Jewett, IL Map & Demographics
Jewett Map
Jewett Overview
$22,042
PER CAPITA INCOME
$60,625
AVG FAMILY INCOME
$57,500
AVG HOUSEHOLD INCOME
0.33
INEQUALITY / GINI INDEX
261
TOTAL POPULATION
117
MALE POPULATION
144
FEMALE POPULATION
81.25
MALES / 100 FEMALES
123.08
FEMALES / 100 MALES
48.2
MEDIAN AGE
2.7
AVG FAMILY SIZE
2.6
AVG HOUSEHOLD SIZE
111
LABOR FORCE [ PEOPLE ]
53.9%
PERCENT IN LABOR FORCE
6.3%
UNEMPLOYMENT RATE
Jewett Zip Codes
Jewett Area Codes
Income in Jewett
Income Overview in Jewett
Per Capita Income in Jewett is $22,042, while median incomes of families and households are $60,625 and $57,500 respectively.
| Characteristic | Number | Measure |
| Per Capita Income | 261 | $22,042 |
| Median Family Income | 85 | $60,625 |
| Mean Family Income | 85 | $62,355 |
| Median Household Income | 100 | $57,500 |
| Mean Household Income | 100 | $58,433 |
| Income Deficit | 85 | $0 |
| Wage / Income Gap (%) | 261 | 0.00% |
| Wage / Income Gap ($) | 261 | 100.00¢ per $1 |
| Gini / Inequality Index | 261 | 0.33 |
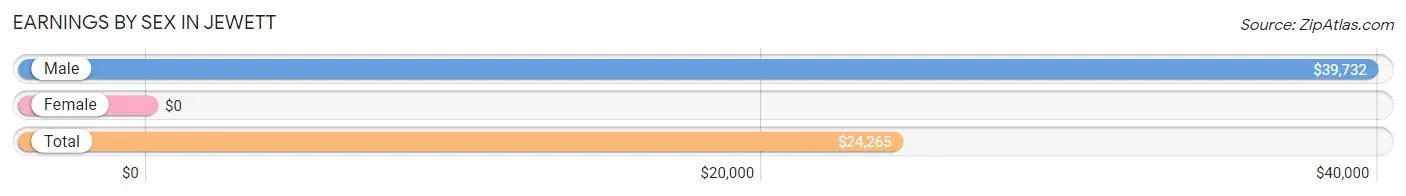
Earnings by Sex in Jewett
| Sex | Number | Average Earnings |
| Male | 49 (42.2%) | $39,732 |
| Female | 67 (57.8%) | $0 |
| Total | 116 (100.0%) | $24,265 |
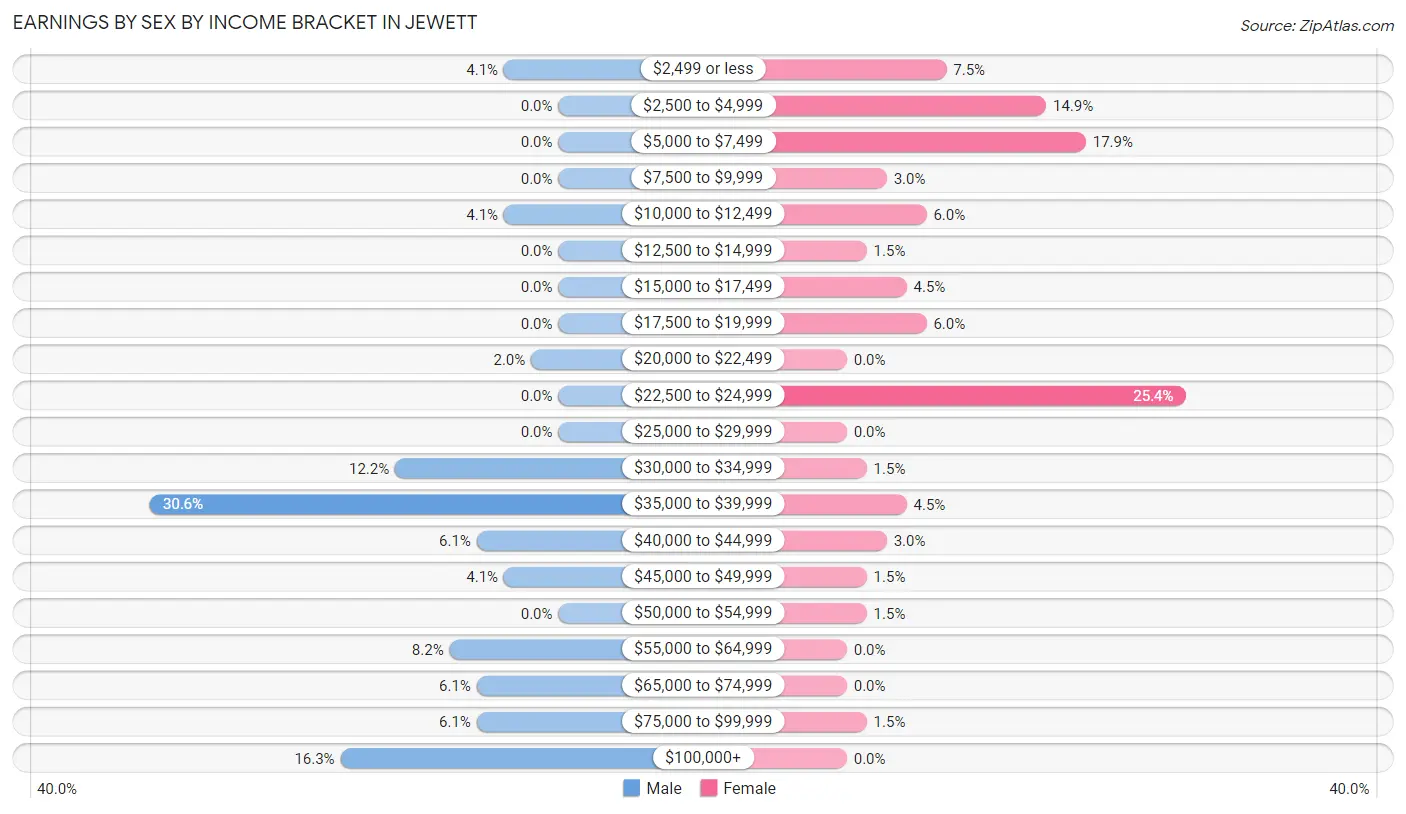
Earnings by Sex by Income Bracket in Jewett
The most common earnings brackets in Jewett are $35,000 to $39,999 for men (15 | 30.6%) and $22,500 to $24,999 for women (17 | 25.4%).
| Income | Male | Female |
| $2,499 or less | 2 (4.1%) | 5 (7.5%) |
| $2,500 to $4,999 | 0 (0.0%) | 10 (14.9%) |
| $5,000 to $7,499 | 0 (0.0%) | 12 (17.9%) |
| $7,500 to $9,999 | 0 (0.0%) | 2 (3.0%) |
| $10,000 to $12,499 | 2 (4.1%) | 4 (6.0%) |
| $12,500 to $14,999 | 0 (0.0%) | 1 (1.5%) |
| $15,000 to $17,499 | 0 (0.0%) | 3 (4.5%) |
| $17,500 to $19,999 | 0 (0.0%) | 4 (6.0%) |
| $20,000 to $22,499 | 1 (2.0%) | 0 (0.0%) |
| $22,500 to $24,999 | 0 (0.0%) | 17 (25.4%) |
| $25,000 to $29,999 | 0 (0.0%) | 0 (0.0%) |
| $30,000 to $34,999 | 6 (12.2%) | 1 (1.5%) |
| $35,000 to $39,999 | 15 (30.6%) | 3 (4.5%) |
| $40,000 to $44,999 | 3 (6.1%) | 2 (3.0%) |
| $45,000 to $49,999 | 2 (4.1%) | 1 (1.5%) |
| $50,000 to $54,999 | 0 (0.0%) | 1 (1.5%) |
| $55,000 to $64,999 | 4 (8.2%) | 0 (0.0%) |
| $65,000 to $74,999 | 3 (6.1%) | 0 (0.0%) |
| $75,000 to $99,999 | 3 (6.1%) | 1 (1.5%) |
| $100,000+ | 8 (16.3%) | 0 (0.0%) |
| Total | 49 (100.0%) | 67 (100.0%) |
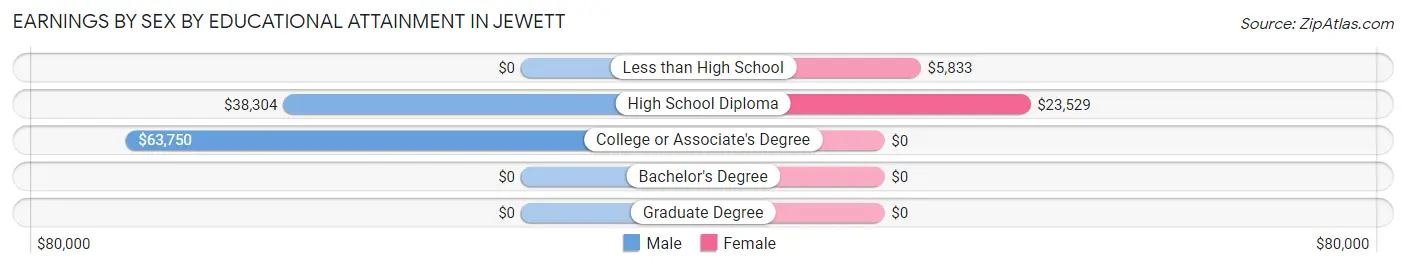
Earnings by Sex by Educational Attainment in Jewett
Average earnings in Jewett are $39,643 for men and $19,063 for women, a difference of 51.9%. Men with an educational attainment of college or associate's degree enjoy the highest average annual earnings of $63,750, while those with high school diploma education earn the least with $38,304. Women with an educational attainment of high school diploma earn the most with the average annual earnings of $23,529, while those with less than high school education have the smallest earnings of $5,833.
| Educational Attainment | Male Income | Female Income |
| Less than High School | - | - |
| High School Diploma | $38,304 | $23,529 |
| College or Associate's Degree | $63,750 | $0 |
| Bachelor's Degree | - | - |
| Graduate Degree | - | - |
| Total | $39,643 | $19,063 |
Family Income in Jewett
Family Income Brackets in Jewett
According to the Jewett family income data, there are 31 families falling into the $50,000 to $74,999 income range, which is the most common income bracket and makes up 36.5% of all families.
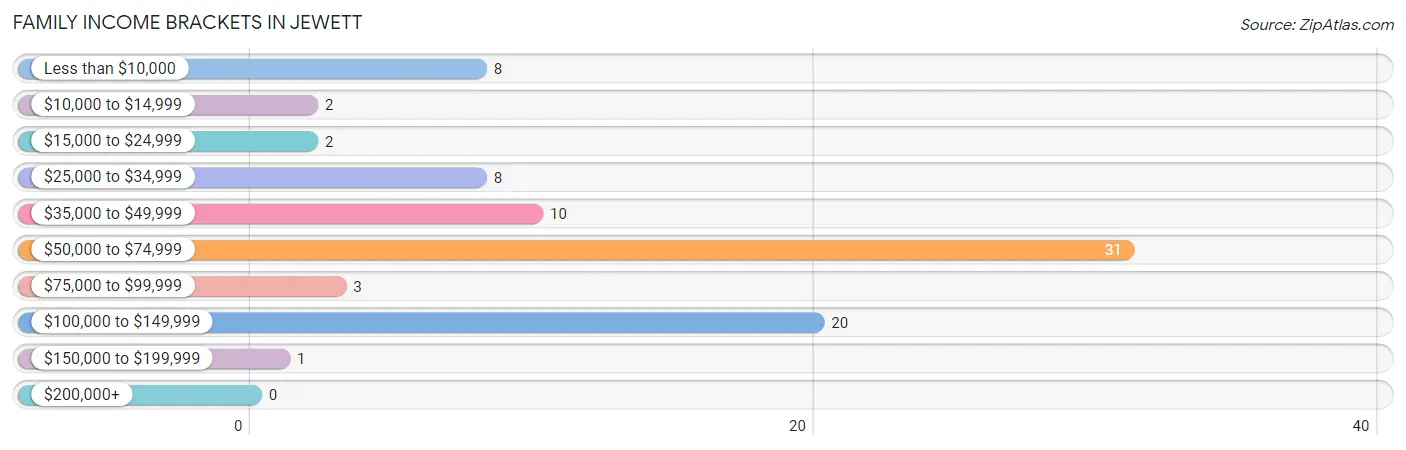
| Income Bracket | # Families | % Families |
| Less than $10,000 | 8 | 9.4% |
| $10,000 to $14,999 | 2 | 2.4% |
| $15,000 to $24,999 | 2 | 2.4% |
| $25,000 to $34,999 | 8 | 9.4% |
| $35,000 to $49,999 | 10 | 11.8% |
| $50,000 to $74,999 | 31 | 36.5% |
| $75,000 to $99,999 | 3 | 3.5% |
| $100,000 to $149,999 | 20 | 23.5% |
| $150,000 to $199,999 | 1 | 1.2% |
| $200,000+ | 0 | 0.0% |
Family Income by Famaliy Size in Jewett
2-person families (55 | 64.7%) account for the highest median family income in Jewett with $61,103 per family, while 2-person families (55 | 64.7%) have the highest median income of $30,552 per family member.
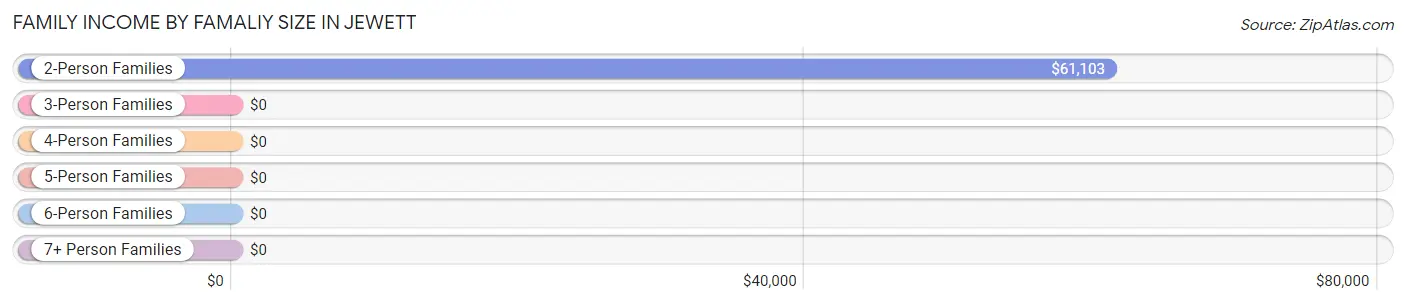
| Income Bracket | # Families | Median Income |
| 2-Person Families | 55 (64.7%) | $61,103 |
| 3-Person Families | 8 (9.4%) | $0 |
| 4-Person Families | 22 (25.9%) | $0 |
| 5-Person Families | 0 (0.0%) | $0 |
| 6-Person Families | 0 (0.0%) | $0 |
| 7+ Person Families | 0 (0.0%) | $0 |
| Total | 85 (100.0%) | $60,625 |
Family Income by Number of Earners in Jewett
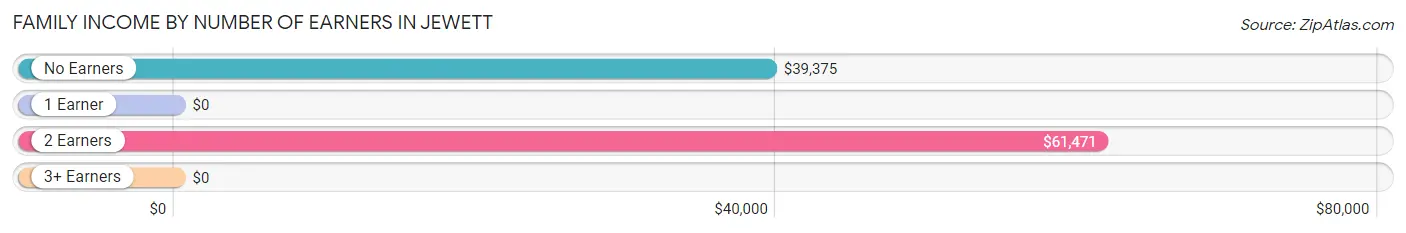
| Number of Earners | # Families | Median Income |
| No Earners | 17 (20.0%) | $39,375 |
| 1 Earner | 28 (32.9%) | $0 |
| 2 Earners | 38 (44.7%) | $61,471 |
| 3+ Earners | 2 (2.4%) | $0 |
| Total | 85 (100.0%) | $60,625 |
Household Income in Jewett
Household Income Brackets in Jewett
With 35 households falling in the category, the $50,000 to $74,999 income range is the most frequent in Jewett, accounting for 35.0% of all households.
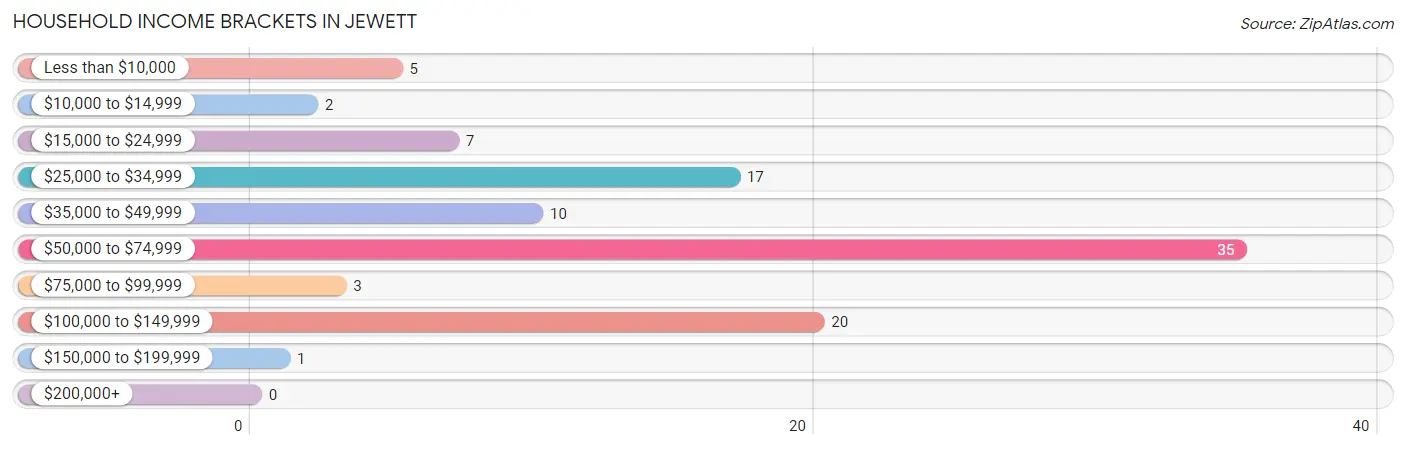
| Income Bracket | # Households | % Households |
| Less than $10,000 | 5 | 5.0% |
| $10,000 to $14,999 | 2 | 2.0% |
| $15,000 to $24,999 | 7 | 7.0% |
| $25,000 to $34,999 | 17 | 17.0% |
| $35,000 to $49,999 | 10 | 10.0% |
| $50,000 to $74,999 | 35 | 35.0% |
| $75,000 to $99,999 | 3 | 3.0% |
| $100,000 to $149,999 | 20 | 20.0% |
| $150,000 to $199,999 | 1 | 1.0% |
| $200,000+ | 0 | 0.0% |
Household Income by Householder Age in Jewett
The median household income in Jewett is $57,500, with the highest median household income of $60,809 found in the 45 to 64 years age bracket for the primary householder. A total of 49 households (49.0%) fall into this category. Meanwhile, the 15 to 24 years age bracket for the primary householder has the lowest median household income of $0, with 2 households (2.0%) in this group.
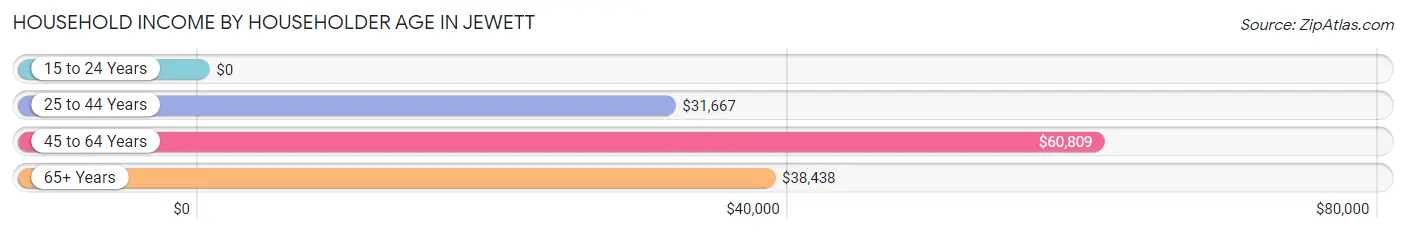
| Income Bracket | # Households | Median Income |
| 15 to 24 Years | 2 (2.0%) | $0 |
| 25 to 44 Years | 20 (20.0%) | $31,667 |
| 45 to 64 Years | 49 (49.0%) | $60,809 |
| 65+ Years | 29 (29.0%) | $38,438 |
| Total | 100 (100.0%) | $57,500 |
Poverty in Jewett
Income Below Poverty by Sex and Age in Jewett
With 10.3% poverty level for males and 21.8% for females among the residents of Jewett, 6 to 11 year old males and 16 and 17 year old females are the most vulnerable to poverty, with 5 males (62.5%) and 7 females (77.8%) in their respective age groups living below the poverty level.
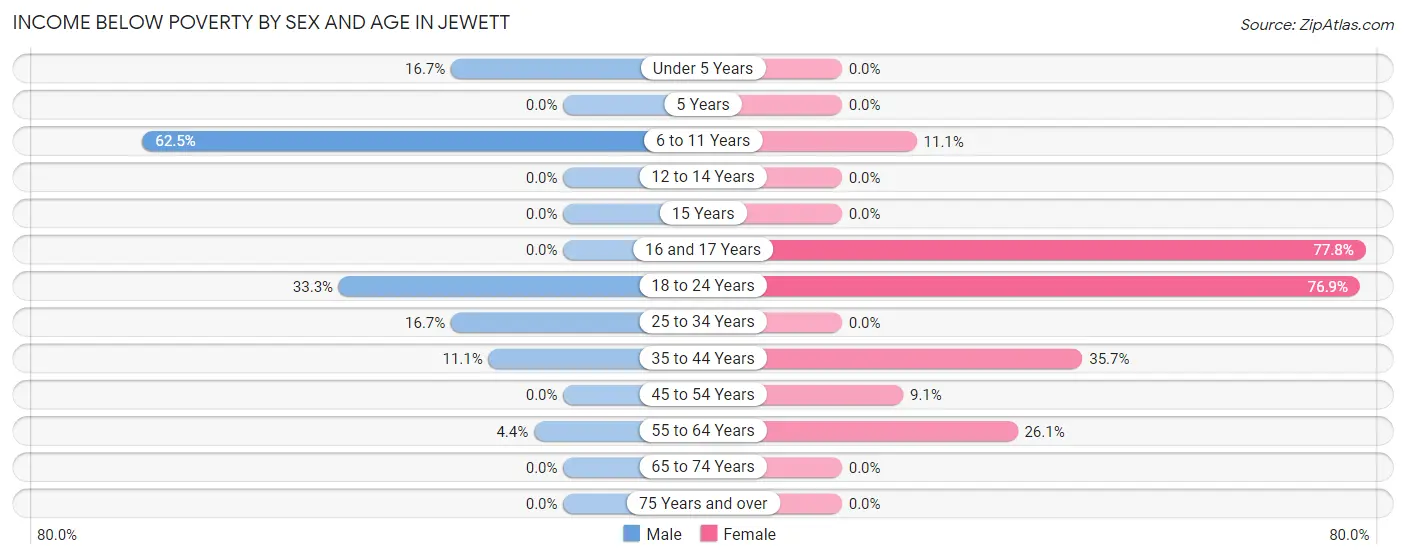
| Age Bracket | Male | Female |
| Under 5 Years | 2 (16.7%) | 0 (0.0%) |
| 5 Years | 0 (0.0%) | 0 (0.0%) |
| 6 to 11 Years | 5 (62.5%) | 1 (11.1%) |
| 12 to 14 Years | 0 (0.0%) | 0 (0.0%) |
| 15 Years | 0 (0.0%) | 0 (0.0%) |
| 16 and 17 Years | 0 (0.0%) | 7 (77.8%) |
| 18 to 24 Years | 1 (33.3%) | 10 (76.9%) |
| 25 to 34 Years | 2 (16.7%) | 0 (0.0%) |
| 35 to 44 Years | 1 (11.1%) | 5 (35.7%) |
| 45 to 54 Years | 0 (0.0%) | 2 (9.1%) |
| 55 to 64 Years | 1 (4.3%) | 6 (26.1%) |
| 65 to 74 Years | 0 (0.0%) | 0 (0.0%) |
| 75 Years and over | 0 (0.0%) | 0 (0.0%) |
| Total | 12 (10.3%) | 31 (21.8%) |
Income Above Poverty by Sex and Age in Jewett
According to the poverty statistics in Jewett, males aged 5 years and females aged under 5 years are the age groups that are most secure financially, with 100.0% of males and 100.0% of females in these age groups living above the poverty line.
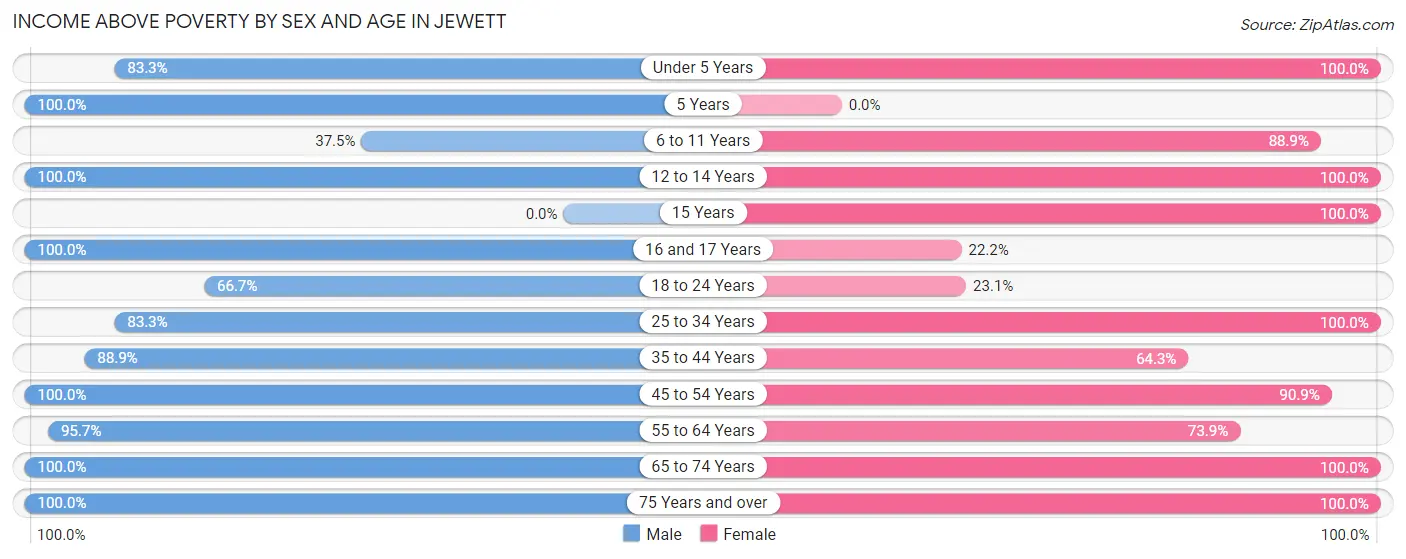
| Age Bracket | Male | Female |
| Under 5 Years | 10 (83.3%) | 20 (100.0%) |
| 5 Years | 1 (100.0%) | 0 (0.0%) |
| 6 to 11 Years | 3 (37.5%) | 8 (88.9%) |
| 12 to 14 Years | 1 (100.0%) | 1 (100.0%) |
| 15 Years | 0 (0.0%) | 1 (100.0%) |
| 16 and 17 Years | 10 (100.0%) | 2 (22.2%) |
| 18 to 24 Years | 2 (66.7%) | 3 (23.1%) |
| 25 to 34 Years | 10 (83.3%) | 4 (100.0%) |
| 35 to 44 Years | 8 (88.9%) | 9 (64.3%) |
| 45 to 54 Years | 12 (100.0%) | 20 (90.9%) |
| 55 to 64 Years | 22 (95.7%) | 17 (73.9%) |
| 65 to 74 Years | 22 (100.0%) | 13 (100.0%) |
| 75 Years and over | 4 (100.0%) | 13 (100.0%) |
| Total | 105 (89.7%) | 111 (78.2%) |
Income Below Poverty Among Married-Couple Families in Jewett
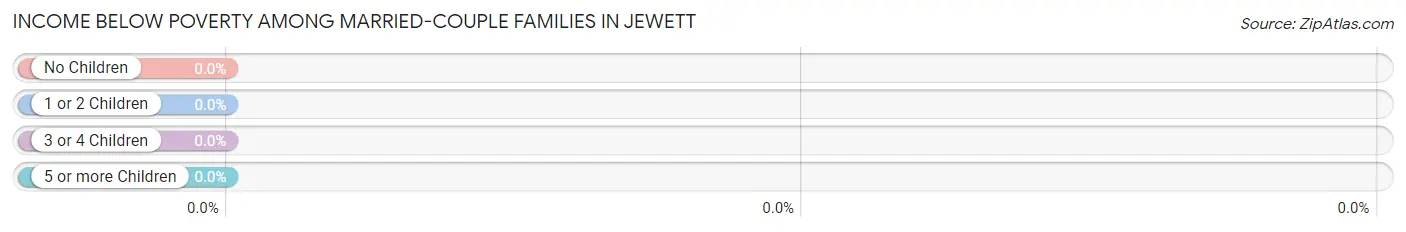
| Children | Above Poverty | Below Poverty |
| No Children | 43 (100.0%) | 0 (0.0%) |
| 1 or 2 Children | 13 (100.0%) | 0 (0.0%) |
| 3 or 4 Children | 0 (0.0%) | 0 (0.0%) |
| 5 or more Children | 0 (0.0%) | 0 (0.0%) |
| Total | 56 (100.0%) | 0 (0.0%) |
Income Below Poverty Among Single-Parent Households in Jewett
According to the poverty data in Jewett, 5.9% or 1 single-father households and 75.0% or 9 single-mother households are living below the poverty line. Among single-father households, those with 1 or 2 children have the highest poverty rate, with 1 households (14.3%) experiencing poverty. Likewise, among single-mother households, those with 1 or 2 children have the highest poverty rate, with 2 households (100.0%) falling below the poverty line.
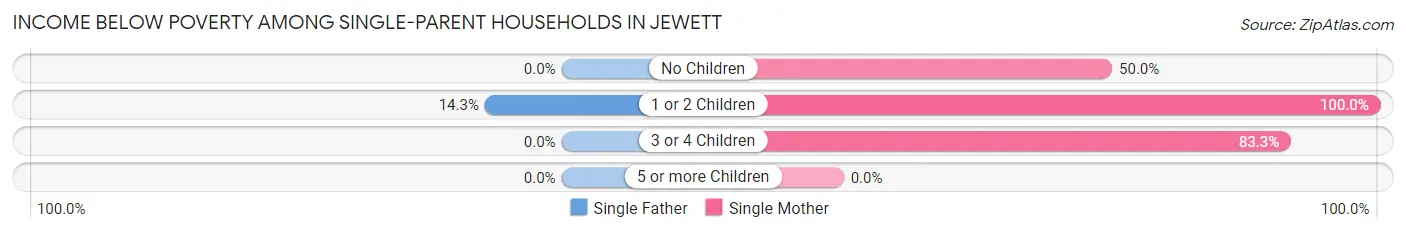
| Children | Single Father | Single Mother |
| No Children | 0 (0.0%) | 2 (50.0%) |
| 1 or 2 Children | 1 (14.3%) | 2 (100.0%) |
| 3 or 4 Children | 0 (0.0%) | 5 (83.3%) |
| 5 or more Children | 0 (0.0%) | 0 (0.0%) |
| Total | 1 (5.9%) | 9 (75.0%) |
Income Below Poverty Among Married-Couple vs Single-Parent Households in Jewett
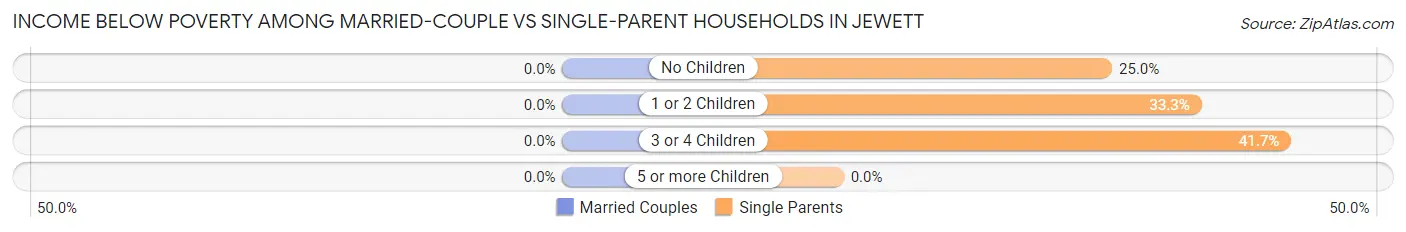
| Children | Married-Couple Families | Single-Parent Households |
| No Children | 0 (0.0%) | 2 (25.0%) |
| 1 or 2 Children | 0 (0.0%) | 3 (33.3%) |
| 3 or 4 Children | 0 (0.0%) | 5 (41.7%) |
| 5 or more Children | 0 (0.0%) | 0 (0.0%) |
| Total | 0 (0.0%) | 10 (34.5%) |
Race in Jewett
The most populous races in Jewett are White / Caucasian (239 | 91.6%), and Two or more Races (22 | 8.4%).
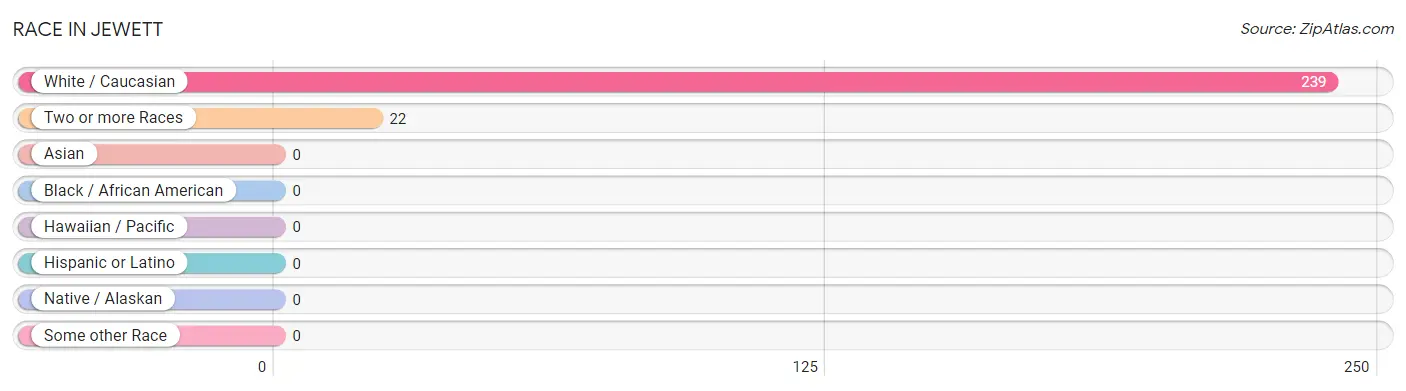
| Race | # Population | % Population |
| Asian | 0 | 0.0% |
| Black / African American | 0 | 0.0% |
| Hawaiian / Pacific | 0 | 0.0% |
| Hispanic or Latino | 0 | 0.0% |
| Native / Alaskan | 0 | 0.0% |
| White / Caucasian | 239 | 91.6% |
| Two or more Races | 22 | 8.4% |
| Some other Race | 0 | 0.0% |
| Total | 261 | 100.0% |
Ancestry in Jewett
The most populous ancestries reported in Jewett are German (74 | 28.3%), English (34 | 13.0%), Norwegian (26 | 10.0%), Irish (23 | 8.8%), and American (10 | 3.8%), together accounting for 64.0% of all Jewett residents.
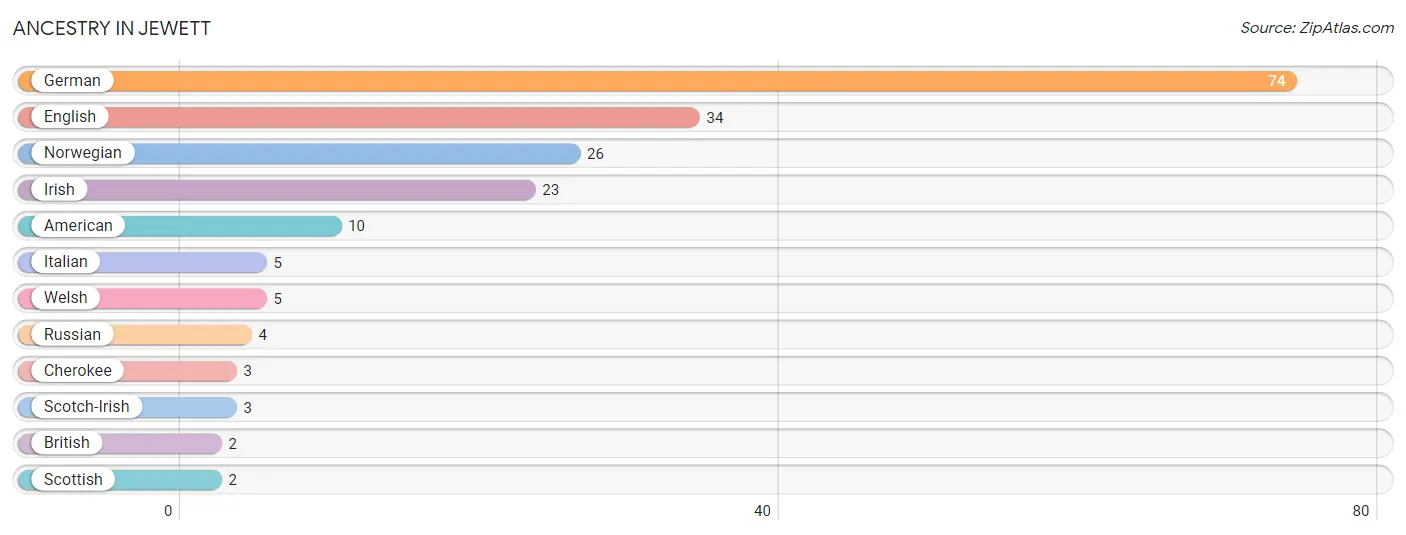
| Ancestry | # Population | % Population |
| American | 10 | 3.8% |
| British | 2 | 0.8% |
| Cherokee | 3 | 1.1% |
| English | 34 | 13.0% |
| German | 74 | 28.3% |
| Irish | 23 | 8.8% |
| Italian | 5 | 1.9% |
| Norwegian | 26 | 10.0% |
| Russian | 4 | 1.5% |
| Scotch-Irish | 3 | 1.1% |
| Scottish | 2 | 0.8% |
| Welsh | 5 | 1.9% | View All 12 Rows |
Immigrants in Jewett

| Immigration Origin | # Population | % Population | View All 0 Rows |
Sex and Age in Jewett
Sex and Age in Jewett
The most populous age groups in Jewett are 65 to 69 Years (18 | 15.4%) for men and Under 5 Years (22 | 15.3%) for women.
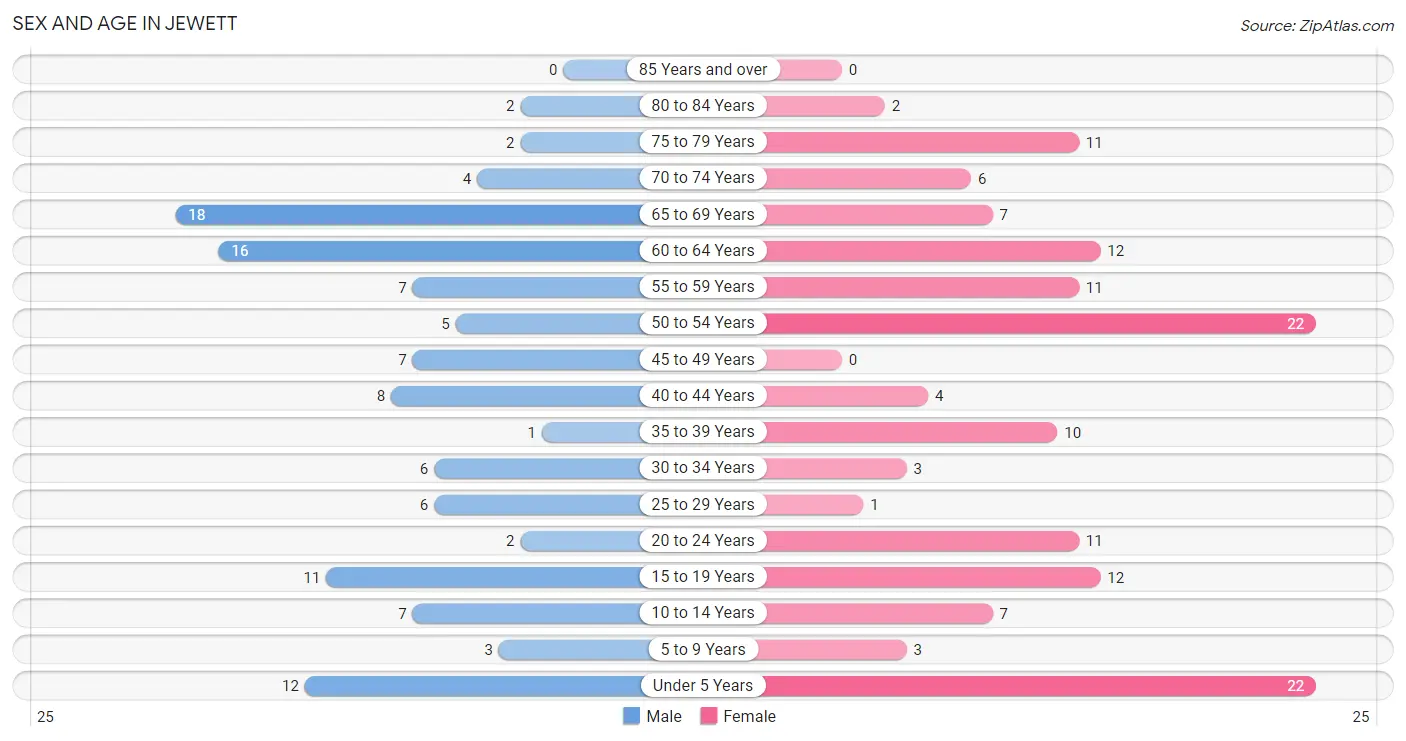
| Age Bracket | Male | Female |
| Under 5 Years | 12 (10.3%) | 22 (15.3%) |
| 5 to 9 Years | 3 (2.6%) | 3 (2.1%) |
| 10 to 14 Years | 7 (6.0%) | 7 (4.9%) |
| 15 to 19 Years | 11 (9.4%) | 12 (8.3%) |
| 20 to 24 Years | 2 (1.7%) | 11 (7.6%) |
| 25 to 29 Years | 6 (5.1%) | 1 (0.7%) |
| 30 to 34 Years | 6 (5.1%) | 3 (2.1%) |
| 35 to 39 Years | 1 (0.9%) | 10 (6.9%) |
| 40 to 44 Years | 8 (6.8%) | 4 (2.8%) |
| 45 to 49 Years | 7 (6.0%) | 0 (0.0%) |
| 50 to 54 Years | 5 (4.3%) | 22 (15.3%) |
| 55 to 59 Years | 7 (6.0%) | 11 (7.6%) |
| 60 to 64 Years | 16 (13.7%) | 12 (8.3%) |
| 65 to 69 Years | 18 (15.4%) | 7 (4.9%) |
| 70 to 74 Years | 4 (3.4%) | 6 (4.2%) |
| 75 to 79 Years | 2 (1.7%) | 11 (7.6%) |
| 80 to 84 Years | 2 (1.7%) | 2 (1.4%) |
| 85 Years and over | 0 (0.0%) | 0 (0.0%) |
| Total | 117 (100.0%) | 144 (100.0%) |
Families and Households in Jewett
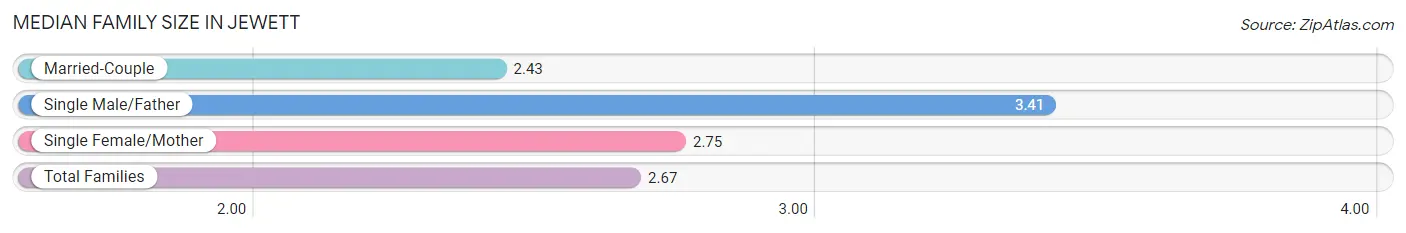
Median Family Size in Jewett
The median family size in Jewett is 2.67 persons per family, with single male/father families (17 | 20.0%) accounting for the largest median family size of 3.41 persons per family. On the other hand, married-couple families (56 | 65.9%) represent the smallest median family size with 2.43 persons per family.
| Family Type | # Families | Family Size |
| Married-Couple | 56 (65.9%) | 2.43 |
| Single Male/Father | 17 (20.0%) | 3.41 |
| Single Female/Mother | 12 (14.1%) | 2.75 |
| Total Families | 85 (100.0%) | 2.67 |
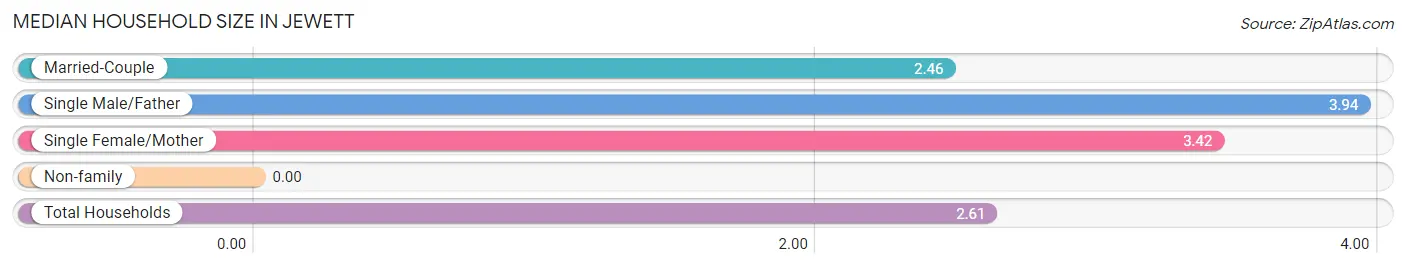
Median Household Size in Jewett
| Household Type | # Households | Household Size |
| Married-Couple | 56 (56.0%) | 2.46 |
| Single Male/Father | 17 (17.0%) | 3.94 |
| Single Female/Mother | 12 (12.0%) | 3.42 |
| Non-family | 15 (15.0%) | - |
| Total Households | 100 (100.0%) | 2.61 |
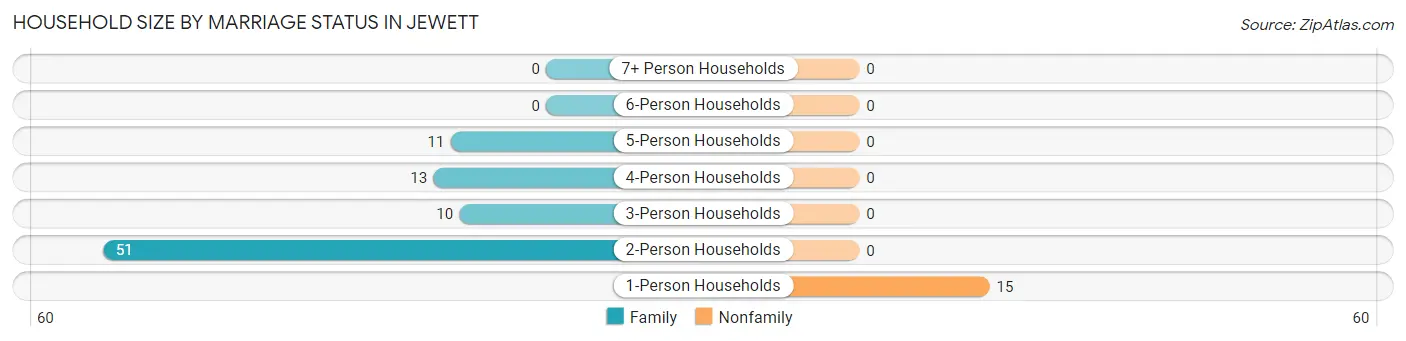
Household Size by Marriage Status in Jewett
Out of a total of 100 households in Jewett, 85 (85.0%) are family households, while 15 (15.0%) are nonfamily households. The most numerous type of family households are 2-person households, comprising 51, and the most common type of nonfamily households are 1-person households, comprising 15.
| Household Size | Family Households | Nonfamily Households |
| 1-Person Households | - | 15 (15.0%) |
| 2-Person Households | 51 (51.0%) | 0 (0.0%) |
| 3-Person Households | 10 (10.0%) | 0 (0.0%) |
| 4-Person Households | 13 (13.0%) | 0 (0.0%) |
| 5-Person Households | 11 (11.0%) | 0 (0.0%) |
| 6-Person Households | 0 (0.0%) | 0 (0.0%) |
| 7+ Person Households | 0 (0.0%) | 0 (0.0%) |
| Total | 85 (85.0%) | 15 (15.0%) |
Female Fertility in Jewett
Fertility by Age in Jewett
Average fertility rate in Jewett is 244.0 births per 1,000 women. Women in the age bracket of 20 to 34 years have the highest fertility rate with 667.0 births per 1,000 women. Women in the age bracket of 20 to 34 years acount for 100.0% of all women with births.
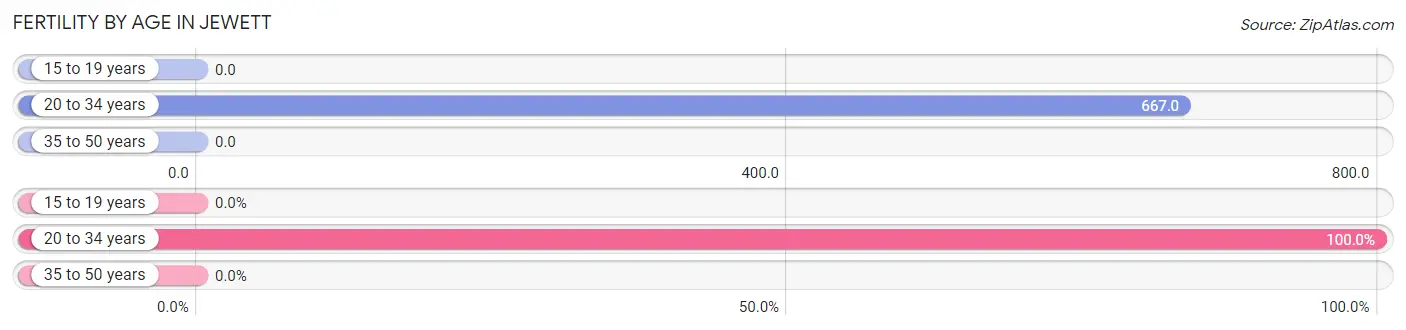
| Age Bracket | Women with Births | Births / 1,000 Women |
| 15 to 19 years | 0 (0.0%) | 0.0 |
| 20 to 34 years | 10 (100.0%) | 667.0 |
| 35 to 50 years | 0 (0.0%) | 0.0 |
| Total | 10 (100.0%) | 244.0 |
Fertility by Age by Marriage Status in Jewett
20.0% of women with births (10) in Jewett are married. The highest percentage of unmarried women with births falls into 20 to 34 years age bracket with 80.0% of them unmarried at the time of birth, while the lowest percentage of unmarried women with births belong to 20 to 34 years age bracket with 80.0% of them unmarried.
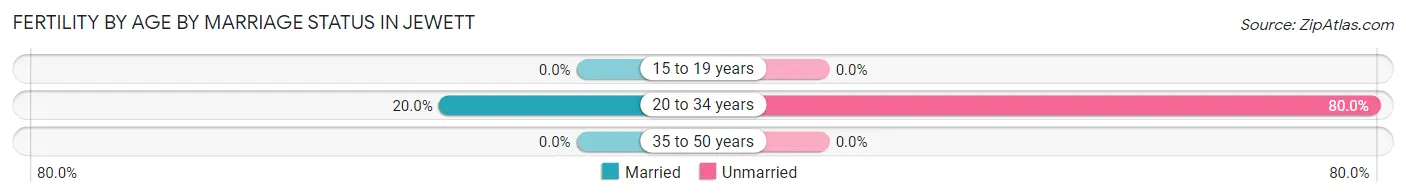
| Age Bracket | Married | Unmarried |
| 15 to 19 years | 0 (0.0%) | 0 (0.0%) |
| 20 to 34 years | 2 (20.0%) | 8 (80.0%) |
| 35 to 50 years | 0 (0.0%) | 0 (0.0%) |
| Total | 2 (20.0%) | 8 (80.0%) |
Fertility by Education in Jewett
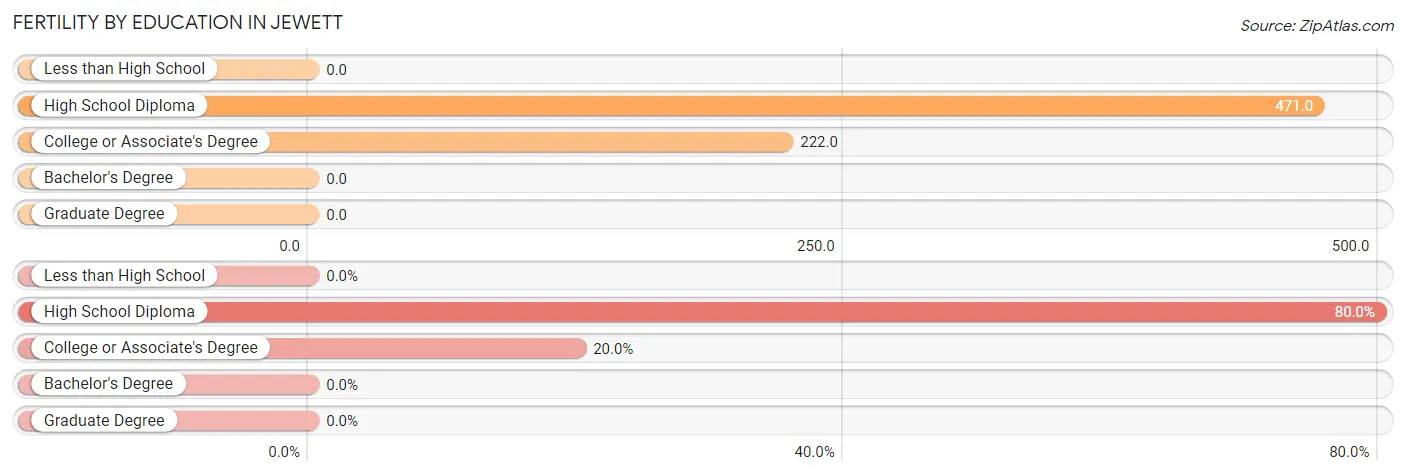
| Educational Attainment | Women with Births | Births / 1,000 Women |
| Less than High School | 0 (0.0%) | 0.0 |
| High School Diploma | 8 (80.0%) | 471.0 |
| College or Associate's Degree | 2 (20.0%) | 222.0 |
| Bachelor's Degree | 0 (0.0%) | 0.0 |
| Graduate Degree | 0 (0.0%) | 0.0 |
| Total | 10 (100.0%) | 244.0 |
Fertility by Education by Marriage Status in Jewett
80.0% of women with births in Jewett are unmarried. Women with the educational attainment of college or associate's degree are most likely to be married with 100.0% of them married at childbirth, while women with the educational attainment of high school diploma are least likely to be married with 100.0% of them unmarried at childbirth.
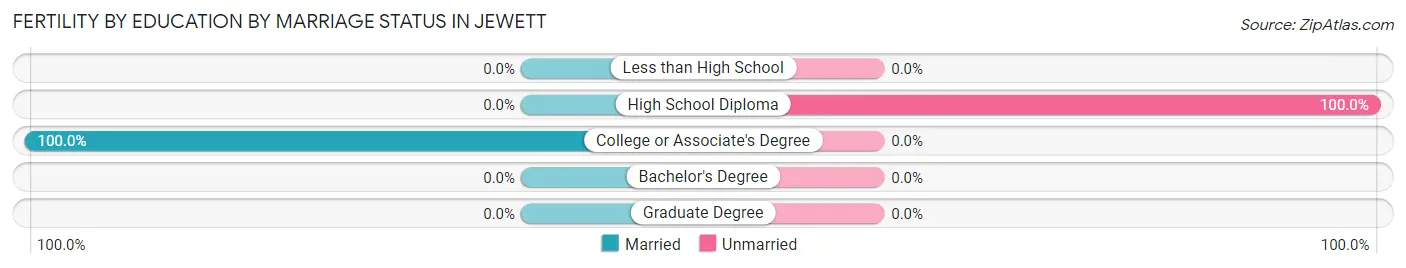
| Educational Attainment | Married | Unmarried |
| Less than High School | 0 (0.0%) | 0 (0.0%) |
| High School Diploma | 0 (0.0%) | 8 (100.0%) |
| College or Associate's Degree | 2 (100.0%) | 0 (0.0%) |
| Bachelor's Degree | 0 (0.0%) | 0 (0.0%) |
| Graduate Degree | 0 (0.0%) | 0 (0.0%) |
| Total | 2 (20.0%) | 8 (80.0%) |
Employment Characteristics in Jewett
Employment by Class of Employer in Jewett
Among the 98 employed individuals in Jewett, private company employees (77 | 78.6%), state government employees (7 | 7.1%), and not-for-profit organizations (6 | 6.1%) make up the most common classes of employment.
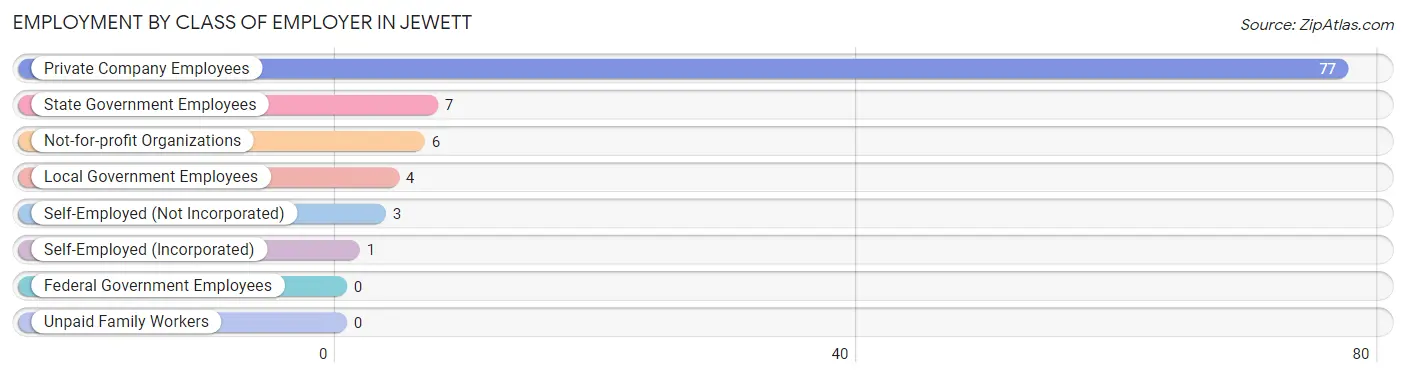
| Employer Class | # Employees | % Employees |
| Private Company Employees | 77 | 78.6% |
| Self-Employed (Incorporated) | 1 | 1.0% |
| Self-Employed (Not Incorporated) | 3 | 3.1% |
| Not-for-profit Organizations | 6 | 6.1% |
| Local Government Employees | 4 | 4.1% |
| State Government Employees | 7 | 7.1% |
| Federal Government Employees | 0 | 0.0% |
| Unpaid Family Workers | 0 | 0.0% |
| Total | 98 | 100.0% |
Employment Status by Age in Jewett
According to the labor force statistics for Jewett, out of the total population over 16 years of age (206), 53.9% or 111 individuals are in the labor force, with 6.3% or 7 of them unemployed. The age group with the highest labor force participation rate is 25 to 29 years, with 100.0% or 7 individuals in the labor force. Within the labor force, the 30 to 34 years age range has the highest percentage of unemployed individuals, with 33.3% or 2 of them being unemployed.
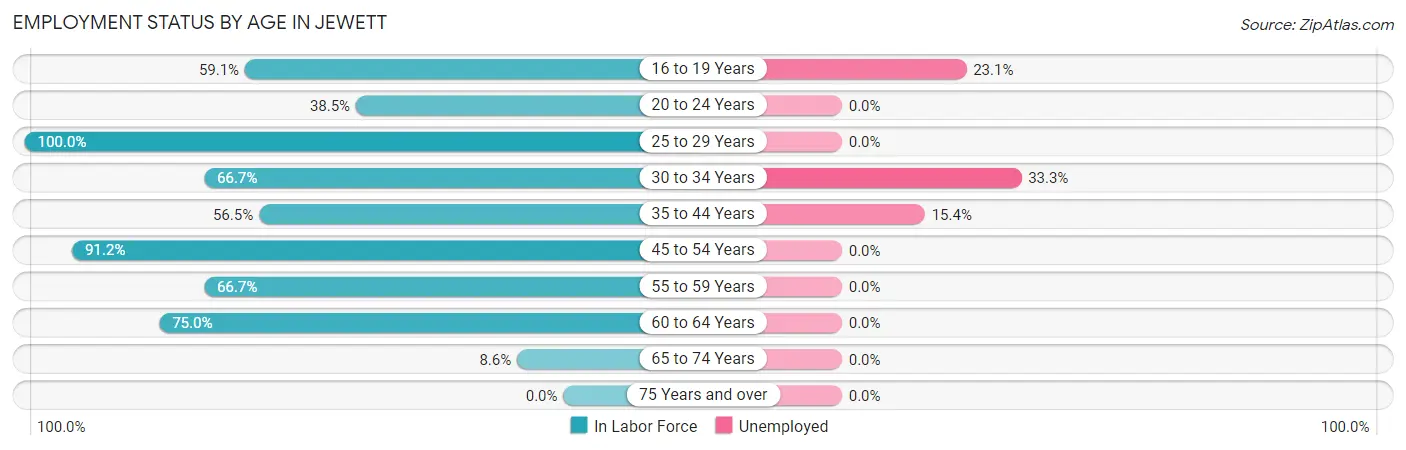
| Age Bracket | In Labor Force | Unemployed |
| 16 to 19 Years | 13 (59.1%) | 3 (23.1%) |
| 20 to 24 Years | 5 (38.5%) | 0 (0.0%) |
| 25 to 29 Years | 7 (100.0%) | 0 (0.0%) |
| 30 to 34 Years | 6 (66.7%) | 2 (33.3%) |
| 35 to 44 Years | 13 (56.5%) | 2 (15.4%) |
| 45 to 54 Years | 31 (91.2%) | 0 (0.0%) |
| 55 to 59 Years | 12 (66.7%) | 0 (0.0%) |
| 60 to 64 Years | 21 (75.0%) | 0 (0.0%) |
| 65 to 74 Years | 3 (8.6%) | 0 (0.0%) |
| 75 Years and over | 0 (0.0%) | 0 (0.0%) |
| Total | 111 (53.9%) | 7 (6.3%) |
Employment Status by Educational Attainment in Jewett
According to labor force statistics for Jewett, 75.6% of individuals (90) out of the total population between 25 and 64 years of age (119) are in the labor force, with 4.4% or 4 of them being unemployed. The group with the highest labor force participation rate are those with the educational attainment of college / associate degree, with 90.0% or 27 individuals in the labor force. Within the labor force, individuals with college / associate degree education have the highest percentage of unemployment, with 7.4% or 2 of them being unemployed.
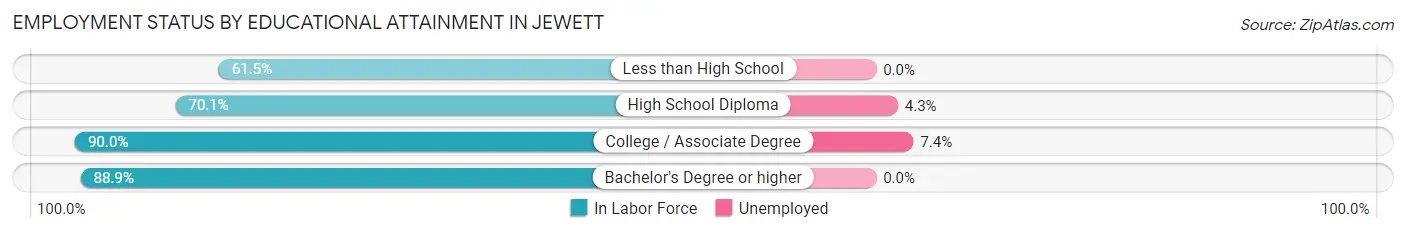
| Educational Attainment | In Labor Force | Unemployed |
| Less than High School | 8 (61.5%) | 0 (0.0%) |
| High School Diploma | 47 (70.1%) | 3 (4.3%) |
| College / Associate Degree | 27 (90.0%) | 2 (7.4%) |
| Bachelor's Degree or higher | 8 (88.9%) | 0 (0.0%) |
| Total | 90 (75.6%) | 5 (4.4%) |
Employment Occupations by Sex in Jewett
Management, Business, Science and Arts Occupations
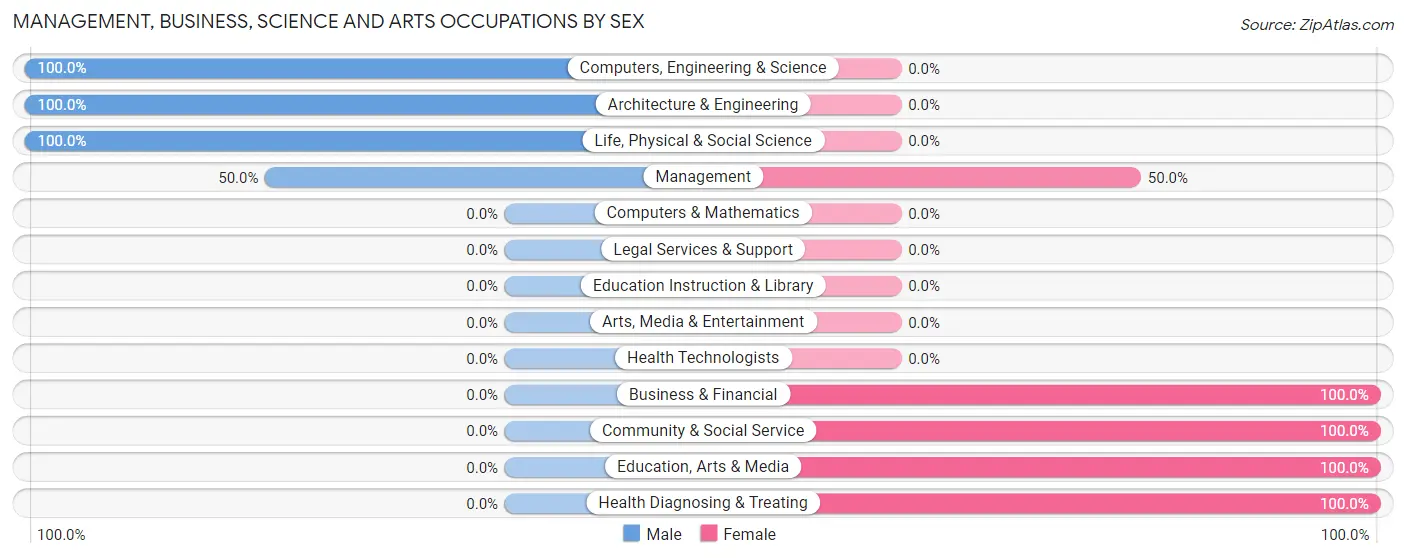
The most common Management, Business, Science and Arts occupations in Jewett are Computers, Engineering & Science (5 | 4.8%), Business & Financial (4 | 3.8%), Architecture & Engineering (4 | 3.8%), Management (2 | 1.9%), and Life, Physical & Social Science (1 | 1.0%).
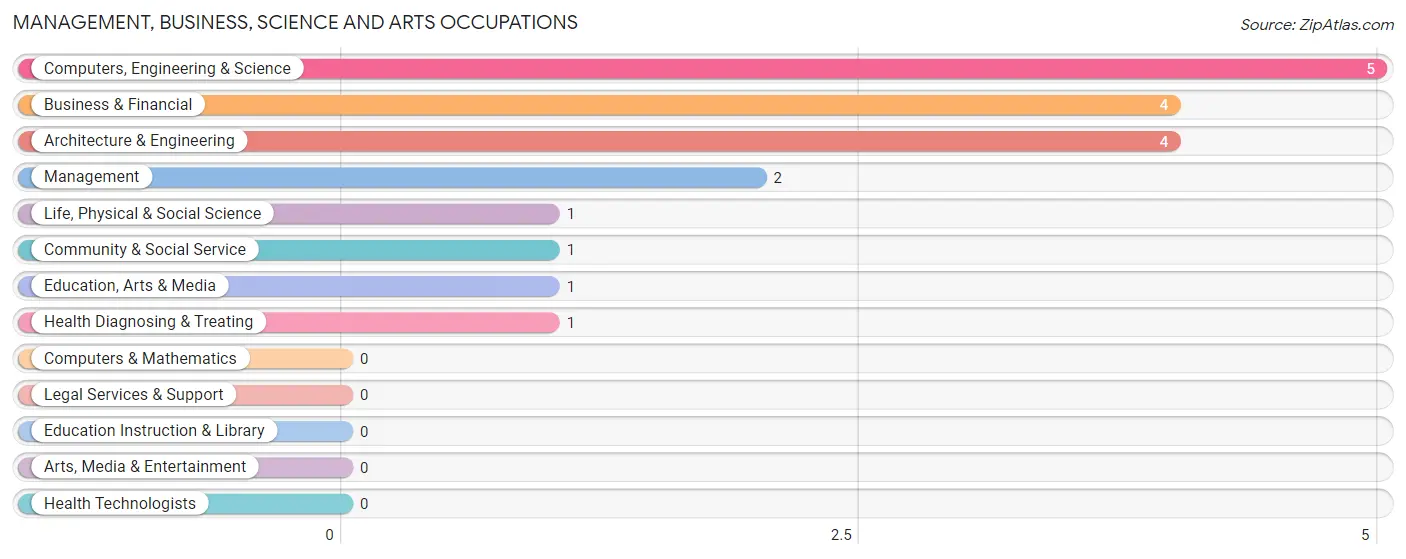
Management, Business, Science and Arts Occupations by Sex
Within the Management, Business, Science and Arts occupations in Jewett, the most male-oriented occupations are Computers, Engineering & Science (100.0%), Architecture & Engineering (100.0%), and Life, Physical & Social Science (100.0%), while the most female-oriented occupations are Business & Financial (100.0%), Community & Social Service (100.0%), and Education, Arts & Media (100.0%).
| Occupation | Male | Female |
| Management | 1 (50.0%) | 1 (50.0%) |
| Business & Financial | 0 (0.0%) | 4 (100.0%) |
| Computers, Engineering & Science | 5 (100.0%) | 0 (0.0%) |
| Computers & Mathematics | 0 (0.0%) | 0 (0.0%) |
| Architecture & Engineering | 4 (100.0%) | 0 (0.0%) |
| Life, Physical & Social Science | 1 (100.0%) | 0 (0.0%) |
| Community & Social Service | 0 (0.0%) | 1 (100.0%) |
| Education, Arts & Media | 0 (0.0%) | 1 (100.0%) |
| Legal Services & Support | 0 (0.0%) | 0 (0.0%) |
| Education Instruction & Library | 0 (0.0%) | 0 (0.0%) |
| Arts, Media & Entertainment | 0 (0.0%) | 0 (0.0%) |
| Health Diagnosing & Treating | 0 (0.0%) | 1 (100.0%) |
| Health Technologists | 0 (0.0%) | 0 (0.0%) |
| Total (Category) | 6 (46.2%) | 7 (53.8%) |
| Total (Overall) | 47 (45.2%) | 57 (54.8%) |
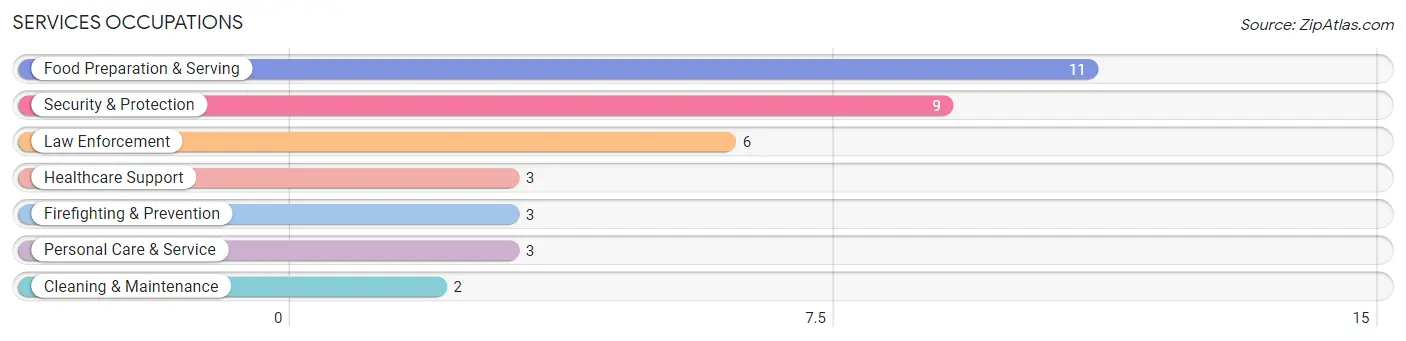
Services Occupations
The most common Services occupations in Jewett are Food Preparation & Serving (11 | 10.6%), Security & Protection (9 | 8.6%), Law Enforcement (6 | 5.8%), Healthcare Support (3 | 2.9%), and Firefighting & Prevention (3 | 2.9%).
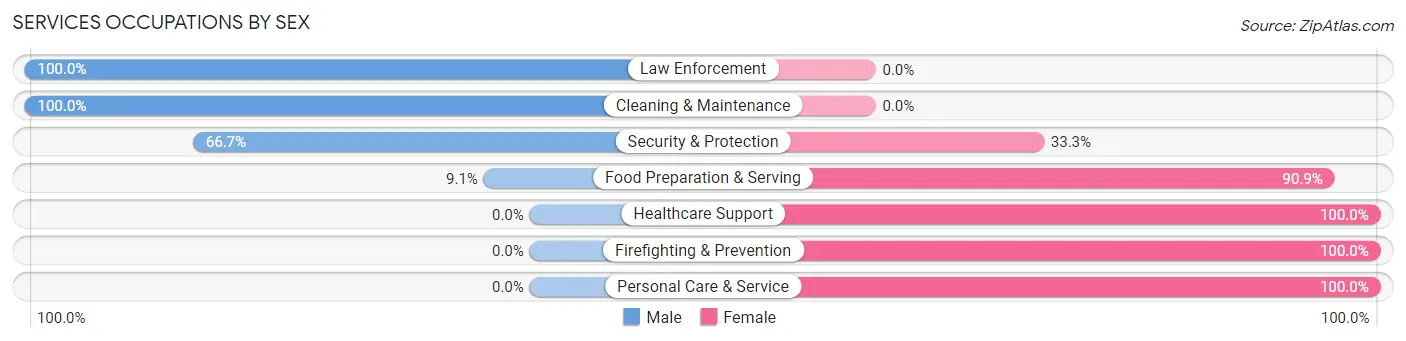
Services Occupations by Sex
Within the Services occupations in Jewett, the most male-oriented occupations are Law Enforcement (100.0%), Cleaning & Maintenance (100.0%), and Security & Protection (66.7%), while the most female-oriented occupations are Healthcare Support (100.0%), Firefighting & Prevention (100.0%), and Personal Care & Service (100.0%).
| Occupation | Male | Female |
| Healthcare Support | 0 (0.0%) | 3 (100.0%) |
| Security & Protection | 6 (66.7%) | 3 (33.3%) |
| Firefighting & Prevention | 0 (0.0%) | 3 (100.0%) |
| Law Enforcement | 6 (100.0%) | 0 (0.0%) |
| Food Preparation & Serving | 1 (9.1%) | 10 (90.9%) |
| Cleaning & Maintenance | 2 (100.0%) | 0 (0.0%) |
| Personal Care & Service | 0 (0.0%) | 3 (100.0%) |
| Total (Category) | 9 (32.1%) | 19 (67.9%) |
| Total (Overall) | 47 (45.2%) | 57 (54.8%) |
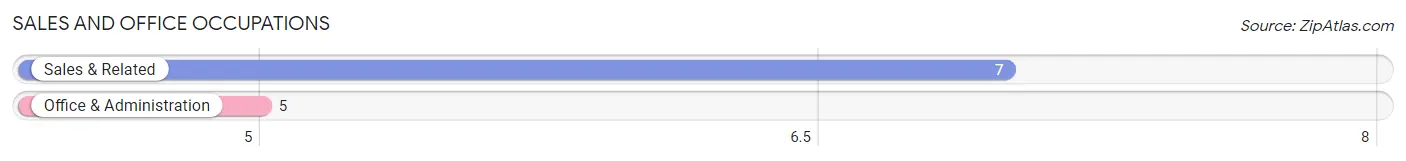
Sales and Office Occupations
The most common Sales and Office occupations in Jewett are Sales & Related (7 | 6.7%), and Office & Administration (5 | 4.8%).
Sales and Office Occupations by Sex
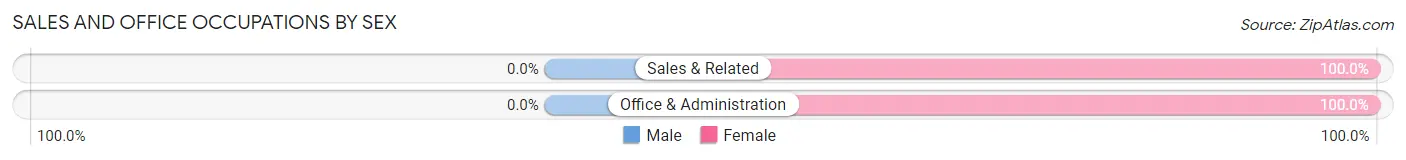
| Occupation | Male | Female |
| Sales & Related | 0 (0.0%) | 7 (100.0%) |
| Office & Administration | 0 (0.0%) | 5 (100.0%) |
| Total (Category) | 0 (0.0%) | 12 (100.0%) |
| Total (Overall) | 47 (45.2%) | 57 (54.8%) |
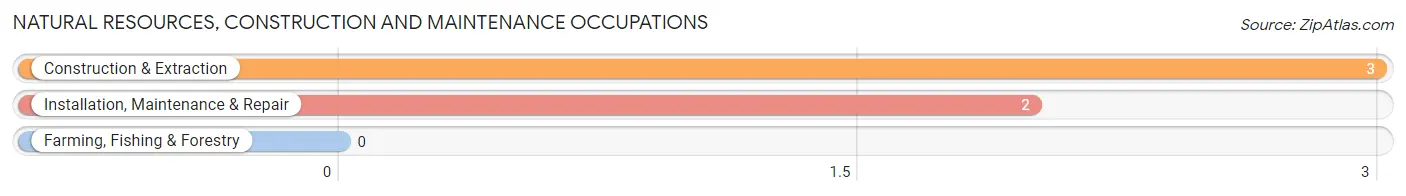
Natural Resources, Construction and Maintenance Occupations
The most common Natural Resources, Construction and Maintenance occupations in Jewett are Construction & Extraction (3 | 2.9%), and Installation, Maintenance & Repair (2 | 1.9%).
Natural Resources, Construction and Maintenance Occupations by Sex
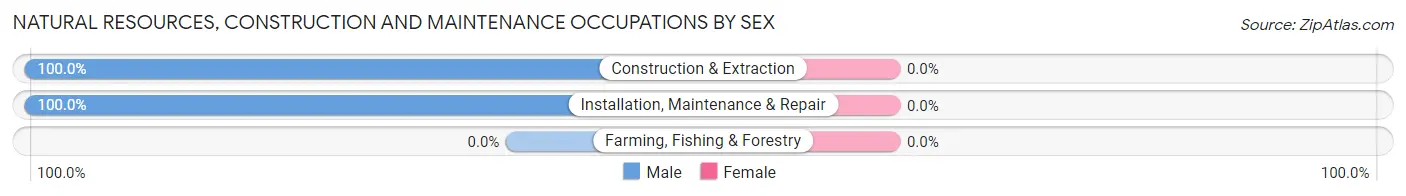
| Occupation | Male | Female |
| Farming, Fishing & Forestry | 0 (0.0%) | 0 (0.0%) |
| Construction & Extraction | 3 (100.0%) | 0 (0.0%) |
| Installation, Maintenance & Repair | 2 (100.0%) | 0 (0.0%) |
| Total (Category) | 5 (100.0%) | 0 (0.0%) |
| Total (Overall) | 47 (45.2%) | 57 (54.8%) |
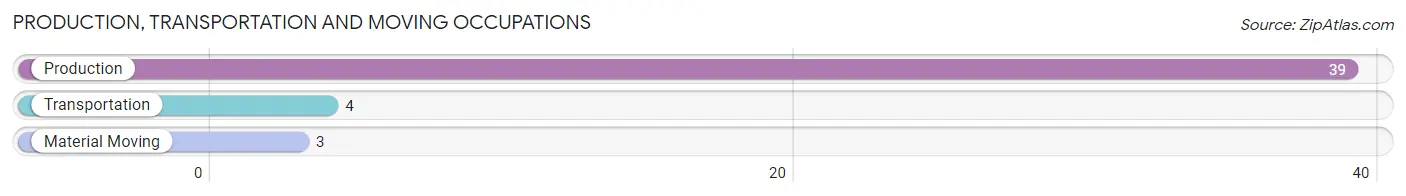
Production, Transportation and Moving Occupations
The most common Production, Transportation and Moving occupations in Jewett are Production (39 | 37.5%), Transportation (4 | 3.8%), and Material Moving (3 | 2.9%).
Production, Transportation and Moving Occupations by Sex
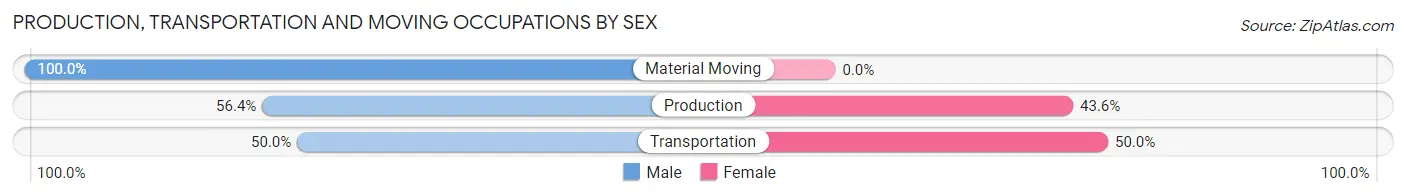
| Occupation | Male | Female |
| Production | 22 (56.4%) | 17 (43.6%) |
| Transportation | 2 (50.0%) | 2 (50.0%) |
| Material Moving | 3 (100.0%) | 0 (0.0%) |
| Total (Category) | 27 (58.7%) | 19 (41.3%) |
| Total (Overall) | 47 (45.2%) | 57 (54.8%) |
Employment Industries by Sex in Jewett
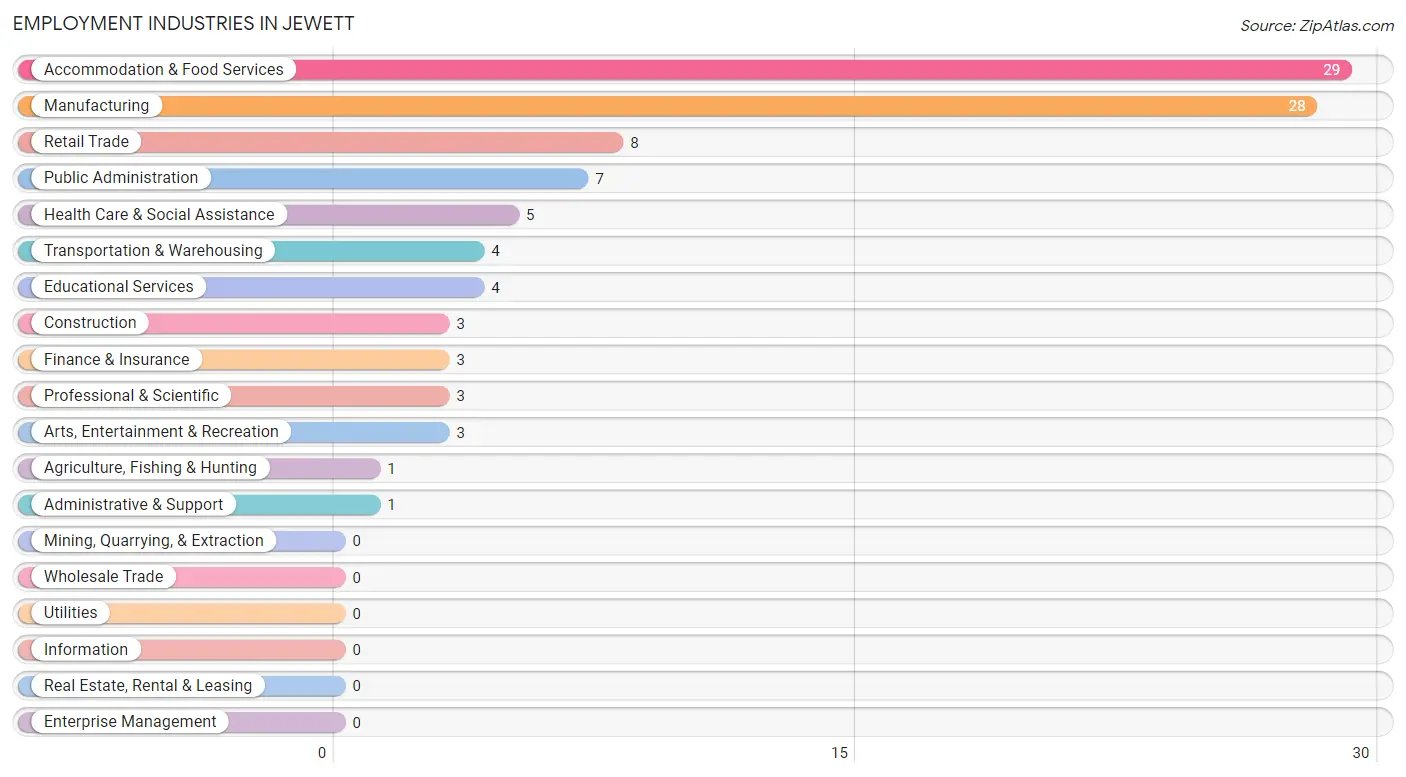
Employment Industries in Jewett
The major employment industries in Jewett include Accommodation & Food Services (29 | 27.9%), Manufacturing (28 | 26.9%), Retail Trade (8 | 7.7%), Public Administration (7 | 6.7%), and Health Care & Social Assistance (5 | 4.8%).
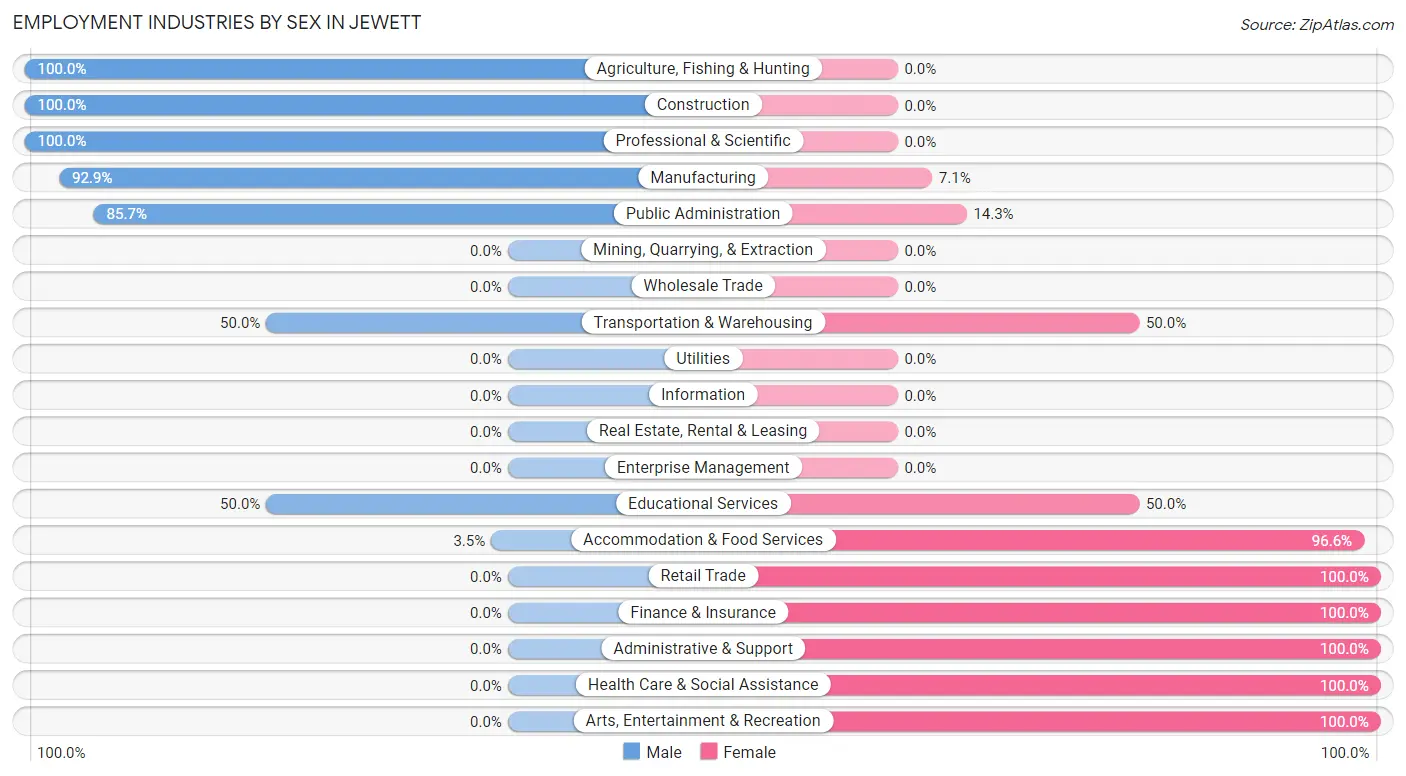
Employment Industries by Sex in Jewett
The Jewett industries that see more men than women are Agriculture, Fishing & Hunting (100.0%), Construction (100.0%), and Professional & Scientific (100.0%), whereas the industries that tend to have a higher number of women are Retail Trade (100.0%), Finance & Insurance (100.0%), and Administrative & Support (100.0%).
| Industry | Male | Female |
| Agriculture, Fishing & Hunting | 1 (100.0%) | 0 (0.0%) |
| Mining, Quarrying, & Extraction | 0 (0.0%) | 0 (0.0%) |
| Construction | 3 (100.0%) | 0 (0.0%) |
| Manufacturing | 26 (92.9%) | 2 (7.1%) |
| Wholesale Trade | 0 (0.0%) | 0 (0.0%) |
| Retail Trade | 0 (0.0%) | 8 (100.0%) |
| Transportation & Warehousing | 2 (50.0%) | 2 (50.0%) |
| Utilities | 0 (0.0%) | 0 (0.0%) |
| Information | 0 (0.0%) | 0 (0.0%) |
| Finance & Insurance | 0 (0.0%) | 3 (100.0%) |
| Real Estate, Rental & Leasing | 0 (0.0%) | 0 (0.0%) |
| Professional & Scientific | 3 (100.0%) | 0 (0.0%) |
| Enterprise Management | 0 (0.0%) | 0 (0.0%) |
| Administrative & Support | 0 (0.0%) | 1 (100.0%) |
| Educational Services | 2 (50.0%) | 2 (50.0%) |
| Health Care & Social Assistance | 0 (0.0%) | 5 (100.0%) |
| Arts, Entertainment & Recreation | 0 (0.0%) | 3 (100.0%) |
| Accommodation & Food Services | 1 (3.5%) | 28 (96.6%) |
| Public Administration | 6 (85.7%) | 1 (14.3%) |
| Total | 47 (45.2%) | 57 (54.8%) |
Education in Jewett
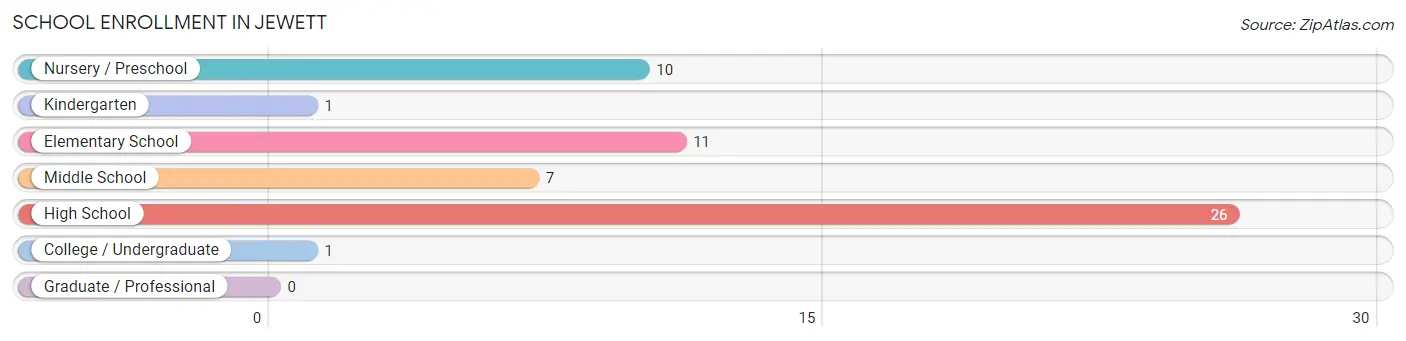
School Enrollment in Jewett
The most common levels of schooling among the 56 students in Jewett are high school (26 | 46.4%), elementary school (11 | 19.6%), and nursery / preschool (10 | 17.9%).
| School Level | # Students | % Students |
| Nursery / Preschool | 10 | 17.9% |
| Kindergarten | 1 | 1.8% |
| Elementary School | 11 | 19.6% |
| Middle School | 7 | 12.5% |
| High School | 26 | 46.4% |
| College / Undergraduate | 1 | 1.8% |
| Graduate / Professional | 0 | 0.0% |
| Total | 56 | 100.0% |
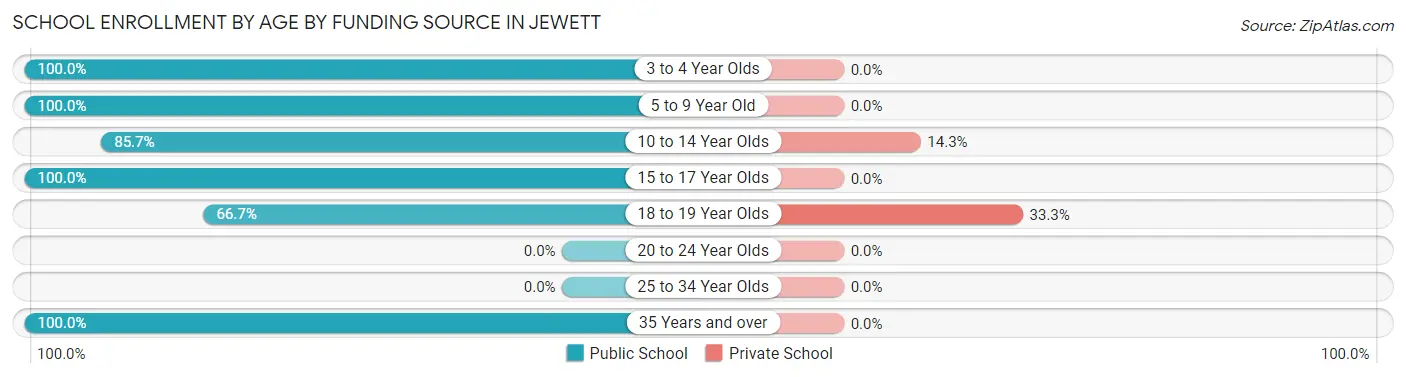
School Enrollment by Age by Funding Source in Jewett
Out of a total of 56 students who are enrolled in schools in Jewett, 3 (5.4%) attend a private institution, while the remaining 53 (94.6%) are enrolled in public schools. The age group of 18 to 19 year olds has the highest likelihood of being enrolled in private schools, with 1 (33.3% in the age bracket) enrolled. Conversely, the age group of 3 to 4 year olds has the lowest likelihood of being enrolled in a private school, with 10 (100.0% in the age bracket) attending a public institution.
| Age Bracket | Public School | Private School |
| 3 to 4 Year Olds | 10 (100.0%) | 0 (0.0%) |
| 5 to 9 Year Old | 6 (100.0%) | 0 (0.0%) |
| 10 to 14 Year Olds | 12 (85.7%) | 2 (14.3%) |
| 15 to 17 Year Olds | 20 (100.0%) | 0 (0.0%) |
| 18 to 19 Year Olds | 2 (66.7%) | 1 (33.3%) |
| 20 to 24 Year Olds | 0 (0.0%) | 0 (0.0%) |
| 25 to 34 Year Olds | 0 (0.0%) | 0 (0.0%) |
| 35 Years and over | 3 (100.0%) | 0 (0.0%) |
| Total | 53 (94.6%) | 3 (5.4%) |
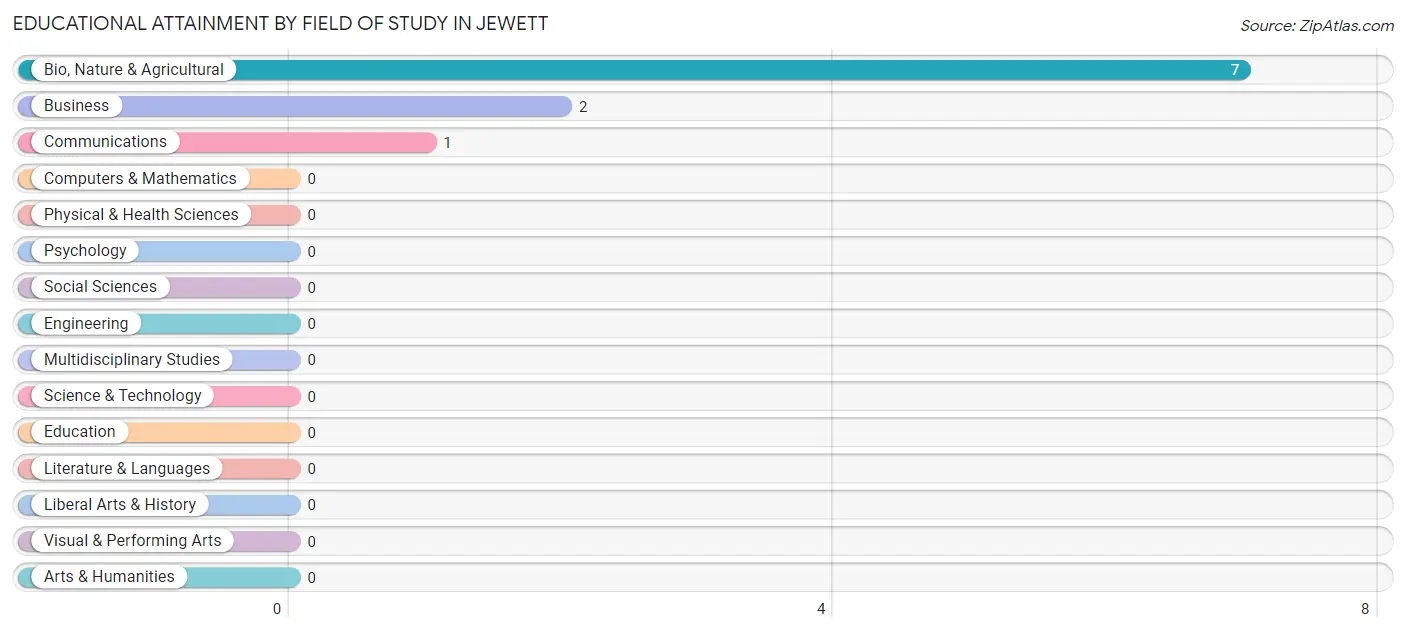
Educational Attainment by Field of Study in Jewett
Bio, nature & agricultural (7 | 70.0%), business (2 | 20.0%), and communications (1 | 10.0%) are the most common fields of study among 10 individuals in Jewett who have obtained a bachelor's degree or higher.
| Field of Study | # Graduates | % Graduates |
| Computers & Mathematics | 0 | 0.0% |
| Bio, Nature & Agricultural | 7 | 70.0% |
| Physical & Health Sciences | 0 | 0.0% |
| Psychology | 0 | 0.0% |
| Social Sciences | 0 | 0.0% |
| Engineering | 0 | 0.0% |
| Multidisciplinary Studies | 0 | 0.0% |
| Science & Technology | 0 | 0.0% |
| Business | 2 | 20.0% |
| Education | 0 | 0.0% |
| Literature & Languages | 0 | 0.0% |
| Liberal Arts & History | 0 | 0.0% |
| Visual & Performing Arts | 0 | 0.0% |
| Communications | 1 | 10.0% |
| Arts & Humanities | 0 | 0.0% |
| Total | 10 | 100.0% |
Transportation & Commute in Jewett
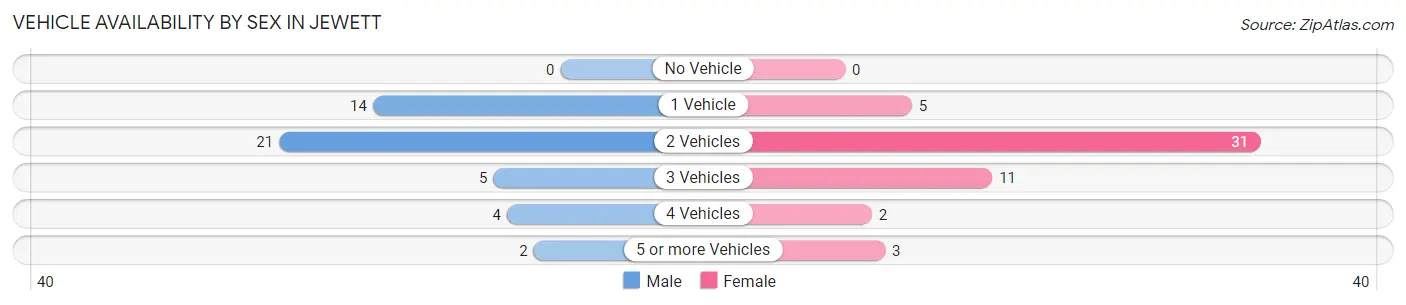
Vehicle Availability by Sex in Jewett
The most prevalent vehicle ownership categories in Jewett are males with 2 vehicles (21, accounting for 45.7%) and females with 2 vehicles (31, making up 40.4%).
| Vehicles Available | Male | Female |
| No Vehicle | 0 (0.0%) | 0 (0.0%) |
| 1 Vehicle | 14 (30.4%) | 5 (9.6%) |
| 2 Vehicles | 21 (45.7%) | 31 (59.6%) |
| 3 Vehicles | 5 (10.9%) | 11 (21.1%) |
| 4 Vehicles | 4 (8.7%) | 2 (3.8%) |
| 5 or more Vehicles | 2 (4.3%) | 3 (5.8%) |
| Total | 46 (100.0%) | 52 (100.0%) |
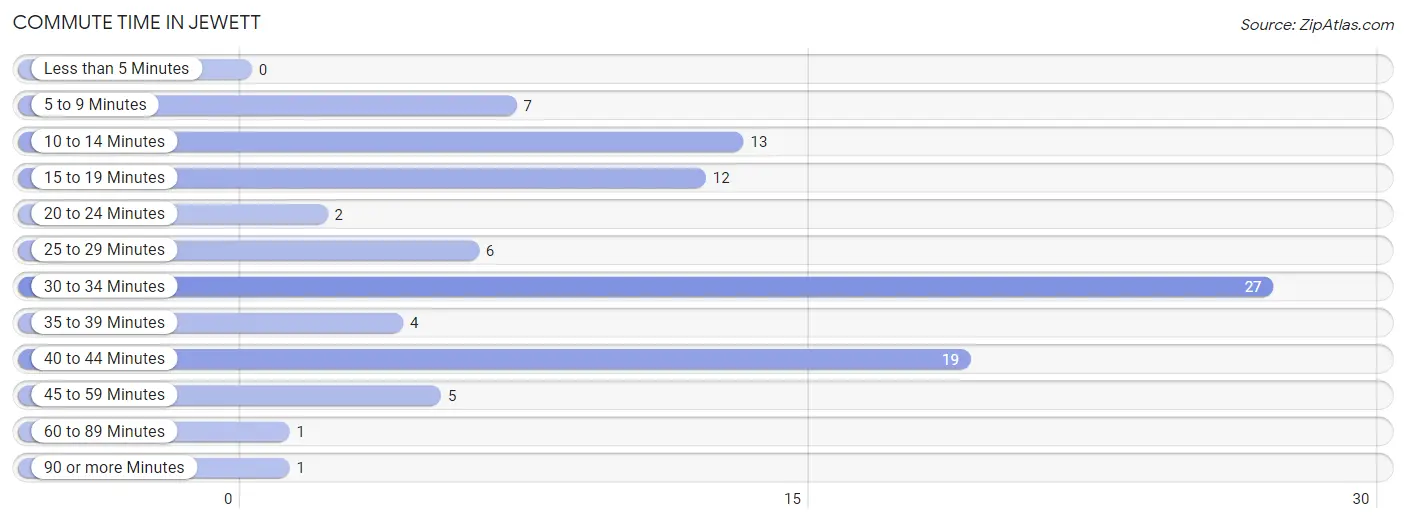
Commute Time in Jewett
The most frequently occuring commute durations in Jewett are 30 to 34 minutes (27 commuters, 27.8%), 40 to 44 minutes (19 commuters, 19.6%), and 10 to 14 minutes (13 commuters, 13.4%).
| Commute Time | # Commuters | % Commuters |
| Less than 5 Minutes | 0 | 0.0% |
| 5 to 9 Minutes | 7 | 7.2% |
| 10 to 14 Minutes | 13 | 13.4% |
| 15 to 19 Minutes | 12 | 12.4% |
| 20 to 24 Minutes | 2 | 2.1% |
| 25 to 29 Minutes | 6 | 6.2% |
| 30 to 34 Minutes | 27 | 27.8% |
| 35 to 39 Minutes | 4 | 4.1% |
| 40 to 44 Minutes | 19 | 19.6% |
| 45 to 59 Minutes | 5 | 5.1% |
| 60 to 89 Minutes | 1 | 1.0% |
| 90 or more Minutes | 1 | 1.0% |
Commute Time by Sex in Jewett
The most common commute times in Jewett are 30 to 34 minutes (17 commuters, 37.0%) for males and 40 to 44 minutes (19 commuters, 37.2%) for females.
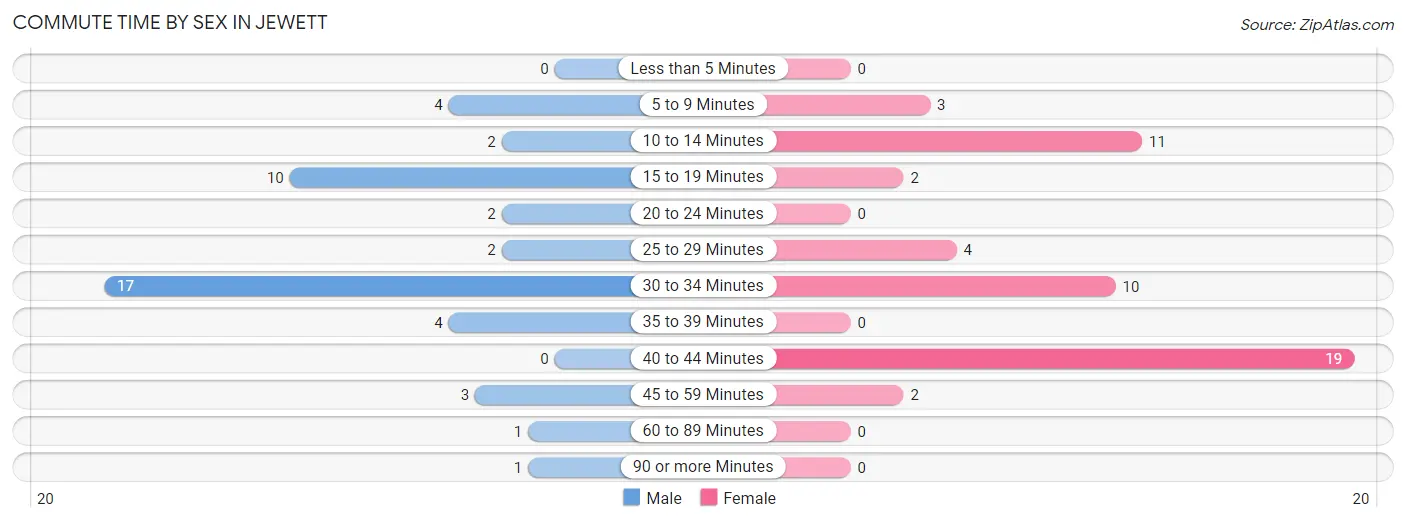
| Commute Time | Male | Female |
| Less than 5 Minutes | 0 (0.0%) | 0 (0.0%) |
| 5 to 9 Minutes | 4 (8.7%) | 3 (5.9%) |
| 10 to 14 Minutes | 2 (4.3%) | 11 (21.6%) |
| 15 to 19 Minutes | 10 (21.7%) | 2 (3.9%) |
| 20 to 24 Minutes | 2 (4.3%) | 0 (0.0%) |
| 25 to 29 Minutes | 2 (4.3%) | 4 (7.8%) |
| 30 to 34 Minutes | 17 (37.0%) | 10 (19.6%) |
| 35 to 39 Minutes | 4 (8.7%) | 0 (0.0%) |
| 40 to 44 Minutes | 0 (0.0%) | 19 (37.2%) |
| 45 to 59 Minutes | 3 (6.5%) | 2 (3.9%) |
| 60 to 89 Minutes | 1 (2.2%) | 0 (0.0%) |
| 90 or more Minutes | 1 (2.2%) | 0 (0.0%) |
Time of Departure to Work by Sex in Jewett
The most frequent times of departure to work in Jewett are 12:00 AM to 4:59 AM (14, 30.4%) for males and 6:30 AM to 6:59 AM (19, 37.2%) for females.
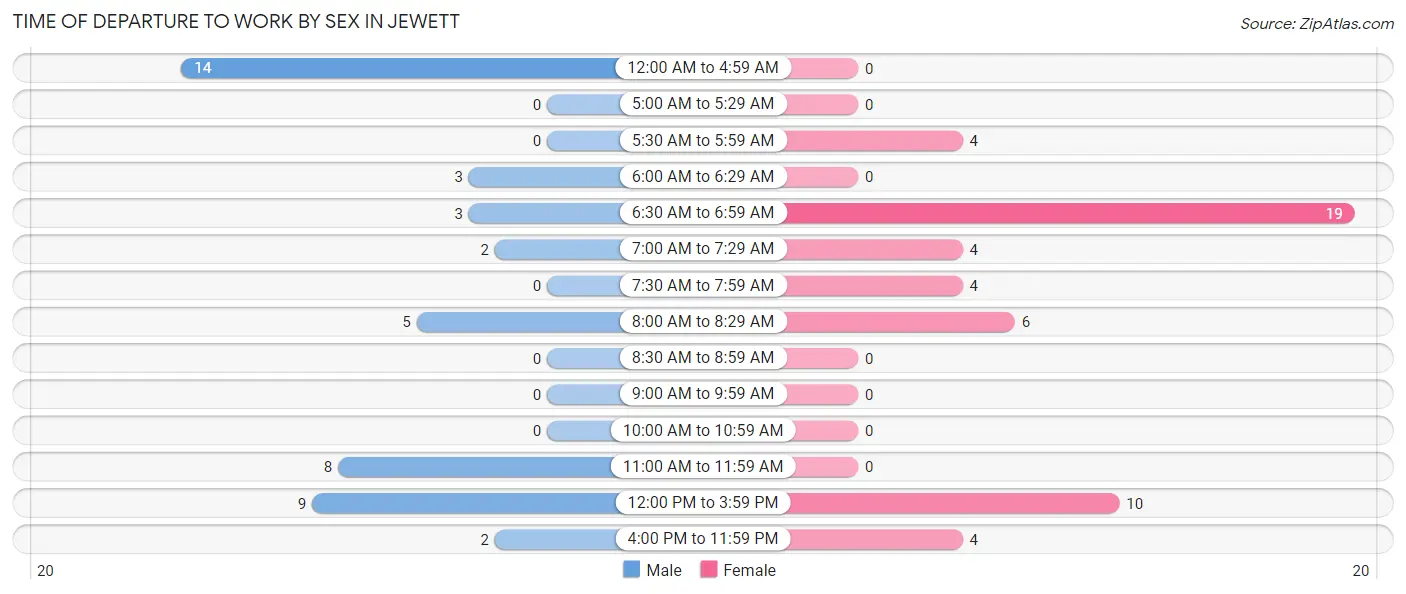
| Time of Departure | Male | Female |
| 12:00 AM to 4:59 AM | 14 (30.4%) | 0 (0.0%) |
| 5:00 AM to 5:29 AM | 0 (0.0%) | 0 (0.0%) |
| 5:30 AM to 5:59 AM | 0 (0.0%) | 4 (7.8%) |
| 6:00 AM to 6:29 AM | 3 (6.5%) | 0 (0.0%) |
| 6:30 AM to 6:59 AM | 3 (6.5%) | 19 (37.2%) |
| 7:00 AM to 7:29 AM | 2 (4.3%) | 4 (7.8%) |
| 7:30 AM to 7:59 AM | 0 (0.0%) | 4 (7.8%) |
| 8:00 AM to 8:29 AM | 5 (10.9%) | 6 (11.8%) |
| 8:30 AM to 8:59 AM | 0 (0.0%) | 0 (0.0%) |
| 9:00 AM to 9:59 AM | 0 (0.0%) | 0 (0.0%) |
| 10:00 AM to 10:59 AM | 0 (0.0%) | 0 (0.0%) |
| 11:00 AM to 11:59 AM | 8 (17.4%) | 0 (0.0%) |
| 12:00 PM to 3:59 PM | 9 (19.6%) | 10 (19.6%) |
| 4:00 PM to 11:59 PM | 2 (4.3%) | 4 (7.8%) |
| Total | 46 (100.0%) | 51 (100.0%) |
Housing Occupancy in Jewett
Occupancy by Ownership in Jewett
Of the total 100 dwellings in Jewett, owner-occupied units account for 85 (85.0%), while renter-occupied units make up 15 (15.0%).
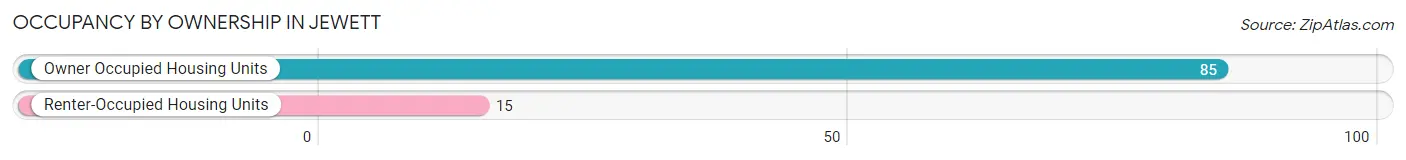
| Occupancy | # Housing Units | % Housing Units |
| Owner Occupied Housing Units | 85 | 85.0% |
| Renter-Occupied Housing Units | 15 | 15.0% |
| Total Occupied Housing Units | 100 | 100.0% |
Occupancy by Household Size in Jewett
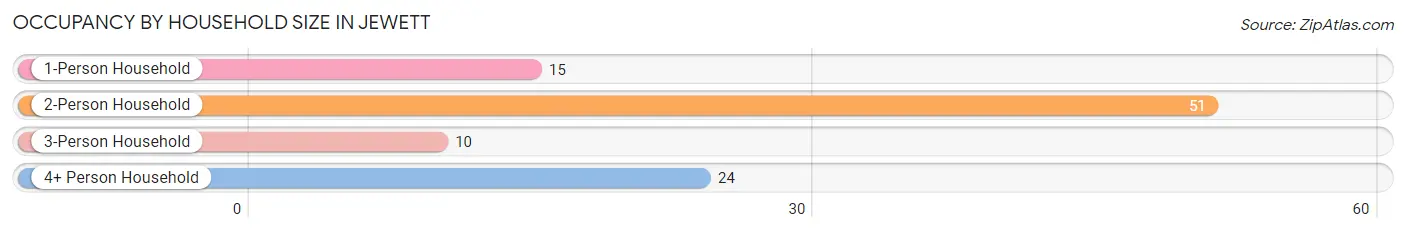
| Household Size | # Housing Units | % Housing Units |
| 1-Person Household | 15 | 15.0% |
| 2-Person Household | 51 | 51.0% |
| 3-Person Household | 10 | 10.0% |
| 4+ Person Household | 24 | 24.0% |
| Total Housing Units | 100 | 100.0% |
Occupancy by Ownership by Household Size in Jewett
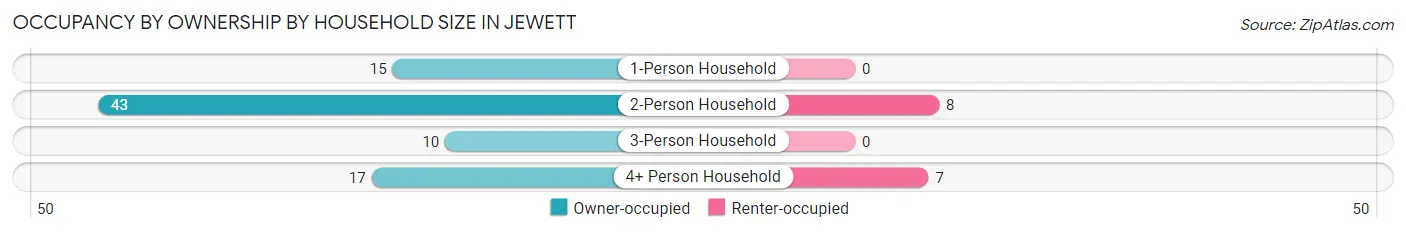
| Household Size | Owner-occupied | Renter-occupied |
| 1-Person Household | 15 (100.0%) | 0 (0.0%) |
| 2-Person Household | 43 (84.3%) | 8 (15.7%) |
| 3-Person Household | 10 (100.0%) | 0 (0.0%) |
| 4+ Person Household | 17 (70.8%) | 7 (29.2%) |
| Total Housing Units | 85 (85.0%) | 15 (15.0%) |
Occupancy by Educational Attainment in Jewett
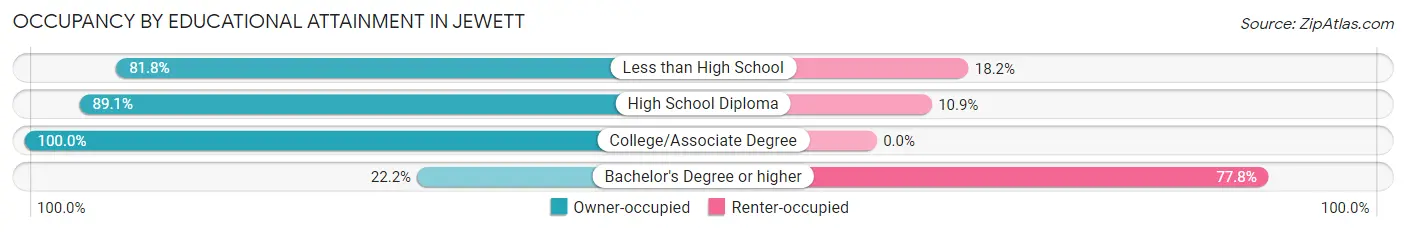
| Household Size | Owner-occupied | Renter-occupied |
| Less than High School | 9 (81.8%) | 2 (18.2%) |
| High School Diploma | 49 (89.1%) | 6 (10.9%) |
| College/Associate Degree | 25 (100.0%) | 0 (0.0%) |
| Bachelor's Degree or higher | 2 (22.2%) | 7 (77.8%) |
Occupancy by Age of Householder in Jewett
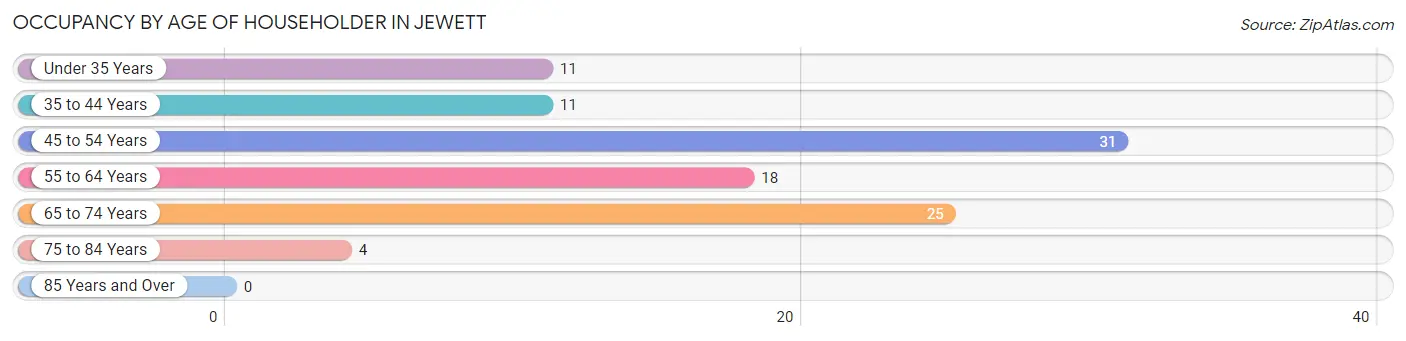
| Age Bracket | # Households | % Households |
| Under 35 Years | 11 | 11.0% |
| 35 to 44 Years | 11 | 11.0% |
| 45 to 54 Years | 31 | 31.0% |
| 55 to 64 Years | 18 | 18.0% |
| 65 to 74 Years | 25 | 25.0% |
| 75 to 84 Years | 4 | 4.0% |
| 85 Years and Over | 0 | 0.0% |
| Total | 100 | 100.0% |
Housing Finances in Jewett
Median Income by Occupancy in Jewett
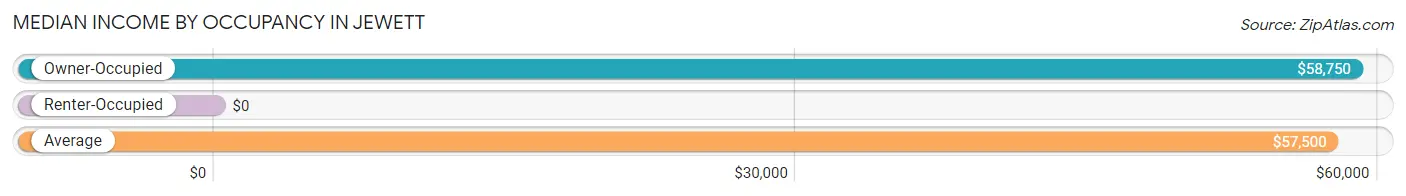
| Occupancy Type | # Households | Median Income |
| Owner-Occupied | 85 (85.0%) | $58,750 |
| Renter-Occupied | 15 (15.0%) | $0 |
| Average | 100 (100.0%) | $57,500 |
Occupancy by Householder Income Bracket in Jewett
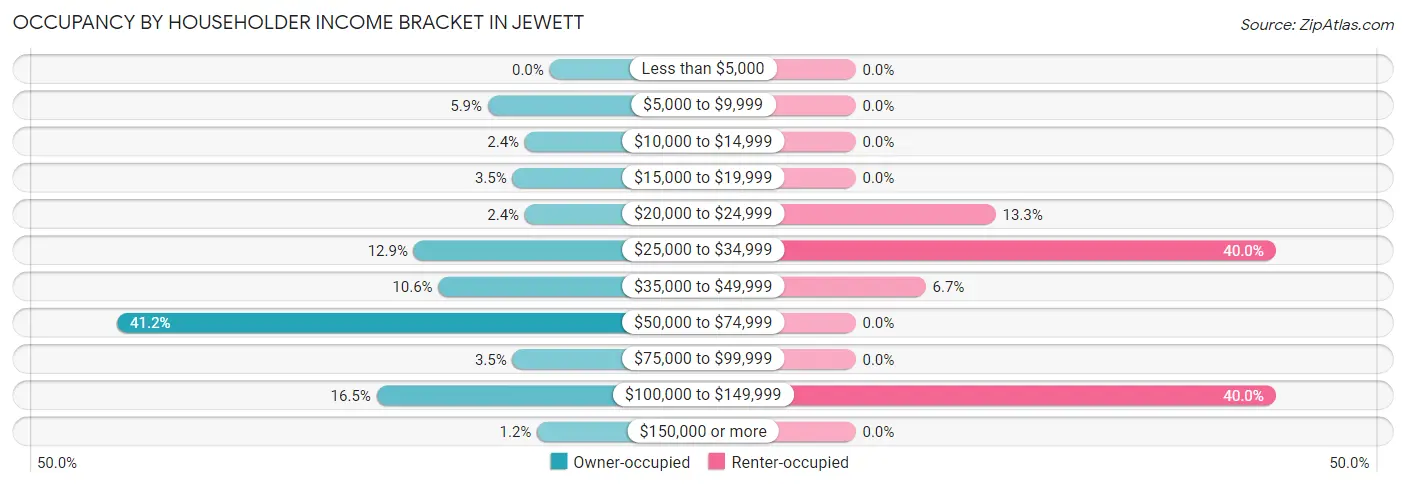
| Income Bracket | Owner-occupied | Renter-occupied |
| Less than $5,000 | 0 (0.0%) | 0 (0.0%) |
| $5,000 to $9,999 | 5 (5.9%) | 0 (0.0%) |
| $10,000 to $14,999 | 2 (2.4%) | 0 (0.0%) |
| $15,000 to $19,999 | 3 (3.5%) | 0 (0.0%) |
| $20,000 to $24,999 | 2 (2.4%) | 2 (13.3%) |
| $25,000 to $34,999 | 11 (12.9%) | 6 (40.0%) |
| $35,000 to $49,999 | 9 (10.6%) | 1 (6.7%) |
| $50,000 to $74,999 | 35 (41.2%) | 0 (0.0%) |
| $75,000 to $99,999 | 3 (3.5%) | 0 (0.0%) |
| $100,000 to $149,999 | 14 (16.5%) | 6 (40.0%) |
| $150,000 or more | 1 (1.2%) | 0 (0.0%) |
| Total | 85 (100.0%) | 15 (100.0%) |
Monthly Housing Cost Tiers in Jewett
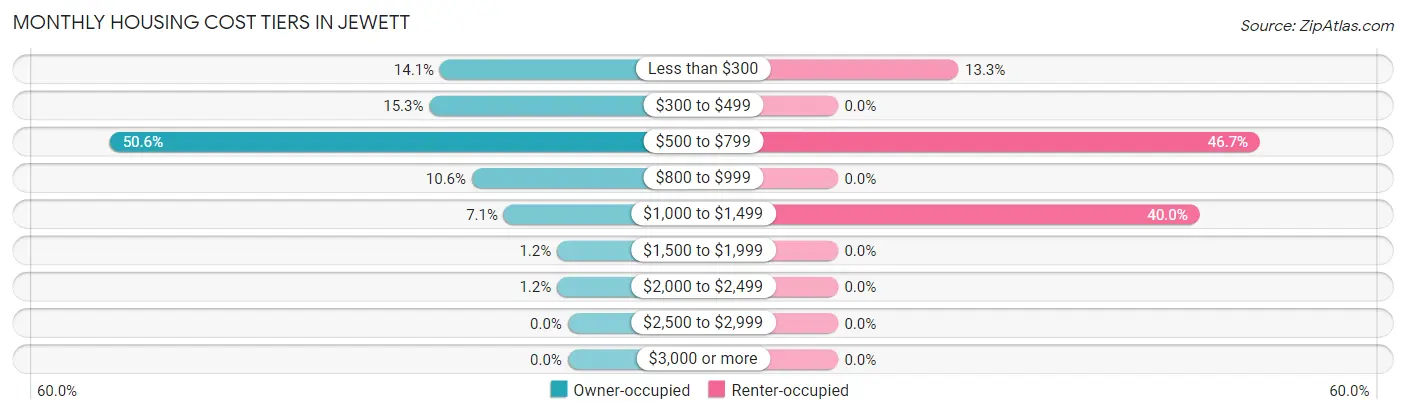
| Monthly Cost | Owner-occupied | Renter-occupied |
| Less than $300 | 12 (14.1%) | 2 (13.3%) |
| $300 to $499 | 13 (15.3%) | 0 (0.0%) |
| $500 to $799 | 43 (50.6%) | 7 (46.7%) |
| $800 to $999 | 9 (10.6%) | 0 (0.0%) |
| $1,000 to $1,499 | 6 (7.1%) | 6 (40.0%) |
| $1,500 to $1,999 | 1 (1.2%) | 0 (0.0%) |
| $2,000 to $2,499 | 1 (1.2%) | 0 (0.0%) |
| $2,500 to $2,999 | 0 (0.0%) | 0 (0.0%) |
| $3,000 or more | 0 (0.0%) | 0 (0.0%) |
| Total | 85 (100.0%) | 15 (100.0%) |
Physical Housing Characteristics in Jewett
Housing Structures in Jewett
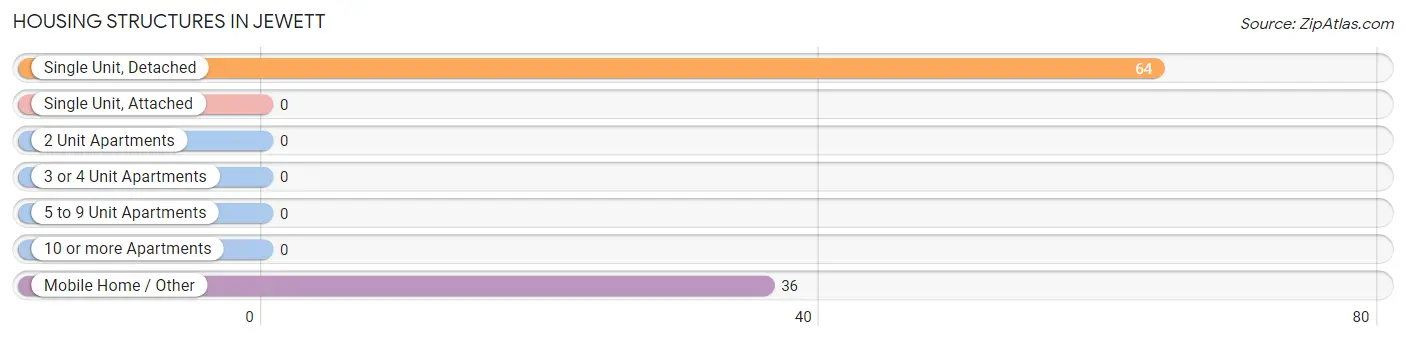
| Structure Type | # Housing Units | % Housing Units |
| Single Unit, Detached | 64 | 64.0% |
| Single Unit, Attached | 0 | 0.0% |
| 2 Unit Apartments | 0 | 0.0% |
| 3 or 4 Unit Apartments | 0 | 0.0% |
| 5 to 9 Unit Apartments | 0 | 0.0% |
| 10 or more Apartments | 0 | 0.0% |
| Mobile Home / Other | 36 | 36.0% |
| Total | 100 | 100.0% |
Housing Structures by Occupancy in Jewett
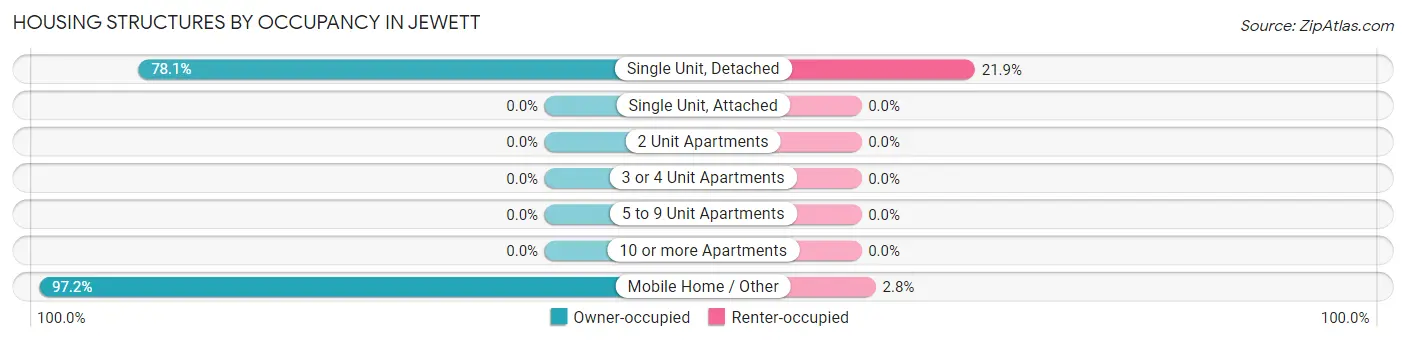
| Structure Type | Owner-occupied | Renter-occupied |
| Single Unit, Detached | 50 (78.1%) | 14 (21.9%) |
| Single Unit, Attached | 0 (0.0%) | 0 (0.0%) |
| 2 Unit Apartments | 0 (0.0%) | 0 (0.0%) |
| 3 or 4 Unit Apartments | 0 (0.0%) | 0 (0.0%) |
| 5 to 9 Unit Apartments | 0 (0.0%) | 0 (0.0%) |
| 10 or more Apartments | 0 (0.0%) | 0 (0.0%) |
| Mobile Home / Other | 35 (97.2%) | 1 (2.8%) |
| Total | 85 (85.0%) | 15 (15.0%) |
Housing Structures by Number of Rooms in Jewett
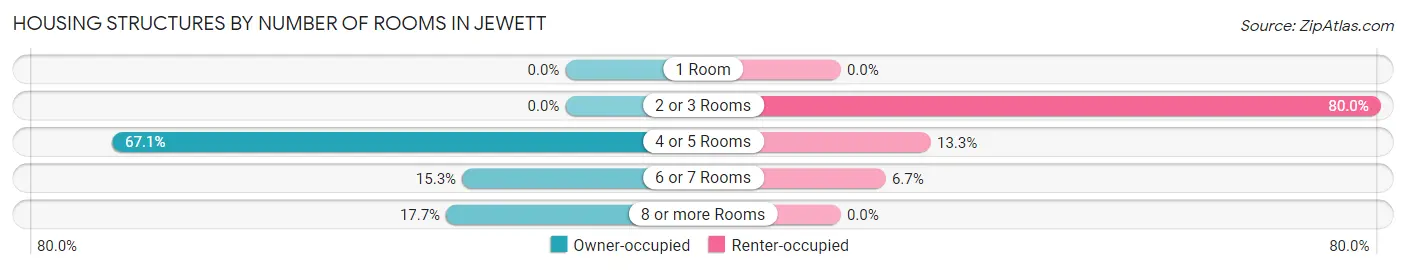
| Number of Rooms | Owner-occupied | Renter-occupied |
| 1 Room | 0 (0.0%) | 0 (0.0%) |
| 2 or 3 Rooms | 0 (0.0%) | 12 (80.0%) |
| 4 or 5 Rooms | 57 (67.1%) | 2 (13.3%) |
| 6 or 7 Rooms | 13 (15.3%) | 1 (6.7%) |
| 8 or more Rooms | 15 (17.6%) | 0 (0.0%) |
| Total | 85 (100.0%) | 15 (100.0%) |
Housing Structure by Heating Type in Jewett
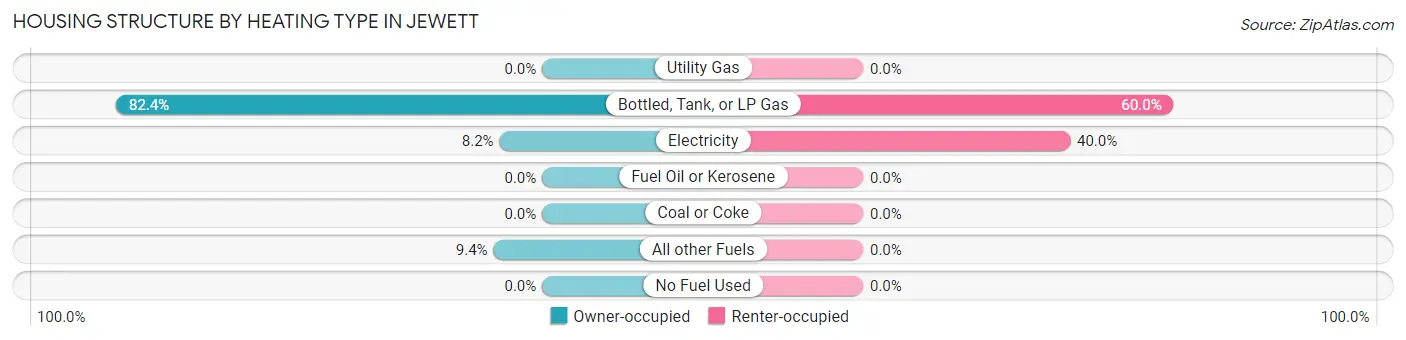
| Heating Type | Owner-occupied | Renter-occupied |
| Utility Gas | 0 (0.0%) | 0 (0.0%) |
| Bottled, Tank, or LP Gas | 70 (82.4%) | 9 (60.0%) |
| Electricity | 7 (8.2%) | 6 (40.0%) |
| Fuel Oil or Kerosene | 0 (0.0%) | 0 (0.0%) |
| Coal or Coke | 0 (0.0%) | 0 (0.0%) |
| All other Fuels | 8 (9.4%) | 0 (0.0%) |
| No Fuel Used | 0 (0.0%) | 0 (0.0%) |
| Total | 85 (100.0%) | 15 (100.0%) |
Household Vehicle Usage in Jewett
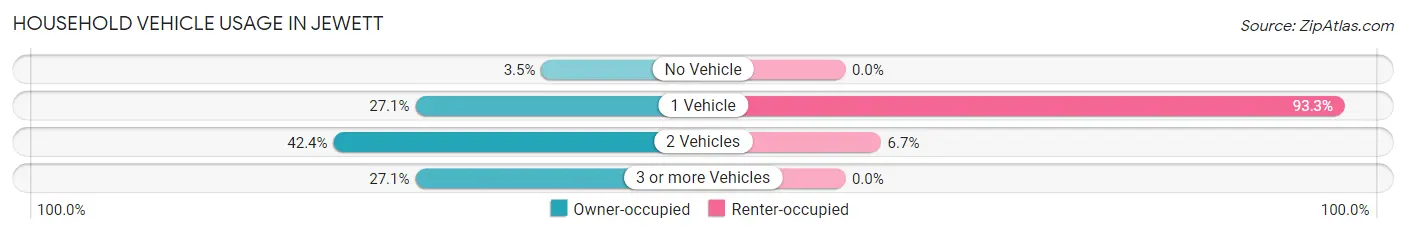
| Vehicles per Household | Owner-occupied | Renter-occupied |
| No Vehicle | 3 (3.5%) | 0 (0.0%) |
| 1 Vehicle | 23 (27.1%) | 14 (93.3%) |
| 2 Vehicles | 36 (42.3%) | 1 (6.7%) |
| 3 or more Vehicles | 23 (27.1%) | 0 (0.0%) |
| Total | 85 (100.0%) | 15 (100.0%) |
Real Estate & Mortgages in Jewett
Real Estate and Mortgage Overview in Jewett
| Characteristic | Without Mortgage | With Mortgage |
| Housing Units | 33 | 52 |
| Median Property Value | $68,300 | $50,000 |
| Median Household Income | $38,438 | $1 |
| Monthly Housing Costs | $425 | $0 |
| Real Estate Taxes | $1,583 | $2 |
Property Value by Mortgage Status in Jewett
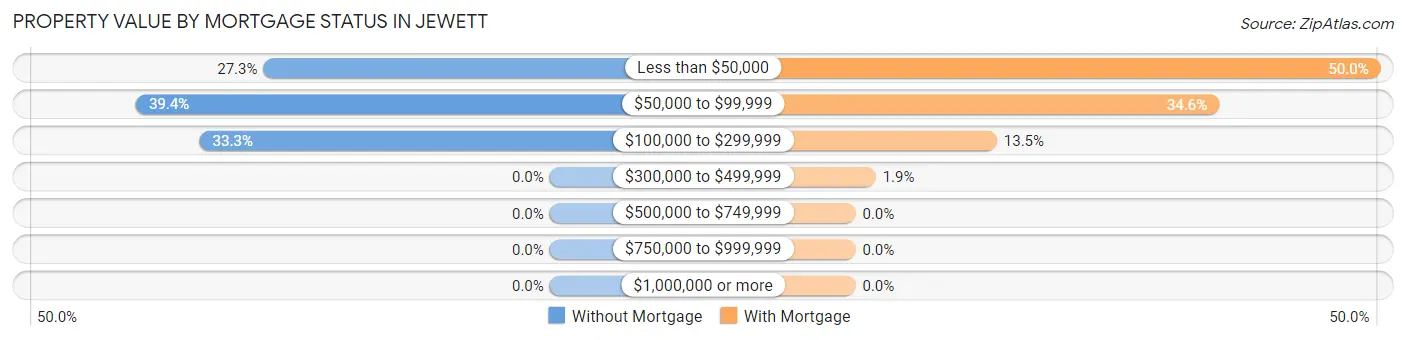
| Property Value | Without Mortgage | With Mortgage |
| Less than $50,000 | 9 (27.3%) | 26 (50.0%) |
| $50,000 to $99,999 | 13 (39.4%) | 18 (34.6%) |
| $100,000 to $299,999 | 11 (33.3%) | 7 (13.5%) |
| $300,000 to $499,999 | 0 (0.0%) | 1 (1.9%) |
| $500,000 to $749,999 | 0 (0.0%) | 0 (0.0%) |
| $750,000 to $999,999 | 0 (0.0%) | 0 (0.0%) |
| $1,000,000 or more | 0 (0.0%) | 0 (0.0%) |
| Total | 33 (100.0%) | 52 (100.0%) |
Household Income by Mortgage Status in Jewett
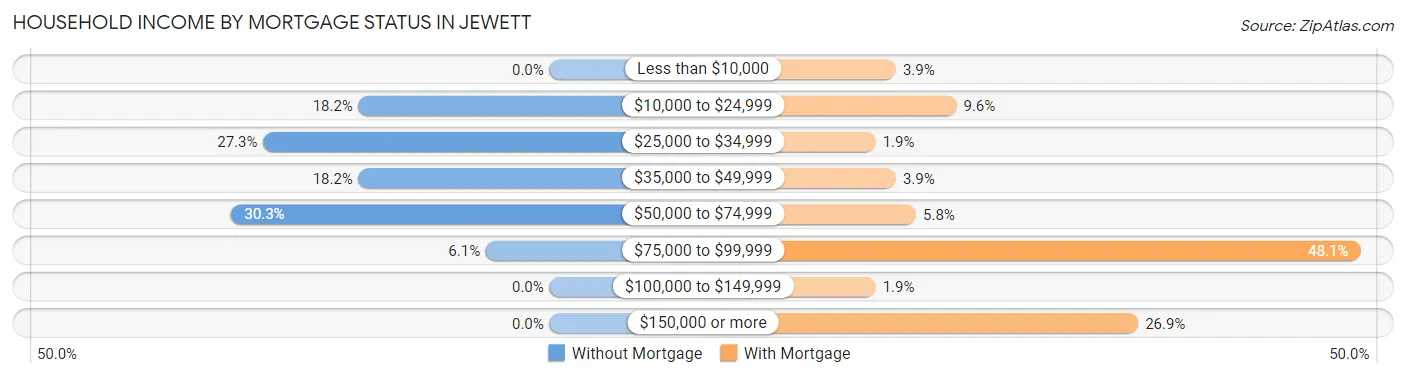
| Household Income | Without Mortgage | With Mortgage |
| Less than $10,000 | 0 (0.0%) | 2 (3.8%) |
| $10,000 to $24,999 | 6 (18.2%) | 5 (9.6%) |
| $25,000 to $34,999 | 9 (27.3%) | 1 (1.9%) |
| $35,000 to $49,999 | 6 (18.2%) | 2 (3.8%) |
| $50,000 to $74,999 | 10 (30.3%) | 3 (5.8%) |
| $75,000 to $99,999 | 2 (6.1%) | 25 (48.1%) |
| $100,000 to $149,999 | 0 (0.0%) | 1 (1.9%) |
| $150,000 or more | 0 (0.0%) | 14 (26.9%) |
| Total | 33 (100.0%) | 52 (100.0%) |
Property Value to Household Income Ratio in Jewett
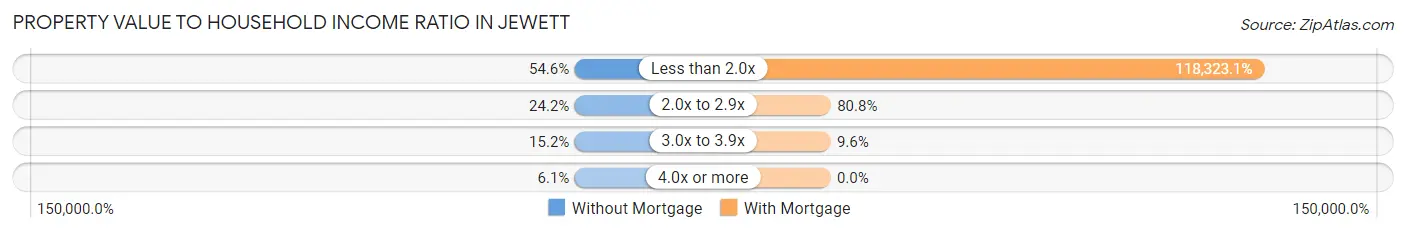
| Value-to-Income Ratio | Without Mortgage | With Mortgage |
| Less than 2.0x | 18 (54.5%) | 61,528 (118,323.1%) |
| 2.0x to 2.9x | 8 (24.2%) | 42 (80.8%) |
| 3.0x to 3.9x | 5 (15.1%) | 5 (9.6%) |
| 4.0x or more | 2 (6.1%) | 0 (0.0%) |
| Total | 33 (100.0%) | 52 (100.0%) |
Real Estate Taxes by Mortgage Status in Jewett
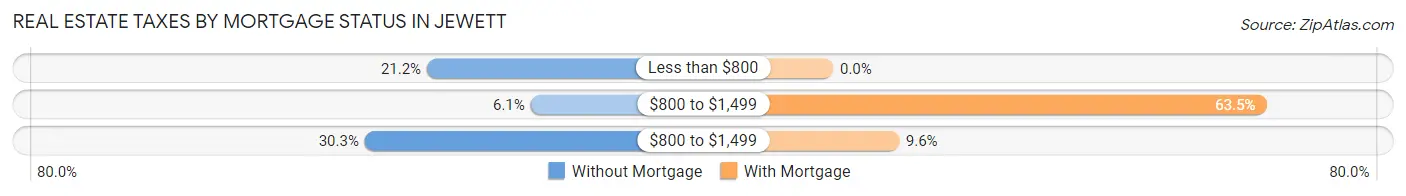
| Property Taxes | Without Mortgage | With Mortgage |
| Less than $800 | 7 (21.2%) | 0 (0.0%) |
| $800 to $1,499 | 2 (6.1%) | 33 (63.5%) |
| $800 to $1,499 | 10 (30.3%) | 5 (9.6%) |
| Total | 33 (100.0%) | 52 (100.0%) |
Health & Disability in Jewett
Health Insurance Coverage by Age in Jewett
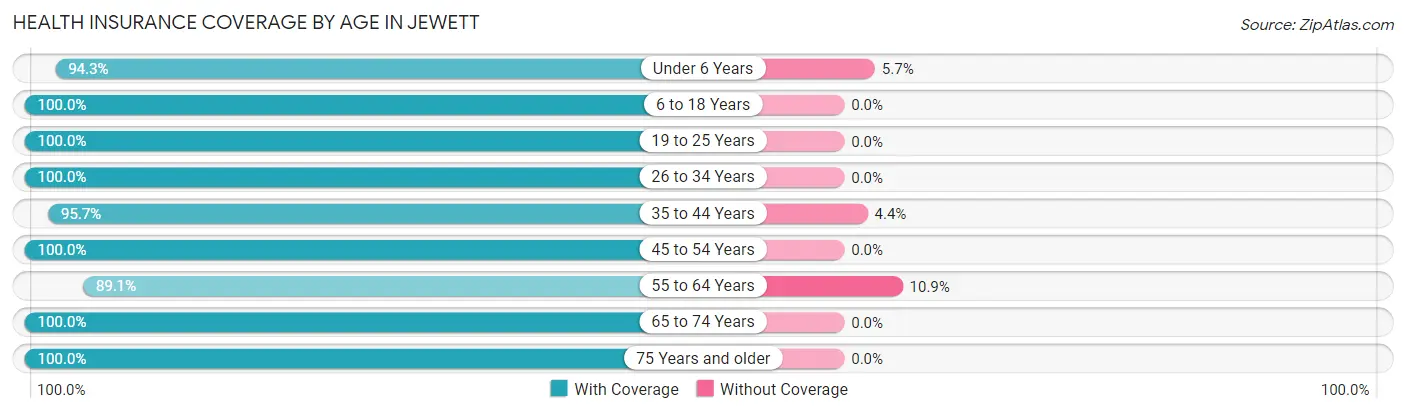
| Age Bracket | With Coverage | Without Coverage |
| Under 6 Years | 33 (94.3%) | 2 (5.7%) |
| 6 to 18 Years | 42 (100.0%) | 0 (0.0%) |
| 19 to 25 Years | 13 (100.0%) | 0 (0.0%) |
| 26 to 34 Years | 16 (100.0%) | 0 (0.0%) |
| 35 to 44 Years | 22 (95.7%) | 1 (4.3%) |
| 45 to 54 Years | 34 (100.0%) | 0 (0.0%) |
| 55 to 64 Years | 41 (89.1%) | 5 (10.9%) |
| 65 to 74 Years | 35 (100.0%) | 0 (0.0%) |
| 75 Years and older | 17 (100.0%) | 0 (0.0%) |
| Total | 253 (96.9%) | 8 (3.1%) |
Health Insurance Coverage by Citizenship Status in Jewett
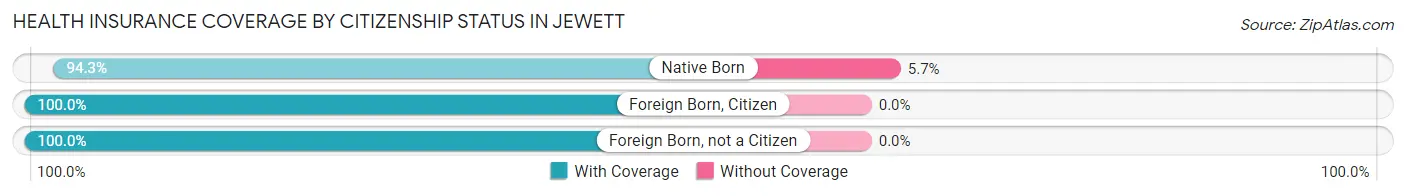
| Citizenship Status | With Coverage | Without Coverage |
| Native Born | 33 (94.3%) | 2 (5.7%) |
| Foreign Born, Citizen | 42 (100.0%) | 0 (0.0%) |
| Foreign Born, not a Citizen | 13 (100.0%) | 0 (0.0%) |
Health Insurance Coverage by Household Income in Jewett
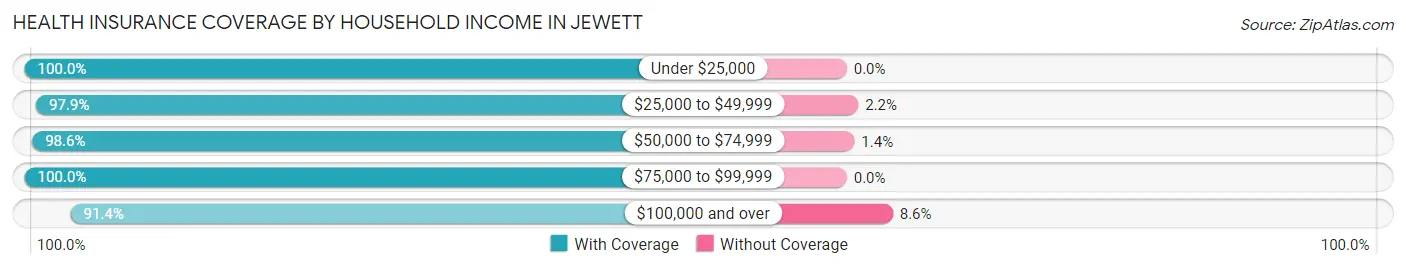
| Household Income | With Coverage | Without Coverage |
| Under $25,000 | 32 (100.0%) | 0 (0.0%) |
| $25,000 to $49,999 | 91 (97.9%) | 2 (2.1%) |
| $50,000 to $74,999 | 69 (98.6%) | 1 (1.4%) |
| $75,000 to $99,999 | 8 (100.0%) | 0 (0.0%) |
| $100,000 and over | 53 (91.4%) | 5 (8.6%) |
Public vs Private Health Insurance Coverage by Age in Jewett
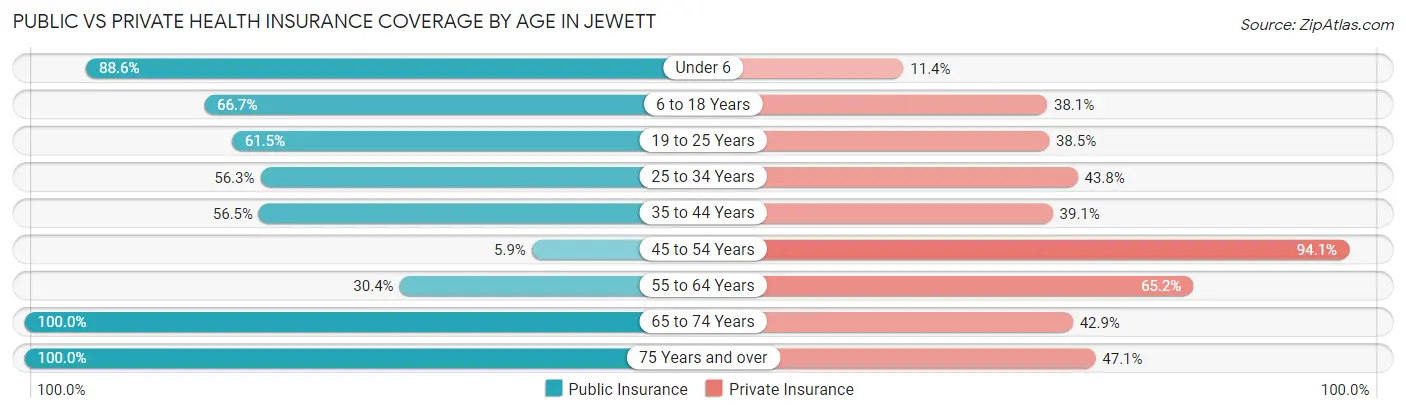
| Age Bracket | Public Insurance | Private Insurance |
| Under 6 | 31 (88.6%) | 4 (11.4%) |
| 6 to 18 Years | 28 (66.7%) | 16 (38.1%) |
| 19 to 25 Years | 8 (61.5%) | 5 (38.5%) |
| 25 to 34 Years | 9 (56.2%) | 7 (43.8%) |
| 35 to 44 Years | 13 (56.5%) | 9 (39.1%) |
| 45 to 54 Years | 2 (5.9%) | 32 (94.1%) |
| 55 to 64 Years | 14 (30.4%) | 30 (65.2%) |
| 65 to 74 Years | 35 (100.0%) | 15 (42.9%) |
| 75 Years and over | 17 (100.0%) | 8 (47.1%) |
| Total | 157 (60.2%) | 126 (48.3%) |
Disability Status by Sex by Age in Jewett
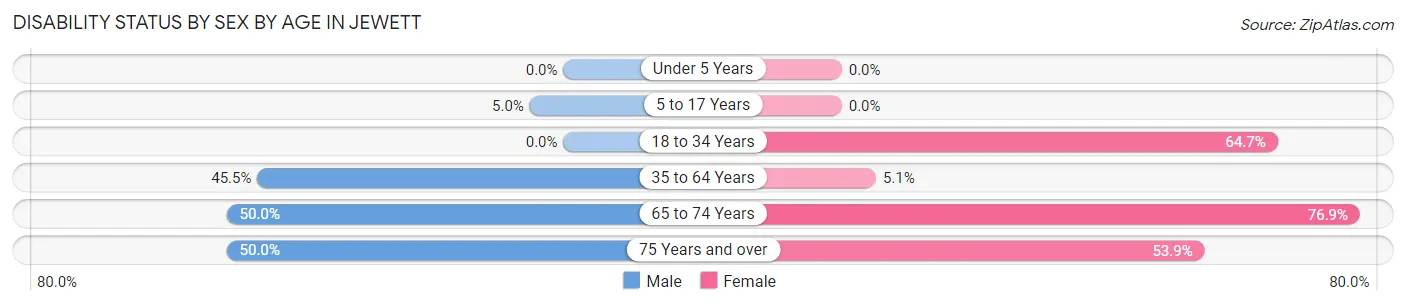
| Age Bracket | Male | Female |
| Under 5 Years | 0 (0.0%) | 0 (0.0%) |
| 5 to 17 Years | 1 (5.0%) | 0 (0.0%) |
| 18 to 34 Years | 0 (0.0%) | 11 (64.7%) |
| 35 to 64 Years | 20 (45.5%) | 3 (5.1%) |
| 65 to 74 Years | 11 (50.0%) | 10 (76.9%) |
| 75 Years and over | 2 (50.0%) | 7 (53.8%) |
Disability Class by Sex by Age in Jewett
Disability Class: Hearing Difficulty
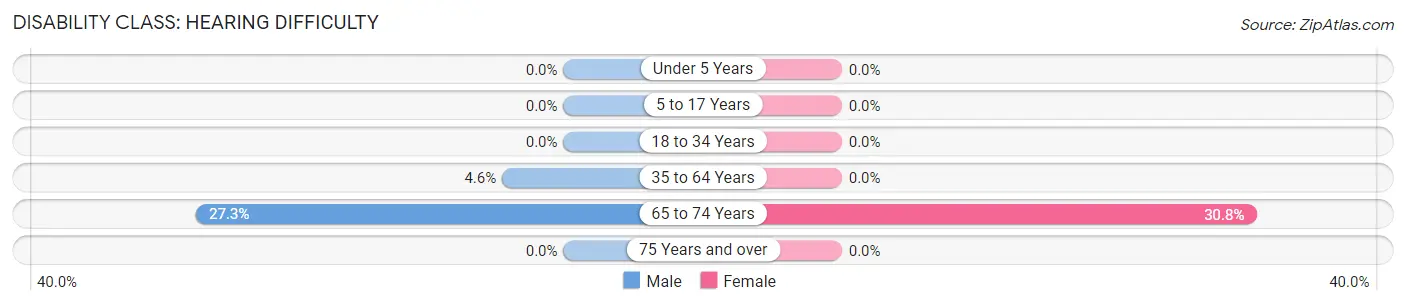
| Age Bracket | Male | Female |
| Under 5 Years | 0 (0.0%) | 0 (0.0%) |
| 5 to 17 Years | 0 (0.0%) | 0 (0.0%) |
| 18 to 34 Years | 0 (0.0%) | 0 (0.0%) |
| 35 to 64 Years | 2 (4.5%) | 0 (0.0%) |
| 65 to 74 Years | 6 (27.3%) | 4 (30.8%) |
| 75 Years and over | 0 (0.0%) | 0 (0.0%) |
Disability Class: Vision Difficulty
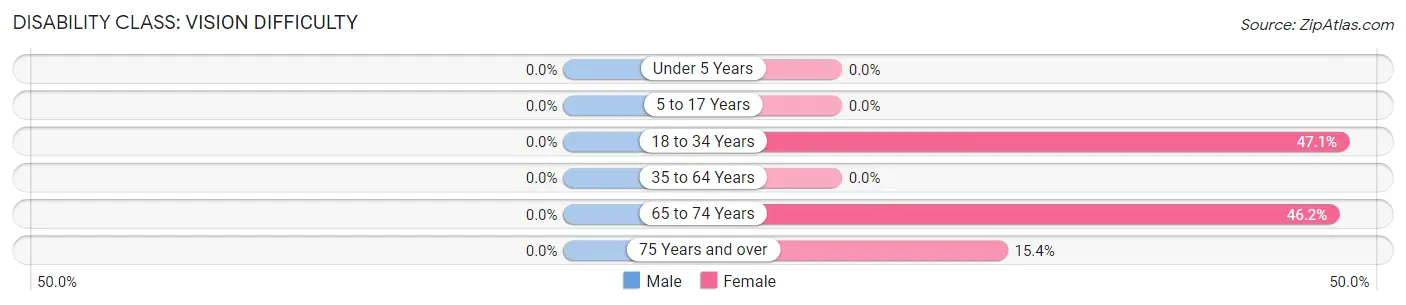
| Age Bracket | Male | Female |
| Under 5 Years | 0 (0.0%) | 0 (0.0%) |
| 5 to 17 Years | 0 (0.0%) | 0 (0.0%) |
| 18 to 34 Years | 0 (0.0%) | 8 (47.1%) |
| 35 to 64 Years | 0 (0.0%) | 0 (0.0%) |
| 65 to 74 Years | 0 (0.0%) | 6 (46.2%) |
| 75 Years and over | 0 (0.0%) | 2 (15.4%) |
Disability Class: Cognitive Difficulty
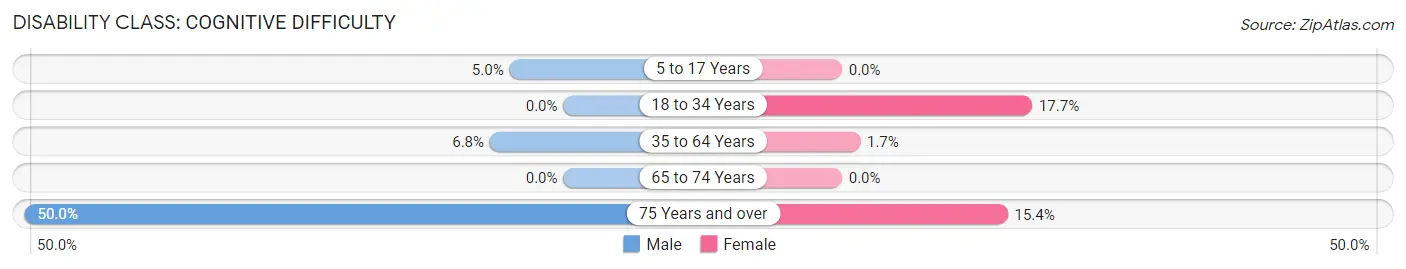
| Age Bracket | Male | Female |
| 5 to 17 Years | 1 (5.0%) | 0 (0.0%) |
| 18 to 34 Years | 0 (0.0%) | 3 (17.6%) |
| 35 to 64 Years | 3 (6.8%) | 1 (1.7%) |
| 65 to 74 Years | 0 (0.0%) | 0 (0.0%) |
| 75 Years and over | 2 (50.0%) | 2 (15.4%) |
Disability Class: Ambulatory Difficulty
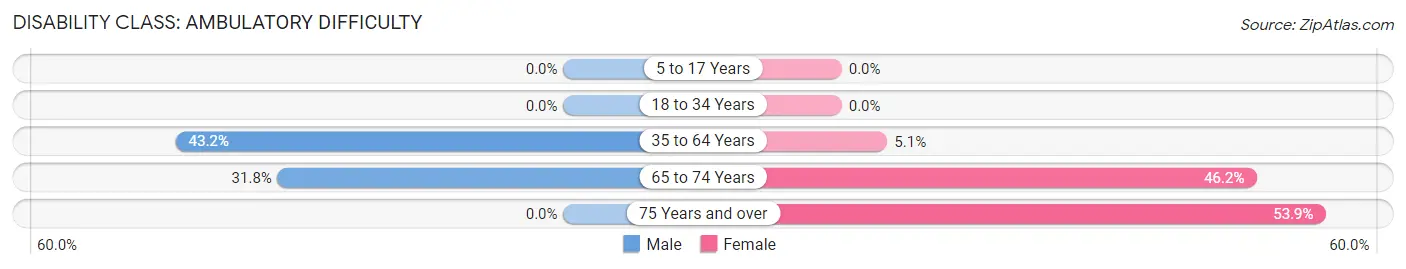
| Age Bracket | Male | Female |
| 5 to 17 Years | 0 (0.0%) | 0 (0.0%) |
| 18 to 34 Years | 0 (0.0%) | 0 (0.0%) |
| 35 to 64 Years | 19 (43.2%) | 3 (5.1%) |
| 65 to 74 Years | 7 (31.8%) | 6 (46.2%) |
| 75 Years and over | 0 (0.0%) | 7 (53.8%) |
Disability Class: Self-Care Difficulty
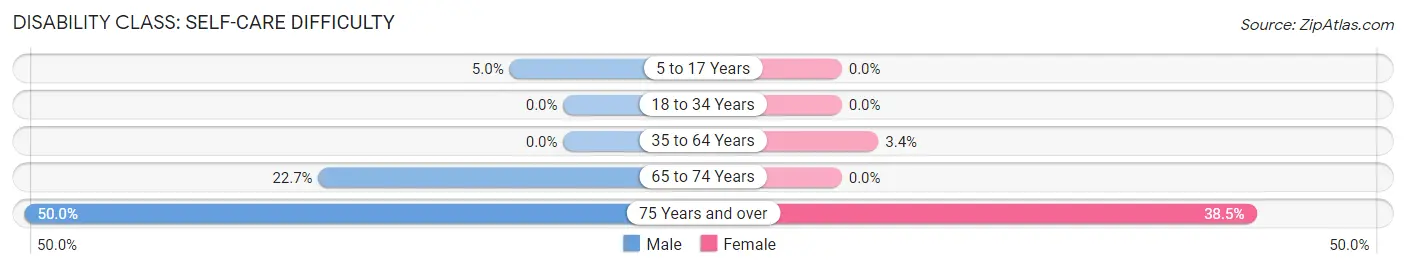
| Age Bracket | Male | Female |
| 5 to 17 Years | 1 (5.0%) | 0 (0.0%) |
| 18 to 34 Years | 0 (0.0%) | 0 (0.0%) |
| 35 to 64 Years | 0 (0.0%) | 2 (3.4%) |
| 65 to 74 Years | 5 (22.7%) | 0 (0.0%) |
| 75 Years and over | 2 (50.0%) | 5 (38.5%) |
Technology Access in Jewett
Computing Device Access in Jewett
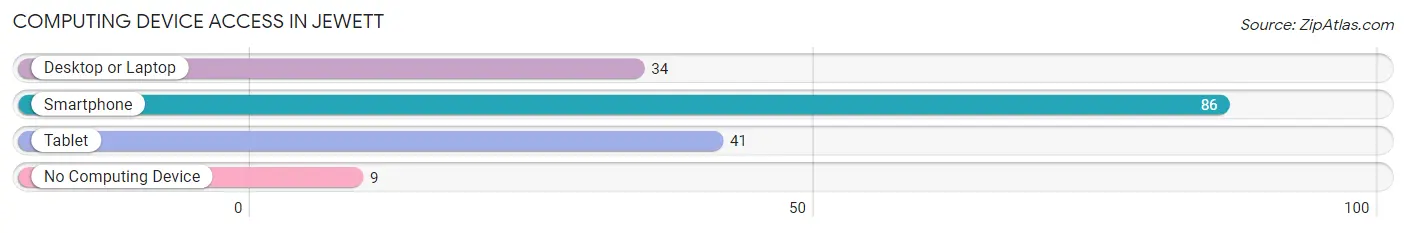
| Device Type | # Households | % Households |
| Desktop or Laptop | 34 | 34.0% |
| Smartphone | 86 | 86.0% |
| Tablet | 41 | 41.0% |
| No Computing Device | 9 | 9.0% |
| Total | 100 | 100.0% |
Internet Access in Jewett
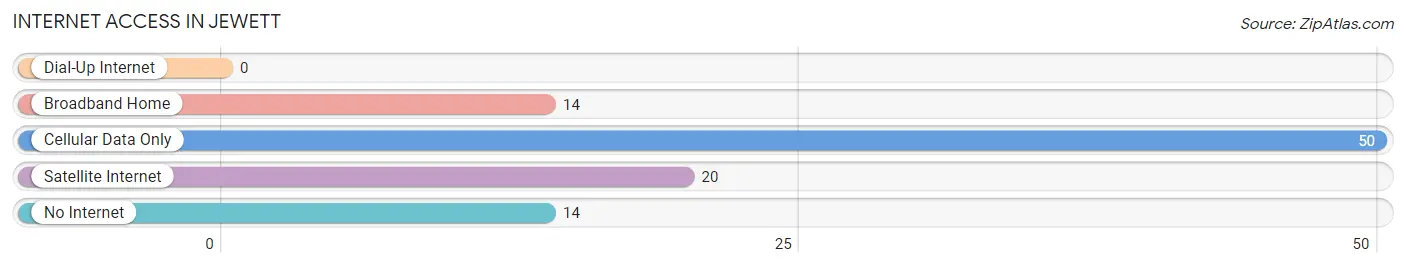
| Internet Type | # Households | % Households |
| Dial-Up Internet | 0 | 0.0% |
| Broadband Home | 14 | 14.0% |
| Cellular Data Only | 50 | 50.0% |
| Satellite Internet | 20 | 20.0% |
| No Internet | 14 | 14.0% |
| Total | 100 | 100.0% |
Jewett Summary
History
The small town of Jewett, Illinois is located in the southeastern corner of the state, in the county of Fayette. It is situated on the banks of the Embarras River, and is surrounded by the towns of Vandalia, Brownstown, and St. Elmo. The town was founded in 1858 by a group of settlers from Ohio, led by William Jewett. The town was named after him, and the first post office was established in 1859.
The town grew slowly, but steadily, and by the turn of the century, it had become a thriving agricultural community. The town was home to several businesses, including a general store, a blacksmith shop, a hotel, and a bank. The town also had a school, a church, and a cemetery.
In the early 1900s, the town began to experience a period of growth and prosperity. The railroad came to town in 1906, and the town was connected to the rest of the state by a network of roads. This allowed for the growth of the town’s businesses, and the population began to grow.
By the mid-1900s, the town had become a center for the production of coal and other minerals. The town was also home to several manufacturing plants, including a paper mill and a furniture factory. The town’s population continued to grow, and by the 1970s, it had reached its peak of 1,500 people.
Geography
Jewett is located in the southeastern corner of Illinois, in Fayette County. It is situated on the banks of the Embarras River, and is surrounded by the towns of Vandalia, Brownstown, and St. Elmo. The town is located in the Central Till Plains region of the state, and is characterized by rolling hills and flat plains. The town is located at an elevation of 690 feet above sea level.
The climate in Jewett is classified as humid continental, with hot summers and cold winters. The average temperature in the summer is around 80 degrees Fahrenheit, and the average temperature in the winter is around 30 degrees Fahrenheit. The town receives an average of 40 inches of precipitation per year, with most of it falling in the spring and summer months.
Economy
The economy of Jewett is largely based on agriculture and manufacturing. The town is home to several farms, which produce a variety of crops, including corn, soybeans, and wheat. The town is also home to several manufacturing plants, including a paper mill and a furniture factory.
The town is also home to several small businesses, including restaurants, retail stores, and service providers. The town is also home to a bank, a post office, and a library.
Demographics
As of the 2010 census, the population of Jewett was 1,093. The population is largely white, with a small percentage of African Americans and Hispanics. The median age of the population is 43.7 years, and the median household income is $41,250. The town has a poverty rate of 16.3%, and the unemployment rate is 5.2%.
Conclusion
Jewett, Illinois is a small town located in the southeastern corner of the state. It was founded in 1858 by a group of settlers from Ohio, and has since grown into a thriving agricultural and manufacturing community. The town is home to several businesses, including a general store, a blacksmith shop, a hotel, and a bank. The town is also home to several farms, which produce a variety of crops, and several manufacturing plants. The population of the town is largely white, with a small percentage of African Americans and Hispanics. The median age of the population is 43.7 years, and the median household income is $41,250. The town has a poverty rate of 16.3%, and the unemployment rate is 5.2%.
Common Questions
What is Per Capita Income in Jewett?
Per Capita income in Jewett is $22,042.
What is the Median Family Income in Jewett?
Median Family Income in Jewett is $60,625.
What is the Median Household income in Jewett?
Median Household Income in Jewett is $57,500.
What is Inequality or Gini Index in Jewett?
Inequality or Gini Index in Jewett is 0.33.
What is the Total Population of Jewett?
Total Population of Jewett is 261.
What is the Total Male Population of Jewett?
Total Male Population of Jewett is 117.
What is the Total Female Population of Jewett?
Total Female Population of Jewett is 144.
What is the Ratio of Males per 100 Females in Jewett?
There are 81.25 Males per 100 Females in Jewett.
What is the Ratio of Females per 100 Males in Jewett?
There are 123.08 Females per 100 Males in Jewett.
What is the Median Population Age in Jewett?
Median Population Age in Jewett is 48.2 Years.
What is the Average Family Size in Jewett
Average Family Size in Jewett is 2.7 People.
What is the Average Household Size in Jewett
Average Household Size in Jewett is 2.6 People.
How Large is the Labor Force in Jewett?
There are 111 People in the Labor Forcein in Jewett.
What is the Percentage of People in the Labor Force in Jewett?
53.9% of People are in the Labor Force in Jewett.
What is the Unemployment Rate in Jewett?
Unemployment Rate in Jewett is 6.3%.