Zip Codes with the Highest Percentage of Population Employed in Accommodation & Food Services in Mchenry, IL
RELATED REPORTS & OPTIONS
Accommodation & Food Services
Mchenry
Compare Zip Codes
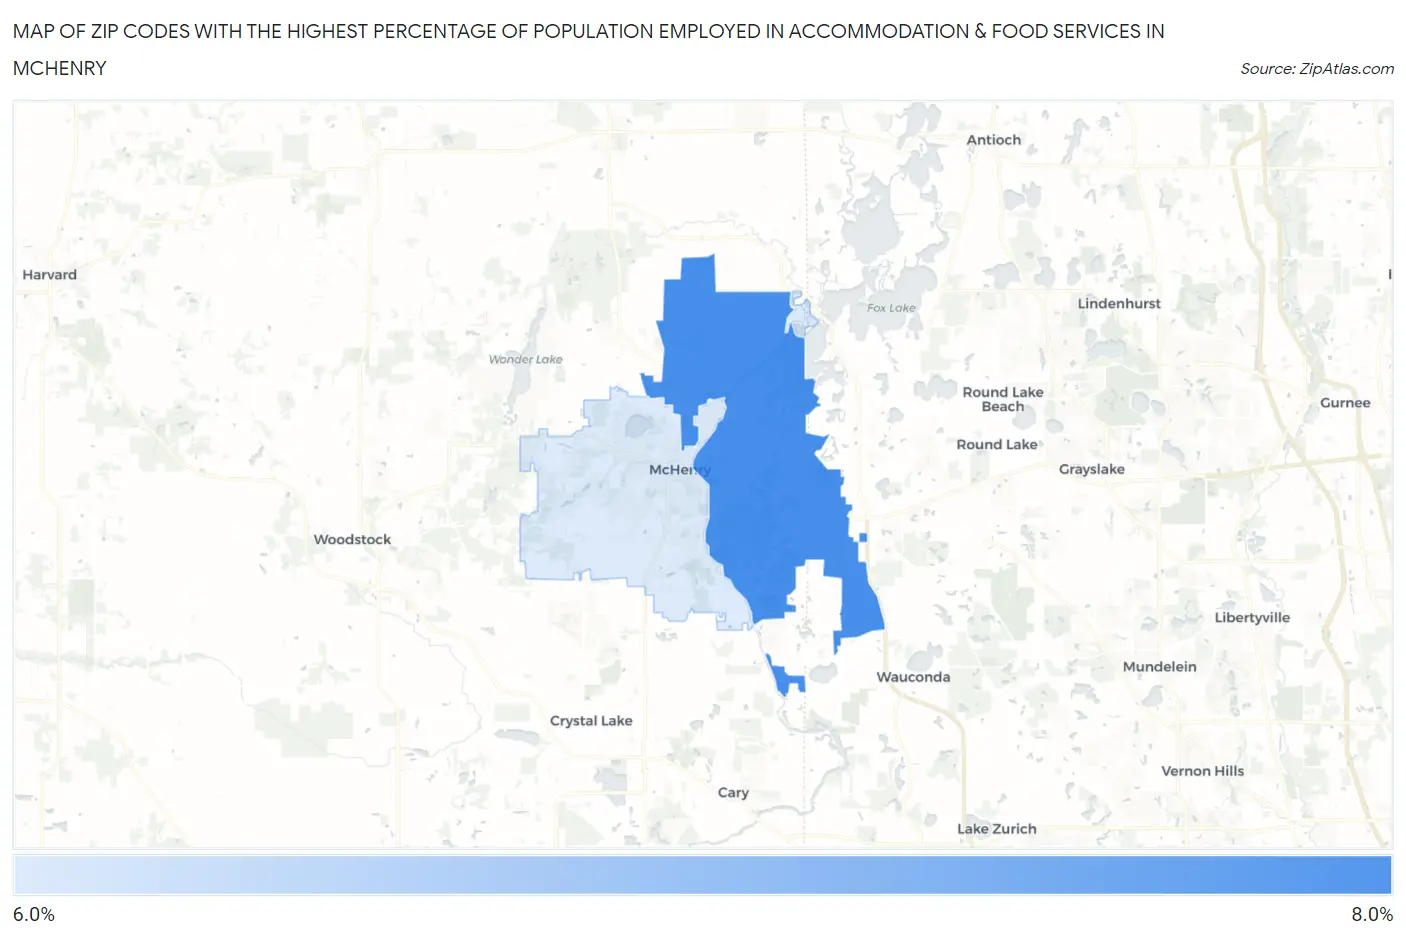
Map of Zip Codes with the Highest Percentage of Population Employed in Accommodation & Food Services in Mchenry
6.0%
6.2%
Zip Codes with the Highest Percentage of Population Employed in Accommodation & Food Services in Mchenry, IL
| Zip Code | % Employed | vs State | vs National | |
| 1. | 60051 | 6.2% | 6.5%(-0.261)#466 | 6.9%(-0.672)#12,764 |
| 2. | 60050 | 6.0% | 6.5%(-0.434)#495 | 6.9%(-0.845)#13,333 |
1
Common Questions
What are the Top Zip Codes with the Highest Percentage of Population Employed in Accommodation & Food Services in Mchenry, IL?
Top Zip Codes with the Highest Percentage of Population Employed in Accommodation & Food Services in Mchenry, IL are:
What zip code has the Highest Percentage of Population Employed in Accommodation & Food Services in Mchenry, IL?
60051 has the Highest Percentage of Population Employed in Accommodation & Food Services in Mchenry, IL with 6.2%.
What is the Percentage of Population Employed in Accommodation & Food Services in Mchenry, IL?
Percentage of Population Employed in Accommodation & Food Services in Mchenry is 6.8%.
What is the Percentage of Population Employed in Accommodation & Food Services in Illinois?
Percentage of Population Employed in Accommodation & Food Services in Illinois is 6.5%.
What is the Percentage of Population Employed in Accommodation & Food Services in the United States?
Percentage of Population Employed in Accommodation & Food Services in the United States is 6.9%.