Zip Codes with the Highest Percentage of Population Employed in Accommodation & Food Services in Plainfield, IL
RELATED REPORTS & OPTIONS
Accommodation & Food Services
Plainfield
Compare Zip Codes
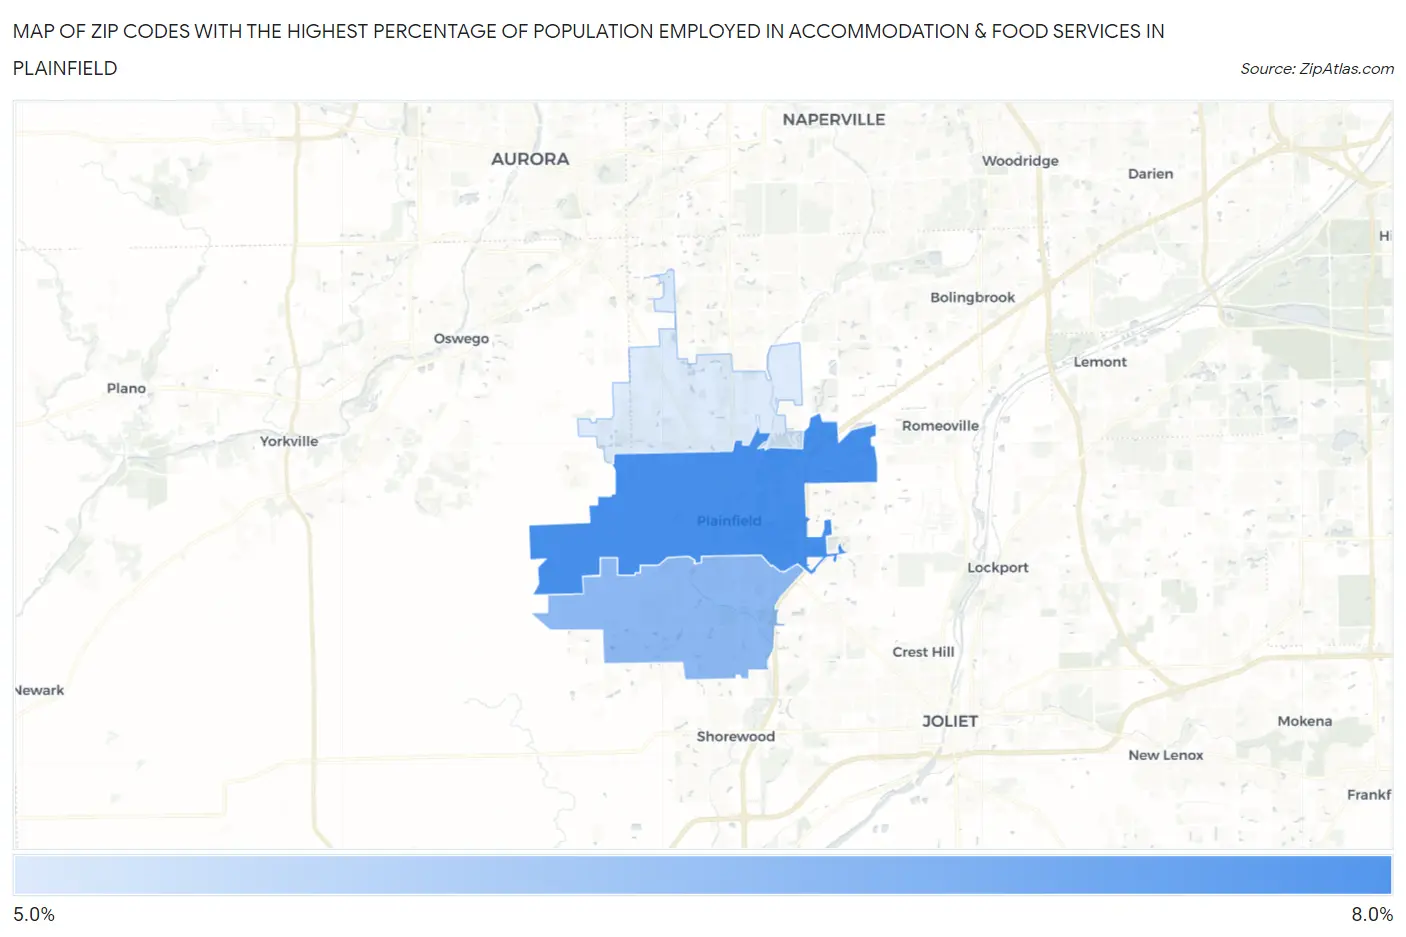
Map of Zip Codes with the Highest Percentage of Population Employed in Accommodation & Food Services in Plainfield
5.2%
6.8%
Zip Codes with the Highest Percentage of Population Employed in Accommodation & Food Services in Plainfield, IL
| Zip Code | % Employed | vs State | vs National | |
| 1. | 60544 | 6.8% | 6.5%(+0.298)#403 | 6.9%(-0.113)#10,989 |
| 2. | 60586 | 6.1% | 6.5%(-0.406)#493 | 6.9%(-0.818)#13,257 |
| 3. | 60585 | 5.2% | 6.5%(-1.24)#621 | 6.9%(-1.65)#15,996 |
1
Common Questions
What are the Top Zip Codes with the Highest Percentage of Population Employed in Accommodation & Food Services in Plainfield, IL?
Top Zip Codes with the Highest Percentage of Population Employed in Accommodation & Food Services in Plainfield, IL are:
What zip code has the Highest Percentage of Population Employed in Accommodation & Food Services in Plainfield, IL?
60544 has the Highest Percentage of Population Employed in Accommodation & Food Services in Plainfield, IL with 6.8%.
What is the Percentage of Population Employed in Accommodation & Food Services in Plainfield, IL?
Percentage of Population Employed in Accommodation & Food Services in Plainfield is 5.3%.
What is the Percentage of Population Employed in Accommodation & Food Services in Illinois?
Percentage of Population Employed in Accommodation & Food Services in Illinois is 6.5%.
What is the Percentage of Population Employed in Accommodation & Food Services in the United States?
Percentage of Population Employed in Accommodation & Food Services in the United States is 6.9%.