Zip Codes with the Highest Percentage of Population Employed in Accommodation & Food Services in Carbondale, IL
RELATED REPORTS & OPTIONS
Accommodation & Food Services
Carbondale
Compare Zip Codes
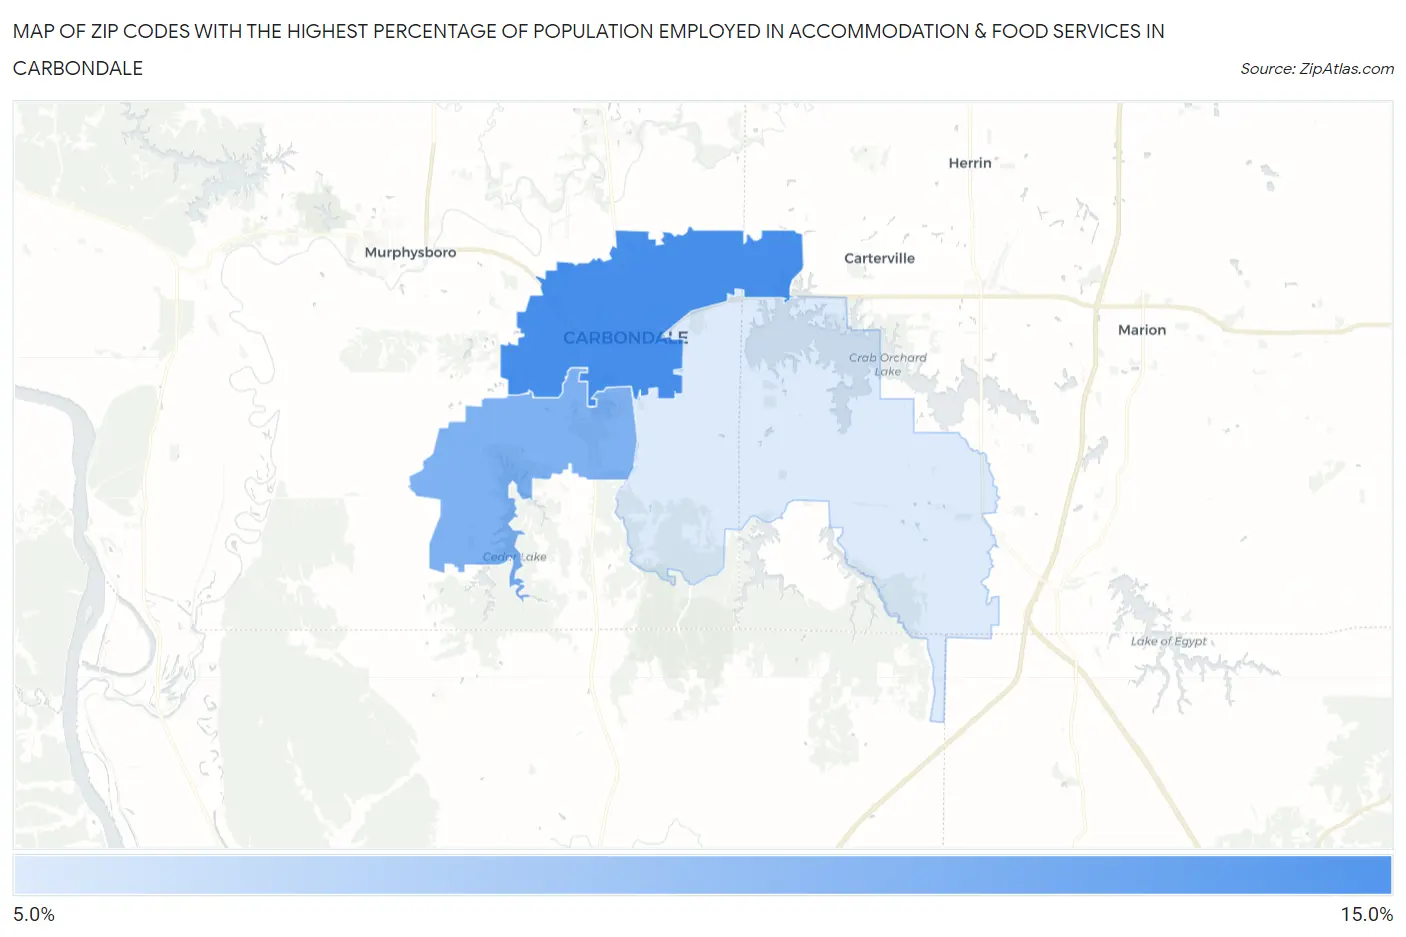
Map of Zip Codes with the Highest Percentage of Population Employed in Accommodation & Food Services in Carbondale
6.1%
13.5%
Zip Codes with the Highest Percentage of Population Employed in Accommodation & Food Services in Carbondale, IL
| Zip Code | % Employed | vs State | vs National | |
| 1. | 62901 | 13.5% | 6.5%(+7.01)#56 | 6.9%(+6.59)#2,149 |
| 2. | 62903 | 10.8% | 6.5%(+4.29)#103 | 6.9%(+3.88)#3,751 |
| 3. | 62902 | 6.1% | 6.5%(-0.327)#479 | 6.9%(-0.738)#12,990 |
1
Common Questions
What are the Top Zip Codes with the Highest Percentage of Population Employed in Accommodation & Food Services in Carbondale, IL?
Top Zip Codes with the Highest Percentage of Population Employed in Accommodation & Food Services in Carbondale, IL are:
What zip code has the Highest Percentage of Population Employed in Accommodation & Food Services in Carbondale, IL?
62901 has the Highest Percentage of Population Employed in Accommodation & Food Services in Carbondale, IL with 13.5%.
What is the Percentage of Population Employed in Accommodation & Food Services in Carbondale, IL?
Percentage of Population Employed in Accommodation & Food Services in Carbondale is 14.3%.
What is the Percentage of Population Employed in Accommodation & Food Services in Illinois?
Percentage of Population Employed in Accommodation & Food Services in Illinois is 6.5%.
What is the Percentage of Population Employed in Accommodation & Food Services in the United States?
Percentage of Population Employed in Accommodation & Food Services in the United States is 6.9%.