Zip Codes with the Highest Percentage of Population Employed in Accommodation & Food Services in Saint Charles, IL
RELATED REPORTS & OPTIONS
Accommodation & Food Services
Saint Charles
Compare Zip Codes
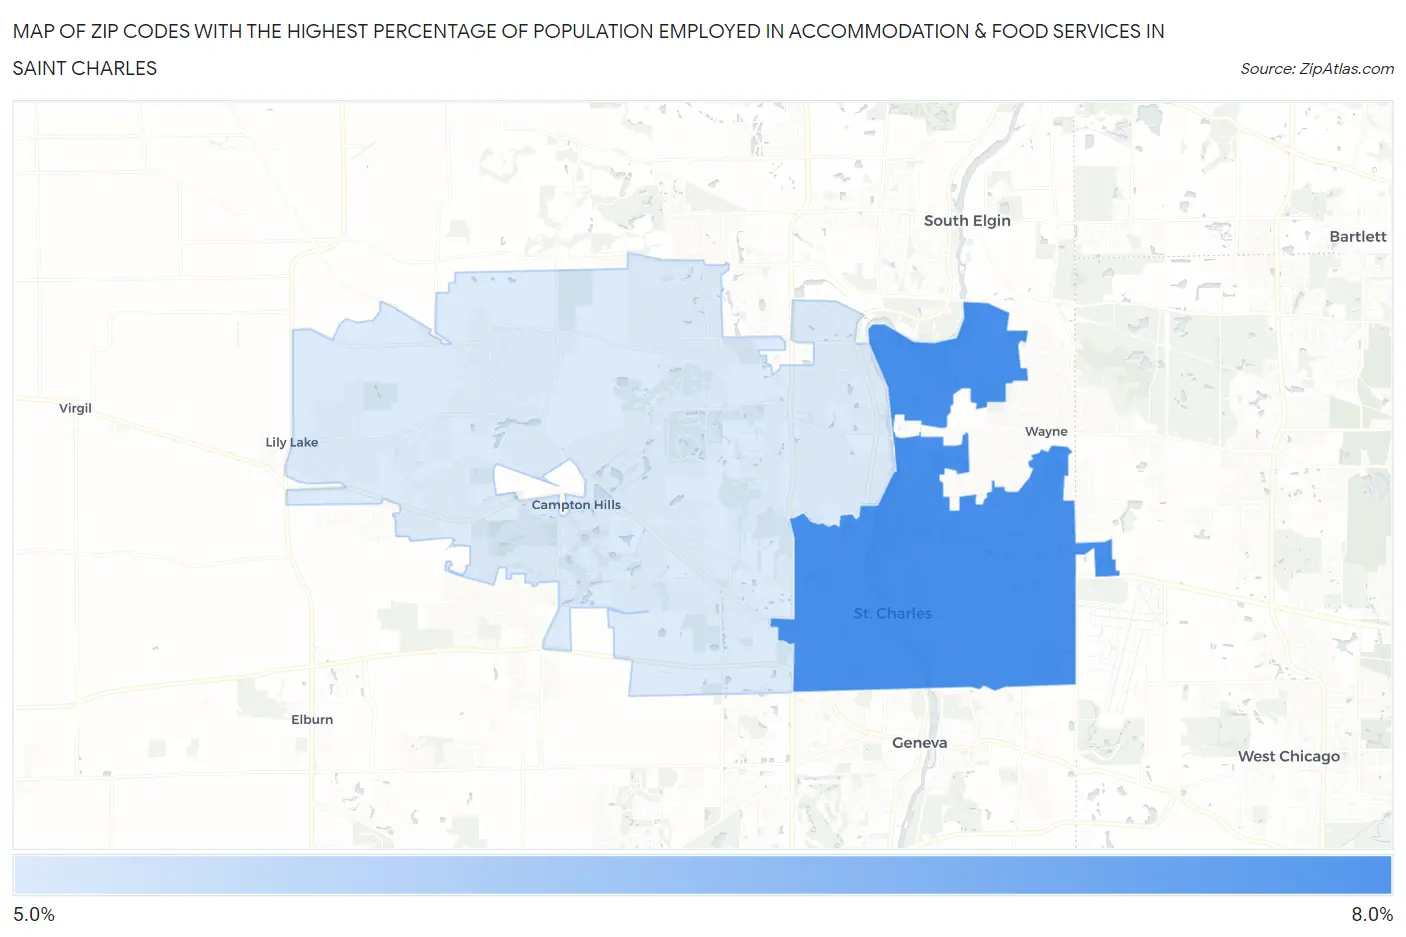
Map of Zip Codes with the Highest Percentage of Population Employed in Accommodation & Food Services in Saint Charles
5.2%
7.1%
Zip Codes with the Highest Percentage of Population Employed in Accommodation & Food Services in Saint Charles, IL
| Zip Code | % Employed | vs State | vs National | |
| 1. | 60174 | 7.1% | 6.5%(+0.654)#363 | 6.9%(+0.243)#9,997 |
| 2. | 60175 | 5.2% | 6.5%(-1.27)#626 | 6.9%(-1.68)#16,124 |
1
Common Questions
What are the Top Zip Codes with the Highest Percentage of Population Employed in Accommodation & Food Services in Saint Charles, IL?
Top Zip Codes with the Highest Percentage of Population Employed in Accommodation & Food Services in Saint Charles, IL are:
What zip code has the Highest Percentage of Population Employed in Accommodation & Food Services in Saint Charles, IL?
60174 has the Highest Percentage of Population Employed in Accommodation & Food Services in Saint Charles, IL with 7.1%.
What is the Percentage of Population Employed in Accommodation & Food Services in Illinois?
Percentage of Population Employed in Accommodation & Food Services in Illinois is 6.5%.
What is the Percentage of Population Employed in Accommodation & Food Services in the United States?
Percentage of Population Employed in Accommodation & Food Services in the United States is 6.9%.