Zip Codes with the Highest Percentage of Population Employed in Accommodation & Food Services in Champaign, IL
RELATED REPORTS & OPTIONS
Accommodation & Food Services
Champaign
Compare Zip Codes
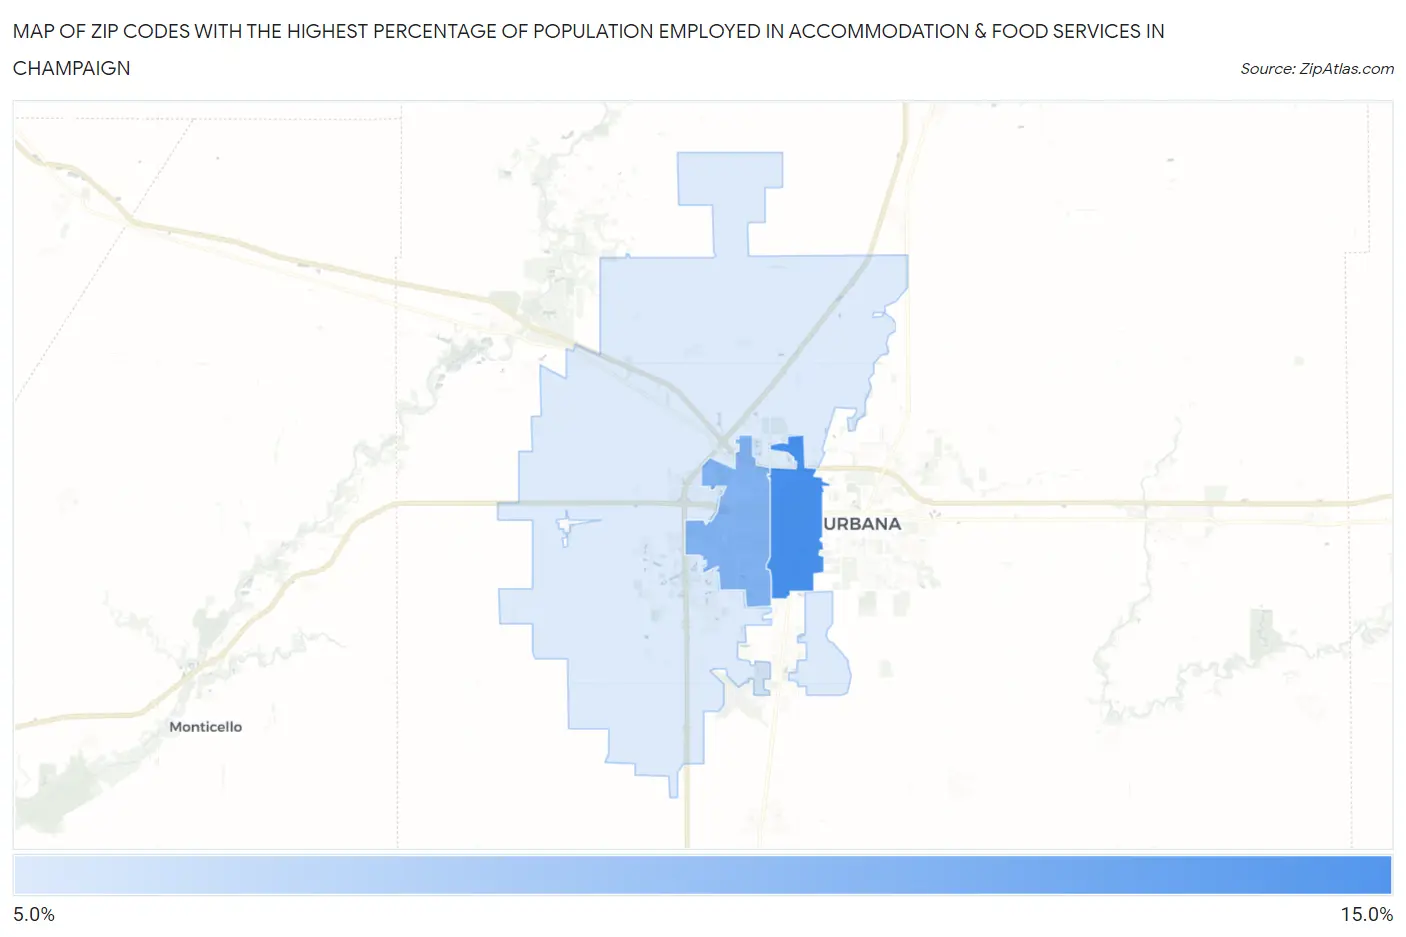
Map of Zip Codes with the Highest Percentage of Population Employed in Accommodation & Food Services in Champaign
5.6%
11.7%
Zip Codes with the Highest Percentage of Population Employed in Accommodation & Food Services in Champaign, IL
| Zip Code | % Employed | vs State | vs National | |
| 1. | 61820 | 11.7% | 6.5%(+5.26)#80 | 6.9%(+4.85)#3,001 |
| 2. | 61821 | 9.4% | 6.5%(+2.89)#161 | 6.9%(+2.48)#5,412 |
| 3. | 61822 | 5.6% | 6.5%(-0.860)#559 | 6.9%(-1.27)#14,670 |
1
Common Questions
What are the Top Zip Codes with the Highest Percentage of Population Employed in Accommodation & Food Services in Champaign, IL?
Top Zip Codes with the Highest Percentage of Population Employed in Accommodation & Food Services in Champaign, IL are:
What zip code has the Highest Percentage of Population Employed in Accommodation & Food Services in Champaign, IL?
61820 has the Highest Percentage of Population Employed in Accommodation & Food Services in Champaign, IL with 11.7%.
What is the Percentage of Population Employed in Accommodation & Food Services in Champaign, IL?
Percentage of Population Employed in Accommodation & Food Services in Champaign is 9.8%.
What is the Percentage of Population Employed in Accommodation & Food Services in Illinois?
Percentage of Population Employed in Accommodation & Food Services in Illinois is 6.5%.
What is the Percentage of Population Employed in Accommodation & Food Services in the United States?
Percentage of Population Employed in Accommodation & Food Services in the United States is 6.9%.