Shelton, CT Map & Demographics
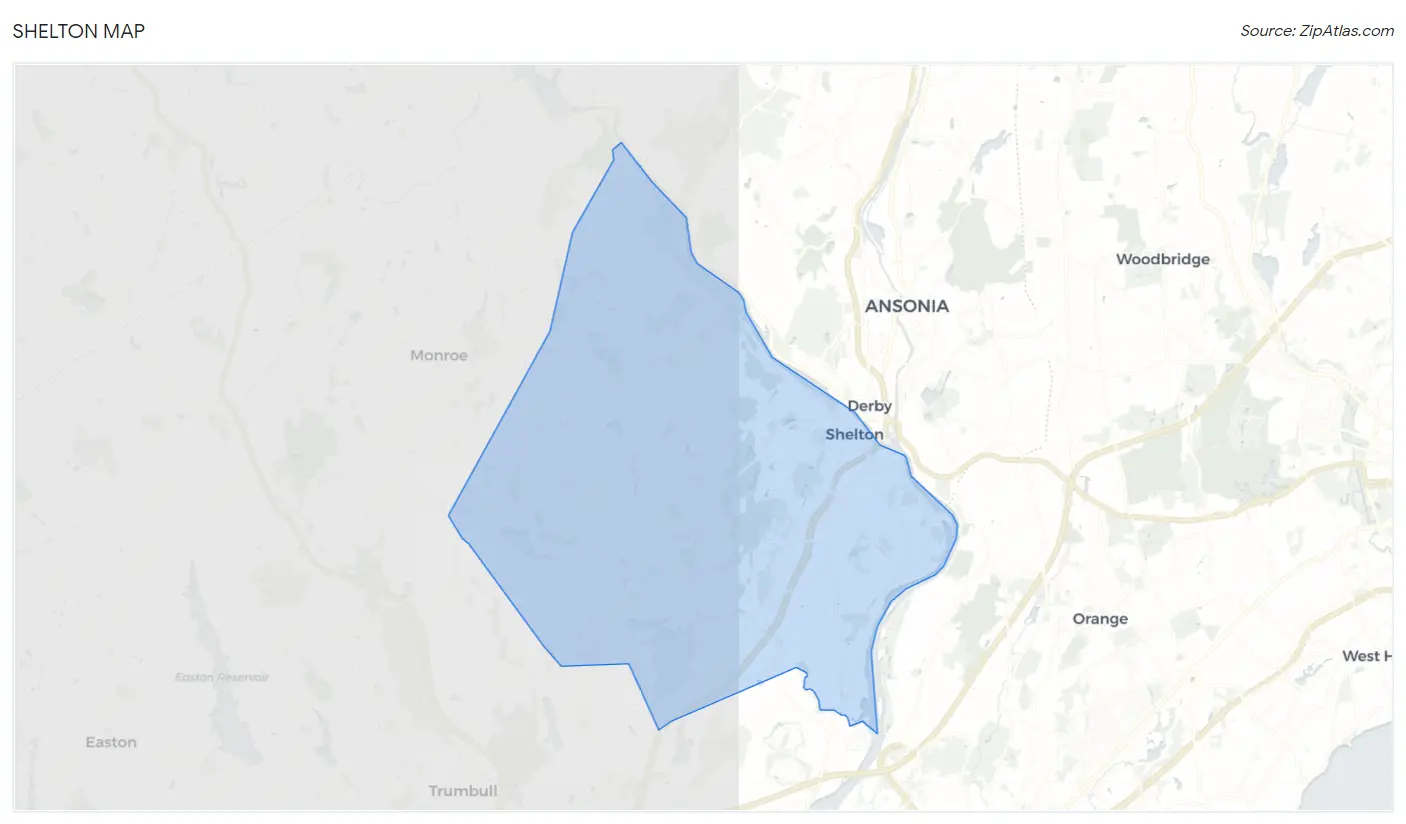
Shelton Map
Shelton Overview
$54,444
PER CAPITA INCOME
$128,756
AVG FAMILY INCOME
$112,366
AVG HOUSEHOLD INCOME
21.6%
WAGE / INCOME GAP [ % ]
78.4¢/ $1
WAGE / INCOME GAP [ $ ]
0.43
INEQUALITY / GINI INDEX
41,206
TOTAL POPULATION
19,585
MALE POPULATION
21,621
FEMALE POPULATION
90.58
MALES / 100 FEMALES
110.40
FEMALES / 100 MALES
44.6
MEDIAN AGE
3.1
AVG FAMILY SIZE
2.6
AVG HOUSEHOLD SIZE
22,965
LABOR FORCE [ PEOPLE ]
66.3%
PERCENT IN LABOR FORCE
5.5%
UNEMPLOYMENT RATE
Shelton Zip Codes
Income in Shelton
Income Overview in Shelton
Per Capita Income in Shelton is $54,444, while median incomes of families and households are $128,756 and $112,366 respectively.
| Characteristic | Number | Measure |
| Per Capita Income | 41,206 | $54,444 |
| Median Family Income | 11,077 | $128,756 |
| Mean Family Income | 11,077 | $165,819 |
| Median Household Income | 15,774 | $112,366 |
| Mean Household Income | 15,774 | $140,301 |
| Income Deficit | 11,077 | $0 |
| Wage / Income Gap (%) | 41,206 | 21.59% |
| Wage / Income Gap ($) | 41,206 | 78.41¢ per $1 |
| Gini / Inequality Index | 41,206 | 0.43 |
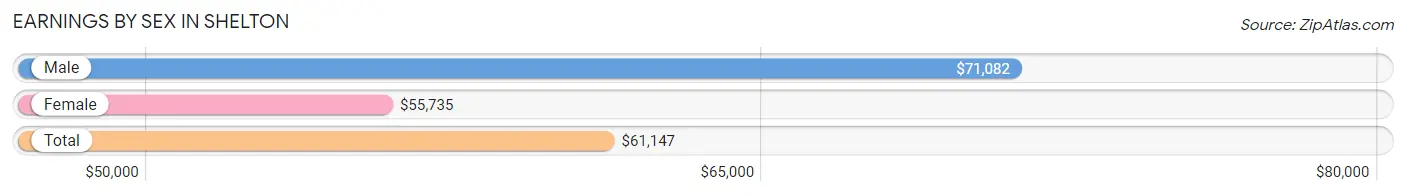
Earnings by Sex in Shelton
Average Earnings in Shelton are $61,147, $71,082 for men and $55,735 for women, a difference of 21.6%.
| Sex | Number | Average Earnings |
| Male | 11,986 (51.0%) | $71,082 |
| Female | 11,497 (49.0%) | $55,735 |
| Total | 23,483 (100.0%) | $61,147 |
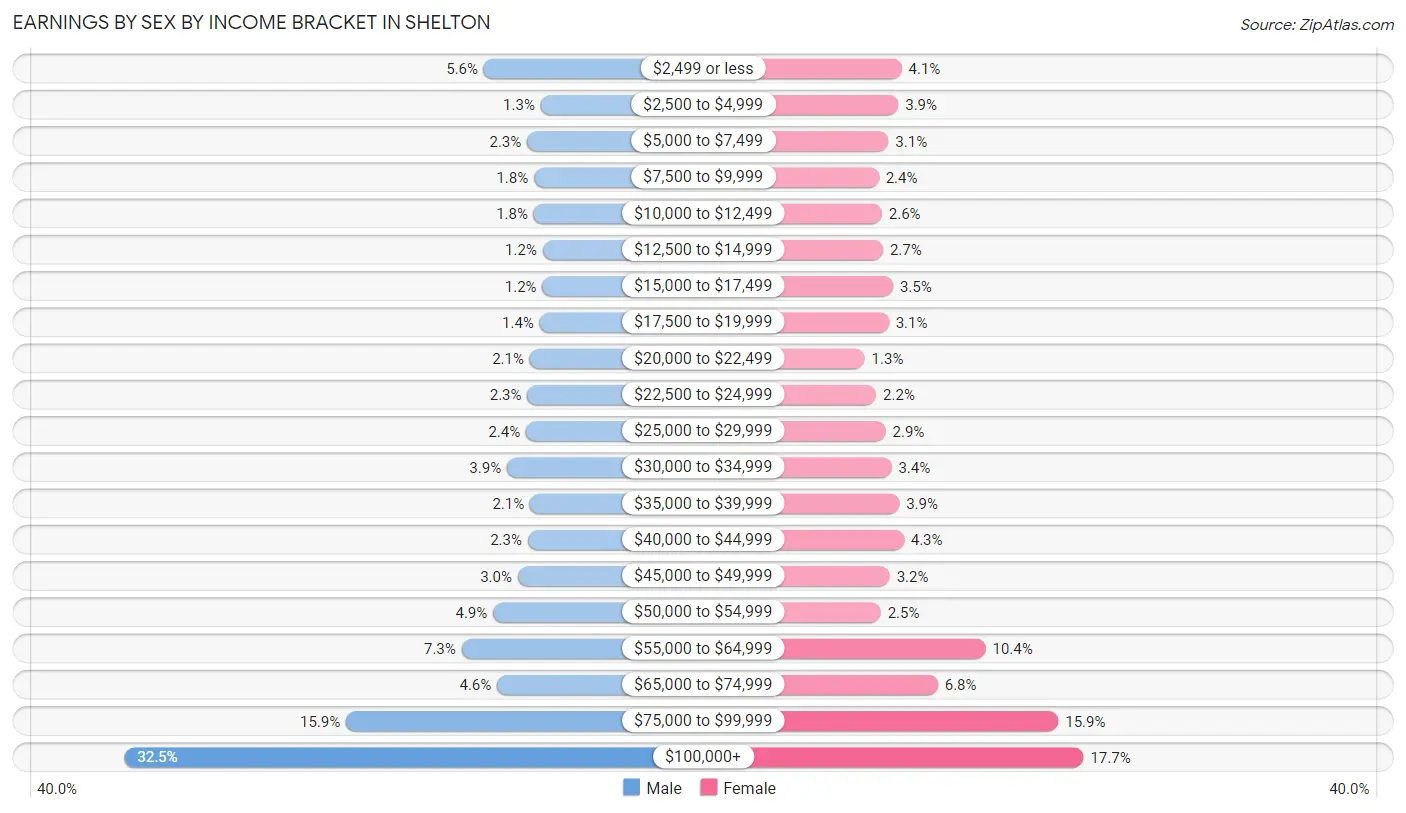
Earnings by Sex by Income Bracket in Shelton
The most common earnings brackets in Shelton are $100,000+ for men (3,898 | 32.5%) and $100,000+ for women (2,040 | 17.7%).
| Income | Male | Female |
| $2,499 or less | 669 (5.6%) | 473 (4.1%) |
| $2,500 to $4,999 | 158 (1.3%) | 444 (3.9%) |
| $5,000 to $7,499 | 281 (2.3%) | 359 (3.1%) |
| $7,500 to $9,999 | 218 (1.8%) | 275 (2.4%) |
| $10,000 to $12,499 | 220 (1.8%) | 302 (2.6%) |
| $12,500 to $14,999 | 140 (1.2%) | 312 (2.7%) |
| $15,000 to $17,499 | 143 (1.2%) | 398 (3.5%) |
| $17,500 to $19,999 | 168 (1.4%) | 361 (3.1%) |
| $20,000 to $22,499 | 256 (2.1%) | 154 (1.3%) |
| $22,500 to $24,999 | 278 (2.3%) | 253 (2.2%) |
| $25,000 to $29,999 | 290 (2.4%) | 334 (2.9%) |
| $30,000 to $34,999 | 462 (3.8%) | 385 (3.4%) |
| $35,000 to $39,999 | 254 (2.1%) | 452 (3.9%) |
| $40,000 to $44,999 | 275 (2.3%) | 491 (4.3%) |
| $45,000 to $49,999 | 364 (3.0%) | 370 (3.2%) |
| $50,000 to $54,999 | 586 (4.9%) | 292 (2.5%) |
| $55,000 to $64,999 | 869 (7.2%) | 1,196 (10.4%) |
| $65,000 to $74,999 | 550 (4.6%) | 784 (6.8%) |
| $75,000 to $99,999 | 1,907 (15.9%) | 1,822 (15.9%) |
| $100,000+ | 3,898 (32.5%) | 2,040 (17.7%) |
| Total | 11,986 (100.0%) | 11,497 (100.0%) |
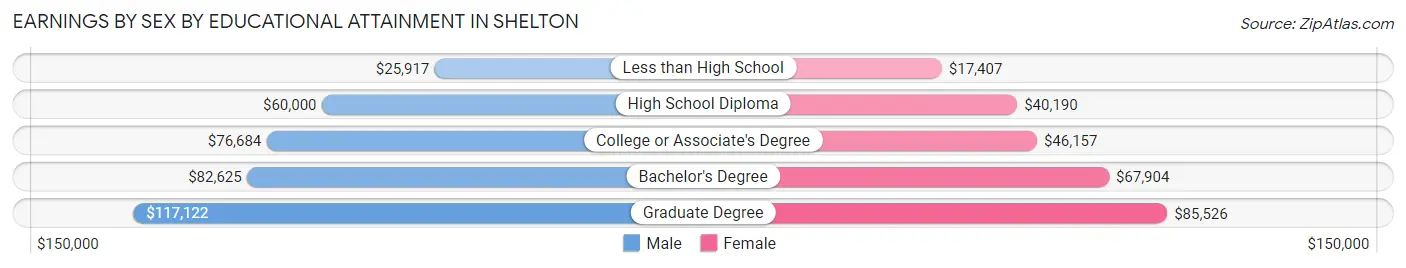
Earnings by Sex by Educational Attainment in Shelton
Average earnings in Shelton are $78,832 for men and $61,104 for women, a difference of 22.5%. Men with an educational attainment of graduate degree enjoy the highest average annual earnings of $117,122, while those with less than high school education earn the least with $25,917. Women with an educational attainment of graduate degree earn the most with the average annual earnings of $85,526, while those with less than high school education have the smallest earnings of $17,407.
| Educational Attainment | Male Income | Female Income |
| Less than High School | $25,917 | $17,407 |
| High School Diploma | $60,000 | $40,190 |
| College or Associate's Degree | $76,684 | $46,157 |
| Bachelor's Degree | $82,625 | $67,904 |
| Graduate Degree | $117,122 | $85,526 |
| Total | $78,832 | $61,104 |
Family Income in Shelton
Family Income Brackets in Shelton
According to the Shelton family income data, there are 3,124 families falling into the $200,000+ income range, which is the most common income bracket and makes up 28.2% of all families. Conversely, the $10,000 to $14,999 income bracket is the least frequent group with only 111 families (1.0%) belonging to this category.
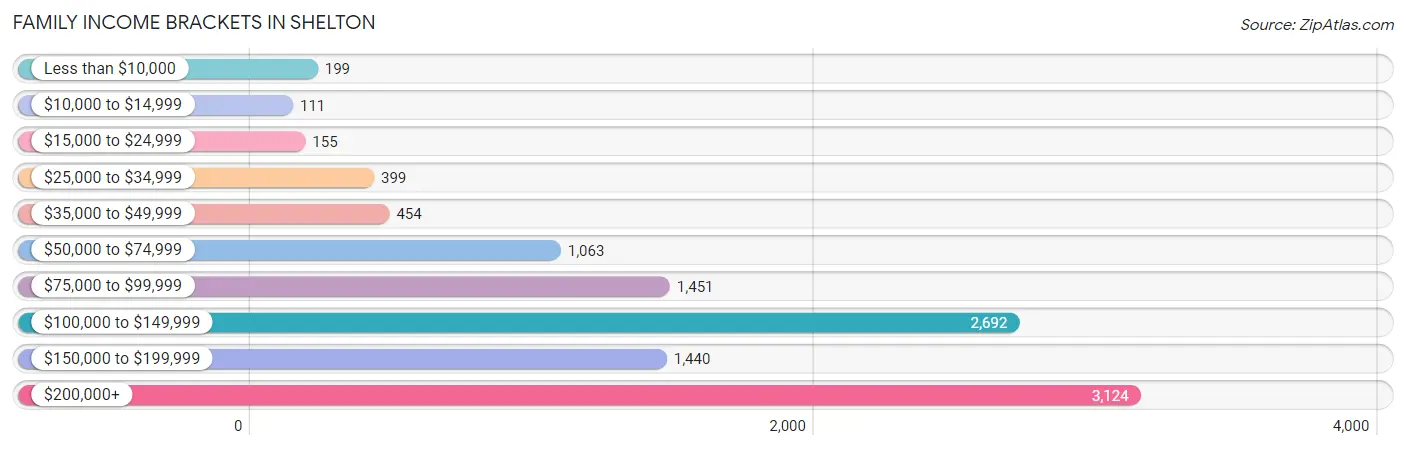
| Income Bracket | # Families | % Families |
| Less than $10,000 | 199 | 1.8% |
| $10,000 to $14,999 | 111 | 1.0% |
| $15,000 to $24,999 | 155 | 1.4% |
| $25,000 to $34,999 | 399 | 3.6% |
| $35,000 to $49,999 | 454 | 4.1% |
| $50,000 to $74,999 | 1,063 | 9.6% |
| $75,000 to $99,999 | 1,451 | 13.1% |
| $100,000 to $149,999 | 2,692 | 24.3% |
| $150,000 to $199,999 | 1,440 | 13.0% |
| $200,000+ | 3,124 | 28.2% |
Family Income by Famaliy Size in Shelton
7+ person families (183 | 1.7%) account for the highest median family income in Shelton with $217,750 per family, while 2-person families (4,961 | 44.8%) have the highest median income of $55,920 per family member.
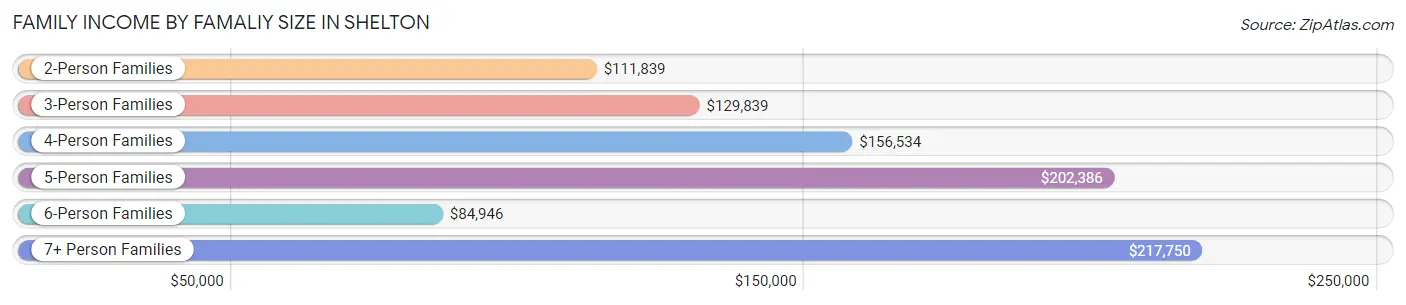
| Income Bracket | # Families | Median Income |
| 2-Person Families | 4,961 (44.8%) | $111,839 |
| 3-Person Families | 2,907 (26.2%) | $129,839 |
| 4-Person Families | 2,328 (21.0%) | $156,534 |
| 5-Person Families | 653 (5.9%) | $202,386 |
| 6-Person Families | 45 (0.4%) | $84,946 |
| 7+ Person Families | 183 (1.7%) | $217,750 |
| Total | 11,077 (100.0%) | $128,756 |
Family Income by Number of Earners in Shelton
The median family income in Shelton is $128,756, with families comprising 3+ earners (1,741) having the highest median family income of $194,714, while families with no earners (1,419) have the lowest median family income of $70,023, accounting for 15.7% and 12.8% of families, respectively.
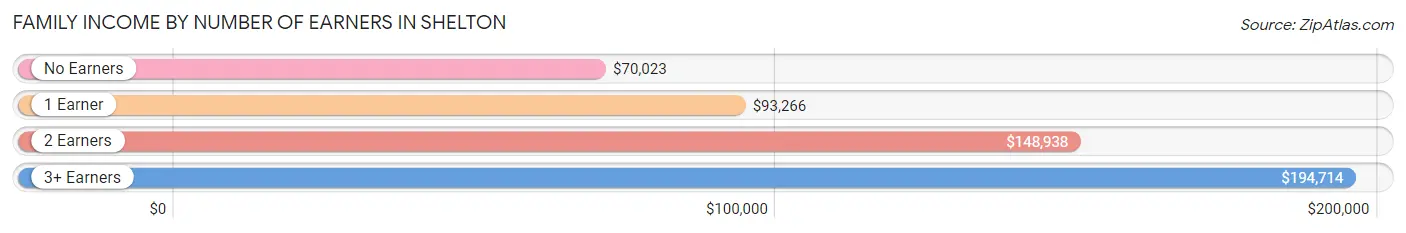
| Number of Earners | # Families | Median Income |
| No Earners | 1,419 (12.8%) | $70,023 |
| 1 Earner | 2,757 (24.9%) | $93,266 |
| 2 Earners | 5,160 (46.6%) | $148,938 |
| 3+ Earners | 1,741 (15.7%) | $194,714 |
| Total | 11,077 (100.0%) | $128,756 |
Household Income in Shelton
Household Income Brackets in Shelton
With 3,754 households falling in the category, the $100,000 to $149,999 income range is the most frequent in Shelton, accounting for 23.8% of all households. In contrast, only 379 households (2.4%) fall into the $10,000 to $14,999 income bracket, making it the least populous group.
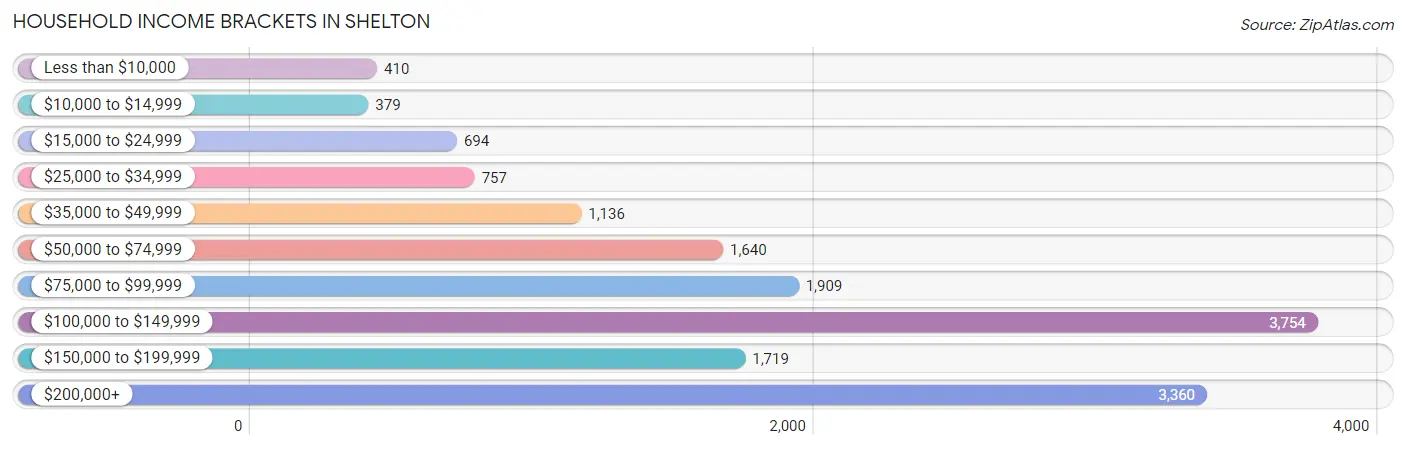
| Income Bracket | # Households | % Households |
| Less than $10,000 | 410 | 2.6% |
| $10,000 to $14,999 | 379 | 2.4% |
| $15,000 to $24,999 | 694 | 4.4% |
| $25,000 to $34,999 | 757 | 4.8% |
| $35,000 to $49,999 | 1,136 | 7.2% |
| $50,000 to $74,999 | 1,640 | 10.4% |
| $75,000 to $99,999 | 1,909 | 12.1% |
| $100,000 to $149,999 | 3,754 | 23.8% |
| $150,000 to $199,999 | 1,719 | 10.9% |
| $200,000+ | 3,360 | 21.3% |
Household Income by Householder Age in Shelton
The median household income in Shelton is $112,366, with the highest median household income of $127,801 found in the 25 to 44 years age bracket for the primary householder. A total of 4,180 households (26.5%) fall into this category. Meanwhile, the 65+ years age bracket for the primary householder has the lowest median household income of $75,579, with 4,729 households (30.0%) in this group.
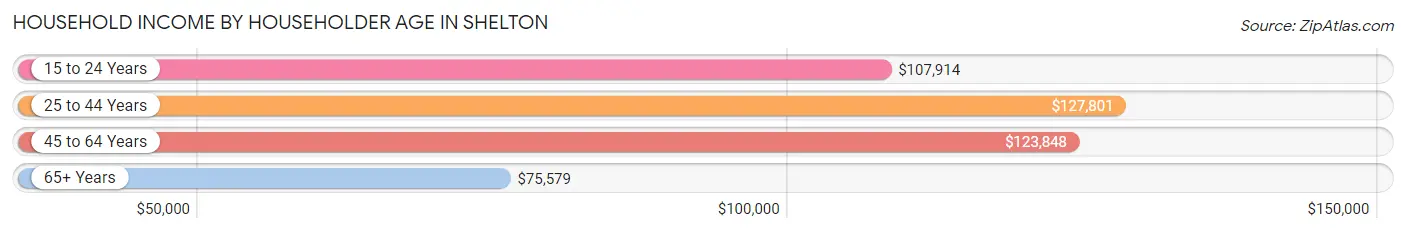
| Income Bracket | # Households | Median Income |
| 15 to 24 Years | 286 (1.8%) | $107,914 |
| 25 to 44 Years | 4,180 (26.5%) | $127,801 |
| 45 to 64 Years | 6,579 (41.7%) | $123,848 |
| 65+ Years | 4,729 (30.0%) | $75,579 |
| Total | 15,774 (100.0%) | $112,366 |
Poverty in Shelton
Income Below Poverty by Sex and Age in Shelton
With 4.5% poverty level for males and 6.5% for females among the residents of Shelton, 15 year old males and 16 and 17 year old females are the most vulnerable to poverty, with 63 males (39.1%) and 97 females (24.1%) in their respective age groups living below the poverty level.
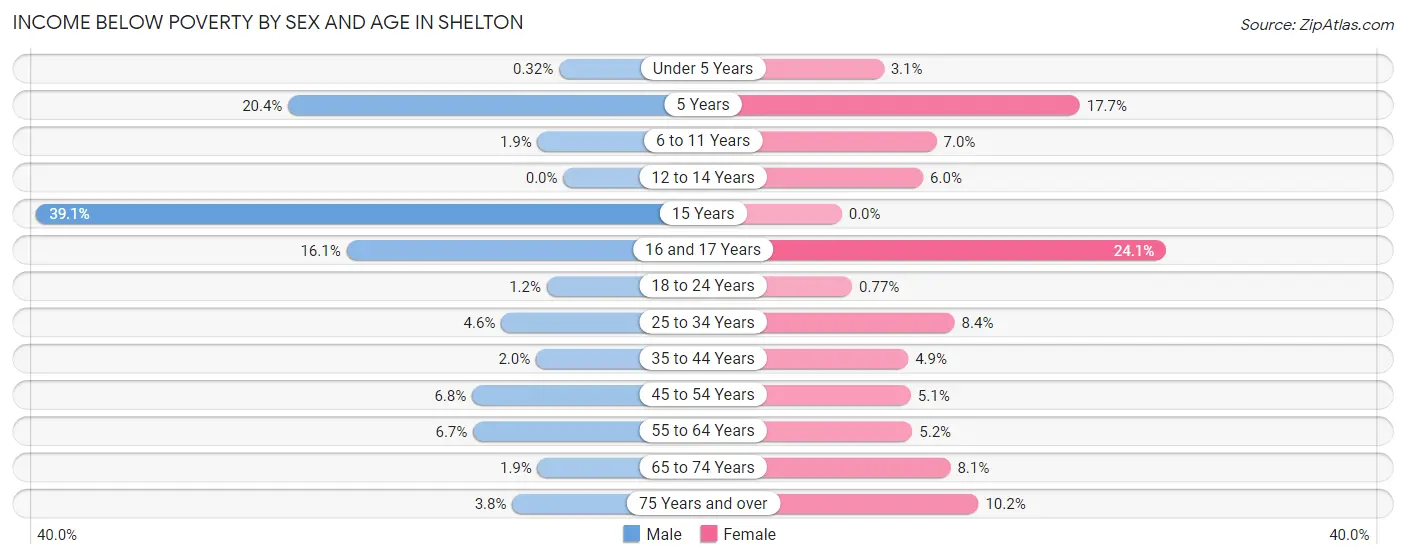
| Age Bracket | Male | Female |
| Under 5 Years | 4 (0.3%) | 44 (3.1%) |
| 5 Years | 19 (20.4%) | 50 (17.7%) |
| 6 to 11 Years | 18 (1.9%) | 80 (7.0%) |
| 12 to 14 Years | 0 (0.0%) | 34 (6.0%) |
| 15 Years | 63 (39.1%) | 0 (0.0%) |
| 16 and 17 Years | 81 (16.1%) | 97 (24.1%) |
| 18 to 24 Years | 15 (1.2%) | 12 (0.8%) |
| 25 to 34 Years | 125 (4.6%) | 206 (8.4%) |
| 35 to 44 Years | 53 (2.0%) | 135 (4.9%) |
| 45 to 54 Years | 184 (6.8%) | 134 (5.1%) |
| 55 to 64 Years | 215 (6.7%) | 189 (5.2%) |
| 65 to 74 Years | 36 (1.9%) | 180 (8.1%) |
| 75 Years and over | 59 (3.8%) | 222 (10.2%) |
| Total | 872 (4.5%) | 1,383 (6.5%) |
Income Above Poverty by Sex and Age in Shelton
According to the poverty statistics in Shelton, males aged 12 to 14 years and females aged 15 years are the age groups that are most secure financially, with 100.0% of males and 100.0% of females in these age groups living above the poverty line.
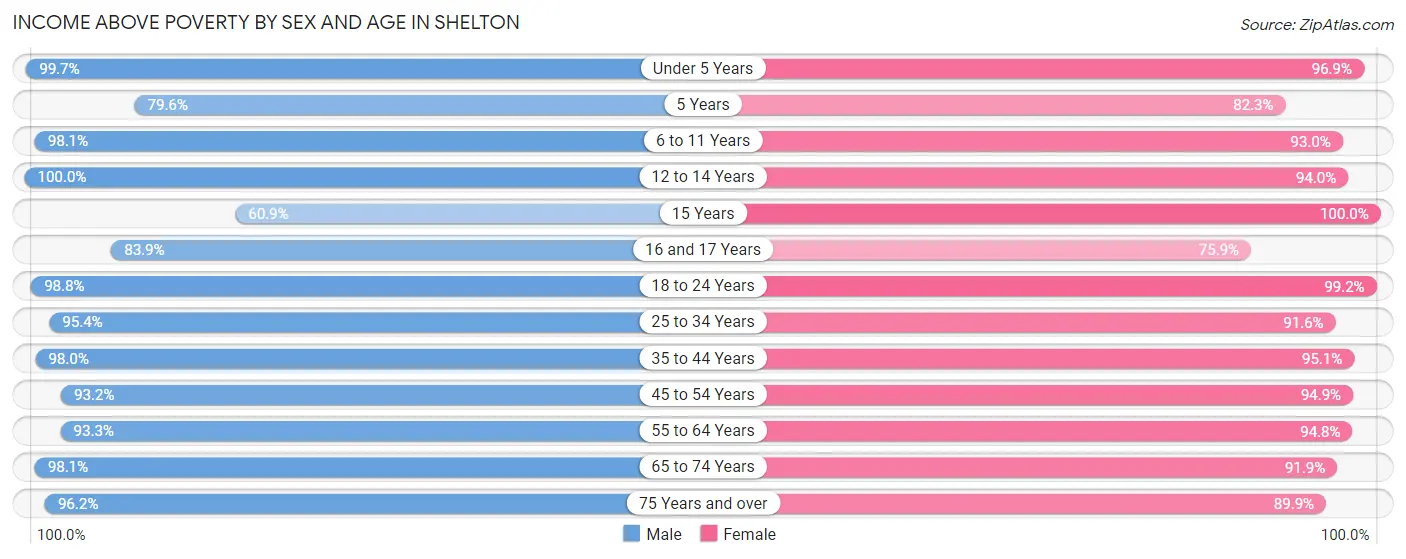
| Age Bracket | Male | Female |
| Under 5 Years | 1,239 (99.7%) | 1,371 (96.9%) |
| 5 Years | 74 (79.6%) | 233 (82.3%) |
| 6 to 11 Years | 926 (98.1%) | 1,057 (93.0%) |
| 12 to 14 Years | 572 (100.0%) | 529 (94.0%) |
| 15 Years | 98 (60.9%) | 155 (100.0%) |
| 16 and 17 Years | 422 (83.9%) | 306 (75.9%) |
| 18 to 24 Years | 1,201 (98.8%) | 1,546 (99.2%) |
| 25 to 34 Years | 2,586 (95.4%) | 2,252 (91.6%) |
| 35 to 44 Years | 2,560 (98.0%) | 2,604 (95.1%) |
| 45 to 54 Years | 2,531 (93.2%) | 2,479 (94.9%) |
| 55 to 64 Years | 2,996 (93.3%) | 3,421 (94.8%) |
| 65 to 74 Years | 1,852 (98.1%) | 2,051 (91.9%) |
| 75 Years and over | 1,496 (96.2%) | 1,966 (89.8%) |
| Total | 18,553 (95.5%) | 19,970 (93.5%) |
Income Below Poverty Among Married-Couple Families in Shelton
The poverty statistics for married-couple families in Shelton show that 1.7% or 151 of the total 8,972 families live below the poverty line. Families with no children have the highest poverty rate of 1.9%, comprising of 109 families. On the other hand, families with 3 or 4 children have the lowest poverty rate of 0.0%, which includes 0 families.
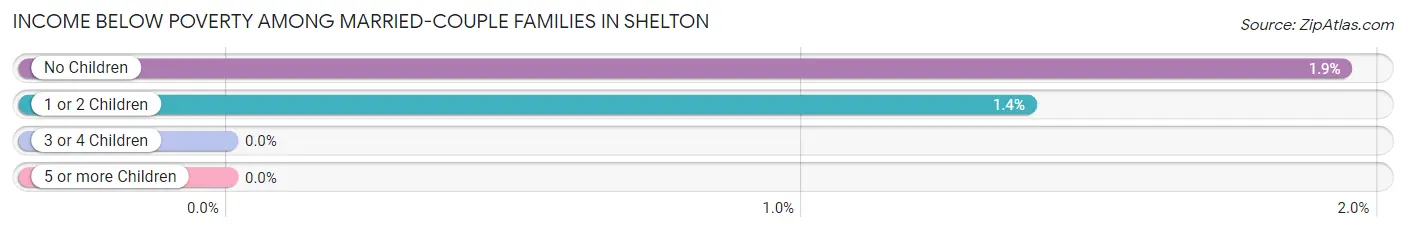
| Children | Above Poverty | Below Poverty |
| No Children | 5,521 (98.1%) | 109 (1.9%) |
| 1 or 2 Children | 2,970 (98.6%) | 42 (1.4%) |
| 3 or 4 Children | 318 (100.0%) | 0 (0.0%) |
| 5 or more Children | 12 (100.0%) | 0 (0.0%) |
| Total | 8,821 (98.3%) | 151 (1.7%) |
Income Below Poverty Among Single-Parent Households in Shelton
According to the poverty data in Shelton, 2.2% or 13 single-father households and 15.1% or 227 single-mother households are living below the poverty line. Among single-father households, those with no children have the highest poverty rate, with 13 households (3.5%) experiencing poverty. Likewise, among single-mother households, those with 3 or 4 children have the highest poverty rate, with 38 households (61.3%) falling below the poverty line.
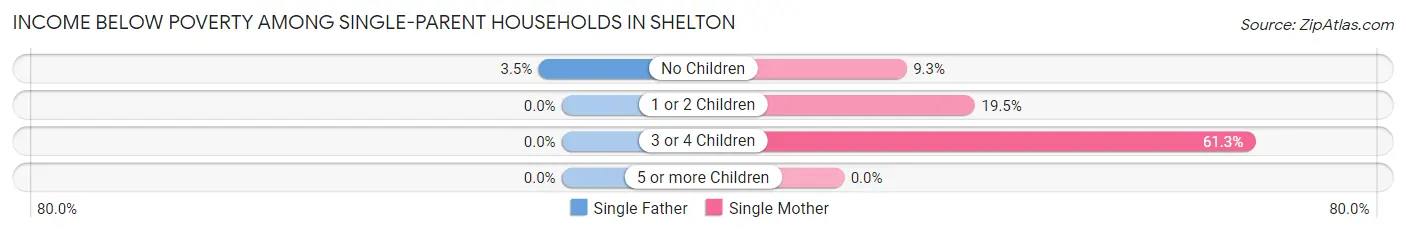
| Children | Single Father | Single Mother |
| No Children | 13 (3.5%) | 85 (9.3%) |
| 1 or 2 Children | 0 (0.0%) | 104 (19.5%) |
| 3 or 4 Children | 0 (0.0%) | 38 (61.3%) |
| 5 or more Children | 0 (0.0%) | 0 (0.0%) |
| Total | 13 (2.2%) | 227 (15.1%) |
Income Below Poverty Among Married-Couple vs Single-Parent Households in Shelton
The poverty data for Shelton shows that 151 of the married-couple family households (1.7%) and 240 of the single-parent households (11.4%) are living below the poverty level. Within the married-couple family households, those with no children have the highest poverty rate, with 109 households (1.9%) falling below the poverty line. Among the single-parent households, those with 3 or 4 children have the highest poverty rate, with 38 household (53.5%) living below poverty.
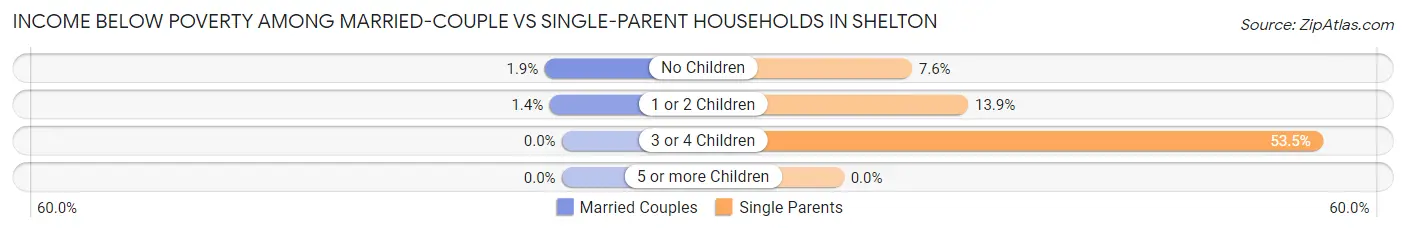
| Children | Married-Couple Families | Single-Parent Households |
| No Children | 109 (1.9%) | 98 (7.6%) |
| 1 or 2 Children | 42 (1.4%) | 104 (13.9%) |
| 3 or 4 Children | 0 (0.0%) | 38 (53.5%) |
| 5 or more Children | 0 (0.0%) | 0 (0.0%) |
| Total | 151 (1.7%) | 240 (11.4%) |
Race in Shelton
The most populous races in Shelton are White / Caucasian (31,190 | 75.7%), Hispanic or Latino (4,991 | 12.1%), and Asian (3,641 | 8.8%).
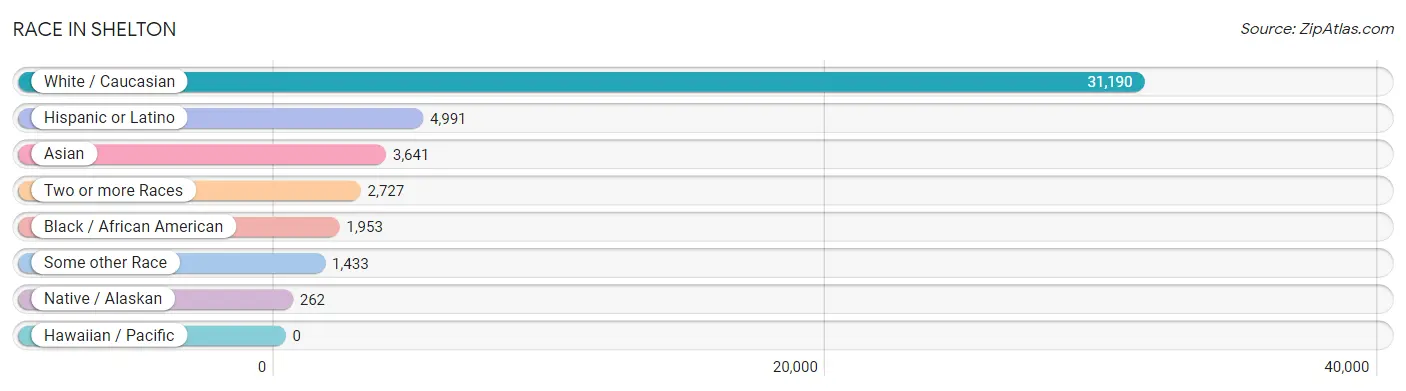
| Race | # Population | % Population |
| Asian | 3,641 | 8.8% |
| Black / African American | 1,953 | 4.7% |
| Hawaiian / Pacific | 0 | 0.0% |
| Hispanic or Latino | 4,991 | 12.1% |
| Native / Alaskan | 262 | 0.6% |
| White / Caucasian | 31,190 | 75.7% |
| Two or more Races | 2,727 | 6.6% |
| Some other Race | 1,433 | 3.5% |
| Total | 41,206 | 100.0% |
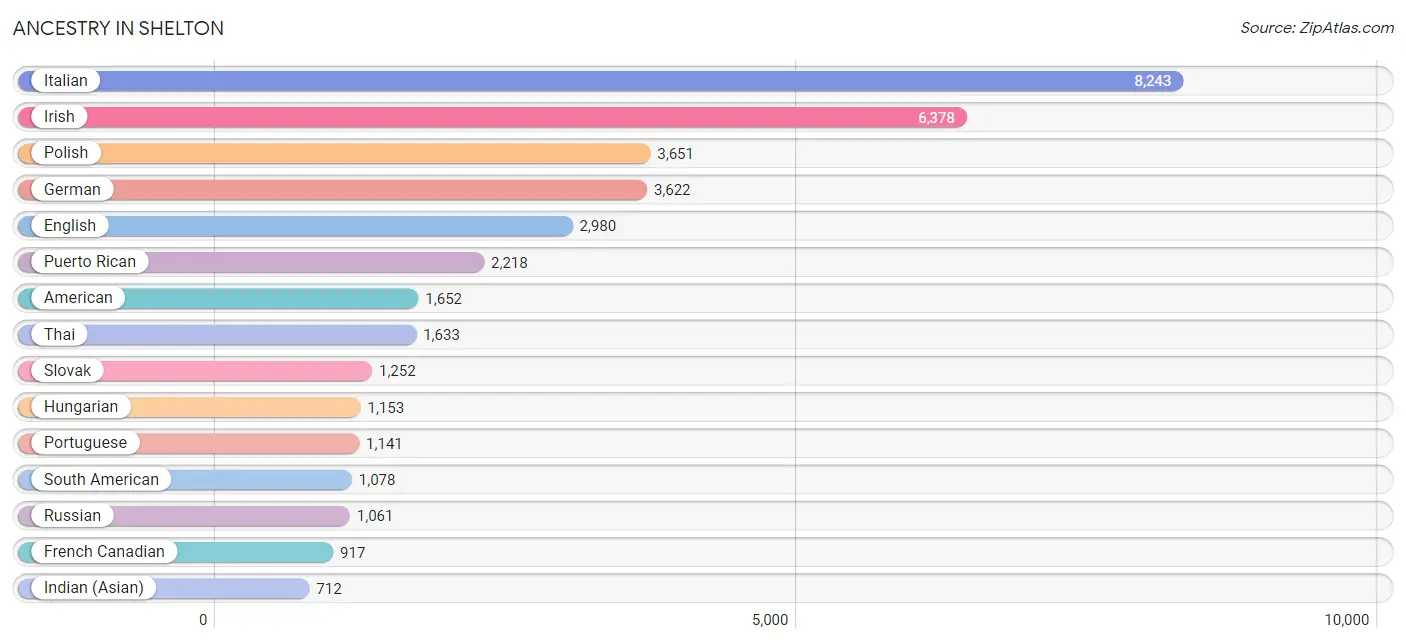
Ancestry in Shelton
The most populous ancestries reported in Shelton are Italian (8,243 | 20.0%), Irish (6,378 | 15.5%), Polish (3,651 | 8.9%), German (3,622 | 8.8%), and English (2,980 | 7.2%), together accounting for 60.4% of all Shelton residents.
| Ancestry | # Population | % Population |
| African | 36 | 0.1% |
| Albanian | 127 | 0.3% |
| Alsatian | 17 | 0.0% |
| American | 1,652 | 4.0% |
| Arab | 289 | 0.7% |
| Austrian | 204 | 0.5% |
| Barbadian | 25 | 0.1% |
| Belgian | 35 | 0.1% |
| Bhutanese | 54 | 0.1% |
| Blackfeet | 5 | 0.0% |
| Brazilian | 533 | 1.3% |
| British | 67 | 0.2% |
| British West Indian | 61 | 0.2% |
| Bulgarian | 20 | 0.1% |
| Burmese | 184 | 0.4% |
| Canadian | 173 | 0.4% |
| Cape Verdean | 20 | 0.1% |
| Central American | 461 | 1.1% |
| Cherokee | 14 | 0.0% |
| Chilean | 40 | 0.1% |
| Colombian | 184 | 0.4% |
| Croatian | 155 | 0.4% |
| Cuban | 230 | 0.6% |
| Czech | 147 | 0.4% |
| Czechoslovakian | 45 | 0.1% |
| Danish | 236 | 0.6% |
| Delaware | 6 | 0.0% |
| Dominican | 311 | 0.7% |
| Dutch | 157 | 0.4% |
| Eastern European | 218 | 0.5% |
| Ecuadorian | 341 | 0.8% |
| Egyptian | 25 | 0.1% |
| English | 2,980 | 7.2% |
| Estonian | 25 | 0.1% |
| Ethiopian | 84 | 0.2% |
| European | 259 | 0.6% |
| Finnish | 10 | 0.0% |
| French | 593 | 1.4% |
| French Canadian | 917 | 2.2% |
| German | 3,622 | 8.8% |
| Greek | 180 | 0.4% |
| Guatemalan | 189 | 0.5% |
| Guyanese | 38 | 0.1% |
| Haitian | 242 | 0.6% |
| Honduran | 170 | 0.4% |
| Hungarian | 1,153 | 2.8% |
| Icelander | 8 | 0.0% |
| Indian (Asian) | 712 | 1.7% |
| Iranian | 52 | 0.1% |
| Irish | 6,378 | 15.5% |
| Iroquois | 5 | 0.0% |
| Israeli | 8 | 0.0% |
| Italian | 8,243 | 20.0% |
| Jamaican | 161 | 0.4% |
| Korean | 562 | 1.4% |
| Latvian | 8 | 0.0% |
| Lebanese | 141 | 0.3% |
| Lithuanian | 307 | 0.7% |
| Lumbee | 69 | 0.2% |
| Maltese | 9 | 0.0% |
| Mexican | 513 | 1.2% |
| Northern European | 8 | 0.0% |
| Norwegian | 158 | 0.4% |
| Peruvian | 467 | 1.1% |
| Polish | 3,651 | 8.9% |
| Portuguese | 1,141 | 2.8% |
| Puerto Rican | 2,218 | 5.4% |
| Romanian | 317 | 0.8% |
| Russian | 1,061 | 2.6% |
| Salvadoran | 102 | 0.3% |
| Scandinavian | 36 | 0.1% |
| Scotch-Irish | 322 | 0.8% |
| Scottish | 455 | 1.1% |
| Slavic | 32 | 0.1% |
| Slovak | 1,252 | 3.0% |
| Slovene | 12 | 0.0% |
| South African | 89 | 0.2% |
| South American | 1,078 | 2.6% |
| South American Indian | 27 | 0.1% |
| Spaniard | 82 | 0.2% |
| Spanish | 44 | 0.1% |
| Sri Lankan | 654 | 1.6% |
| Subsaharan African | 285 | 0.7% |
| Swedish | 479 | 1.2% |
| Swiss | 75 | 0.2% |
| Syrian | 78 | 0.2% |
| Thai | 1,633 | 4.0% |
| Trinidadian and Tobagonian | 120 | 0.3% |
| Turkish | 11 | 0.0% |
| Ukrainian | 218 | 0.5% |
| Venezuelan | 46 | 0.1% |
| Welsh | 107 | 0.3% |
| West Indian | 61 | 0.2% | View All 93 Rows |
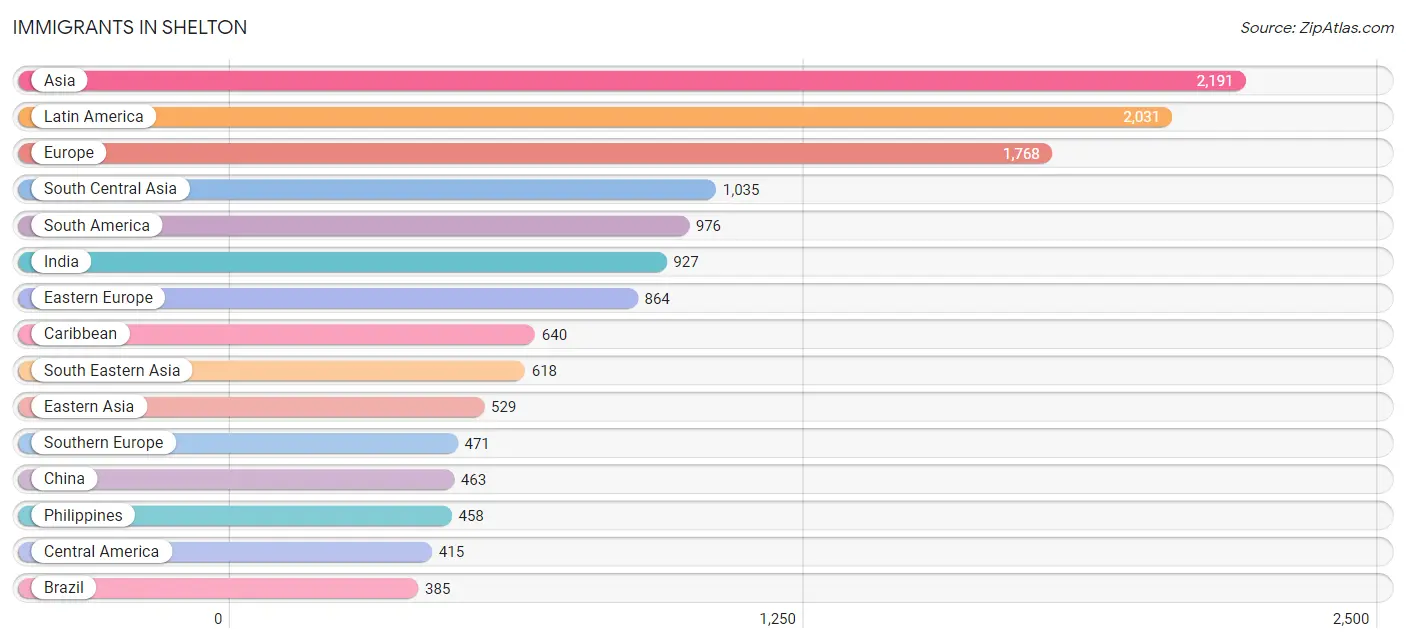
Immigrants in Shelton
The most numerous immigrant groups reported in Shelton came from Asia (2,191 | 5.3%), Latin America (2,031 | 4.9%), Europe (1,768 | 4.3%), South Central Asia (1,035 | 2.5%), and South America (976 | 2.4%), together accounting for 19.4% of all Shelton residents.
| Immigration Origin | # Population | % Population |
| Africa | 235 | 0.6% |
| Albania | 33 | 0.1% |
| Asia | 2,191 | 5.3% |
| Austria | 27 | 0.1% |
| Barbados | 7 | 0.0% |
| Brazil | 385 | 0.9% |
| Bulgaria | 20 | 0.1% |
| Canada | 242 | 0.6% |
| Caribbean | 640 | 1.5% |
| Central America | 415 | 1.0% |
| Chile | 40 | 0.1% |
| China | 463 | 1.1% |
| Colombia | 24 | 0.1% |
| Croatia | 16 | 0.0% |
| Cuba | 9 | 0.0% |
| Czechoslovakia | 41 | 0.1% |
| Denmark | 6 | 0.0% |
| Dominica | 61 | 0.2% |
| Dominican Republic | 113 | 0.3% |
| Eastern Africa | 57 | 0.1% |
| Eastern Asia | 529 | 1.3% |
| Eastern Europe | 864 | 2.1% |
| Ecuador | 218 | 0.5% |
| Egypt | 7 | 0.0% |
| El Salvador | 74 | 0.2% |
| England | 113 | 0.3% |
| Ethiopia | 49 | 0.1% |
| Europe | 1,768 | 4.3% |
| France | 71 | 0.2% |
| Germany | 91 | 0.2% |
| Greece | 12 | 0.0% |
| Guatemala | 73 | 0.2% |
| Guyana | 72 | 0.2% |
| Haiti | 242 | 0.6% |
| Honduras | 66 | 0.2% |
| Hungary | 11 | 0.0% |
| India | 927 | 2.2% |
| Iran | 69 | 0.2% |
| Iraq | 1 | 0.0% |
| Ireland | 48 | 0.1% |
| Israel | 8 | 0.0% |
| Italy | 259 | 0.6% |
| Jamaica | 61 | 0.2% |
| Korea | 66 | 0.2% |
| Latin America | 2,031 | 4.9% |
| Lithuania | 21 | 0.1% |
| Mexico | 202 | 0.5% |
| Moldova | 98 | 0.2% |
| Morocco | 9 | 0.0% |
| Netherlands | 25 | 0.1% |
| North Macedonia | 36 | 0.1% |
| Northern Africa | 17 | 0.0% |
| Northern Europe | 219 | 0.5% |
| Pakistan | 27 | 0.1% |
| Peru | 191 | 0.5% |
| Philippines | 458 | 1.1% |
| Poland | 342 | 0.8% |
| Portugal | 200 | 0.5% |
| Romania | 137 | 0.3% |
| Russia | 43 | 0.1% |
| Scotland | 12 | 0.0% |
| Singapore | 19 | 0.1% |
| South Africa | 105 | 0.3% |
| South America | 976 | 2.4% |
| South Central Asia | 1,035 | 2.5% |
| South Eastern Asia | 618 | 1.5% |
| Southern Europe | 471 | 1.1% |
| St. Vincent and the Grenadines | 27 | 0.1% |
| Sweden | 11 | 0.0% |
| Taiwan | 5 | 0.0% |
| Trinidad and Tobago | 120 | 0.3% |
| Ukraine | 11 | 0.0% |
| Uzbekistan | 12 | 0.0% |
| Venezuela | 46 | 0.1% |
| Vietnam | 141 | 0.3% |
| Western Africa | 56 | 0.1% |
| Western Asia | 9 | 0.0% |
| Western Europe | 214 | 0.5% |
| Zimbabwe | 8 | 0.0% | View All 79 Rows |
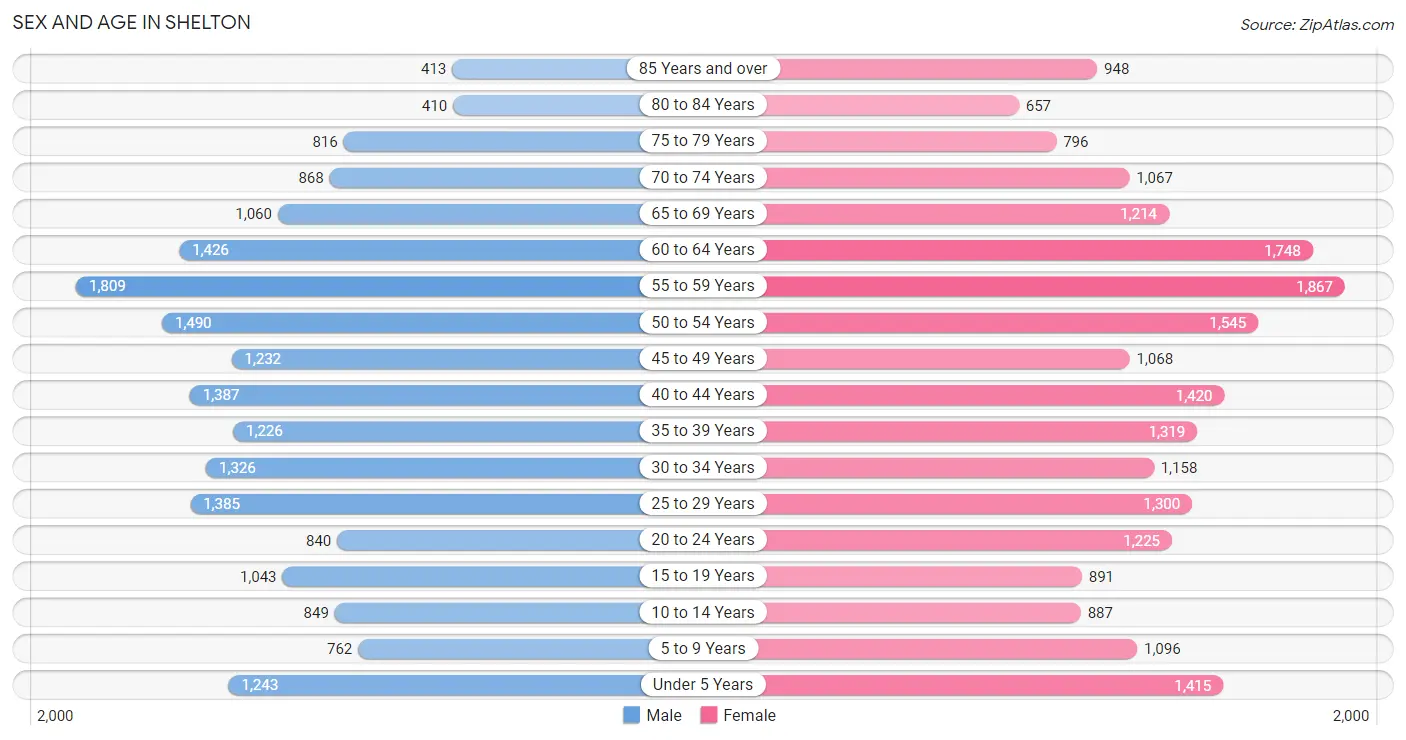
Sex and Age in Shelton
Sex and Age in Shelton
The most populous age groups in Shelton are 55 to 59 Years (1,809 | 9.2%) for men and 55 to 59 Years (1,867 | 8.6%) for women.
| Age Bracket | Male | Female |
| Under 5 Years | 1,243 (6.4%) | 1,415 (6.5%) |
| 5 to 9 Years | 762 (3.9%) | 1,096 (5.1%) |
| 10 to 14 Years | 849 (4.3%) | 887 (4.1%) |
| 15 to 19 Years | 1,043 (5.3%) | 891 (4.1%) |
| 20 to 24 Years | 840 (4.3%) | 1,225 (5.7%) |
| 25 to 29 Years | 1,385 (7.1%) | 1,300 (6.0%) |
| 30 to 34 Years | 1,326 (6.8%) | 1,158 (5.4%) |
| 35 to 39 Years | 1,226 (6.3%) | 1,319 (6.1%) |
| 40 to 44 Years | 1,387 (7.1%) | 1,420 (6.6%) |
| 45 to 49 Years | 1,232 (6.3%) | 1,068 (4.9%) |
| 50 to 54 Years | 1,490 (7.6%) | 1,545 (7.1%) |
| 55 to 59 Years | 1,809 (9.2%) | 1,867 (8.6%) |
| 60 to 64 Years | 1,426 (7.3%) | 1,748 (8.1%) |
| 65 to 69 Years | 1,060 (5.4%) | 1,214 (5.6%) |
| 70 to 74 Years | 868 (4.4%) | 1,067 (4.9%) |
| 75 to 79 Years | 816 (4.2%) | 796 (3.7%) |
| 80 to 84 Years | 410 (2.1%) | 657 (3.0%) |
| 85 Years and over | 413 (2.1%) | 948 (4.4%) |
| Total | 19,585 (100.0%) | 21,621 (100.0%) |
Families and Households in Shelton
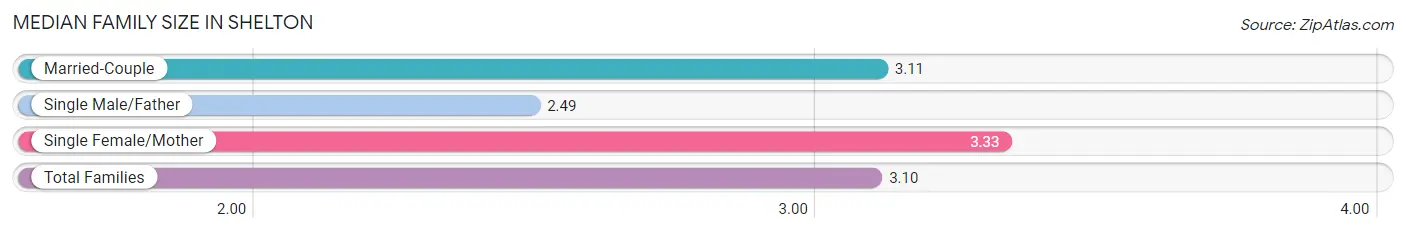
Median Family Size in Shelton
The median family size in Shelton is 3.10 persons per family, with single female/mother families (1,507 | 13.6%) accounting for the largest median family size of 3.33 persons per family. On the other hand, single male/father families (598 | 5.4%) represent the smallest median family size with 2.49 persons per family.
| Family Type | # Families | Family Size |
| Married-Couple | 8,972 (81.0%) | 3.11 |
| Single Male/Father | 598 (5.4%) | 2.49 |
| Single Female/Mother | 1,507 (13.6%) | 3.33 |
| Total Families | 11,077 (100.0%) | 3.10 |
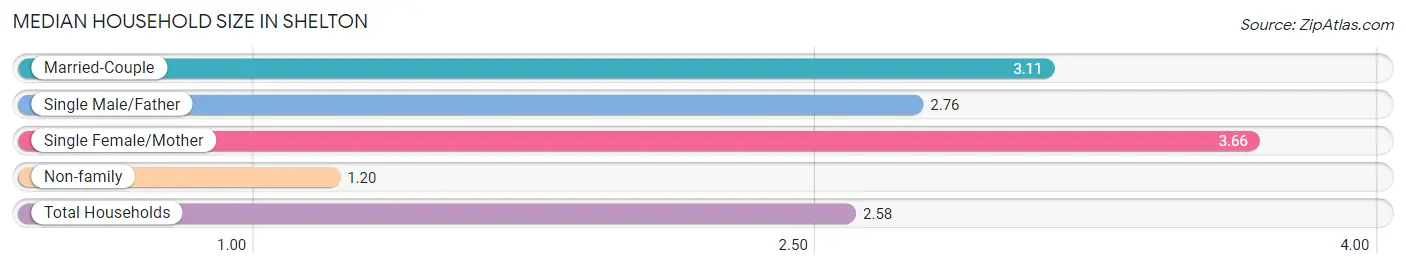
Median Household Size in Shelton
The median household size in Shelton is 2.58 persons per household, with single female/mother households (1,507 | 9.6%) accounting for the largest median household size of 3.66 persons per household. non-family households (4,697 | 29.8%) represent the smallest median household size with 1.20 persons per household.
| Household Type | # Households | Household Size |
| Married-Couple | 8,972 (56.9%) | 3.11 |
| Single Male/Father | 598 (3.8%) | 2.76 |
| Single Female/Mother | 1,507 (9.6%) | 3.66 |
| Non-family | 4,697 (29.8%) | 1.20 |
| Total Households | 15,774 (100.0%) | 2.58 |
Household Size by Marriage Status in Shelton
Out of a total of 15,774 households in Shelton, 11,077 (70.2%) are family households, while 4,697 (29.8%) are nonfamily households. The most numerous type of family households are 2-person households, comprising 4,773, and the most common type of nonfamily households are 1-person households, comprising 3,867.
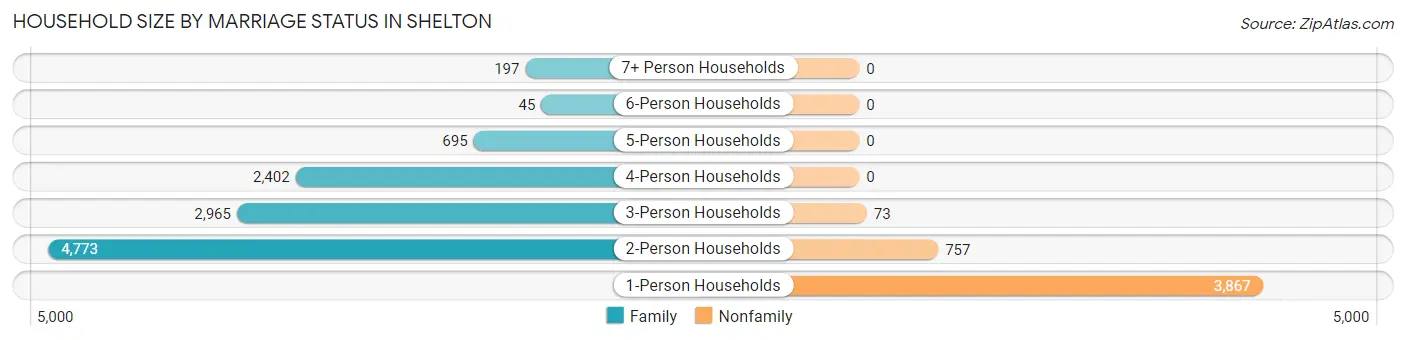
| Household Size | Family Households | Nonfamily Households |
| 1-Person Households | - | 3,867 (24.5%) |
| 2-Person Households | 4,773 (30.3%) | 757 (4.8%) |
| 3-Person Households | 2,965 (18.8%) | 73 (0.5%) |
| 4-Person Households | 2,402 (15.2%) | 0 (0.0%) |
| 5-Person Households | 695 (4.4%) | 0 (0.0%) |
| 6-Person Households | 45 (0.3%) | 0 (0.0%) |
| 7+ Person Households | 197 (1.3%) | 0 (0.0%) |
| Total | 11,077 (70.2%) | 4,697 (29.8%) |
Female Fertility in Shelton
Fertility by Age in Shelton
Average fertility rate in Shelton is 90.0 births per 1,000 women. Women in the age bracket of 20 to 34 years have the highest fertility rate with 132.0 births per 1,000 women. Women in the age bracket of 20 to 34 years acount for 62.3% of all women with births.
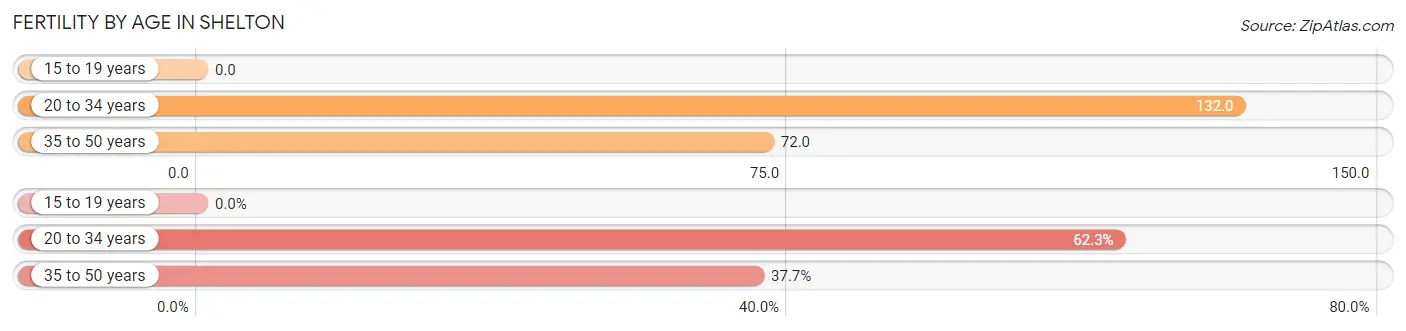
| Age Bracket | Women with Births | Births / 1,000 Women |
| 15 to 19 years | 0 (0.0%) | 0.0 |
| 20 to 34 years | 485 (62.3%) | 132.0 |
| 35 to 50 years | 294 (37.7%) | 72.0 |
| Total | 779 (100.0%) | 90.0 |
Fertility by Age by Marriage Status in Shelton
92.3% of women with births (779) in Shelton are married. The highest percentage of unmarried women with births falls into 20 to 34 years age bracket with 7.8% of them unmarried at the time of birth, while the lowest percentage of unmarried women with births belong to 35 to 50 years age bracket with 7.5% of them unmarried.
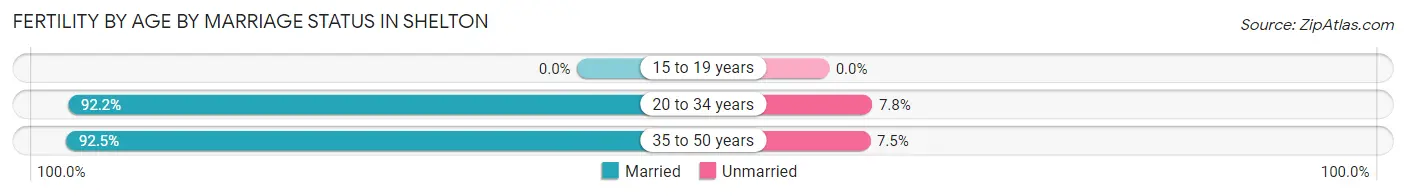
| Age Bracket | Married | Unmarried |
| 15 to 19 years | 0 (0.0%) | 0 (0.0%) |
| 20 to 34 years | 447 (92.2%) | 38 (7.8%) |
| 35 to 50 years | 272 (92.5%) | 22 (7.5%) |
| Total | 719 (92.3%) | 60 (7.7%) |
Fertility by Education in Shelton
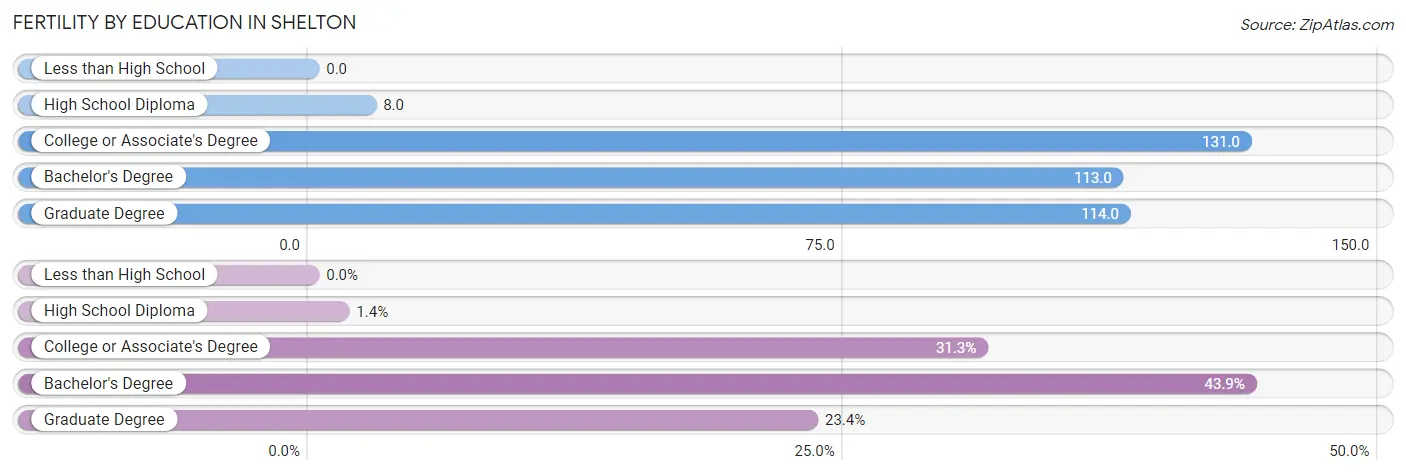
| Educational Attainment | Women with Births | Births / 1,000 Women |
| Less than High School | 0 (0.0%) | 0.0 |
| High School Diploma | 11 (1.4%) | 8.0 |
| College or Associate's Degree | 244 (31.3%) | 131.0 |
| Bachelor's Degree | 342 (43.9%) | 113.0 |
| Graduate Degree | 182 (23.4%) | 114.0 |
| Total | 779 (100.0%) | 90.0 |
Fertility by Education by Marriage Status in Shelton
7.7% of women with births in Shelton are unmarried. Women with the educational attainment of college or associate's degree are most likely to be married with 100.0% of them married at childbirth, while women with the educational attainment of high school diploma are least likely to be married with 36.4% of them unmarried at childbirth.
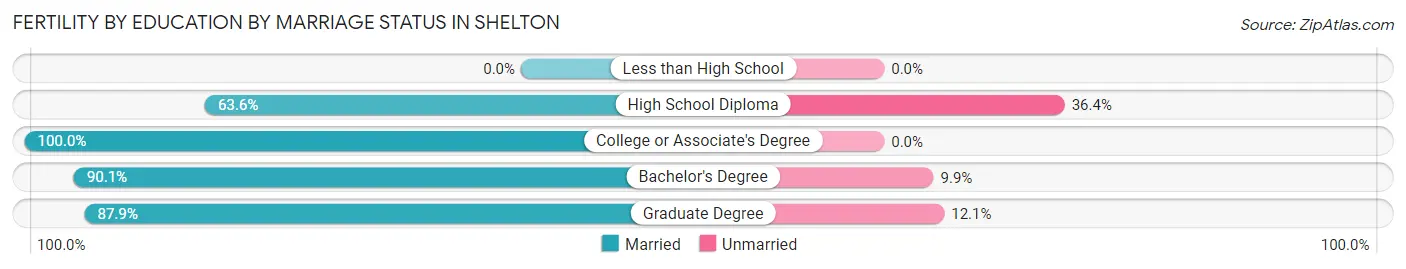
| Educational Attainment | Married | Unmarried |
| Less than High School | 0 (0.0%) | 0 (0.0%) |
| High School Diploma | 7 (63.6%) | 4 (36.4%) |
| College or Associate's Degree | 244 (100.0%) | 0 (0.0%) |
| Bachelor's Degree | 308 (90.1%) | 34 (9.9%) |
| Graduate Degree | 160 (87.9%) | 22 (12.1%) |
| Total | 719 (92.3%) | 60 (7.7%) |
Employment Characteristics in Shelton
Employment by Class of Employer in Shelton
Among the 21,420 employed individuals in Shelton, private company employees (14,604 | 68.2%), not-for-profit organizations (1,966 | 9.2%), and local government employees (1,833 | 8.6%) make up the most common classes of employment.
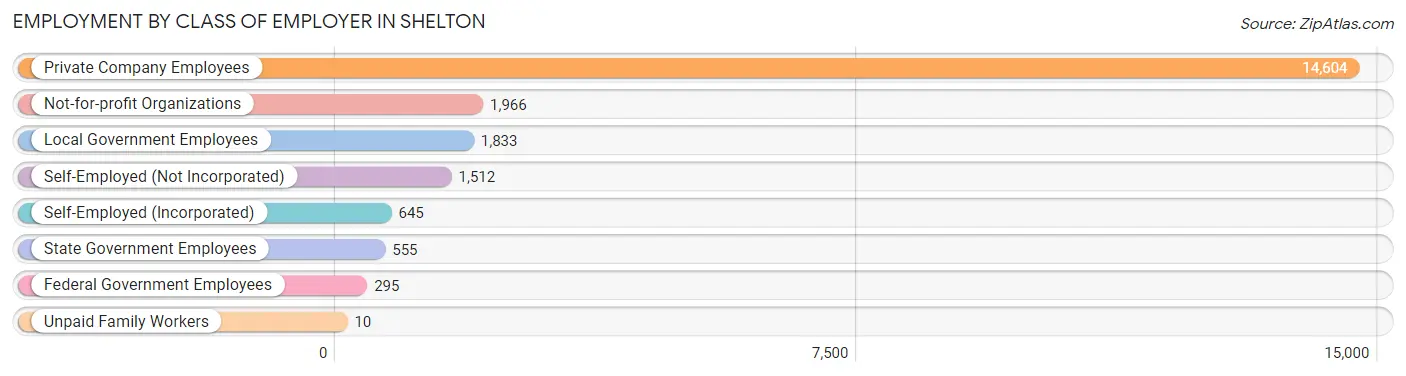
| Employer Class | # Employees | % Employees |
| Private Company Employees | 14,604 | 68.2% |
| Self-Employed (Incorporated) | 645 | 3.0% |
| Self-Employed (Not Incorporated) | 1,512 | 7.1% |
| Not-for-profit Organizations | 1,966 | 9.2% |
| Local Government Employees | 1,833 | 8.6% |
| State Government Employees | 555 | 2.6% |
| Federal Government Employees | 295 | 1.4% |
| Unpaid Family Workers | 10 | 0.1% |
| Total | 21,420 | 100.0% |
Employment Status by Age in Shelton
According to the labor force statistics for Shelton, out of the total population over 16 years of age (34,638), 66.3% or 22,965 individuals are in the labor force, with 5.5% or 1,263 of them unemployed. The age group with the highest labor force participation rate is 45 to 54 years, with 88.9% or 4,743 individuals in the labor force. Within the labor force, the 16 to 19 years age range has the highest percentage of unemployed individuals, with 14.7% or 92 of them being unemployed.
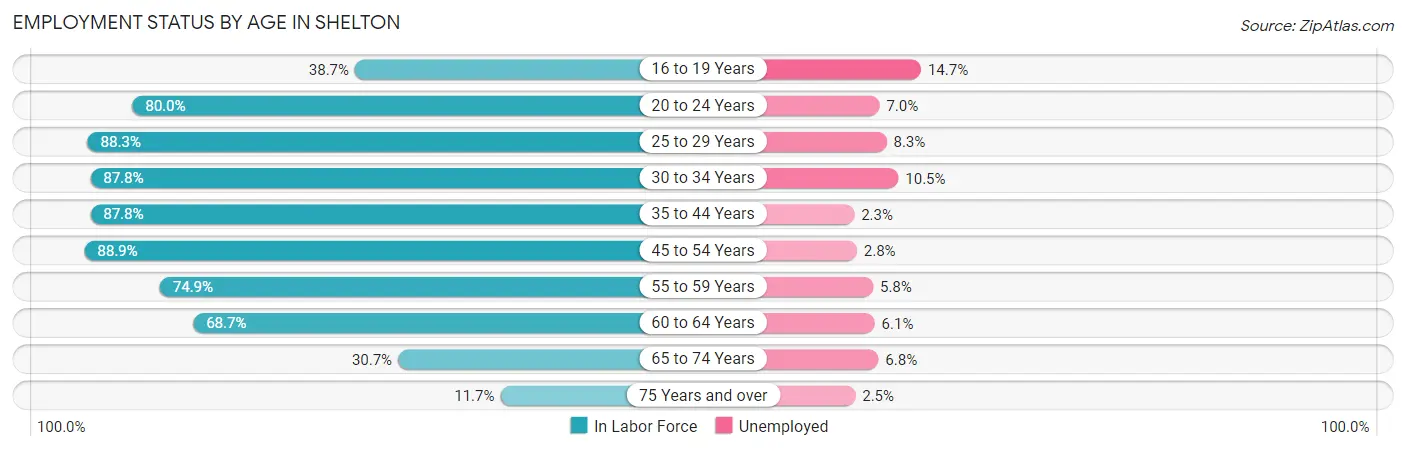
| Age Bracket | In Labor Force | Unemployed |
| 16 to 19 Years | 626 (38.7%) | 92 (14.7%) |
| 20 to 24 Years | 1,652 (80.0%) | 116 (7.0%) |
| 25 to 29 Years | 2,371 (88.3%) | 197 (8.3%) |
| 30 to 34 Years | 2,181 (87.8%) | 229 (10.5%) |
| 35 to 44 Years | 4,699 (87.8%) | 108 (2.3%) |
| 45 to 54 Years | 4,743 (88.9%) | 133 (2.8%) |
| 55 to 59 Years | 2,753 (74.9%) | 160 (5.8%) |
| 60 to 64 Years | 2,181 (68.7%) | 133 (6.1%) |
| 65 to 74 Years | 1,292 (30.7%) | 88 (6.8%) |
| 75 Years and over | 473 (11.7%) | 12 (2.5%) |
| Total | 22,965 (66.3%) | 1,263 (5.5%) |
Employment Status by Educational Attainment in Shelton
According to labor force statistics for Shelton, 83.4% of individuals (18,937) out of the total population between 25 and 64 years of age (22,706) are in the labor force, with 5.1% or 966 of them being unemployed. The group with the highest labor force participation rate are those with the educational attainment of bachelor's degree or higher, with 88.3% or 9,506 individuals in the labor force. Within the labor force, individuals with less than high school education have the highest percentage of unemployment, with 15.0% or 112 of them being unemployed.
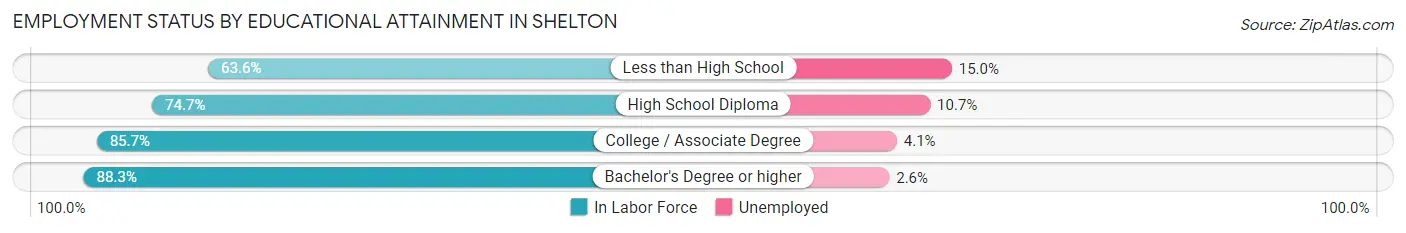
| Educational Attainment | In Labor Force | Unemployed |
| Less than High School | 748 (63.6%) | 176 (15.0%) |
| High School Diploma | 3,727 (74.7%) | 534 (10.7%) |
| College / Associate Degree | 4,949 (85.7%) | 237 (4.1%) |
| Bachelor's Degree or higher | 9,506 (88.3%) | 280 (2.6%) |
| Total | 18,937 (83.4%) | 1,158 (5.1%) |
Employment Occupations by Sex in Shelton
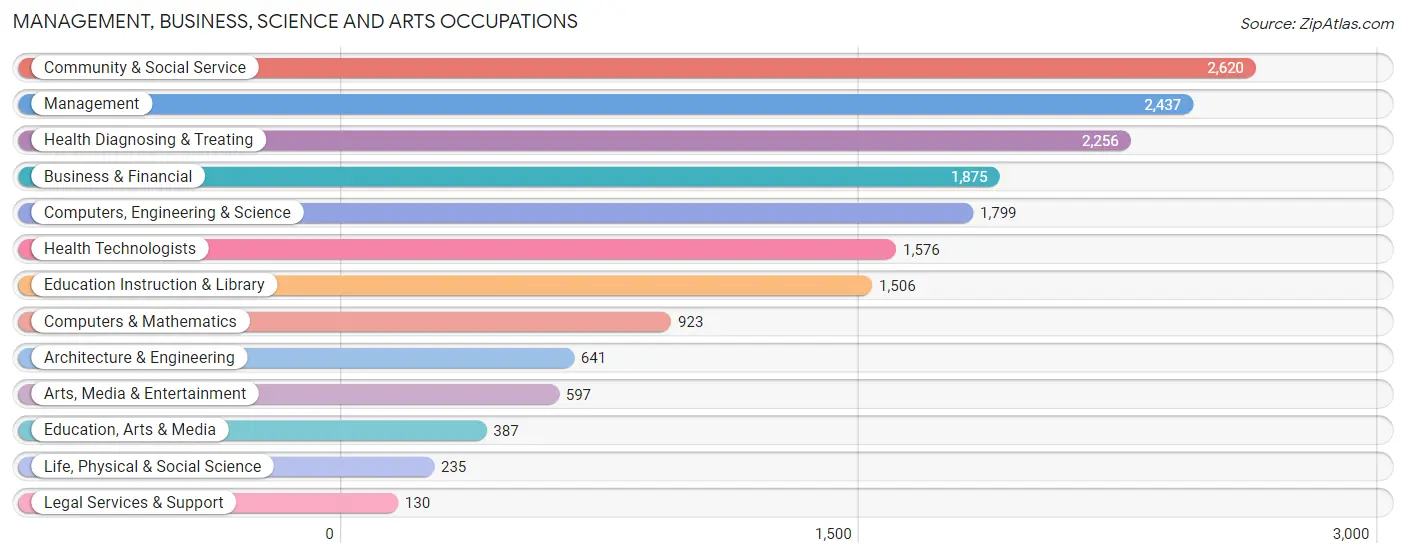
Management, Business, Science and Arts Occupations
The most common Management, Business, Science and Arts occupations in Shelton are Community & Social Service (2,620 | 12.1%), Management (2,437 | 11.3%), Health Diagnosing & Treating (2,256 | 10.4%), Business & Financial (1,875 | 8.7%), and Computers, Engineering & Science (1,799 | 8.3%).
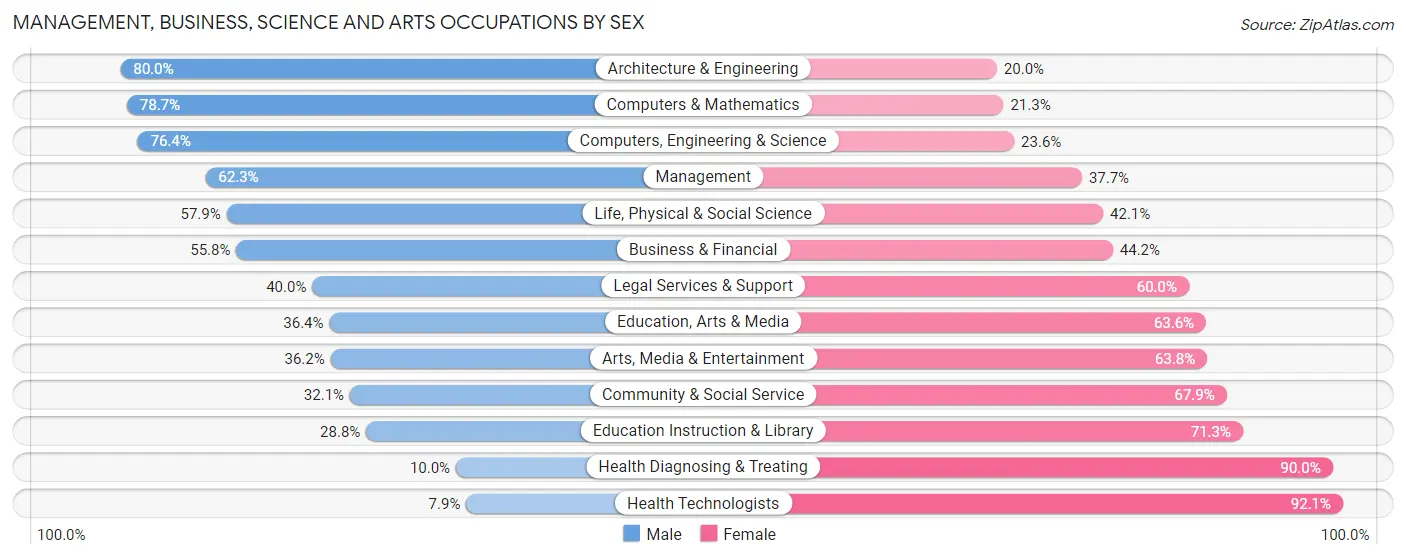
Management, Business, Science and Arts Occupations by Sex
Within the Management, Business, Science and Arts occupations in Shelton, the most male-oriented occupations are Architecture & Engineering (80.0%), Computers & Mathematics (78.7%), and Computers, Engineering & Science (76.4%), while the most female-oriented occupations are Health Technologists (92.1%), Health Diagnosing & Treating (90.0%), and Education Instruction & Library (71.3%).
| Occupation | Male | Female |
| Management | 1,518 (62.3%) | 919 (37.7%) |
| Business & Financial | 1,047 (55.8%) | 828 (44.2%) |
| Computers, Engineering & Science | 1,375 (76.4%) | 424 (23.6%) |
| Computers & Mathematics | 726 (78.7%) | 197 (21.3%) |
| Architecture & Engineering | 513 (80.0%) | 128 (20.0%) |
| Life, Physical & Social Science | 136 (57.9%) | 99 (42.1%) |
| Community & Social Service | 842 (32.1%) | 1,778 (67.9%) |
| Education, Arts & Media | 141 (36.4%) | 246 (63.6%) |
| Legal Services & Support | 52 (40.0%) | 78 (60.0%) |
| Education Instruction & Library | 433 (28.7%) | 1,073 (71.3%) |
| Arts, Media & Entertainment | 216 (36.2%) | 381 (63.8%) |
| Health Diagnosing & Treating | 226 (10.0%) | 2,030 (90.0%) |
| Health Technologists | 124 (7.9%) | 1,452 (92.1%) |
| Total (Category) | 5,008 (45.6%) | 5,979 (54.4%) |
| Total (Overall) | 10,960 (50.8%) | 10,626 (49.2%) |
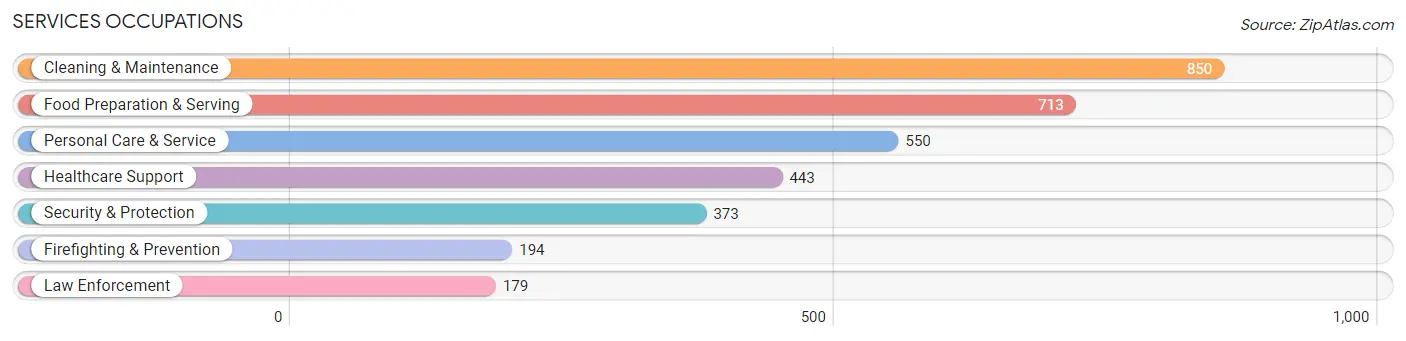
Services Occupations
The most common Services occupations in Shelton are Cleaning & Maintenance (850 | 3.9%), Food Preparation & Serving (713 | 3.3%), Personal Care & Service (550 | 2.5%), Healthcare Support (443 | 2.1%), and Security & Protection (373 | 1.7%).
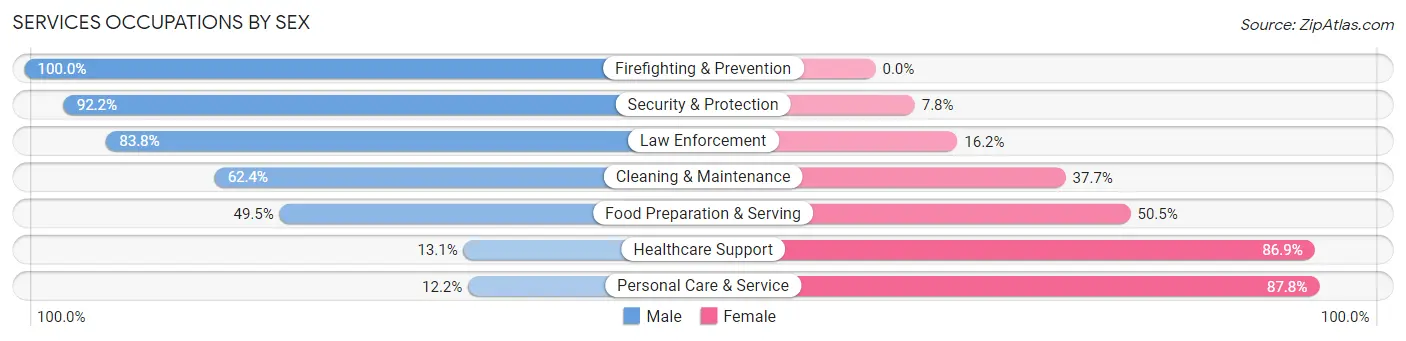
Services Occupations by Sex
Within the Services occupations in Shelton, the most male-oriented occupations are Firefighting & Prevention (100.0%), Security & Protection (92.2%), and Law Enforcement (83.8%), while the most female-oriented occupations are Personal Care & Service (87.8%), Healthcare Support (86.9%), and Food Preparation & Serving (50.5%).
| Occupation | Male | Female |
| Healthcare Support | 58 (13.1%) | 385 (86.9%) |
| Security & Protection | 344 (92.2%) | 29 (7.8%) |
| Firefighting & Prevention | 194 (100.0%) | 0 (0.0%) |
| Law Enforcement | 150 (83.8%) | 29 (16.2%) |
| Food Preparation & Serving | 353 (49.5%) | 360 (50.5%) |
| Cleaning & Maintenance | 530 (62.4%) | 320 (37.7%) |
| Personal Care & Service | 67 (12.2%) | 483 (87.8%) |
| Total (Category) | 1,352 (46.2%) | 1,577 (53.8%) |
| Total (Overall) | 10,960 (50.8%) | 10,626 (49.2%) |
Sales and Office Occupations
The most common Sales and Office occupations in Shelton are Office & Administration (2,110 | 9.8%), and Sales & Related (1,780 | 8.3%).
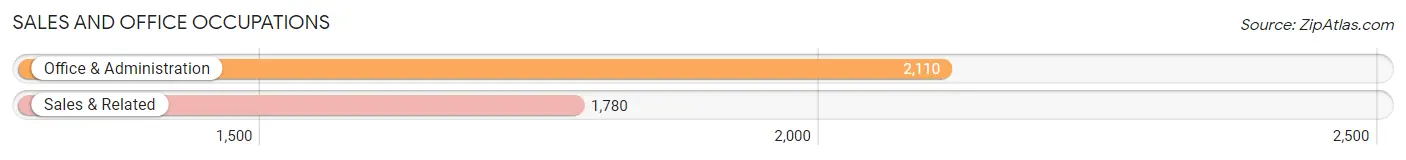
Sales and Office Occupations by Sex
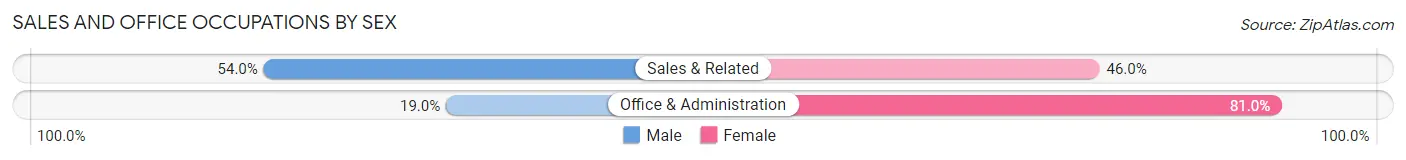
| Occupation | Male | Female |
| Sales & Related | 962 (54.0%) | 818 (46.0%) |
| Office & Administration | 400 (19.0%) | 1,710 (81.0%) |
| Total (Category) | 1,362 (35.0%) | 2,528 (65.0%) |
| Total (Overall) | 10,960 (50.8%) | 10,626 (49.2%) |
Natural Resources, Construction and Maintenance Occupations
The most common Natural Resources, Construction and Maintenance occupations in Shelton are Construction & Extraction (882 | 4.1%), Installation, Maintenance & Repair (641 | 3.0%), and Farming, Fishing & Forestry (46 | 0.2%).
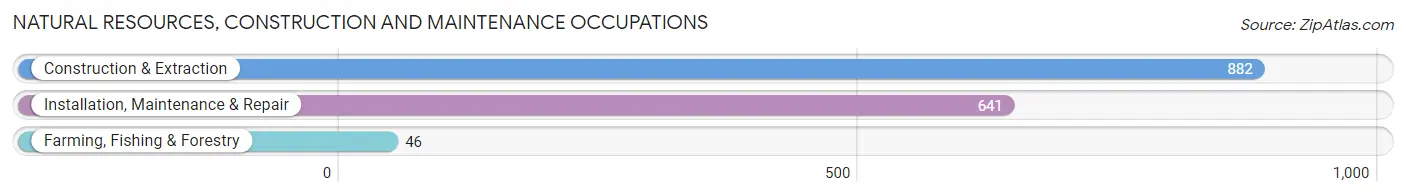
Natural Resources, Construction and Maintenance Occupations by Sex
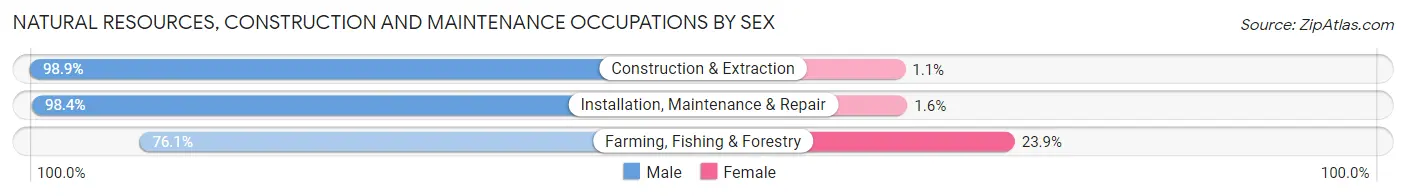
| Occupation | Male | Female |
| Farming, Fishing & Forestry | 35 (76.1%) | 11 (23.9%) |
| Construction & Extraction | 872 (98.9%) | 10 (1.1%) |
| Installation, Maintenance & Repair | 631 (98.4%) | 10 (1.6%) |
| Total (Category) | 1,538 (98.0%) | 31 (2.0%) |
| Total (Overall) | 10,960 (50.8%) | 10,626 (49.2%) |
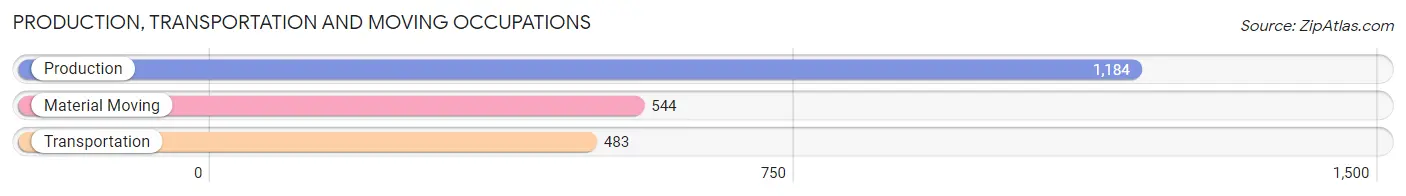
Production, Transportation and Moving Occupations
The most common Production, Transportation and Moving occupations in Shelton are Production (1,184 | 5.5%), Material Moving (544 | 2.5%), and Transportation (483 | 2.2%).
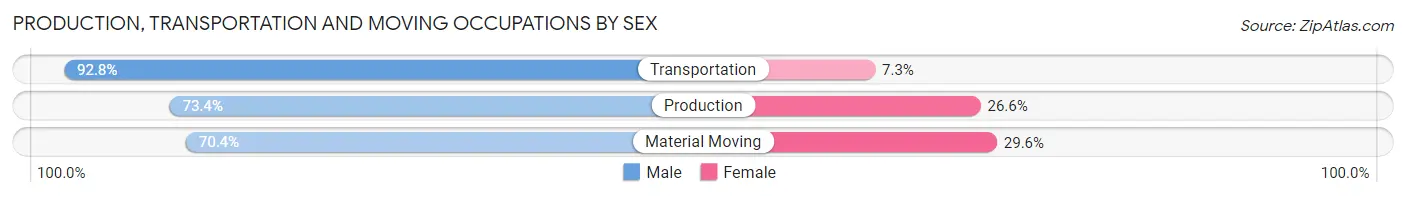
Production, Transportation and Moving Occupations by Sex
| Occupation | Male | Female |
| Production | 869 (73.4%) | 315 (26.6%) |
| Transportation | 448 (92.7%) | 35 (7.2%) |
| Material Moving | 383 (70.4%) | 161 (29.6%) |
| Total (Category) | 1,700 (76.9%) | 511 (23.1%) |
| Total (Overall) | 10,960 (50.8%) | 10,626 (49.2%) |
Employment Industries by Sex in Shelton
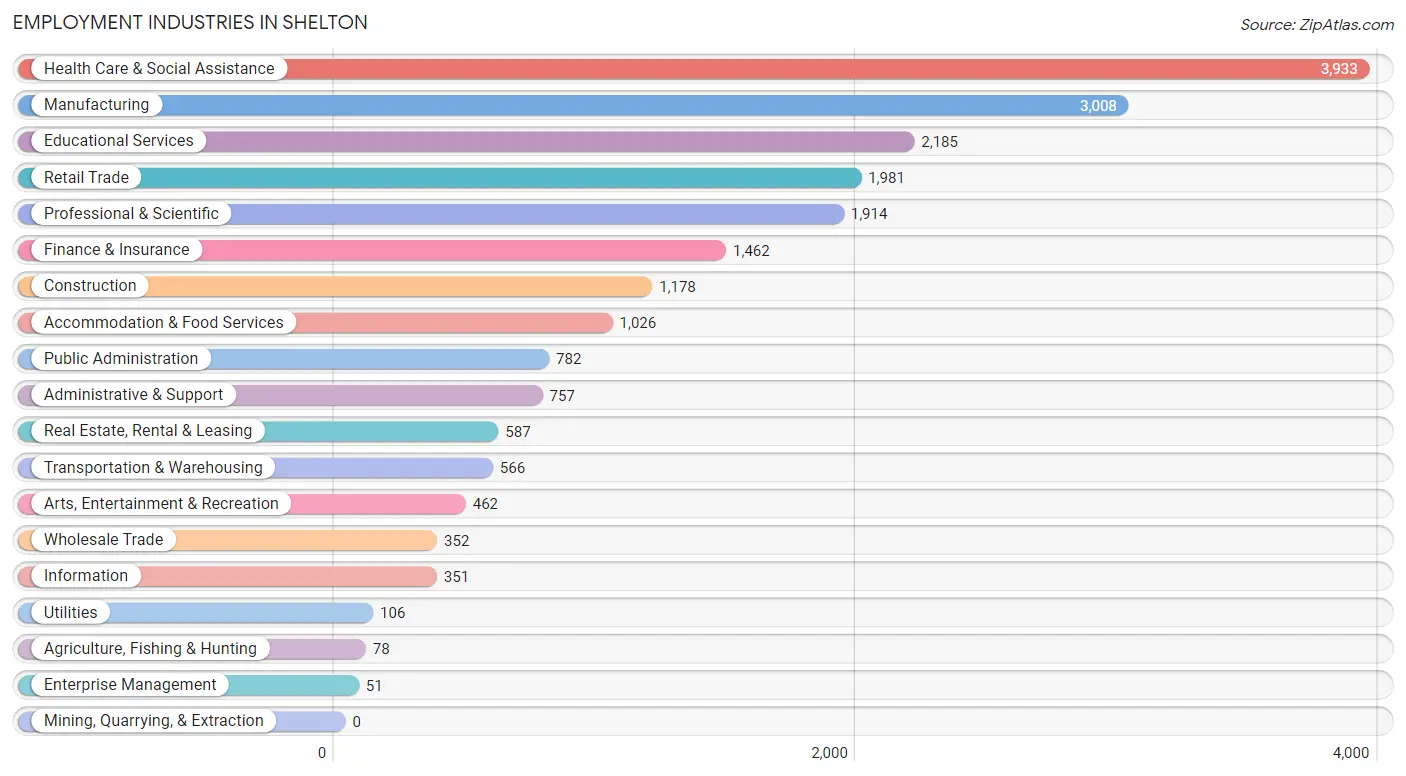
Employment Industries in Shelton
The major employment industries in Shelton include Health Care & Social Assistance (3,933 | 18.2%), Manufacturing (3,008 | 13.9%), Educational Services (2,185 | 10.1%), Retail Trade (1,981 | 9.2%), and Professional & Scientific (1,914 | 8.9%).
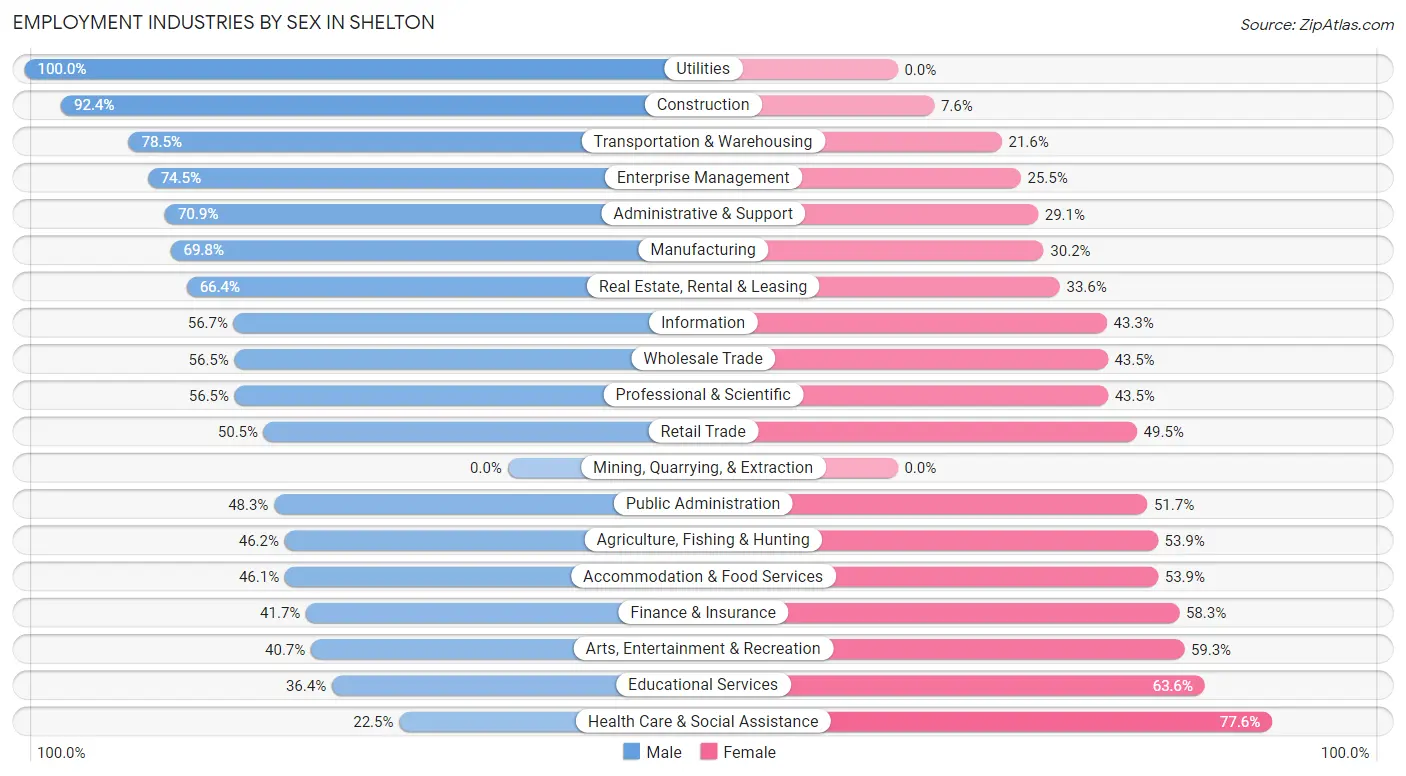
Employment Industries by Sex in Shelton
The Shelton industries that see more men than women are Utilities (100.0%), Construction (92.4%), and Transportation & Warehousing (78.4%), whereas the industries that tend to have a higher number of women are Health Care & Social Assistance (77.5%), Educational Services (63.6%), and Arts, Entertainment & Recreation (59.3%).
| Industry | Male | Female |
| Agriculture, Fishing & Hunting | 36 (46.2%) | 42 (53.8%) |
| Mining, Quarrying, & Extraction | 0 (0.0%) | 0 (0.0%) |
| Construction | 1,089 (92.4%) | 89 (7.6%) |
| Manufacturing | 2,099 (69.8%) | 909 (30.2%) |
| Wholesale Trade | 199 (56.5%) | 153 (43.5%) |
| Retail Trade | 1,000 (50.5%) | 981 (49.5%) |
| Transportation & Warehousing | 444 (78.4%) | 122 (21.5%) |
| Utilities | 106 (100.0%) | 0 (0.0%) |
| Information | 199 (56.7%) | 152 (43.3%) |
| Finance & Insurance | 610 (41.7%) | 852 (58.3%) |
| Real Estate, Rental & Leasing | 390 (66.4%) | 197 (33.6%) |
| Professional & Scientific | 1,081 (56.5%) | 833 (43.5%) |
| Enterprise Management | 38 (74.5%) | 13 (25.5%) |
| Administrative & Support | 537 (70.9%) | 220 (29.1%) |
| Educational Services | 795 (36.4%) | 1,390 (63.6%) |
| Health Care & Social Assistance | 883 (22.5%) | 3,050 (77.5%) |
| Arts, Entertainment & Recreation | 188 (40.7%) | 274 (59.3%) |
| Accommodation & Food Services | 473 (46.1%) | 553 (53.9%) |
| Public Administration | 378 (48.3%) | 404 (51.7%) |
| Total | 10,960 (50.8%) | 10,626 (49.2%) |
Education in Shelton
School Enrollment in Shelton
The most common levels of schooling among the 7,943 students in Shelton are high school (1,614 | 20.3%), elementary school (1,504 | 18.9%), and middle school (1,438 | 18.1%).
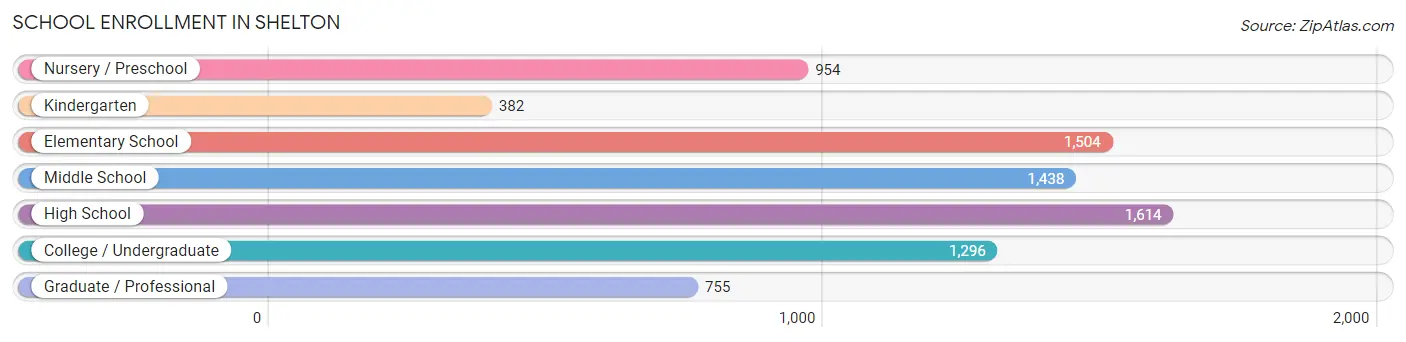
| School Level | # Students | % Students |
| Nursery / Preschool | 954 | 12.0% |
| Kindergarten | 382 | 4.8% |
| Elementary School | 1,504 | 18.9% |
| Middle School | 1,438 | 18.1% |
| High School | 1,614 | 20.3% |
| College / Undergraduate | 1,296 | 16.3% |
| Graduate / Professional | 755 | 9.5% |
| Total | 7,943 | 100.0% |
School Enrollment by Age by Funding Source in Shelton
Out of a total of 7,943 students who are enrolled in schools in Shelton, 1,914 (24.1%) attend a private institution, while the remaining 6,029 (75.9%) are enrolled in public schools. The age group of 20 to 24 year olds has the highest likelihood of being enrolled in private schools, with 471 (55.8% in the age bracket) enrolled. Conversely, the age group of 5 to 9 year old has the lowest likelihood of being enrolled in a private school, with 1,635 (92.4% in the age bracket) attending a public institution.
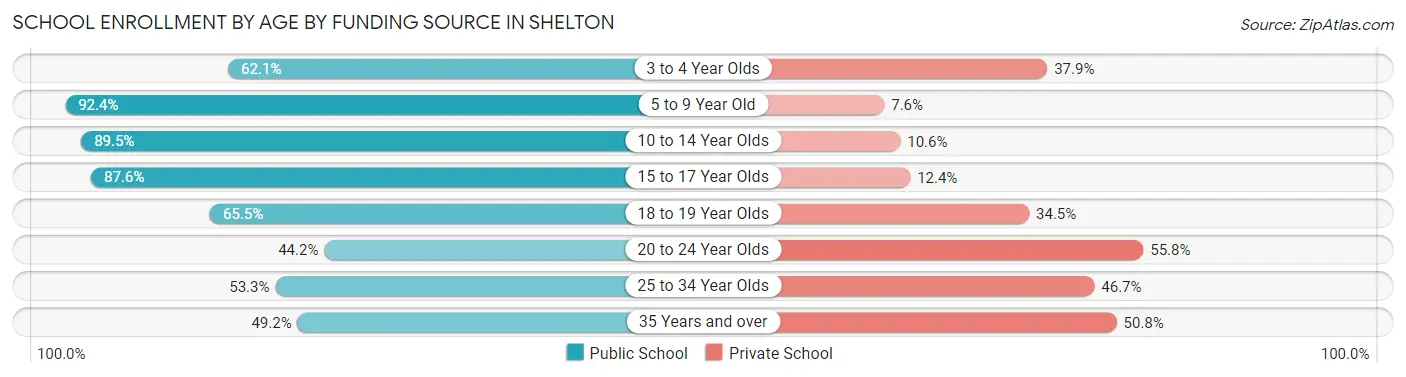
| Age Bracket | Public School | Private School |
| 3 to 4 Year Olds | 578 (62.1%) | 353 (37.9%) |
| 5 to 9 Year Old | 1,635 (92.4%) | 134 (7.6%) |
| 10 to 14 Year Olds | 1,543 (89.4%) | 182 (10.5%) |
| 15 to 17 Year Olds | 1,061 (87.6%) | 150 (12.4%) |
| 18 to 19 Year Olds | 415 (65.5%) | 219 (34.5%) |
| 20 to 24 Year Olds | 373 (44.2%) | 471 (55.8%) |
| 25 to 34 Year Olds | 185 (53.3%) | 162 (46.7%) |
| 35 Years and over | 237 (49.2%) | 245 (50.8%) |
| Total | 6,029 (75.9%) | 1,914 (24.1%) |
Educational Attainment by Field of Study in Shelton
Business (3,198 | 22.4%), science & technology (1,633 | 11.4%), education (1,216 | 8.5%), social sciences (1,186 | 8.3%), and engineering (1,158 | 8.1%) are the most common fields of study among 14,273 individuals in Shelton who have obtained a bachelor's degree or higher.
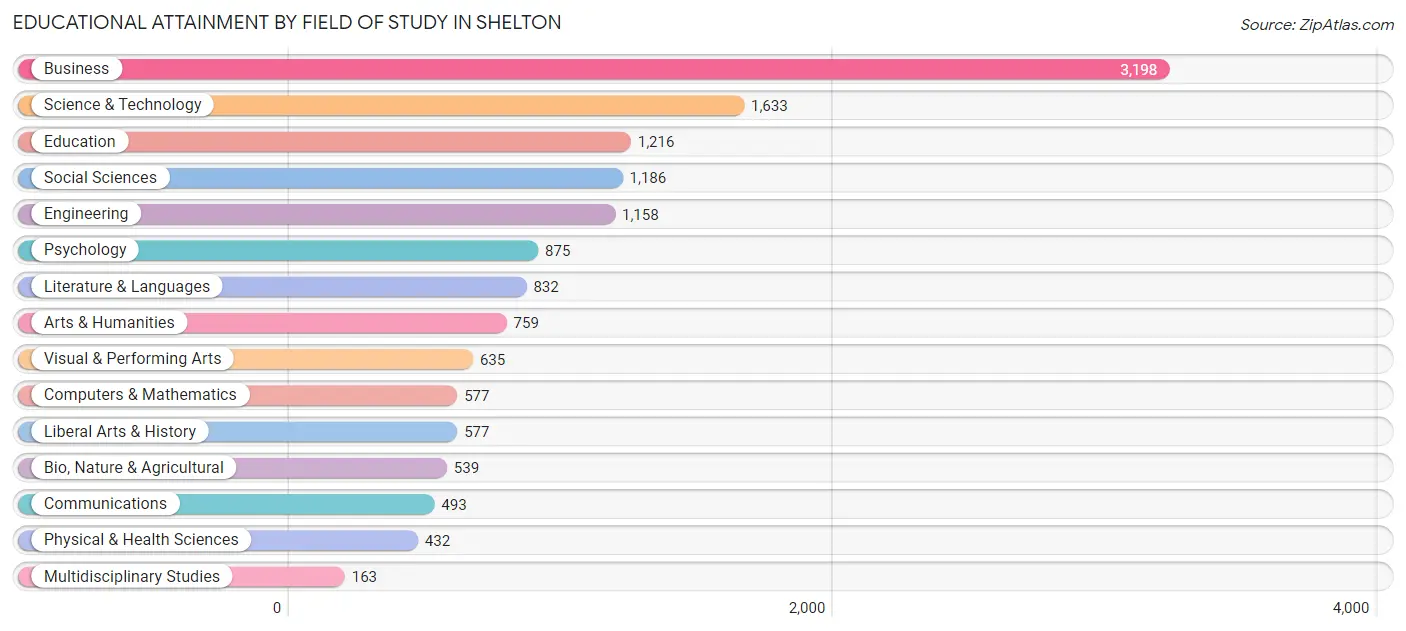
| Field of Study | # Graduates | % Graduates |
| Computers & Mathematics | 577 | 4.0% |
| Bio, Nature & Agricultural | 539 | 3.8% |
| Physical & Health Sciences | 432 | 3.0% |
| Psychology | 875 | 6.1% |
| Social Sciences | 1,186 | 8.3% |
| Engineering | 1,158 | 8.1% |
| Multidisciplinary Studies | 163 | 1.1% |
| Science & Technology | 1,633 | 11.4% |
| Business | 3,198 | 22.4% |
| Education | 1,216 | 8.5% |
| Literature & Languages | 832 | 5.8% |
| Liberal Arts & History | 577 | 4.0% |
| Visual & Performing Arts | 635 | 4.4% |
| Communications | 493 | 3.5% |
| Arts & Humanities | 759 | 5.3% |
| Total | 14,273 | 100.0% |
Transportation & Commute in Shelton
Vehicle Availability by Sex in Shelton
The most prevalent vehicle ownership categories in Shelton are males with 2 vehicles (5,107, accounting for 46.7%) and females with 2 vehicles (4,405, making up 48.8%).
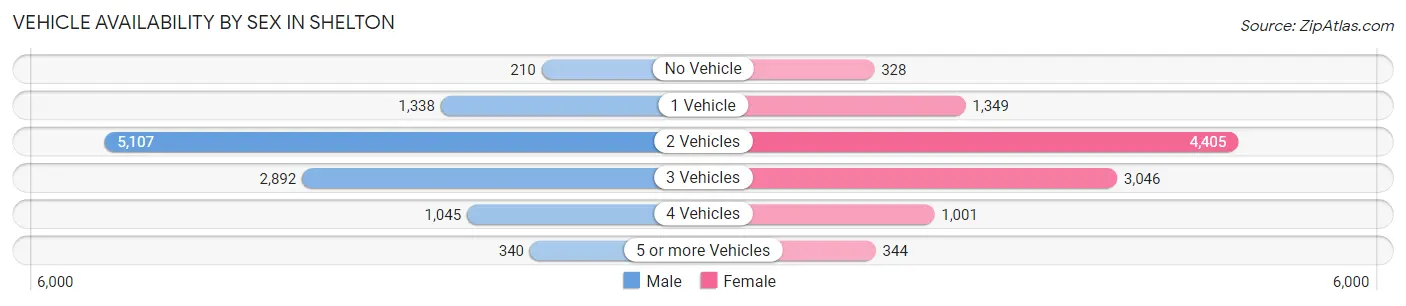
| Vehicles Available | Male | Female |
| No Vehicle | 210 (1.9%) | 328 (3.1%) |
| 1 Vehicle | 1,338 (12.2%) | 1,349 (12.9%) |
| 2 Vehicles | 5,107 (46.7%) | 4,405 (42.1%) |
| 3 Vehicles | 2,892 (26.5%) | 3,046 (29.1%) |
| 4 Vehicles | 1,045 (9.6%) | 1,001 (9.6%) |
| 5 or more Vehicles | 340 (3.1%) | 344 (3.3%) |
| Total | 10,932 (100.0%) | 10,473 (100.0%) |
Commute Time in Shelton
The most frequently occuring commute durations in Shelton are 20 to 24 minutes (3,043 commuters, 16.2%), 15 to 19 minutes (2,942 commuters, 15.7%), and 10 to 14 minutes (2,331 commuters, 12.4%).
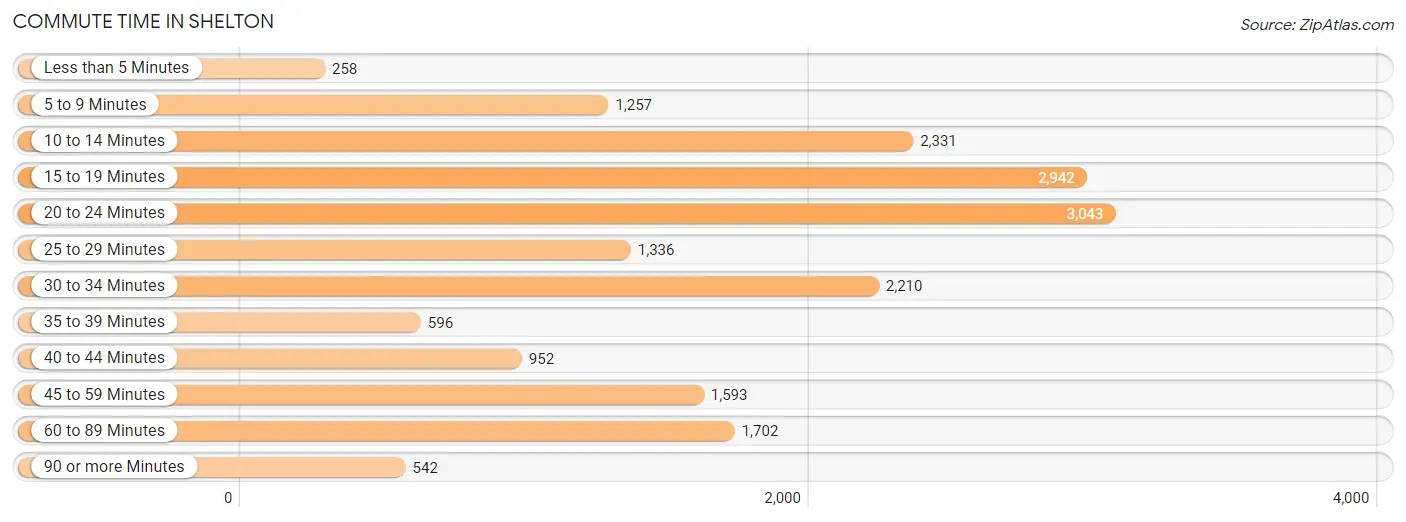
| Commute Time | # Commuters | % Commuters |
| Less than 5 Minutes | 258 | 1.4% |
| 5 to 9 Minutes | 1,257 | 6.7% |
| 10 to 14 Minutes | 2,331 | 12.4% |
| 15 to 19 Minutes | 2,942 | 15.7% |
| 20 to 24 Minutes | 3,043 | 16.2% |
| 25 to 29 Minutes | 1,336 | 7.1% |
| 30 to 34 Minutes | 2,210 | 11.8% |
| 35 to 39 Minutes | 596 | 3.2% |
| 40 to 44 Minutes | 952 | 5.1% |
| 45 to 59 Minutes | 1,593 | 8.5% |
| 60 to 89 Minutes | 1,702 | 9.1% |
| 90 or more Minutes | 542 | 2.9% |
Commute Time by Sex in Shelton
The most common commute times in Shelton are 20 to 24 minutes (1,382 commuters, 14.1%) for males and 20 to 24 minutes (1,661 commuters, 18.6%) for females.
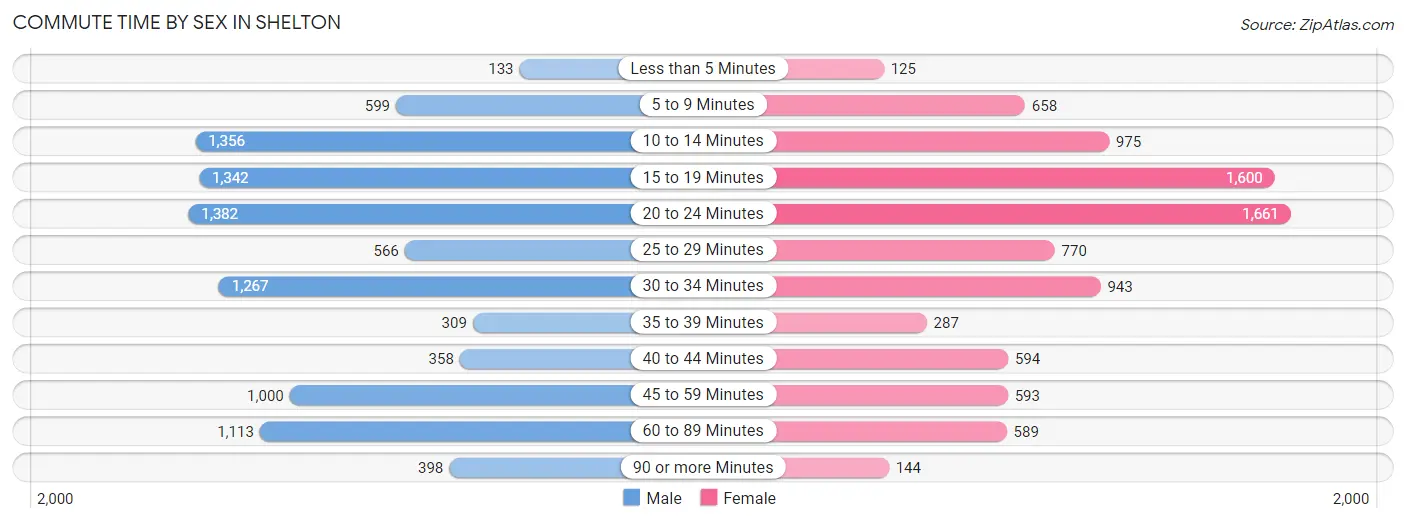
| Commute Time | Male | Female |
| Less than 5 Minutes | 133 (1.3%) | 125 (1.4%) |
| 5 to 9 Minutes | 599 (6.1%) | 658 (7.4%) |
| 10 to 14 Minutes | 1,356 (13.8%) | 975 (10.9%) |
| 15 to 19 Minutes | 1,342 (13.7%) | 1,600 (17.9%) |
| 20 to 24 Minutes | 1,382 (14.1%) | 1,661 (18.6%) |
| 25 to 29 Minutes | 566 (5.8%) | 770 (8.6%) |
| 30 to 34 Minutes | 1,267 (12.9%) | 943 (10.5%) |
| 35 to 39 Minutes | 309 (3.2%) | 287 (3.2%) |
| 40 to 44 Minutes | 358 (3.6%) | 594 (6.7%) |
| 45 to 59 Minutes | 1,000 (10.2%) | 593 (6.6%) |
| 60 to 89 Minutes | 1,113 (11.3%) | 589 (6.6%) |
| 90 or more Minutes | 398 (4.1%) | 144 (1.6%) |
Time of Departure to Work by Sex in Shelton
The most frequent times of departure to work in Shelton are 8:00 AM to 8:29 AM (1,271, 12.9%) for males and 7:30 AM to 7:59 AM (1,250, 14.0%) for females.
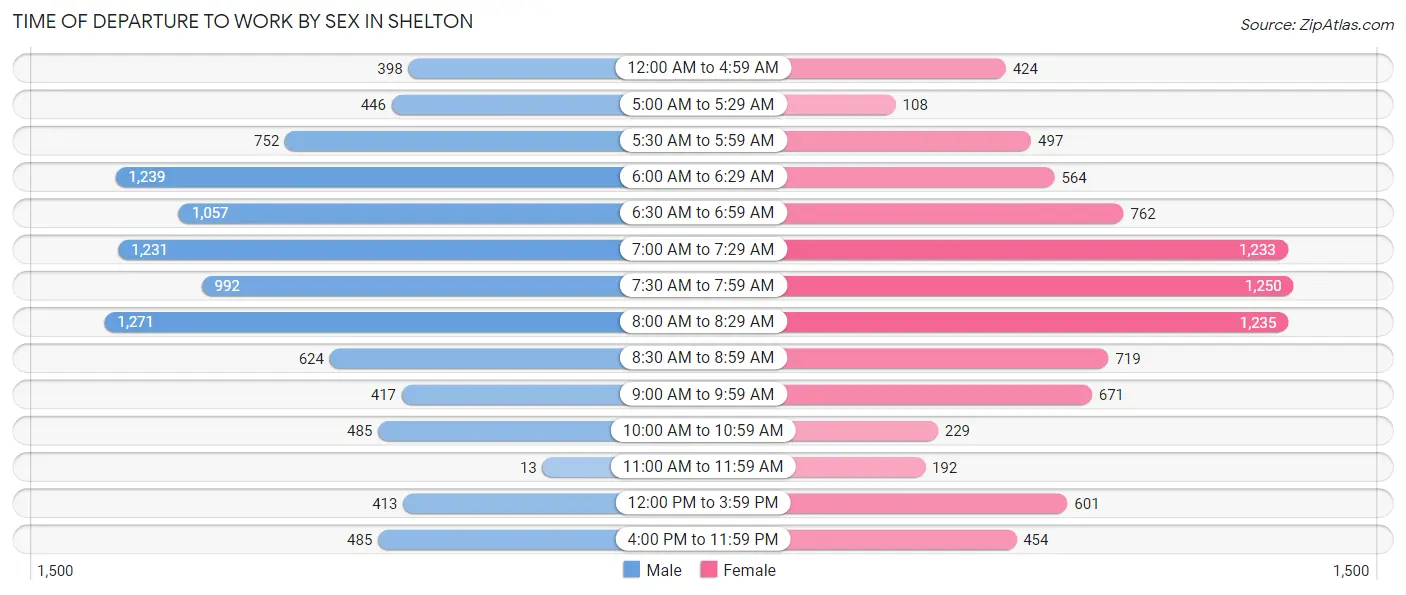
| Time of Departure | Male | Female |
| 12:00 AM to 4:59 AM | 398 (4.1%) | 424 (4.7%) |
| 5:00 AM to 5:29 AM | 446 (4.5%) | 108 (1.2%) |
| 5:30 AM to 5:59 AM | 752 (7.7%) | 497 (5.6%) |
| 6:00 AM to 6:29 AM | 1,239 (12.6%) | 564 (6.3%) |
| 6:30 AM to 6:59 AM | 1,057 (10.8%) | 762 (8.5%) |
| 7:00 AM to 7:29 AM | 1,231 (12.5%) | 1,233 (13.8%) |
| 7:30 AM to 7:59 AM | 992 (10.1%) | 1,250 (14.0%) |
| 8:00 AM to 8:29 AM | 1,271 (12.9%) | 1,235 (13.8%) |
| 8:30 AM to 8:59 AM | 624 (6.4%) | 719 (8.0%) |
| 9:00 AM to 9:59 AM | 417 (4.3%) | 671 (7.5%) |
| 10:00 AM to 10:59 AM | 485 (4.9%) | 229 (2.6%) |
| 11:00 AM to 11:59 AM | 13 (0.1%) | 192 (2.1%) |
| 12:00 PM to 3:59 PM | 413 (4.2%) | 601 (6.7%) |
| 4:00 PM to 11:59 PM | 485 (4.9%) | 454 (5.1%) |
| Total | 9,823 (100.0%) | 8,939 (100.0%) |
Housing Occupancy in Shelton
Occupancy by Ownership in Shelton
Of the total 15,774 dwellings in Shelton, owner-occupied units account for 12,379 (78.5%), while renter-occupied units make up 3,395 (21.5%).
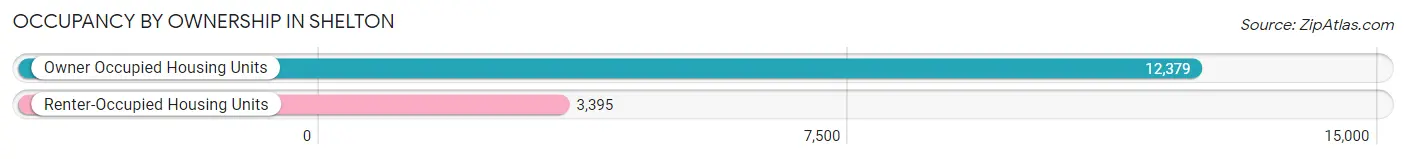
| Occupancy | # Housing Units | % Housing Units |
| Owner Occupied Housing Units | 12,379 | 78.5% |
| Renter-Occupied Housing Units | 3,395 | 21.5% |
| Total Occupied Housing Units | 15,774 | 100.0% |
Occupancy by Household Size in Shelton
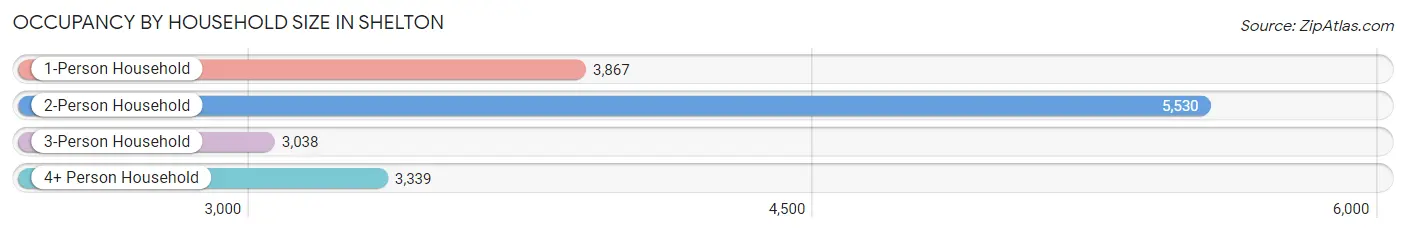
| Household Size | # Housing Units | % Housing Units |
| 1-Person Household | 3,867 | 24.5% |
| 2-Person Household | 5,530 | 35.1% |
| 3-Person Household | 3,038 | 19.3% |
| 4+ Person Household | 3,339 | 21.2% |
| Total Housing Units | 15,774 | 100.0% |
Occupancy by Ownership by Household Size in Shelton
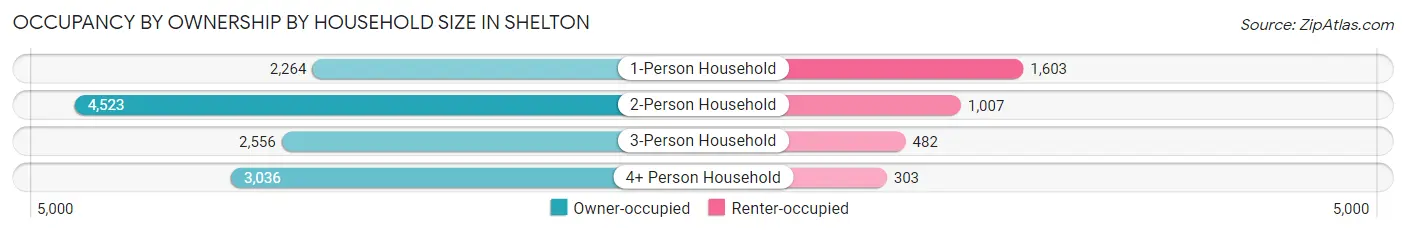
| Household Size | Owner-occupied | Renter-occupied |
| 1-Person Household | 2,264 (58.6%) | 1,603 (41.4%) |
| 2-Person Household | 4,523 (81.8%) | 1,007 (18.2%) |
| 3-Person Household | 2,556 (84.1%) | 482 (15.9%) |
| 4+ Person Household | 3,036 (90.9%) | 303 (9.1%) |
| Total Housing Units | 12,379 (78.5%) | 3,395 (21.5%) |
Occupancy by Educational Attainment in Shelton
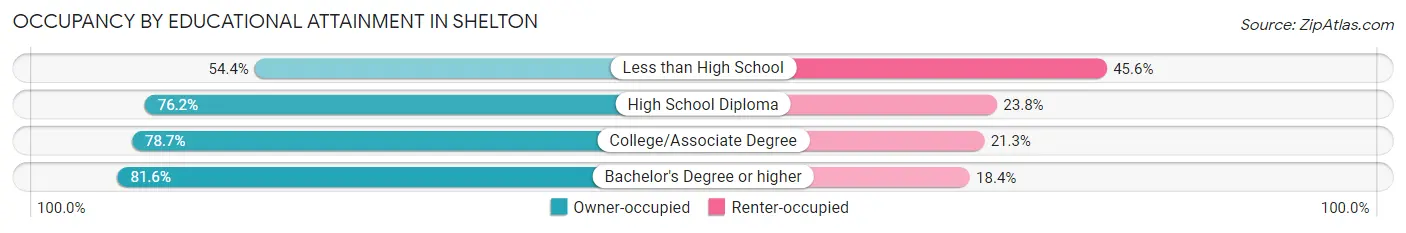
| Household Size | Owner-occupied | Renter-occupied |
| Less than High School | 378 (54.4%) | 317 (45.6%) |
| High School Diploma | 2,556 (76.2%) | 800 (23.8%) |
| College/Associate Degree | 3,173 (78.7%) | 860 (21.3%) |
| Bachelor's Degree or higher | 6,272 (81.6%) | 1,418 (18.4%) |
Occupancy by Age of Householder in Shelton
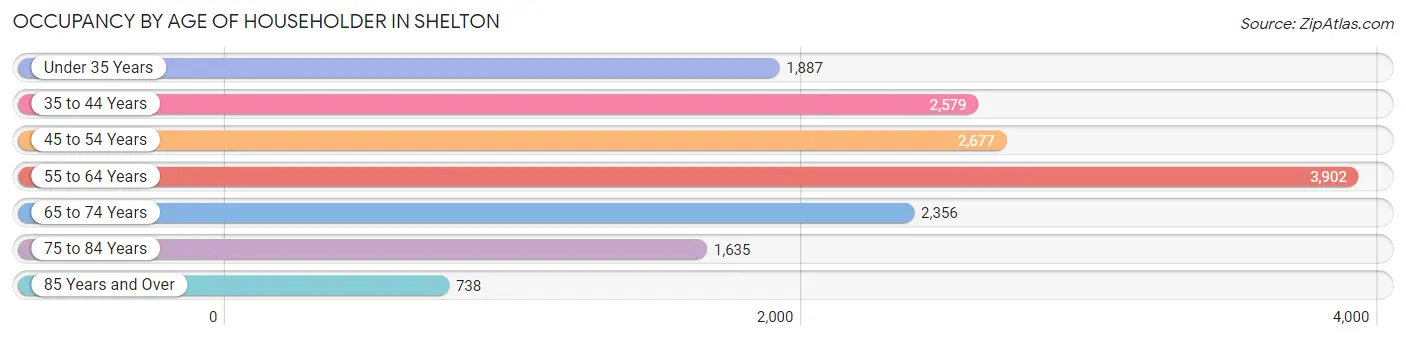
| Age Bracket | # Households | % Households |
| Under 35 Years | 1,887 | 12.0% |
| 35 to 44 Years | 2,579 | 16.4% |
| 45 to 54 Years | 2,677 | 17.0% |
| 55 to 64 Years | 3,902 | 24.7% |
| 65 to 74 Years | 2,356 | 14.9% |
| 75 to 84 Years | 1,635 | 10.4% |
| 85 Years and Over | 738 | 4.7% |
| Total | 15,774 | 100.0% |
Housing Finances in Shelton
Median Income by Occupancy in Shelton
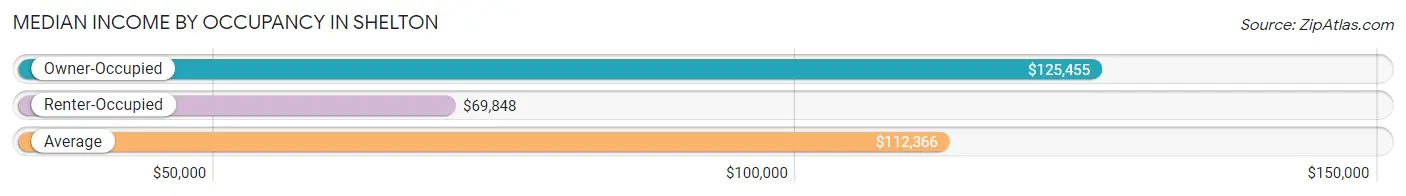
| Occupancy Type | # Households | Median Income |
| Owner-Occupied | 12,379 (78.5%) | $125,455 |
| Renter-Occupied | 3,395 (21.5%) | $69,848 |
| Average | 15,774 (100.0%) | $112,366 |
Occupancy by Householder Income Bracket in Shelton
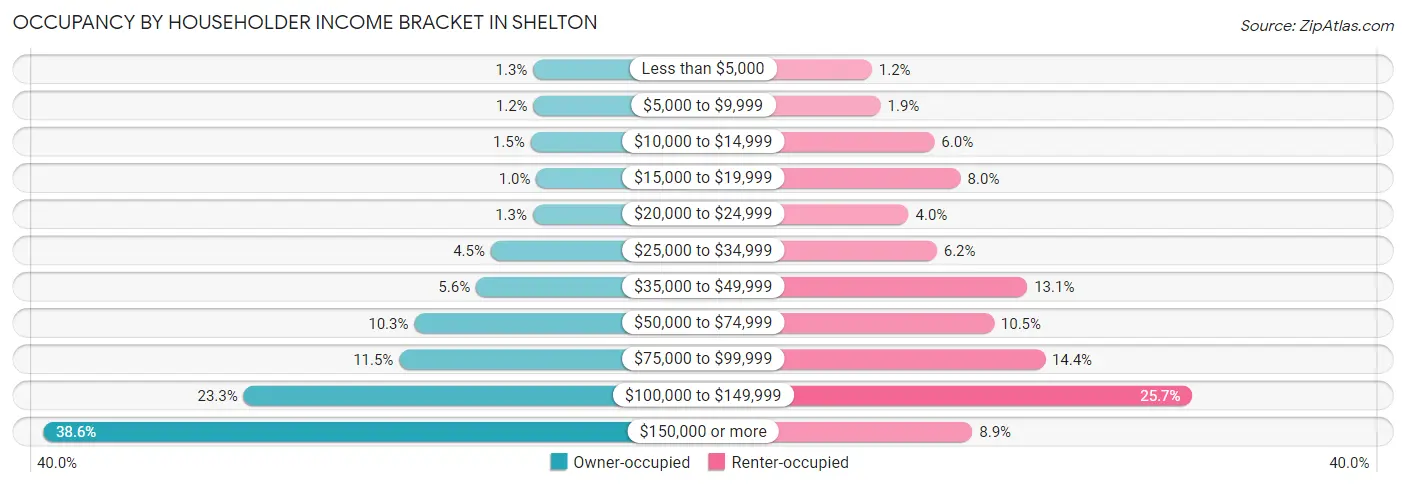
| Income Bracket | Owner-occupied | Renter-occupied |
| Less than $5,000 | 155 (1.3%) | 42 (1.2%) |
| $5,000 to $9,999 | 152 (1.2%) | 65 (1.9%) |
| $10,000 to $14,999 | 180 (1.5%) | 204 (6.0%) |
| $15,000 to $19,999 | 125 (1.0%) | 272 (8.0%) |
| $20,000 to $24,999 | 158 (1.3%) | 137 (4.0%) |
| $25,000 to $34,999 | 555 (4.5%) | 210 (6.2%) |
| $35,000 to $49,999 | 694 (5.6%) | 444 (13.1%) |
| $50,000 to $74,999 | 1,276 (10.3%) | 358 (10.5%) |
| $75,000 to $99,999 | 1,419 (11.5%) | 490 (14.4%) |
| $100,000 to $149,999 | 2,887 (23.3%) | 871 (25.7%) |
| $150,000 or more | 4,778 (38.6%) | 302 (8.9%) |
| Total | 12,379 (100.0%) | 3,395 (100.0%) |
Monthly Housing Cost Tiers in Shelton
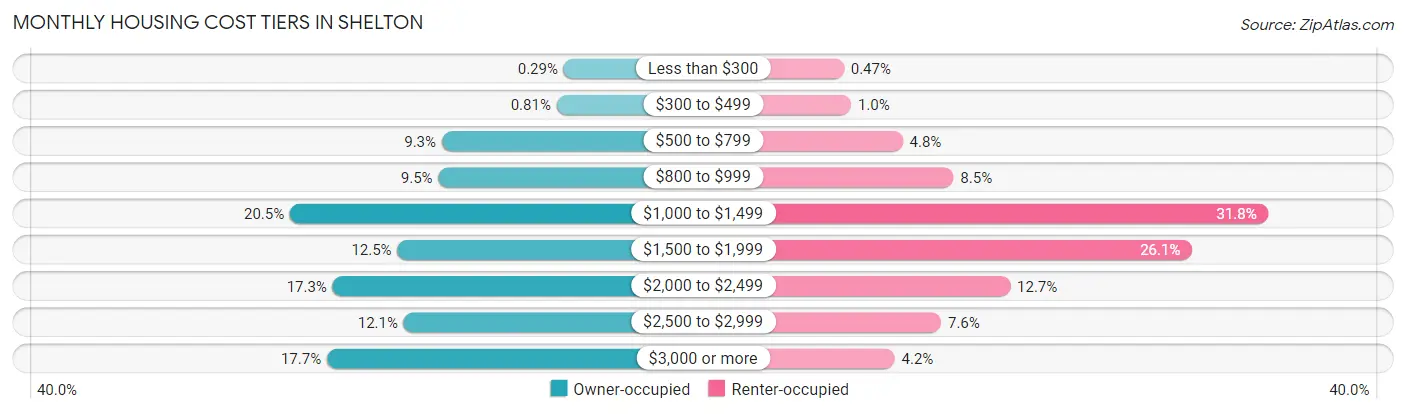
| Monthly Cost | Owner-occupied | Renter-occupied |
| Less than $300 | 36 (0.3%) | 16 (0.5%) |
| $300 to $499 | 100 (0.8%) | 34 (1.0%) |
| $500 to $799 | 1,148 (9.3%) | 163 (4.8%) |
| $800 to $999 | 1,179 (9.5%) | 290 (8.5%) |
| $1,000 to $1,499 | 2,532 (20.4%) | 1,078 (31.8%) |
| $1,500 to $1,999 | 1,552 (12.5%) | 887 (26.1%) |
| $2,000 to $2,499 | 2,143 (17.3%) | 432 (12.7%) |
| $2,500 to $2,999 | 1,494 (12.1%) | 259 (7.6%) |
| $3,000 or more | 2,195 (17.7%) | 143 (4.2%) |
| Total | 12,379 (100.0%) | 3,395 (100.0%) |
Physical Housing Characteristics in Shelton
Housing Structures in Shelton
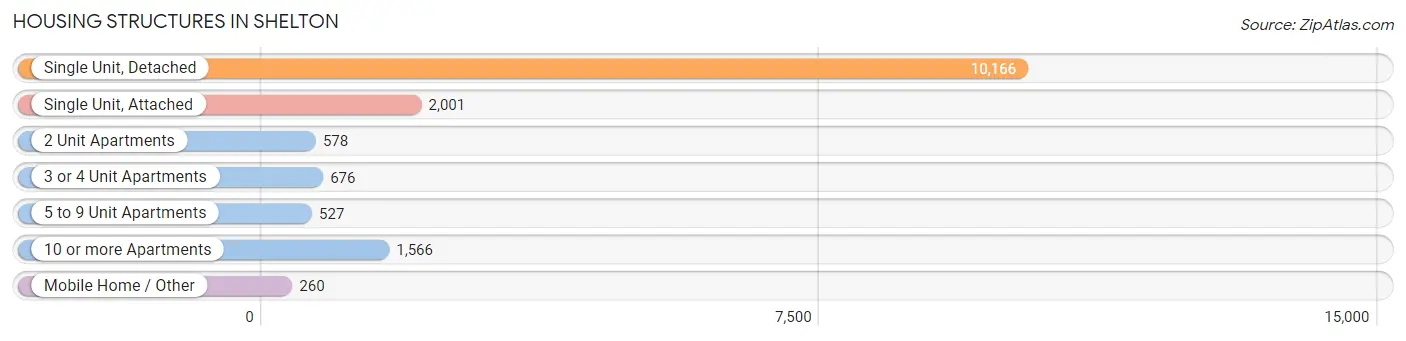
| Structure Type | # Housing Units | % Housing Units |
| Single Unit, Detached | 10,166 | 64.4% |
| Single Unit, Attached | 2,001 | 12.7% |
| 2 Unit Apartments | 578 | 3.7% |
| 3 or 4 Unit Apartments | 676 | 4.3% |
| 5 to 9 Unit Apartments | 527 | 3.3% |
| 10 or more Apartments | 1,566 | 9.9% |
| Mobile Home / Other | 260 | 1.7% |
| Total | 15,774 | 100.0% |
Housing Structures by Occupancy in Shelton
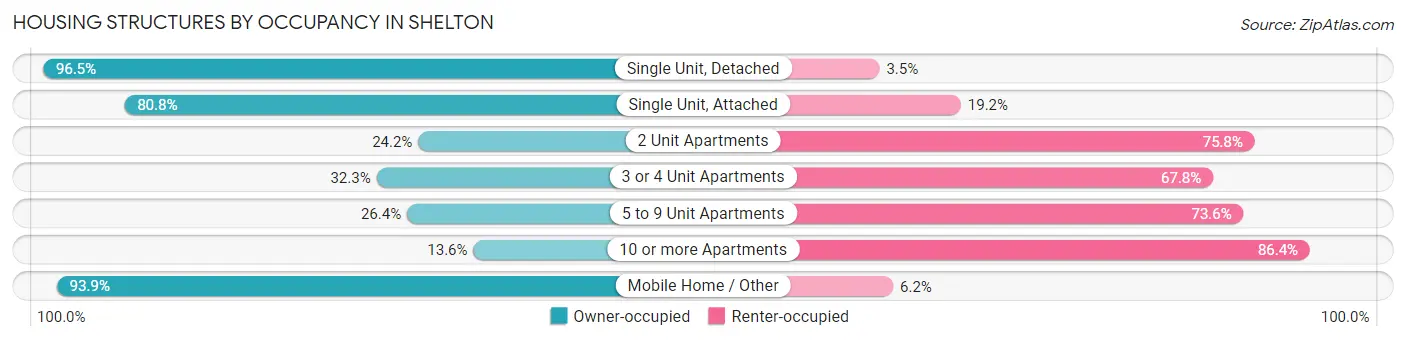
| Structure Type | Owner-occupied | Renter-occupied |
| Single Unit, Detached | 9,808 (96.5%) | 358 (3.5%) |
| Single Unit, Attached | 1,617 (80.8%) | 384 (19.2%) |
| 2 Unit Apartments | 140 (24.2%) | 438 (75.8%) |
| 3 or 4 Unit Apartments | 218 (32.3%) | 458 (67.7%) |
| 5 to 9 Unit Apartments | 139 (26.4%) | 388 (73.6%) |
| 10 or more Apartments | 213 (13.6%) | 1,353 (86.4%) |
| Mobile Home / Other | 244 (93.9%) | 16 (6.1%) |
| Total | 12,379 (78.5%) | 3,395 (21.5%) |
Housing Structures by Number of Rooms in Shelton
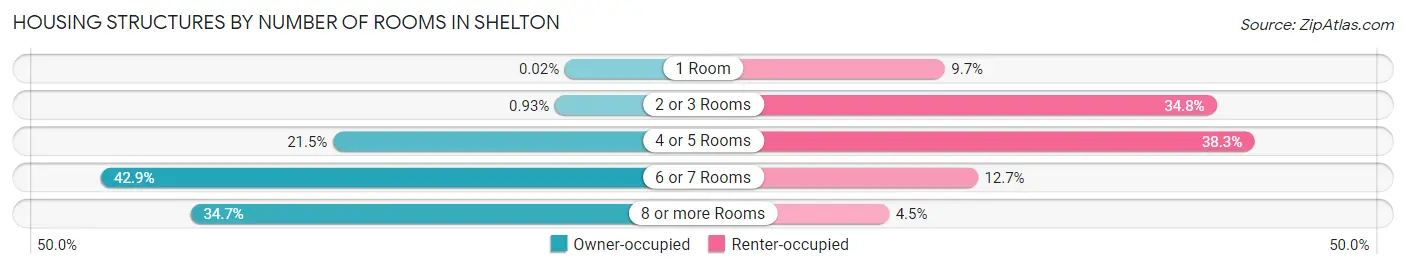
| Number of Rooms | Owner-occupied | Renter-occupied |
| 1 Room | 2 (0.0%) | 328 (9.7%) |
| 2 or 3 Rooms | 115 (0.9%) | 1,182 (34.8%) |
| 4 or 5 Rooms | 2,657 (21.5%) | 1,300 (38.3%) |
| 6 or 7 Rooms | 5,314 (42.9%) | 432 (12.7%) |
| 8 or more Rooms | 4,291 (34.7%) | 153 (4.5%) |
| Total | 12,379 (100.0%) | 3,395 (100.0%) |
Housing Structure by Heating Type in Shelton
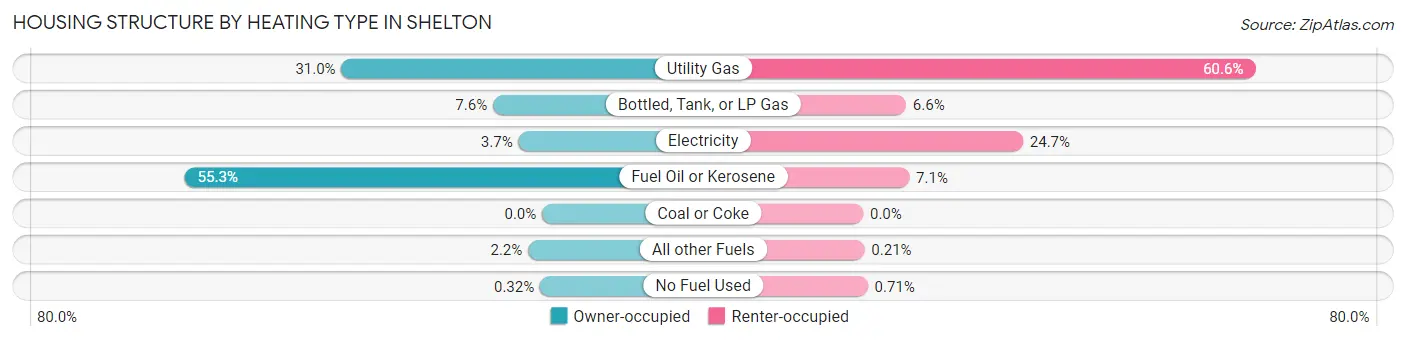
| Heating Type | Owner-occupied | Renter-occupied |
| Utility Gas | 3,840 (31.0%) | 2,058 (60.6%) |
| Bottled, Tank, or LP Gas | 940 (7.6%) | 225 (6.6%) |
| Electricity | 452 (3.6%) | 839 (24.7%) |
| Fuel Oil or Kerosene | 6,839 (55.2%) | 242 (7.1%) |
| Coal or Coke | 0 (0.0%) | 0 (0.0%) |
| All other Fuels | 268 (2.2%) | 7 (0.2%) |
| No Fuel Used | 40 (0.3%) | 24 (0.7%) |
| Total | 12,379 (100.0%) | 3,395 (100.0%) |
Household Vehicle Usage in Shelton
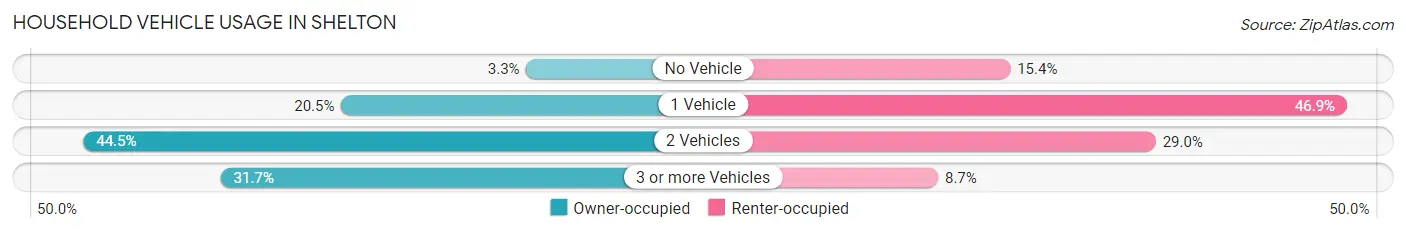
| Vehicles per Household | Owner-occupied | Renter-occupied |
| No Vehicle | 402 (3.3%) | 524 (15.4%) |
| 1 Vehicle | 2,542 (20.5%) | 1,591 (46.9%) |
| 2 Vehicles | 5,511 (44.5%) | 985 (29.0%) |
| 3 or more Vehicles | 3,924 (31.7%) | 295 (8.7%) |
| Total | 12,379 (100.0%) | 3,395 (100.0%) |
Real Estate & Mortgages in Shelton
Real Estate and Mortgage Overview in Shelton
| Characteristic | Without Mortgage | With Mortgage |
| Housing Units | 4,322 | 8,057 |
| Median Property Value | $381,600 | $423,500 |
| Median Household Income | $87,344 | $3,559 |
| Monthly Housing Costs | $992 | $2,182 |
| Real Estate Taxes | $4,942 | $91 |
Property Value by Mortgage Status in Shelton
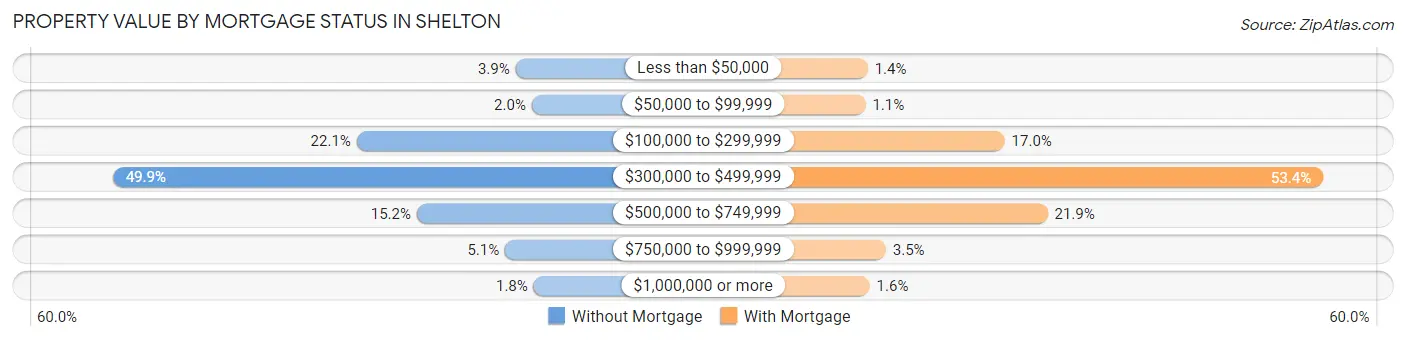
| Property Value | Without Mortgage | With Mortgage |
| Less than $50,000 | 168 (3.9%) | 112 (1.4%) |
| $50,000 to $99,999 | 88 (2.0%) | 91 (1.1%) |
| $100,000 to $299,999 | 953 (22.1%) | 1,373 (17.0%) |
| $300,000 to $499,999 | 2,158 (49.9%) | 4,304 (53.4%) |
| $500,000 to $749,999 | 656 (15.2%) | 1,768 (21.9%) |
| $750,000 to $999,999 | 220 (5.1%) | 279 (3.5%) |
| $1,000,000 or more | 79 (1.8%) | 130 (1.6%) |
| Total | 4,322 (100.0%) | 8,057 (100.0%) |
Household Income by Mortgage Status in Shelton
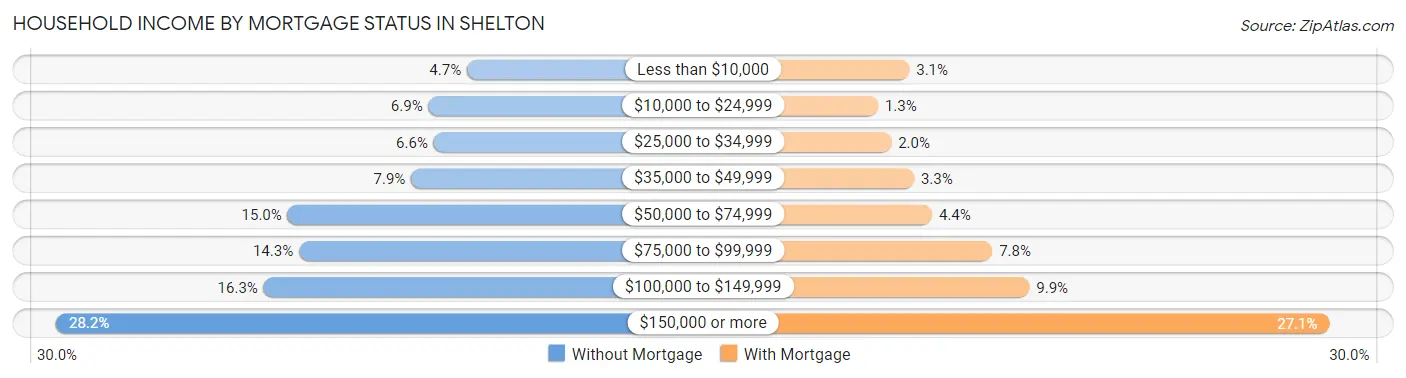
| Household Income | Without Mortgage | With Mortgage |
| Less than $10,000 | 204 (4.7%) | 247 (3.1%) |
| $10,000 to $24,999 | 299 (6.9%) | 103 (1.3%) |
| $25,000 to $34,999 | 286 (6.6%) | 164 (2.0%) |
| $35,000 to $49,999 | 342 (7.9%) | 269 (3.3%) |
| $50,000 to $74,999 | 647 (15.0%) | 352 (4.4%) |
| $75,000 to $99,999 | 619 (14.3%) | 629 (7.8%) |
| $100,000 to $149,999 | 706 (16.3%) | 800 (9.9%) |
| $150,000 or more | 1,219 (28.2%) | 2,181 (27.1%) |
| Total | 4,322 (100.0%) | 8,057 (100.0%) |
Property Value to Household Income Ratio in Shelton
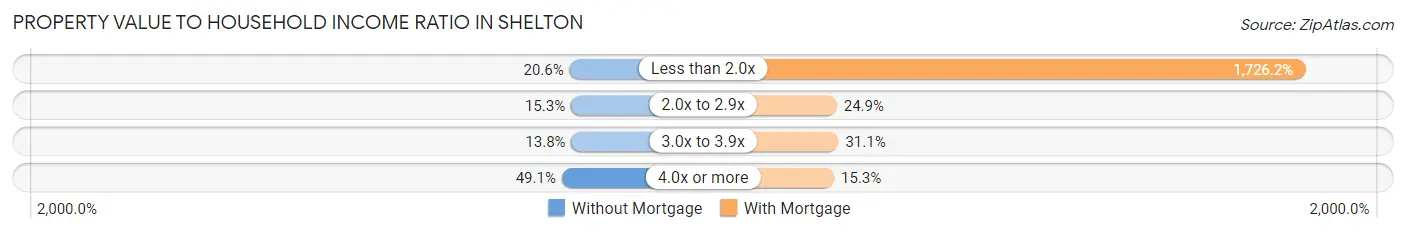
| Value-to-Income Ratio | Without Mortgage | With Mortgage |
| Less than 2.0x | 891 (20.6%) | 139,077 (1,726.2%) |
| 2.0x to 2.9x | 663 (15.3%) | 2,002 (24.8%) |
| 3.0x to 3.9x | 595 (13.8%) | 2,505 (31.1%) |
| 4.0x or more | 2,120 (49.0%) | 1,233 (15.3%) |
| Total | 4,322 (100.0%) | 8,057 (100.0%) |
Real Estate Taxes by Mortgage Status in Shelton
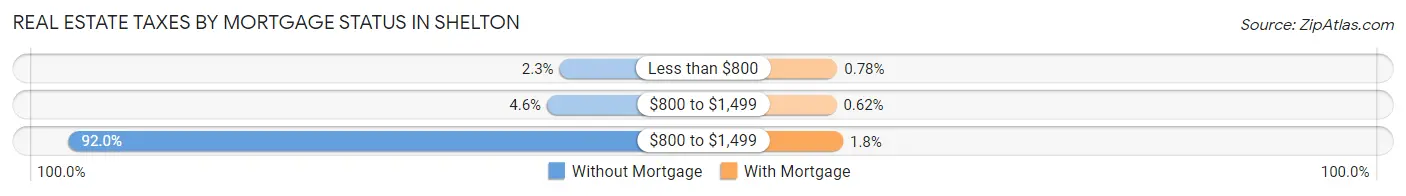
| Property Taxes | Without Mortgage | With Mortgage |
| Less than $800 | 100 (2.3%) | 63 (0.8%) |
| $800 to $1,499 | 199 (4.6%) | 50 (0.6%) |
| $800 to $1,499 | 3,974 (91.9%) | 147 (1.8%) |
| Total | 4,322 (100.0%) | 8,057 (100.0%) |
Health & Disability in Shelton
Health Insurance Coverage by Age in Shelton
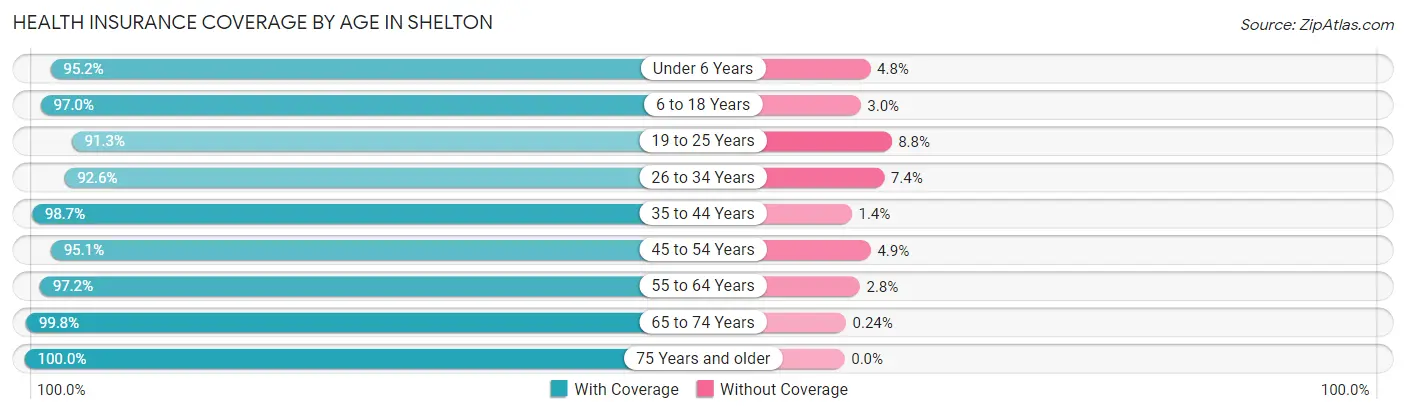
| Age Bracket | With Coverage | Without Coverage |
| Under 6 Years | 2,888 (95.2%) | 146 (4.8%) |
| 6 to 18 Years | 4,665 (97.0%) | 144 (3.0%) |
| 19 to 25 Years | 2,586 (91.2%) | 248 (8.7%) |
| 26 to 34 Years | 4,389 (92.6%) | 350 (7.4%) |
| 35 to 44 Years | 5,280 (98.7%) | 72 (1.3%) |
| 45 to 54 Years | 5,068 (95.1%) | 260 (4.9%) |
| 55 to 64 Years | 6,505 (97.2%) | 190 (2.8%) |
| 65 to 74 Years | 4,109 (99.8%) | 10 (0.2%) |
| 75 Years and older | 3,743 (100.0%) | 0 (0.0%) |
| Total | 39,233 (96.5%) | 1,420 (3.5%) |
Health Insurance Coverage by Citizenship Status in Shelton
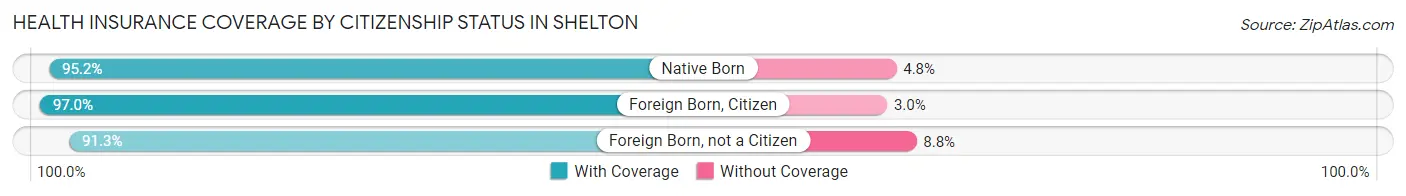
| Citizenship Status | With Coverage | Without Coverage |
| Native Born | 2,888 (95.2%) | 146 (4.8%) |
| Foreign Born, Citizen | 4,665 (97.0%) | 144 (3.0%) |
| Foreign Born, not a Citizen | 2,586 (91.2%) | 248 (8.7%) |
Health Insurance Coverage by Household Income in Shelton
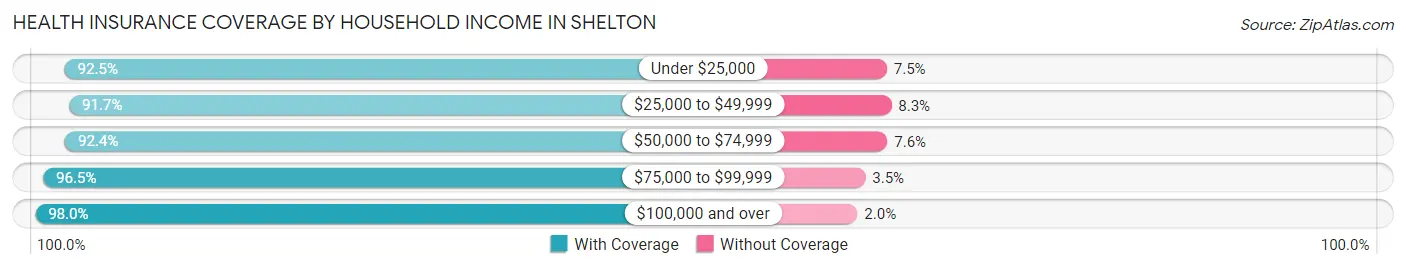
| Household Income | With Coverage | Without Coverage |
| Under $25,000 | 1,997 (92.5%) | 162 (7.5%) |
| $25,000 to $49,999 | 3,374 (91.7%) | 307 (8.3%) |
| $50,000 to $74,999 | 3,140 (92.4%) | 258 (7.6%) |
| $75,000 to $99,999 | 4,567 (96.5%) | 164 (3.5%) |
| $100,000 and over | 26,082 (98.0%) | 529 (2.0%) |
Public vs Private Health Insurance Coverage by Age in Shelton
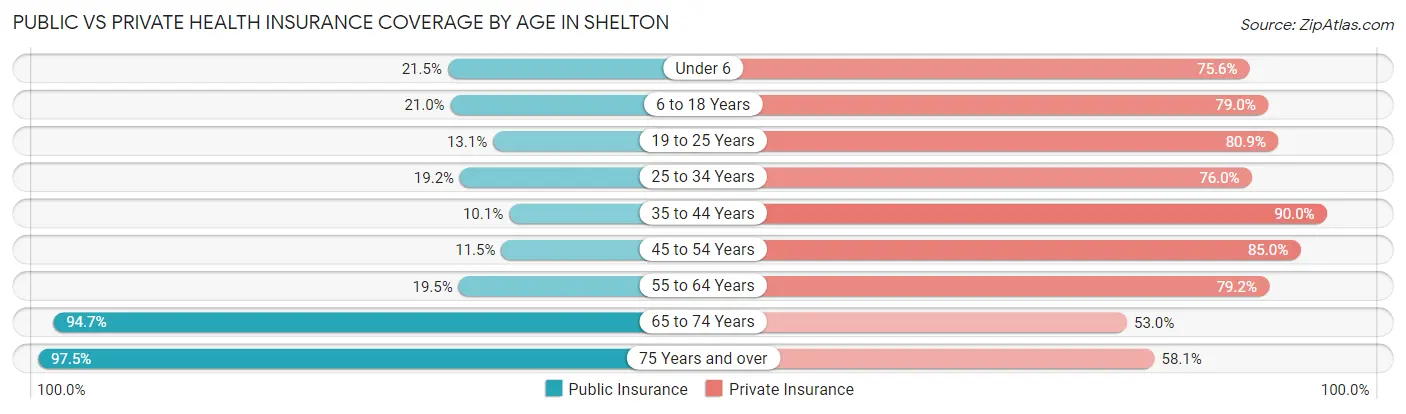
| Age Bracket | Public Insurance | Private Insurance |
| Under 6 | 651 (21.5%) | 2,295 (75.6%) |
| 6 to 18 Years | 1,008 (21.0%) | 3,801 (79.0%) |
| 19 to 25 Years | 370 (13.1%) | 2,293 (80.9%) |
| 25 to 34 Years | 910 (19.2%) | 3,603 (76.0%) |
| 35 to 44 Years | 540 (10.1%) | 4,814 (89.9%) |
| 45 to 54 Years | 614 (11.5%) | 4,531 (85.0%) |
| 55 to 64 Years | 1,302 (19.5%) | 5,305 (79.2%) |
| 65 to 74 Years | 3,900 (94.7%) | 2,181 (52.9%) |
| 75 Years and over | 3,650 (97.5%) | 2,173 (58.1%) |
| Total | 12,945 (31.8%) | 30,996 (76.2%) |
Disability Status by Sex by Age in Shelton
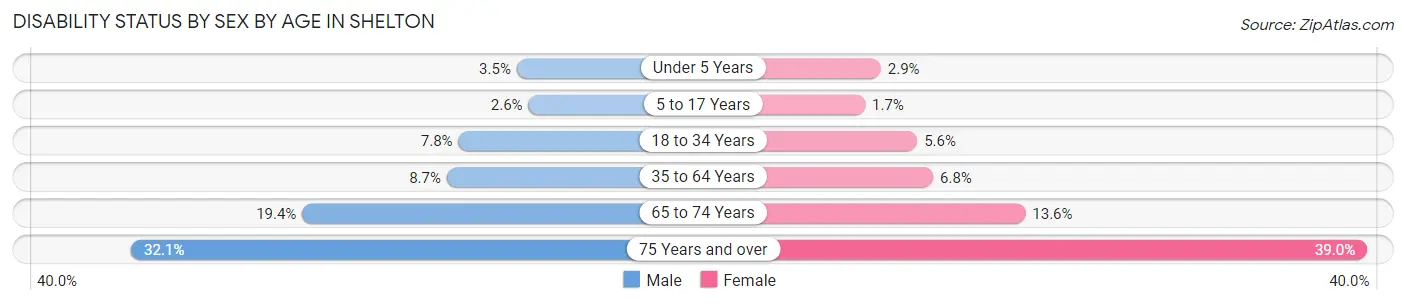
| Age Bracket | Male | Female |
| Under 5 Years | 43 (3.5%) | 41 (2.9%) |
| 5 to 17 Years | 59 (2.6%) | 44 (1.7%) |
| 18 to 34 Years | 306 (7.8%) | 225 (5.6%) |
| 35 to 64 Years | 728 (8.6%) | 608 (6.8%) |
| 65 to 74 Years | 366 (19.4%) | 304 (13.6%) |
| 75 Years and over | 499 (32.1%) | 853 (39.0%) |
Disability Class by Sex by Age in Shelton
Disability Class: Hearing Difficulty
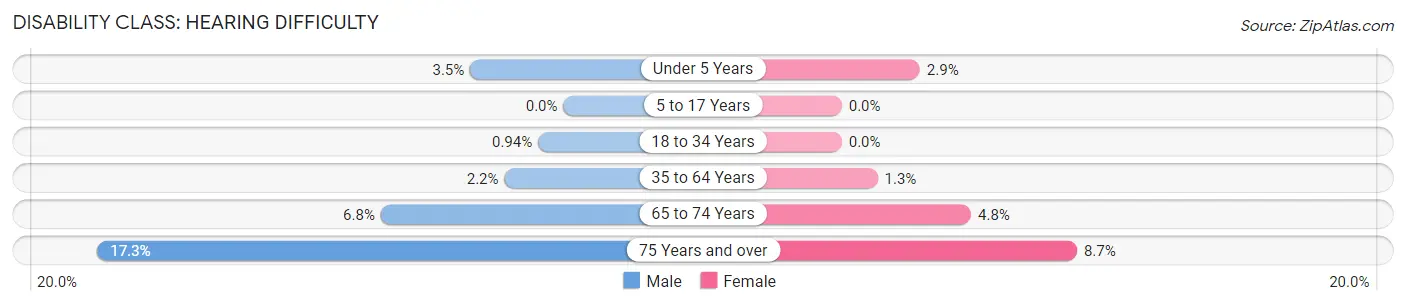
| Age Bracket | Male | Female |
| Under 5 Years | 43 (3.5%) | 41 (2.9%) |
| 5 to 17 Years | 0 (0.0%) | 0 (0.0%) |
| 18 to 34 Years | 37 (0.9%) | 0 (0.0%) |
| 35 to 64 Years | 184 (2.2%) | 119 (1.3%) |
| 65 to 74 Years | 128 (6.8%) | 107 (4.8%) |
| 75 Years and over | 269 (17.3%) | 191 (8.7%) |
Disability Class: Vision Difficulty
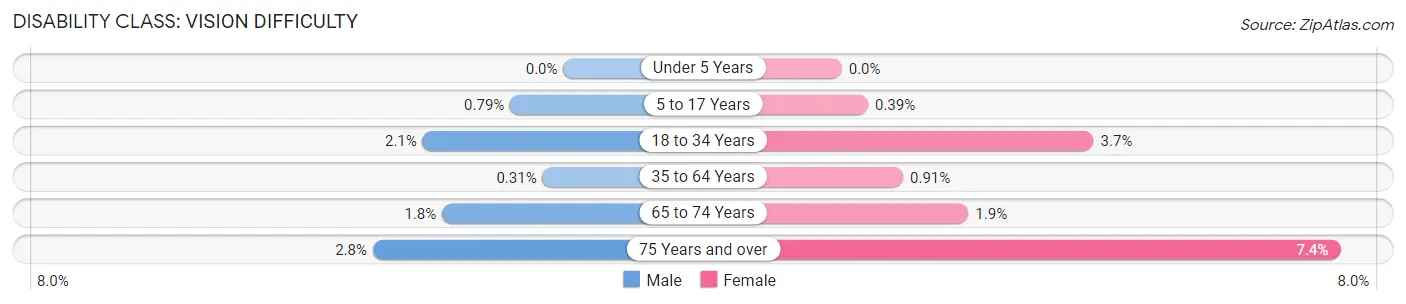
| Age Bracket | Male | Female |
| Under 5 Years | 0 (0.0%) | 0 (0.0%) |
| 5 to 17 Years | 18 (0.8%) | 10 (0.4%) |
| 18 to 34 Years | 82 (2.1%) | 150 (3.7%) |
| 35 to 64 Years | 26 (0.3%) | 82 (0.9%) |
| 65 to 74 Years | 34 (1.8%) | 42 (1.9%) |
| 75 Years and over | 44 (2.8%) | 162 (7.4%) |
Disability Class: Cognitive Difficulty
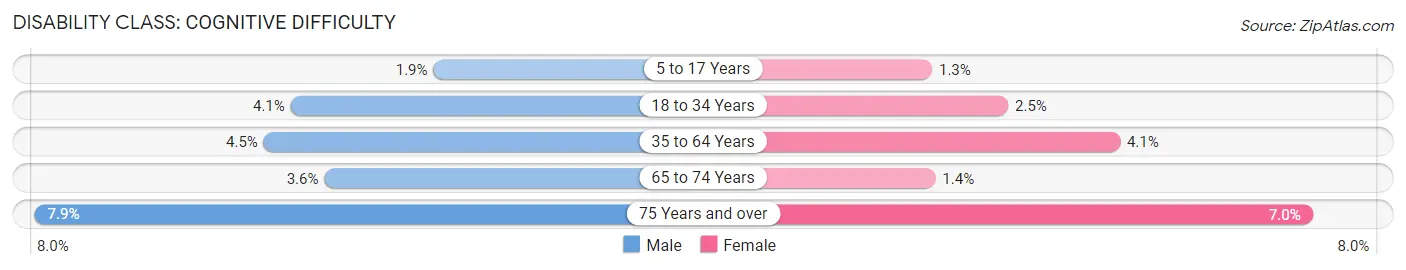
| Age Bracket | Male | Female |
| 5 to 17 Years | 44 (1.9%) | 34 (1.3%) |
| 18 to 34 Years | 159 (4.1%) | 99 (2.5%) |
| 35 to 64 Years | 374 (4.4%) | 370 (4.1%) |
| 65 to 74 Years | 67 (3.5%) | 31 (1.4%) |
| 75 Years and over | 122 (7.9%) | 153 (7.0%) |
Disability Class: Ambulatory Difficulty
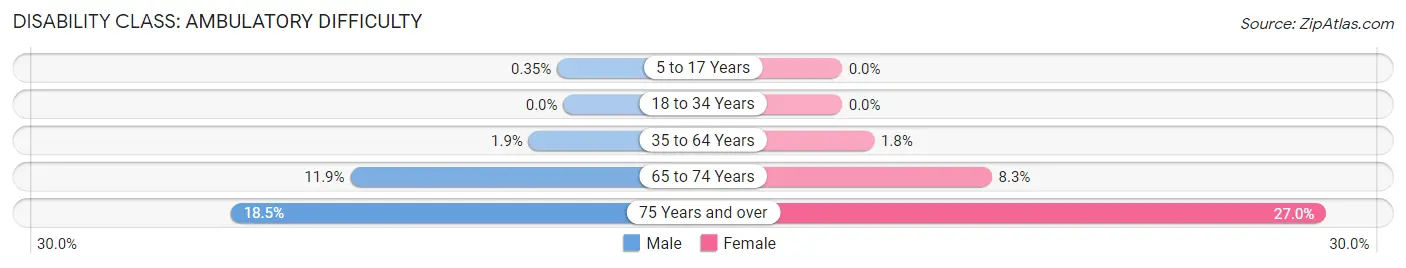
| Age Bracket | Male | Female |
| 5 to 17 Years | 8 (0.4%) | 0 (0.0%) |
| 18 to 34 Years | 0 (0.0%) | 0 (0.0%) |
| 35 to 64 Years | 162 (1.9%) | 160 (1.8%) |
| 65 to 74 Years | 224 (11.9%) | 186 (8.3%) |
| 75 Years and over | 288 (18.5%) | 590 (27.0%) |
Disability Class: Self-Care Difficulty
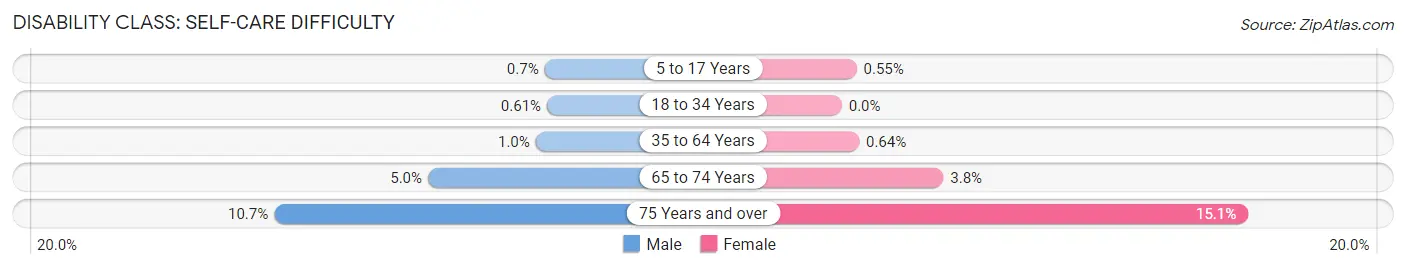
| Age Bracket | Male | Female |
| 5 to 17 Years | 16 (0.7%) | 14 (0.5%) |
| 18 to 34 Years | 24 (0.6%) | 0 (0.0%) |
| 35 to 64 Years | 87 (1.0%) | 57 (0.6%) |
| 65 to 74 Years | 95 (5.0%) | 84 (3.8%) |
| 75 Years and over | 167 (10.7%) | 330 (15.1%) |
Technology Access in Shelton
Computing Device Access in Shelton
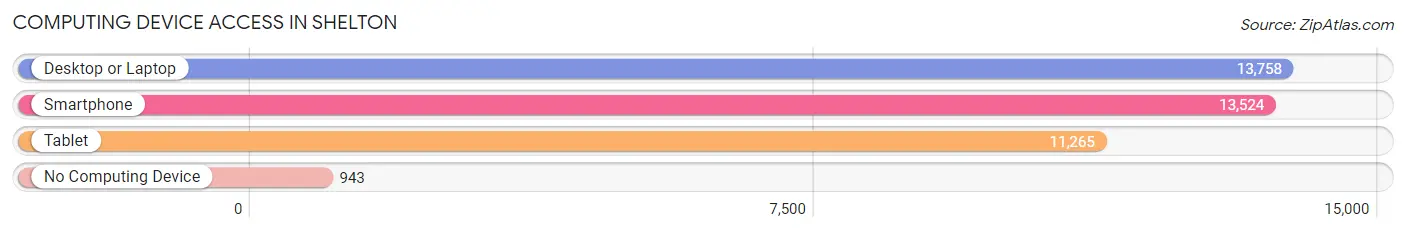
| Device Type | # Households | % Households |
| Desktop or Laptop | 13,758 | 87.2% |
| Smartphone | 13,524 | 85.7% |
| Tablet | 11,265 | 71.4% |
| No Computing Device | 943 | 6.0% |
| Total | 15,774 | 100.0% |
Internet Access in Shelton
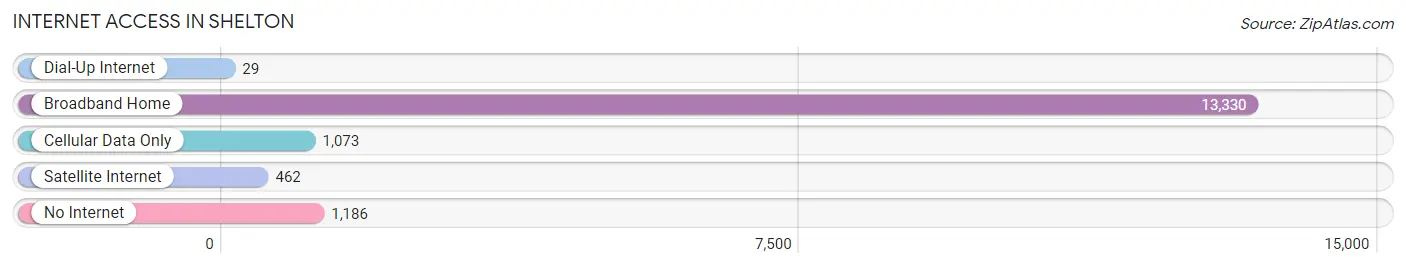
| Internet Type | # Households | % Households |
| Dial-Up Internet | 29 | 0.2% |
| Broadband Home | 13,330 | 84.5% |
| Cellular Data Only | 1,073 | 6.8% |
| Satellite Internet | 462 | 2.9% |
| No Internet | 1,186 | 7.5% |
| Total | 15,774 | 100.0% |
Shelton Summary
Shelton, Connecticut is a city located in Fairfield County, Connecticut, United States. It is situated in the southwestern part of the state, along the Housatonic River. The city has a population of approximately 40,000 people, making it the third largest city in the county.
Geography
Shelton is located in southwestern Connecticut, along the Housatonic River. It is bordered by the towns of Stratford to the east, Monroe to the north, Trumbull to the west, and Derby to the south. The city covers an area of approximately 16.5 square miles, with a population density of 2,400 people per square mile.
The terrain of Shelton is mostly flat, with some rolling hills in the northern and western parts of the city. The highest point in the city is the summit of Pine Hill, which rises to an elevation of 590 feet above sea level. The city is located in the humid continental climate zone, with hot, humid summers and cold, snowy winters.
Economy
Shelton is home to a variety of businesses and industries. The city is home to several large corporations, including Sikorsky Aircraft, PerkinElmer, and Unilever. The city is also home to several smaller businesses, including manufacturing, retail, and service industries.
The city's economy is largely driven by its manufacturing sector, which accounts for approximately 40% of the city's total employment. The city is home to several large manufacturing companies, including Sikorsky Aircraft, PerkinElmer, and Unilever. The city is also home to several smaller manufacturing companies, including medical device manufacturers, food processors, and metal fabricators.
The city's retail sector is also an important part of the local economy. The city is home to several large retail stores, including Walmart, Target, and Home Depot. The city is also home to several smaller retail stores, including clothing stores, specialty shops, and restaurants.
Demographics
As of the 2010 census, Shelton had a population of 39,559 people. The racial makeup of the city was 87.3% White, 4.2% African American, 0.3% Native American, 4.2% Asian, 0.1% Pacific Islander, 1.7% from other races, and 2.4% from two or more races. Hispanic or Latino of any race were 6.3% of the population.
The median household income in Shelton was $76,845 in 2019, and the median family income was $90,945. The per capita income for the city was $37,845. Approximately 8.3% of the population was below the poverty line.
History
Shelton was first settled in 1639 by English settlers. The town was originally part of Stratford, but was incorporated as a separate town in 1789. The town was named after the Shelton family, who were among the first settlers in the area.
In the 19th century, Shelton was an important industrial center, with several factories producing textiles, paper, and other goods. The city was also home to several large farms, which produced a variety of crops.
In the 20th century, Shelton continued to be an important industrial center, with several large corporations setting up operations in the city. The city also experienced a population boom, with the population increasing from 8,000 in 1950 to over 40,000 in 2020.
Today, Shelton is a vibrant city with a diverse economy and a strong sense of community. The city is home to several large corporations, as well as a variety of small businesses. The city is also home to several parks and recreational areas, making it a great place to live and work.
Common Questions
What is Per Capita Income in Shelton?
Per Capita income in Shelton is $54,444.
What is the Median Family Income in Shelton?
Median Family Income in Shelton is $128,756.
What is the Median Household income in Shelton?
Median Household Income in Shelton is $112,366.
What is Income or Wage Gap in Shelton?
Income or Wage Gap in Shelton is 21.6%.
Women in Shelton earn 78.4 cents for every dollar earned by a man.
What is Inequality or Gini Index in Shelton?
Inequality or Gini Index in Shelton is 0.43.
What is the Total Population of Shelton?
Total Population of Shelton is 41,206.
What is the Total Male Population of Shelton?
Total Male Population of Shelton is 19,585.
What is the Total Female Population of Shelton?
Total Female Population of Shelton is 21,621.
What is the Ratio of Males per 100 Females in Shelton?
There are 90.58 Males per 100 Females in Shelton.
What is the Ratio of Females per 100 Males in Shelton?
There are 110.40 Females per 100 Males in Shelton.
What is the Median Population Age in Shelton?
Median Population Age in Shelton is 44.6 Years.
What is the Average Family Size in Shelton
Average Family Size in Shelton is 3.1 People.
What is the Average Household Size in Shelton
Average Household Size in Shelton is 2.6 People.
How Large is the Labor Force in Shelton?
There are 22,965 People in the Labor Forcein in Shelton.
What is the Percentage of People in the Labor Force in Shelton?
66.3% of People are in the Labor Force in Shelton.
What is the Unemployment Rate in Shelton?
Unemployment Rate in Shelton is 5.5%.