Waterford, CT Map & Demographics
Waterford Map
Waterford Overview
$41,727
PER CAPITA INCOME
$100,938
AVG FAMILY INCOME
$74,701
AVG HOUSEHOLD INCOME
25.4%
WAGE / INCOME GAP [ % ]
74.6¢/ $1
WAGE / INCOME GAP [ $ ]
0.40
INEQUALITY / GINI INDEX
3,276
TOTAL POPULATION
1,472
MALE POPULATION
1,804
FEMALE POPULATION
81.60
MALES / 100 FEMALES
122.55
FEMALES / 100 MALES
45.2
MEDIAN AGE
2.9
AVG FAMILY SIZE
2.1
AVG HOUSEHOLD SIZE
1,725
LABOR FORCE [ PEOPLE ]
60.3%
PERCENT IN LABOR FORCE
8.2%
UNEMPLOYMENT RATE
Waterford Zip Codes
Waterford Area Codes
Income in Waterford
Income Overview in Waterford
Per Capita Income in Waterford is $41,727, while median incomes of families and households are $100,938 and $74,701 respectively.
| Characteristic | Number | Measure |
| Per Capita Income | 3,276 | $41,727 |
| Median Family Income | 758 | $100,938 |
| Mean Family Income | 758 | $115,411 |
| Median Household Income | 1,496 | $74,701 |
| Mean Household Income | 1,496 | $89,243 |
| Income Deficit | 758 | $0 |
| Wage / Income Gap (%) | 3,276 | 25.37% |
| Wage / Income Gap ($) | 3,276 | 74.63¢ per $1 |
| Gini / Inequality Index | 3,276 | 0.40 |
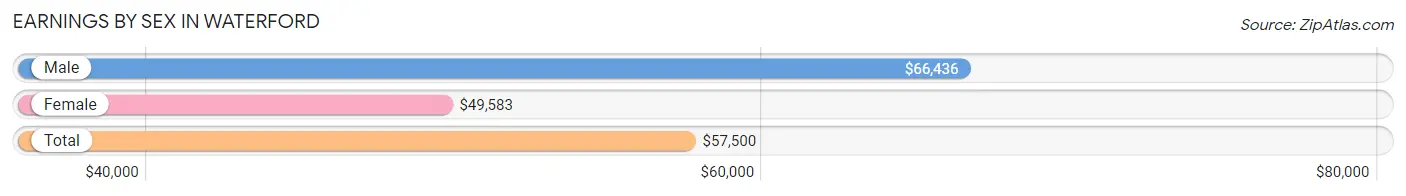
Earnings by Sex in Waterford
Average Earnings in Waterford are $57,500, $66,436 for men and $49,583 for women, a difference of 25.4%.
| Sex | Number | Average Earnings |
| Male | 940 (55.7%) | $66,436 |
| Female | 746 (44.3%) | $49,583 |
| Total | 1,686 (100.0%) | $57,500 |
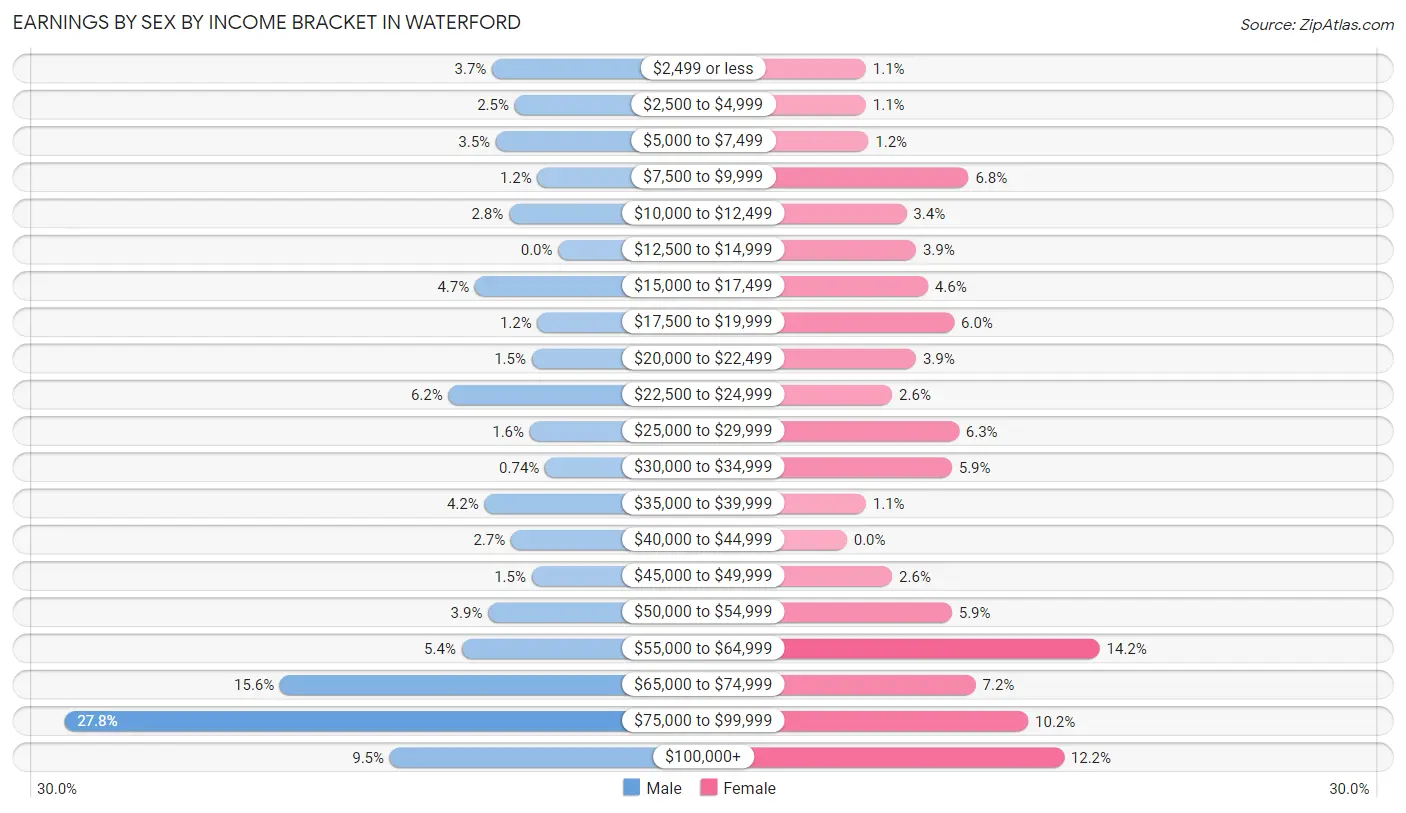
Earnings by Sex by Income Bracket in Waterford
The most common earnings brackets in Waterford are $75,000 to $99,999 for men (261 | 27.8%) and $55,000 to $64,999 for women (106 | 14.2%).
| Income | Male | Female |
| $2,499 or less | 35 (3.7%) | 8 (1.1%) |
| $2,500 to $4,999 | 23 (2.5%) | 8 (1.1%) |
| $5,000 to $7,499 | 33 (3.5%) | 9 (1.2%) |
| $7,500 to $9,999 | 11 (1.2%) | 51 (6.8%) |
| $10,000 to $12,499 | 26 (2.8%) | 25 (3.4%) |
| $12,500 to $14,999 | 0 (0.0%) | 29 (3.9%) |
| $15,000 to $17,499 | 44 (4.7%) | 34 (4.6%) |
| $17,500 to $19,999 | 11 (1.2%) | 45 (6.0%) |
| $20,000 to $22,499 | 14 (1.5%) | 29 (3.9%) |
| $22,500 to $24,999 | 58 (6.2%) | 19 (2.5%) |
| $25,000 to $29,999 | 15 (1.6%) | 47 (6.3%) |
| $30,000 to $34,999 | 7 (0.7%) | 44 (5.9%) |
| $35,000 to $39,999 | 39 (4.2%) | 8 (1.1%) |
| $40,000 to $44,999 | 25 (2.7%) | 0 (0.0%) |
| $45,000 to $49,999 | 14 (1.5%) | 19 (2.5%) |
| $50,000 to $54,999 | 37 (3.9%) | 44 (5.9%) |
| $55,000 to $64,999 | 51 (5.4%) | 106 (14.2%) |
| $65,000 to $74,999 | 147 (15.6%) | 54 (7.2%) |
| $75,000 to $99,999 | 261 (27.8%) | 76 (10.2%) |
| $100,000+ | 89 (9.5%) | 91 (12.2%) |
| Total | 940 (100.0%) | 746 (100.0%) |
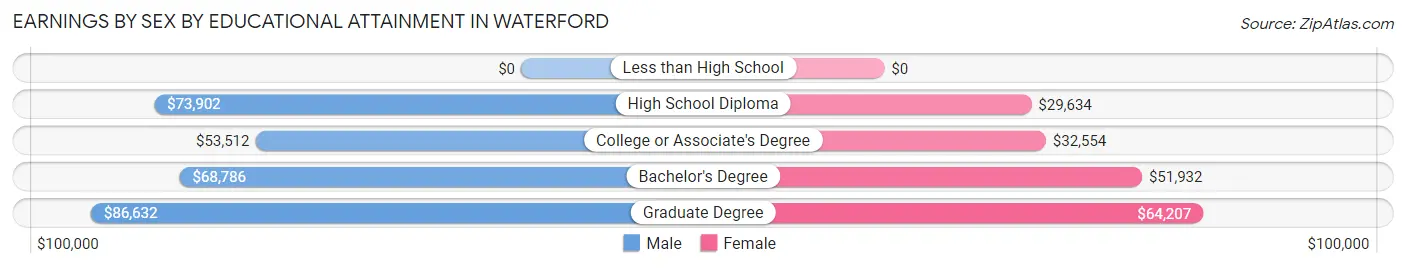
Earnings by Sex by Educational Attainment in Waterford
Average earnings in Waterford are $68,622 for men and $50,710 for women, a difference of 26.1%. Men with an educational attainment of graduate degree enjoy the highest average annual earnings of $86,632, while those with college or associate's degree education earn the least with $53,512. Women with an educational attainment of graduate degree earn the most with the average annual earnings of $64,207, while those with high school diploma education have the smallest earnings of $29,634.
| Educational Attainment | Male Income | Female Income |
| Less than High School | - | - |
| High School Diploma | $73,902 | $29,634 |
| College or Associate's Degree | $53,512 | $32,554 |
| Bachelor's Degree | $68,786 | $51,932 |
| Graduate Degree | $86,632 | $64,207 |
| Total | $68,622 | $50,710 |
Family Income in Waterford
Family Income Brackets in Waterford
According to the Waterford family income data, there are 206 families falling into the $100,000 to $149,999 income range, which is the most common income bracket and makes up 27.2% of all families.
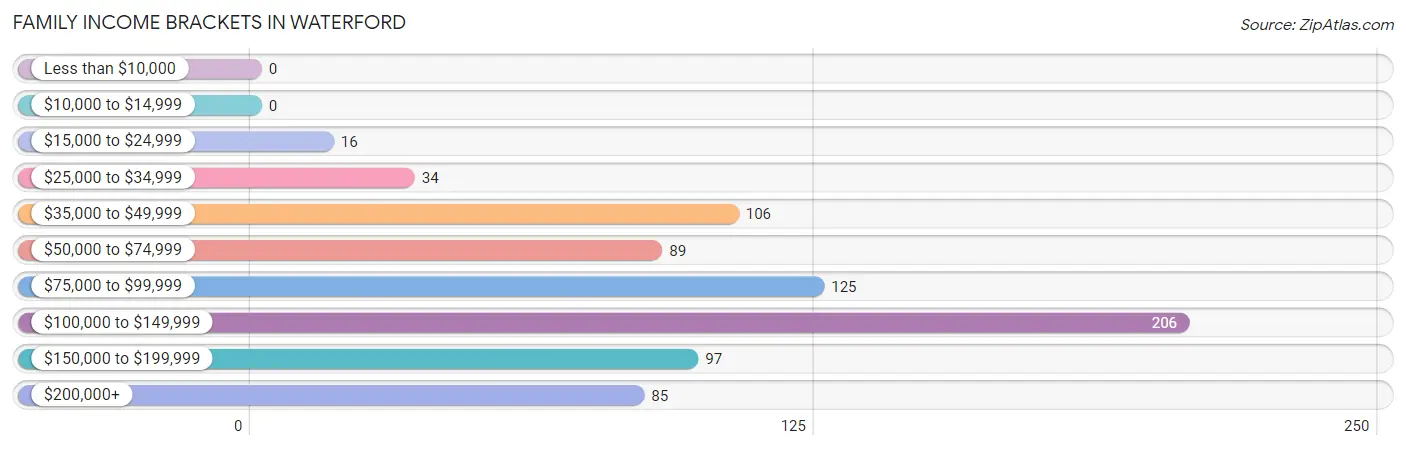
| Income Bracket | # Families | % Families |
| Less than $10,000 | 0 | 0.0% |
| $10,000 to $14,999 | 0 | 0.0% |
| $15,000 to $24,999 | 16 | 2.1% |
| $25,000 to $34,999 | 34 | 4.5% |
| $35,000 to $49,999 | 106 | 14.0% |
| $50,000 to $74,999 | 89 | 11.7% |
| $75,000 to $99,999 | 125 | 16.5% |
| $100,000 to $149,999 | 206 | 27.2% |
| $150,000 to $199,999 | 97 | 12.8% |
| $200,000+ | 85 | 11.2% |
Family Income by Famaliy Size in Waterford
3-person families (202 | 26.7%) account for the highest median family income in Waterford with $133,333 per family, while 2-person families (363 | 47.9%) have the highest median income of $50,547 per family member.
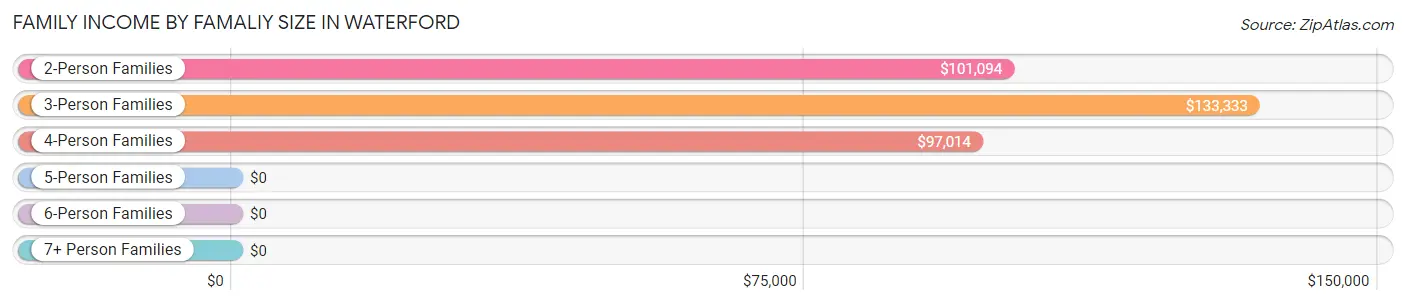
| Income Bracket | # Families | Median Income |
| 2-Person Families | 363 (47.9%) | $101,094 |
| 3-Person Families | 202 (26.7%) | $133,333 |
| 4-Person Families | 125 (16.5%) | $97,014 |
| 5-Person Families | 47 (6.2%) | $0 |
| 6-Person Families | 21 (2.8%) | $0 |
| 7+ Person Families | 0 (0.0%) | $0 |
| Total | 758 (100.0%) | $100,938 |
Family Income by Number of Earners in Waterford
The median family income in Waterford is $100,938, with families comprising 2 earners (393) having the highest median family income of $127,601, while families with no earners (97) have the lowest median family income of $50,139, accounting for 51.8% and 12.8% of families, respectively.
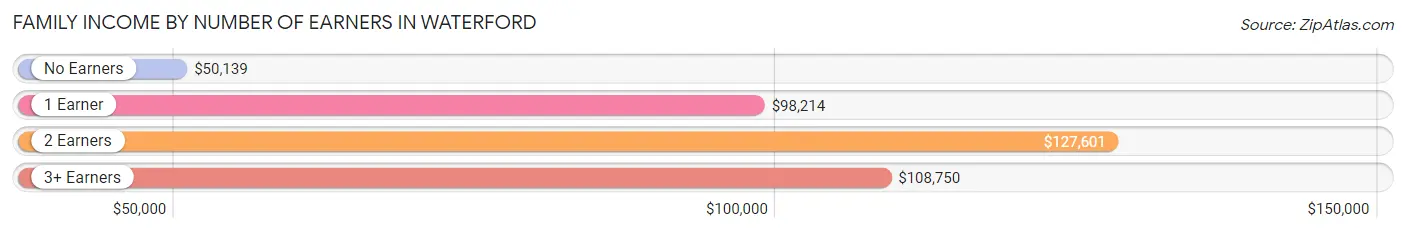
| Number of Earners | # Families | Median Income |
| No Earners | 97 (12.8%) | $50,139 |
| 1 Earner | 182 (24.0%) | $98,214 |
| 2 Earners | 393 (51.8%) | $127,601 |
| 3+ Earners | 86 (11.4%) | $108,750 |
| Total | 758 (100.0%) | $100,938 |
Household Income in Waterford
Household Income Brackets in Waterford
With 319 households falling in the category, the $100,000 to $149,999 income range is the most frequent in Waterford, accounting for 21.3% of all households. In contrast, only 46 households (3.1%) fall into the less than $10,000 income bracket, making it the least populous group.
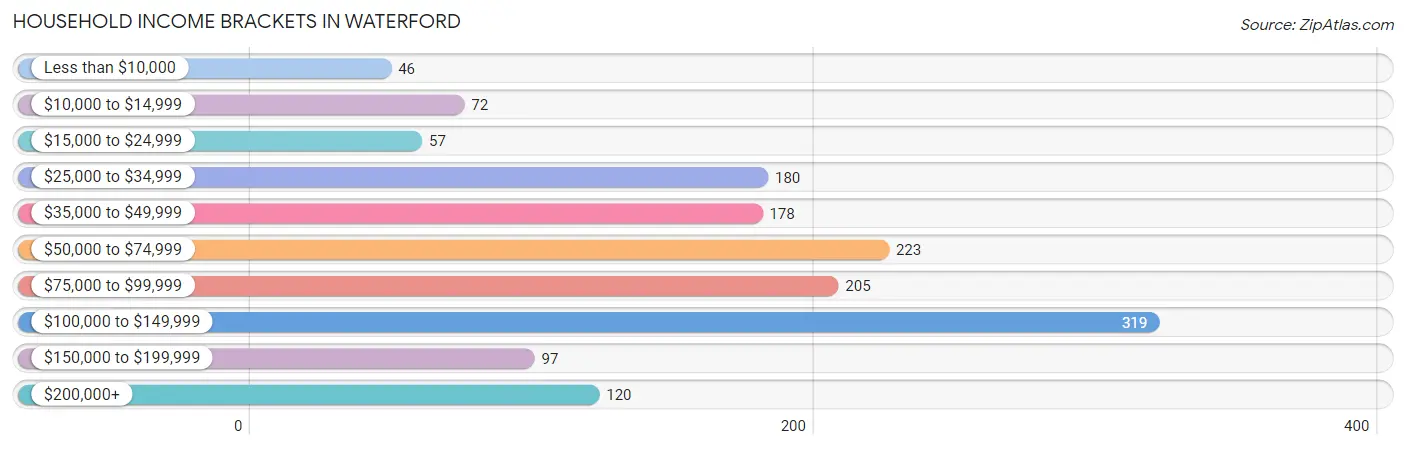
| Income Bracket | # Households | % Households |
| Less than $10,000 | 46 | 3.1% |
| $10,000 to $14,999 | 72 | 4.8% |
| $15,000 to $24,999 | 57 | 3.8% |
| $25,000 to $34,999 | 180 | 12.0% |
| $35,000 to $49,999 | 178 | 11.9% |
| $50,000 to $74,999 | 223 | 14.9% |
| $75,000 to $99,999 | 205 | 13.7% |
| $100,000 to $149,999 | 319 | 21.3% |
| $150,000 to $199,999 | 97 | 6.5% |
| $200,000+ | 120 | 8.0% |
Household Income by Householder Age in Waterford
The median household income in Waterford is $74,701, with the highest median household income of $108,676 found in the 25 to 44 years age bracket for the primary householder. A total of 382 households (25.5%) fall into this category. Meanwhile, the 65+ years age bracket for the primary householder has the lowest median household income of $46,979, with 525 households (35.1%) in this group.
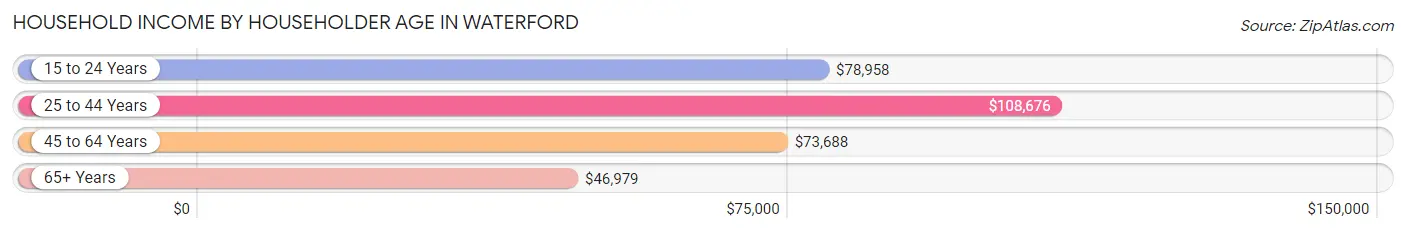
| Income Bracket | # Households | Median Income |
| 15 to 24 Years | 36 (2.4%) | $78,958 |
| 25 to 44 Years | 382 (25.5%) | $108,676 |
| 45 to 64 Years | 553 (37.0%) | $73,688 |
| 65+ Years | 525 (35.1%) | $46,979 |
| Total | 1,496 (100.0%) | $74,701 |
Poverty in Waterford
Income Below Poverty by Sex and Age in Waterford
With 3.2% poverty level for males and 11.1% for females among the residents of Waterford, 18 to 24 year old males and 16 and 17 year old females are the most vulnerable to poverty, with 10 males (8.4%) and 24 females (50.0%) in their respective age groups living below the poverty level.
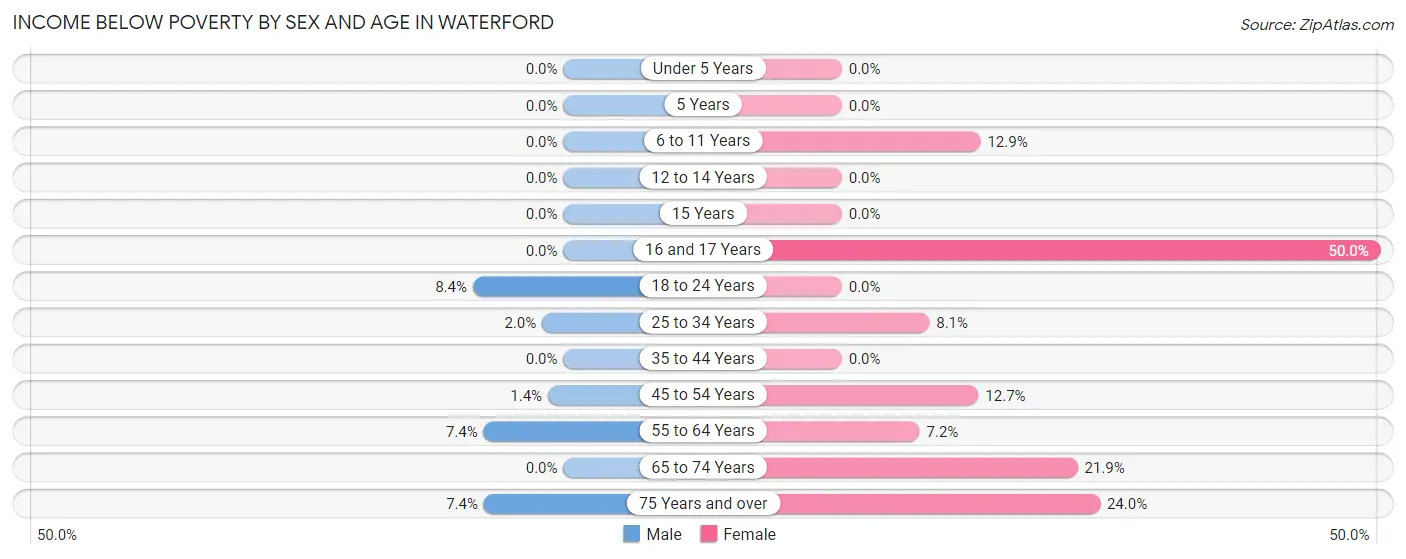
| Age Bracket | Male | Female |
| Under 5 Years | 0 (0.0%) | 0 (0.0%) |
| 5 Years | 0 (0.0%) | 0 (0.0%) |
| 6 to 11 Years | 0 (0.0%) | 13 (12.9%) |
| 12 to 14 Years | 0 (0.0%) | 0 (0.0%) |
| 15 Years | 0 (0.0%) | 0 (0.0%) |
| 16 and 17 Years | 0 (0.0%) | 24 (50.0%) |
| 18 to 24 Years | 10 (8.4%) | 0 (0.0%) |
| 25 to 34 Years | 5 (2.0%) | 22 (8.1%) |
| 35 to 44 Years | 0 (0.0%) | 0 (0.0%) |
| 45 to 54 Years | 2 (1.4%) | 35 (12.7%) |
| 55 to 64 Years | 20 (7.4%) | 13 (7.2%) |
| 65 to 74 Years | 0 (0.0%) | 42 (21.9%) |
| 75 Years and over | 9 (7.4%) | 46 (24.0%) |
| Total | 46 (3.2%) | 195 (11.1%) |
Income Above Poverty by Sex and Age in Waterford
According to the poverty statistics in Waterford, males aged under 5 years and females aged under 5 years are the age groups that are most secure financially, with 100.0% of males and 100.0% of females in these age groups living above the poverty line.
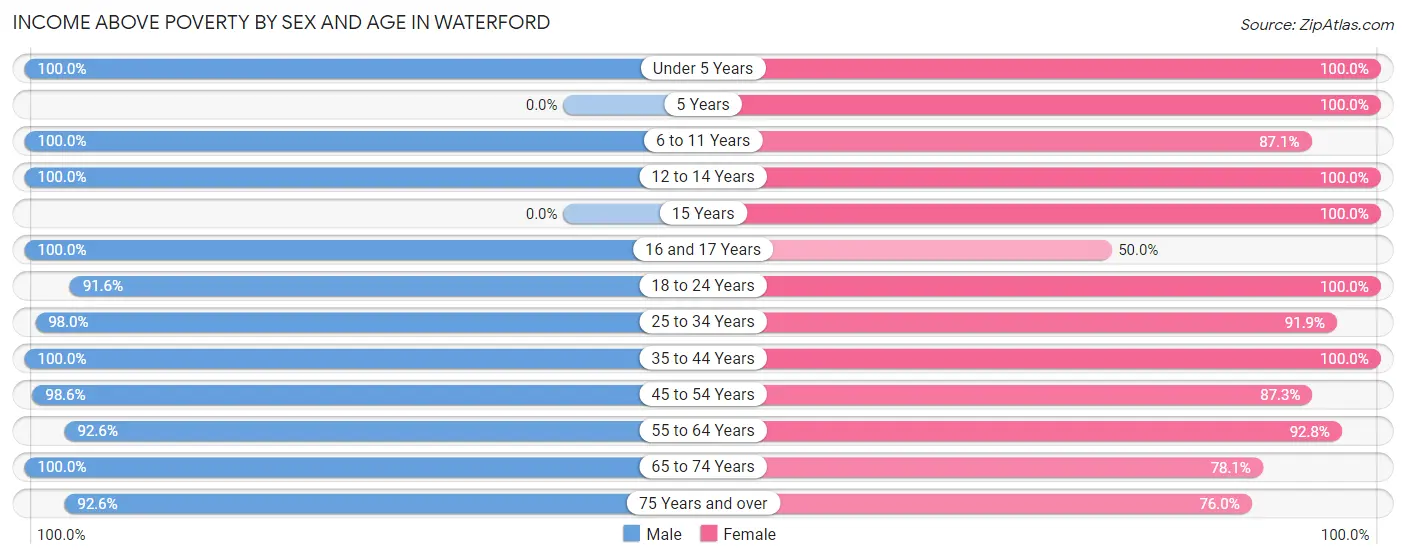
| Age Bracket | Male | Female |
| Under 5 Years | 37 (100.0%) | 61 (100.0%) |
| 5 Years | 0 (0.0%) | 9 (100.0%) |
| 6 to 11 Years | 57 (100.0%) | 88 (87.1%) |
| 12 to 14 Years | 13 (100.0%) | 96 (100.0%) |
| 15 Years | 0 (0.0%) | 41 (100.0%) |
| 16 and 17 Years | 71 (100.0%) | 24 (50.0%) |
| 18 to 24 Years | 109 (91.6%) | 117 (100.0%) |
| 25 to 34 Years | 249 (98.0%) | 249 (91.9%) |
| 35 to 44 Years | 171 (100.0%) | 167 (100.0%) |
| 45 to 54 Years | 138 (98.6%) | 241 (87.3%) |
| 55 to 64 Years | 250 (92.6%) | 167 (92.8%) |
| 65 to 74 Years | 165 (100.0%) | 150 (78.1%) |
| 75 Years and over | 113 (92.6%) | 146 (76.0%) |
| Total | 1,373 (96.8%) | 1,556 (88.9%) |
Income Below Poverty Among Married-Couple Families in Waterford
The poverty statistics for married-couple families in Waterford show that 1.7% or 9 of the total 524 families live below the poverty line. Families with no children have the highest poverty rate of 3.0%, comprising of 9 families. On the other hand, families with 1 or 2 children have the lowest poverty rate of 0.0%, which includes 0 families.
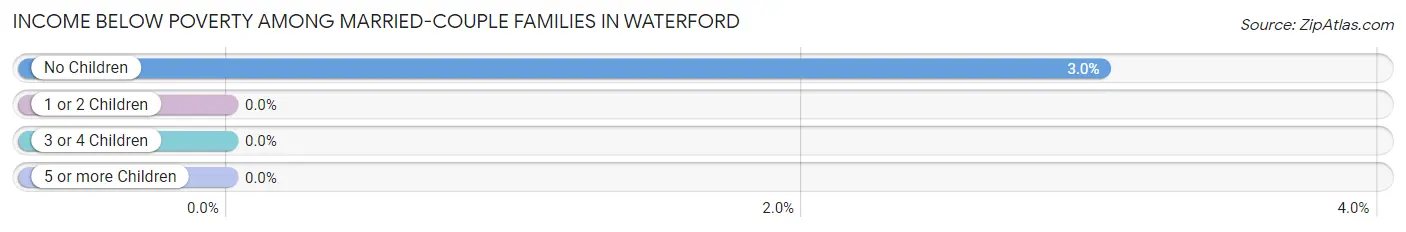
| Children | Above Poverty | Below Poverty |
| No Children | 287 (97.0%) | 9 (3.0%) |
| 1 or 2 Children | 211 (100.0%) | 0 (0.0%) |
| 3 or 4 Children | 17 (100.0%) | 0 (0.0%) |
| 5 or more Children | 0 (0.0%) | 0 (0.0%) |
| Total | 515 (98.3%) | 9 (1.7%) |
Income Below Poverty Among Single-Parent Households in Waterford
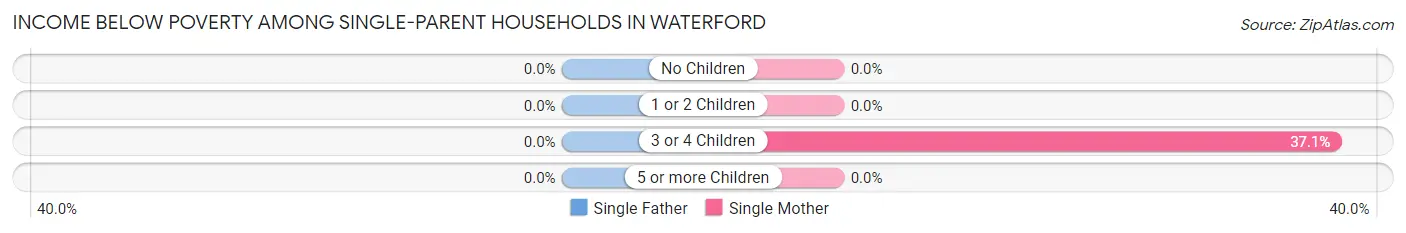
| Children | Single Father | Single Mother |
| No Children | 0 (0.0%) | 0 (0.0%) |
| 1 or 2 Children | 0 (0.0%) | 0 (0.0%) |
| 3 or 4 Children | 0 (0.0%) | 13 (37.1%) |
| 5 or more Children | 0 (0.0%) | 0 (0.0%) |
| Total | 0 (0.0%) | 13 (10.0%) |
Income Below Poverty Among Married-Couple vs Single-Parent Households in Waterford
The poverty data for Waterford shows that 9 of the married-couple family households (1.7%) and 13 of the single-parent households (5.6%) are living below the poverty level. Within the married-couple family households, those with no children have the highest poverty rate, with 9 households (3.0%) falling below the poverty line. Among the single-parent households, those with 3 or 4 children have the highest poverty rate, with 13 household (37.1%) living below poverty.
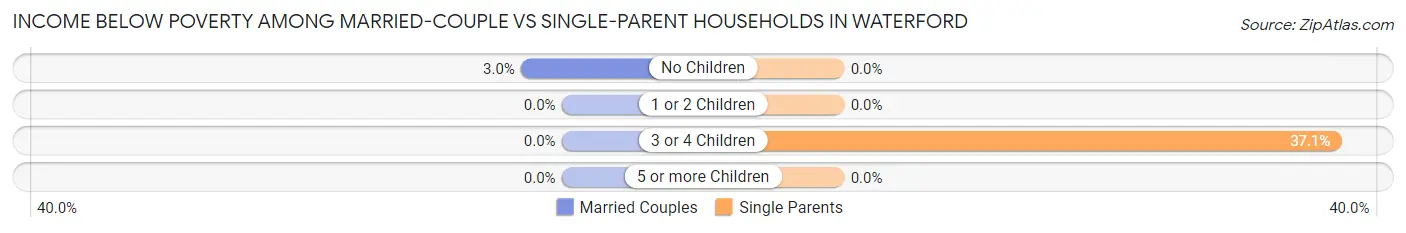
| Children | Married-Couple Families | Single-Parent Households |
| No Children | 9 (3.0%) | 0 (0.0%) |
| 1 or 2 Children | 0 (0.0%) | 0 (0.0%) |
| 3 or 4 Children | 0 (0.0%) | 13 (37.1%) |
| 5 or more Children | 0 (0.0%) | 0 (0.0%) |
| Total | 9 (1.7%) | 13 (5.6%) |
Race in Waterford
The most populous races in Waterford are White / Caucasian (2,720 | 83.0%), Two or more Races (203 | 6.2%), and Hispanic or Latino (156 | 4.8%).
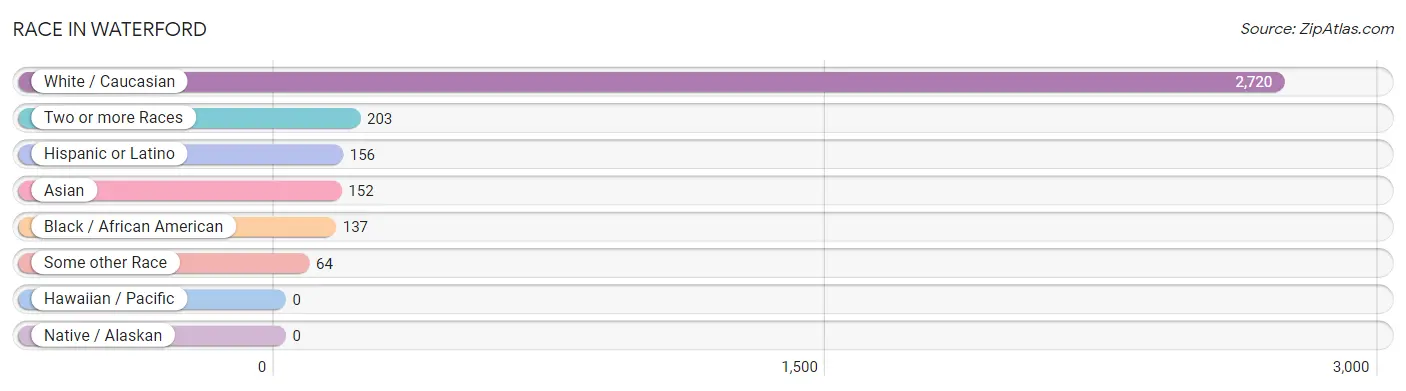
| Race | # Population | % Population |
| Asian | 152 | 4.6% |
| Black / African American | 137 | 4.2% |
| Hawaiian / Pacific | 0 | 0.0% |
| Hispanic or Latino | 156 | 4.8% |
| Native / Alaskan | 0 | 0.0% |
| White / Caucasian | 2,720 | 83.0% |
| Two or more Races | 203 | 6.2% |
| Some other Race | 64 | 1.9% |
| Total | 3,276 | 100.0% |
Ancestry in Waterford
The most populous ancestries reported in Waterford are Italian (807 | 24.6%), Irish (683 | 20.8%), English (388 | 11.8%), German (207 | 6.3%), and French (206 | 6.3%), together accounting for 69.9% of all Waterford residents.
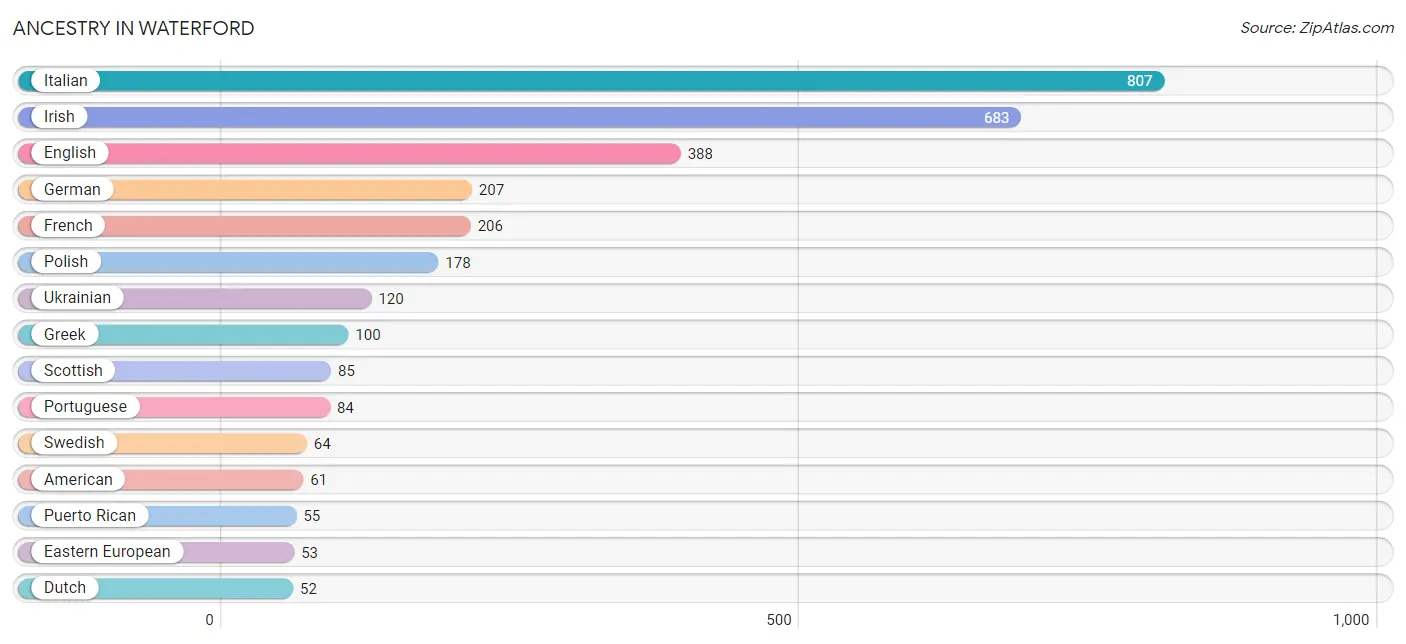
| Ancestry | # Population | % Population |
| African | 22 | 0.7% |
| American | 61 | 1.9% |
| Austrian | 14 | 0.4% |
| Belgian | 30 | 0.9% |
| Brazilian | 35 | 1.1% |
| British | 29 | 0.9% |
| Central American | 10 | 0.3% |
| Czechoslovakian | 19 | 0.6% |
| Dominican | 17 | 0.5% |
| Dutch | 52 | 1.6% |
| Eastern European | 53 | 1.6% |
| English | 388 | 11.8% |
| Finnish | 42 | 1.3% |
| French | 206 | 6.3% |
| French Canadian | 45 | 1.4% |
| German | 207 | 6.3% |
| Greek | 100 | 3.0% |
| Hungarian | 6 | 0.2% |
| Indian (Asian) | 5 | 0.2% |
| Irish | 683 | 20.8% |
| Italian | 807 | 24.6% |
| Jamaican | 6 | 0.2% |
| Korean | 34 | 1.0% |
| Mexican | 45 | 1.4% |
| Nicaraguan | 10 | 0.3% |
| Norwegian | 4 | 0.1% |
| Peruvian | 19 | 0.6% |
| Polish | 178 | 5.4% |
| Portuguese | 84 | 2.6% |
| Puerto Rican | 55 | 1.7% |
| Russian | 8 | 0.2% |
| Scandinavian | 25 | 0.8% |
| Scotch-Irish | 7 | 0.2% |
| Scottish | 85 | 2.6% |
| South American | 19 | 0.6% |
| Spaniard | 10 | 0.3% |
| Subsaharan African | 30 | 0.9% |
| Swedish | 64 | 1.9% |
| Thai | 36 | 1.1% |
| Ukrainian | 120 | 3.7% | View All 40 Rows |
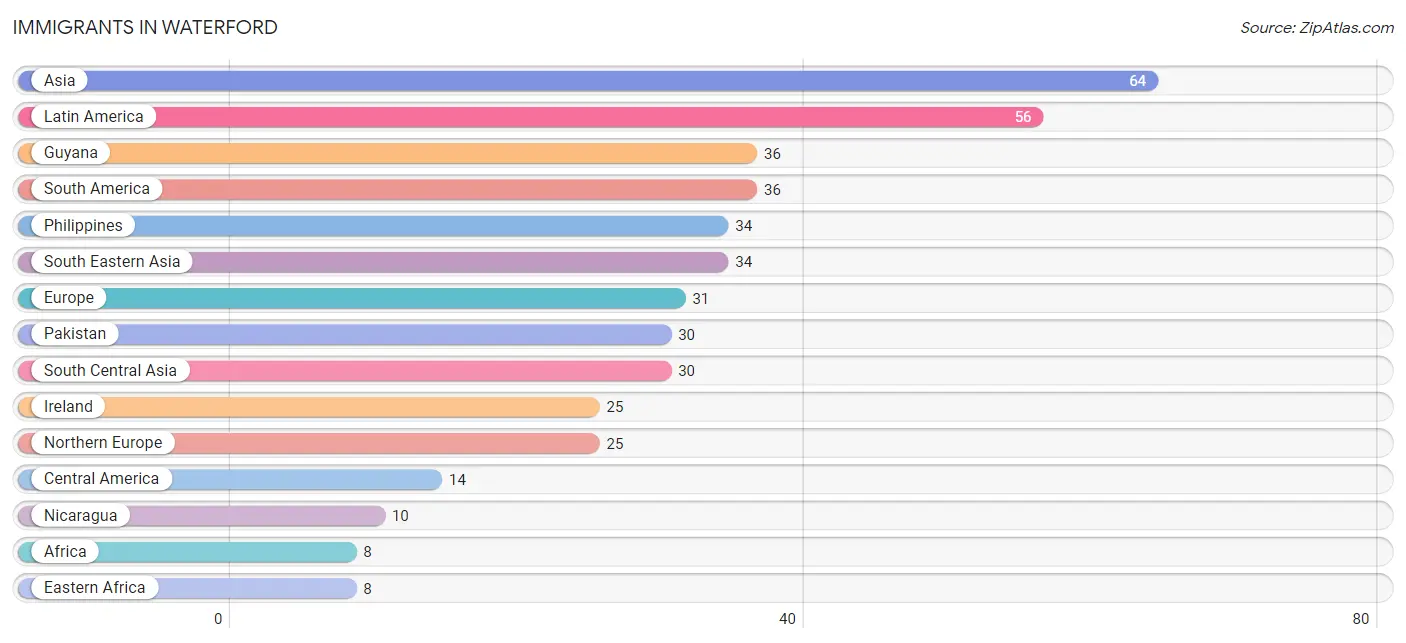
Immigrants in Waterford
The most numerous immigrant groups reported in Waterford came from Asia (64 | 1.9%), Latin America (56 | 1.7%), Guyana (36 | 1.1%), South America (36 | 1.1%), and Philippines (34 | 1.0%), together accounting for 6.9% of all Waterford residents.
| Immigration Origin | # Population | % Population |
| Africa | 8 | 0.2% |
| Asia | 64 | 1.9% |
| Austria | 6 | 0.2% |
| Caribbean | 6 | 0.2% |
| Central America | 14 | 0.4% |
| Eastern Africa | 8 | 0.2% |
| Europe | 31 | 0.9% |
| Guyana | 36 | 1.1% |
| Honduras | 4 | 0.1% |
| Ireland | 25 | 0.8% |
| Jamaica | 6 | 0.2% |
| Latin America | 56 | 1.7% |
| Nicaragua | 10 | 0.3% |
| Northern Europe | 25 | 0.8% |
| Pakistan | 30 | 0.9% |
| Philippines | 34 | 1.0% |
| South America | 36 | 1.1% |
| South Central Asia | 30 | 0.9% |
| South Eastern Asia | 34 | 1.0% |
| Western Europe | 6 | 0.2% | View All 20 Rows |
Sex and Age in Waterford
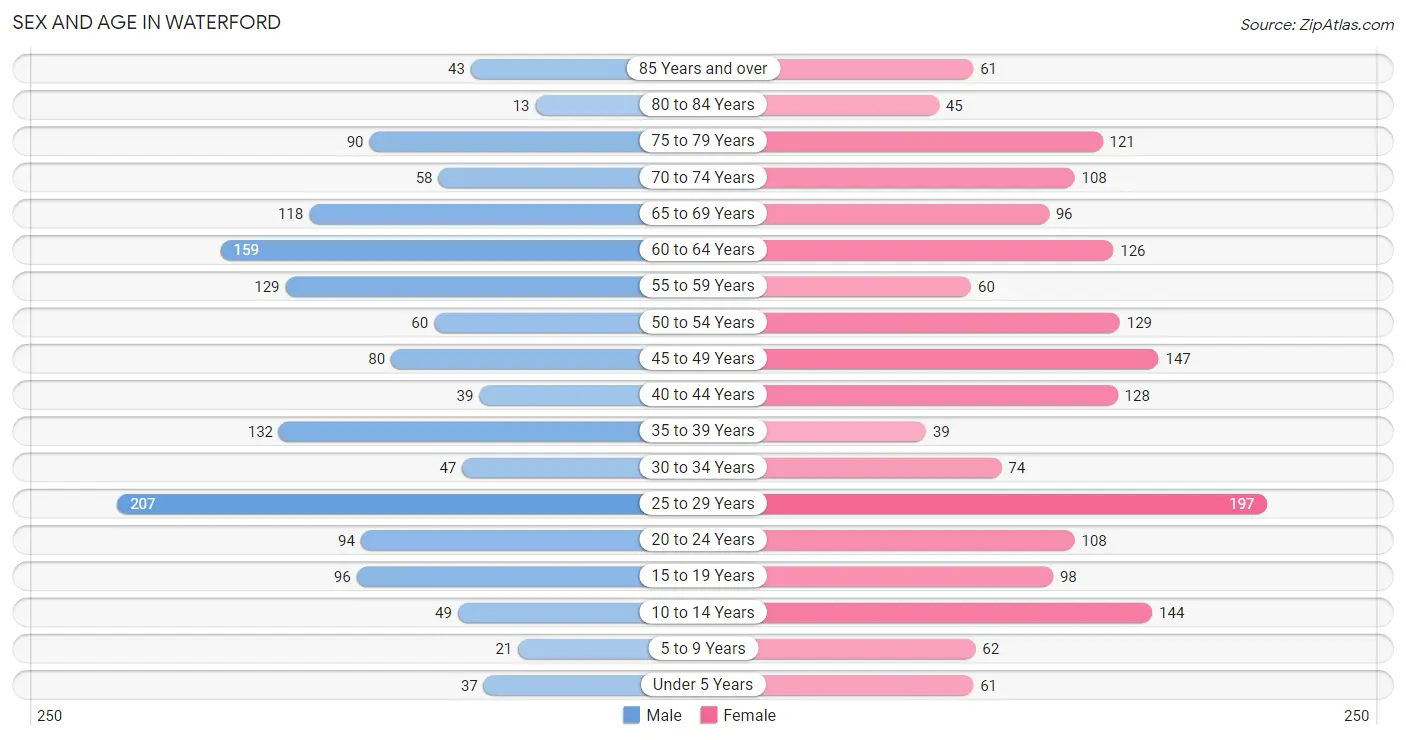
Sex and Age in Waterford
The most populous age groups in Waterford are 25 to 29 Years (207 | 14.1%) for men and 25 to 29 Years (197 | 10.9%) for women.
| Age Bracket | Male | Female |
| Under 5 Years | 37 (2.5%) | 61 (3.4%) |
| 5 to 9 Years | 21 (1.4%) | 62 (3.4%) |
| 10 to 14 Years | 49 (3.3%) | 144 (8.0%) |
| 15 to 19 Years | 96 (6.5%) | 98 (5.4%) |
| 20 to 24 Years | 94 (6.4%) | 108 (6.0%) |
| 25 to 29 Years | 207 (14.1%) | 197 (10.9%) |
| 30 to 34 Years | 47 (3.2%) | 74 (4.1%) |
| 35 to 39 Years | 132 (9.0%) | 39 (2.2%) |
| 40 to 44 Years | 39 (2.6%) | 128 (7.1%) |
| 45 to 49 Years | 80 (5.4%) | 147 (8.2%) |
| 50 to 54 Years | 60 (4.1%) | 129 (7.1%) |
| 55 to 59 Years | 129 (8.8%) | 60 (3.3%) |
| 60 to 64 Years | 159 (10.8%) | 126 (7.0%) |
| 65 to 69 Years | 118 (8.0%) | 96 (5.3%) |
| 70 to 74 Years | 58 (3.9%) | 108 (6.0%) |
| 75 to 79 Years | 90 (6.1%) | 121 (6.7%) |
| 80 to 84 Years | 13 (0.9%) | 45 (2.5%) |
| 85 Years and over | 43 (2.9%) | 61 (3.4%) |
| Total | 1,472 (100.0%) | 1,804 (100.0%) |
Families and Households in Waterford
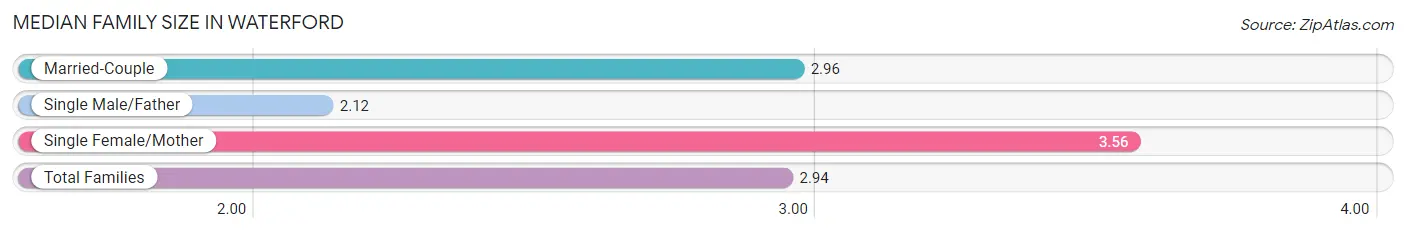
Median Family Size in Waterford
The median family size in Waterford is 2.94 persons per family, with single female/mother families (130 | 17.2%) accounting for the largest median family size of 3.56 persons per family. On the other hand, single male/father families (104 | 13.7%) represent the smallest median family size with 2.12 persons per family.
| Family Type | # Families | Family Size |
| Married-Couple | 524 (69.1%) | 2.96 |
| Single Male/Father | 104 (13.7%) | 2.12 |
| Single Female/Mother | 130 (17.2%) | 3.56 |
| Total Families | 758 (100.0%) | 2.94 |
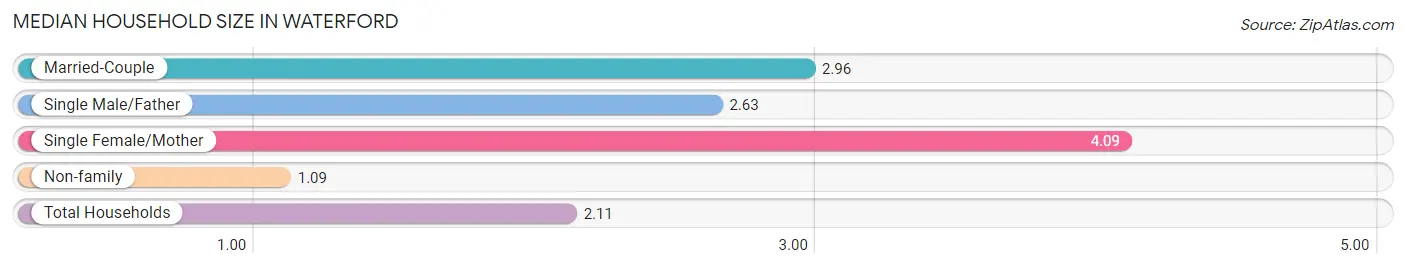
Median Household Size in Waterford
The median household size in Waterford is 2.11 persons per household, with single female/mother households (130 | 8.7%) accounting for the largest median household size of 4.09 persons per household. non-family households (738 | 49.3%) represent the smallest median household size with 1.09 persons per household.
| Household Type | # Households | Household Size |
| Married-Couple | 524 (35.0%) | 2.96 |
| Single Male/Father | 104 (7.0%) | 2.63 |
| Single Female/Mother | 130 (8.7%) | 4.09 |
| Non-family | 738 (49.3%) | 1.09 |
| Total Households | 1,496 (100.0%) | 2.11 |
Household Size by Marriage Status in Waterford
Out of a total of 1,496 households in Waterford, 758 (50.7%) are family households, while 738 (49.3%) are nonfamily households. The most numerous type of family households are 2-person households, comprising 283, and the most common type of nonfamily households are 1-person households, comprising 679.
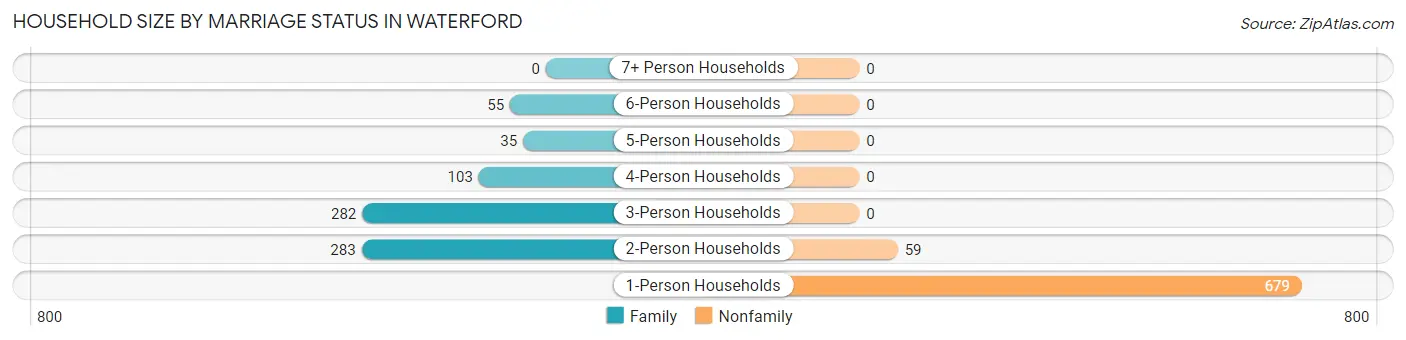
| Household Size | Family Households | Nonfamily Households |
| 1-Person Households | - | 679 (45.4%) |
| 2-Person Households | 283 (18.9%) | 59 (3.9%) |
| 3-Person Households | 282 (18.9%) | 0 (0.0%) |
| 4-Person Households | 103 (6.9%) | 0 (0.0%) |
| 5-Person Households | 35 (2.3%) | 0 (0.0%) |
| 6-Person Households | 55 (3.7%) | 0 (0.0%) |
| 7+ Person Households | 0 (0.0%) | 0 (0.0%) |
| Total | 758 (50.7%) | 738 (49.3%) |
Female Fertility in Waterford
Fertility by Age in Waterford
Average fertility rate in Waterford is 27.0 births per 1,000 women. Women in the age bracket of 20 to 34 years have the highest fertility rate with 58.0 births per 1,000 women. Women in the age bracket of 20 to 34 years acount for 100.0% of all women with births.
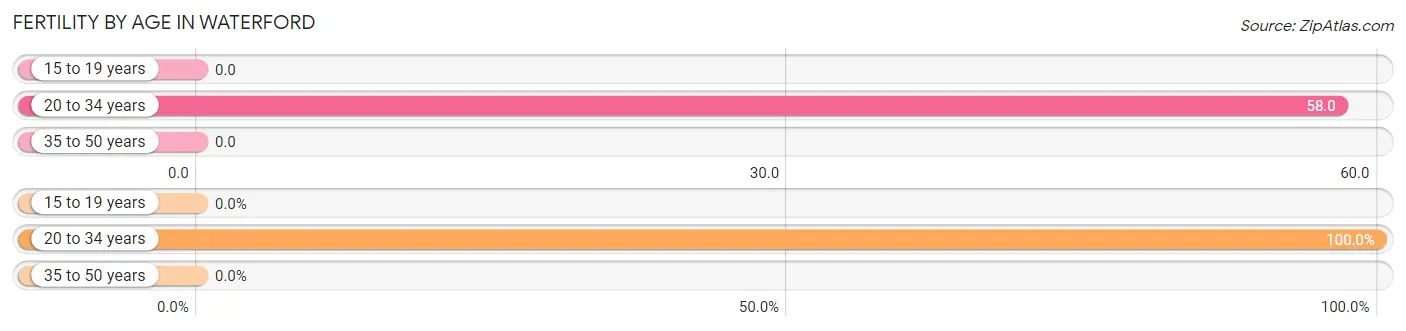
| Age Bracket | Women with Births | Births / 1,000 Women |
| 15 to 19 years | 0 (0.0%) | 0.0 |
| 20 to 34 years | 22 (100.0%) | 58.0 |
| 35 to 50 years | 0 (0.0%) | 0.0 |
| Total | 22 (100.0%) | 27.0 |
Fertility by Age by Marriage Status in Waterford
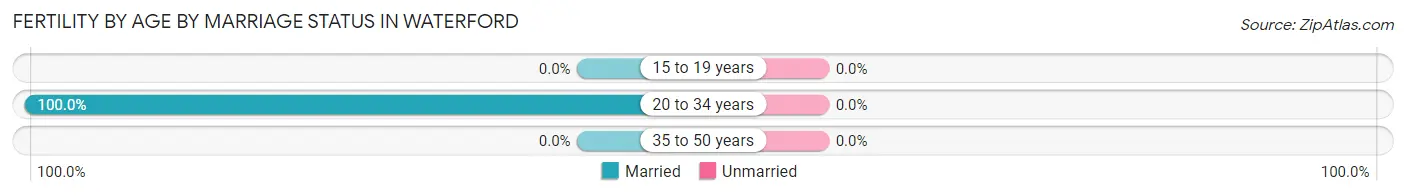
| Age Bracket | Married | Unmarried |
| 15 to 19 years | 0 (0.0%) | 0 (0.0%) |
| 20 to 34 years | 22 (100.0%) | 0 (0.0%) |
| 35 to 50 years | 0 (0.0%) | 0 (0.0%) |
| Total | 22 (100.0%) | 0 (0.0%) |
Fertility by Education in Waterford
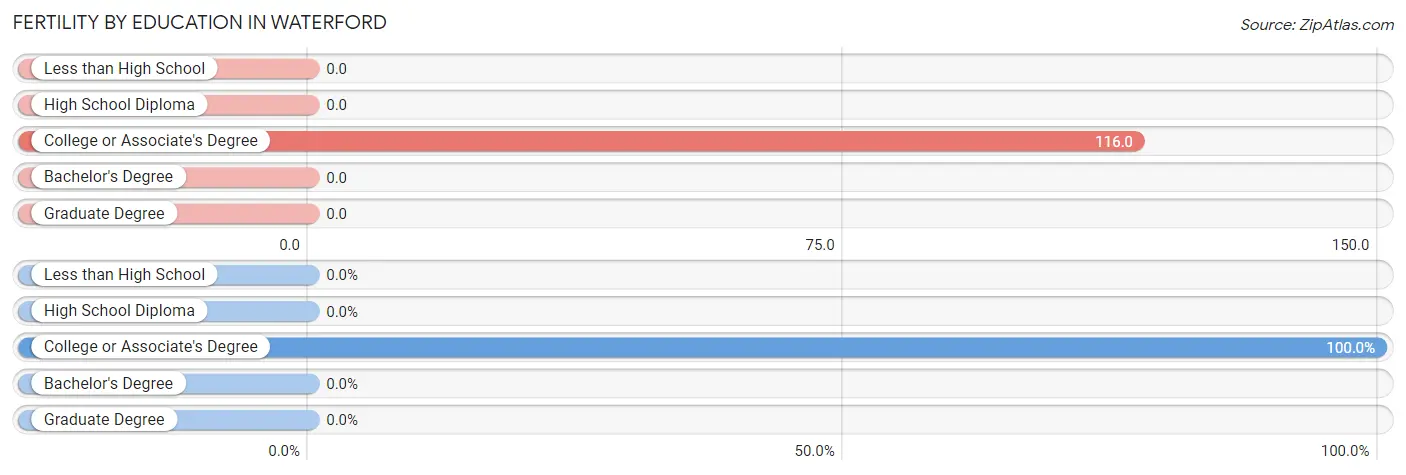
| Educational Attainment | Women with Births | Births / 1,000 Women |
| Less than High School | 0 (0.0%) | 0.0 |
| High School Diploma | 0 (0.0%) | 0.0 |
| College or Associate's Degree | 22 (100.0%) | 116.0 |
| Bachelor's Degree | 0 (0.0%) | 0.0 |
| Graduate Degree | 0 (0.0%) | 0.0 |
| Total | 22 (100.0%) | 27.0 |
Fertility by Education by Marriage Status in Waterford
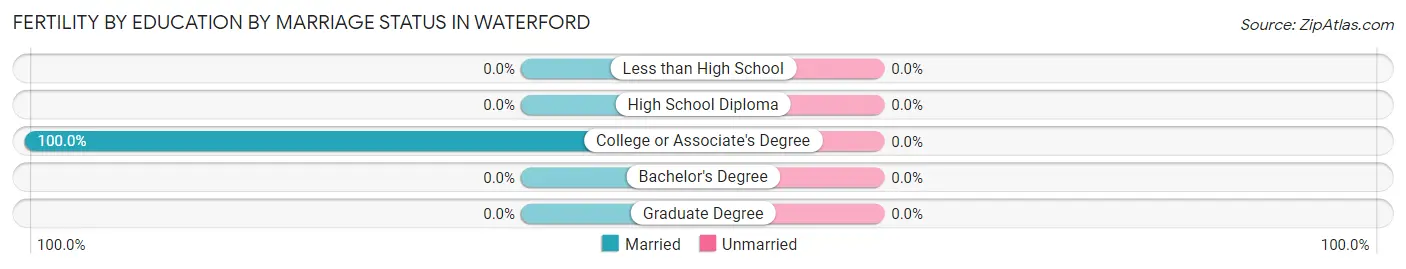
| Educational Attainment | Married | Unmarried |
| Less than High School | 0 (0.0%) | 0 (0.0%) |
| High School Diploma | 0 (0.0%) | 0 (0.0%) |
| College or Associate's Degree | 22 (100.0%) | 0 (0.0%) |
| Bachelor's Degree | 0 (0.0%) | 0 (0.0%) |
| Graduate Degree | 0 (0.0%) | 0 (0.0%) |
| Total | 22 (100.0%) | 0 (0.0%) |
Employment Characteristics in Waterford
Employment by Class of Employer in Waterford
Among the 1,556 employed individuals in Waterford, private company employees (1,036 | 66.6%), local government employees (181 | 11.6%), and not-for-profit organizations (165 | 10.6%) make up the most common classes of employment.
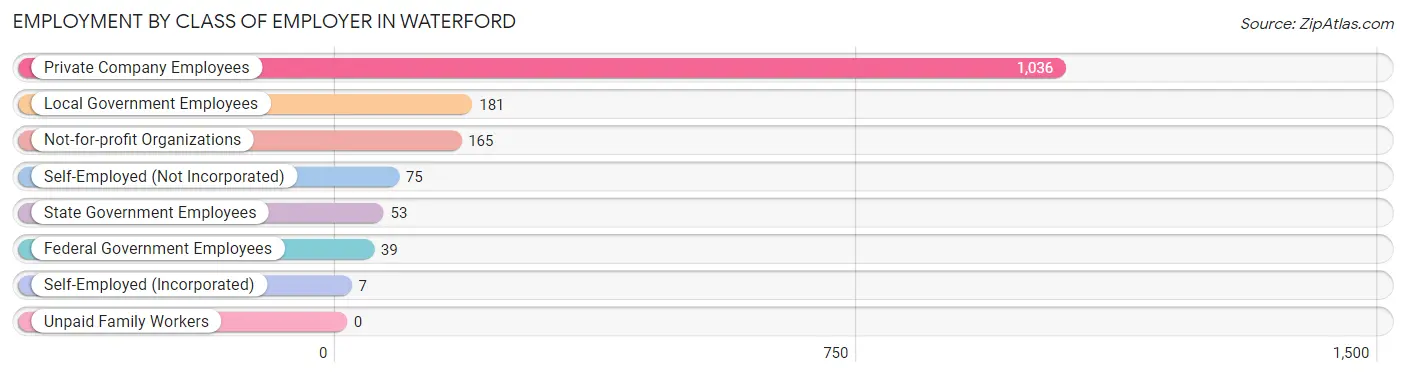
| Employer Class | # Employees | % Employees |
| Private Company Employees | 1,036 | 66.6% |
| Self-Employed (Incorporated) | 7 | 0.4% |
| Self-Employed (Not Incorporated) | 75 | 4.8% |
| Not-for-profit Organizations | 165 | 10.6% |
| Local Government Employees | 181 | 11.6% |
| State Government Employees | 53 | 3.4% |
| Federal Government Employees | 39 | 2.5% |
| Unpaid Family Workers | 0 | 0.0% |
| Total | 1,556 | 100.0% |
Employment Status by Age in Waterford
According to the labor force statistics for Waterford, out of the total population over 16 years of age (2,861), 60.3% or 1,725 individuals are in the labor force, with 8.2% or 141 of them unemployed. The age group with the highest labor force participation rate is 25 to 29 years, with 91.1% or 368 individuals in the labor force. Within the labor force, the 16 to 19 years age range has the highest percentage of unemployed individuals, with 39.0% or 39 of them being unemployed.
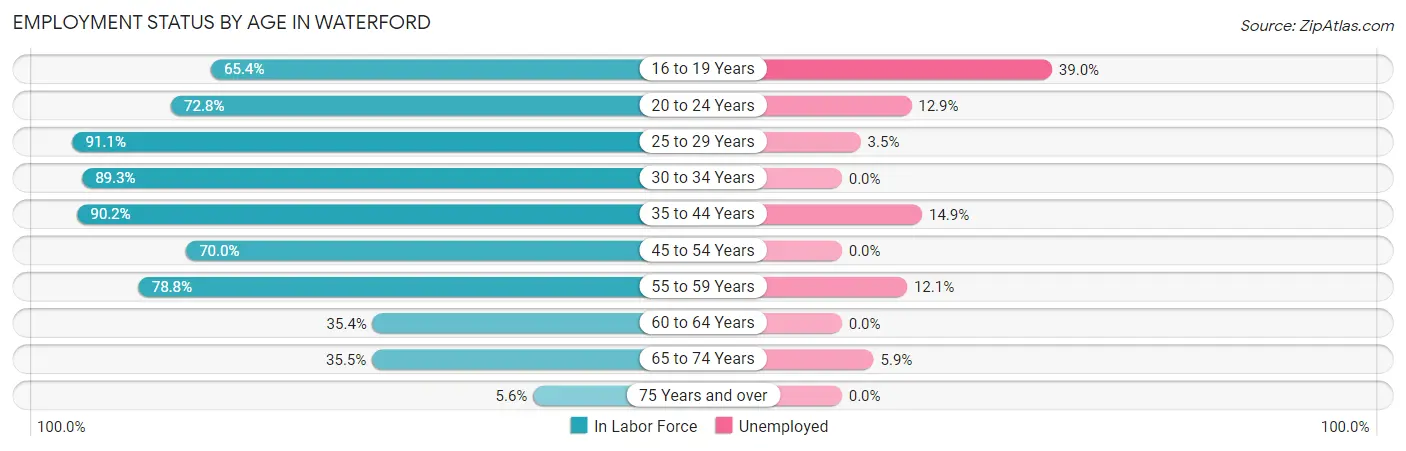
| Age Bracket | In Labor Force | Unemployed |
| 16 to 19 Years | 100 (65.4%) | 39 (39.0%) |
| 20 to 24 Years | 147 (72.8%) | 19 (12.9%) |
| 25 to 29 Years | 368 (91.1%) | 13 (3.5%) |
| 30 to 34 Years | 108 (89.3%) | 0 (0.0%) |
| 35 to 44 Years | 305 (90.2%) | 45 (14.9%) |
| 45 to 54 Years | 291 (70.0%) | 0 (0.0%) |
| 55 to 59 Years | 149 (78.8%) | 18 (12.1%) |
| 60 to 64 Years | 101 (35.4%) | 0 (0.0%) |
| 65 to 74 Years | 135 (35.5%) | 8 (5.9%) |
| 75 Years and over | 21 (5.6%) | 0 (0.0%) |
| Total | 1,725 (60.3%) | 141 (8.2%) |
Employment Status by Educational Attainment in Waterford
According to labor force statistics for Waterford, 75.4% of individuals (1,322) out of the total population between 25 and 64 years of age (1,753) are in the labor force, with 5.7% or 75 of them being unemployed. The group with the highest labor force participation rate are those with the educational attainment of bachelor's degree or higher, with 87.1% or 358 individuals in the labor force. Within the labor force, individuals with less than high school education have the highest percentage of unemployment, with 52.9% or 18 of them being unemployed.
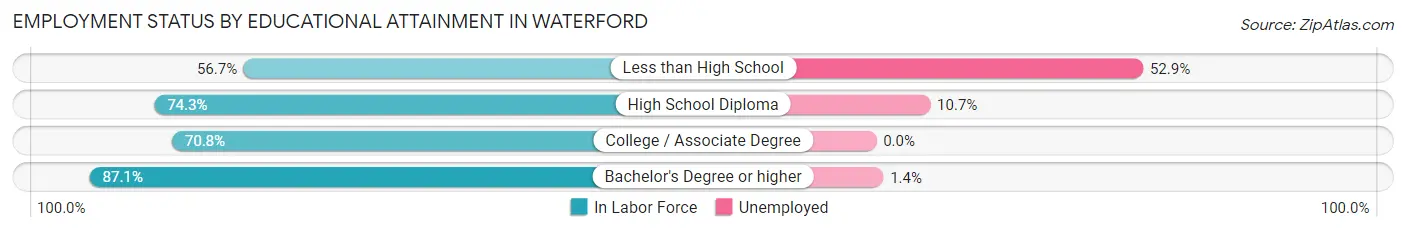
| Educational Attainment | In Labor Force | Unemployed |
| Less than High School | 34 (56.7%) | 32 (52.9%) |
| High School Diploma | 475 (74.3%) | 68 (10.7%) |
| College / Associate Degree | 455 (70.8%) | 0 (0.0%) |
| Bachelor's Degree or higher | 358 (87.1%) | 6 (1.4%) |
| Total | 1,322 (75.4%) | 100 (5.7%) |
Employment Occupations by Sex in Waterford
Management, Business, Science and Arts Occupations
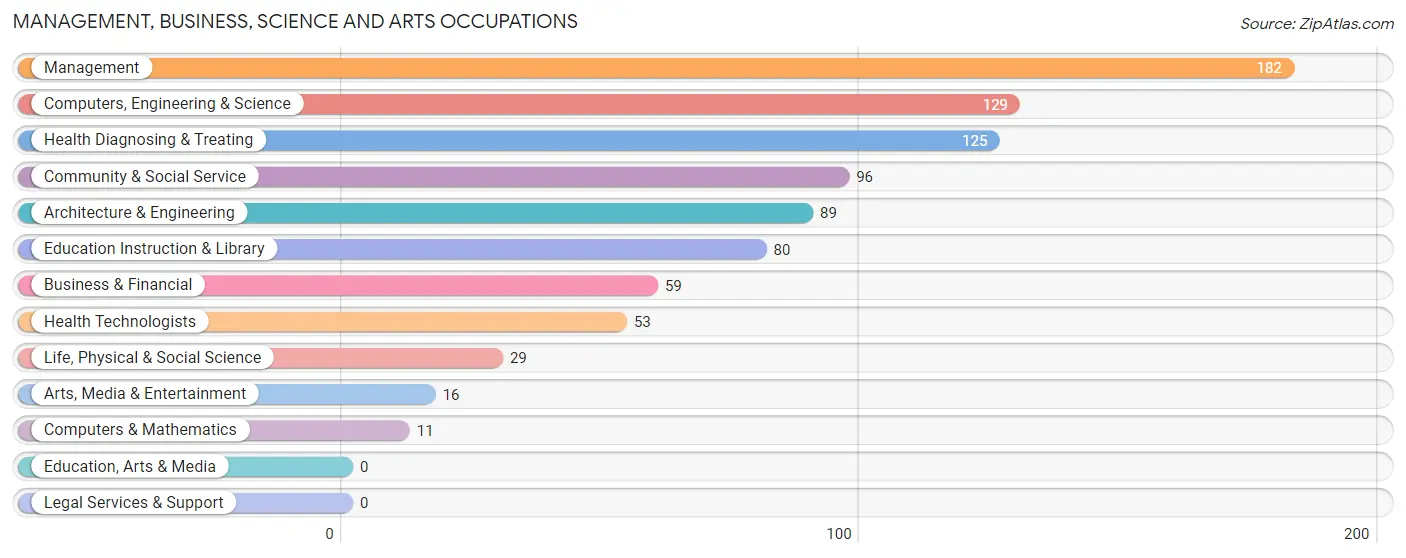
The most common Management, Business, Science and Arts occupations in Waterford are Management (182 | 11.6%), Computers, Engineering & Science (129 | 8.2%), Health Diagnosing & Treating (125 | 8.0%), Community & Social Service (96 | 6.1%), and Architecture & Engineering (89 | 5.7%).
Management, Business, Science and Arts Occupations by Sex
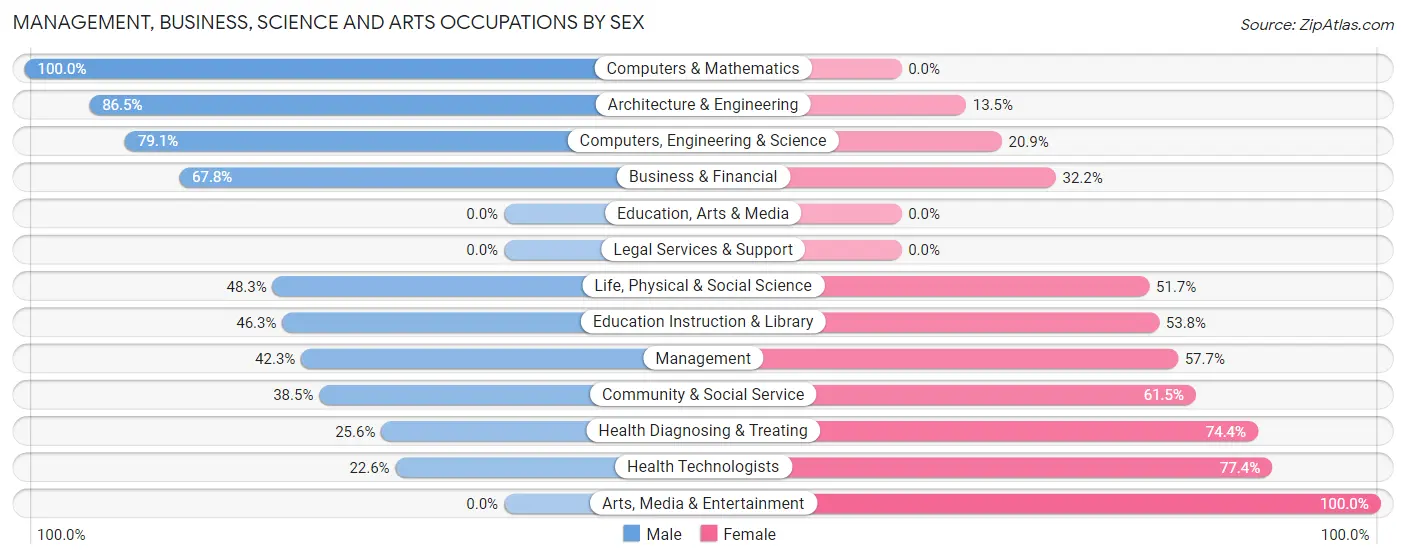
Within the Management, Business, Science and Arts occupations in Waterford, the most male-oriented occupations are Computers & Mathematics (100.0%), Architecture & Engineering (86.5%), and Computers, Engineering & Science (79.1%), while the most female-oriented occupations are Arts, Media & Entertainment (100.0%), Health Technologists (77.4%), and Health Diagnosing & Treating (74.4%).
| Occupation | Male | Female |
| Management | 77 (42.3%) | 105 (57.7%) |
| Business & Financial | 40 (67.8%) | 19 (32.2%) |
| Computers, Engineering & Science | 102 (79.1%) | 27 (20.9%) |
| Computers & Mathematics | 11 (100.0%) | 0 (0.0%) |
| Architecture & Engineering | 77 (86.5%) | 12 (13.5%) |
| Life, Physical & Social Science | 14 (48.3%) | 15 (51.7%) |
| Community & Social Service | 37 (38.5%) | 59 (61.5%) |
| Education, Arts & Media | 0 (0.0%) | 0 (0.0%) |
| Legal Services & Support | 0 (0.0%) | 0 (0.0%) |
| Education Instruction & Library | 37 (46.3%) | 43 (53.7%) |
| Arts, Media & Entertainment | 0 (0.0%) | 16 (100.0%) |
| Health Diagnosing & Treating | 32 (25.6%) | 93 (74.4%) |
| Health Technologists | 12 (22.6%) | 41 (77.4%) |
| Total (Category) | 288 (48.7%) | 303 (51.3%) |
| Total (Overall) | 866 (55.2%) | 703 (44.8%) |
Services Occupations
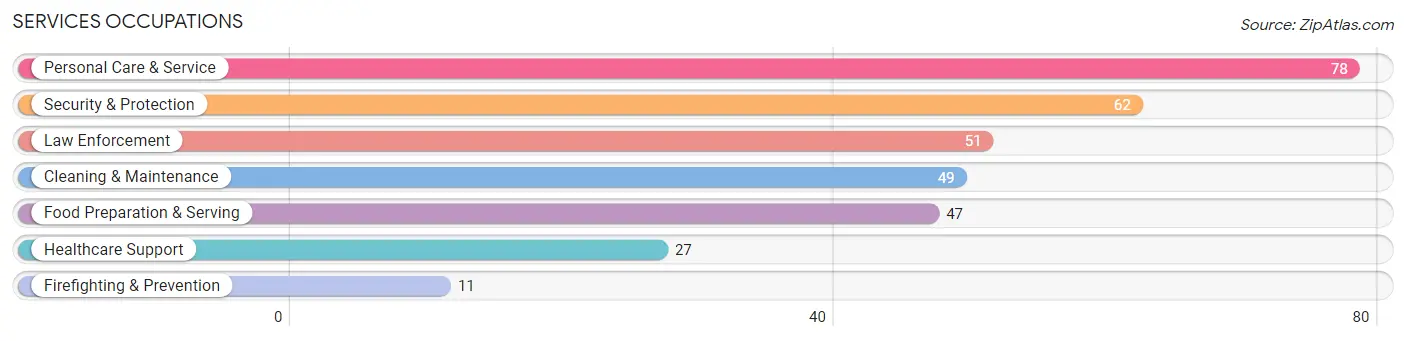
The most common Services occupations in Waterford are Personal Care & Service (78 | 5.0%), Security & Protection (62 | 4.0%), Law Enforcement (51 | 3.3%), Cleaning & Maintenance (49 | 3.1%), and Food Preparation & Serving (47 | 3.0%).
Services Occupations by Sex
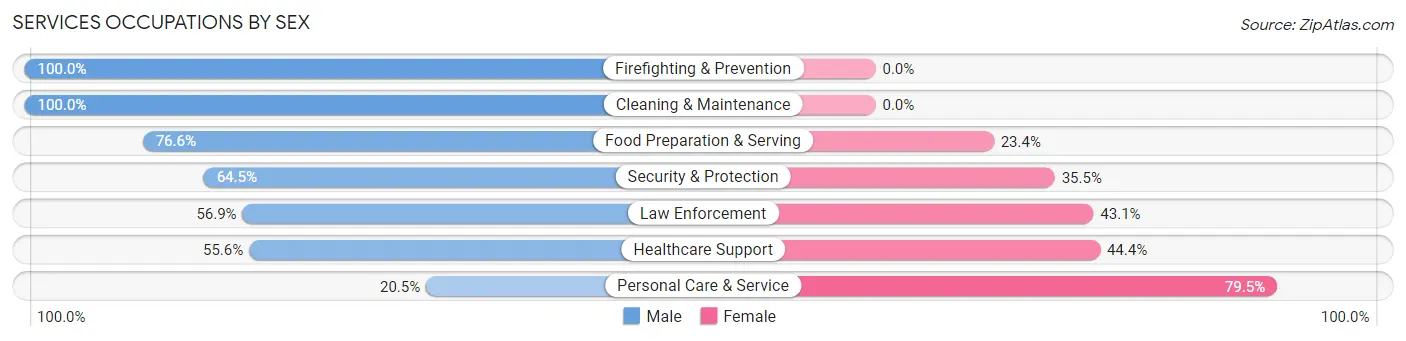
Within the Services occupations in Waterford, the most male-oriented occupations are Firefighting & Prevention (100.0%), Cleaning & Maintenance (100.0%), and Food Preparation & Serving (76.6%), while the most female-oriented occupations are Personal Care & Service (79.5%), Healthcare Support (44.4%), and Law Enforcement (43.1%).
| Occupation | Male | Female |
| Healthcare Support | 15 (55.6%) | 12 (44.4%) |
| Security & Protection | 40 (64.5%) | 22 (35.5%) |
| Firefighting & Prevention | 11 (100.0%) | 0 (0.0%) |
| Law Enforcement | 29 (56.9%) | 22 (43.1%) |
| Food Preparation & Serving | 36 (76.6%) | 11 (23.4%) |
| Cleaning & Maintenance | 49 (100.0%) | 0 (0.0%) |
| Personal Care & Service | 16 (20.5%) | 62 (79.5%) |
| Total (Category) | 156 (59.3%) | 107 (40.7%) |
| Total (Overall) | 866 (55.2%) | 703 (44.8%) |
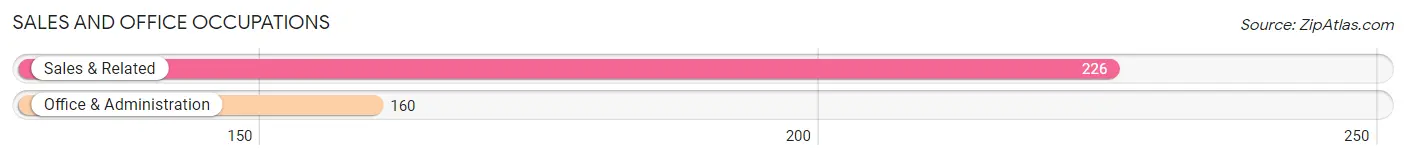
Sales and Office Occupations
The most common Sales and Office occupations in Waterford are Sales & Related (226 | 14.4%), and Office & Administration (160 | 10.2%).
Sales and Office Occupations by Sex
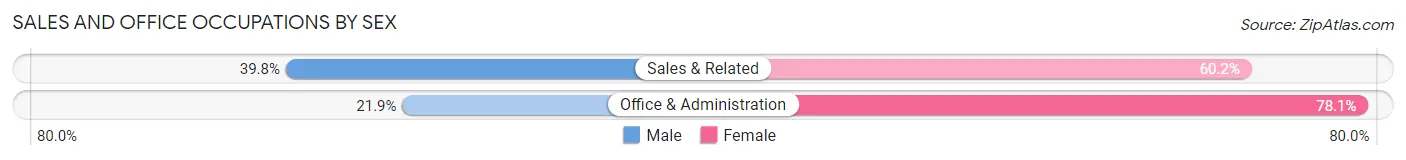
| Occupation | Male | Female |
| Sales & Related | 90 (39.8%) | 136 (60.2%) |
| Office & Administration | 35 (21.9%) | 125 (78.1%) |
| Total (Category) | 125 (32.4%) | 261 (67.6%) |
| Total (Overall) | 866 (55.2%) | 703 (44.8%) |
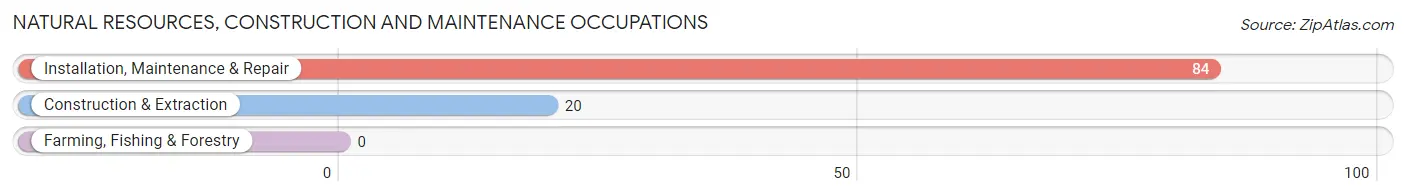
Natural Resources, Construction and Maintenance Occupations
The most common Natural Resources, Construction and Maintenance occupations in Waterford are Installation, Maintenance & Repair (84 | 5.3%), and Construction & Extraction (20 | 1.3%).
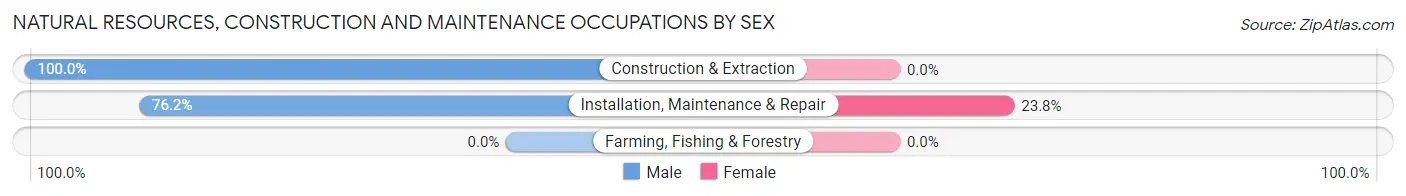
Natural Resources, Construction and Maintenance Occupations by Sex
| Occupation | Male | Female |
| Farming, Fishing & Forestry | 0 (0.0%) | 0 (0.0%) |
| Construction & Extraction | 20 (100.0%) | 0 (0.0%) |
| Installation, Maintenance & Repair | 64 (76.2%) | 20 (23.8%) |
| Total (Category) | 84 (80.8%) | 20 (19.2%) |
| Total (Overall) | 866 (55.2%) | 703 (44.8%) |
Production, Transportation and Moving Occupations
The most common Production, Transportation and Moving occupations in Waterford are Transportation (104 | 6.6%), Material Moving (68 | 4.3%), and Production (53 | 3.4%).
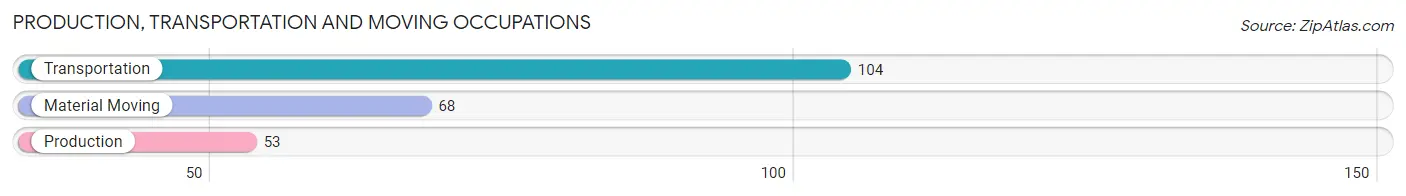
Production, Transportation and Moving Occupations by Sex
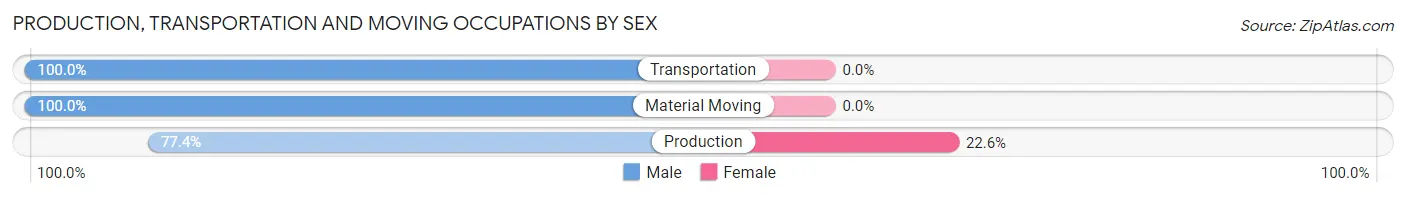
| Occupation | Male | Female |
| Production | 41 (77.4%) | 12 (22.6%) |
| Transportation | 104 (100.0%) | 0 (0.0%) |
| Material Moving | 68 (100.0%) | 0 (0.0%) |
| Total (Category) | 213 (94.7%) | 12 (5.3%) |
| Total (Overall) | 866 (55.2%) | 703 (44.8%) |
Employment Industries by Sex in Waterford
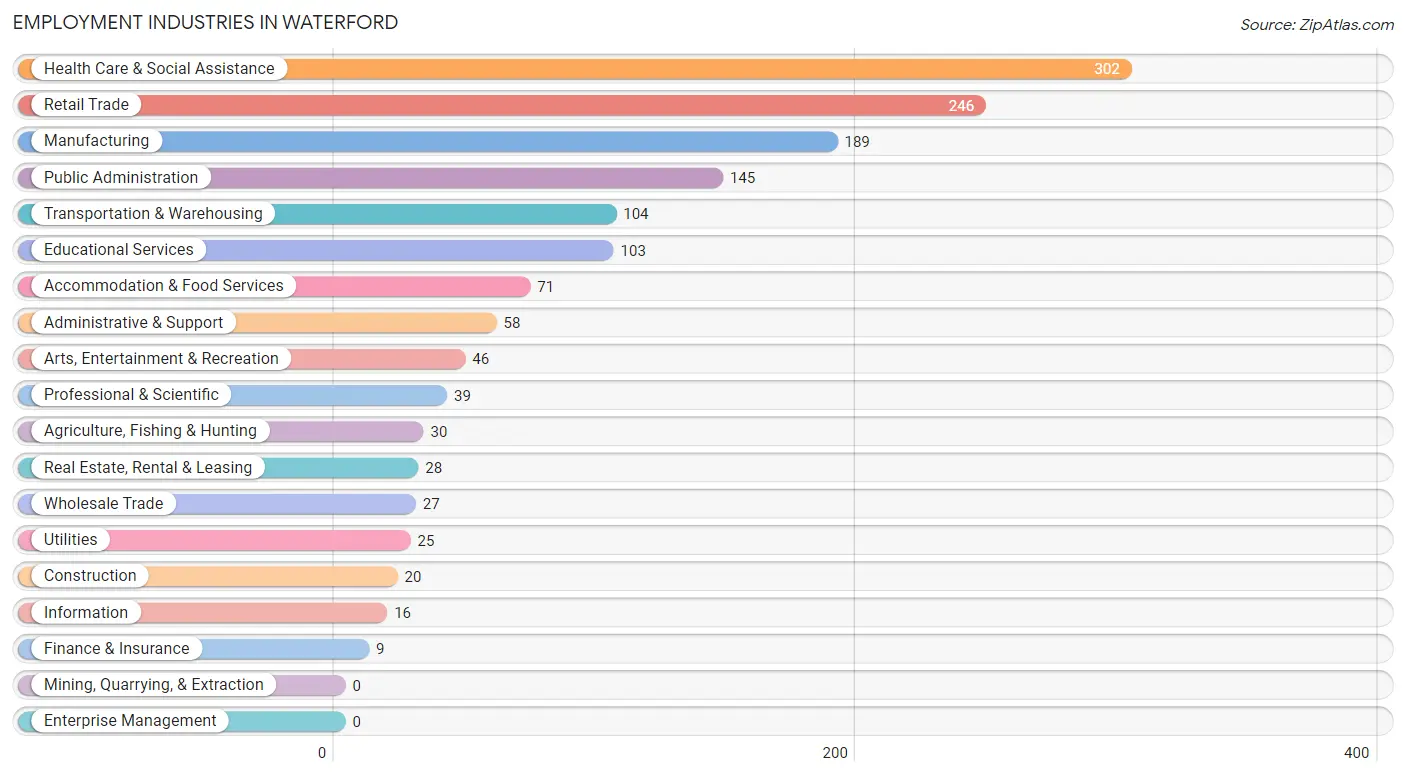
Employment Industries in Waterford
The major employment industries in Waterford include Health Care & Social Assistance (302 | 19.3%), Retail Trade (246 | 15.7%), Manufacturing (189 | 12.0%), Public Administration (145 | 9.2%), and Transportation & Warehousing (104 | 6.6%).
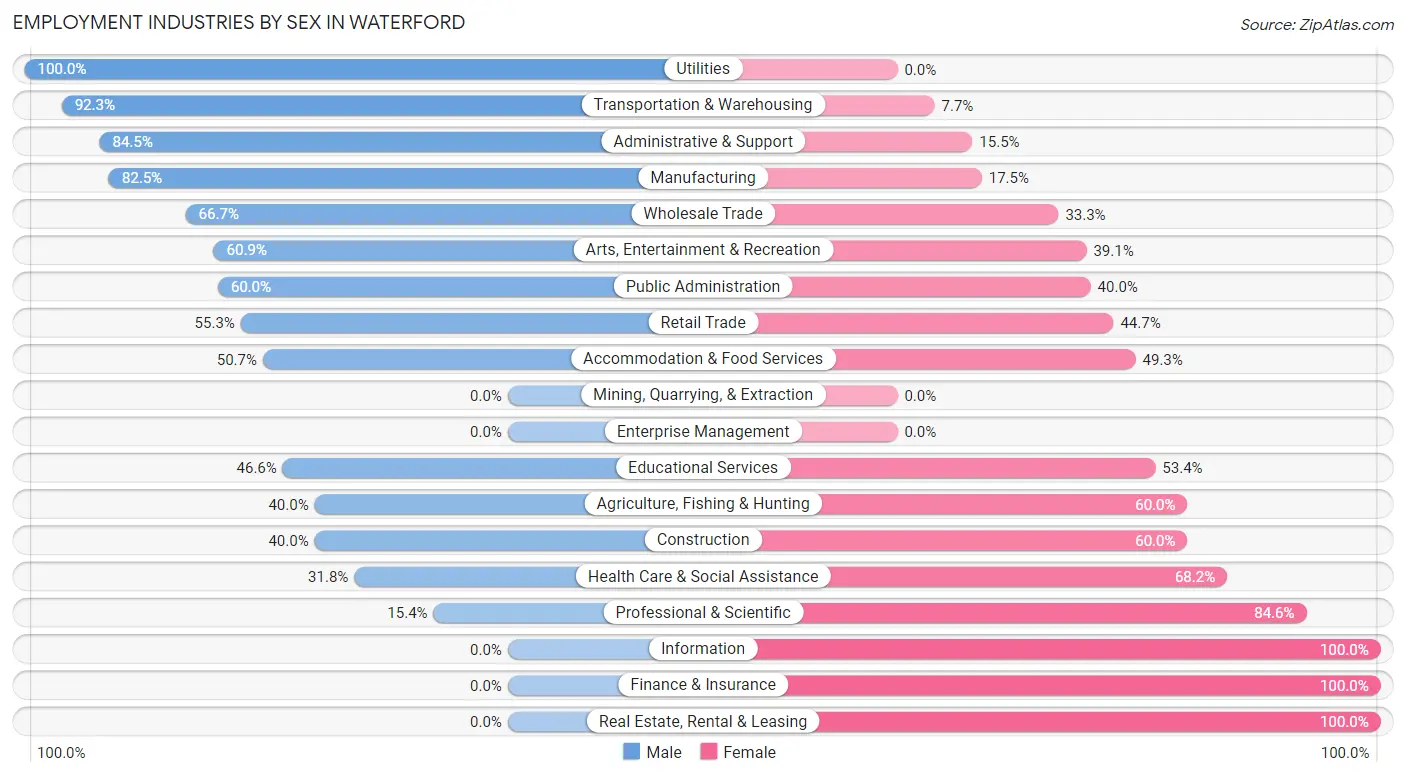
Employment Industries by Sex in Waterford
The Waterford industries that see more men than women are Utilities (100.0%), Transportation & Warehousing (92.3%), and Administrative & Support (84.5%), whereas the industries that tend to have a higher number of women are Information (100.0%), Finance & Insurance (100.0%), and Real Estate, Rental & Leasing (100.0%).
| Industry | Male | Female |
| Agriculture, Fishing & Hunting | 12 (40.0%) | 18 (60.0%) |
| Mining, Quarrying, & Extraction | 0 (0.0%) | 0 (0.0%) |
| Construction | 8 (40.0%) | 12 (60.0%) |
| Manufacturing | 156 (82.5%) | 33 (17.5%) |
| Wholesale Trade | 18 (66.7%) | 9 (33.3%) |
| Retail Trade | 136 (55.3%) | 110 (44.7%) |
| Transportation & Warehousing | 96 (92.3%) | 8 (7.7%) |
| Utilities | 25 (100.0%) | 0 (0.0%) |
| Information | 0 (0.0%) | 16 (100.0%) |
| Finance & Insurance | 0 (0.0%) | 9 (100.0%) |
| Real Estate, Rental & Leasing | 0 (0.0%) | 28 (100.0%) |
| Professional & Scientific | 6 (15.4%) | 33 (84.6%) |
| Enterprise Management | 0 (0.0%) | 0 (0.0%) |
| Administrative & Support | 49 (84.5%) | 9 (15.5%) |
| Educational Services | 48 (46.6%) | 55 (53.4%) |
| Health Care & Social Assistance | 96 (31.8%) | 206 (68.2%) |
| Arts, Entertainment & Recreation | 28 (60.9%) | 18 (39.1%) |
| Accommodation & Food Services | 36 (50.7%) | 35 (49.3%) |
| Public Administration | 87 (60.0%) | 58 (40.0%) |
| Total | 866 (55.2%) | 703 (44.8%) |
Education in Waterford
School Enrollment in Waterford
The most common levels of schooling among the 610 students in Waterford are high school (185 | 30.3%), middle school (165 | 27.1%), and college / undergraduate (106 | 17.4%).
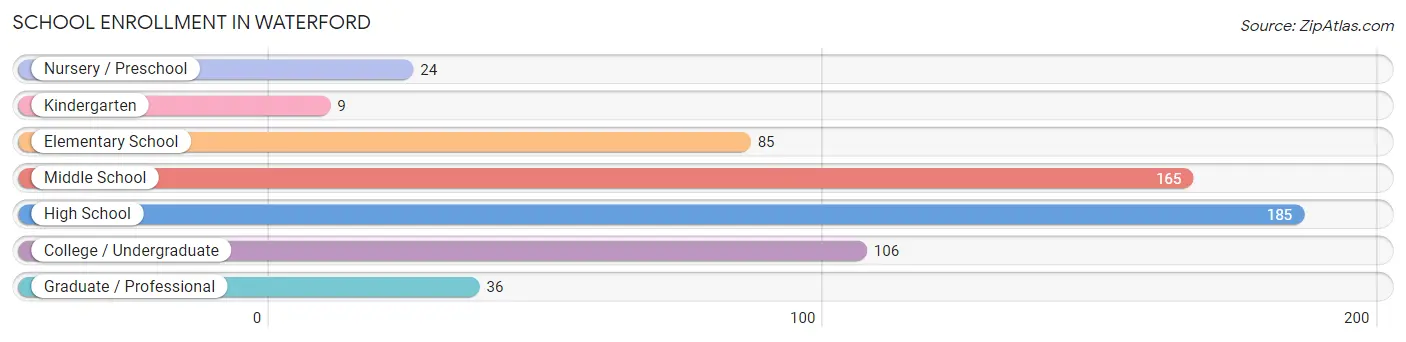
| School Level | # Students | % Students |
| Nursery / Preschool | 24 | 3.9% |
| Kindergarten | 9 | 1.5% |
| Elementary School | 85 | 13.9% |
| Middle School | 165 | 27.1% |
| High School | 185 | 30.3% |
| College / Undergraduate | 106 | 17.4% |
| Graduate / Professional | 36 | 5.9% |
| Total | 610 | 100.0% |
School Enrollment by Age by Funding Source in Waterford
Out of a total of 610 students who are enrolled in schools in Waterford, 69 (11.3%) attend a private institution, while the remaining 541 (88.7%) are enrolled in public schools. The age group of 25 to 34 year olds has the highest likelihood of being enrolled in private schools, with 13 (24.5% in the age bracket) enrolled. Conversely, the age group of 3 to 4 year olds has the lowest likelihood of being enrolled in a private school, with 24 (100.0% in the age bracket) attending a public institution.
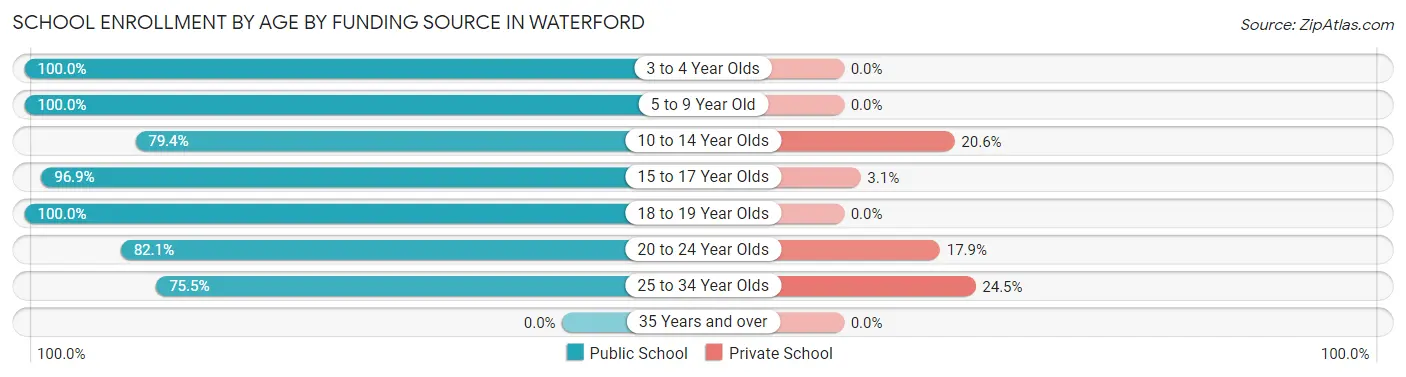
| Age Bracket | Public School | Private School |
| 3 to 4 Year Olds | 24 (100.0%) | 0 (0.0%) |
| 5 to 9 Year Old | 83 (100.0%) | 0 (0.0%) |
| 10 to 14 Year Olds | 150 (79.4%) | 39 (20.6%) |
| 15 to 17 Year Olds | 155 (96.9%) | 5 (3.1%) |
| 18 to 19 Year Olds | 34 (100.0%) | 0 (0.0%) |
| 20 to 24 Year Olds | 55 (82.1%) | 12 (17.9%) |
| 25 to 34 Year Olds | 40 (75.5%) | 13 (24.5%) |
| 35 Years and over | 0 (0.0%) | 0 (0.0%) |
| Total | 541 (88.7%) | 69 (11.3%) |
Educational Attainment by Field of Study in Waterford
Education (140 | 21.9%), engineering (84 | 13.2%), social sciences (80 | 12.5%), business (62 | 9.7%), and science & technology (57 | 8.9%) are the most common fields of study among 639 individuals in Waterford who have obtained a bachelor's degree or higher.
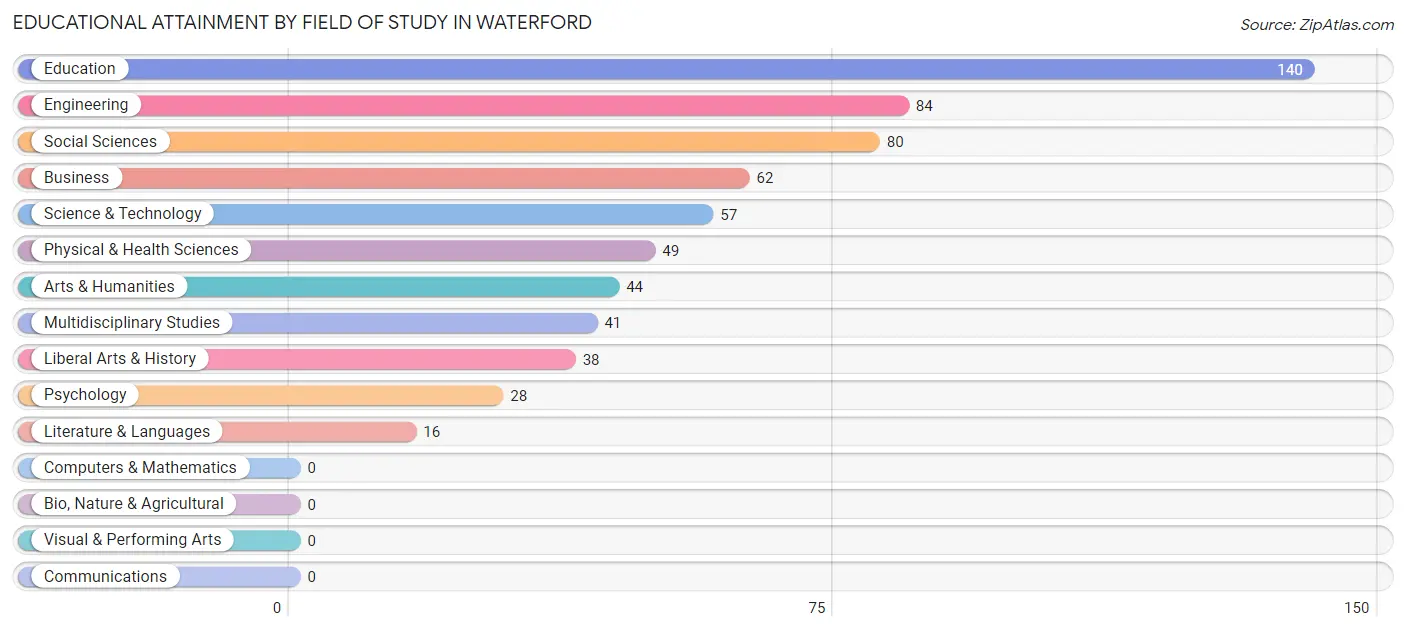
| Field of Study | # Graduates | % Graduates |
| Computers & Mathematics | 0 | 0.0% |
| Bio, Nature & Agricultural | 0 | 0.0% |
| Physical & Health Sciences | 49 | 7.7% |
| Psychology | 28 | 4.4% |
| Social Sciences | 80 | 12.5% |
| Engineering | 84 | 13.2% |
| Multidisciplinary Studies | 41 | 6.4% |
| Science & Technology | 57 | 8.9% |
| Business | 62 | 9.7% |
| Education | 140 | 21.9% |
| Literature & Languages | 16 | 2.5% |
| Liberal Arts & History | 38 | 5.9% |
| Visual & Performing Arts | 0 | 0.0% |
| Communications | 0 | 0.0% |
| Arts & Humanities | 44 | 6.9% |
| Total | 639 | 100.0% |
Transportation & Commute in Waterford
Vehicle Availability by Sex in Waterford
The most prevalent vehicle ownership categories in Waterford are males with 2 vehicles (386, accounting for 45.4%) and females with 2 vehicles (267, making up 54.9%).
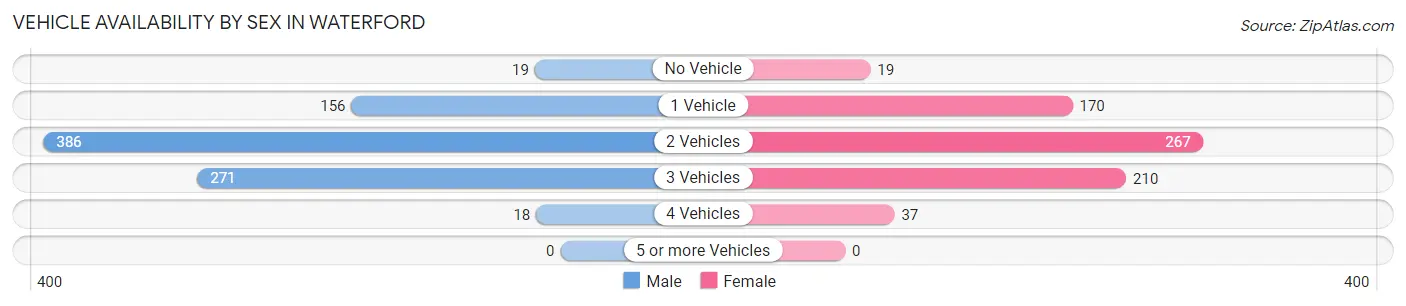
| Vehicles Available | Male | Female |
| No Vehicle | 19 (2.2%) | 19 (2.7%) |
| 1 Vehicle | 156 (18.3%) | 170 (24.2%) |
| 2 Vehicles | 386 (45.4%) | 267 (38.0%) |
| 3 Vehicles | 271 (31.9%) | 210 (29.9%) |
| 4 Vehicles | 18 (2.1%) | 37 (5.3%) |
| 5 or more Vehicles | 0 (0.0%) | 0 (0.0%) |
| Total | 850 (100.0%) | 703 (100.0%) |
Commute Time in Waterford
The most frequently occuring commute durations in Waterford are 5 to 9 minutes (237 commuters, 16.2%), 20 to 24 minutes (237 commuters, 16.2%), and 10 to 14 minutes (236 commuters, 16.1%).
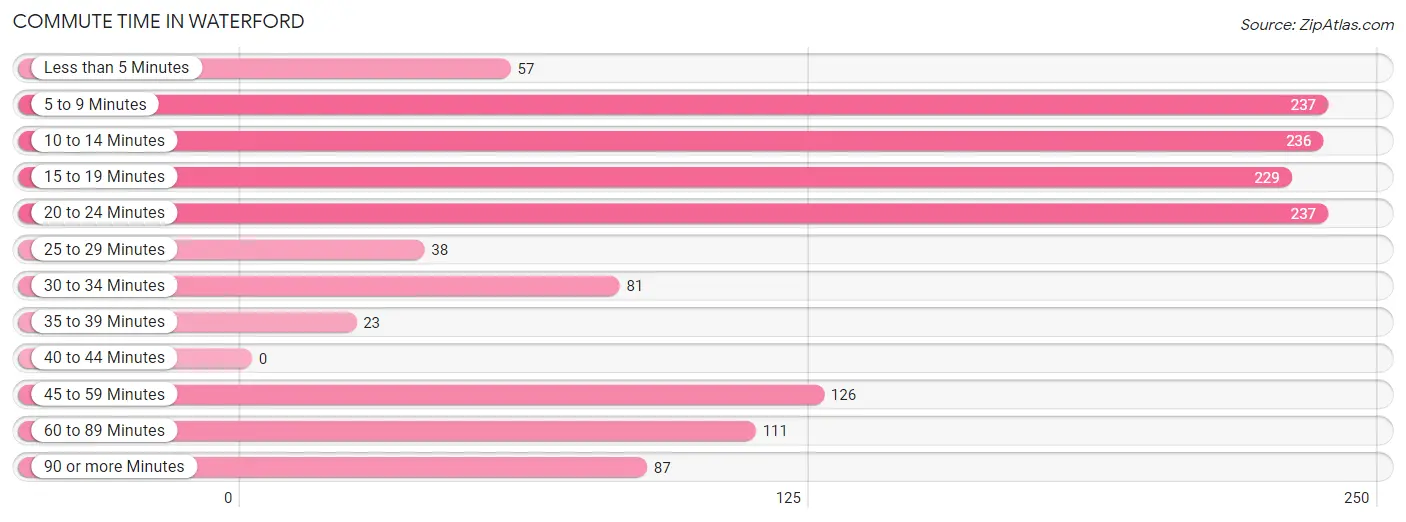
| Commute Time | # Commuters | % Commuters |
| Less than 5 Minutes | 57 | 3.9% |
| 5 to 9 Minutes | 237 | 16.2% |
| 10 to 14 Minutes | 236 | 16.1% |
| 15 to 19 Minutes | 229 | 15.7% |
| 20 to 24 Minutes | 237 | 16.2% |
| 25 to 29 Minutes | 38 | 2.6% |
| 30 to 34 Minutes | 81 | 5.5% |
| 35 to 39 Minutes | 23 | 1.6% |
| 40 to 44 Minutes | 0 | 0.0% |
| 45 to 59 Minutes | 126 | 8.6% |
| 60 to 89 Minutes | 111 | 7.6% |
| 90 or more Minutes | 87 | 5.9% |
Commute Time by Sex in Waterford
The most common commute times in Waterford are 10 to 14 minutes (152 commuters, 19.1%) for males and 5 to 9 minutes (146 commuters, 21.9%) for females.
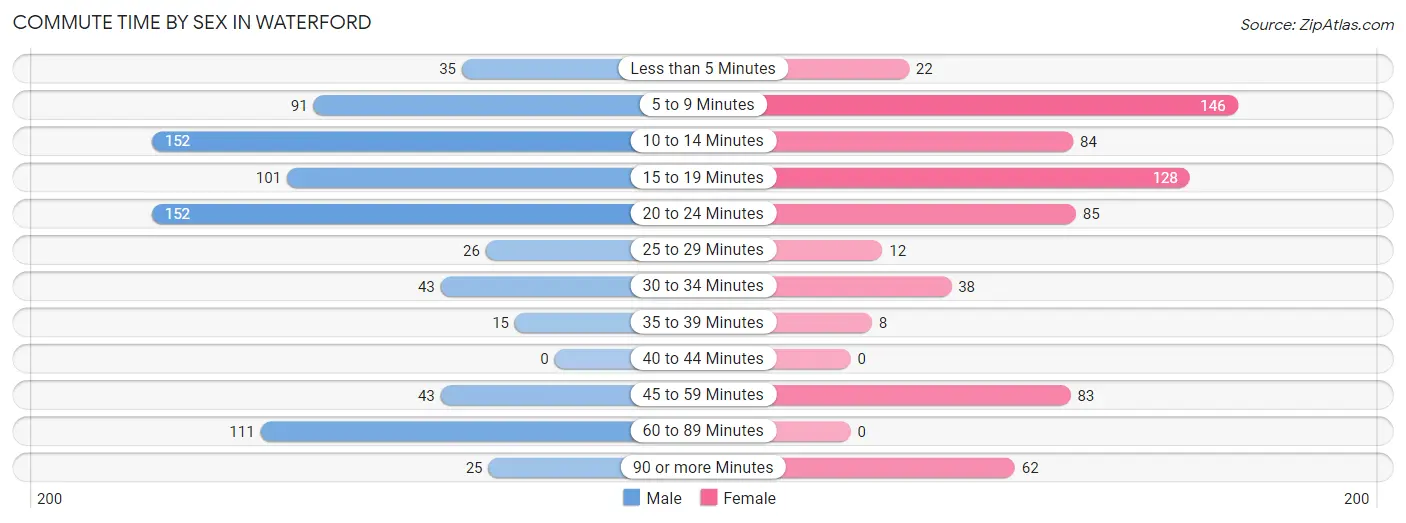
| Commute Time | Male | Female |
| Less than 5 Minutes | 35 (4.4%) | 22 (3.3%) |
| 5 to 9 Minutes | 91 (11.5%) | 146 (21.9%) |
| 10 to 14 Minutes | 152 (19.1%) | 84 (12.6%) |
| 15 to 19 Minutes | 101 (12.7%) | 128 (19.2%) |
| 20 to 24 Minutes | 152 (19.1%) | 85 (12.7%) |
| 25 to 29 Minutes | 26 (3.3%) | 12 (1.8%) |
| 30 to 34 Minutes | 43 (5.4%) | 38 (5.7%) |
| 35 to 39 Minutes | 15 (1.9%) | 8 (1.2%) |
| 40 to 44 Minutes | 0 (0.0%) | 0 (0.0%) |
| 45 to 59 Minutes | 43 (5.4%) | 83 (12.4%) |
| 60 to 89 Minutes | 111 (14.0%) | 0 (0.0%) |
| 90 or more Minutes | 25 (3.2%) | 62 (9.3%) |
Time of Departure to Work by Sex in Waterford
The most frequent times of departure to work in Waterford are 7:00 AM to 7:29 AM (150, 18.9%) for males and 7:00 AM to 7:29 AM (183, 27.4%) for females.
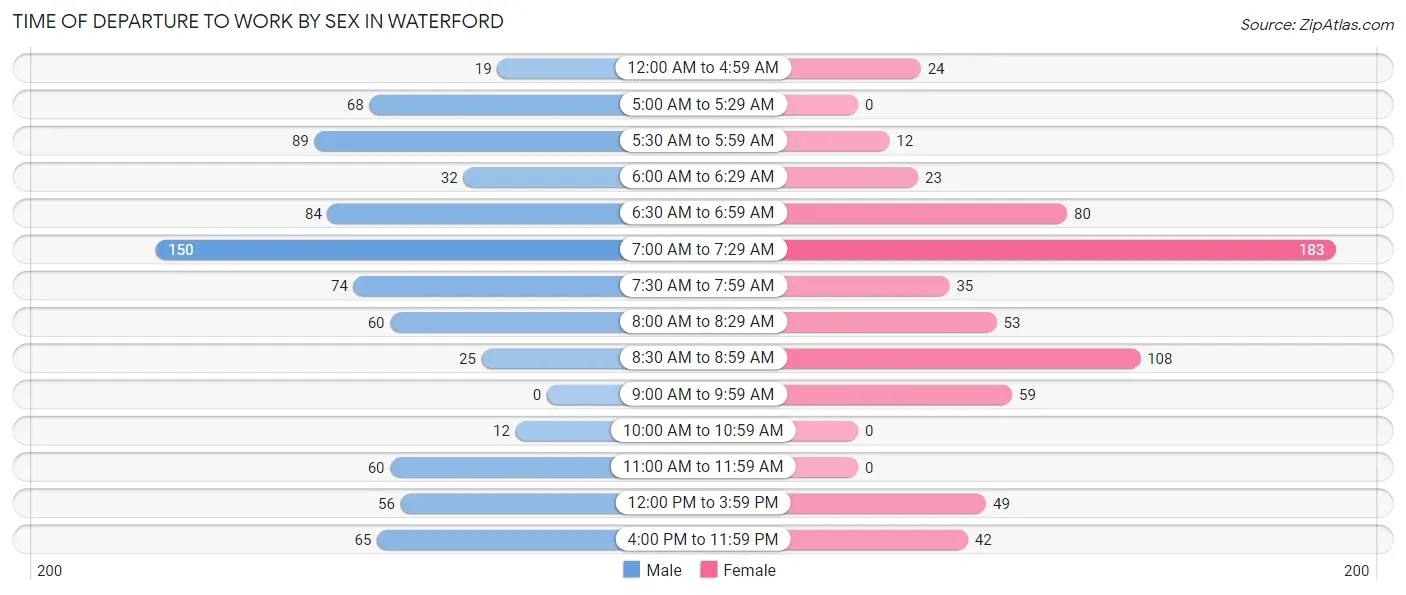
| Time of Departure | Male | Female |
| 12:00 AM to 4:59 AM | 19 (2.4%) | 24 (3.6%) |
| 5:00 AM to 5:29 AM | 68 (8.6%) | 0 (0.0%) |
| 5:30 AM to 5:59 AM | 89 (11.2%) | 12 (1.8%) |
| 6:00 AM to 6:29 AM | 32 (4.0%) | 23 (3.4%) |
| 6:30 AM to 6:59 AM | 84 (10.6%) | 80 (12.0%) |
| 7:00 AM to 7:29 AM | 150 (18.9%) | 183 (27.4%) |
| 7:30 AM to 7:59 AM | 74 (9.3%) | 35 (5.2%) |
| 8:00 AM to 8:29 AM | 60 (7.6%) | 53 (7.9%) |
| 8:30 AM to 8:59 AM | 25 (3.2%) | 108 (16.2%) |
| 9:00 AM to 9:59 AM | 0 (0.0%) | 59 (8.8%) |
| 10:00 AM to 10:59 AM | 12 (1.5%) | 0 (0.0%) |
| 11:00 AM to 11:59 AM | 60 (7.6%) | 0 (0.0%) |
| 12:00 PM to 3:59 PM | 56 (7.0%) | 49 (7.3%) |
| 4:00 PM to 11:59 PM | 65 (8.2%) | 42 (6.3%) |
| Total | 794 (100.0%) | 668 (100.0%) |
Housing Occupancy in Waterford
Occupancy by Ownership in Waterford
Of the total 1,496 dwellings in Waterford, owner-occupied units account for 1,026 (68.6%), while renter-occupied units make up 470 (31.4%).
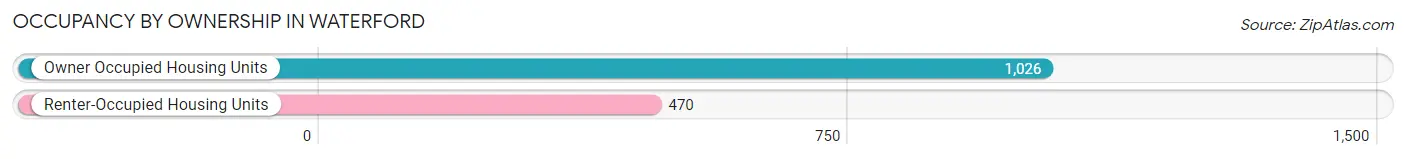
| Occupancy | # Housing Units | % Housing Units |
| Owner Occupied Housing Units | 1,026 | 68.6% |
| Renter-Occupied Housing Units | 470 | 31.4% |
| Total Occupied Housing Units | 1,496 | 100.0% |
Occupancy by Household Size in Waterford
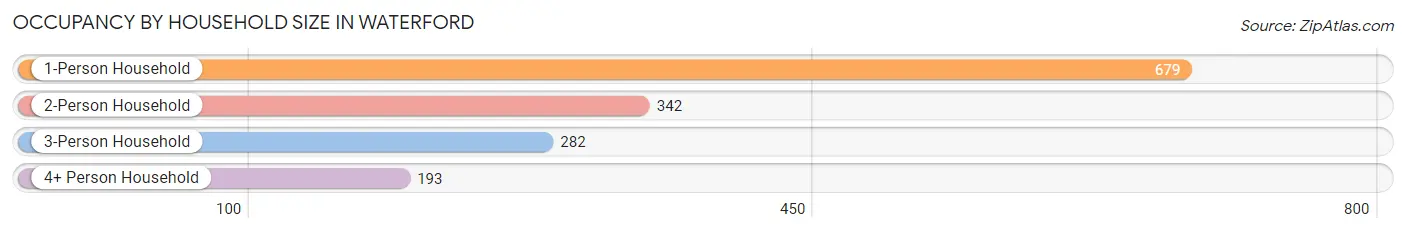
| Household Size | # Housing Units | % Housing Units |
| 1-Person Household | 679 | 45.4% |
| 2-Person Household | 342 | 22.9% |
| 3-Person Household | 282 | 18.9% |
| 4+ Person Household | 193 | 12.9% |
| Total Housing Units | 1,496 | 100.0% |
Occupancy by Ownership by Household Size in Waterford
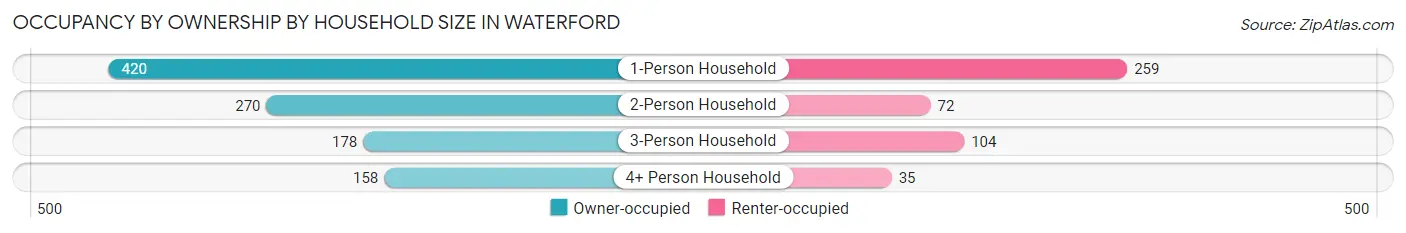
| Household Size | Owner-occupied | Renter-occupied |
| 1-Person Household | 420 (61.9%) | 259 (38.1%) |
| 2-Person Household | 270 (78.9%) | 72 (21.0%) |
| 3-Person Household | 178 (63.1%) | 104 (36.9%) |
| 4+ Person Household | 158 (81.9%) | 35 (18.1%) |
| Total Housing Units | 1,026 (68.6%) | 470 (31.4%) |
Occupancy by Educational Attainment in Waterford
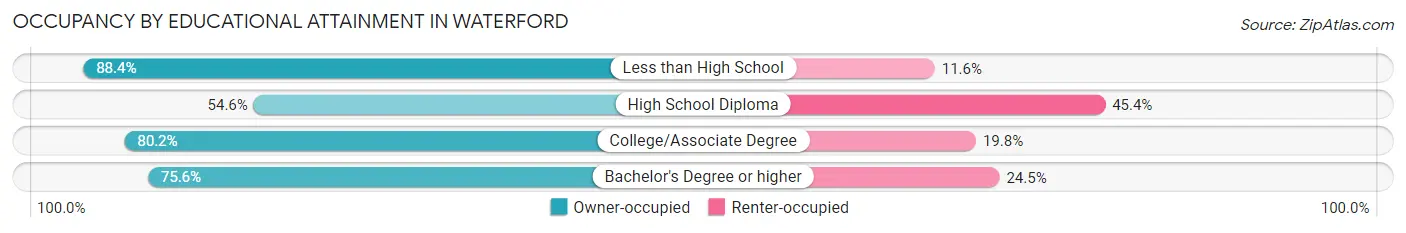
| Household Size | Owner-occupied | Renter-occupied |
| Less than High School | 38 (88.4%) | 5 (11.6%) |
| High School Diploma | 333 (54.6%) | 277 (45.4%) |
| College/Associate Degree | 312 (80.2%) | 77 (19.8%) |
| Bachelor's Degree or higher | 343 (75.5%) | 111 (24.4%) |
Occupancy by Age of Householder in Waterford
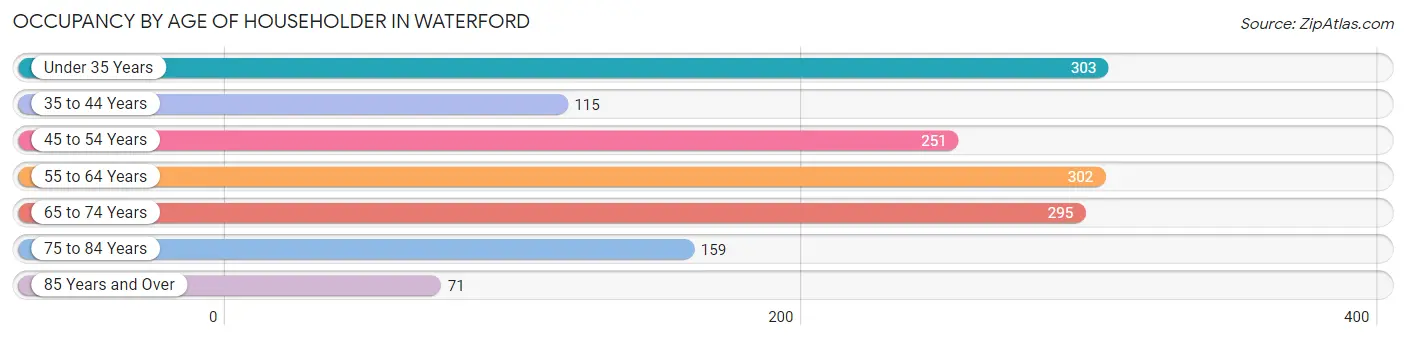
| Age Bracket | # Households | % Households |
| Under 35 Years | 303 | 20.3% |
| 35 to 44 Years | 115 | 7.7% |
| 45 to 54 Years | 251 | 16.8% |
| 55 to 64 Years | 302 | 20.2% |
| 65 to 74 Years | 295 | 19.7% |
| 75 to 84 Years | 159 | 10.6% |
| 85 Years and Over | 71 | 4.8% |
| Total | 1,496 | 100.0% |
Housing Finances in Waterford
Median Income by Occupancy in Waterford
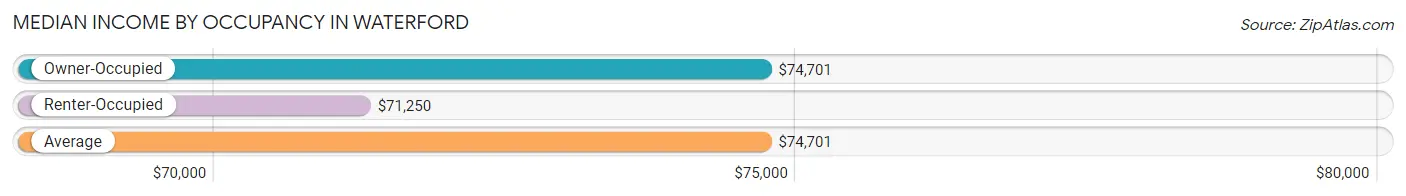
| Occupancy Type | # Households | Median Income |
| Owner-Occupied | 1,026 (68.6%) | $74,701 |
| Renter-Occupied | 470 (31.4%) | $71,250 |
| Average | 1,496 (100.0%) | $74,701 |
Occupancy by Householder Income Bracket in Waterford
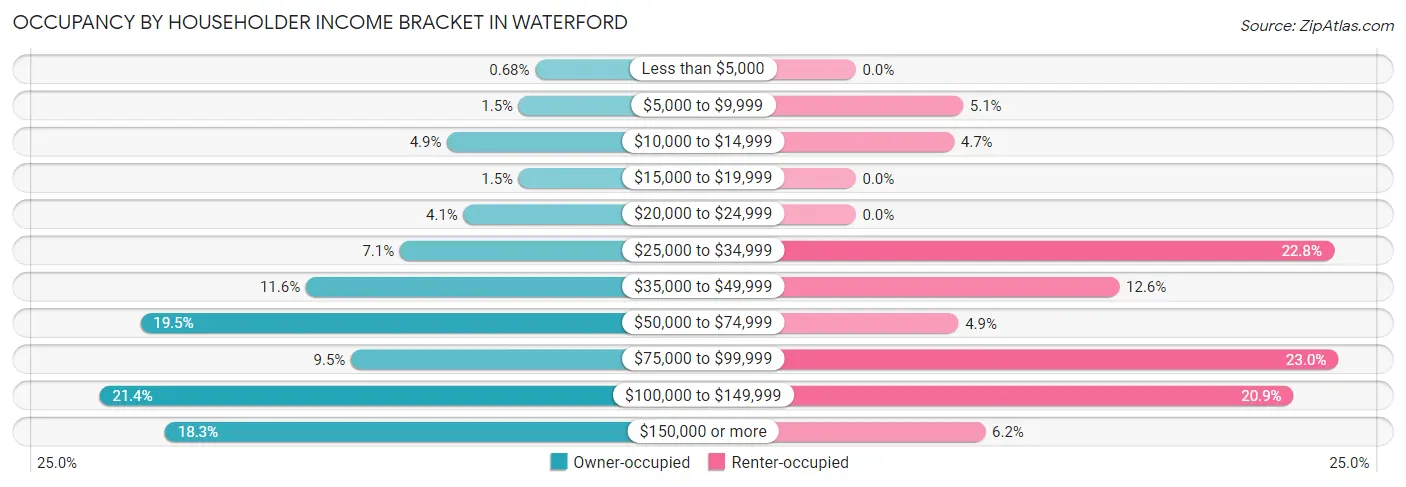
| Income Bracket | Owner-occupied | Renter-occupied |
| Less than $5,000 | 7 (0.7%) | 0 (0.0%) |
| $5,000 to $9,999 | 15 (1.5%) | 24 (5.1%) |
| $10,000 to $14,999 | 50 (4.9%) | 22 (4.7%) |
| $15,000 to $19,999 | 15 (1.5%) | 0 (0.0%) |
| $20,000 to $24,999 | 42 (4.1%) | 0 (0.0%) |
| $25,000 to $34,999 | 73 (7.1%) | 107 (22.8%) |
| $35,000 to $49,999 | 119 (11.6%) | 59 (12.6%) |
| $50,000 to $74,999 | 200 (19.5%) | 23 (4.9%) |
| $75,000 to $99,999 | 97 (9.5%) | 108 (23.0%) |
| $100,000 to $149,999 | 220 (21.4%) | 98 (20.8%) |
| $150,000 or more | 188 (18.3%) | 29 (6.2%) |
| Total | 1,026 (100.0%) | 470 (100.0%) |
Monthly Housing Cost Tiers in Waterford
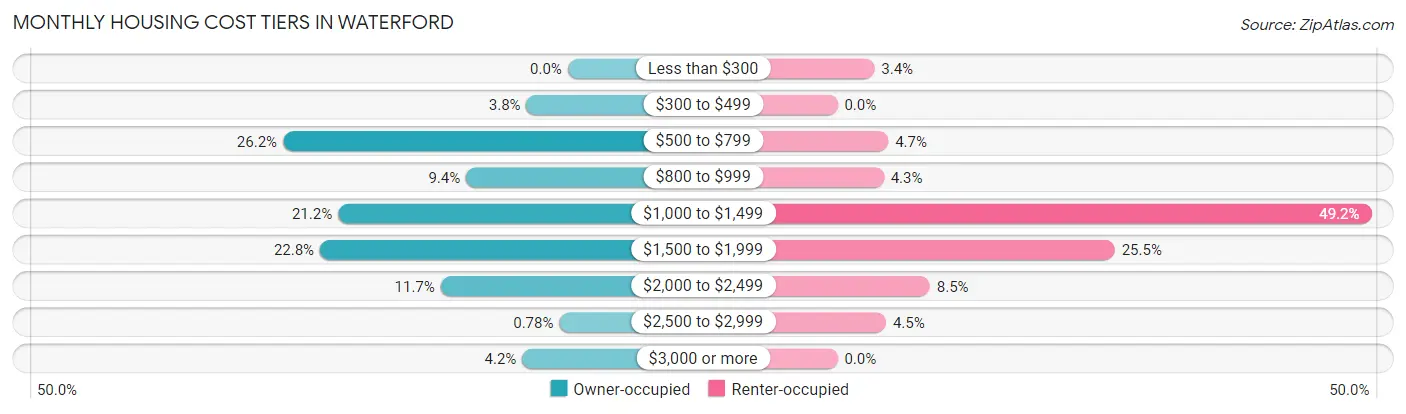
| Monthly Cost | Owner-occupied | Renter-occupied |
| Less than $300 | 0 (0.0%) | 16 (3.4%) |
| $300 to $499 | 39 (3.8%) | 0 (0.0%) |
| $500 to $799 | 269 (26.2%) | 22 (4.7%) |
| $800 to $999 | 96 (9.4%) | 20 (4.3%) |
| $1,000 to $1,499 | 217 (21.1%) | 231 (49.1%) |
| $1,500 to $1,999 | 234 (22.8%) | 120 (25.5%) |
| $2,000 to $2,499 | 120 (11.7%) | 40 (8.5%) |
| $2,500 to $2,999 | 8 (0.8%) | 21 (4.5%) |
| $3,000 or more | 43 (4.2%) | 0 (0.0%) |
| Total | 1,026 (100.0%) | 470 (100.0%) |
Physical Housing Characteristics in Waterford
Housing Structures in Waterford
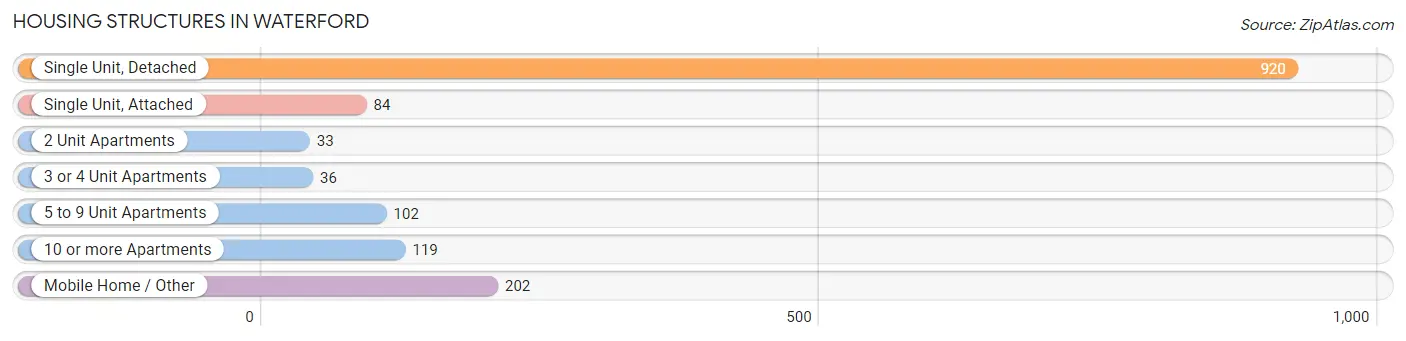
| Structure Type | # Housing Units | % Housing Units |
| Single Unit, Detached | 920 | 61.5% |
| Single Unit, Attached | 84 | 5.6% |
| 2 Unit Apartments | 33 | 2.2% |
| 3 or 4 Unit Apartments | 36 | 2.4% |
| 5 to 9 Unit Apartments | 102 | 6.8% |
| 10 or more Apartments | 119 | 8.0% |
| Mobile Home / Other | 202 | 13.5% |
| Total | 1,496 | 100.0% |
Housing Structures by Occupancy in Waterford
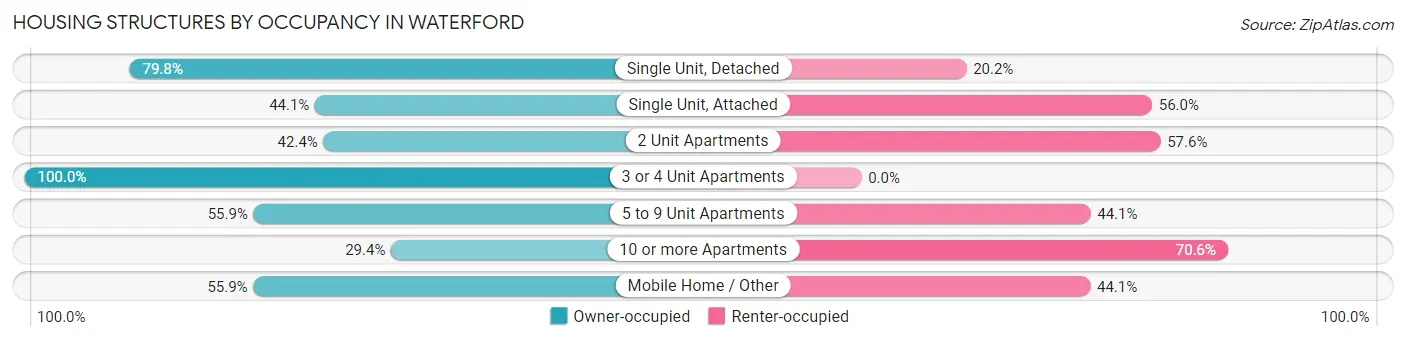
| Structure Type | Owner-occupied | Renter-occupied |
| Single Unit, Detached | 734 (79.8%) | 186 (20.2%) |
| Single Unit, Attached | 37 (44.1%) | 47 (55.9%) |
| 2 Unit Apartments | 14 (42.4%) | 19 (57.6%) |
| 3 or 4 Unit Apartments | 36 (100.0%) | 0 (0.0%) |
| 5 to 9 Unit Apartments | 57 (55.9%) | 45 (44.1%) |
| 10 or more Apartments | 35 (29.4%) | 84 (70.6%) |
| Mobile Home / Other | 113 (55.9%) | 89 (44.1%) |
| Total | 1,026 (68.6%) | 470 (31.4%) |
Housing Structures by Number of Rooms in Waterford
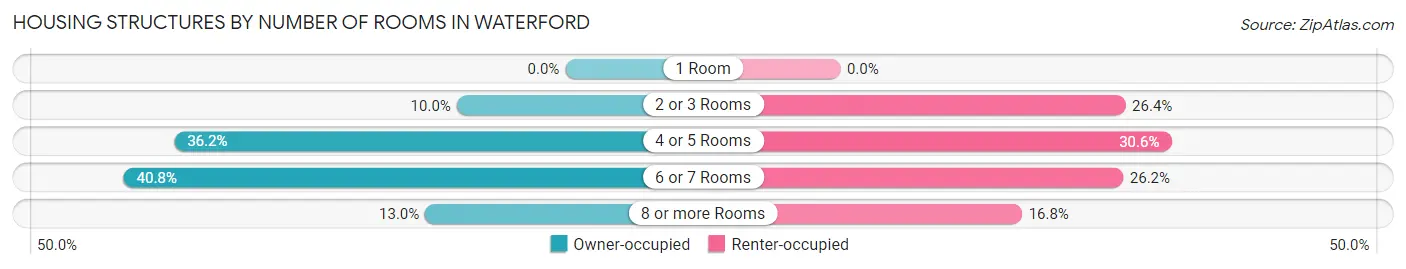
| Number of Rooms | Owner-occupied | Renter-occupied |
| 1 Room | 0 (0.0%) | 0 (0.0%) |
| 2 or 3 Rooms | 103 (10.0%) | 124 (26.4%) |
| 4 or 5 Rooms | 371 (36.2%) | 144 (30.6%) |
| 6 or 7 Rooms | 419 (40.8%) | 123 (26.2%) |
| 8 or more Rooms | 133 (13.0%) | 79 (16.8%) |
| Total | 1,026 (100.0%) | 470 (100.0%) |
Housing Structure by Heating Type in Waterford
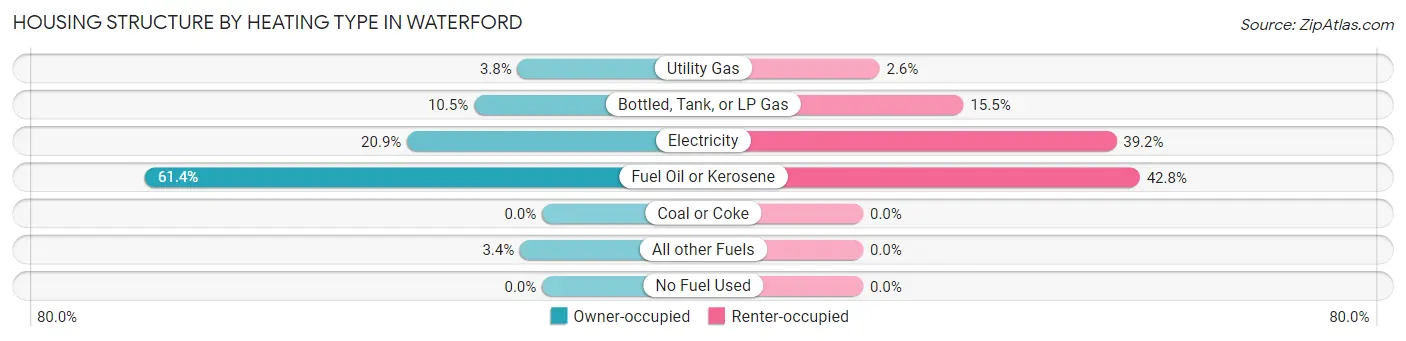
| Heating Type | Owner-occupied | Renter-occupied |
| Utility Gas | 39 (3.8%) | 12 (2.5%) |
| Bottled, Tank, or LP Gas | 108 (10.5%) | 73 (15.5%) |
| Electricity | 214 (20.9%) | 184 (39.2%) |
| Fuel Oil or Kerosene | 630 (61.4%) | 201 (42.8%) |
| Coal or Coke | 0 (0.0%) | 0 (0.0%) |
| All other Fuels | 35 (3.4%) | 0 (0.0%) |
| No Fuel Used | 0 (0.0%) | 0 (0.0%) |
| Total | 1,026 (100.0%) | 470 (100.0%) |
Household Vehicle Usage in Waterford
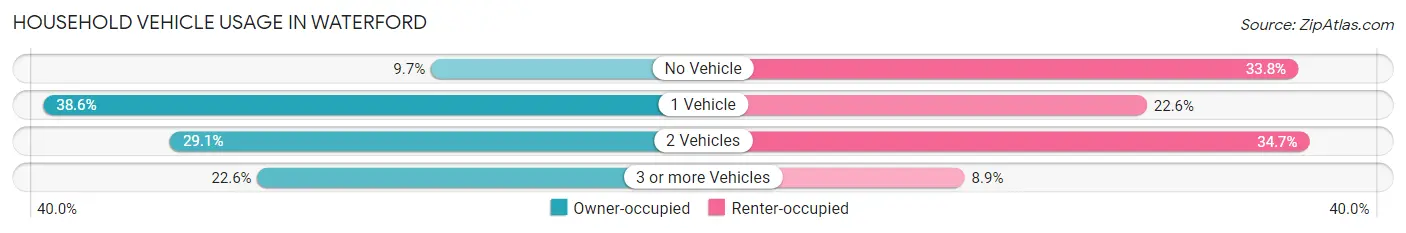
| Vehicles per Household | Owner-occupied | Renter-occupied |
| No Vehicle | 99 (9.7%) | 159 (33.8%) |
| 1 Vehicle | 396 (38.6%) | 106 (22.6%) |
| 2 Vehicles | 299 (29.1%) | 163 (34.7%) |
| 3 or more Vehicles | 232 (22.6%) | 42 (8.9%) |
| Total | 1,026 (100.0%) | 470 (100.0%) |
Real Estate & Mortgages in Waterford
Real Estate and Mortgage Overview in Waterford
| Characteristic | Without Mortgage | With Mortgage |
| Housing Units | 425 | 601 |
| Median Property Value | $204,100 | $236,800 |
| Median Household Income | $62,989 | $120 |
| Monthly Housing Costs | $731 | $43 |
| Real Estate Taxes | $3,148 | $0 |
Property Value by Mortgage Status in Waterford
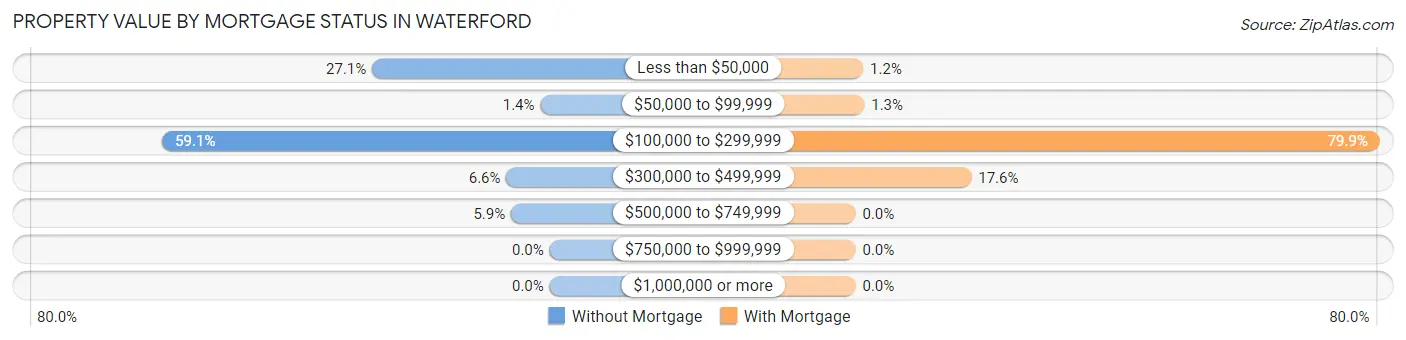
| Property Value | Without Mortgage | With Mortgage |
| Less than $50,000 | 115 (27.1%) | 7 (1.2%) |
| $50,000 to $99,999 | 6 (1.4%) | 8 (1.3%) |
| $100,000 to $299,999 | 251 (59.1%) | 480 (79.9%) |
| $300,000 to $499,999 | 28 (6.6%) | 106 (17.6%) |
| $500,000 to $749,999 | 25 (5.9%) | 0 (0.0%) |
| $750,000 to $999,999 | 0 (0.0%) | 0 (0.0%) |
| $1,000,000 or more | 0 (0.0%) | 0 (0.0%) |
| Total | 425 (100.0%) | 601 (100.0%) |
Household Income by Mortgage Status in Waterford
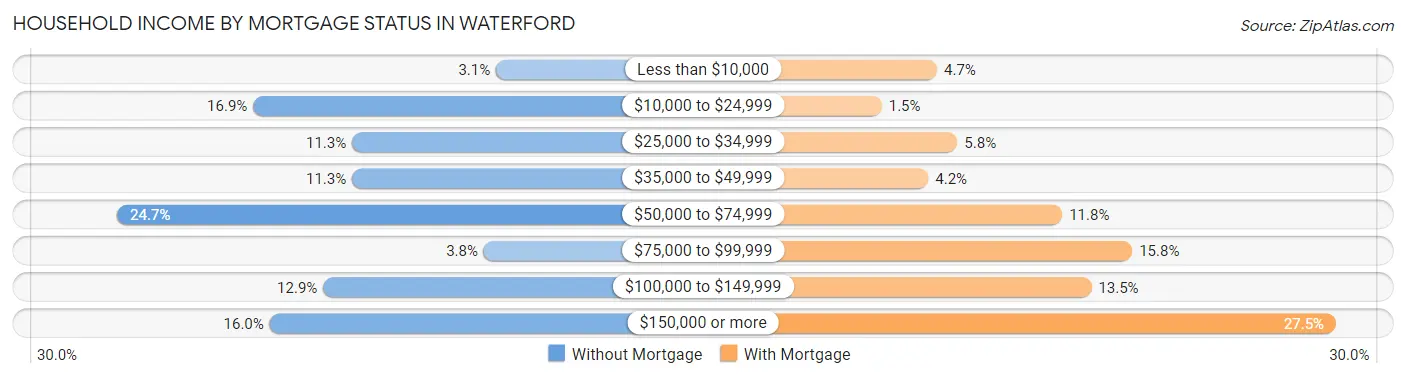
| Household Income | Without Mortgage | With Mortgage |
| Less than $10,000 | 13 (3.1%) | 28 (4.7%) |
| $10,000 to $24,999 | 72 (16.9%) | 9 (1.5%) |
| $25,000 to $34,999 | 48 (11.3%) | 35 (5.8%) |
| $35,000 to $49,999 | 48 (11.3%) | 25 (4.2%) |
| $50,000 to $74,999 | 105 (24.7%) | 71 (11.8%) |
| $75,000 to $99,999 | 16 (3.8%) | 95 (15.8%) |
| $100,000 to $149,999 | 55 (12.9%) | 81 (13.5%) |
| $150,000 or more | 68 (16.0%) | 165 (27.5%) |
| Total | 425 (100.0%) | 601 (100.0%) |
Property Value to Household Income Ratio in Waterford
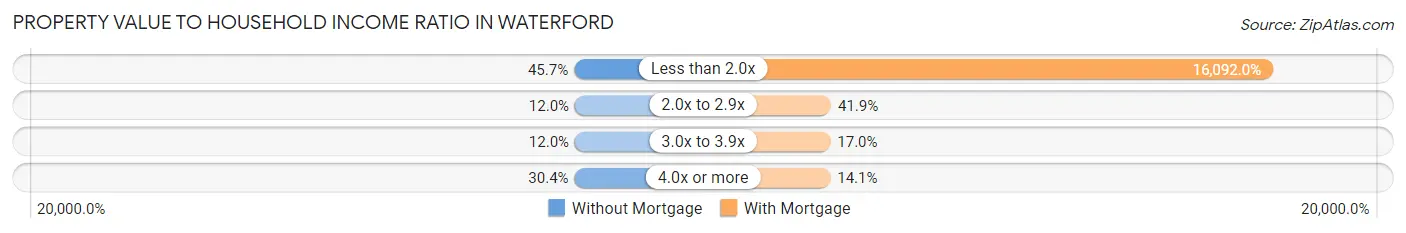
| Value-to-Income Ratio | Without Mortgage | With Mortgage |
| Less than 2.0x | 194 (45.7%) | 96,713 (16,092.0%) |
| 2.0x to 2.9x | 51 (12.0%) | 252 (41.9%) |
| 3.0x to 3.9x | 51 (12.0%) | 102 (17.0%) |
| 4.0x or more | 129 (30.3%) | 85 (14.1%) |
| Total | 425 (100.0%) | 601 (100.0%) |
Real Estate Taxes by Mortgage Status in Waterford
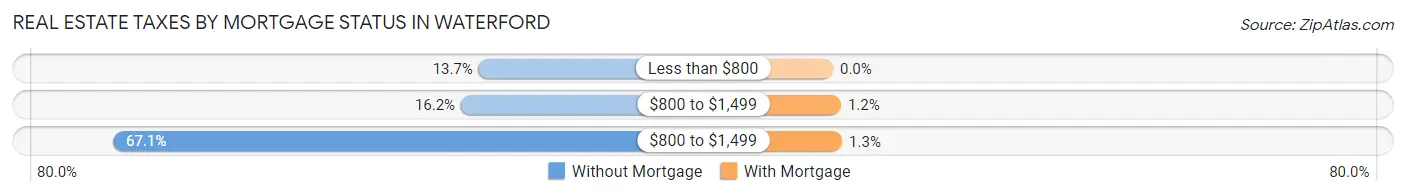
| Property Taxes | Without Mortgage | With Mortgage |
| Less than $800 | 58 (13.7%) | 0 (0.0%) |
| $800 to $1,499 | 69 (16.2%) | 7 (1.2%) |
| $800 to $1,499 | 285 (67.1%) | 8 (1.3%) |
| Total | 425 (100.0%) | 601 (100.0%) |
Health & Disability in Waterford
Health Insurance Coverage by Age in Waterford
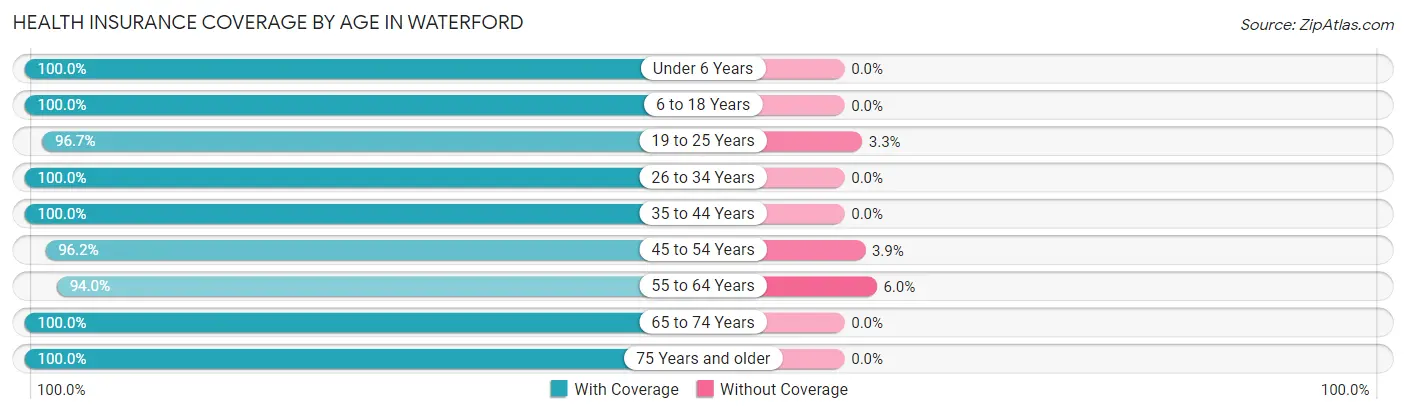
| Age Bracket | With Coverage | Without Coverage |
| Under 6 Years | 107 (100.0%) | 0 (0.0%) |
| 6 to 18 Years | 437 (100.0%) | 0 (0.0%) |
| 19 to 25 Years | 325 (96.7%) | 11 (3.3%) |
| 26 to 34 Years | 415 (100.0%) | 0 (0.0%) |
| 35 to 44 Years | 322 (100.0%) | 0 (0.0%) |
| 45 to 54 Years | 400 (96.2%) | 16 (3.8%) |
| 55 to 64 Years | 423 (94.0%) | 27 (6.0%) |
| 65 to 74 Years | 357 (100.0%) | 0 (0.0%) |
| 75 Years and older | 314 (100.0%) | 0 (0.0%) |
| Total | 3,100 (98.3%) | 54 (1.7%) |
Health Insurance Coverage by Citizenship Status in Waterford
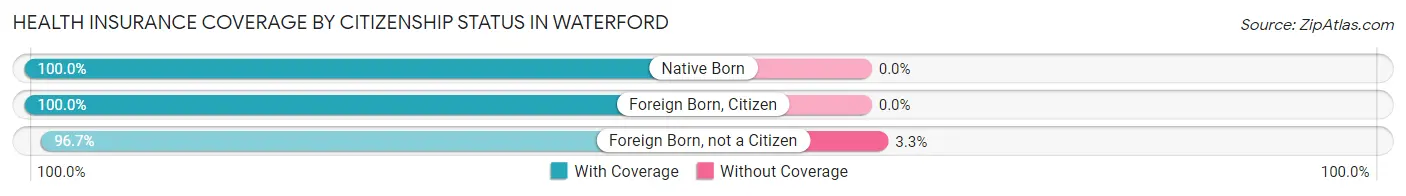
| Citizenship Status | With Coverage | Without Coverage |
| Native Born | 107 (100.0%) | 0 (0.0%) |
| Foreign Born, Citizen | 437 (100.0%) | 0 (0.0%) |
| Foreign Born, not a Citizen | 325 (96.7%) | 11 (3.3%) |
Health Insurance Coverage by Household Income in Waterford
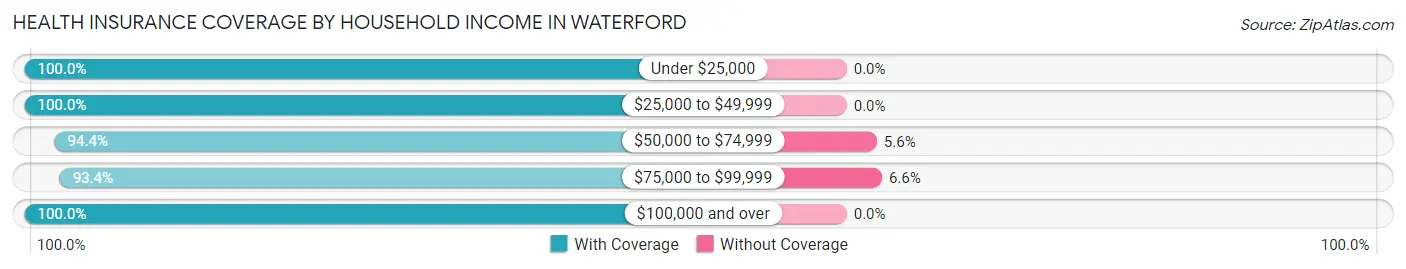
| Household Income | With Coverage | Without Coverage |
| Under $25,000 | 203 (100.0%) | 0 (0.0%) |
| $25,000 to $49,999 | 551 (100.0%) | 0 (0.0%) |
| $50,000 to $74,999 | 318 (94.4%) | 19 (5.6%) |
| $75,000 to $99,999 | 496 (93.4%) | 35 (6.6%) |
| $100,000 and over | 1,518 (100.0%) | 0 (0.0%) |
Public vs Private Health Insurance Coverage by Age in Waterford
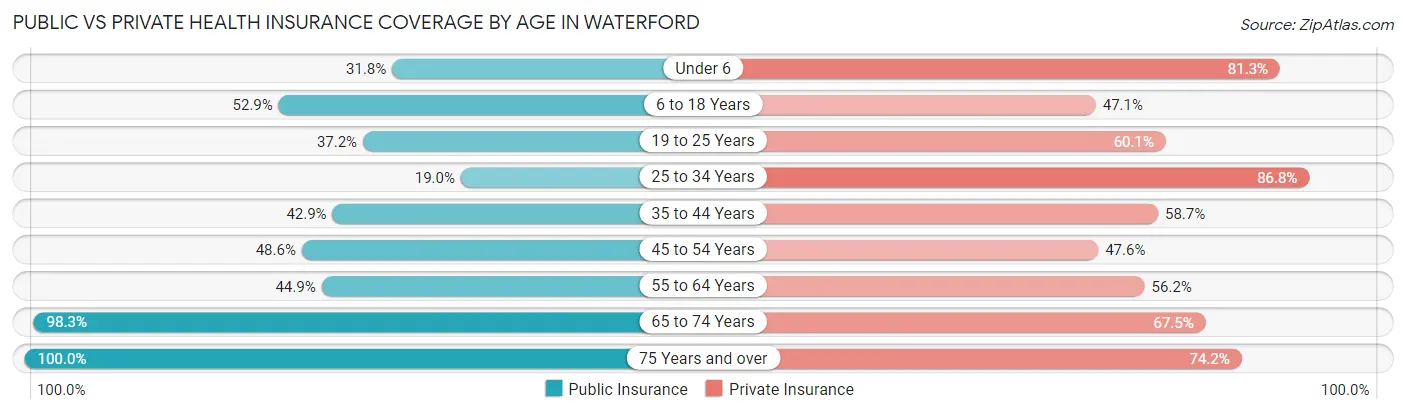
| Age Bracket | Public Insurance | Private Insurance |
| Under 6 | 34 (31.8%) | 87 (81.3%) |
| 6 to 18 Years | 231 (52.9%) | 206 (47.1%) |
| 19 to 25 Years | 125 (37.2%) | 202 (60.1%) |
| 25 to 34 Years | 79 (19.0%) | 360 (86.8%) |
| 35 to 44 Years | 138 (42.9%) | 189 (58.7%) |
| 45 to 54 Years | 202 (48.6%) | 198 (47.6%) |
| 55 to 64 Years | 202 (44.9%) | 253 (56.2%) |
| 65 to 74 Years | 351 (98.3%) | 241 (67.5%) |
| 75 Years and over | 314 (100.0%) | 233 (74.2%) |
| Total | 1,676 (53.1%) | 1,969 (62.4%) |
Disability Status by Sex by Age in Waterford
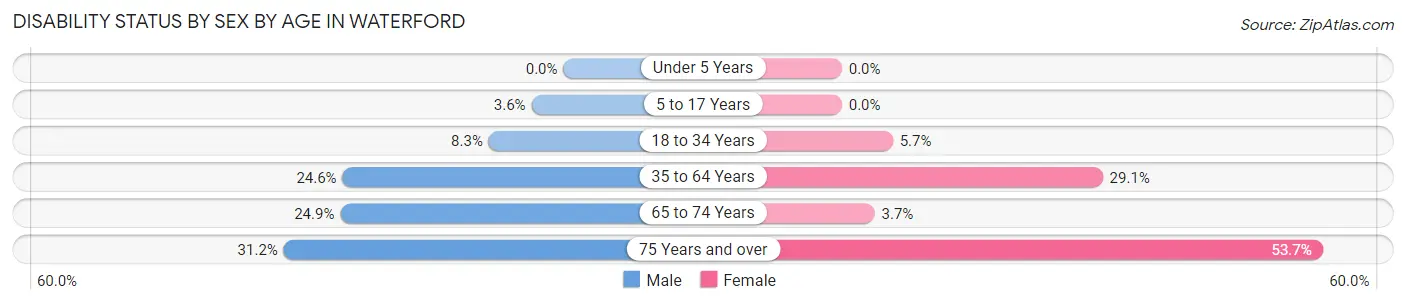
| Age Bracket | Male | Female |
| Under 5 Years | 0 (0.0%) | 0 (0.0%) |
| 5 to 17 Years | 5 (3.5%) | 0 (0.0%) |
| 18 to 34 Years | 31 (8.3%) | 22 (5.7%) |
| 35 to 64 Years | 139 (24.6%) | 181 (29.0%) |
| 65 to 74 Years | 41 (24.8%) | 7 (3.6%) |
| 75 Years and over | 38 (31.1%) | 103 (53.6%) |
Disability Class by Sex by Age in Waterford
Disability Class: Hearing Difficulty
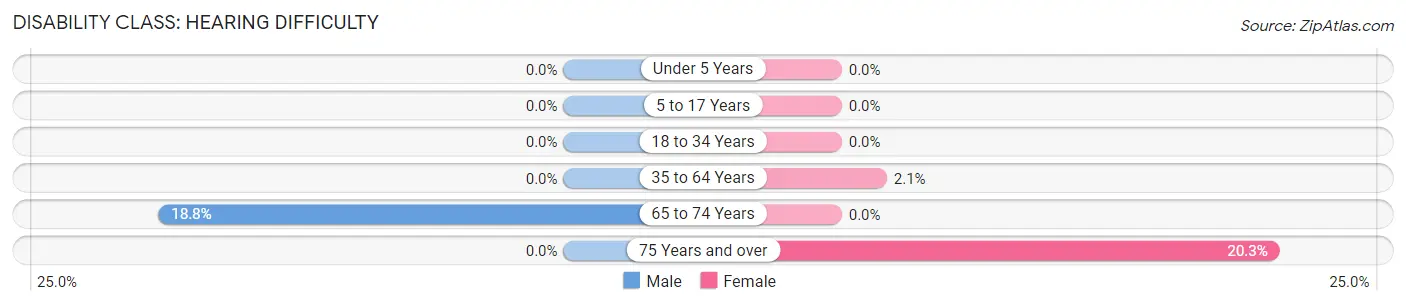
| Age Bracket | Male | Female |
| Under 5 Years | 0 (0.0%) | 0 (0.0%) |
| 5 to 17 Years | 0 (0.0%) | 0 (0.0%) |
| 18 to 34 Years | 0 (0.0%) | 0 (0.0%) |
| 35 to 64 Years | 0 (0.0%) | 13 (2.1%) |
| 65 to 74 Years | 31 (18.8%) | 0 (0.0%) |
| 75 Years and over | 0 (0.0%) | 39 (20.3%) |
Disability Class: Vision Difficulty
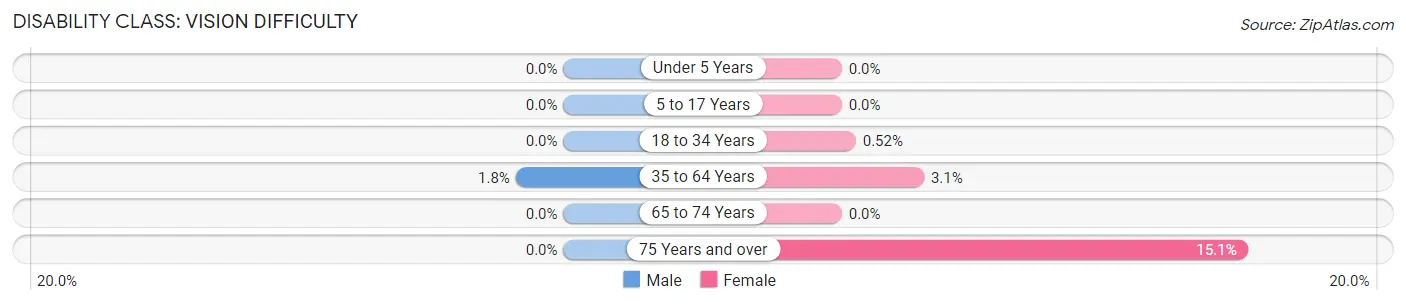
| Age Bracket | Male | Female |
| Under 5 Years | 0 (0.0%) | 0 (0.0%) |
| 5 to 17 Years | 0 (0.0%) | 0 (0.0%) |
| 18 to 34 Years | 0 (0.0%) | 2 (0.5%) |
| 35 to 64 Years | 10 (1.8%) | 19 (3.0%) |
| 65 to 74 Years | 0 (0.0%) | 0 (0.0%) |
| 75 Years and over | 0 (0.0%) | 29 (15.1%) |
Disability Class: Cognitive Difficulty
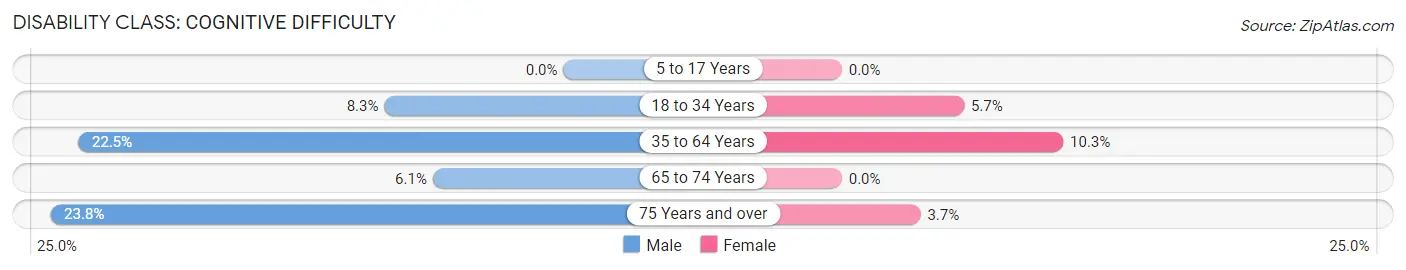
| Age Bracket | Male | Female |
| 5 to 17 Years | 0 (0.0%) | 0 (0.0%) |
| 18 to 34 Years | 31 (8.3%) | 22 (5.7%) |
| 35 to 64 Years | 127 (22.5%) | 64 (10.3%) |
| 65 to 74 Years | 10 (6.1%) | 0 (0.0%) |
| 75 Years and over | 29 (23.8%) | 7 (3.6%) |
Disability Class: Ambulatory Difficulty
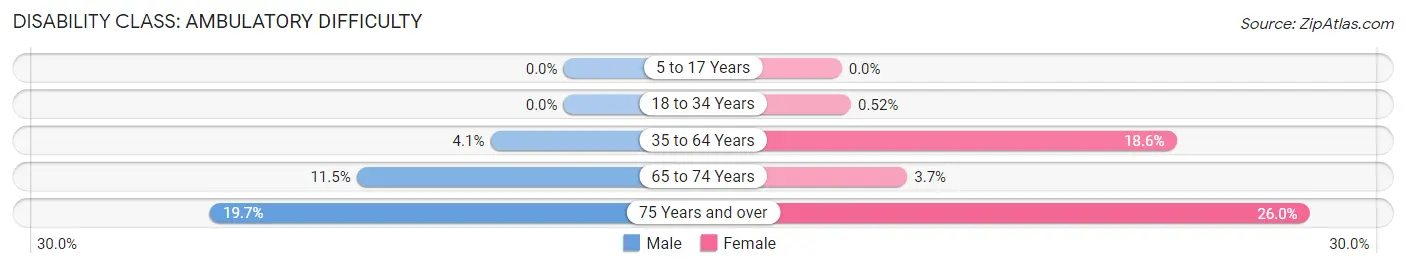
| Age Bracket | Male | Female |
| 5 to 17 Years | 0 (0.0%) | 0 (0.0%) |
| 18 to 34 Years | 0 (0.0%) | 2 (0.5%) |
| 35 to 64 Years | 23 (4.1%) | 116 (18.6%) |
| 65 to 74 Years | 19 (11.5%) | 7 (3.6%) |
| 75 Years and over | 24 (19.7%) | 50 (26.0%) |
Disability Class: Self-Care Difficulty
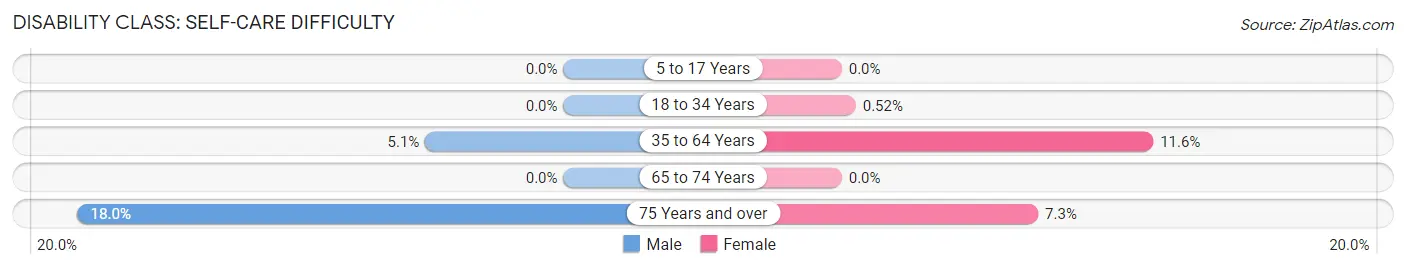
| Age Bracket | Male | Female |
| 5 to 17 Years | 0 (0.0%) | 0 (0.0%) |
| 18 to 34 Years | 0 (0.0%) | 2 (0.5%) |
| 35 to 64 Years | 29 (5.1%) | 72 (11.6%) |
| 65 to 74 Years | 0 (0.0%) | 0 (0.0%) |
| 75 Years and over | 22 (18.0%) | 14 (7.3%) |
Technology Access in Waterford
Computing Device Access in Waterford
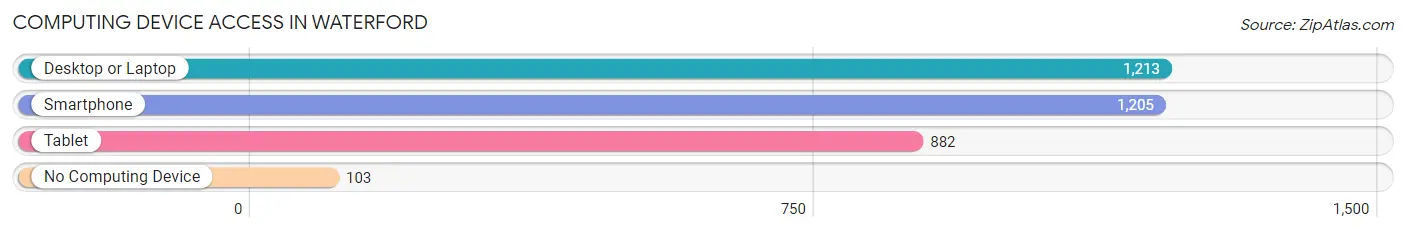
| Device Type | # Households | % Households |
| Desktop or Laptop | 1,213 | 81.1% |
| Smartphone | 1,205 | 80.5% |
| Tablet | 882 | 59.0% |
| No Computing Device | 103 | 6.9% |
| Total | 1,496 | 100.0% |
Internet Access in Waterford
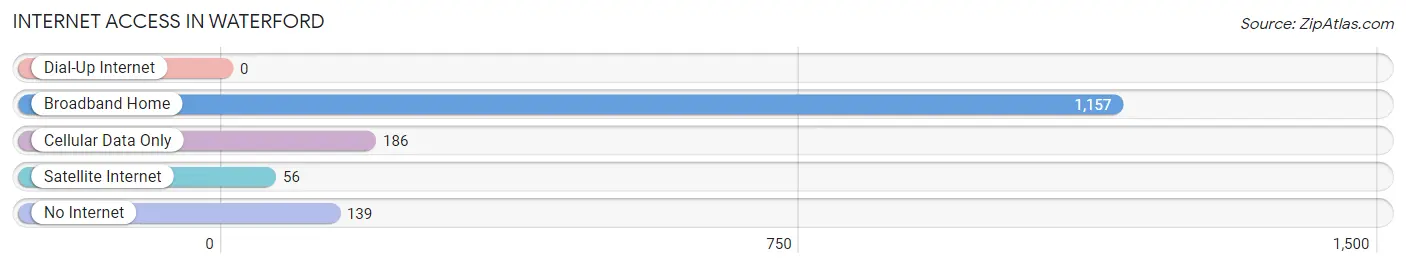
| Internet Type | # Households | % Households |
| Dial-Up Internet | 0 | 0.0% |
| Broadband Home | 1,157 | 77.3% |
| Cellular Data Only | 186 | 12.4% |
| Satellite Internet | 56 | 3.7% |
| No Internet | 139 | 9.3% |
| Total | 1,496 | 100.0% |
Waterford Summary
Waterford, Connecticut is a town located in New London County, Connecticut. It is situated on the east bank of the Thames River, and is bordered by the towns of East Lyme, Groton, Ledyard, Montville, and New London. The town has a population of 19,517 as of the 2010 census, and is the second most populous town in New London County.
History
Waterford was first settled in 1637 by a group of settlers from the Massachusetts Bay Colony. The town was originally part of New London, but was incorporated as its own town in 1801. The town was named after Waterford, Ireland, which was the hometown of one of the original settlers.
The town was an important port during the Revolutionary War, and was the site of several naval battles. During the War of 1812, the town was the site of a major naval battle between the United States and the British.
Geography
Waterford is located in southeastern Connecticut, on the east bank of the Thames River. The town is bordered by the towns of East Lyme, Groton, Ledyard, Montville, and New London. The town has a total area of 28.2 square miles, of which 27.7 square miles is land and 0.5 square miles is water.
The town is located in the Thames River Valley, and is characterized by rolling hills and wooded areas. The highest point in the town is the summit of Great Hill, which has an elevation of 545 feet.
Economy
Waterford is home to several major employers, including Electric Boat, Pfizer, and the United States Coast Guard Academy. The town is also home to several small businesses, including restaurants, retail stores, and professional services.
The town has a strong tourism industry, with several attractions, including the Waterford Historical Society, the Waterford Speedbowl, and the Waterford Country School.
Demographics
As of the 2010 census, Waterford had a population of 19,517. The racial makeup of the town was 94.2% White, 1.7% African American, 0.4% Native American, 1.3% Asian, 0.1% Pacific Islander, 1.2% from other races, and 1.1% from two or more races. Hispanic or Latino of any race were 3.3% of the population.
The median household income in Waterford was $68,945, and the median family income was $80,945. The per capita income for the town was $31,945. About 4.2% of families and 5.7% of the population were below the poverty line, including 6.3% of those under age 18 and 4.2% of those age 65 or over.
Common Questions
What is Per Capita Income in Waterford?
Per Capita income in Waterford is $41,727.
What is the Median Family Income in Waterford?
Median Family Income in Waterford is $100,938.
What is the Median Household income in Waterford?
Median Household Income in Waterford is $74,701.
What is Income or Wage Gap in Waterford?
Income or Wage Gap in Waterford is 25.4%.
Women in Waterford earn 74.6 cents for every dollar earned by a man.
What is Inequality or Gini Index in Waterford?
Inequality or Gini Index in Waterford is 0.40.
What is the Total Population of Waterford?
Total Population of Waterford is 3,276.
What is the Total Male Population of Waterford?
Total Male Population of Waterford is 1,472.
What is the Total Female Population of Waterford?
Total Female Population of Waterford is 1,804.
What is the Ratio of Males per 100 Females in Waterford?
There are 81.60 Males per 100 Females in Waterford.
What is the Ratio of Females per 100 Males in Waterford?
There are 122.55 Females per 100 Males in Waterford.
What is the Median Population Age in Waterford?
Median Population Age in Waterford is 45.2 Years.
What is the Average Family Size in Waterford
Average Family Size in Waterford is 2.9 People.
What is the Average Household Size in Waterford
Average Household Size in Waterford is 2.1 People.
How Large is the Labor Force in Waterford?
There are 1,725 People in the Labor Forcein in Waterford.
What is the Percentage of People in the Labor Force in Waterford?
60.3% of People are in the Labor Force in Waterford.
What is the Unemployment Rate in Waterford?
Unemployment Rate in Waterford is 8.2%.