Orange, CT Map & Demographics
Orange Map
Orange Overview
$61,656
PER CAPITA INCOME
$162,763
AVG FAMILY INCOME
$138,514
AVG HOUSEHOLD INCOME
34.4%
WAGE / INCOME GAP [ % ]
65.6¢/ $1
WAGE / INCOME GAP [ $ ]
$11,969
FAMILY INCOME DEFICIT
0.40
INEQUALITY / GINI INDEX
14,231
TOTAL POPULATION
6,607
MALE POPULATION
7,624
FEMALE POPULATION
86.66
MALES / 100 FEMALES
115.39
FEMALES / 100 MALES
45.7
MEDIAN AGE
3.1
AVG FAMILY SIZE
2.7
AVG HOUSEHOLD SIZE
7,386
LABOR FORCE [ PEOPLE ]
65.4%
PERCENT IN LABOR FORCE
3.8%
UNEMPLOYMENT RATE
Orange Zip Codes
Orange Area Codes
Income in Orange
Income Overview in Orange
Per Capita Income in Orange is $61,656, while median incomes of families and households are $162,763 and $138,514 respectively.
| Characteristic | Number | Measure |
| Per Capita Income | 14,231 | $61,656 |
| Median Family Income | 4,108 | $162,763 |
| Mean Family Income | 4,108 | $186,821 |
| Median Household Income | 5,192 | $138,514 |
| Mean Household Income | 5,192 | $167,978 |
| Income Deficit | 4,108 | $11,969 |
| Wage / Income Gap (%) | 14,231 | 34.44% |
| Wage / Income Gap ($) | 14,231 | 65.56¢ per $1 |
| Gini / Inequality Index | 14,231 | 0.40 |
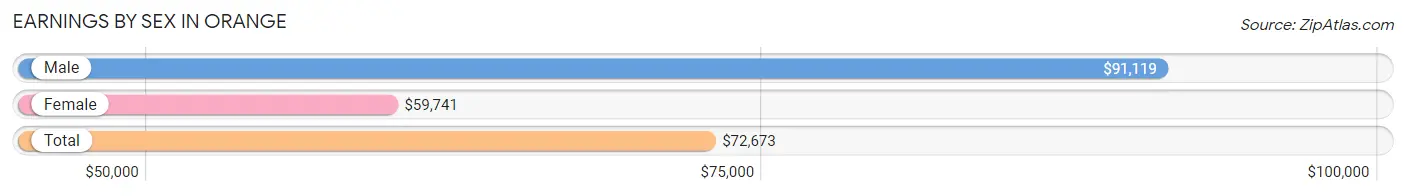
Earnings by Sex in Orange
Average Earnings in Orange are $72,673, $91,119 for men and $59,741 for women, a difference of 34.4%.
| Sex | Number | Average Earnings |
| Male | 3,810 (49.2%) | $91,119 |
| Female | 3,932 (50.8%) | $59,741 |
| Total | 7,742 (100.0%) | $72,673 |
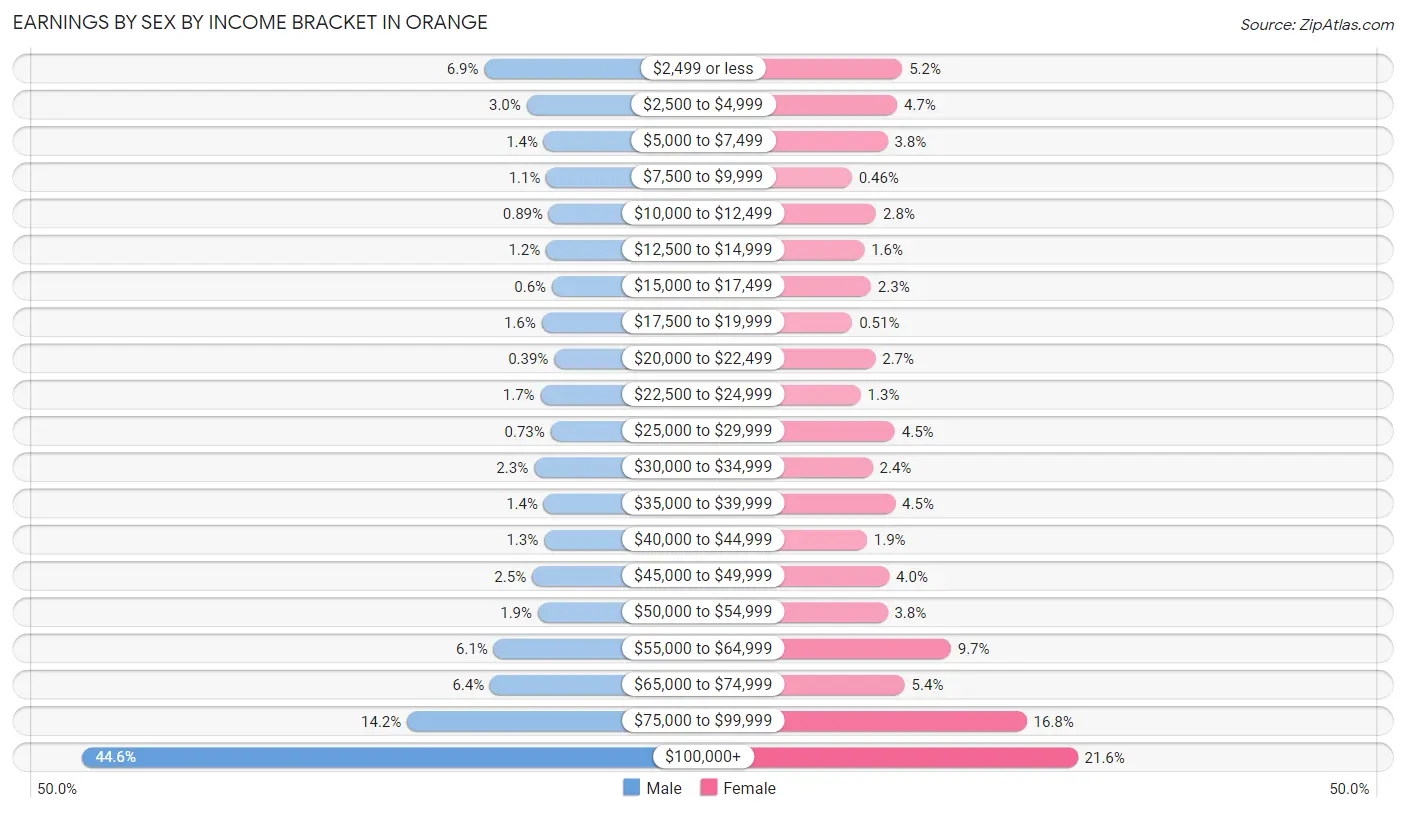
Earnings by Sex by Income Bracket in Orange
The most common earnings brackets in Orange are $100,000+ for men (1,698 | 44.6%) and $100,000+ for women (850 | 21.6%).
| Income | Male | Female |
| $2,499 or less | 264 (6.9%) | 204 (5.2%) |
| $2,500 to $4,999 | 113 (3.0%) | 185 (4.7%) |
| $5,000 to $7,499 | 52 (1.4%) | 150 (3.8%) |
| $7,500 to $9,999 | 43 (1.1%) | 18 (0.5%) |
| $10,000 to $12,499 | 34 (0.9%) | 108 (2.8%) |
| $12,500 to $14,999 | 44 (1.1%) | 64 (1.6%) |
| $15,000 to $17,499 | 23 (0.6%) | 89 (2.3%) |
| $17,500 to $19,999 | 60 (1.6%) | 20 (0.5%) |
| $20,000 to $22,499 | 15 (0.4%) | 105 (2.7%) |
| $22,500 to $24,999 | 64 (1.7%) | 51 (1.3%) |
| $25,000 to $29,999 | 28 (0.7%) | 177 (4.5%) |
| $30,000 to $34,999 | 87 (2.3%) | 95 (2.4%) |
| $35,000 to $39,999 | 52 (1.4%) | 178 (4.5%) |
| $40,000 to $44,999 | 51 (1.3%) | 74 (1.9%) |
| $45,000 to $49,999 | 94 (2.5%) | 156 (4.0%) |
| $50,000 to $54,999 | 73 (1.9%) | 150 (3.8%) |
| $55,000 to $64,999 | 231 (6.1%) | 383 (9.7%) |
| $65,000 to $74,999 | 244 (6.4%) | 213 (5.4%) |
| $75,000 to $99,999 | 540 (14.2%) | 662 (16.8%) |
| $100,000+ | 1,698 (44.6%) | 850 (21.6%) |
| Total | 3,810 (100.0%) | 3,932 (100.0%) |
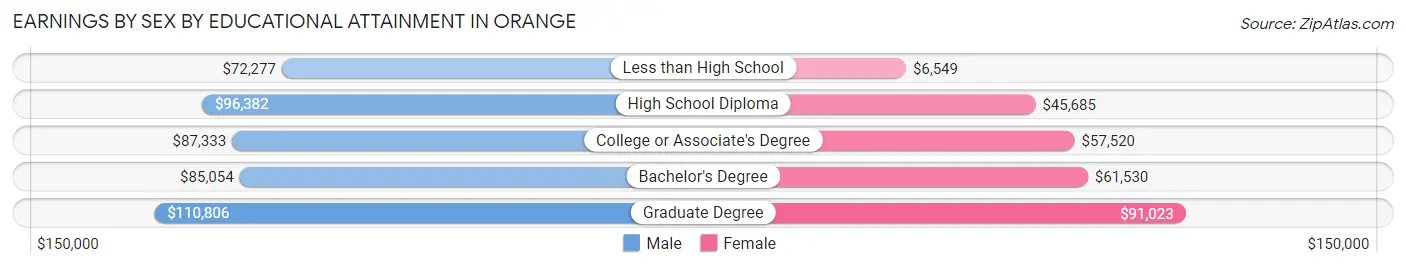
Earnings by Sex by Educational Attainment in Orange
Average earnings in Orange are $97,596 for men and $66,181 for women, a difference of 32.2%. Men with an educational attainment of graduate degree enjoy the highest average annual earnings of $110,806, while those with less than high school education earn the least with $72,277. Women with an educational attainment of graduate degree earn the most with the average annual earnings of $91,023, while those with less than high school education have the smallest earnings of $6,549.
| Educational Attainment | Male Income | Female Income |
| Less than High School | $72,277 | $6,549 |
| High School Diploma | $96,382 | $45,685 |
| College or Associate's Degree | $87,333 | $57,520 |
| Bachelor's Degree | $85,054 | $61,530 |
| Graduate Degree | $110,806 | $91,023 |
| Total | $97,596 | $66,181 |
Family Income in Orange
Family Income Brackets in Orange
According to the Orange family income data, there are 1,347 families falling into the $200,000+ income range, which is the most common income bracket and makes up 32.8% of all families. Conversely, the $15,000 to $24,999 income bracket is the least frequent group with only 12 families (0.3%) belonging to this category.
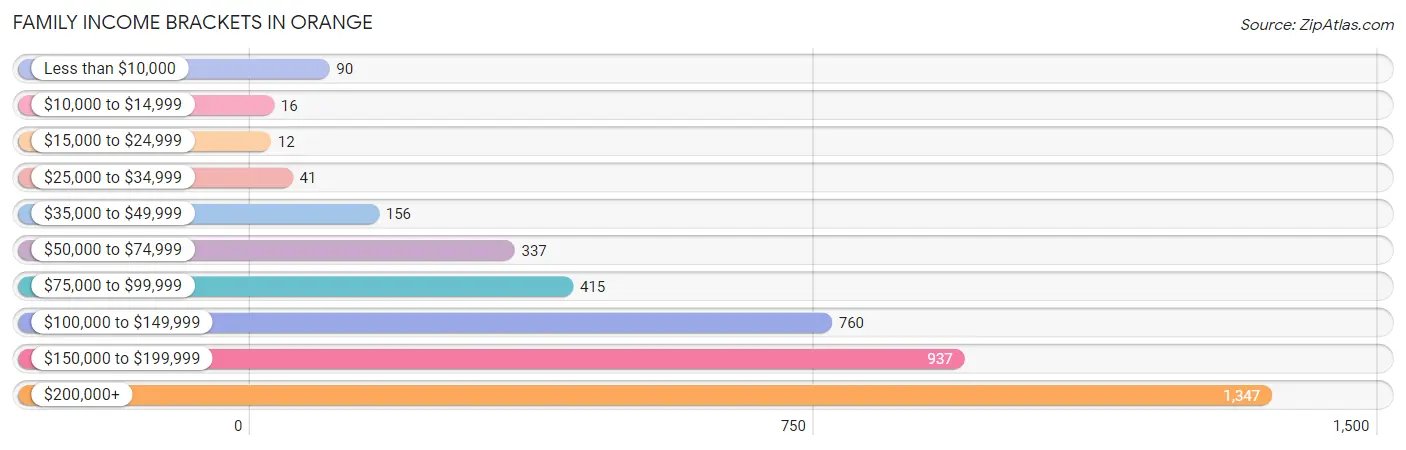
| Income Bracket | # Families | % Families |
| Less than $10,000 | 90 | 2.2% |
| $10,000 to $14,999 | 16 | 0.4% |
| $15,000 to $24,999 | 12 | 0.3% |
| $25,000 to $34,999 | 41 | 1.0% |
| $35,000 to $49,999 | 156 | 3.8% |
| $50,000 to $74,999 | 337 | 8.2% |
| $75,000 to $99,999 | 415 | 10.1% |
| $100,000 to $149,999 | 760 | 18.5% |
| $150,000 to $199,999 | 937 | 22.8% |
| $200,000+ | 1,347 | 32.8% |
Family Income by Famaliy Size in Orange
5-person families (312 | 7.6%) account for the highest median family income in Orange with $245,625 per family, while 2-person families (1,808 | 44.0%) have the highest median income of $62,394 per family member.
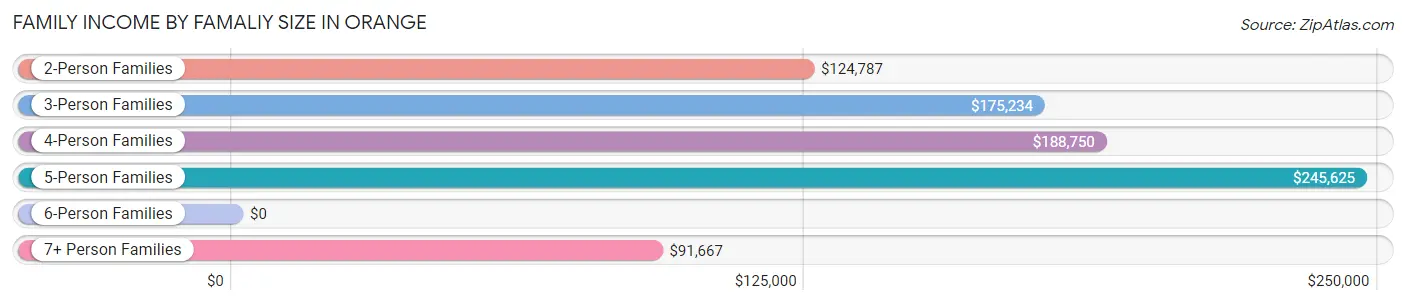
| Income Bracket | # Families | Median Income |
| 2-Person Families | 1,808 (44.0%) | $124,787 |
| 3-Person Families | 1,045 (25.4%) | $175,234 |
| 4-Person Families | 828 (20.2%) | $188,750 |
| 5-Person Families | 312 (7.6%) | $245,625 |
| 6-Person Families | 79 (1.9%) | $0 |
| 7+ Person Families | 36 (0.9%) | $91,667 |
| Total | 4,108 (100.0%) | $162,763 |
Family Income by Number of Earners in Orange
The median family income in Orange is $162,763, with families comprising 3+ earners (573) having the highest median family income of $193,250, while families with no earners (525) have the lowest median family income of $91,763, accounting for 14.0% and 12.8% of families, respectively.
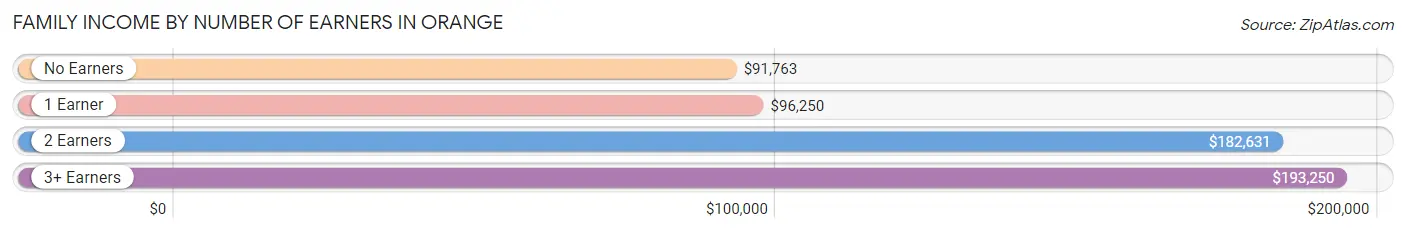
| Number of Earners | # Families | Median Income |
| No Earners | 525 (12.8%) | $91,763 |
| 1 Earner | 977 (23.8%) | $96,250 |
| 2 Earners | 2,033 (49.5%) | $182,631 |
| 3+ Earners | 573 (14.0%) | $193,250 |
| Total | 4,108 (100.0%) | $162,763 |
Household Income in Orange
Household Income Brackets in Orange
With 1,506 households falling in the category, the $200,000+ income range is the most frequent in Orange, accounting for 29.0% of all households. In contrast, only 36 households (0.7%) fall into the $15,000 to $24,999 income bracket, making it the least populous group.
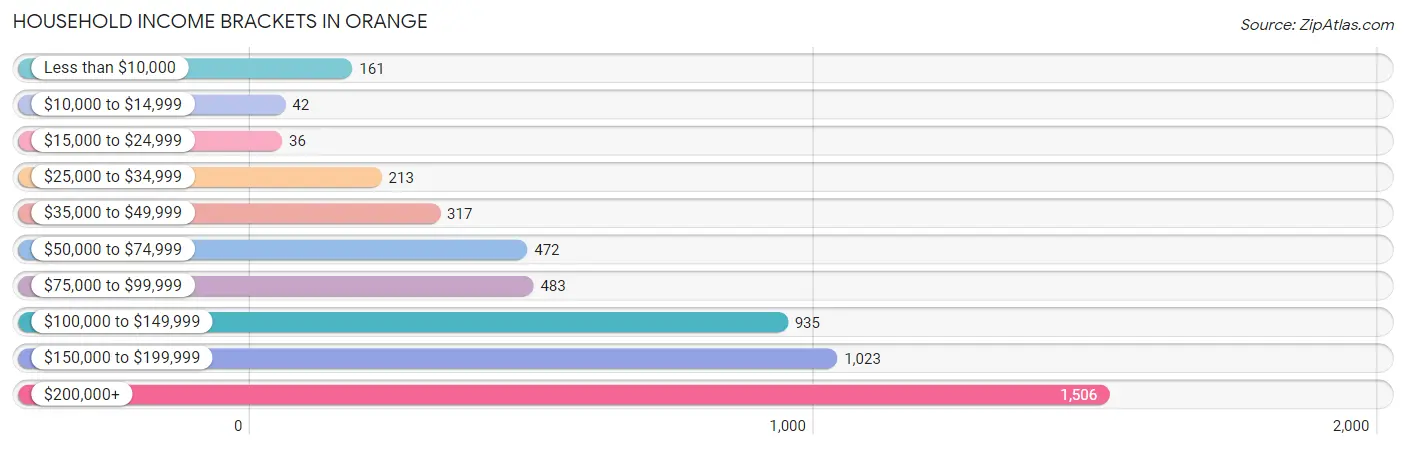
| Income Bracket | # Households | % Households |
| Less than $10,000 | 161 | 3.1% |
| $10,000 to $14,999 | 42 | 0.8% |
| $15,000 to $24,999 | 36 | 0.7% |
| $25,000 to $34,999 | 213 | 4.1% |
| $35,000 to $49,999 | 317 | 6.1% |
| $50,000 to $74,999 | 472 | 9.1% |
| $75,000 to $99,999 | 483 | 9.3% |
| $100,000 to $149,999 | 935 | 18.0% |
| $150,000 to $199,999 | 1,023 | 19.7% |
| $200,000+ | 1,506 | 29.0% |
Household Income by Householder Age in Orange
The median household income in Orange is $138,514, with the highest median household income of $167,904 found in the 25 to 44 years age bracket for the primary householder. A total of 1,133 households (21.8%) fall into this category. Meanwhile, the 15 to 24 years age bracket for the primary householder has the lowest median household income of $0, with 28 households (0.5%) in this group.
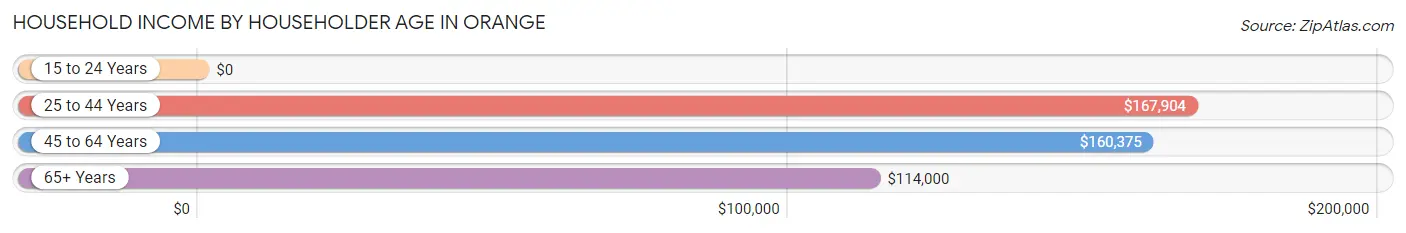
| Income Bracket | # Households | Median Income |
| 15 to 24 Years | 28 (0.5%) | $0 |
| 25 to 44 Years | 1,133 (21.8%) | $167,904 |
| 45 to 64 Years | 2,261 (43.5%) | $160,375 |
| 65+ Years | 1,770 (34.1%) | $114,000 |
| Total | 5,192 (100.0%) | $138,514 |
Poverty in Orange
Income Below Poverty by Sex and Age in Orange
With 2.2% poverty level for males and 3.2% for females among the residents of Orange, 25 to 34 year old males and 15 year old females are the most vulnerable to poverty, with 34 males (8.6%) and 10 females (16.1%) in their respective age groups living below the poverty level.
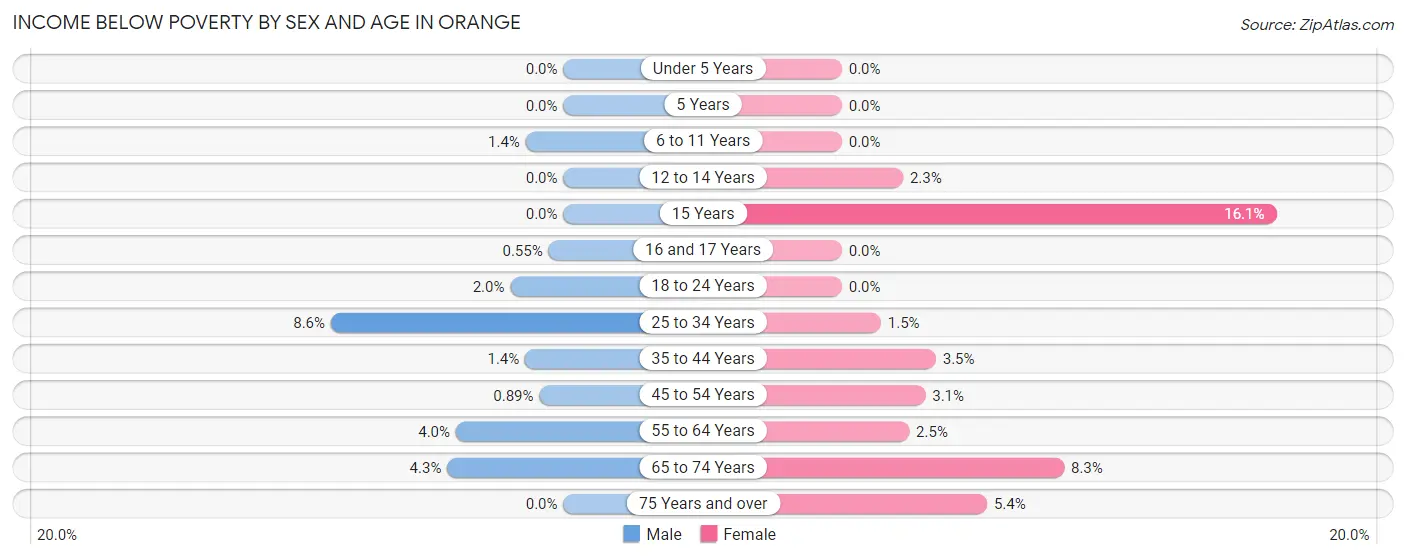
| Age Bracket | Male | Female |
| Under 5 Years | 0 (0.0%) | 0 (0.0%) |
| 5 Years | 0 (0.0%) | 0 (0.0%) |
| 6 to 11 Years | 8 (1.4%) | 0 (0.0%) |
| 12 to 14 Years | 0 (0.0%) | 10 (2.3%) |
| 15 Years | 0 (0.0%) | 10 (16.1%) |
| 16 and 17 Years | 1 (0.5%) | 0 (0.0%) |
| 18 to 24 Years | 9 (2.0%) | 0 (0.0%) |
| 25 to 34 Years | 34 (8.6%) | 8 (1.5%) |
| 35 to 44 Years | 12 (1.4%) | 28 (3.5%) |
| 45 to 54 Years | 9 (0.9%) | 32 (3.1%) |
| 55 to 64 Years | 39 (4.0%) | 27 (2.5%) |
| 65 to 74 Years | 35 (4.3%) | 86 (8.3%) |
| 75 Years and over | 0 (0.0%) | 41 (5.4%) |
| Total | 147 (2.2%) | 242 (3.2%) |
Income Above Poverty by Sex and Age in Orange
According to the poverty statistics in Orange, males aged under 5 years and females aged under 5 years are the age groups that are most secure financially, with 100.0% of males and 100.0% of females in these age groups living above the poverty line.
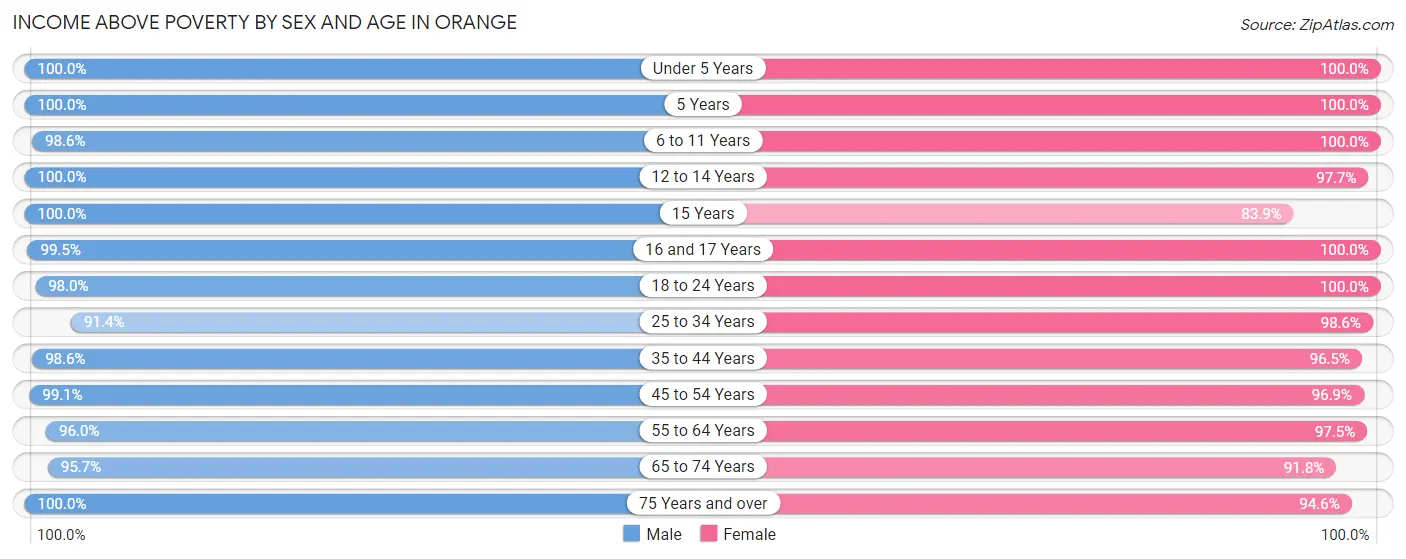
| Age Bracket | Male | Female |
| Under 5 Years | 464 (100.0%) | 347 (100.0%) |
| 5 Years | 28 (100.0%) | 33 (100.0%) |
| 6 to 11 Years | 563 (98.6%) | 655 (100.0%) |
| 12 to 14 Years | 242 (100.0%) | 431 (97.7%) |
| 15 Years | 95 (100.0%) | 52 (83.9%) |
| 16 and 17 Years | 180 (99.5%) | 191 (100.0%) |
| 18 to 24 Years | 449 (98.0%) | 594 (100.0%) |
| 25 to 34 Years | 360 (91.4%) | 542 (98.6%) |
| 35 to 44 Years | 832 (98.6%) | 774 (96.5%) |
| 45 to 54 Years | 1,005 (99.1%) | 999 (96.9%) |
| 55 to 64 Years | 938 (96.0%) | 1,055 (97.5%) |
| 65 to 74 Years | 777 (95.7%) | 957 (91.7%) |
| 75 Years and over | 504 (100.0%) | 719 (94.6%) |
| Total | 6,437 (97.8%) | 7,349 (96.8%) |
Income Below Poverty Among Married-Couple Families in Orange
The poverty statistics for married-couple families in Orange show that 2.6% or 88 of the total 3,444 families live below the poverty line. Families with no children have the highest poverty rate of 4.3%, comprising of 88 families. On the other hand, families with 1 or 2 children have the lowest poverty rate of 0.0%, which includes 0 families.
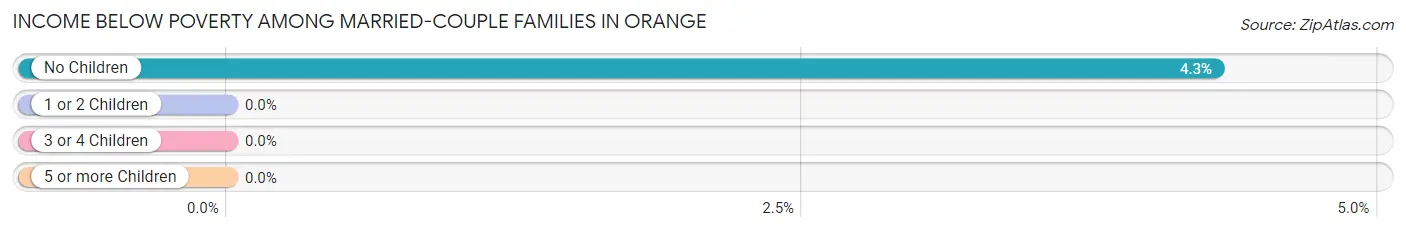
| Children | Above Poverty | Below Poverty |
| No Children | 1,961 (95.7%) | 88 (4.3%) |
| 1 or 2 Children | 1,166 (100.0%) | 0 (0.0%) |
| 3 or 4 Children | 197 (100.0%) | 0 (0.0%) |
| 5 or more Children | 32 (100.0%) | 0 (0.0%) |
| Total | 3,356 (97.4%) | 88 (2.6%) |
Income Below Poverty Among Single-Parent Households in Orange
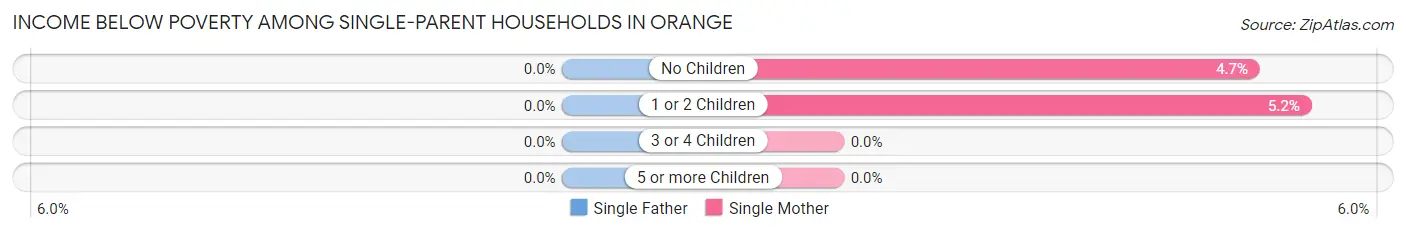
| Children | Single Father | Single Mother |
| No Children | 0 (0.0%) | 12 (4.6%) |
| 1 or 2 Children | 0 (0.0%) | 15 (5.2%) |
| 3 or 4 Children | 0 (0.0%) | 0 (0.0%) |
| 5 or more Children | 0 (0.0%) | 0 (0.0%) |
| Total | 0 (0.0%) | 27 (5.0%) |
Income Below Poverty Among Married-Couple vs Single-Parent Households in Orange
The poverty data for Orange shows that 88 of the married-couple family households (2.6%) and 27 of the single-parent households (4.1%) are living below the poverty level. Within the married-couple family households, those with no children have the highest poverty rate, with 88 households (4.3%) falling below the poverty line. Among the single-parent households, those with 1 or 2 children have the highest poverty rate, with 15 household (5.1%) living below poverty.
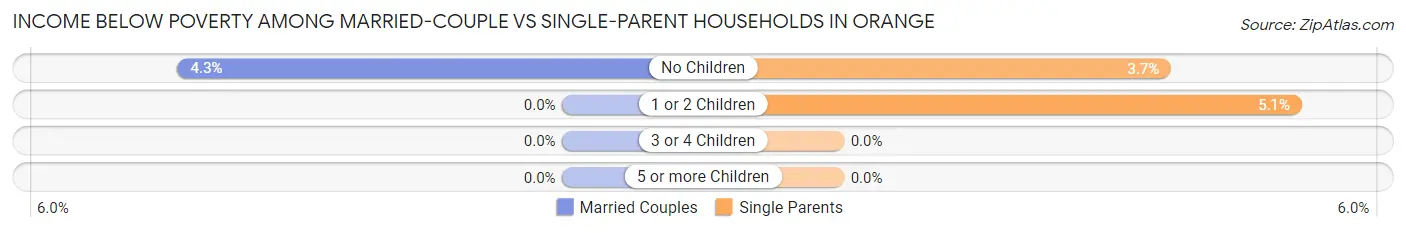
| Children | Married-Couple Families | Single-Parent Households |
| No Children | 88 (4.3%) | 12 (3.7%) |
| 1 or 2 Children | 0 (0.0%) | 15 (5.1%) |
| 3 or 4 Children | 0 (0.0%) | 0 (0.0%) |
| 5 or more Children | 0 (0.0%) | 0 (0.0%) |
| Total | 88 (2.6%) | 27 (4.1%) |
Race in Orange
The most populous races in Orange are White / Caucasian (11,845 | 83.2%), Asian (1,254 | 8.8%), and Black / African American (615 | 4.3%).
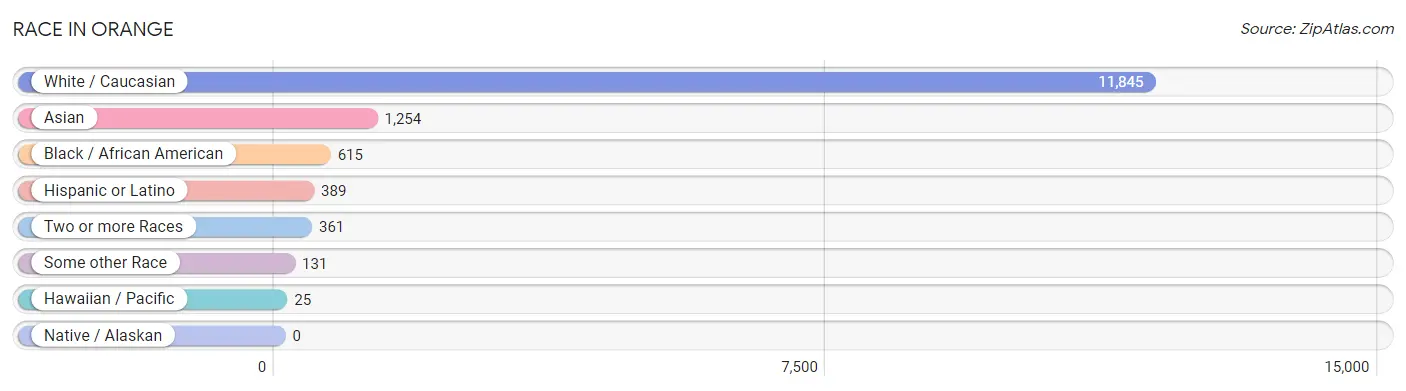
| Race | # Population | % Population |
| Asian | 1,254 | 8.8% |
| Black / African American | 615 | 4.3% |
| Hawaiian / Pacific | 25 | 0.2% |
| Hispanic or Latino | 389 | 2.7% |
| Native / Alaskan | 0 | 0.0% |
| White / Caucasian | 11,845 | 83.2% |
| Two or more Races | 361 | 2.5% |
| Some other Race | 131 | 0.9% |
| Total | 14,231 | 100.0% |
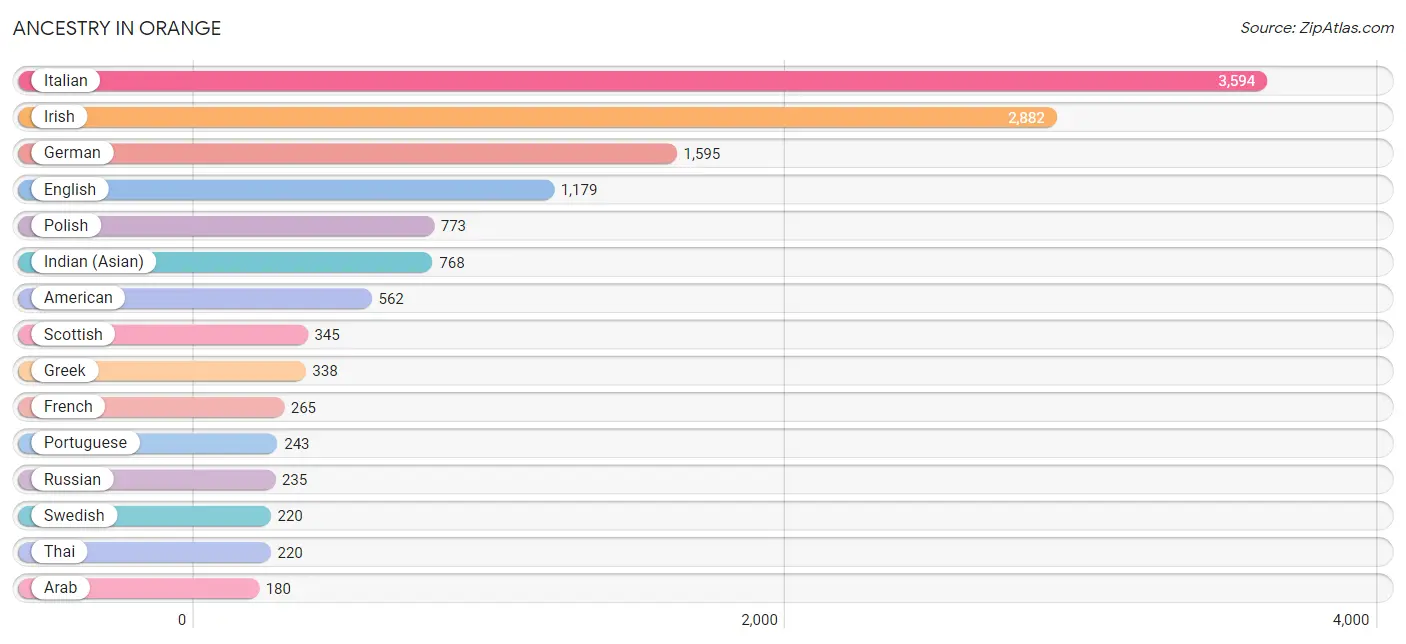
Ancestry in Orange
The most populous ancestries reported in Orange are Italian (3,594 | 25.3%), Irish (2,882 | 20.3%), German (1,595 | 11.2%), English (1,179 | 8.3%), and Polish (773 | 5.4%), together accounting for 70.4% of all Orange residents.
| Ancestry | # Population | % Population |
| American | 562 | 4.0% |
| Arab | 180 | 1.3% |
| Argentinean | 14 | 0.1% |
| Armenian | 41 | 0.3% |
| Assyrian / Chaldean / Syriac | 6 | 0.0% |
| Austrian | 24 | 0.2% |
| Belgian | 8 | 0.1% |
| Bhutanese | 3 | 0.0% |
| Brazilian | 75 | 0.5% |
| British | 19 | 0.1% |
| Burmese | 108 | 0.8% |
| Cambodian | 18 | 0.1% |
| Canadian | 11 | 0.1% |
| Cape Verdean | 11 | 0.1% |
| Central American | 11 | 0.1% |
| Colombian | 22 | 0.2% |
| Cuban | 34 | 0.2% |
| Czech | 36 | 0.3% |
| Czechoslovakian | 83 | 0.6% |
| Danish | 30 | 0.2% |
| Dominican | 75 | 0.5% |
| Dutch | 49 | 0.3% |
| Eastern European | 42 | 0.3% |
| Ecuadorian | 110 | 0.8% |
| Egyptian | 53 | 0.4% |
| English | 1,179 | 8.3% |
| Ethiopian | 29 | 0.2% |
| European | 53 | 0.4% |
| Filipino | 27 | 0.2% |
| French | 265 | 1.9% |
| French Canadian | 90 | 0.6% |
| German | 1,595 | 11.2% |
| Greek | 338 | 2.4% |
| Guatemalan | 11 | 0.1% |
| Hungarian | 168 | 1.2% |
| Indian (Asian) | 768 | 5.4% |
| Irish | 2,882 | 20.3% |
| Italian | 3,594 | 25.3% |
| Jamaican | 67 | 0.5% |
| Japanese | 39 | 0.3% |
| Korean | 51 | 0.4% |
| Lebanese | 92 | 0.6% |
| Liberian | 21 | 0.2% |
| Lithuanian | 55 | 0.4% |
| Mexican | 53 | 0.4% |
| New Zealander | 4 | 0.0% |
| Nigerian | 71 | 0.5% |
| Northern European | 8 | 0.1% |
| Norwegian | 50 | 0.4% |
| Palestinian | 26 | 0.2% |
| Peruvian | 8 | 0.1% |
| Polish | 773 | 5.4% |
| Portuguese | 243 | 1.7% |
| Puerto Rican | 16 | 0.1% |
| Romanian | 18 | 0.1% |
| Russian | 235 | 1.7% |
| Scotch-Irish | 69 | 0.5% |
| Scottish | 345 | 2.4% |
| Serbian | 48 | 0.3% |
| Slovak | 82 | 0.6% |
| South American | 167 | 1.2% |
| Spaniard | 33 | 0.2% |
| Subsaharan African | 132 | 0.9% |
| Swedish | 220 | 1.5% |
| Swiss | 8 | 0.1% |
| Syrian | 9 | 0.1% |
| Thai | 220 | 1.5% |
| Turkish | 47 | 0.3% |
| Ukrainian | 156 | 1.1% |
| Venezuelan | 13 | 0.1% |
| Welsh | 40 | 0.3% | View All 71 Rows |
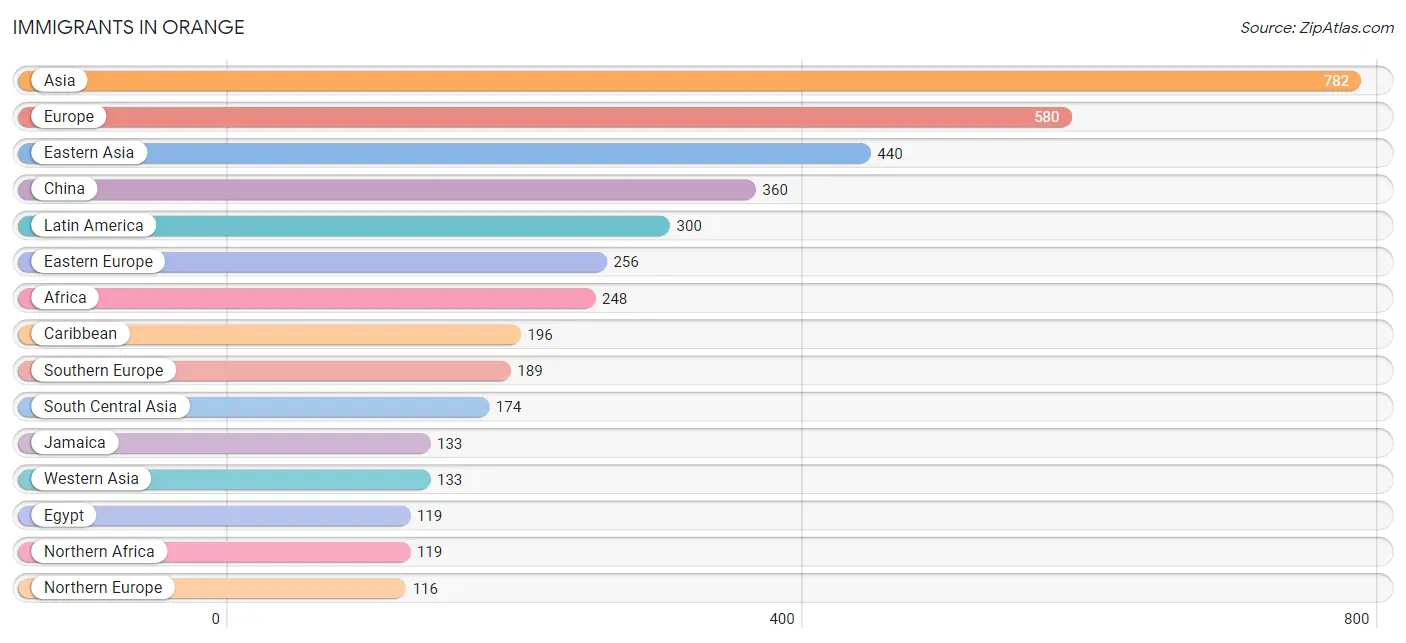
Immigrants in Orange
The most numerous immigrant groups reported in Orange came from Asia (782 | 5.5%), Europe (580 | 4.1%), Eastern Asia (440 | 3.1%), China (360 | 2.5%), and Latin America (300 | 2.1%), together accounting for 17.3% of all Orange residents.
| Immigration Origin | # Population | % Population |
| Africa | 248 | 1.7% |
| Asia | 782 | 5.5% |
| Belarus | 20 | 0.1% |
| Brazil | 15 | 0.1% |
| Cambodia | 25 | 0.2% |
| Canada | 30 | 0.2% |
| Caribbean | 196 | 1.4% |
| Central America | 11 | 0.1% |
| China | 360 | 2.5% |
| Colombia | 15 | 0.1% |
| Cuba | 9 | 0.1% |
| Czechoslovakia | 35 | 0.3% |
| Dominican Republic | 54 | 0.4% |
| Eastern Africa | 17 | 0.1% |
| Eastern Asia | 440 | 3.1% |
| Eastern Europe | 256 | 1.8% |
| Ecuador | 55 | 0.4% |
| Egypt | 119 | 0.8% |
| England | 19 | 0.1% |
| Ethiopia | 12 | 0.1% |
| Europe | 580 | 4.1% |
| Germany | 19 | 0.1% |
| Ghana | 19 | 0.1% |
| Greece | 22 | 0.2% |
| Guatemala | 11 | 0.1% |
| Hong Kong | 17 | 0.1% |
| India | 105 | 0.7% |
| Ireland | 44 | 0.3% |
| Italy | 88 | 0.6% |
| Jamaica | 133 | 0.9% |
| Kenya | 5 | 0.0% |
| Korea | 68 | 0.5% |
| Latin America | 300 | 2.1% |
| Lebanon | 64 | 0.4% |
| Liberia | 21 | 0.2% |
| Middle Africa | 40 | 0.3% |
| Moldova | 17 | 0.1% |
| Nepal | 38 | 0.3% |
| Nigeria | 32 | 0.2% |
| Northern Africa | 119 | 0.8% |
| Northern Europe | 116 | 0.8% |
| Norway | 10 | 0.1% |
| Oceania | 4 | 0.0% |
| Pakistan | 23 | 0.2% |
| Peru | 8 | 0.1% |
| Philippines | 10 | 0.1% |
| Poland | 28 | 0.2% |
| Portugal | 63 | 0.4% |
| Russia | 56 | 0.4% |
| Scotland | 43 | 0.3% |
| Serbia | 28 | 0.2% |
| South America | 93 | 0.6% |
| South Central Asia | 174 | 1.2% |
| South Eastern Asia | 35 | 0.3% |
| Southern Europe | 189 | 1.3% |
| Spain | 16 | 0.1% |
| Sri Lanka | 8 | 0.1% |
| Syria | 9 | 0.1% |
| Taiwan | 53 | 0.4% |
| Turkey | 25 | 0.2% |
| Ukraine | 65 | 0.5% |
| Western Africa | 72 | 0.5% |
| Western Asia | 133 | 0.9% |
| Western Europe | 19 | 0.1% | View All 64 Rows |
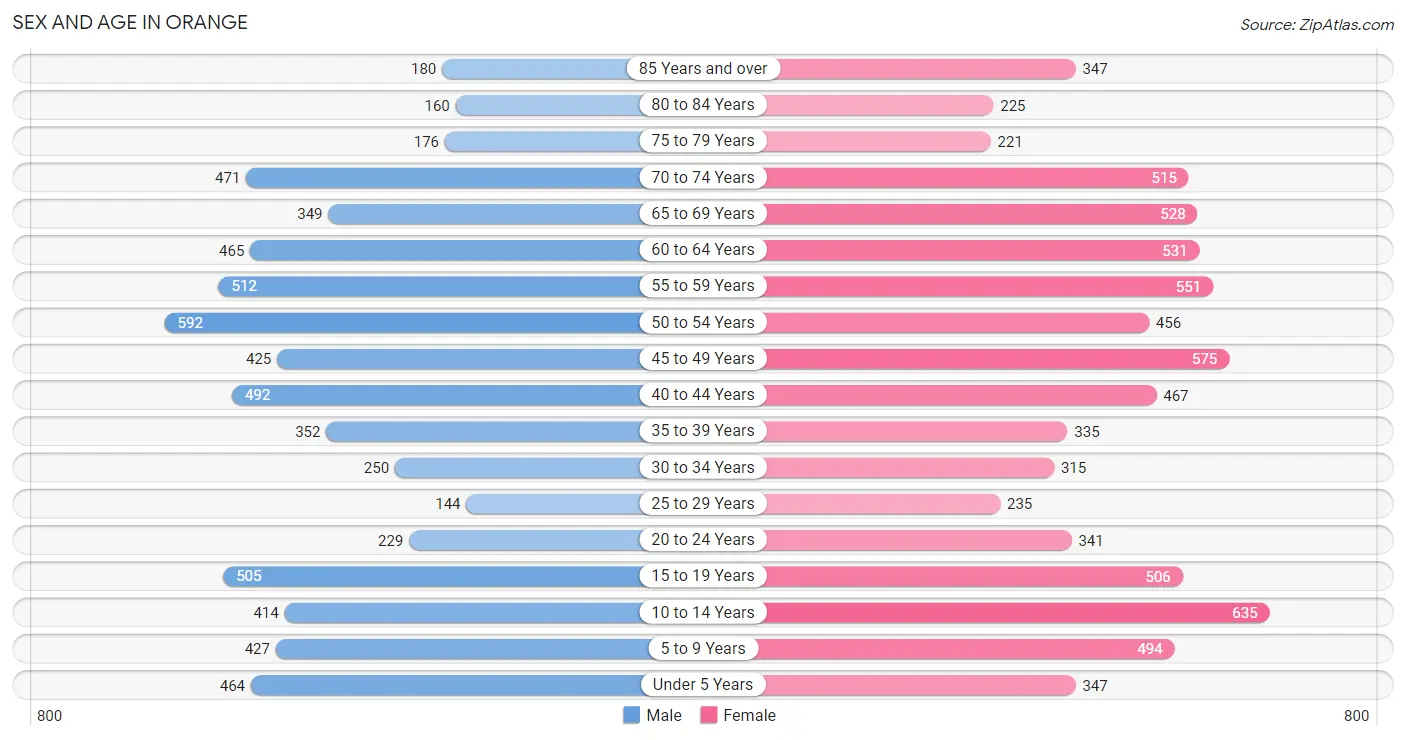
Sex and Age in Orange
Sex and Age in Orange
The most populous age groups in Orange are 50 to 54 Years (592 | 9.0%) for men and 10 to 14 Years (635 | 8.3%) for women.
| Age Bracket | Male | Female |
| Under 5 Years | 464 (7.0%) | 347 (4.5%) |
| 5 to 9 Years | 427 (6.5%) | 494 (6.5%) |
| 10 to 14 Years | 414 (6.3%) | 635 (8.3%) |
| 15 to 19 Years | 505 (7.6%) | 506 (6.6%) |
| 20 to 24 Years | 229 (3.5%) | 341 (4.5%) |
| 25 to 29 Years | 144 (2.2%) | 235 (3.1%) |
| 30 to 34 Years | 250 (3.8%) | 315 (4.1%) |
| 35 to 39 Years | 352 (5.3%) | 335 (4.4%) |
| 40 to 44 Years | 492 (7.4%) | 467 (6.1%) |
| 45 to 49 Years | 425 (6.4%) | 575 (7.5%) |
| 50 to 54 Years | 592 (9.0%) | 456 (6.0%) |
| 55 to 59 Years | 512 (7.7%) | 551 (7.2%) |
| 60 to 64 Years | 465 (7.0%) | 531 (7.0%) |
| 65 to 69 Years | 349 (5.3%) | 528 (6.9%) |
| 70 to 74 Years | 471 (7.1%) | 515 (6.8%) |
| 75 to 79 Years | 176 (2.7%) | 221 (2.9%) |
| 80 to 84 Years | 160 (2.4%) | 225 (2.9%) |
| 85 Years and over | 180 (2.7%) | 347 (4.5%) |
| Total | 6,607 (100.0%) | 7,624 (100.0%) |
Families and Households in Orange
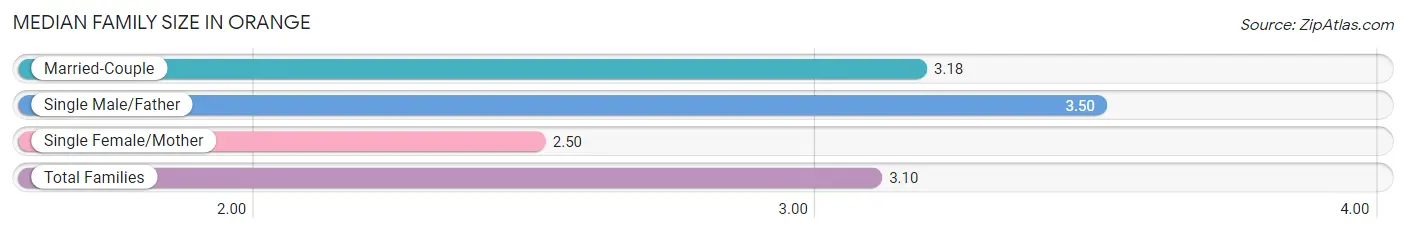
Median Family Size in Orange
The median family size in Orange is 3.10 persons per family, with single male/father families (119 | 2.9%) accounting for the largest median family size of 3.5 persons per family. On the other hand, single female/mother families (545 | 13.3%) represent the smallest median family size with 2.50 persons per family.
| Family Type | # Families | Family Size |
| Married-Couple | 3,444 (83.8%) | 3.18 |
| Single Male/Father | 119 (2.9%) | 3.50 |
| Single Female/Mother | 545 (13.3%) | 2.50 |
| Total Families | 4,108 (100.0%) | 3.10 |
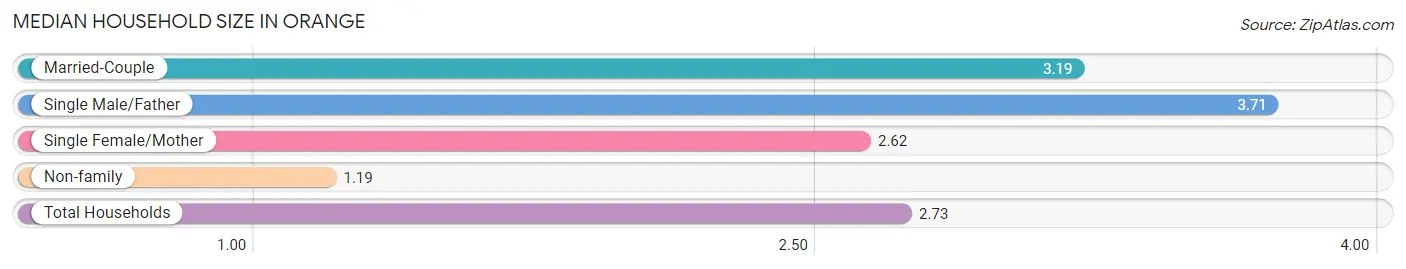
Median Household Size in Orange
The median household size in Orange is 2.73 persons per household, with single male/father households (119 | 2.3%) accounting for the largest median household size of 3.71 persons per household. non-family households (1,084 | 20.9%) represent the smallest median household size with 1.19 persons per household.
| Household Type | # Households | Household Size |
| Married-Couple | 3,444 (66.3%) | 3.19 |
| Single Male/Father | 119 (2.3%) | 3.71 |
| Single Female/Mother | 545 (10.5%) | 2.62 |
| Non-family | 1,084 (20.9%) | 1.19 |
| Total Households | 5,192 (100.0%) | 2.73 |
Household Size by Marriage Status in Orange
Out of a total of 5,192 households in Orange, 4,108 (79.1%) are family households, while 1,084 (20.9%) are nonfamily households. The most numerous type of family households are 2-person households, comprising 1,782, and the most common type of nonfamily households are 1-person households, comprising 893.
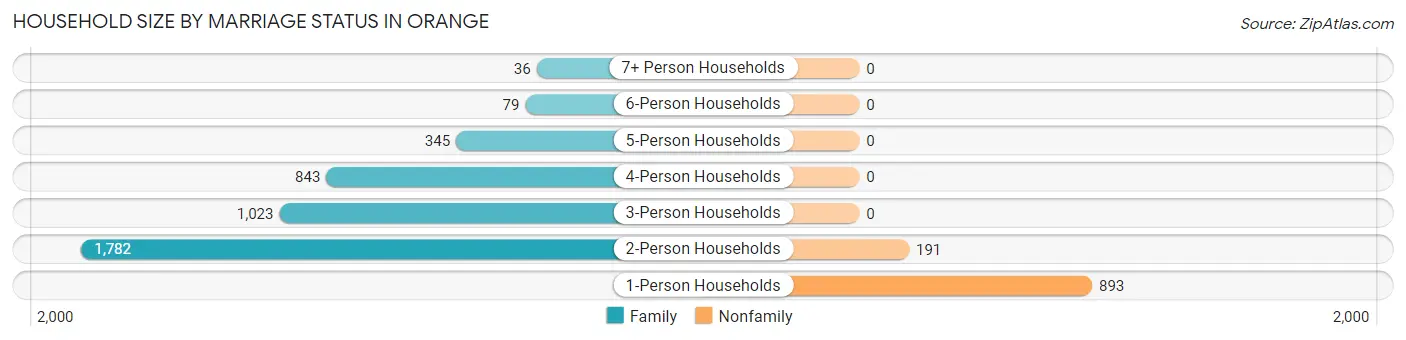
| Household Size | Family Households | Nonfamily Households |
| 1-Person Households | - | 893 (17.2%) |
| 2-Person Households | 1,782 (34.3%) | 191 (3.7%) |
| 3-Person Households | 1,023 (19.7%) | 0 (0.0%) |
| 4-Person Households | 843 (16.2%) | 0 (0.0%) |
| 5-Person Households | 345 (6.6%) | 0 (0.0%) |
| 6-Person Households | 79 (1.5%) | 0 (0.0%) |
| 7+ Person Households | 36 (0.7%) | 0 (0.0%) |
| Total | 4,108 (79.1%) | 1,084 (20.9%) |
Female Fertility in Orange
Fertility by Age in Orange
Average fertility rate in Orange is 56.0 births per 1,000 women. Women in the age bracket of 20 to 34 years have the highest fertility rate with 127.0 births per 1,000 women. Women in the age bracket of 20 to 34 years acount for 71.1% of all women with births.
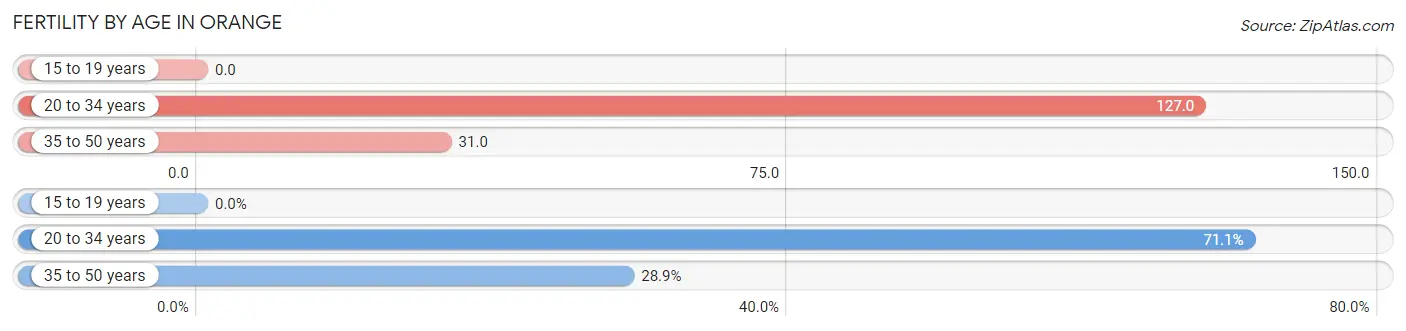
| Age Bracket | Women with Births | Births / 1,000 Women |
| 15 to 19 years | 0 (0.0%) | 0.0 |
| 20 to 34 years | 113 (71.1%) | 127.0 |
| 35 to 50 years | 46 (28.9%) | 31.0 |
| Total | 159 (100.0%) | 56.0 |
Fertility by Age by Marriage Status in Orange
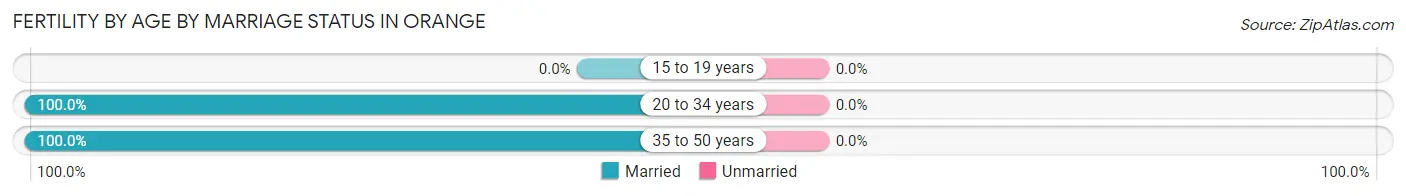
| Age Bracket | Married | Unmarried |
| 15 to 19 years | 0 (0.0%) | 0 (0.0%) |
| 20 to 34 years | 113 (100.0%) | 0 (0.0%) |
| 35 to 50 years | 46 (100.0%) | 0 (0.0%) |
| Total | 159 (100.0%) | 0 (0.0%) |
Fertility by Education in Orange
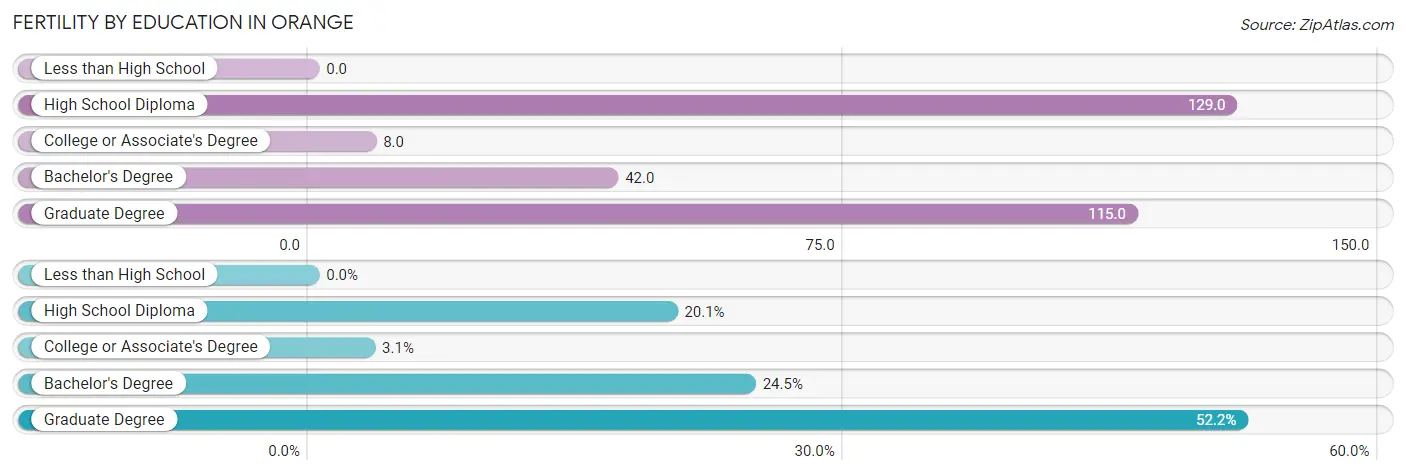
| Educational Attainment | Women with Births | Births / 1,000 Women |
| Less than High School | 0 (0.0%) | 0.0 |
| High School Diploma | 32 (20.1%) | 129.0 |
| College or Associate's Degree | 5 (3.1%) | 8.0 |
| Bachelor's Degree | 39 (24.5%) | 42.0 |
| Graduate Degree | 83 (52.2%) | 115.0 |
| Total | 159 (100.0%) | 56.0 |
Fertility by Education by Marriage Status in Orange
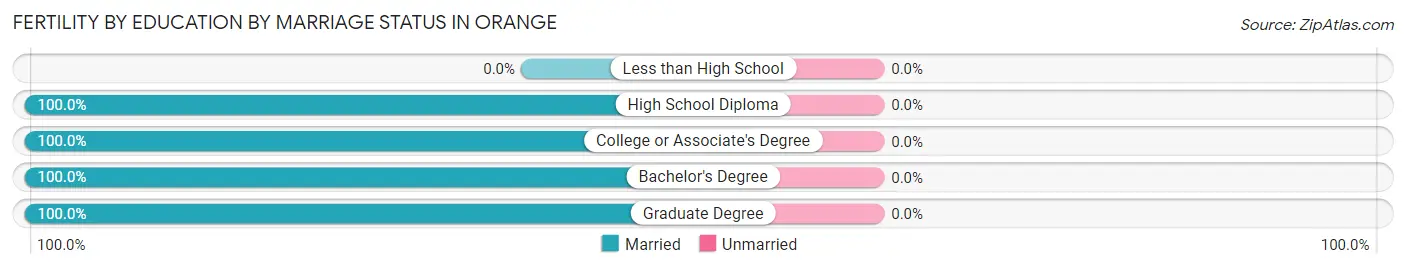
| Educational Attainment | Married | Unmarried |
| Less than High School | 0 (0.0%) | 0 (0.0%) |
| High School Diploma | 32 (100.0%) | 0 (0.0%) |
| College or Associate's Degree | 5 (100.0%) | 0 (0.0%) |
| Bachelor's Degree | 39 (100.0%) | 0 (0.0%) |
| Graduate Degree | 83 (100.0%) | 0 (0.0%) |
| Total | 159 (100.0%) | 0 (0.0%) |
Employment Characteristics in Orange
Employment by Class of Employer in Orange
Among the 6,936 employed individuals in Orange, private company employees (4,222 | 60.9%), not-for-profit organizations (705 | 10.2%), and local government employees (674 | 9.7%) make up the most common classes of employment.
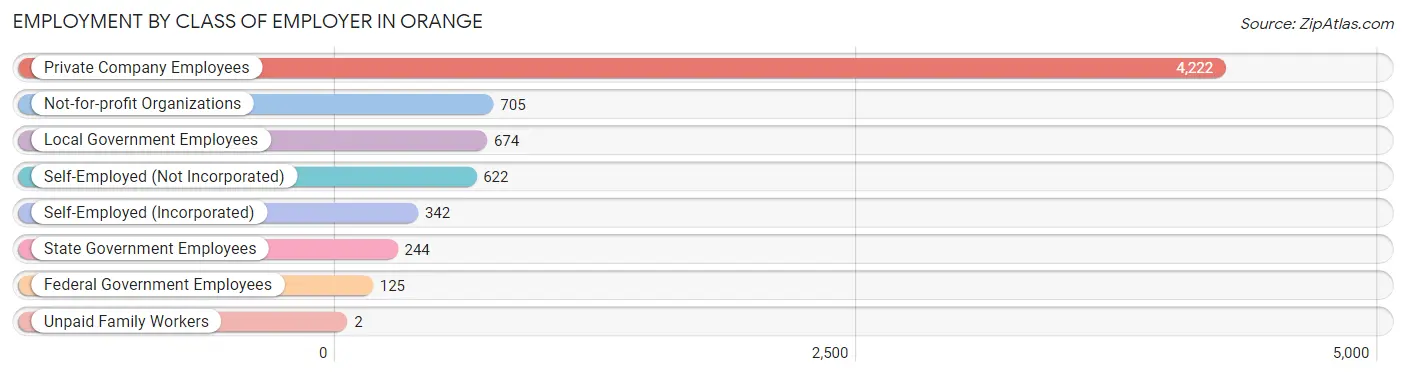
| Employer Class | # Employees | % Employees |
| Private Company Employees | 4,222 | 60.9% |
| Self-Employed (Incorporated) | 342 | 4.9% |
| Self-Employed (Not Incorporated) | 622 | 9.0% |
| Not-for-profit Organizations | 705 | 10.2% |
| Local Government Employees | 674 | 9.7% |
| State Government Employees | 244 | 3.5% |
| Federal Government Employees | 125 | 1.8% |
| Unpaid Family Workers | 2 | 0.0% |
| Total | 6,936 | 100.0% |
Employment Status by Age in Orange
According to the labor force statistics for Orange, out of the total population over 16 years of age (11,293), 65.4% or 7,386 individuals are in the labor force, with 3.8% or 281 of them unemployed. The age group with the highest labor force participation rate is 35 to 44 years, with 91.8% or 1,511 individuals in the labor force. Within the labor force, the 20 to 24 years age range has the highest percentage of unemployed individuals, with 13.3% or 56 of them being unemployed.
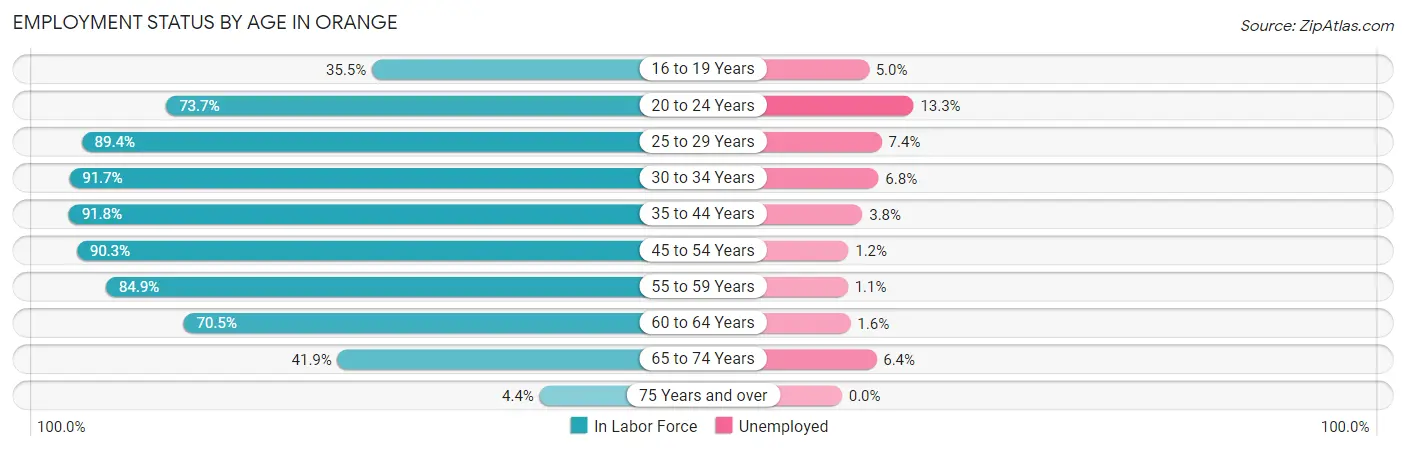
| Age Bracket | In Labor Force | Unemployed |
| 16 to 19 Years | 303 (35.5%) | 15 (5.0%) |
| 20 to 24 Years | 420 (73.7%) | 56 (13.3%) |
| 25 to 29 Years | 339 (89.4%) | 25 (7.4%) |
| 30 to 34 Years | 518 (91.7%) | 35 (6.8%) |
| 35 to 44 Years | 1,511 (91.8%) | 57 (3.8%) |
| 45 to 54 Years | 1,849 (90.3%) | 22 (1.2%) |
| 55 to 59 Years | 902 (84.9%) | 10 (1.1%) |
| 60 to 64 Years | 702 (70.5%) | 11 (1.6%) |
| 65 to 74 Years | 781 (41.9%) | 50 (6.4%) |
| 75 Years and over | 58 (4.4%) | 0 (0.0%) |
| Total | 7,386 (65.4%) | 281 (3.8%) |
Employment Status by Educational Attainment in Orange
According to labor force statistics for Orange, 86.9% of individuals (5,820) out of the total population between 25 and 64 years of age (6,697) are in the labor force, with 2.8% or 163 of them being unemployed. The group with the highest labor force participation rate are those with the educational attainment of bachelor's degree or higher, with 91.6% or 3,980 individuals in the labor force. Within the labor force, individuals with high school diploma education have the highest percentage of unemployment, with 3.1% or 25 of them being unemployed.
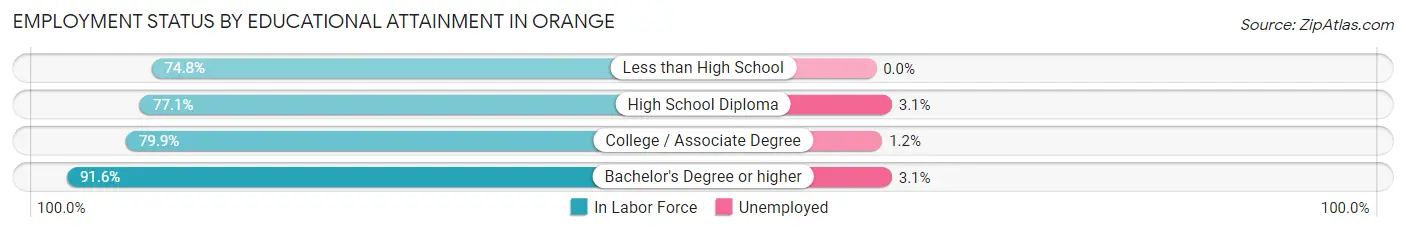
| Educational Attainment | In Labor Force | Unemployed |
| Less than High School | 77 (74.8%) | 0 (0.0%) |
| High School Diploma | 818 (77.1%) | 33 (3.1%) |
| College / Associate Degree | 949 (79.9%) | 14 (1.2%) |
| Bachelor's Degree or higher | 3,980 (91.6%) | 135 (3.1%) |
| Total | 5,820 (86.9%) | 188 (2.8%) |
Employment Occupations by Sex in Orange
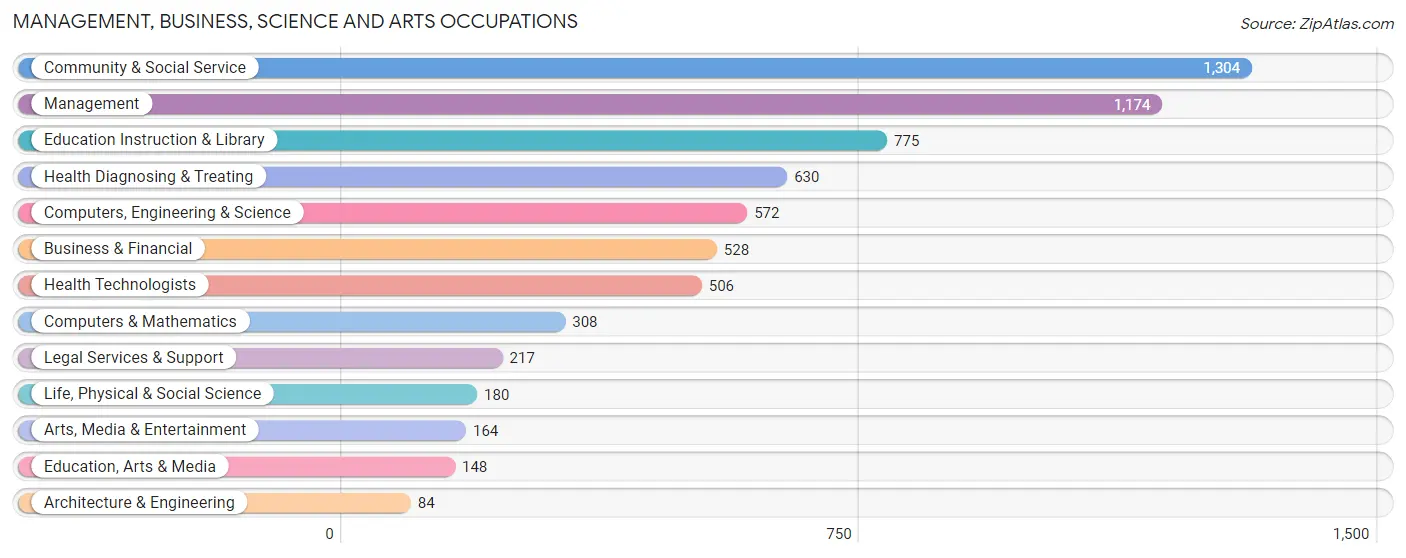
Management, Business, Science and Arts Occupations
The most common Management, Business, Science and Arts occupations in Orange are Community & Social Service (1,304 | 18.4%), Management (1,174 | 16.5%), Education Instruction & Library (775 | 10.9%), Health Diagnosing & Treating (630 | 8.9%), and Computers, Engineering & Science (572 | 8.1%).
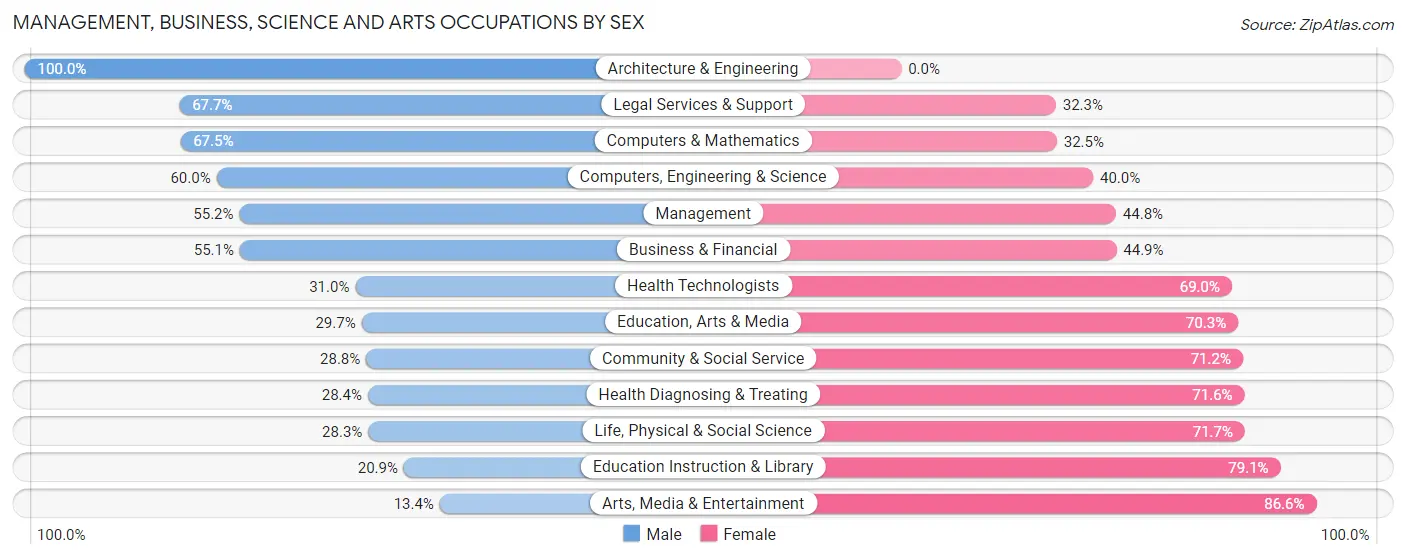
Management, Business, Science and Arts Occupations by Sex
Within the Management, Business, Science and Arts occupations in Orange, the most male-oriented occupations are Architecture & Engineering (100.0%), Legal Services & Support (67.7%), and Computers & Mathematics (67.5%), while the most female-oriented occupations are Arts, Media & Entertainment (86.6%), Education Instruction & Library (79.1%), and Life, Physical & Social Science (71.7%).
| Occupation | Male | Female |
| Management | 648 (55.2%) | 526 (44.8%) |
| Business & Financial | 291 (55.1%) | 237 (44.9%) |
| Computers, Engineering & Science | 343 (60.0%) | 229 (40.0%) |
| Computers & Mathematics | 208 (67.5%) | 100 (32.5%) |
| Architecture & Engineering | 84 (100.0%) | 0 (0.0%) |
| Life, Physical & Social Science | 51 (28.3%) | 129 (71.7%) |
| Community & Social Service | 375 (28.8%) | 929 (71.2%) |
| Education, Arts & Media | 44 (29.7%) | 104 (70.3%) |
| Legal Services & Support | 147 (67.7%) | 70 (32.3%) |
| Education Instruction & Library | 162 (20.9%) | 613 (79.1%) |
| Arts, Media & Entertainment | 22 (13.4%) | 142 (86.6%) |
| Health Diagnosing & Treating | 179 (28.4%) | 451 (71.6%) |
| Health Technologists | 157 (31.0%) | 349 (69.0%) |
| Total (Category) | 1,836 (43.6%) | 2,372 (56.4%) |
| Total (Overall) | 3,513 (49.5%) | 3,588 (50.5%) |
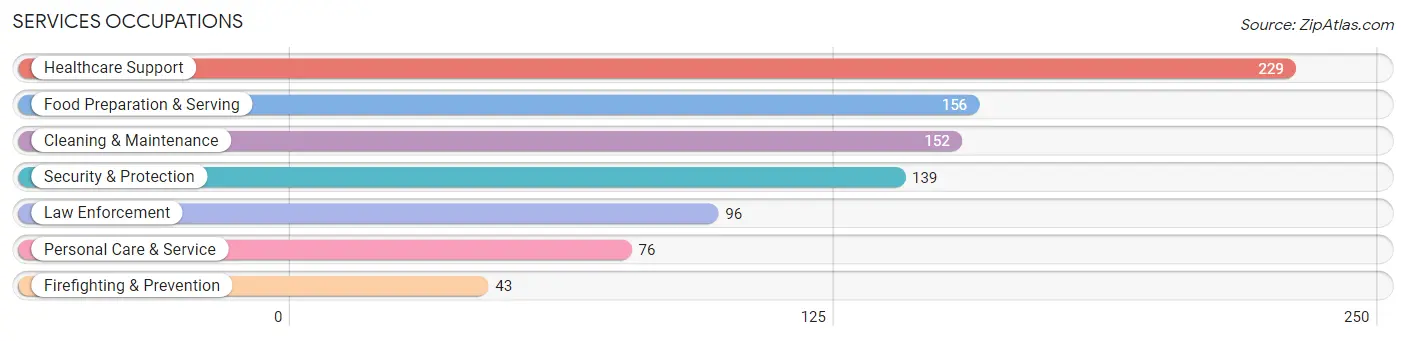
Services Occupations
The most common Services occupations in Orange are Healthcare Support (229 | 3.2%), Food Preparation & Serving (156 | 2.2%), Cleaning & Maintenance (152 | 2.1%), Security & Protection (139 | 2.0%), and Law Enforcement (96 | 1.3%).
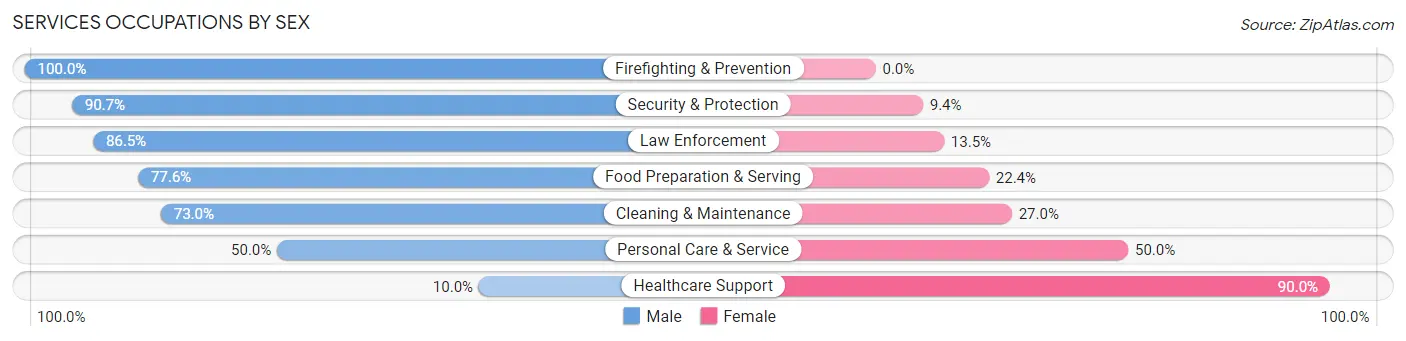
Services Occupations by Sex
Within the Services occupations in Orange, the most male-oriented occupations are Firefighting & Prevention (100.0%), Security & Protection (90.6%), and Law Enforcement (86.5%), while the most female-oriented occupations are Healthcare Support (90.0%), Personal Care & Service (50.0%), and Cleaning & Maintenance (27.0%).
| Occupation | Male | Female |
| Healthcare Support | 23 (10.0%) | 206 (90.0%) |
| Security & Protection | 126 (90.6%) | 13 (9.3%) |
| Firefighting & Prevention | 43 (100.0%) | 0 (0.0%) |
| Law Enforcement | 83 (86.5%) | 13 (13.5%) |
| Food Preparation & Serving | 121 (77.6%) | 35 (22.4%) |
| Cleaning & Maintenance | 111 (73.0%) | 41 (27.0%) |
| Personal Care & Service | 38 (50.0%) | 38 (50.0%) |
| Total (Category) | 419 (55.7%) | 333 (44.3%) |
| Total (Overall) | 3,513 (49.5%) | 3,588 (50.5%) |
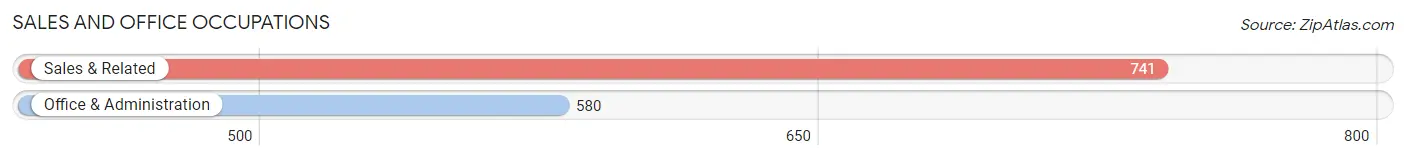
Sales and Office Occupations
The most common Sales and Office occupations in Orange are Sales & Related (741 | 10.4%), and Office & Administration (580 | 8.2%).
Sales and Office Occupations by Sex
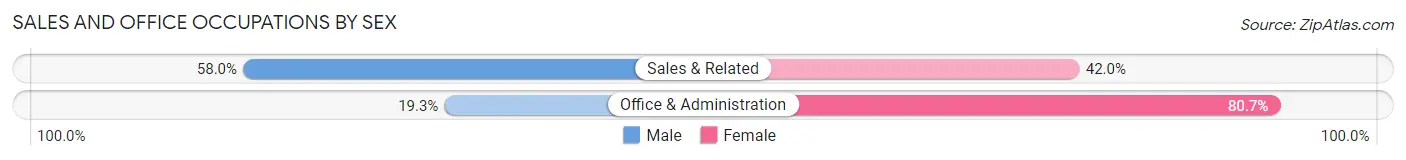
| Occupation | Male | Female |
| Sales & Related | 430 (58.0%) | 311 (42.0%) |
| Office & Administration | 112 (19.3%) | 468 (80.7%) |
| Total (Category) | 542 (41.0%) | 779 (59.0%) |
| Total (Overall) | 3,513 (49.5%) | 3,588 (50.5%) |
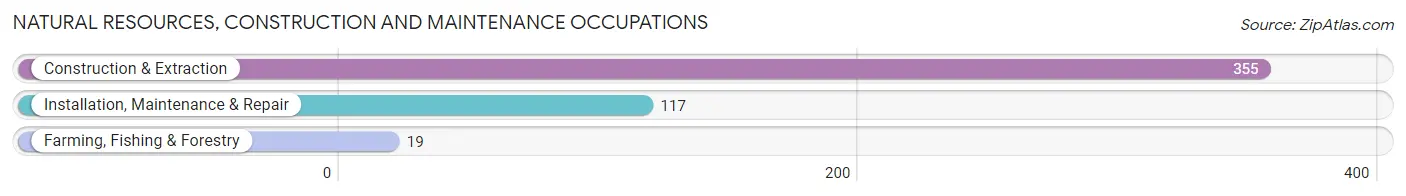
Natural Resources, Construction and Maintenance Occupations
The most common Natural Resources, Construction and Maintenance occupations in Orange are Construction & Extraction (355 | 5.0%), Installation, Maintenance & Repair (117 | 1.7%), and Farming, Fishing & Forestry (19 | 0.3%).
Natural Resources, Construction and Maintenance Occupations by Sex
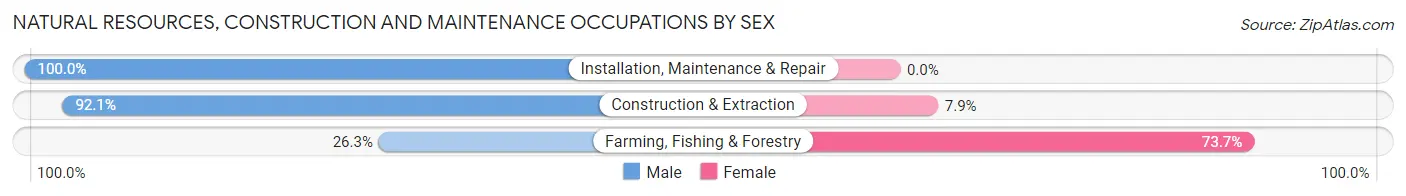
| Occupation | Male | Female |
| Farming, Fishing & Forestry | 5 (26.3%) | 14 (73.7%) |
| Construction & Extraction | 327 (92.1%) | 28 (7.9%) |
| Installation, Maintenance & Repair | 117 (100.0%) | 0 (0.0%) |
| Total (Category) | 449 (91.4%) | 42 (8.6%) |
| Total (Overall) | 3,513 (49.5%) | 3,588 (50.5%) |
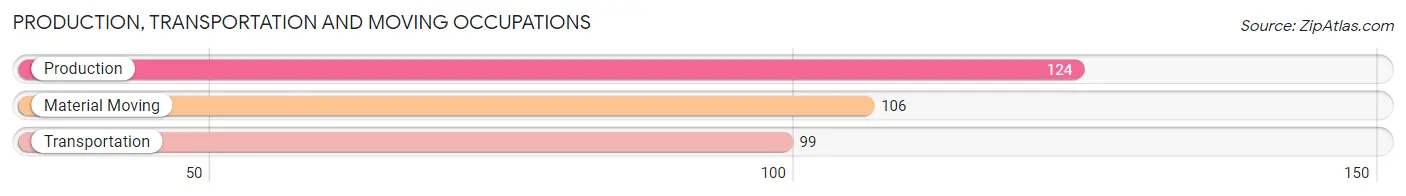
Production, Transportation and Moving Occupations
The most common Production, Transportation and Moving occupations in Orange are Production (124 | 1.8%), Material Moving (106 | 1.5%), and Transportation (99 | 1.4%).
Production, Transportation and Moving Occupations by Sex
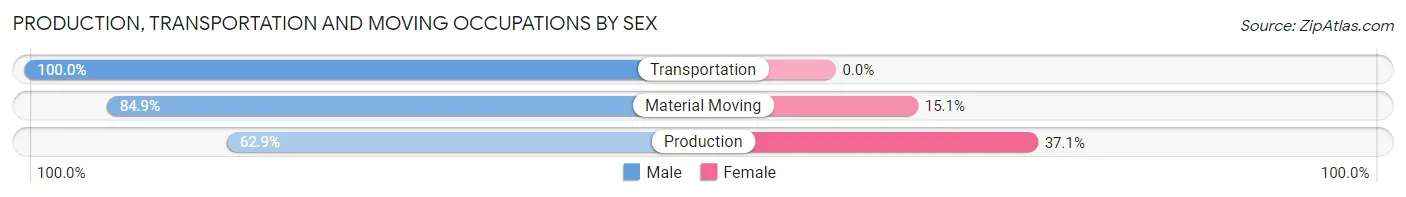
| Occupation | Male | Female |
| Production | 78 (62.9%) | 46 (37.1%) |
| Transportation | 99 (100.0%) | 0 (0.0%) |
| Material Moving | 90 (84.9%) | 16 (15.1%) |
| Total (Category) | 267 (81.2%) | 62 (18.8%) |
| Total (Overall) | 3,513 (49.5%) | 3,588 (50.5%) |
Employment Industries by Sex in Orange
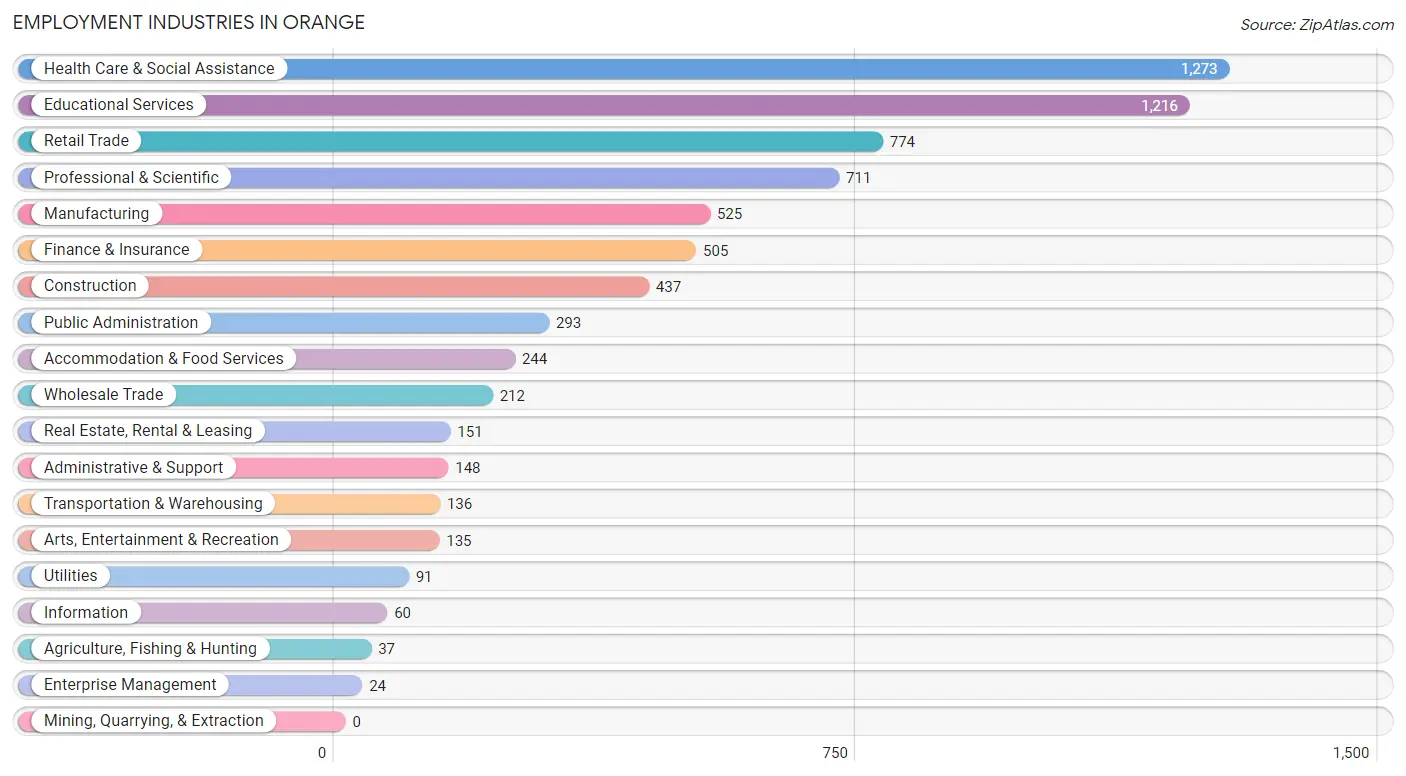
Employment Industries in Orange
The major employment industries in Orange include Health Care & Social Assistance (1,273 | 17.9%), Educational Services (1,216 | 17.1%), Retail Trade (774 | 10.9%), Professional & Scientific (711 | 10.0%), and Manufacturing (525 | 7.4%).
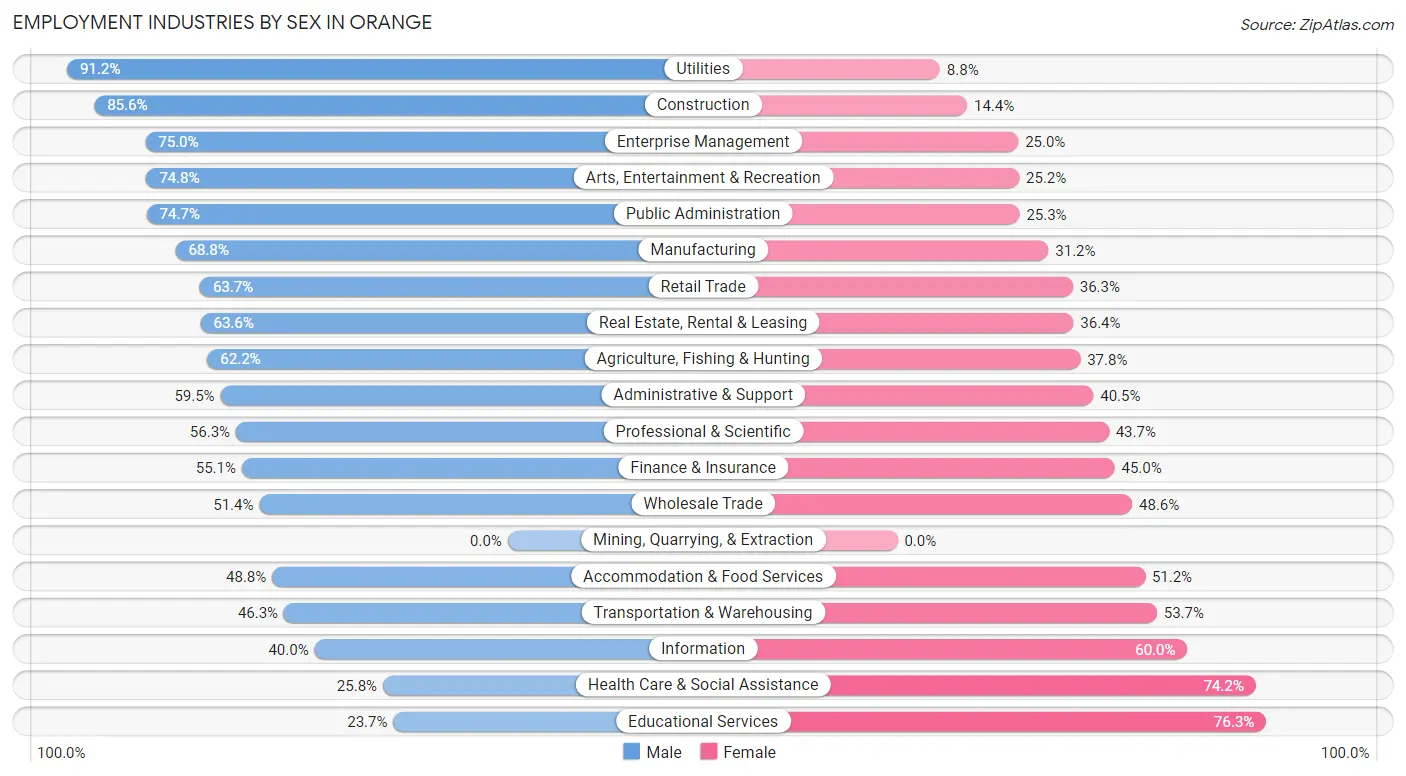
Employment Industries by Sex in Orange
The Orange industries that see more men than women are Utilities (91.2%), Construction (85.6%), and Enterprise Management (75.0%), whereas the industries that tend to have a higher number of women are Educational Services (76.3%), Health Care & Social Assistance (74.2%), and Information (60.0%).
| Industry | Male | Female |
| Agriculture, Fishing & Hunting | 23 (62.2%) | 14 (37.8%) |
| Mining, Quarrying, & Extraction | 0 (0.0%) | 0 (0.0%) |
| Construction | 374 (85.6%) | 63 (14.4%) |
| Manufacturing | 361 (68.8%) | 164 (31.2%) |
| Wholesale Trade | 109 (51.4%) | 103 (48.6%) |
| Retail Trade | 493 (63.7%) | 281 (36.3%) |
| Transportation & Warehousing | 63 (46.3%) | 73 (53.7%) |
| Utilities | 83 (91.2%) | 8 (8.8%) |
| Information | 24 (40.0%) | 36 (60.0%) |
| Finance & Insurance | 278 (55.0%) | 227 (45.0%) |
| Real Estate, Rental & Leasing | 96 (63.6%) | 55 (36.4%) |
| Professional & Scientific | 400 (56.3%) | 311 (43.7%) |
| Enterprise Management | 18 (75.0%) | 6 (25.0%) |
| Administrative & Support | 88 (59.5%) | 60 (40.5%) |
| Educational Services | 288 (23.7%) | 928 (76.3%) |
| Health Care & Social Assistance | 329 (25.8%) | 944 (74.2%) |
| Arts, Entertainment & Recreation | 101 (74.8%) | 34 (25.2%) |
| Accommodation & Food Services | 119 (48.8%) | 125 (51.2%) |
| Public Administration | 219 (74.7%) | 74 (25.3%) |
| Total | 3,513 (49.5%) | 3,588 (50.5%) |
Education in Orange
School Enrollment in Orange
The most common levels of schooling among the 3,660 students in Orange are high school (850 | 23.2%), middle school (848 | 23.2%), and elementary school (811 | 22.2%).
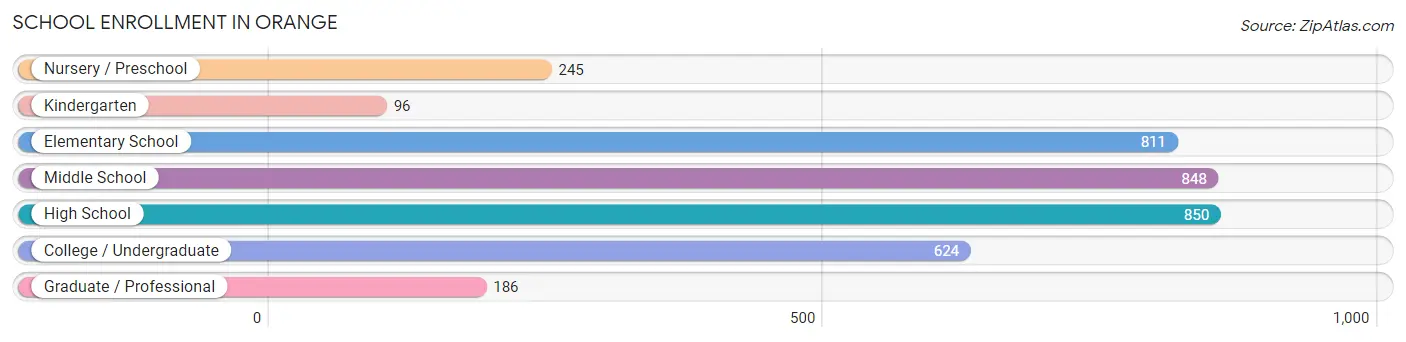
| School Level | # Students | % Students |
| Nursery / Preschool | 245 | 6.7% |
| Kindergarten | 96 | 2.6% |
| Elementary School | 811 | 22.2% |
| Middle School | 848 | 23.2% |
| High School | 850 | 23.2% |
| College / Undergraduate | 624 | 17.1% |
| Graduate / Professional | 186 | 5.1% |
| Total | 3,660 | 100.0% |
School Enrollment by Age by Funding Source in Orange
Out of a total of 3,660 students who are enrolled in schools in Orange, 640 (17.5%) attend a private institution, while the remaining 3,020 (82.5%) are enrolled in public schools. The age group of 25 to 34 year olds has the highest likelihood of being enrolled in private schools, with 64 (87.7% in the age bracket) enrolled. Conversely, the age group of 10 to 14 year olds has the lowest likelihood of being enrolled in a private school, with 991 (94.8% in the age bracket) attending a public institution.
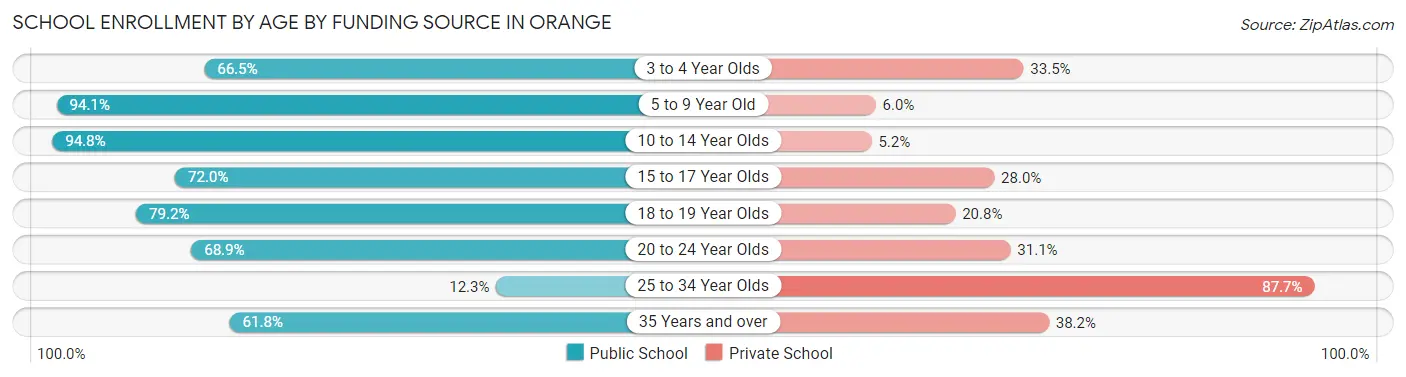
| Age Bracket | Public School | Private School |
| 3 to 4 Year Olds | 147 (66.5%) | 74 (33.5%) |
| 5 to 9 Year Old | 854 (94.1%) | 54 (5.9%) |
| 10 to 14 Year Olds | 991 (94.8%) | 54 (5.2%) |
| 15 to 17 Year Olds | 380 (72.0%) | 148 (28.0%) |
| 18 to 19 Year Olds | 305 (79.2%) | 80 (20.8%) |
| 20 to 24 Year Olds | 222 (68.9%) | 100 (31.1%) |
| 25 to 34 Year Olds | 9 (12.3%) | 64 (87.7%) |
| 35 Years and over | 110 (61.8%) | 68 (38.2%) |
| Total | 3,020 (82.5%) | 640 (17.5%) |
Educational Attainment by Field of Study in Orange
Business (1,226 | 19.4%), education (881 | 13.9%), science & technology (752 | 11.9%), psychology (467 | 7.4%), and social sciences (420 | 6.6%) are the most common fields of study among 6,328 individuals in Orange who have obtained a bachelor's degree or higher.
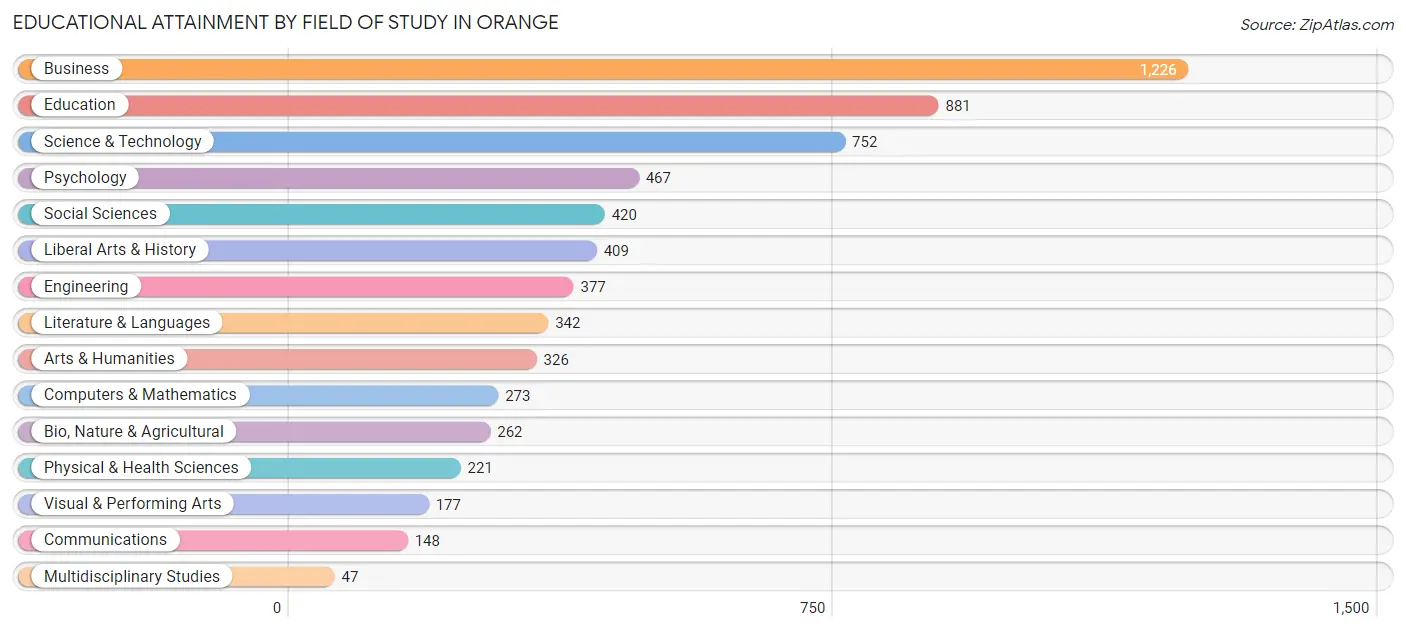
| Field of Study | # Graduates | % Graduates |
| Computers & Mathematics | 273 | 4.3% |
| Bio, Nature & Agricultural | 262 | 4.1% |
| Physical & Health Sciences | 221 | 3.5% |
| Psychology | 467 | 7.4% |
| Social Sciences | 420 | 6.6% |
| Engineering | 377 | 6.0% |
| Multidisciplinary Studies | 47 | 0.7% |
| Science & Technology | 752 | 11.9% |
| Business | 1,226 | 19.4% |
| Education | 881 | 13.9% |
| Literature & Languages | 342 | 5.4% |
| Liberal Arts & History | 409 | 6.5% |
| Visual & Performing Arts | 177 | 2.8% |
| Communications | 148 | 2.3% |
| Arts & Humanities | 326 | 5.1% |
| Total | 6,328 | 100.0% |
Transportation & Commute in Orange
Vehicle Availability by Sex in Orange
The most prevalent vehicle ownership categories in Orange are males with 2 vehicles (1,700, accounting for 48.7%) and females with 2 vehicles (1,395, making up 49.3%).
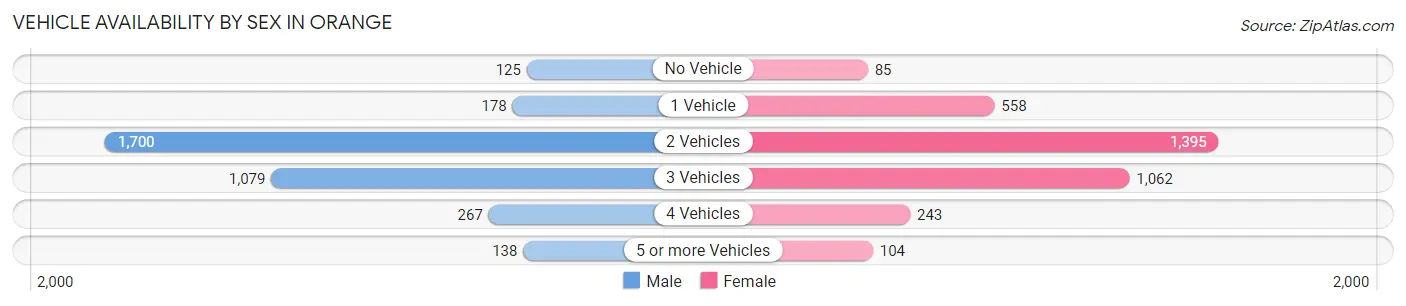
| Vehicles Available | Male | Female |
| No Vehicle | 125 (3.6%) | 85 (2.5%) |
| 1 Vehicle | 178 (5.1%) | 558 (16.2%) |
| 2 Vehicles | 1,700 (48.7%) | 1,395 (40.5%) |
| 3 Vehicles | 1,079 (30.9%) | 1,062 (30.8%) |
| 4 Vehicles | 267 (7.7%) | 243 (7.0%) |
| 5 or more Vehicles | 138 (4.0%) | 104 (3.0%) |
| Total | 3,487 (100.0%) | 3,447 (100.0%) |
Commute Time in Orange
The most frequently occuring commute durations in Orange are 20 to 24 minutes (1,678 commuters, 27.5%), 15 to 19 minutes (1,072 commuters, 17.5%), and 10 to 14 minutes (768 commuters, 12.6%).
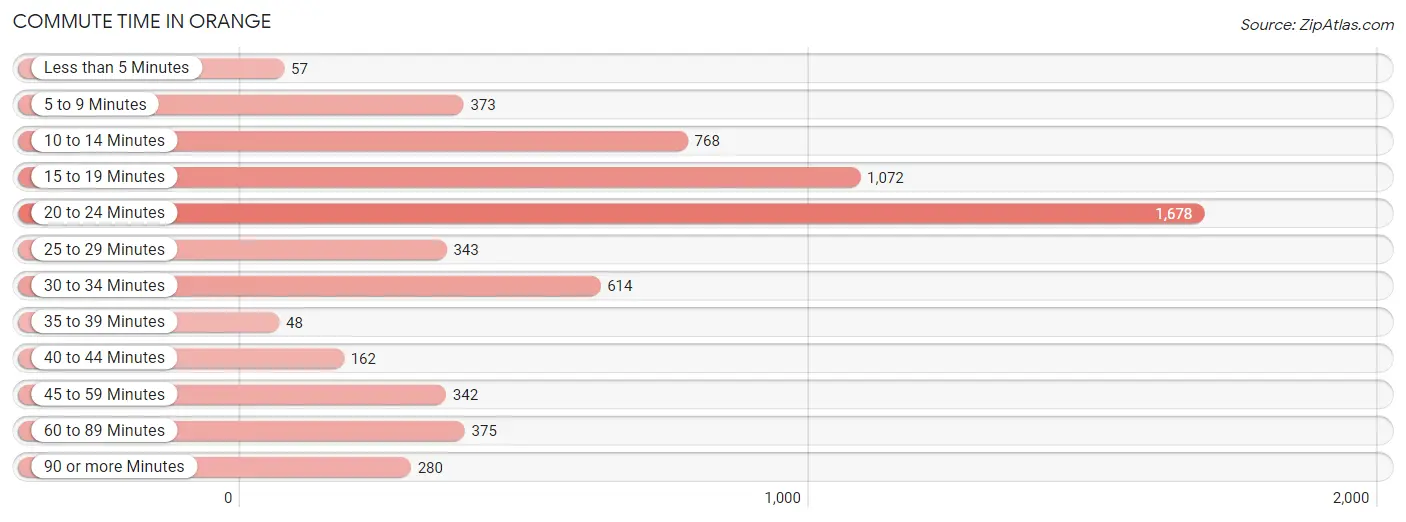
| Commute Time | # Commuters | % Commuters |
| Less than 5 Minutes | 57 | 0.9% |
| 5 to 9 Minutes | 373 | 6.1% |
| 10 to 14 Minutes | 768 | 12.6% |
| 15 to 19 Minutes | 1,072 | 17.5% |
| 20 to 24 Minutes | 1,678 | 27.5% |
| 25 to 29 Minutes | 343 | 5.6% |
| 30 to 34 Minutes | 614 | 10.1% |
| 35 to 39 Minutes | 48 | 0.8% |
| 40 to 44 Minutes | 162 | 2.6% |
| 45 to 59 Minutes | 342 | 5.6% |
| 60 to 89 Minutes | 375 | 6.1% |
| 90 or more Minutes | 280 | 4.6% |
Commute Time by Sex in Orange
The most common commute times in Orange are 20 to 24 minutes (686 commuters, 22.9%) for males and 20 to 24 minutes (992 commuters, 31.8%) for females.
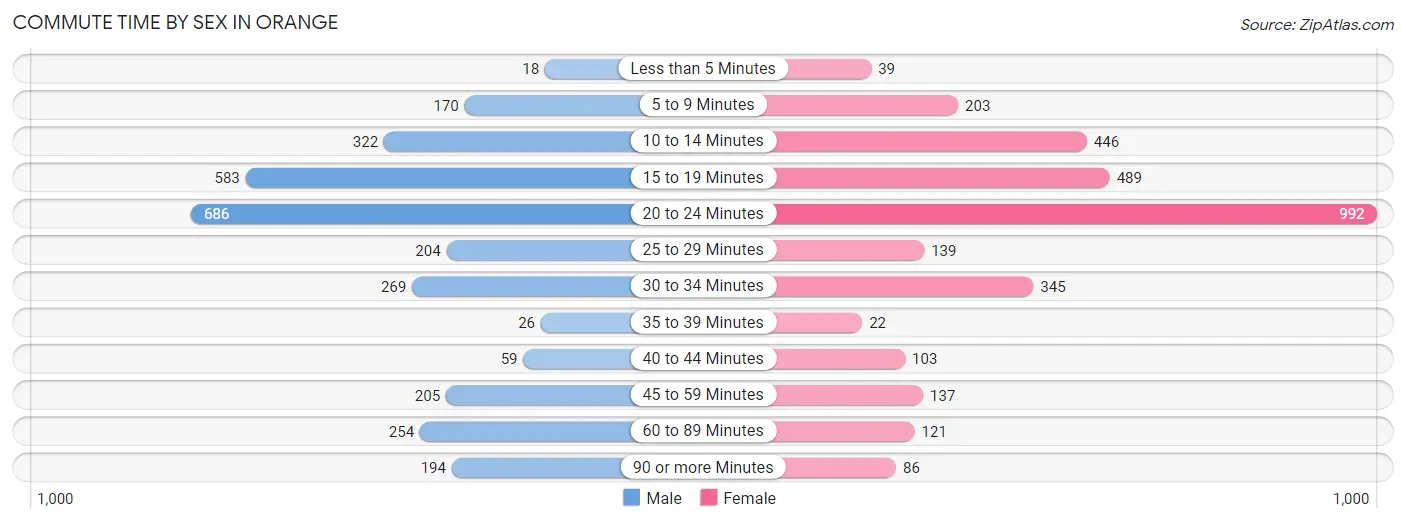
| Commute Time | Male | Female |
| Less than 5 Minutes | 18 (0.6%) | 39 (1.3%) |
| 5 to 9 Minutes | 170 (5.7%) | 203 (6.5%) |
| 10 to 14 Minutes | 322 (10.8%) | 446 (14.3%) |
| 15 to 19 Minutes | 583 (19.5%) | 489 (15.7%) |
| 20 to 24 Minutes | 686 (22.9%) | 992 (31.8%) |
| 25 to 29 Minutes | 204 (6.8%) | 139 (4.4%) |
| 30 to 34 Minutes | 269 (9.0%) | 345 (11.1%) |
| 35 to 39 Minutes | 26 (0.9%) | 22 (0.7%) |
| 40 to 44 Minutes | 59 (2.0%) | 103 (3.3%) |
| 45 to 59 Minutes | 205 (6.9%) | 137 (4.4%) |
| 60 to 89 Minutes | 254 (8.5%) | 121 (3.9%) |
| 90 or more Minutes | 194 (6.5%) | 86 (2.8%) |
Time of Departure to Work by Sex in Orange
The most frequent times of departure to work in Orange are 7:00 AM to 7:29 AM (542, 18.1%) for males and 8:00 AM to 8:29 AM (754, 24.1%) for females.
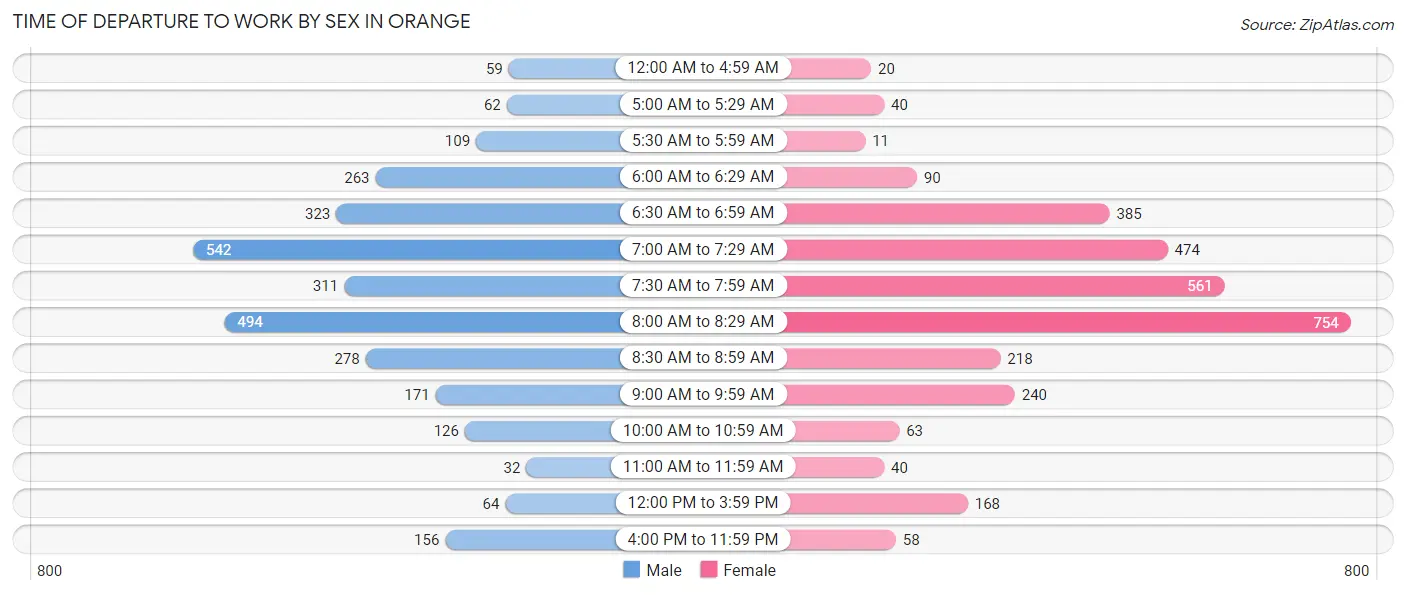
| Time of Departure | Male | Female |
| 12:00 AM to 4:59 AM | 59 (2.0%) | 20 (0.6%) |
| 5:00 AM to 5:29 AM | 62 (2.1%) | 40 (1.3%) |
| 5:30 AM to 5:59 AM | 109 (3.6%) | 11 (0.4%) |
| 6:00 AM to 6:29 AM | 263 (8.8%) | 90 (2.9%) |
| 6:30 AM to 6:59 AM | 323 (10.8%) | 385 (12.3%) |
| 7:00 AM to 7:29 AM | 542 (18.1%) | 474 (15.2%) |
| 7:30 AM to 7:59 AM | 311 (10.4%) | 561 (18.0%) |
| 8:00 AM to 8:29 AM | 494 (16.5%) | 754 (24.1%) |
| 8:30 AM to 8:59 AM | 278 (9.3%) | 218 (7.0%) |
| 9:00 AM to 9:59 AM | 171 (5.7%) | 240 (7.7%) |
| 10:00 AM to 10:59 AM | 126 (4.2%) | 63 (2.0%) |
| 11:00 AM to 11:59 AM | 32 (1.1%) | 40 (1.3%) |
| 12:00 PM to 3:59 PM | 64 (2.1%) | 168 (5.4%) |
| 4:00 PM to 11:59 PM | 156 (5.2%) | 58 (1.9%) |
| Total | 2,990 (100.0%) | 3,122 (100.0%) |
Housing Occupancy in Orange
Occupancy by Ownership in Orange
Of the total 5,192 dwellings in Orange, owner-occupied units account for 4,620 (89.0%), while renter-occupied units make up 572 (11.0%).
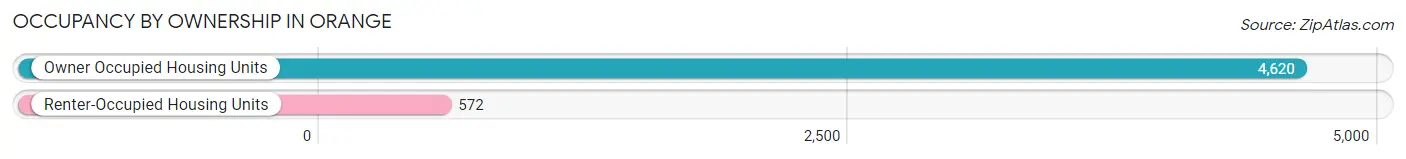
| Occupancy | # Housing Units | % Housing Units |
| Owner Occupied Housing Units | 4,620 | 89.0% |
| Renter-Occupied Housing Units | 572 | 11.0% |
| Total Occupied Housing Units | 5,192 | 100.0% |
Occupancy by Household Size in Orange
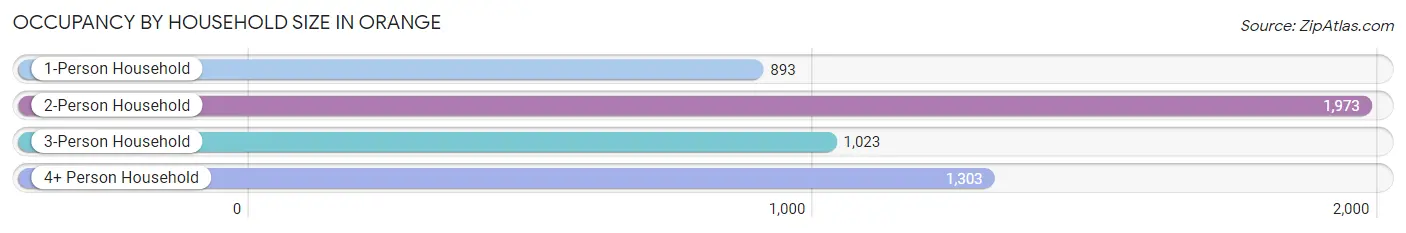
| Household Size | # Housing Units | % Housing Units |
| 1-Person Household | 893 | 17.2% |
| 2-Person Household | 1,973 | 38.0% |
| 3-Person Household | 1,023 | 19.7% |
| 4+ Person Household | 1,303 | 25.1% |
| Total Housing Units | 5,192 | 100.0% |
Occupancy by Ownership by Household Size in Orange
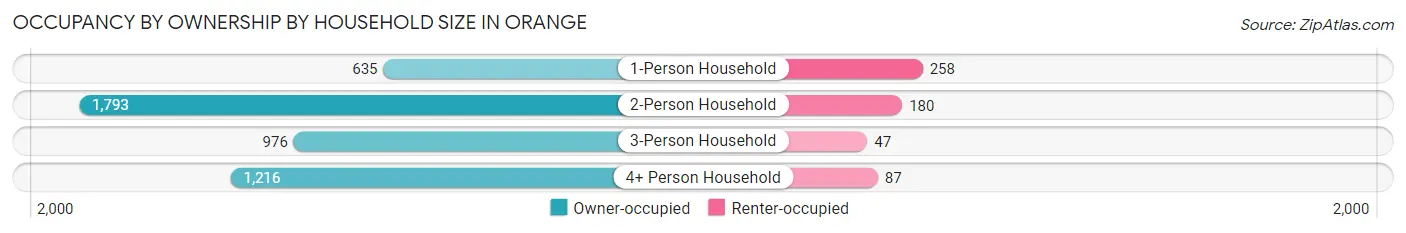
| Household Size | Owner-occupied | Renter-occupied |
| 1-Person Household | 635 (71.1%) | 258 (28.9%) |
| 2-Person Household | 1,793 (90.9%) | 180 (9.1%) |
| 3-Person Household | 976 (95.4%) | 47 (4.6%) |
| 4+ Person Household | 1,216 (93.3%) | 87 (6.7%) |
| Total Housing Units | 4,620 (89.0%) | 572 (11.0%) |
Occupancy by Educational Attainment in Orange
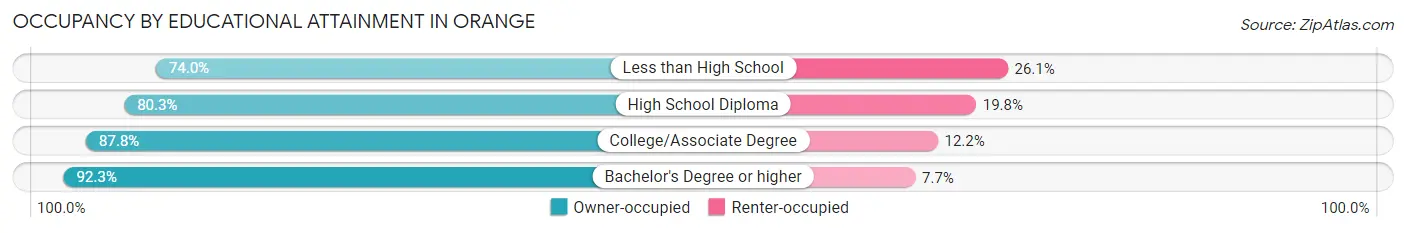
| Household Size | Owner-occupied | Renter-occupied |
| Less than High School | 88 (74.0%) | 31 (26.1%) |
| High School Diploma | 711 (80.2%) | 175 (19.8%) |
| College/Associate Degree | 845 (87.8%) | 117 (12.2%) |
| Bachelor's Degree or higher | 2,976 (92.3%) | 249 (7.7%) |
Occupancy by Age of Householder in Orange
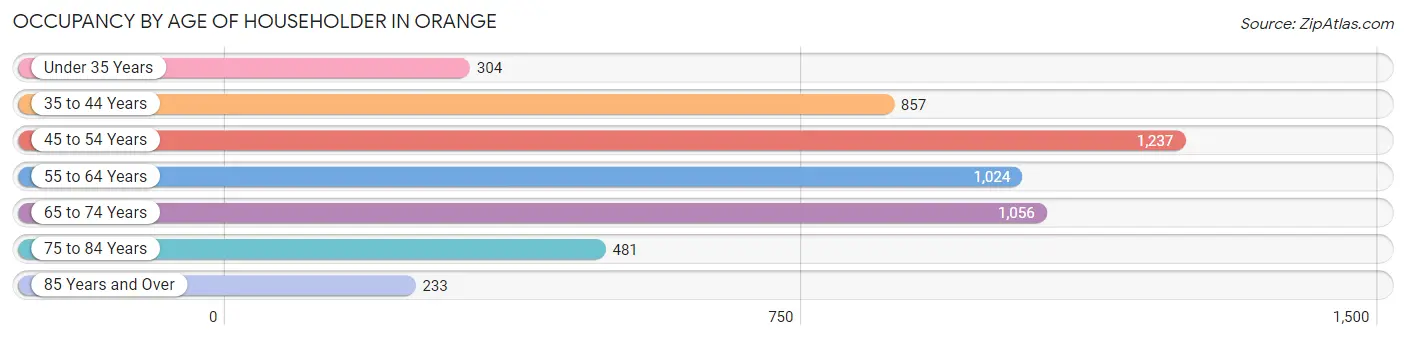
| Age Bracket | # Households | % Households |
| Under 35 Years | 304 | 5.9% |
| 35 to 44 Years | 857 | 16.5% |
| 45 to 54 Years | 1,237 | 23.8% |
| 55 to 64 Years | 1,024 | 19.7% |
| 65 to 74 Years | 1,056 | 20.3% |
| 75 to 84 Years | 481 | 9.3% |
| 85 Years and Over | 233 | 4.5% |
| Total | 5,192 | 100.0% |
Housing Finances in Orange
Median Income by Occupancy in Orange
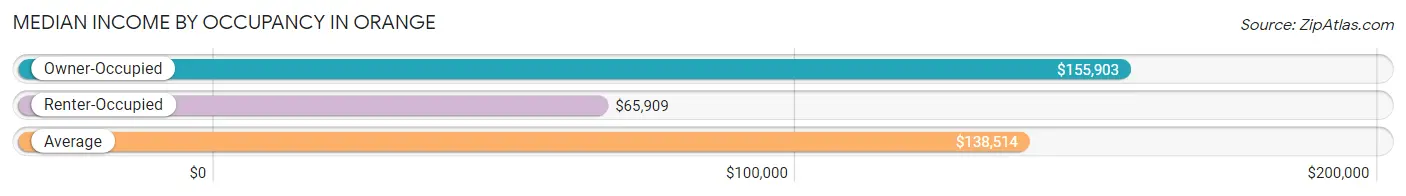
| Occupancy Type | # Households | Median Income |
| Owner-Occupied | 4,620 (89.0%) | $155,903 |
| Renter-Occupied | 572 (11.0%) | $65,909 |
| Average | 5,192 (100.0%) | $138,514 |
Occupancy by Householder Income Bracket in Orange
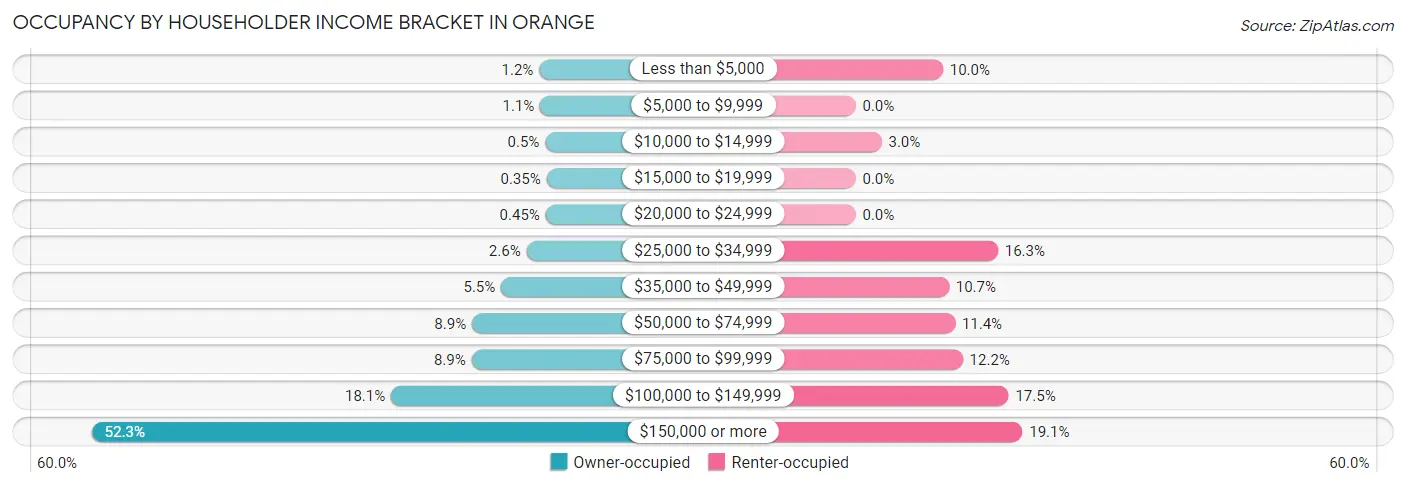
| Income Bracket | Owner-occupied | Renter-occupied |
| Less than $5,000 | 55 (1.2%) | 57 (10.0%) |
| $5,000 to $9,999 | 50 (1.1%) | 0 (0.0%) |
| $10,000 to $14,999 | 23 (0.5%) | 17 (3.0%) |
| $15,000 to $19,999 | 16 (0.4%) | 0 (0.0%) |
| $20,000 to $24,999 | 21 (0.4%) | 0 (0.0%) |
| $25,000 to $34,999 | 122 (2.6%) | 93 (16.3%) |
| $35,000 to $49,999 | 256 (5.5%) | 61 (10.7%) |
| $50,000 to $74,999 | 410 (8.9%) | 65 (11.4%) |
| $75,000 to $99,999 | 412 (8.9%) | 70 (12.2%) |
| $100,000 to $149,999 | 837 (18.1%) | 100 (17.5%) |
| $150,000 or more | 2,418 (52.3%) | 109 (19.1%) |
| Total | 4,620 (100.0%) | 572 (100.0%) |
Monthly Housing Cost Tiers in Orange
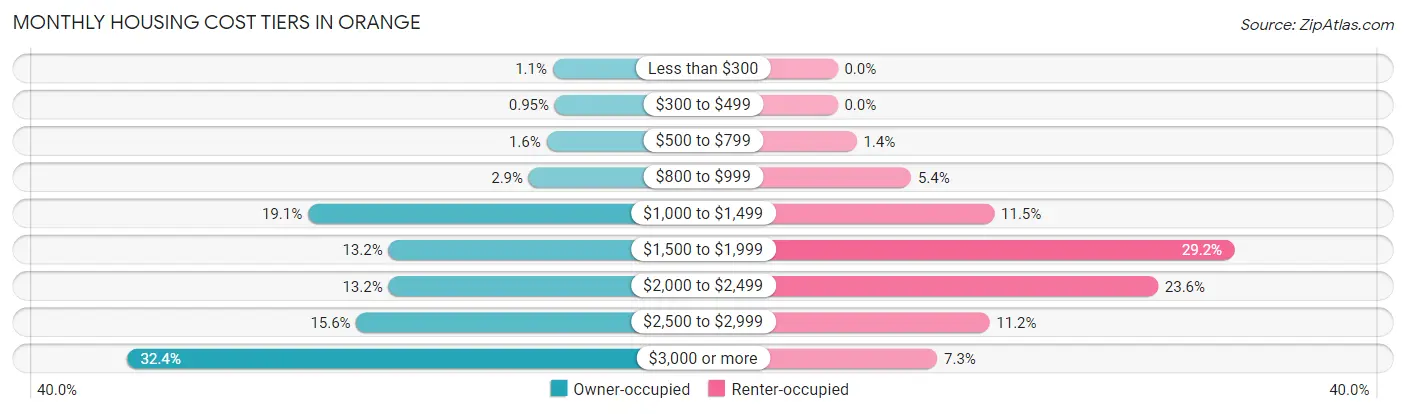
| Monthly Cost | Owner-occupied | Renter-occupied |
| Less than $300 | 51 (1.1%) | 0 (0.0%) |
| $300 to $499 | 44 (0.9%) | 0 (0.0%) |
| $500 to $799 | 72 (1.6%) | 8 (1.4%) |
| $800 to $999 | 132 (2.9%) | 31 (5.4%) |
| $1,000 to $1,499 | 884 (19.1%) | 66 (11.5%) |
| $1,500 to $1,999 | 610 (13.2%) | 167 (29.2%) |
| $2,000 to $2,499 | 610 (13.2%) | 135 (23.6%) |
| $2,500 to $2,999 | 719 (15.6%) | 64 (11.2%) |
| $3,000 or more | 1,498 (32.4%) | 42 (7.3%) |
| Total | 4,620 (100.0%) | 572 (100.0%) |
Physical Housing Characteristics in Orange
Housing Structures in Orange
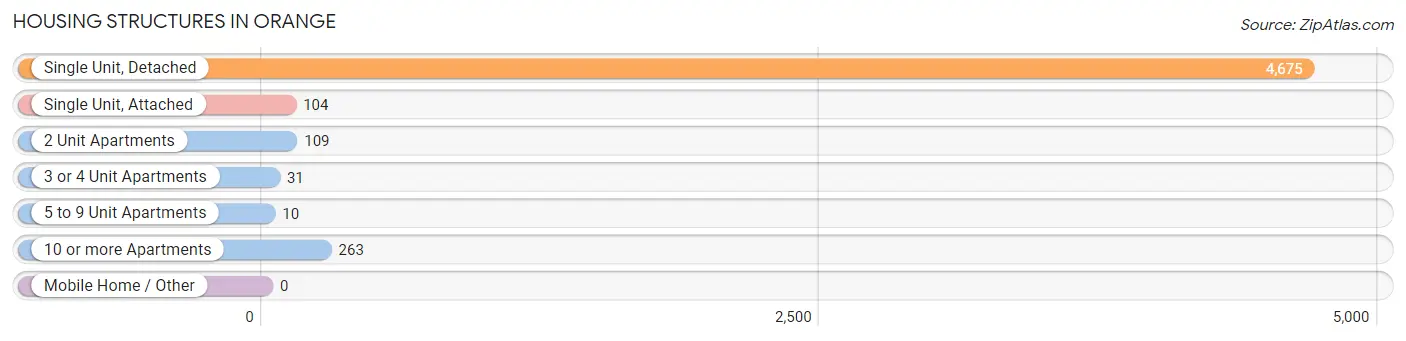
| Structure Type | # Housing Units | % Housing Units |
| Single Unit, Detached | 4,675 | 90.0% |
| Single Unit, Attached | 104 | 2.0% |
| 2 Unit Apartments | 109 | 2.1% |
| 3 or 4 Unit Apartments | 31 | 0.6% |
| 5 to 9 Unit Apartments | 10 | 0.2% |
| 10 or more Apartments | 263 | 5.1% |
| Mobile Home / Other | 0 | 0.0% |
| Total | 5,192 | 100.0% |
Housing Structures by Occupancy in Orange
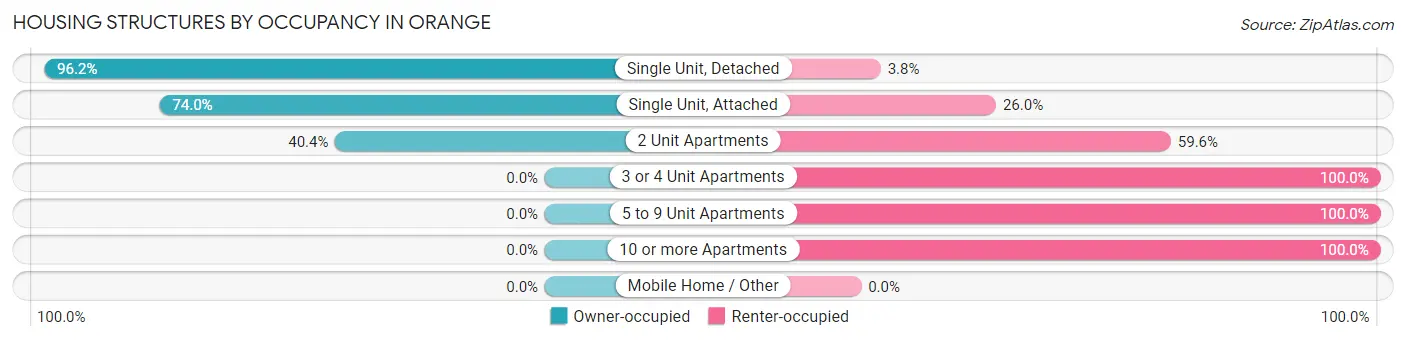
| Structure Type | Owner-occupied | Renter-occupied |
| Single Unit, Detached | 4,499 (96.2%) | 176 (3.8%) |
| Single Unit, Attached | 77 (74.0%) | 27 (26.0%) |
| 2 Unit Apartments | 44 (40.4%) | 65 (59.6%) |
| 3 or 4 Unit Apartments | 0 (0.0%) | 31 (100.0%) |
| 5 to 9 Unit Apartments | 0 (0.0%) | 10 (100.0%) |
| 10 or more Apartments | 0 (0.0%) | 263 (100.0%) |
| Mobile Home / Other | 0 (0.0%) | 0 (0.0%) |
| Total | 4,620 (89.0%) | 572 (11.0%) |
Housing Structures by Number of Rooms in Orange
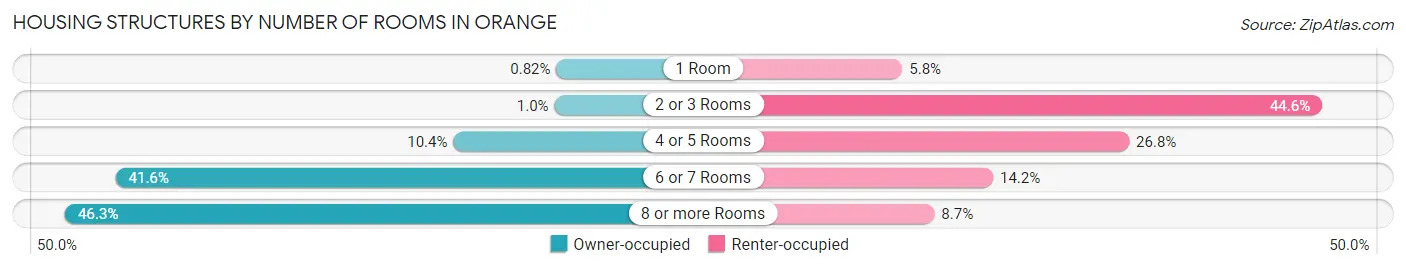
| Number of Rooms | Owner-occupied | Renter-occupied |
| 1 Room | 38 (0.8%) | 33 (5.8%) |
| 2 or 3 Rooms | 46 (1.0%) | 255 (44.6%) |
| 4 or 5 Rooms | 478 (10.3%) | 153 (26.8%) |
| 6 or 7 Rooms | 1,921 (41.6%) | 81 (14.2%) |
| 8 or more Rooms | 2,137 (46.3%) | 50 (8.7%) |
| Total | 4,620 (100.0%) | 572 (100.0%) |
Housing Structure by Heating Type in Orange
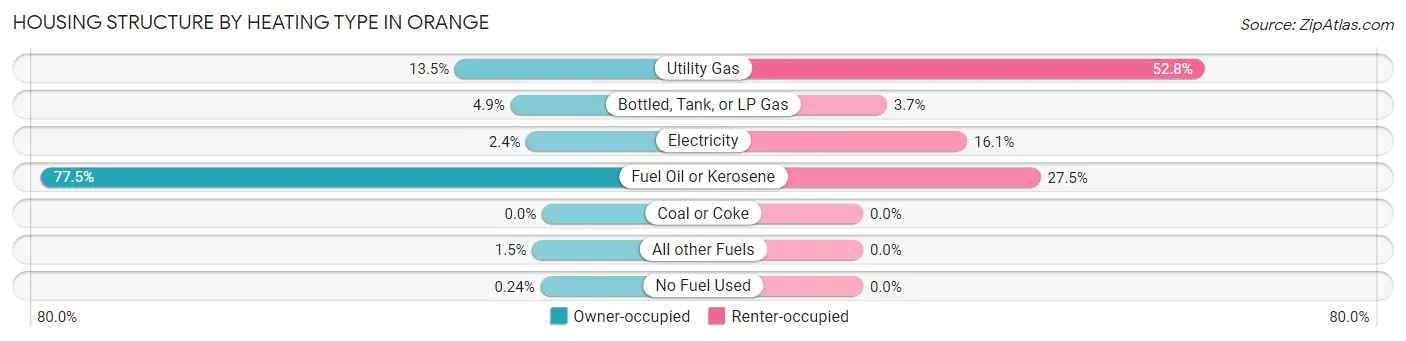
| Heating Type | Owner-occupied | Renter-occupied |
| Utility Gas | 622 (13.5%) | 302 (52.8%) |
| Bottled, Tank, or LP Gas | 226 (4.9%) | 21 (3.7%) |
| Electricity | 112 (2.4%) | 92 (16.1%) |
| Fuel Oil or Kerosene | 3,580 (77.5%) | 157 (27.5%) |
| Coal or Coke | 0 (0.0%) | 0 (0.0%) |
| All other Fuels | 69 (1.5%) | 0 (0.0%) |
| No Fuel Used | 11 (0.2%) | 0 (0.0%) |
| Total | 4,620 (100.0%) | 572 (100.0%) |
Household Vehicle Usage in Orange
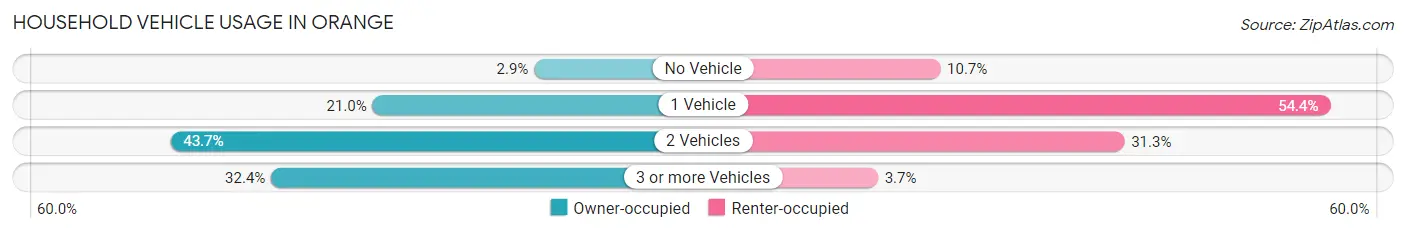
| Vehicles per Household | Owner-occupied | Renter-occupied |
| No Vehicle | 135 (2.9%) | 61 (10.7%) |
| 1 Vehicle | 971 (21.0%) | 311 (54.4%) |
| 2 Vehicles | 2,018 (43.7%) | 179 (31.3%) |
| 3 or more Vehicles | 1,496 (32.4%) | 21 (3.7%) |
| Total | 4,620 (100.0%) | 572 (100.0%) |
Real Estate & Mortgages in Orange
Real Estate and Mortgage Overview in Orange
| Characteristic | Without Mortgage | With Mortgage |
| Housing Units | 1,532 | 3,088 |
| Median Property Value | $452,600 | $445,000 |
| Median Household Income | $121,645 | $1,716 |
| Monthly Housing Costs | $1,324 | $1,469 |
| Real Estate Taxes | $9,035 | $64 |
Property Value by Mortgage Status in Orange
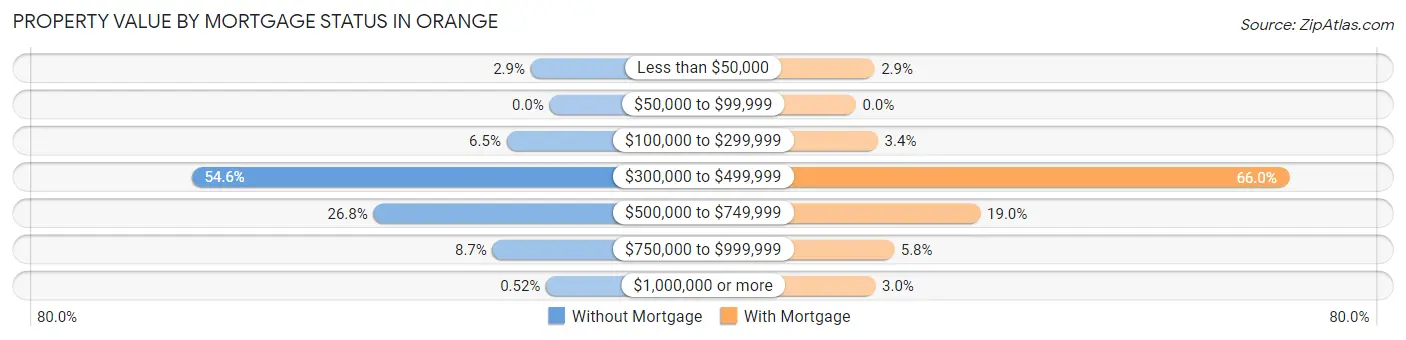
| Property Value | Without Mortgage | With Mortgage |
| Less than $50,000 | 44 (2.9%) | 88 (2.9%) |
| $50,000 to $99,999 | 0 (0.0%) | 0 (0.0%) |
| $100,000 to $299,999 | 100 (6.5%) | 104 (3.4%) |
| $300,000 to $499,999 | 836 (54.6%) | 2,038 (66.0%) |
| $500,000 to $749,999 | 411 (26.8%) | 586 (19.0%) |
| $750,000 to $999,999 | 133 (8.7%) | 180 (5.8%) |
| $1,000,000 or more | 8 (0.5%) | 92 (3.0%) |
| Total | 1,532 (100.0%) | 3,088 (100.0%) |
Household Income by Mortgage Status in Orange
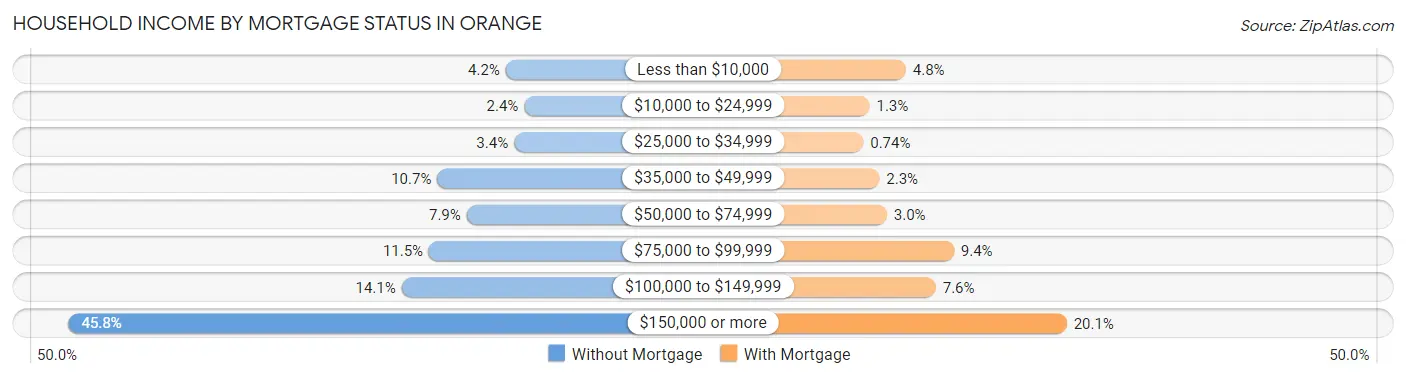
| Household Income | Without Mortgage | With Mortgage |
| Less than $10,000 | 64 (4.2%) | 148 (4.8%) |
| $10,000 to $24,999 | 37 (2.4%) | 41 (1.3%) |
| $25,000 to $34,999 | 52 (3.4%) | 23 (0.7%) |
| $35,000 to $49,999 | 164 (10.7%) | 70 (2.3%) |
| $50,000 to $74,999 | 121 (7.9%) | 92 (3.0%) |
| $75,000 to $99,999 | 176 (11.5%) | 289 (9.4%) |
| $100,000 to $149,999 | 216 (14.1%) | 236 (7.6%) |
| $150,000 or more | 702 (45.8%) | 621 (20.1%) |
| Total | 1,532 (100.0%) | 3,088 (100.0%) |
Property Value to Household Income Ratio in Orange
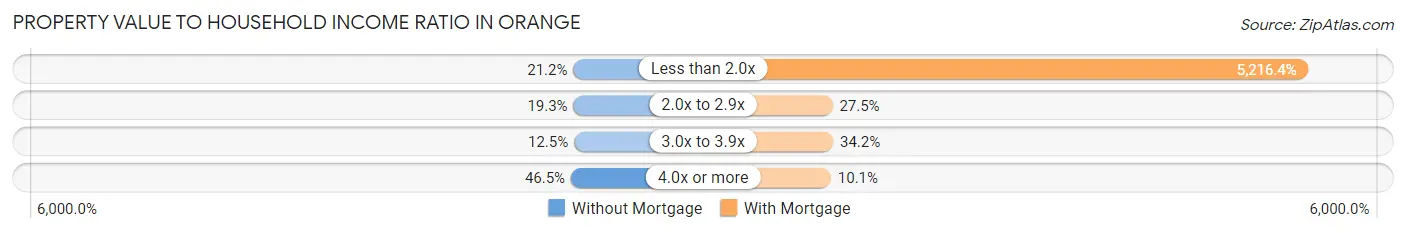
| Value-to-Income Ratio | Without Mortgage | With Mortgage |
| Less than 2.0x | 324 (21.1%) | 161,083 (5,216.4%) |
| 2.0x to 2.9x | 296 (19.3%) | 850 (27.5%) |
| 3.0x to 3.9x | 191 (12.5%) | 1,056 (34.2%) |
| 4.0x or more | 713 (46.5%) | 312 (10.1%) |
| Total | 1,532 (100.0%) | 3,088 (100.0%) |
Real Estate Taxes by Mortgage Status in Orange
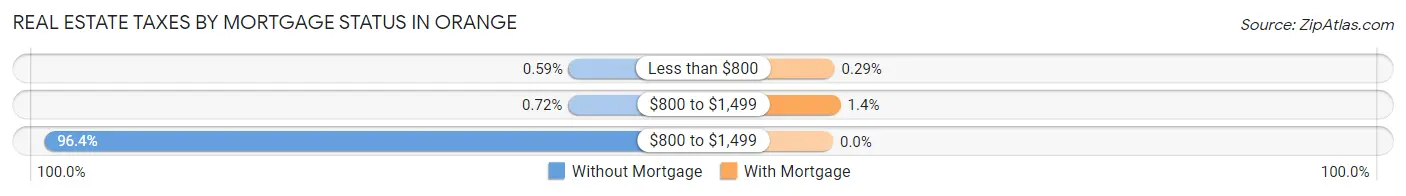
| Property Taxes | Without Mortgage | With Mortgage |
| Less than $800 | 9 (0.6%) | 9 (0.3%) |
| $800 to $1,499 | 11 (0.7%) | 43 (1.4%) |
| $800 to $1,499 | 1,477 (96.4%) | 0 (0.0%) |
| Total | 1,532 (100.0%) | 3,088 (100.0%) |
Health & Disability in Orange
Health Insurance Coverage by Age in Orange
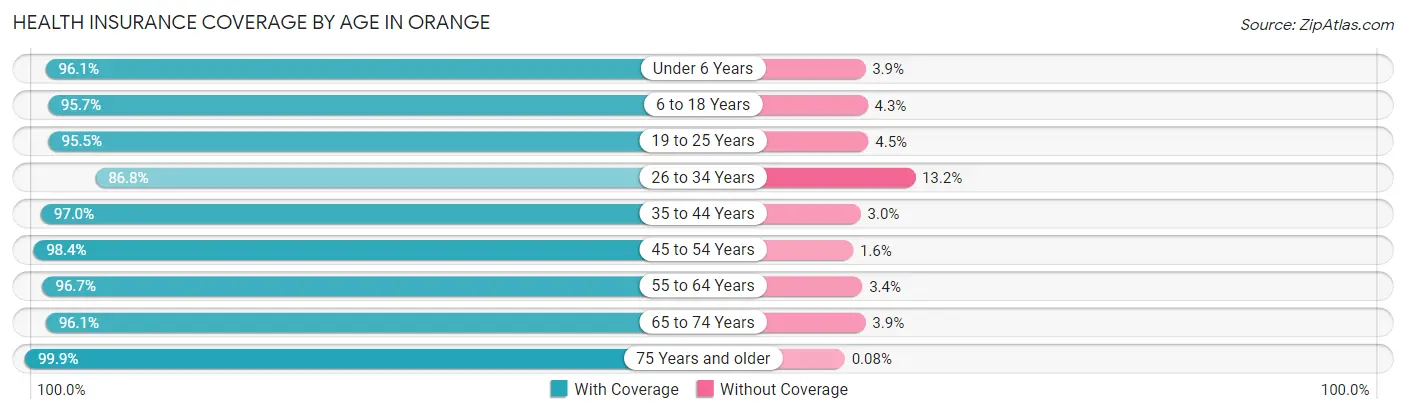
| Age Bracket | With Coverage | Without Coverage |
| Under 6 Years | 838 (96.1%) | 34 (3.9%) |
| 6 to 18 Years | 2,646 (95.7%) | 120 (4.3%) |
| 19 to 25 Years | 789 (95.5%) | 37 (4.5%) |
| 26 to 34 Years | 731 (86.8%) | 111 (13.2%) |
| 35 to 44 Years | 1,596 (97.0%) | 50 (3.0%) |
| 45 to 54 Years | 2,012 (98.4%) | 33 (1.6%) |
| 55 to 64 Years | 1,990 (96.7%) | 69 (3.4%) |
| 65 to 74 Years | 1,782 (96.1%) | 73 (3.9%) |
| 75 Years and older | 1,263 (99.9%) | 1 (0.1%) |
| Total | 13,647 (96.3%) | 528 (3.7%) |
Health Insurance Coverage by Citizenship Status in Orange
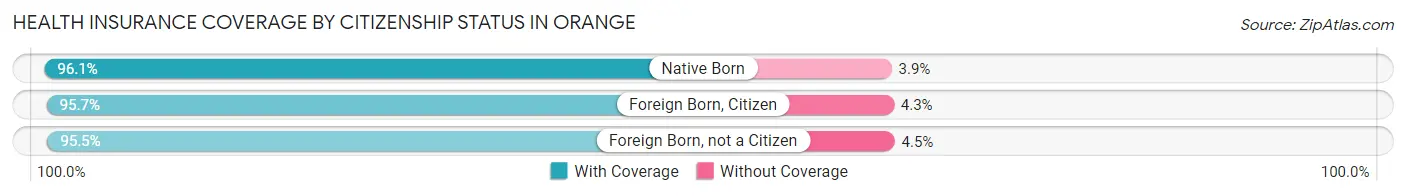
| Citizenship Status | With Coverage | Without Coverage |
| Native Born | 838 (96.1%) | 34 (3.9%) |
| Foreign Born, Citizen | 2,646 (95.7%) | 120 (4.3%) |
| Foreign Born, not a Citizen | 789 (95.5%) | 37 (4.5%) |
Health Insurance Coverage by Household Income in Orange
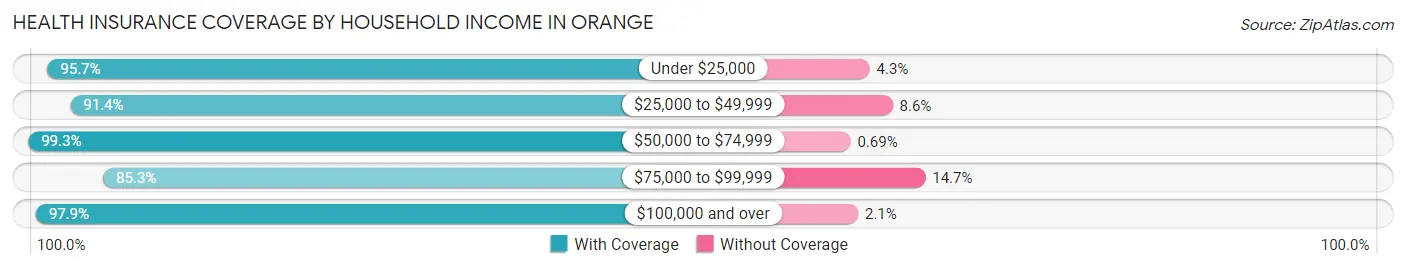
| Household Income | With Coverage | Without Coverage |
| Under $25,000 | 359 (95.7%) | 16 (4.3%) |
| $25,000 to $49,999 | 788 (91.4%) | 74 (8.6%) |
| $50,000 to $74,999 | 858 (99.3%) | 6 (0.7%) |
| $75,000 to $99,999 | 1,201 (85.3%) | 207 (14.7%) |
| $100,000 and over | 10,425 (97.9%) | 225 (2.1%) |
Public vs Private Health Insurance Coverage by Age in Orange
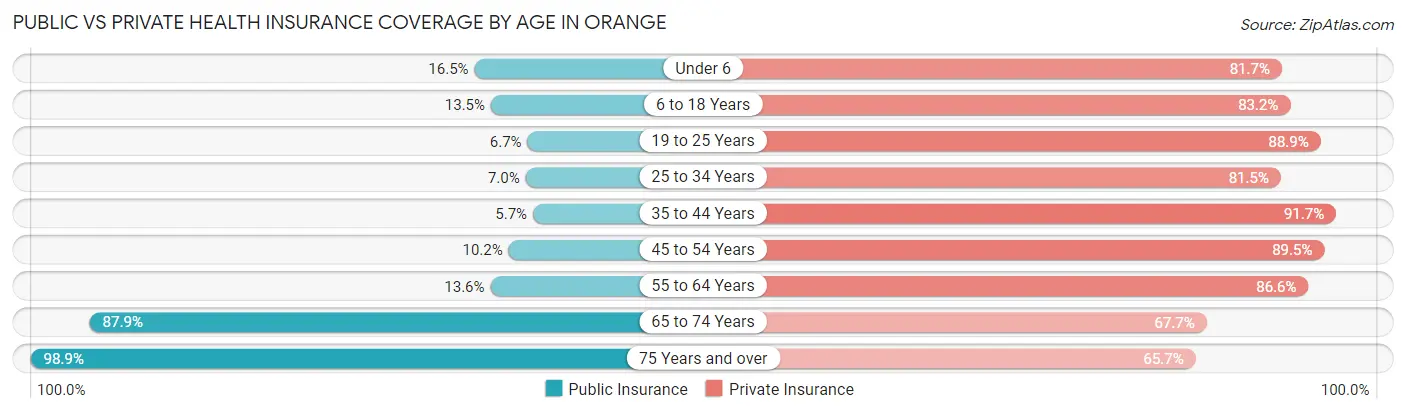
| Age Bracket | Public Insurance | Private Insurance |
| Under 6 | 144 (16.5%) | 712 (81.7%) |
| 6 to 18 Years | 372 (13.5%) | 2,302 (83.2%) |
| 19 to 25 Years | 55 (6.7%) | 734 (88.9%) |
| 25 to 34 Years | 59 (7.0%) | 686 (81.5%) |
| 35 to 44 Years | 93 (5.7%) | 1,510 (91.7%) |
| 45 to 54 Years | 208 (10.2%) | 1,831 (89.5%) |
| 55 to 64 Years | 279 (13.6%) | 1,783 (86.6%) |
| 65 to 74 Years | 1,631 (87.9%) | 1,256 (67.7%) |
| 75 Years and over | 1,250 (98.9%) | 830 (65.7%) |
| Total | 4,091 (28.9%) | 11,644 (82.1%) |
Disability Status by Sex by Age in Orange
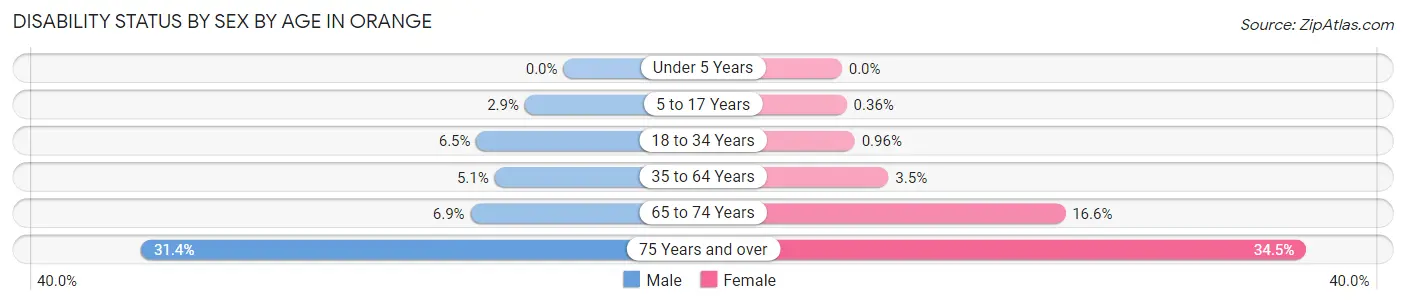
| Age Bracket | Male | Female |
| Under 5 Years | 0 (0.0%) | 0 (0.0%) |
| 5 to 17 Years | 32 (2.9%) | 5 (0.4%) |
| 18 to 34 Years | 55 (6.5%) | 11 (1.0%) |
| 35 to 64 Years | 145 (5.1%) | 101 (3.5%) |
| 65 to 74 Years | 56 (6.9%) | 173 (16.6%) |
| 75 Years and over | 158 (31.4%) | 262 (34.5%) |
Disability Class by Sex by Age in Orange
Disability Class: Hearing Difficulty
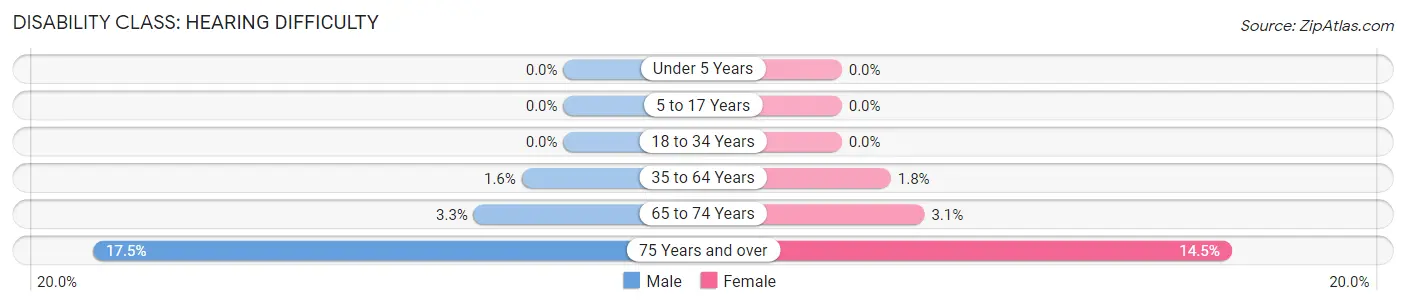
| Age Bracket | Male | Female |
| Under 5 Years | 0 (0.0%) | 0 (0.0%) |
| 5 to 17 Years | 0 (0.0%) | 0 (0.0%) |
| 18 to 34 Years | 0 (0.0%) | 0 (0.0%) |
| 35 to 64 Years | 44 (1.5%) | 53 (1.8%) |
| 65 to 74 Years | 27 (3.3%) | 32 (3.1%) |
| 75 Years and over | 88 (17.5%) | 110 (14.5%) |
Disability Class: Vision Difficulty
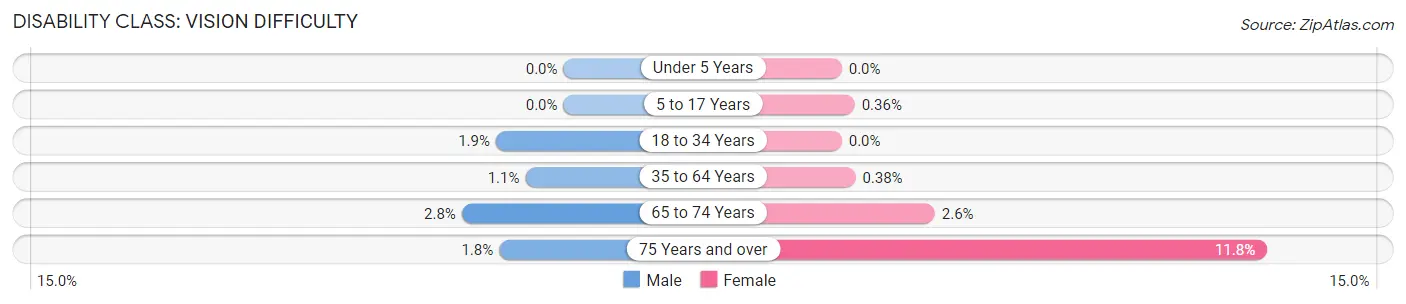
| Age Bracket | Male | Female |
| Under 5 Years | 0 (0.0%) | 0 (0.0%) |
| 5 to 17 Years | 0 (0.0%) | 5 (0.4%) |
| 18 to 34 Years | 16 (1.9%) | 0 (0.0%) |
| 35 to 64 Years | 30 (1.1%) | 11 (0.4%) |
| 65 to 74 Years | 23 (2.8%) | 27 (2.6%) |
| 75 Years and over | 9 (1.8%) | 90 (11.8%) |
Disability Class: Cognitive Difficulty
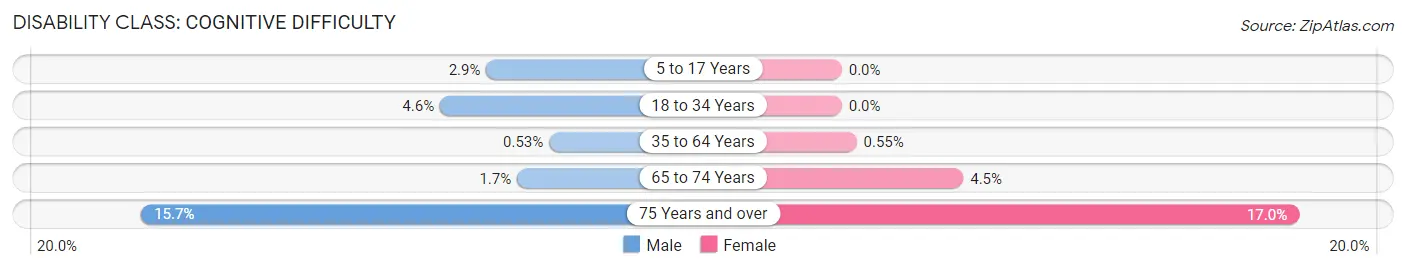
| Age Bracket | Male | Female |
| 5 to 17 Years | 32 (2.9%) | 0 (0.0%) |
| 18 to 34 Years | 39 (4.6%) | 0 (0.0%) |
| 35 to 64 Years | 15 (0.5%) | 16 (0.5%) |
| 65 to 74 Years | 14 (1.7%) | 47 (4.5%) |
| 75 Years and over | 79 (15.7%) | 129 (17.0%) |
Disability Class: Ambulatory Difficulty
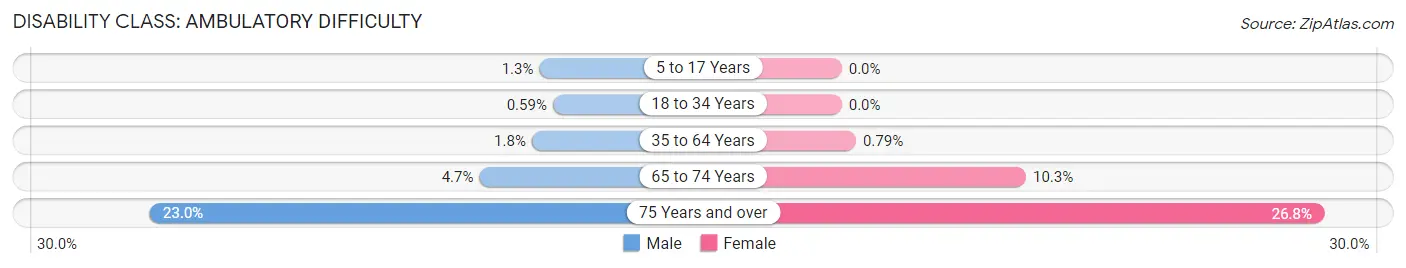
| Age Bracket | Male | Female |
| 5 to 17 Years | 15 (1.3%) | 0 (0.0%) |
| 18 to 34 Years | 5 (0.6%) | 0 (0.0%) |
| 35 to 64 Years | 50 (1.8%) | 23 (0.8%) |
| 65 to 74 Years | 38 (4.7%) | 107 (10.3%) |
| 75 Years and over | 116 (23.0%) | 204 (26.8%) |
Disability Class: Self-Care Difficulty
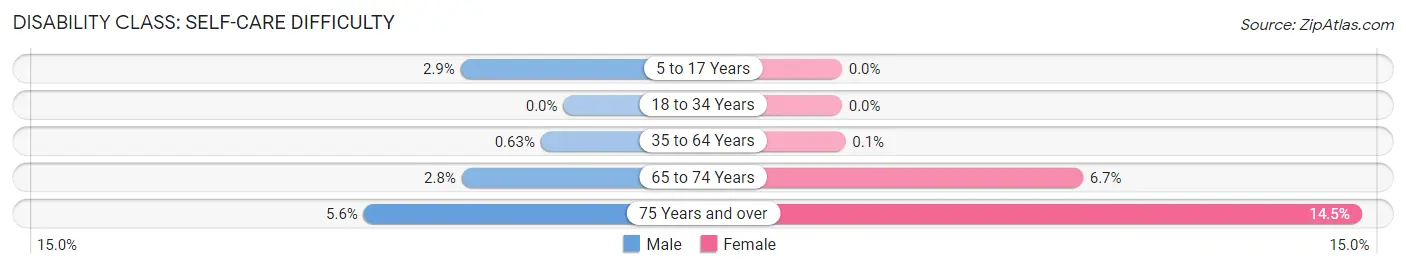
| Age Bracket | Male | Female |
| 5 to 17 Years | 32 (2.9%) | 0 (0.0%) |
| 18 to 34 Years | 0 (0.0%) | 0 (0.0%) |
| 35 to 64 Years | 18 (0.6%) | 3 (0.1%) |
| 65 to 74 Years | 23 (2.8%) | 70 (6.7%) |
| 75 Years and over | 28 (5.6%) | 110 (14.5%) |
Technology Access in Orange
Computing Device Access in Orange
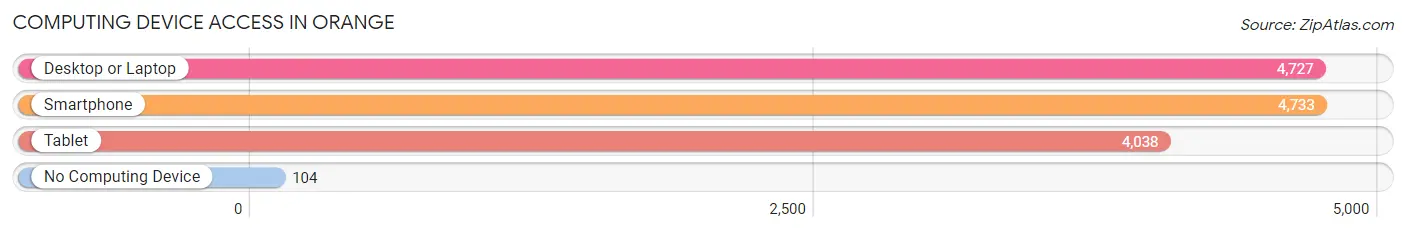
| Device Type | # Households | % Households |
| Desktop or Laptop | 4,727 | 91.0% |
| Smartphone | 4,733 | 91.2% |
| Tablet | 4,038 | 77.8% |
| No Computing Device | 104 | 2.0% |
| Total | 5,192 | 100.0% |
Internet Access in Orange
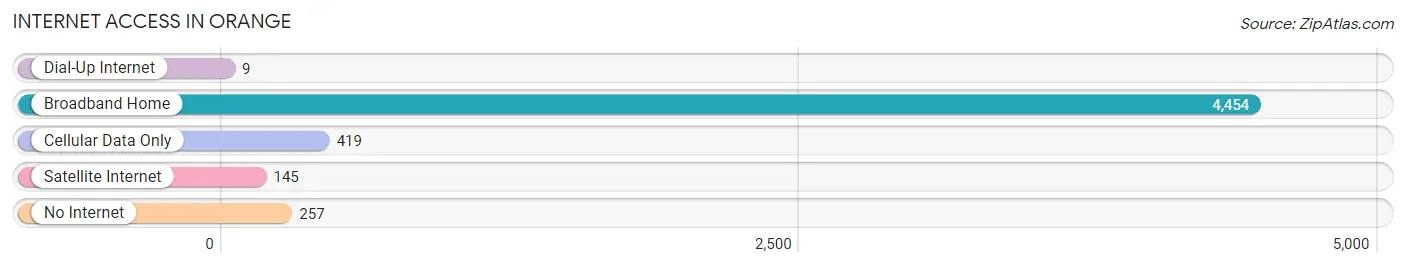
| Internet Type | # Households | % Households |
| Dial-Up Internet | 9 | 0.2% |
| Broadband Home | 4,454 | 85.8% |
| Cellular Data Only | 419 | 8.1% |
| Satellite Internet | 145 | 2.8% |
| No Internet | 257 | 5.0% |
| Total | 5,192 | 100.0% |
Orange Summary
Orange, Connecticut is a town located in New Haven County, Connecticut. It is situated in the southwestern part of the state, and is bordered by the towns of Milford, West Haven, Woodbridge, and Derby. The town has a population of 13,956, according to the 2010 census.
History
The area that is now Orange was originally inhabited by the Paugussett Native American tribe. The first European settlers arrived in the area in 1639, and the town was officially incorporated in 1822. The town was named after William III of Orange, who was the King of England at the time.
The town was originally an agricultural community, and the main crops grown were corn, wheat, and rye. The town also had a number of mills, including a grist mill, a saw mill, and a paper mill.
In the 19th century, the town began to develop into a manufacturing center. The first factory was built in 1825, and by the end of the century, the town had become a major producer of textiles, leather goods, and metal products.
Geography
Orange is located in southwestern Connecticut, and is bordered by the towns of Milford, West Haven, Woodbridge, and Derby. The town has a total area of 8.7 square miles, of which 8.6 square miles is land and 0.1 square miles is water.
The town is located in the Naugatuck River Valley, and is part of the Housatonic River watershed. The terrain is mostly flat, with some rolling hills in the northern part of the town.
Economy
Orange is a primarily residential community, and the town’s economy is largely based on the service sector. The town is home to a number of retail stores, restaurants, and other businesses.
The town is also home to a number of manufacturing companies, including a paper mill, a metal fabrication plant, and a plastics factory. The town is also home to a number of technology companies, including a software development firm and a medical device manufacturer.
Demographics
According to the 2010 census, the town has a population of 13,956. The racial makeup of the town is 87.3% White, 5.2% African American, 0.5% Native American, 2.7% Asian, 0.1% Pacific Islander, 1.7% from other races, and 2.5% from two or more races.
The median household income in the town is $76,845, and the median family income is $90,945. The per capita income in the town is $35,945. The town has a poverty rate of 5.3%.
The town is served by the Amity Regional School District, which includes two elementary schools, one middle school, and one high school. The town is also home to a number of private schools, including a Catholic school and a Montessori school.
Common Questions
What is Per Capita Income in Orange?
Per Capita income in Orange is $61,656.
What is the Median Family Income in Orange?
Median Family Income in Orange is $162,763.
What is the Median Household income in Orange?
Median Household Income in Orange is $138,514.
What is Income or Wage Gap in Orange?
Income or Wage Gap in Orange is 34.4%.
Women in Orange earn 65.6 cents for every dollar earned by a man.
What is Family Income Deficit in Orange?
Family Income Deficit in Orange is $11,969.
Families that are below poverty line in Orange earn $11,969 less on average than the poverty threshold level.
What is Inequality or Gini Index in Orange?
Inequality or Gini Index in Orange is 0.40.
What is the Total Population of Orange?
Total Population of Orange is 14,231.
What is the Total Male Population of Orange?
Total Male Population of Orange is 6,607.
What is the Total Female Population of Orange?
Total Female Population of Orange is 7,624.
What is the Ratio of Males per 100 Females in Orange?
There are 86.66 Males per 100 Females in Orange.
What is the Ratio of Females per 100 Males in Orange?
There are 115.39 Females per 100 Males in Orange.
What is the Median Population Age in Orange?
Median Population Age in Orange is 45.7 Years.
What is the Average Family Size in Orange
Average Family Size in Orange is 3.1 People.
What is the Average Household Size in Orange
Average Household Size in Orange is 2.7 People.
How Large is the Labor Force in Orange?
There are 7,386 People in the Labor Forcein in Orange.
What is the Percentage of People in the Labor Force in Orange?
65.4% of People are in the Labor Force in Orange.
What is the Unemployment Rate in Orange?
Unemployment Rate in Orange is 3.8%.