Zip Codes with the Highest Percentage of Population Employed in Security & Protection in Meriden, CT
RELATED REPORTS & OPTIONS
Security & Protection
Meriden
Compare Zip Codes
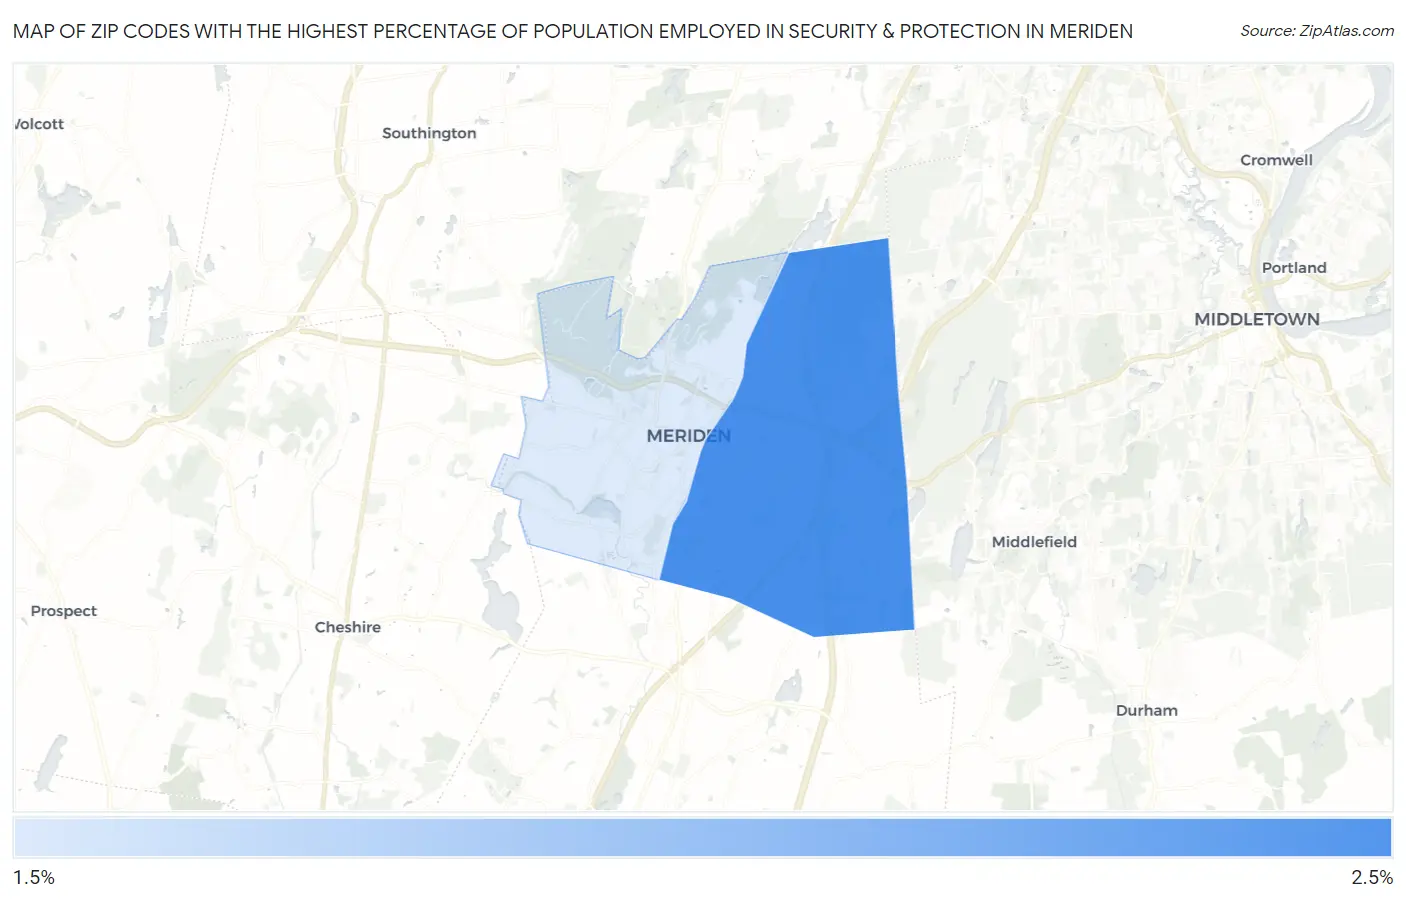
Map of Zip Codes with the Highest Percentage of Population Employed in Security & Protection in Meriden
2.1%
2.3%
Zip Codes with the Highest Percentage of Population Employed in Security & Protection in Meriden, CT
| Zip Code | % Employed | vs State | vs National | |
| 1. | 06450 | 2.3% | 1.8%(+0.440)#79 | 2.1%(+0.104)#10,934 |
| 2. | 06451 | 2.1% | 1.8%(+0.255)#90 | 2.1%(-0.081)#12,134 |
1
Common Questions
What are the Top Zip Codes with the Highest Percentage of Population Employed in Security & Protection in Meriden, CT?
Top Zip Codes with the Highest Percentage of Population Employed in Security & Protection in Meriden, CT are:
What zip code has the Highest Percentage of Population Employed in Security & Protection in Meriden, CT?
06450 has the Highest Percentage of Population Employed in Security & Protection in Meriden, CT with 2.3%.
What is the Percentage of Population Employed in Security & Protection in Meriden, CT?
Percentage of Population Employed in Security & Protection in Meriden is 2.2%.
What is the Percentage of Population Employed in Security & Protection in Connecticut?
Percentage of Population Employed in Security & Protection in Connecticut is 1.8%.
What is the Percentage of Population Employed in Security & Protection in the United States?
Percentage of Population Employed in Security & Protection in the United States is 2.1%.