Niantic, CT Map & Demographics
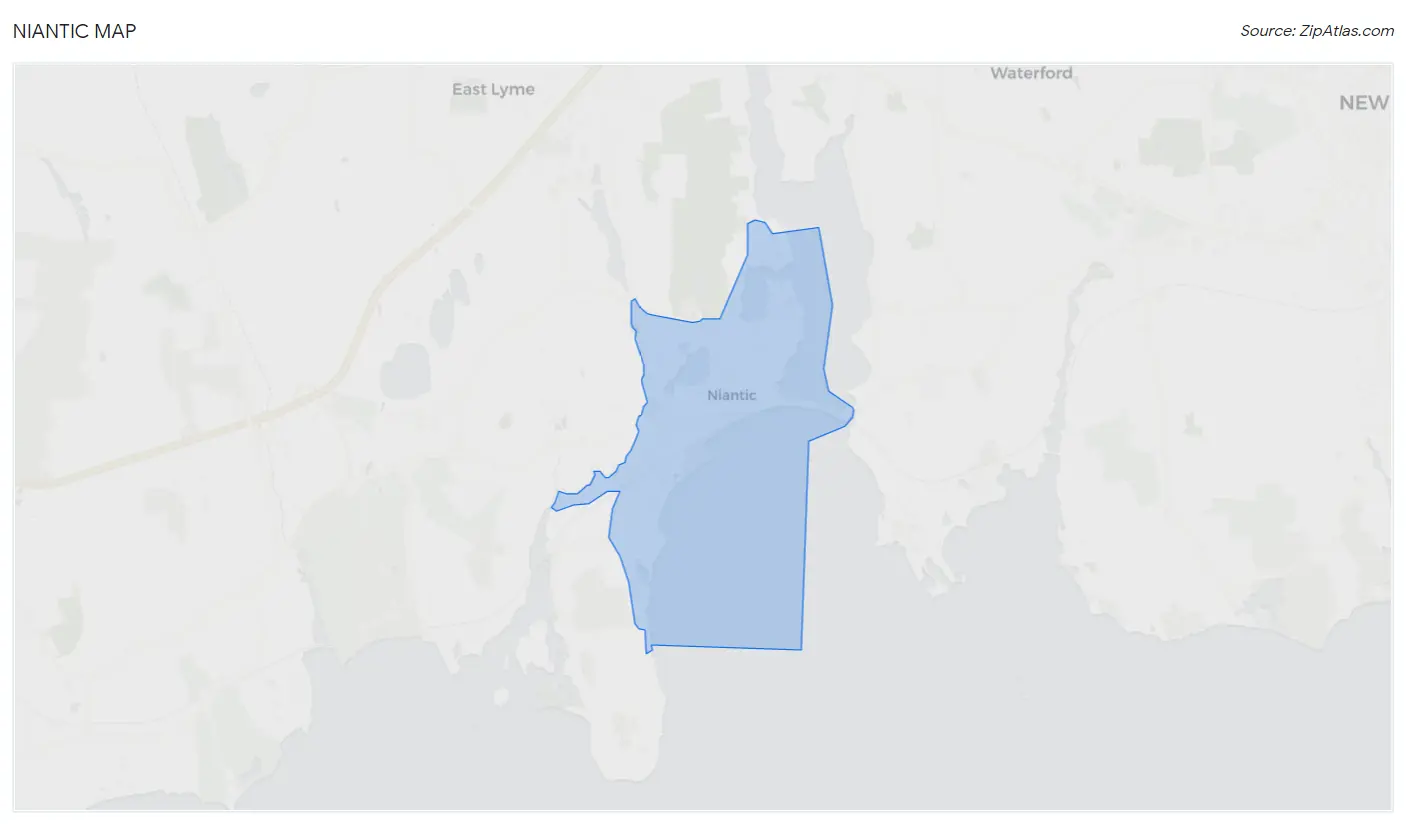
Niantic Map
Niantic Overview
$49,192
PER CAPITA INCOME
$108,836
AVG FAMILY INCOME
$82,398
AVG HOUSEHOLD INCOME
61.1%
WAGE / INCOME GAP [ % ]
38.9¢/ $1
WAGE / INCOME GAP [ $ ]
0.39
INEQUALITY / GINI INDEX
3,497
TOTAL POPULATION
1,639
MALE POPULATION
1,858
FEMALE POPULATION
88.21
MALES / 100 FEMALES
113.36
FEMALES / 100 MALES
57.2
MEDIAN AGE
2.8
AVG FAMILY SIZE
2.2
AVG HOUSEHOLD SIZE
1,699
LABOR FORCE [ PEOPLE ]
54.0%
PERCENT IN LABOR FORCE
2.7%
UNEMPLOYMENT RATE
Niantic Zip Codes
Niantic Area Codes
Income in Niantic
Income Overview in Niantic
Per Capita Income in Niantic is $49,192, while median incomes of families and households are $108,836 and $82,398 respectively.
| Characteristic | Number | Measure |
| Per Capita Income | 3,497 | $49,192 |
| Median Family Income | 915 | $108,836 |
| Mean Family Income | 915 | $131,484 |
| Median Household Income | 1,568 | $82,398 |
| Mean Household Income | 1,568 | $108,829 |
| Income Deficit | 915 | $0 |
| Wage / Income Gap (%) | 3,497 | 61.14% |
| Wage / Income Gap ($) | 3,497 | 38.86¢ per $1 |
| Gini / Inequality Index | 3,497 | 0.39 |
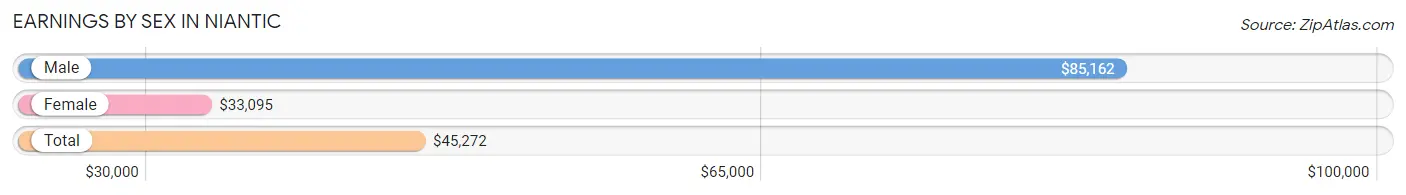
Earnings by Sex in Niantic
Average Earnings in Niantic are $45,272, $85,162 for men and $33,095 for women, a difference of 61.1%.
| Sex | Number | Average Earnings |
| Male | 876 (50.7%) | $85,162 |
| Female | 853 (49.3%) | $33,095 |
| Total | 1,729 (100.0%) | $45,272 |
Earnings by Sex by Income Bracket in Niantic
The most common earnings brackets in Niantic are $75,000 to $99,999 for men (258 | 29.4%) and $75,000 to $99,999 for women (161 | 18.9%).
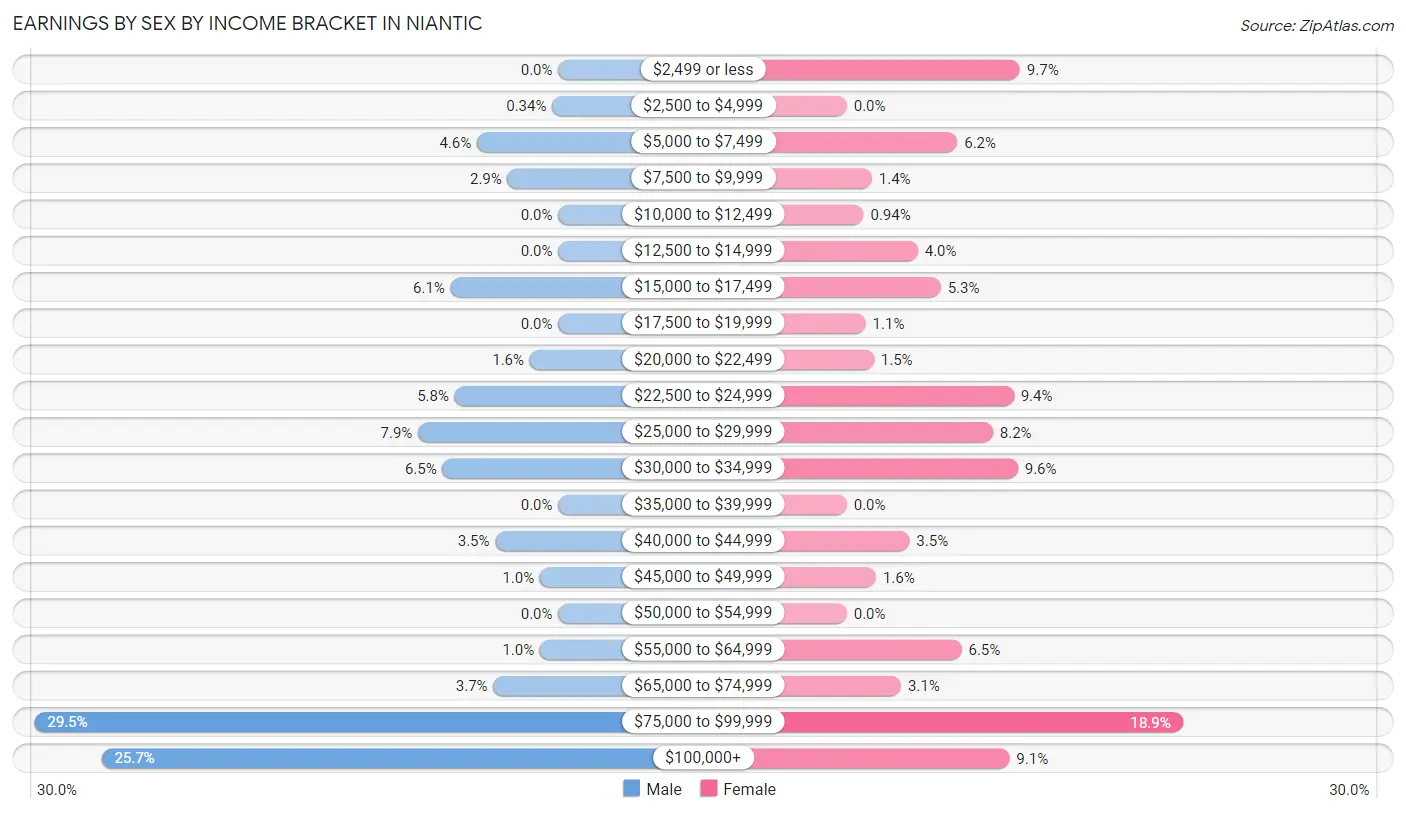
| Income | Male | Female |
| $2,499 or less | 0 (0.0%) | 83 (9.7%) |
| $2,500 to $4,999 | 3 (0.3%) | 0 (0.0%) |
| $5,000 to $7,499 | 40 (4.6%) | 53 (6.2%) |
| $7,500 to $9,999 | 25 (2.9%) | 12 (1.4%) |
| $10,000 to $12,499 | 0 (0.0%) | 8 (0.9%) |
| $12,500 to $14,999 | 0 (0.0%) | 34 (4.0%) |
| $15,000 to $17,499 | 53 (6.0%) | 45 (5.3%) |
| $17,500 to $19,999 | 0 (0.0%) | 9 (1.1%) |
| $20,000 to $22,499 | 14 (1.6%) | 13 (1.5%) |
| $22,500 to $24,999 | 51 (5.8%) | 80 (9.4%) |
| $25,000 to $29,999 | 69 (7.9%) | 70 (8.2%) |
| $30,000 to $34,999 | 57 (6.5%) | 82 (9.6%) |
| $35,000 to $39,999 | 0 (0.0%) | 0 (0.0%) |
| $40,000 to $44,999 | 31 (3.5%) | 30 (3.5%) |
| $45,000 to $49,999 | 9 (1.0%) | 14 (1.6%) |
| $50,000 to $54,999 | 0 (0.0%) | 0 (0.0%) |
| $55,000 to $64,999 | 9 (1.0%) | 55 (6.5%) |
| $65,000 to $74,999 | 32 (3.6%) | 26 (3.0%) |
| $75,000 to $99,999 | 258 (29.4%) | 161 (18.9%) |
| $100,000+ | 225 (25.7%) | 78 (9.1%) |
| Total | 876 (100.0%) | 853 (100.0%) |
Earnings by Sex by Educational Attainment in Niantic
Average earnings in Niantic are $85,666 for men and $34,192 for women, a difference of 60.1%. Men with an educational attainment of bachelor's degree enjoy the highest average annual earnings of $111,250, while those with high school diploma education earn the least with $28,661. Women with an educational attainment of college or associate's degree earn the most with the average annual earnings of $28,955, while those with high school diploma education have the smallest earnings of $17,448.
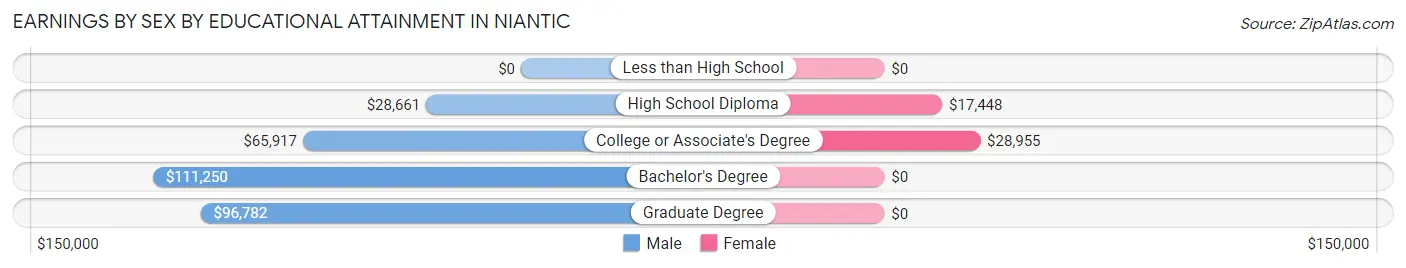
| Educational Attainment | Male Income | Female Income |
| Less than High School | - | - |
| High School Diploma | $28,661 | $17,448 |
| College or Associate's Degree | $65,917 | $28,955 |
| Bachelor's Degree | $111,250 | $0 |
| Graduate Degree | $96,782 | $0 |
| Total | $85,666 | $34,192 |
Family Income in Niantic
Family Income Brackets in Niantic
According to the Niantic family income data, there are 238 families falling into the $200,000+ income range, which is the most common income bracket and makes up 26.0% of all families.
| Income Bracket | # Families | % Families |
| Less than $10,000 | 14 | 1.5% |
| $10,000 to $14,999 | 0 | 0.0% |
| $15,000 to $24,999 | 8 | 0.9% |
| $25,000 to $34,999 | 0 | 0.0% |
| $35,000 to $49,999 | 173 | 18.9% |
| $50,000 to $74,999 | 111 | 12.1% |
| $75,000 to $99,999 | 115 | 12.6% |
| $100,000 to $149,999 | 168 | 18.4% |
| $150,000 to $199,999 | 88 | 9.6% |
| $200,000+ | 238 | 26.0% |
Family Income by Famaliy Size in Niantic
4-person families (138 | 15.1%) account for the highest median family income in Niantic with $200,278 per family, while 4-person families (138 | 15.1%) have the highest median income of $50,070 per family member.
| Income Bracket | # Families | Median Income |
| 2-Person Families | 590 (64.5%) | $80,510 |
| 3-Person Families | 123 (13.4%) | $110,250 |
| 4-Person Families | 138 (15.1%) | $200,278 |
| 5-Person Families | 2 (0.2%) | $0 |
| 6-Person Families | 62 (6.8%) | $0 |
| 7+ Person Families | 0 (0.0%) | $0 |
| Total | 915 (100.0%) | $108,836 |
Family Income by Number of Earners in Niantic
| Number of Earners | # Families | Median Income |
| No Earners | 282 (30.8%) | $76,071 |
| 1 Earner | 198 (21.6%) | $52,794 |
| 2 Earners | 387 (42.3%) | $181,042 |
| 3+ Earners | 48 (5.2%) | $0 |
| Total | 915 (100.0%) | $108,836 |
Household Income in Niantic
Household Income Brackets in Niantic
With 317 households falling in the category, the $50,000 to $74,999 income range is the most frequent in Niantic, accounting for 20.2% of all households.
| Income Bracket | # Households | % Households |
| Less than $10,000 | 64 | 4.1% |
| $10,000 to $14,999 | 0 | 0.0% |
| $15,000 to $24,999 | 44 | 2.8% |
| $25,000 to $34,999 | 41 | 2.6% |
| $35,000 to $49,999 | 249 | 15.9% |
| $50,000 to $74,999 | 317 | 20.2% |
| $75,000 to $99,999 | 215 | 13.7% |
| $100,000 to $149,999 | 256 | 16.3% |
| $150,000 to $199,999 | 125 | 8.0% |
| $200,000+ | 259 | 16.5% |
Household Income by Householder Age in Niantic
The median household income in Niantic is $82,398, with the highest median household income of $181,280 found in the 25 to 44 years age bracket for the primary householder. A total of 213 households (13.6%) fall into this category.
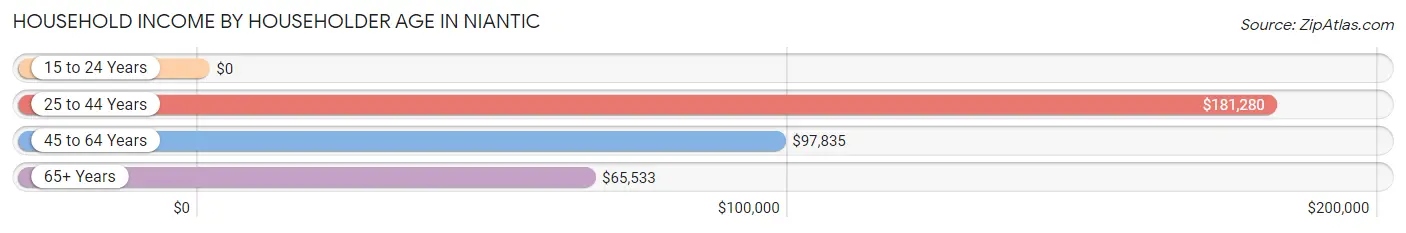
| Income Bracket | # Households | Median Income |
| 15 to 24 Years | 0 (0.0%) | $0 |
| 25 to 44 Years | 213 (13.6%) | $181,280 |
| 45 to 64 Years | 621 (39.6%) | $97,835 |
| 65+ Years | 734 (46.8%) | $65,533 |
| Total | 1,568 (100.0%) | $82,398 |
Poverty in Niantic
Income Below Poverty by Sex and Age in Niantic
With 5.7% poverty level for males and 4.8% for females among the residents of Niantic, 12 to 14 year old males and 18 to 24 year old females are the most vulnerable to poverty, with 8 males (100.0%) and 43 females (33.1%) in their respective age groups living below the poverty level.
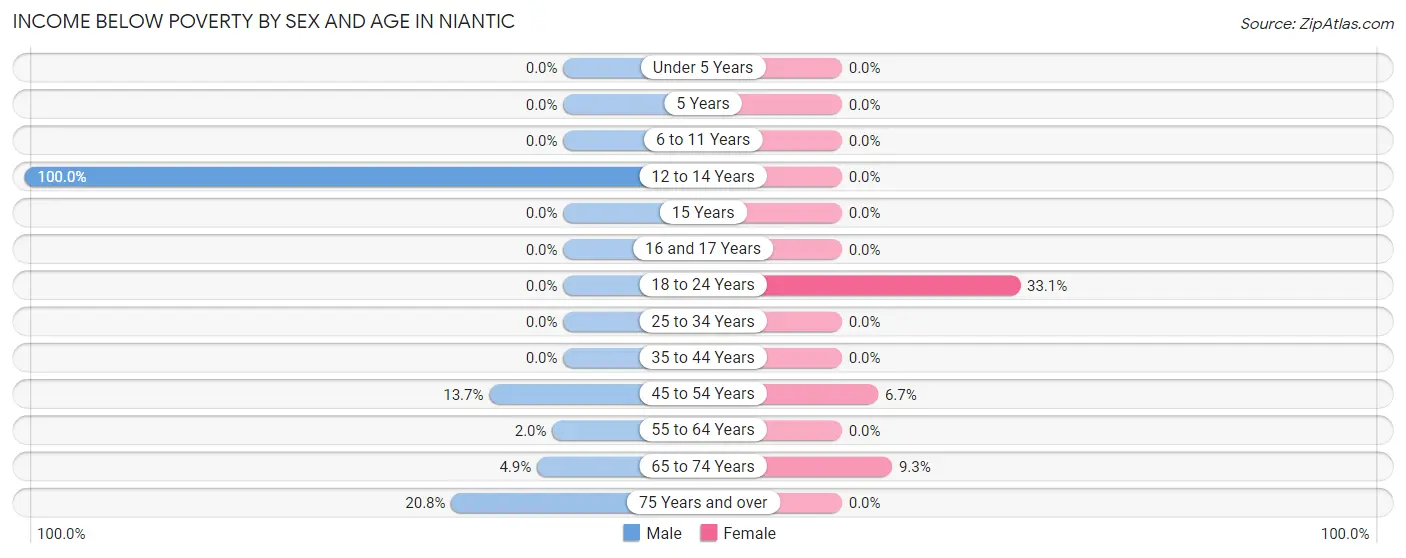
| Age Bracket | Male | Female |
| Under 5 Years | 0 (0.0%) | 0 (0.0%) |
| 5 Years | 0 (0.0%) | 0 (0.0%) |
| 6 to 11 Years | 0 (0.0%) | 0 (0.0%) |
| 12 to 14 Years | 8 (100.0%) | 0 (0.0%) |
| 15 Years | 0 (0.0%) | 0 (0.0%) |
| 16 and 17 Years | 0 (0.0%) | 0 (0.0%) |
| 18 to 24 Years | 0 (0.0%) | 43 (33.1%) |
| 25 to 34 Years | 0 (0.0%) | 0 (0.0%) |
| 35 to 44 Years | 0 (0.0%) | 0 (0.0%) |
| 45 to 54 Years | 25 (13.7%) | 8 (6.7%) |
| 55 to 64 Years | 7 (2.0%) | 0 (0.0%) |
| 65 to 74 Years | 14 (4.9%) | 38 (9.3%) |
| 75 Years and over | 37 (20.8%) | 0 (0.0%) |
| Total | 91 (5.7%) | 89 (4.8%) |
Income Above Poverty by Sex and Age in Niantic
According to the poverty statistics in Niantic, males aged under 5 years and females aged under 5 years are the age groups that are most secure financially, with 100.0% of males and 100.0% of females in these age groups living above the poverty line.
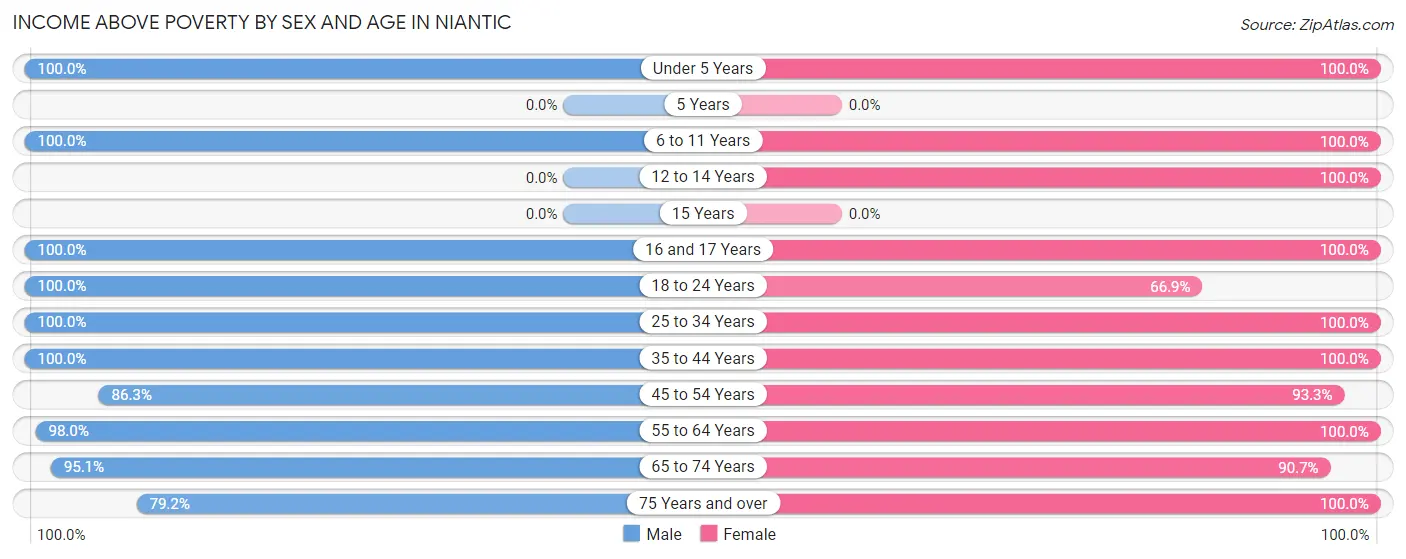
| Age Bracket | Male | Female |
| Under 5 Years | 97 (100.0%) | 107 (100.0%) |
| 5 Years | 0 (0.0%) | 0 (0.0%) |
| 6 to 11 Years | 26 (100.0%) | 104 (100.0%) |
| 12 to 14 Years | 0 (0.0%) | 9 (100.0%) |
| 15 Years | 0 (0.0%) | 0 (0.0%) |
| 16 and 17 Years | 38 (100.0%) | 23 (100.0%) |
| 18 to 24 Years | 31 (100.0%) | 87 (66.9%) |
| 25 to 34 Years | 242 (100.0%) | 165 (100.0%) |
| 35 to 44 Years | 171 (100.0%) | 172 (100.0%) |
| 45 to 54 Years | 157 (86.3%) | 111 (93.3%) |
| 55 to 64 Years | 336 (98.0%) | 338 (100.0%) |
| 65 to 74 Years | 273 (95.1%) | 370 (90.7%) |
| 75 Years and over | 141 (79.2%) | 267 (100.0%) |
| Total | 1,512 (94.3%) | 1,753 (95.2%) |
Income Below Poverty Among Married-Couple Families in Niantic
The poverty statistics for married-couple families in Niantic show that 2.7% or 22 of the total 802 families live below the poverty line. Families with 1 or 2 children have the highest poverty rate of 3.4%, comprising of 8 families. On the other hand, families with 3 or 4 children have the lowest poverty rate of 0.0%, which includes 0 families.
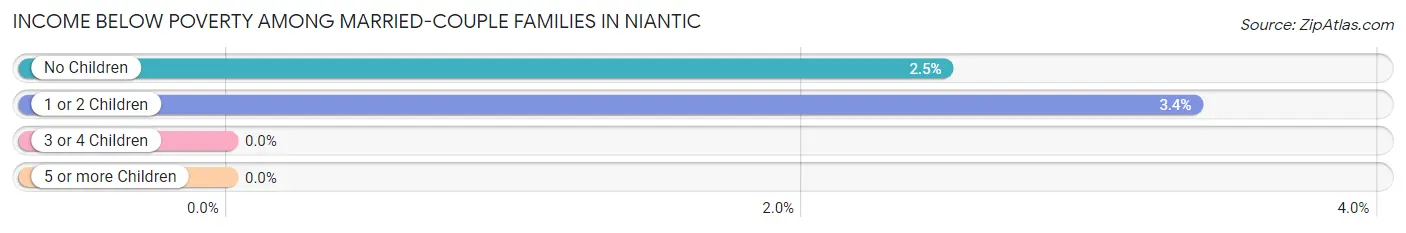
| Children | Above Poverty | Below Poverty |
| No Children | 548 (97.5%) | 14 (2.5%) |
| 1 or 2 Children | 230 (96.6%) | 8 (3.4%) |
| 3 or 4 Children | 2 (100.0%) | 0 (0.0%) |
| 5 or more Children | 0 (0.0%) | 0 (0.0%) |
| Total | 780 (97.3%) | 22 (2.7%) |
Income Below Poverty Among Single-Parent Households in Niantic
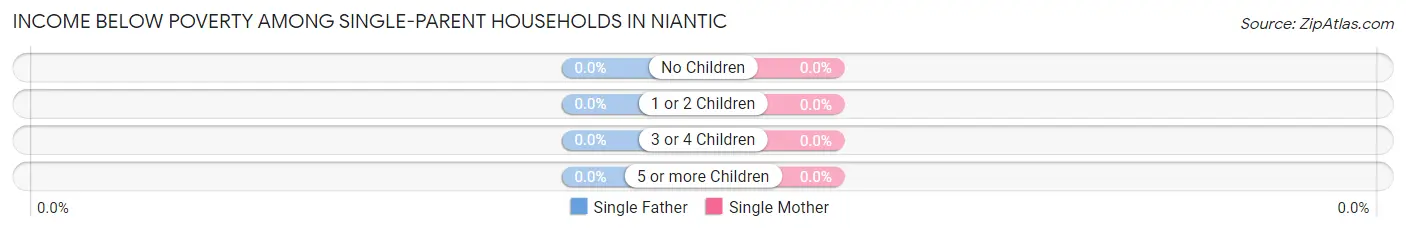
| Children | Single Father | Single Mother |
| No Children | 0 (0.0%) | 0 (0.0%) |
| 1 or 2 Children | 0 (0.0%) | 0 (0.0%) |
| 3 or 4 Children | 0 (0.0%) | 0 (0.0%) |
| 5 or more Children | 0 (0.0%) | 0 (0.0%) |
| Total | 0 (0.0%) | 0 (0.0%) |
Income Below Poverty Among Married-Couple vs Single-Parent Households in Niantic
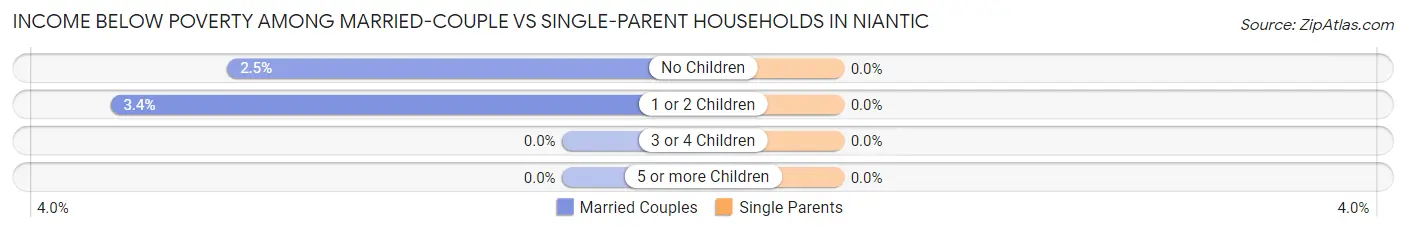
| Children | Married-Couple Families | Single-Parent Households |
| No Children | 14 (2.5%) | 0 (0.0%) |
| 1 or 2 Children | 8 (3.4%) | 0 (0.0%) |
| 3 or 4 Children | 0 (0.0%) | 0 (0.0%) |
| 5 or more Children | 0 (0.0%) | 0 (0.0%) |
| Total | 22 (2.7%) | 0 (0.0%) |
Race in Niantic
The most populous races in Niantic are White / Caucasian (3,268 | 93.4%), Two or more Races (176 | 5.0%), and Asian (40 | 1.1%).
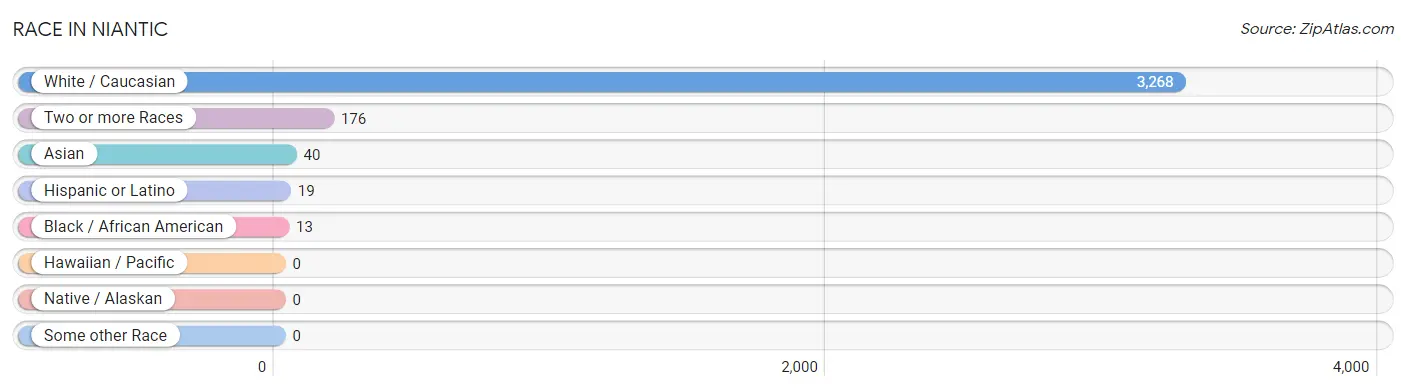
| Race | # Population | % Population |
| Asian | 40 | 1.1% |
| Black / African American | 13 | 0.4% |
| Hawaiian / Pacific | 0 | 0.0% |
| Hispanic or Latino | 19 | 0.5% |
| Native / Alaskan | 0 | 0.0% |
| White / Caucasian | 3,268 | 93.4% |
| Two or more Races | 176 | 5.0% |
| Some other Race | 0 | 0.0% |
| Total | 3,497 | 100.0% |
Ancestry in Niantic
The most populous ancestries reported in Niantic are Irish (1,006 | 28.8%), German (623 | 17.8%), English (419 | 12.0%), Italian (394 | 11.3%), and French (316 | 9.0%), together accounting for 78.9% of all Niantic residents.
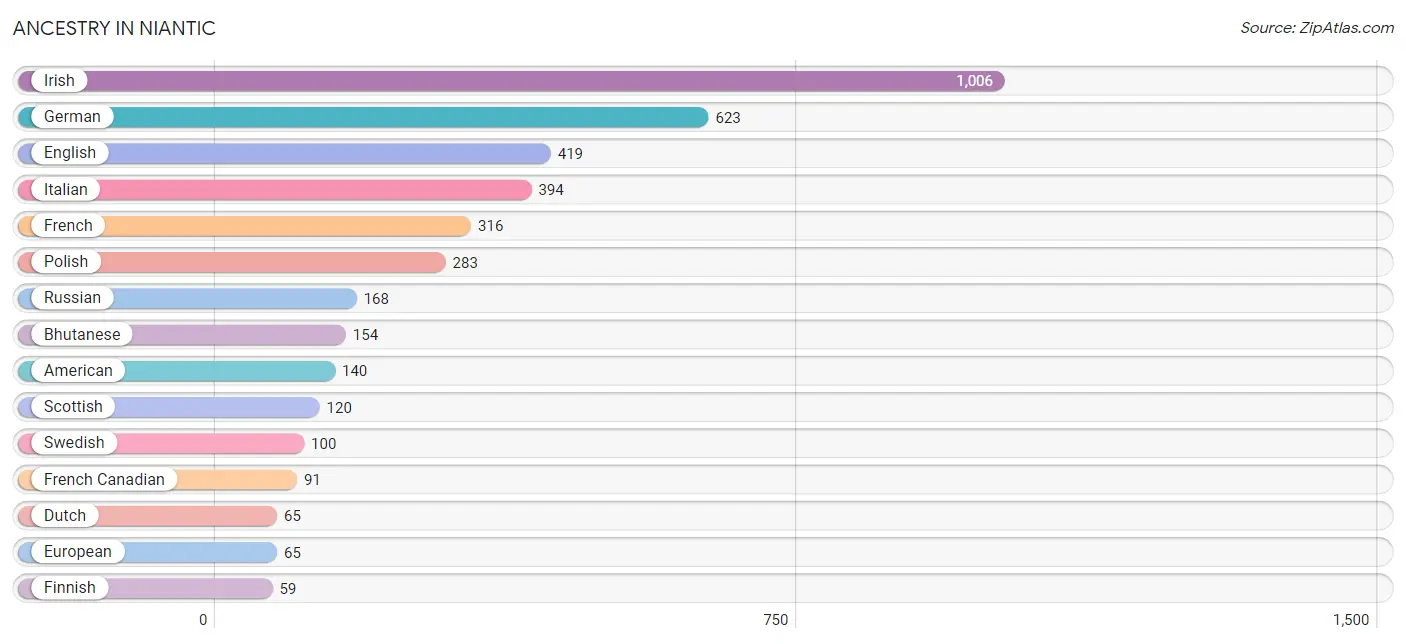
| Ancestry | # Population | % Population |
| American | 140 | 4.0% |
| Arab | 32 | 0.9% |
| Austrian | 13 | 0.4% |
| Bhutanese | 154 | 4.4% |
| Brazilian | 28 | 0.8% |
| British | 11 | 0.3% |
| Canadian | 25 | 0.7% |
| Dutch | 65 | 1.9% |
| English | 419 | 12.0% |
| European | 65 | 1.9% |
| Finnish | 59 | 1.7% |
| French | 316 | 9.0% |
| French Canadian | 91 | 2.6% |
| German | 623 | 17.8% |
| Irish | 1,006 | 28.8% |
| Italian | 394 | 11.3% |
| Lebanese | 32 | 0.9% |
| Lithuanian | 7 | 0.2% |
| Mexican | 6 | 0.2% |
| Norwegian | 49 | 1.4% |
| Polish | 283 | 8.1% |
| Portuguese | 49 | 1.4% |
| Puerto Rican | 13 | 0.4% |
| Russian | 168 | 4.8% |
| Scotch-Irish | 13 | 0.4% |
| Scottish | 120 | 3.4% |
| Subsaharan African | 13 | 0.4% |
| Swedish | 100 | 2.9% |
| Ukrainian | 13 | 0.4% |
| Welsh | 21 | 0.6% | View All 30 Rows |
Immigrants in Niantic
The most numerous immigrant groups reported in Niantic came from Asia (40 | 1.1%), Eastern Asia (40 | 1.1%), Japan (40 | 1.1%), Europe (38 | 1.1%), and Northern Europe (38 | 1.1%), together accounting for 5.6% of all Niantic residents.
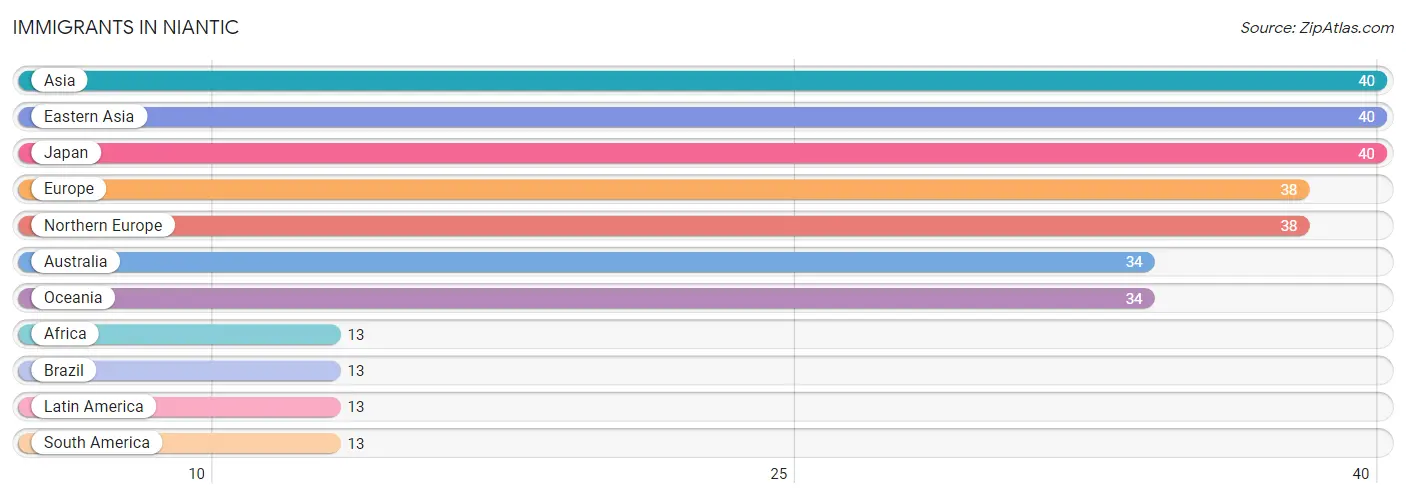
| Immigration Origin | # Population | % Population |
| Africa | 13 | 0.4% |
| Asia | 40 | 1.1% |
| Australia | 34 | 1.0% |
| Brazil | 13 | 0.4% |
| Eastern Asia | 40 | 1.1% |
| Europe | 38 | 1.1% |
| Japan | 40 | 1.1% |
| Latin America | 13 | 0.4% |
| Northern Europe | 38 | 1.1% |
| Oceania | 34 | 1.0% |
| South America | 13 | 0.4% | View All 11 Rows |
Sex and Age in Niantic
Sex and Age in Niantic
The most populous age groups in Niantic are 50 to 54 Years (182 | 11.1%) for men and 70 to 74 Years (241 | 13.0%) for women.
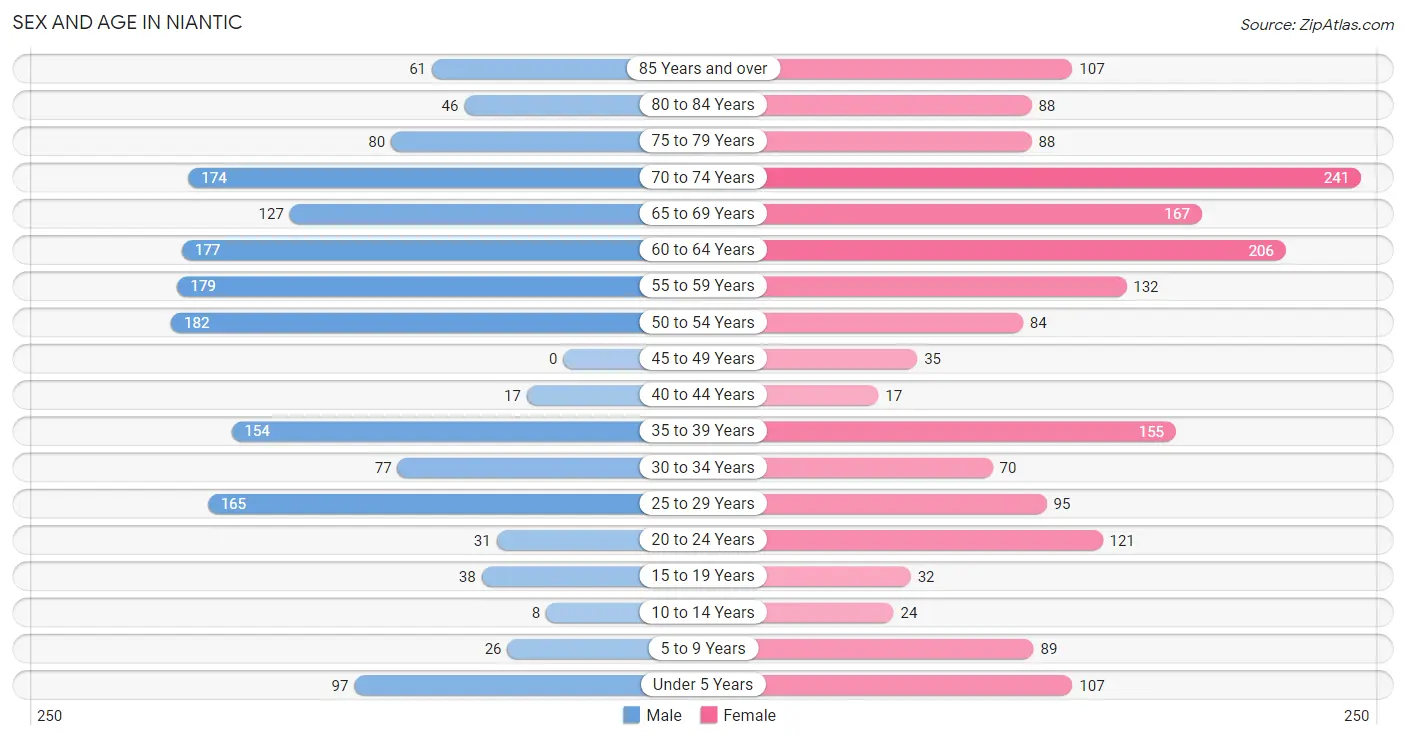
| Age Bracket | Male | Female |
| Under 5 Years | 97 (5.9%) | 107 (5.8%) |
| 5 to 9 Years | 26 (1.6%) | 89 (4.8%) |
| 10 to 14 Years | 8 (0.5%) | 24 (1.3%) |
| 15 to 19 Years | 38 (2.3%) | 32 (1.7%) |
| 20 to 24 Years | 31 (1.9%) | 121 (6.5%) |
| 25 to 29 Years | 165 (10.1%) | 95 (5.1%) |
| 30 to 34 Years | 77 (4.7%) | 70 (3.8%) |
| 35 to 39 Years | 154 (9.4%) | 155 (8.3%) |
| 40 to 44 Years | 17 (1.0%) | 17 (0.9%) |
| 45 to 49 Years | 0 (0.0%) | 35 (1.9%) |
| 50 to 54 Years | 182 (11.1%) | 84 (4.5%) |
| 55 to 59 Years | 179 (10.9%) | 132 (7.1%) |
| 60 to 64 Years | 177 (10.8%) | 206 (11.1%) |
| 65 to 69 Years | 127 (7.7%) | 167 (9.0%) |
| 70 to 74 Years | 174 (10.6%) | 241 (13.0%) |
| 75 to 79 Years | 80 (4.9%) | 88 (4.7%) |
| 80 to 84 Years | 46 (2.8%) | 88 (4.7%) |
| 85 Years and over | 61 (3.7%) | 107 (5.8%) |
| Total | 1,639 (100.0%) | 1,858 (100.0%) |
Families and Households in Niantic
Median Family Size in Niantic
The median family size in Niantic is 2.78 persons per family, with married-couple families (802 | 87.6%) accounting for the largest median family size of 2.83 persons per family. On the other hand, single male/father families (17 | 1.9%) represent the smallest median family size with 2.06 persons per family.
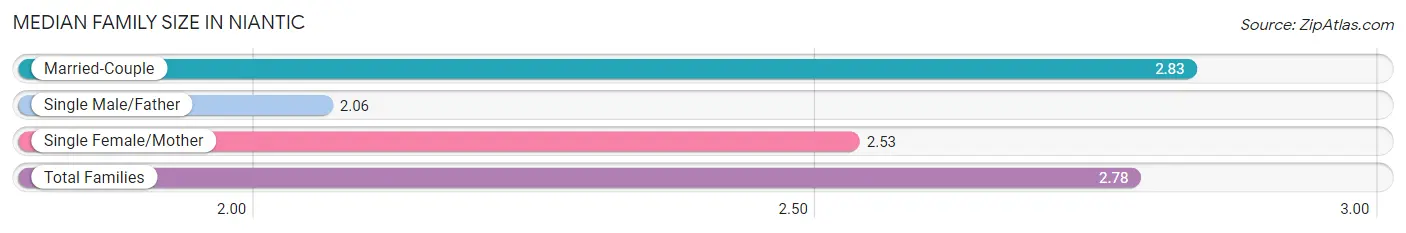
| Family Type | # Families | Family Size |
| Married-Couple | 802 (87.6%) | 2.83 |
| Single Male/Father | 17 (1.9%) | 2.06 |
| Single Female/Mother | 96 (10.5%) | 2.53 |
| Total Families | 915 (100.0%) | 2.78 |
Median Household Size in Niantic
The median household size in Niantic is 2.19 persons per household, with single female/mother households (96 | 6.1%) accounting for the largest median household size of 3.16 persons per household. non-family households (653 | 41.6%) represent the smallest median household size with 1.22 persons per household.
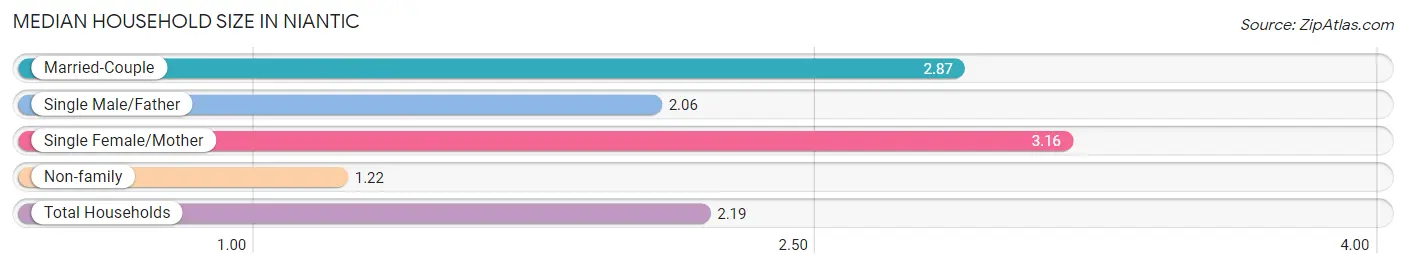
| Household Type | # Households | Household Size |
| Married-Couple | 802 (51.1%) | 2.87 |
| Single Male/Father | 17 (1.1%) | 2.06 |
| Single Female/Mother | 96 (6.1%) | 3.16 |
| Non-family | 653 (41.6%) | 1.22 |
| Total Households | 1,568 (100.0%) | 2.19 |
Household Size by Marriage Status in Niantic
Out of a total of 1,568 households in Niantic, 915 (58.4%) are family households, while 653 (41.6%) are nonfamily households. The most numerous type of family households are 2-person households, comprising 552, and the most common type of nonfamily households are 1-person households, comprising 515.
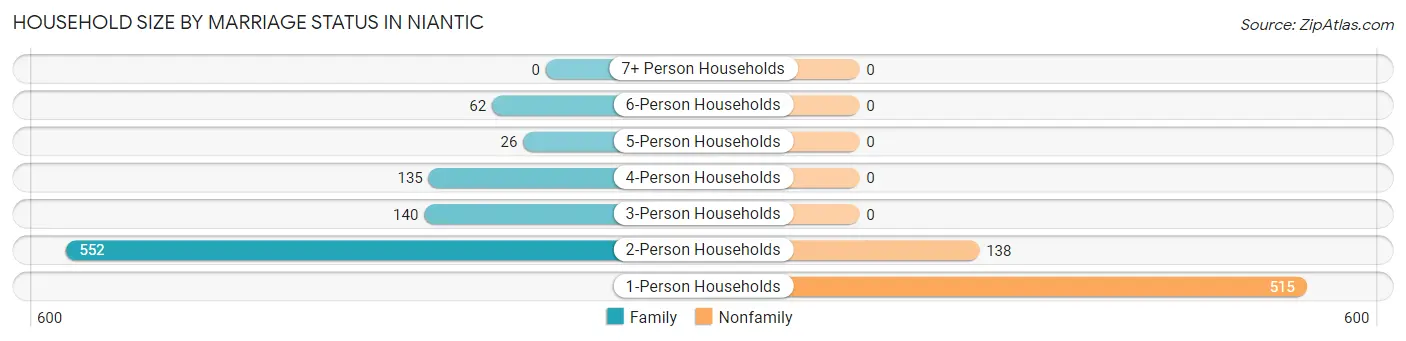
| Household Size | Family Households | Nonfamily Households |
| 1-Person Households | - | 515 (32.8%) |
| 2-Person Households | 552 (35.2%) | 138 (8.8%) |
| 3-Person Households | 140 (8.9%) | 0 (0.0%) |
| 4-Person Households | 135 (8.6%) | 0 (0.0%) |
| 5-Person Households | 26 (1.7%) | 0 (0.0%) |
| 6-Person Households | 62 (4.0%) | 0 (0.0%) |
| 7+ Person Households | 0 (0.0%) | 0 (0.0%) |
| Total | 915 (58.4%) | 653 (41.6%) |
Female Fertility in Niantic
Fertility by Age in Niantic
Average fertility rate in Niantic is 50.0 births per 1,000 women. Women in the age bracket of 20 to 34 years have the highest fertility rate with 91.0 births per 1,000 women. Women in the age bracket of 20 to 34 years acount for 100.0% of all women with births.
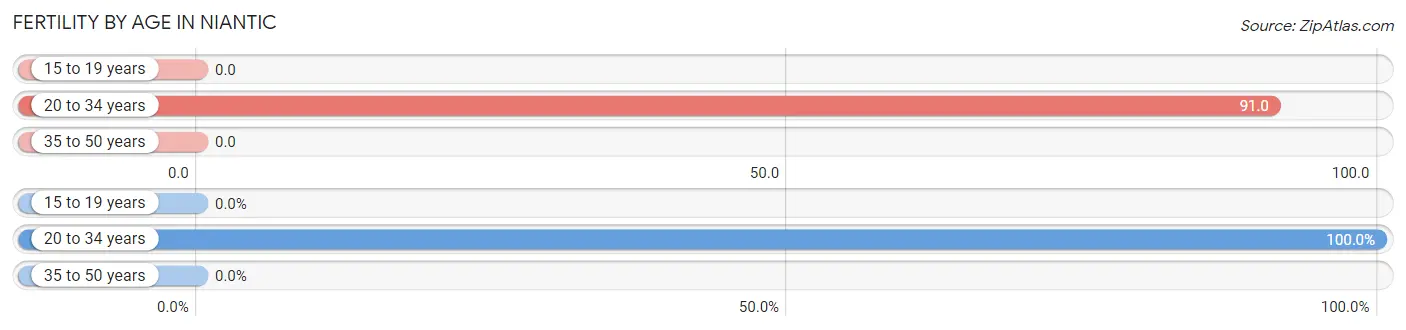
| Age Bracket | Women with Births | Births / 1,000 Women |
| 15 to 19 years | 0 (0.0%) | 0.0 |
| 20 to 34 years | 26 (100.0%) | 91.0 |
| 35 to 50 years | 0 (0.0%) | 0.0 |
| Total | 26 (100.0%) | 50.0 |
Fertility by Age by Marriage Status in Niantic
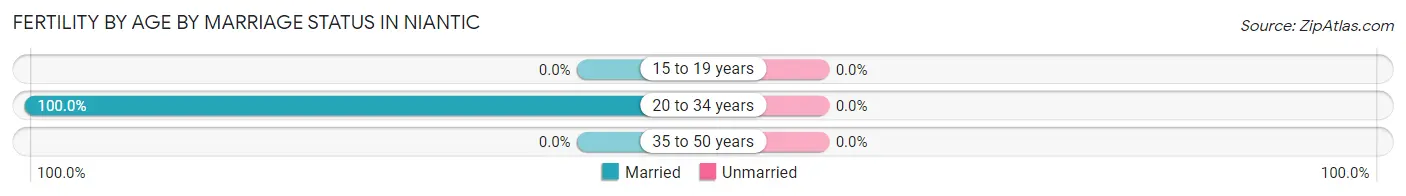
| Age Bracket | Married | Unmarried |
| 15 to 19 years | 0 (0.0%) | 0 (0.0%) |
| 20 to 34 years | 26 (100.0%) | 0 (0.0%) |
| 35 to 50 years | 0 (0.0%) | 0 (0.0%) |
| Total | 26 (100.0%) | 0 (0.0%) |
Fertility by Education in Niantic
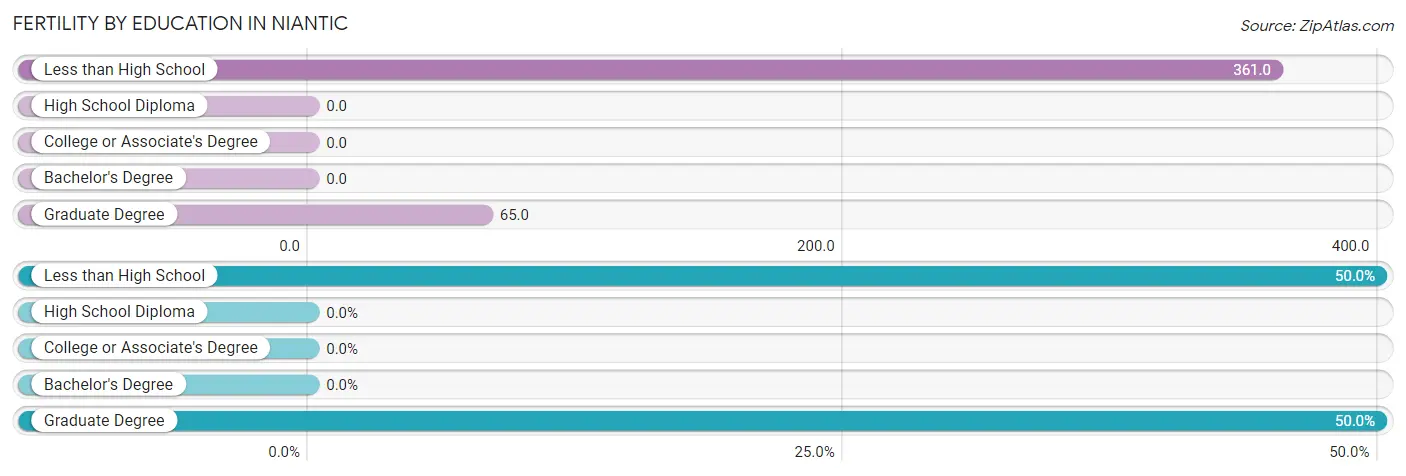
| Educational Attainment | Women with Births | Births / 1,000 Women |
| Less than High School | 13 (50.0%) | 361.0 |
| High School Diploma | 0 (0.0%) | 0.0 |
| College or Associate's Degree | 0 (0.0%) | 0.0 |
| Bachelor's Degree | 0 (0.0%) | 0.0 |
| Graduate Degree | 13 (50.0%) | 65.0 |
| Total | 26 (100.0%) | 50.0 |
Fertility by Education by Marriage Status in Niantic
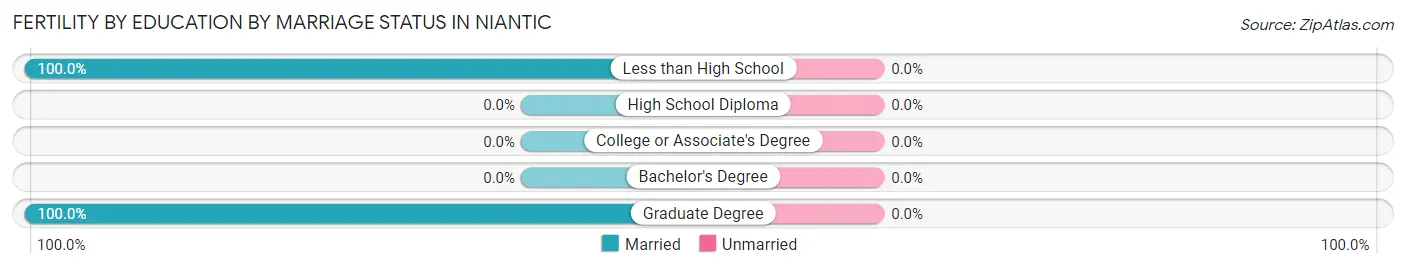
| Educational Attainment | Married | Unmarried |
| Less than High School | 13 (100.0%) | 0 (0.0%) |
| High School Diploma | 0 (0.0%) | 0 (0.0%) |
| College or Associate's Degree | 0 (0.0%) | 0 (0.0%) |
| Bachelor's Degree | 0 (0.0%) | 0 (0.0%) |
| Graduate Degree | 13 (100.0%) | 0 (0.0%) |
| Total | 26 (100.0%) | 0 (0.0%) |
Employment Characteristics in Niantic
Employment by Class of Employer in Niantic
Among the 1,642 employed individuals in Niantic, private company employees (884 | 53.8%), not-for-profit organizations (293 | 17.8%), and local government employees (175 | 10.7%) make up the most common classes of employment.
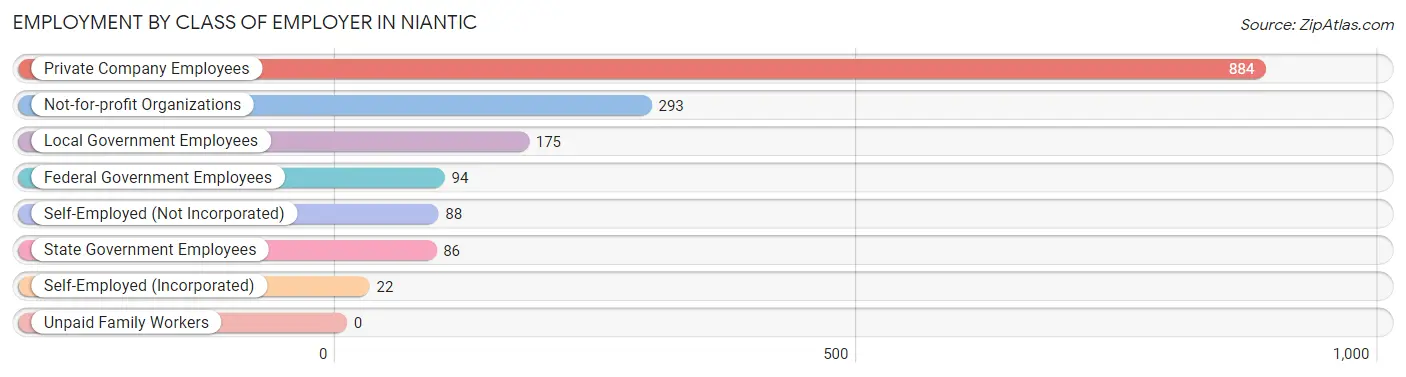
| Employer Class | # Employees | % Employees |
| Private Company Employees | 884 | 53.8% |
| Self-Employed (Incorporated) | 22 | 1.3% |
| Self-Employed (Not Incorporated) | 88 | 5.4% |
| Not-for-profit Organizations | 293 | 17.8% |
| Local Government Employees | 175 | 10.7% |
| State Government Employees | 86 | 5.2% |
| Federal Government Employees | 94 | 5.7% |
| Unpaid Family Workers | 0 | 0.0% |
| Total | 1,642 | 100.0% |
Employment Status by Age in Niantic
According to the labor force statistics for Niantic, out of the total population over 16 years of age (3,146), 54.0% or 1,699 individuals are in the labor force, with 2.7% or 46 of them unemployed. The age group with the highest labor force participation rate is 20 to 24 years, with 100.0% or 152 individuals in the labor force. Within the labor force, the 16 to 19 years age range has the highest percentage of unemployed individuals, with 76.9% or 30 of them being unemployed.
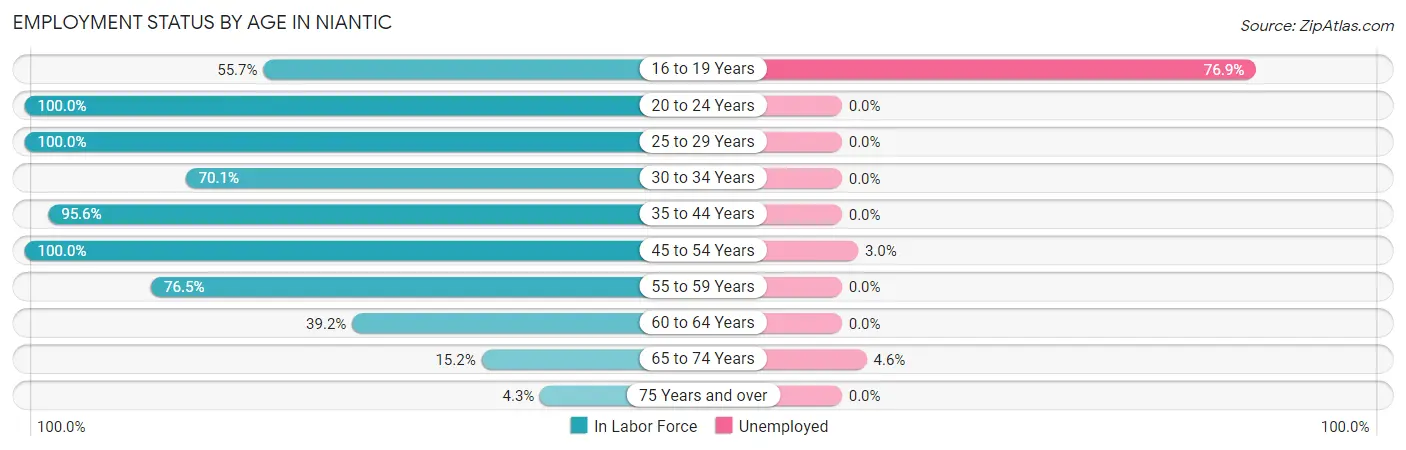
| Age Bracket | In Labor Force | Unemployed |
| 16 to 19 Years | 39 (55.7%) | 30 (76.9%) |
| 20 to 24 Years | 152 (100.0%) | 0 (0.0%) |
| 25 to 29 Years | 260 (100.0%) | 0 (0.0%) |
| 30 to 34 Years | 103 (70.1%) | 0 (0.0%) |
| 35 to 44 Years | 328 (95.6%) | 0 (0.0%) |
| 45 to 54 Years | 301 (100.0%) | 9 (3.0%) |
| 55 to 59 Years | 238 (76.5%) | 0 (0.0%) |
| 60 to 64 Years | 150 (39.2%) | 0 (0.0%) |
| 65 to 74 Years | 108 (15.2%) | 5 (4.6%) |
| 75 Years and over | 20 (4.3%) | 0 (0.0%) |
| Total | 1,699 (54.0%) | 46 (2.7%) |
Employment Status by Educational Attainment in Niantic
According to labor force statistics for Niantic, 79.1% of individuals (1,380) out of the total population between 25 and 64 years of age (1,745) are in the labor force, with 0.7% or 10 of them being unemployed. The group with the highest labor force participation rate are those with the educational attainment of college / associate degree, with 89.1% or 408 individuals in the labor force. Within the labor force, individuals with high school diploma education have the highest percentage of unemployment, with 3.6% or 9 of them being unemployed.
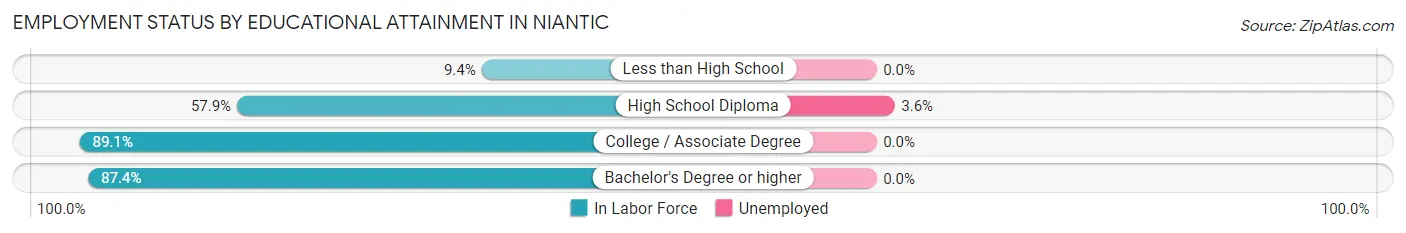
| Educational Attainment | In Labor Force | Unemployed |
| Less than High School | 3 (9.4%) | 0 (0.0%) |
| High School Diploma | 252 (57.9%) | 16 (3.6%) |
| College / Associate Degree | 408 (89.1%) | 0 (0.0%) |
| Bachelor's Degree or higher | 717 (87.4%) | 0 (0.0%) |
| Total | 1,380 (79.1%) | 12 (0.7%) |
Employment Occupations by Sex in Niantic
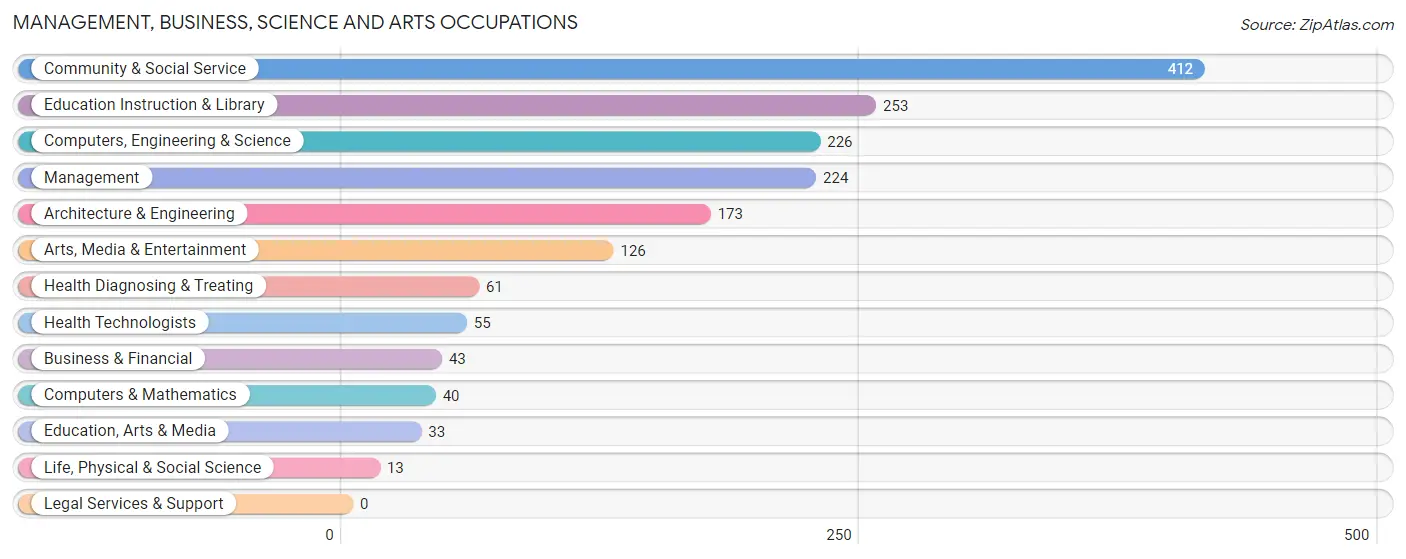
Management, Business, Science and Arts Occupations
The most common Management, Business, Science and Arts occupations in Niantic are Community & Social Service (412 | 25.5%), Education Instruction & Library (253 | 15.7%), Computers, Engineering & Science (226 | 14.0%), Management (224 | 13.9%), and Architecture & Engineering (173 | 10.7%).
Management, Business, Science and Arts Occupations by Sex
Within the Management, Business, Science and Arts occupations in Niantic, the most male-oriented occupations are Computers & Mathematics (100.0%), Computers, Engineering & Science (72.1%), and Architecture & Engineering (71.1%), while the most female-oriented occupations are Life, Physical & Social Science (100.0%), Education, Arts & Media (100.0%), and Health Diagnosing & Treating (72.1%).
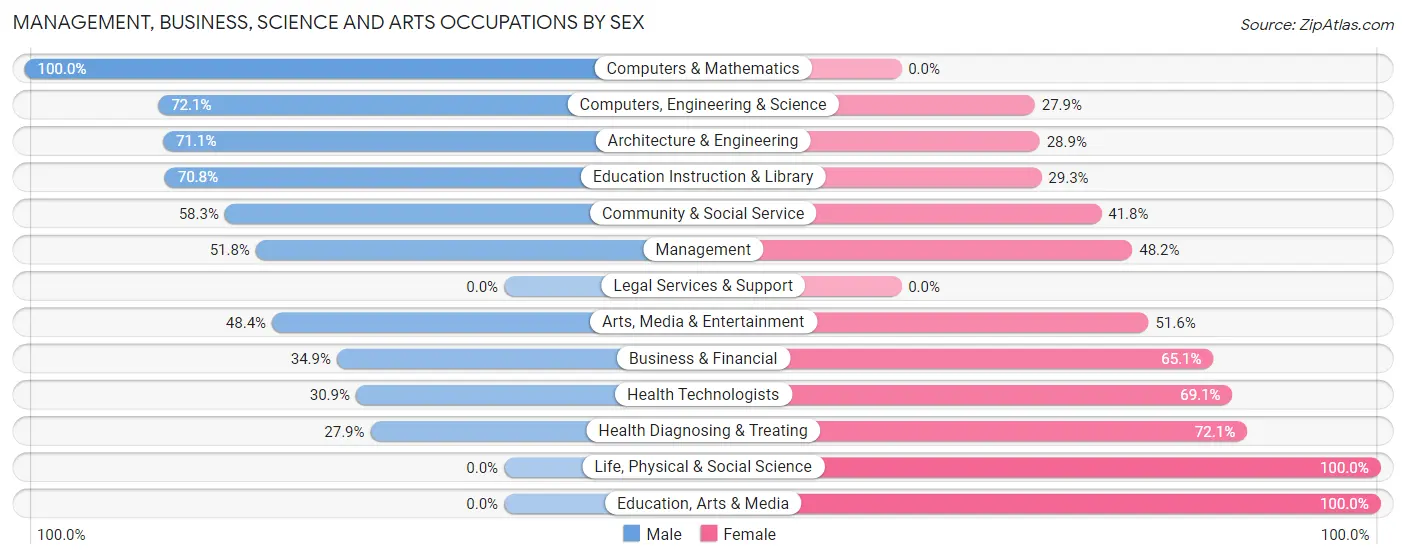
| Occupation | Male | Female |
| Management | 116 (51.8%) | 108 (48.2%) |
| Business & Financial | 15 (34.9%) | 28 (65.1%) |
| Computers, Engineering & Science | 163 (72.1%) | 63 (27.9%) |
| Computers & Mathematics | 40 (100.0%) | 0 (0.0%) |
| Architecture & Engineering | 123 (71.1%) | 50 (28.9%) |
| Life, Physical & Social Science | 0 (0.0%) | 13 (100.0%) |
| Community & Social Service | 240 (58.3%) | 172 (41.7%) |
| Education, Arts & Media | 0 (0.0%) | 33 (100.0%) |
| Legal Services & Support | 0 (0.0%) | 0 (0.0%) |
| Education Instruction & Library | 179 (70.8%) | 74 (29.2%) |
| Arts, Media & Entertainment | 61 (48.4%) | 65 (51.6%) |
| Health Diagnosing & Treating | 17 (27.9%) | 44 (72.1%) |
| Health Technologists | 17 (30.9%) | 38 (69.1%) |
| Total (Category) | 551 (57.0%) | 415 (43.0%) |
| Total (Overall) | 823 (51.0%) | 792 (49.0%) |
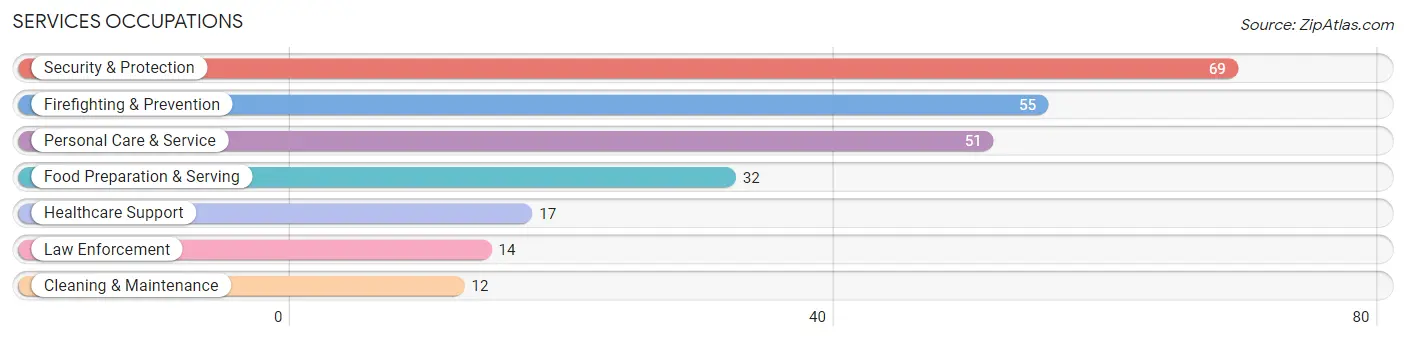
Services Occupations
The most common Services occupations in Niantic are Security & Protection (69 | 4.3%), Firefighting & Prevention (55 | 3.4%), Personal Care & Service (51 | 3.2%), Food Preparation & Serving (32 | 2.0%), and Healthcare Support (17 | 1.1%).
Services Occupations by Sex
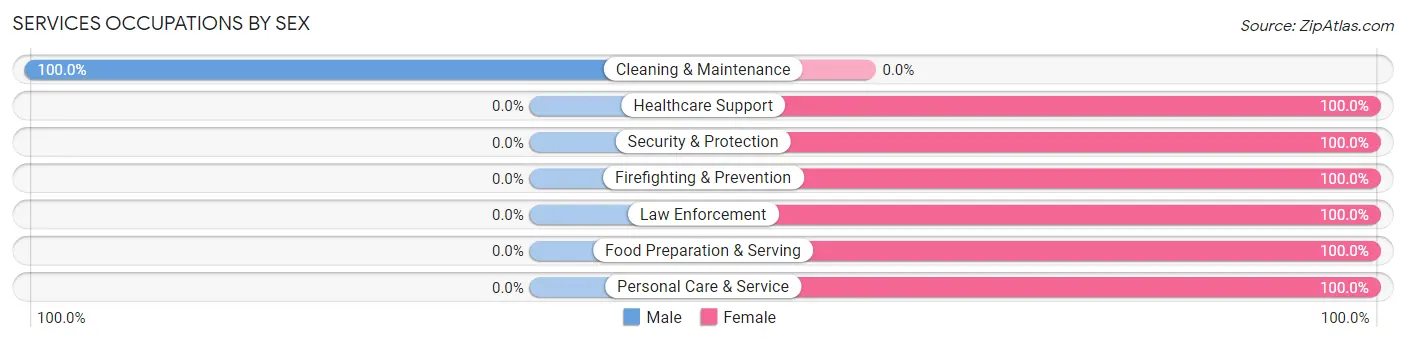
| Occupation | Male | Female |
| Healthcare Support | 0 (0.0%) | 17 (100.0%) |
| Security & Protection | 0 (0.0%) | 69 (100.0%) |
| Firefighting & Prevention | 0 (0.0%) | 55 (100.0%) |
| Law Enforcement | 0 (0.0%) | 14 (100.0%) |
| Food Preparation & Serving | 0 (0.0%) | 32 (100.0%) |
| Cleaning & Maintenance | 12 (100.0%) | 0 (0.0%) |
| Personal Care & Service | 0 (0.0%) | 51 (100.0%) |
| Total (Category) | 12 (6.6%) | 169 (93.4%) |
| Total (Overall) | 823 (51.0%) | 792 (49.0%) |
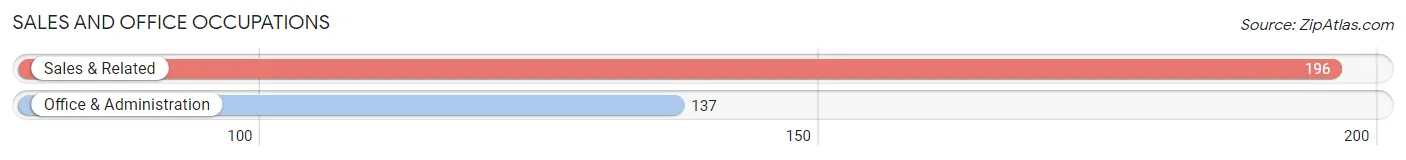
Sales and Office Occupations
The most common Sales and Office occupations in Niantic are Sales & Related (196 | 12.1%), and Office & Administration (137 | 8.5%).
Sales and Office Occupations by Sex
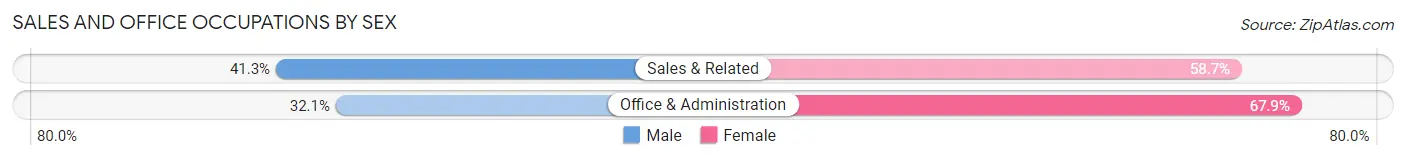
| Occupation | Male | Female |
| Sales & Related | 81 (41.3%) | 115 (58.7%) |
| Office & Administration | 44 (32.1%) | 93 (67.9%) |
| Total (Category) | 125 (37.5%) | 208 (62.5%) |
| Total (Overall) | 823 (51.0%) | 792 (49.0%) |
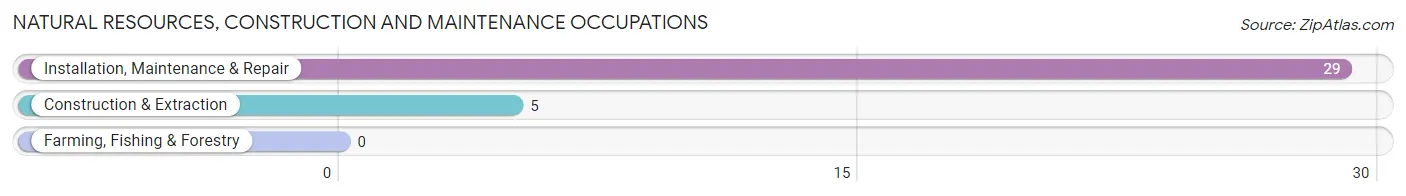
Natural Resources, Construction and Maintenance Occupations
The most common Natural Resources, Construction and Maintenance occupations in Niantic are Installation, Maintenance & Repair (29 | 1.8%), and Construction & Extraction (5 | 0.3%).
Natural Resources, Construction and Maintenance Occupations by Sex
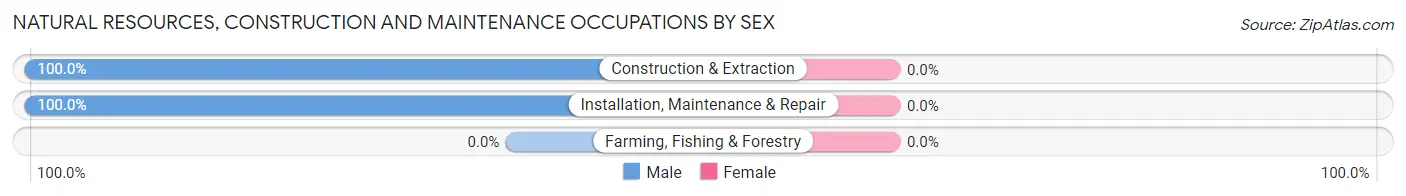
| Occupation | Male | Female |
| Farming, Fishing & Forestry | 0 (0.0%) | 0 (0.0%) |
| Construction & Extraction | 5 (100.0%) | 0 (0.0%) |
| Installation, Maintenance & Repair | 29 (100.0%) | 0 (0.0%) |
| Total (Category) | 34 (100.0%) | 0 (0.0%) |
| Total (Overall) | 823 (51.0%) | 792 (49.0%) |
Production, Transportation and Moving Occupations
The most common Production, Transportation and Moving occupations in Niantic are Material Moving (51 | 3.2%), Production (35 | 2.2%), and Transportation (15 | 0.9%).
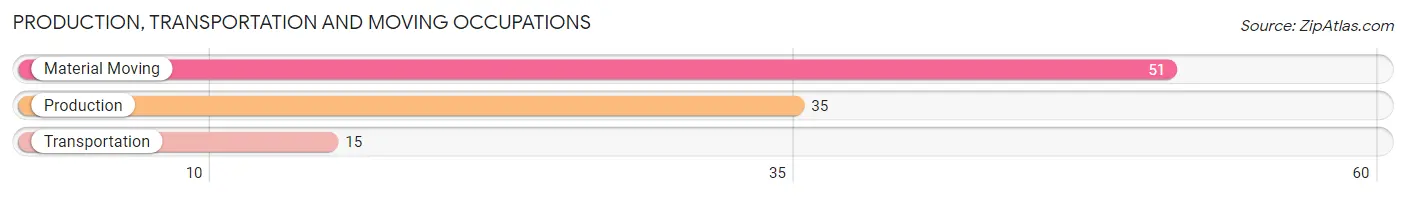
Production, Transportation and Moving Occupations by Sex
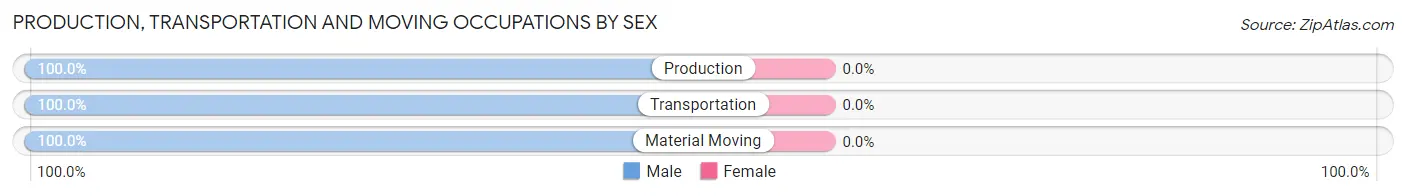
| Occupation | Male | Female |
| Production | 35 (100.0%) | 0 (0.0%) |
| Transportation | 15 (100.0%) | 0 (0.0%) |
| Material Moving | 51 (100.0%) | 0 (0.0%) |
| Total (Category) | 101 (100.0%) | 0 (0.0%) |
| Total (Overall) | 823 (51.0%) | 792 (49.0%) |
Employment Industries by Sex in Niantic
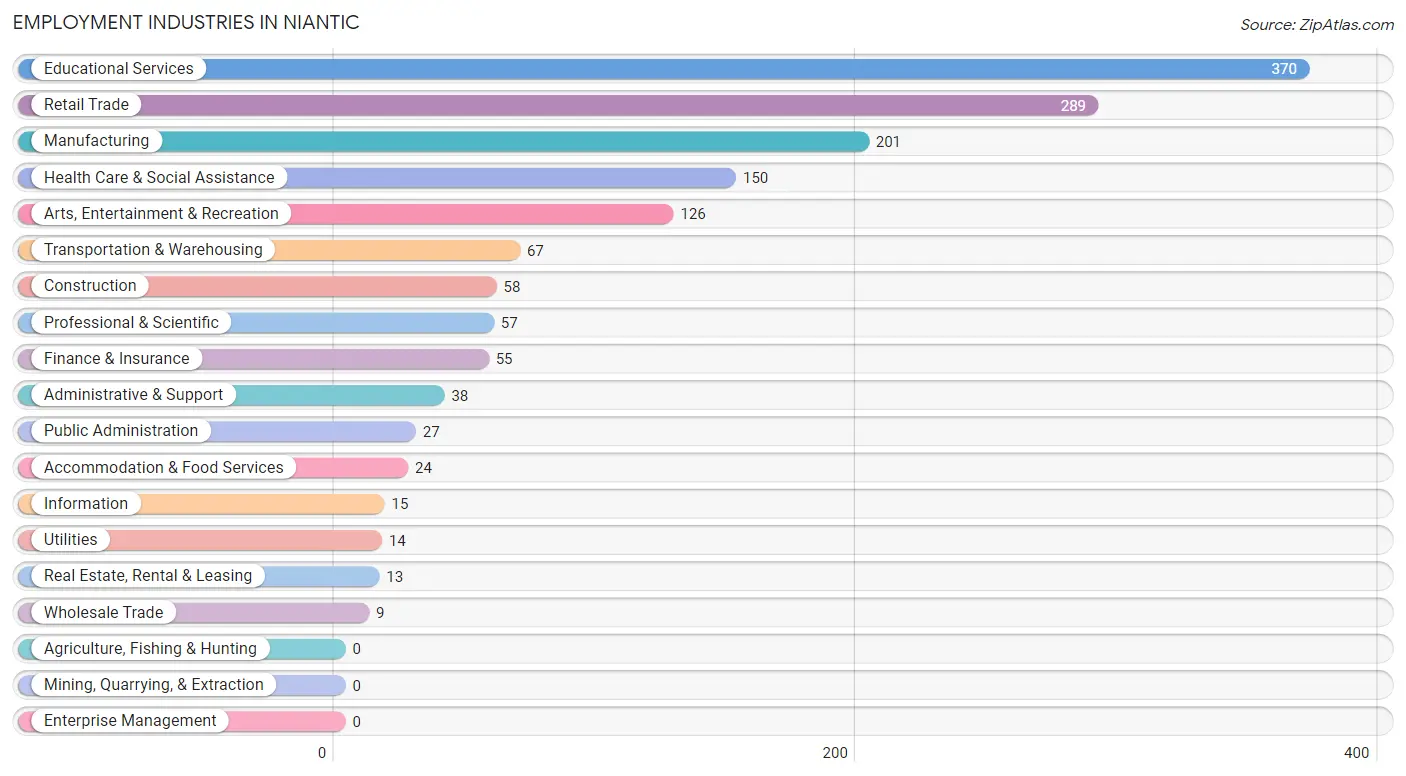
Employment Industries in Niantic
The major employment industries in Niantic include Educational Services (370 | 22.9%), Retail Trade (289 | 17.9%), Manufacturing (201 | 12.4%), Health Care & Social Assistance (150 | 9.3%), and Arts, Entertainment & Recreation (126 | 7.8%).
Employment Industries by Sex in Niantic
The Niantic industries that see more men than women are Construction (100.0%), Wholesale Trade (100.0%), and Transportation & Warehousing (100.0%), whereas the industries that tend to have a higher number of women are Accommodation & Food Services (100.0%), Public Administration (100.0%), and Health Care & Social Assistance (92.0%).
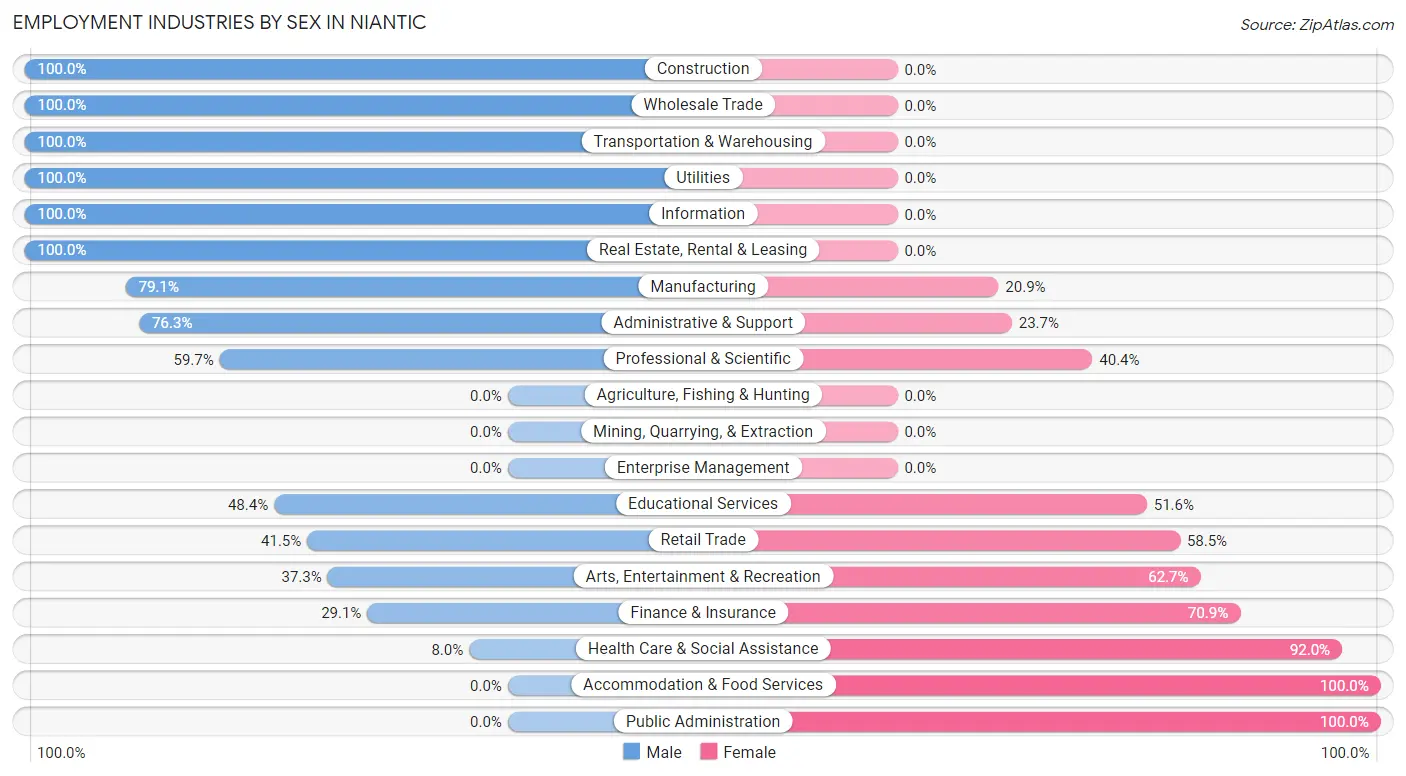
| Industry | Male | Female |
| Agriculture, Fishing & Hunting | 0 (0.0%) | 0 (0.0%) |
| Mining, Quarrying, & Extraction | 0 (0.0%) | 0 (0.0%) |
| Construction | 58 (100.0%) | 0 (0.0%) |
| Manufacturing | 159 (79.1%) | 42 (20.9%) |
| Wholesale Trade | 9 (100.0%) | 0 (0.0%) |
| Retail Trade | 120 (41.5%) | 169 (58.5%) |
| Transportation & Warehousing | 67 (100.0%) | 0 (0.0%) |
| Utilities | 14 (100.0%) | 0 (0.0%) |
| Information | 15 (100.0%) | 0 (0.0%) |
| Finance & Insurance | 16 (29.1%) | 39 (70.9%) |
| Real Estate, Rental & Leasing | 13 (100.0%) | 0 (0.0%) |
| Professional & Scientific | 34 (59.7%) | 23 (40.4%) |
| Enterprise Management | 0 (0.0%) | 0 (0.0%) |
| Administrative & Support | 29 (76.3%) | 9 (23.7%) |
| Educational Services | 179 (48.4%) | 191 (51.6%) |
| Health Care & Social Assistance | 12 (8.0%) | 138 (92.0%) |
| Arts, Entertainment & Recreation | 47 (37.3%) | 79 (62.7%) |
| Accommodation & Food Services | 0 (0.0%) | 24 (100.0%) |
| Public Administration | 0 (0.0%) | 27 (100.0%) |
| Total | 823 (51.0%) | 792 (49.0%) |
Education in Niantic
School Enrollment in Niantic
The most common levels of schooling among the 528 students in Niantic are college / undergraduate (159 | 30.1%), kindergarten (86 | 16.3%), and graduate / professional (82 | 15.5%).
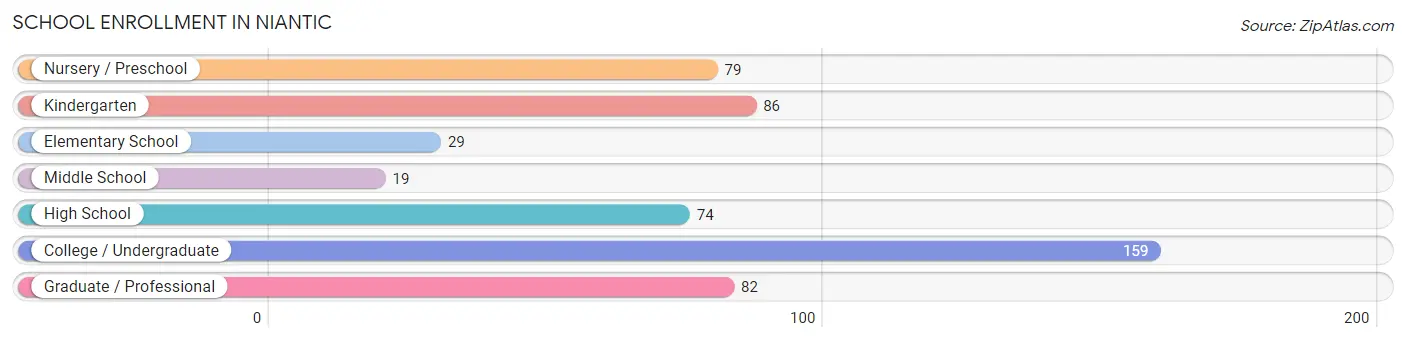
| School Level | # Students | % Students |
| Nursery / Preschool | 79 | 15.0% |
| Kindergarten | 86 | 16.3% |
| Elementary School | 29 | 5.5% |
| Middle School | 19 | 3.6% |
| High School | 74 | 14.0% |
| College / Undergraduate | 159 | 30.1% |
| Graduate / Professional | 82 | 15.5% |
| Total | 528 | 100.0% |
School Enrollment by Age by Funding Source in Niantic
Out of a total of 528 students who are enrolled in schools in Niantic, 58 (11.0%) attend a private institution, while the remaining 470 (89.0%) are enrolled in public schools. The age group of 25 to 34 year olds has the highest likelihood of being enrolled in private schools, with 58 (100.0% in the age bracket) enrolled. Conversely, the age group of 3 to 4 year olds has the lowest likelihood of being enrolled in a private school, with 79 (100.0% in the age bracket) attending a public institution.
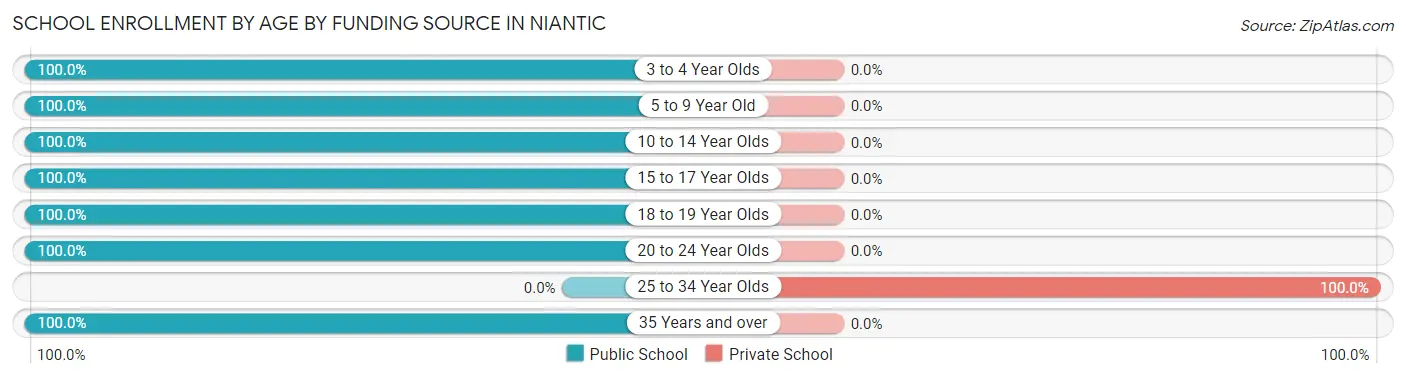
| Age Bracket | Public School | Private School |
| 3 to 4 Year Olds | 79 (100.0%) | 0 (0.0%) |
| 5 to 9 Year Old | 115 (100.0%) | 0 (0.0%) |
| 10 to 14 Year Olds | 32 (100.0%) | 0 (0.0%) |
| 15 to 17 Year Olds | 61 (100.0%) | 0 (0.0%) |
| 18 to 19 Year Olds | 9 (100.0%) | 0 (0.0%) |
| 20 to 24 Year Olds | 123 (100.0%) | 0 (0.0%) |
| 25 to 34 Year Olds | 0 (0.0%) | 58 (100.0%) |
| 35 Years and over | 51 (100.0%) | 0 (0.0%) |
| Total | 470 (89.0%) | 58 (11.0%) |
Educational Attainment by Field of Study in Niantic
Education (211 | 13.3%), psychology (194 | 12.2%), business (190 | 12.0%), science & technology (179 | 11.3%), and computers & mathematics (112 | 7.0%) are the most common fields of study among 1,589 individuals in Niantic who have obtained a bachelor's degree or higher.
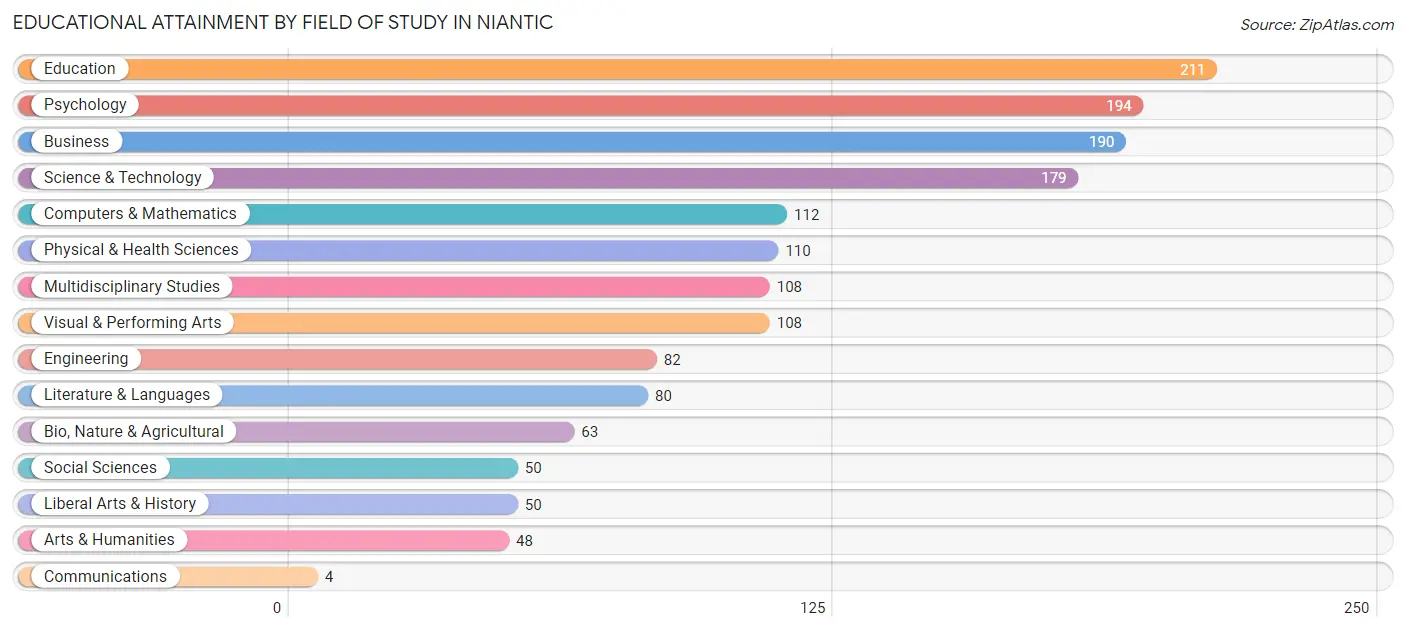
| Field of Study | # Graduates | % Graduates |
| Computers & Mathematics | 112 | 7.0% |
| Bio, Nature & Agricultural | 63 | 4.0% |
| Physical & Health Sciences | 110 | 6.9% |
| Psychology | 194 | 12.2% |
| Social Sciences | 50 | 3.2% |
| Engineering | 82 | 5.2% |
| Multidisciplinary Studies | 108 | 6.8% |
| Science & Technology | 179 | 11.3% |
| Business | 190 | 12.0% |
| Education | 211 | 13.3% |
| Literature & Languages | 80 | 5.0% |
| Liberal Arts & History | 50 | 3.2% |
| Visual & Performing Arts | 108 | 6.8% |
| Communications | 4 | 0.3% |
| Arts & Humanities | 48 | 3.0% |
| Total | 1,589 | 100.0% |
Transportation & Commute in Niantic
Vehicle Availability by Sex in Niantic
The most prevalent vehicle ownership categories in Niantic are males with 2 vehicles (388, accounting for 45.1%) and females with 2 vehicles (310, making up 49.8%).
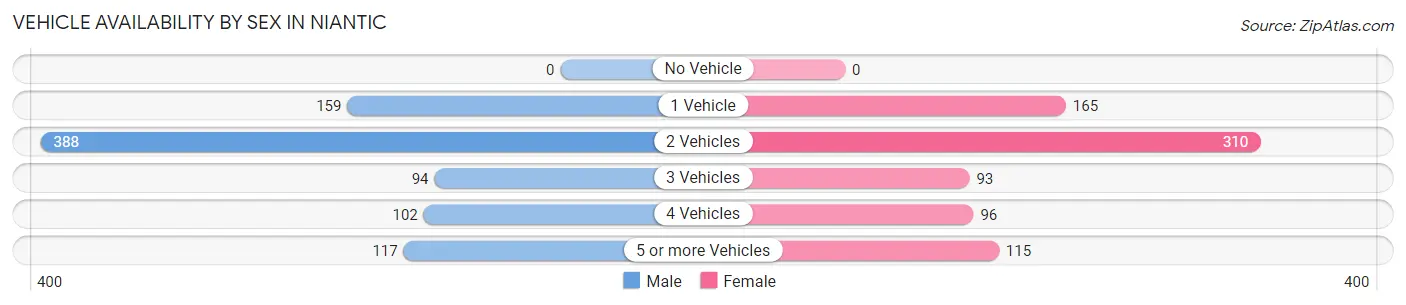
| Vehicles Available | Male | Female |
| No Vehicle | 0 (0.0%) | 0 (0.0%) |
| 1 Vehicle | 159 (18.5%) | 165 (21.2%) |
| 2 Vehicles | 388 (45.1%) | 310 (39.8%) |
| 3 Vehicles | 94 (10.9%) | 93 (11.9%) |
| 4 Vehicles | 102 (11.9%) | 96 (12.3%) |
| 5 or more Vehicles | 117 (13.6%) | 115 (14.8%) |
| Total | 860 (100.0%) | 779 (100.0%) |
Commute Time in Niantic
The most frequently occuring commute durations in Niantic are 20 to 24 minutes (385 commuters, 27.5%), 10 to 14 minutes (241 commuters, 17.2%), and 25 to 29 minutes (178 commuters, 12.7%).
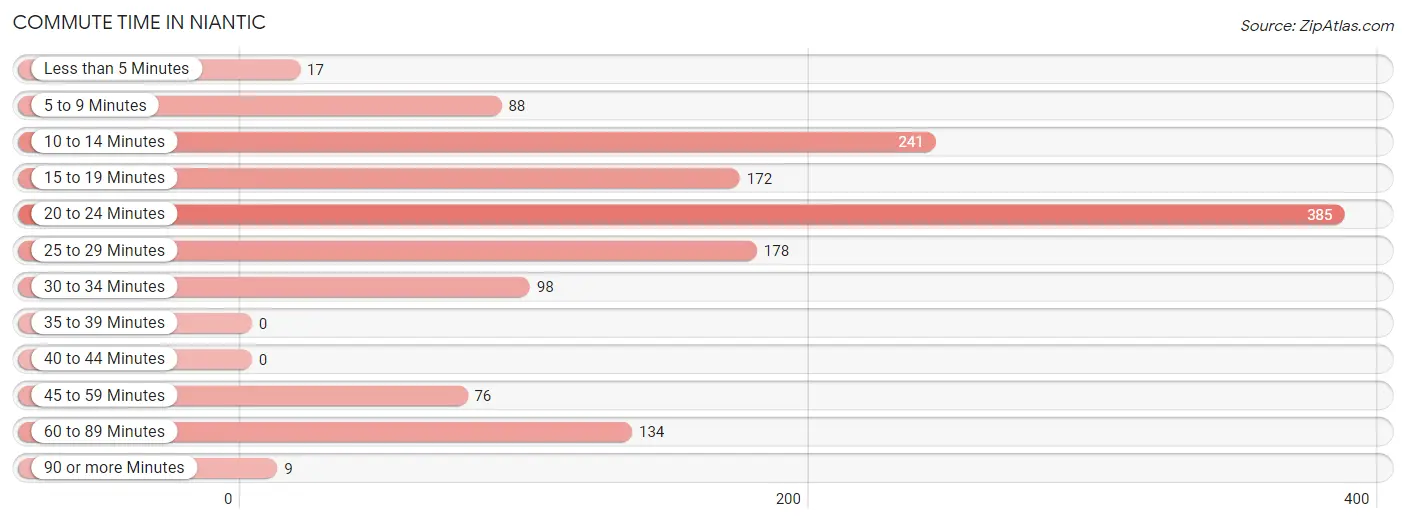
| Commute Time | # Commuters | % Commuters |
| Less than 5 Minutes | 17 | 1.2% |
| 5 to 9 Minutes | 88 | 6.3% |
| 10 to 14 Minutes | 241 | 17.2% |
| 15 to 19 Minutes | 172 | 12.3% |
| 20 to 24 Minutes | 385 | 27.5% |
| 25 to 29 Minutes | 178 | 12.7% |
| 30 to 34 Minutes | 98 | 7.0% |
| 35 to 39 Minutes | 0 | 0.0% |
| 40 to 44 Minutes | 0 | 0.0% |
| 45 to 59 Minutes | 76 | 5.4% |
| 60 to 89 Minutes | 134 | 9.6% |
| 90 or more Minutes | 9 | 0.6% |
Commute Time by Sex in Niantic
The most common commute times in Niantic are 20 to 24 minutes (233 commuters, 33.1%) for males and 20 to 24 minutes (152 commuters, 21.9%) for females.
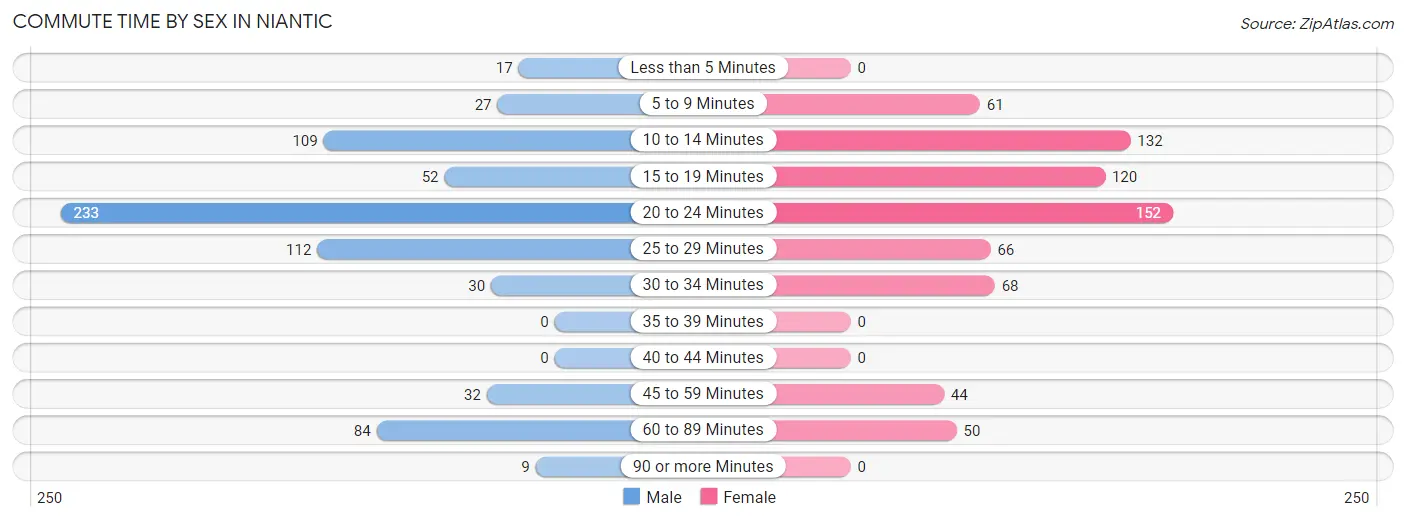
| Commute Time | Male | Female |
| Less than 5 Minutes | 17 (2.4%) | 0 (0.0%) |
| 5 to 9 Minutes | 27 (3.8%) | 61 (8.8%) |
| 10 to 14 Minutes | 109 (15.5%) | 132 (19.1%) |
| 15 to 19 Minutes | 52 (7.4%) | 120 (17.3%) |
| 20 to 24 Minutes | 233 (33.1%) | 152 (21.9%) |
| 25 to 29 Minutes | 112 (15.9%) | 66 (9.5%) |
| 30 to 34 Minutes | 30 (4.3%) | 68 (9.8%) |
| 35 to 39 Minutes | 0 (0.0%) | 0 (0.0%) |
| 40 to 44 Minutes | 0 (0.0%) | 0 (0.0%) |
| 45 to 59 Minutes | 32 (4.5%) | 44 (6.4%) |
| 60 to 89 Minutes | 84 (11.9%) | 50 (7.2%) |
| 90 or more Minutes | 9 (1.3%) | 0 (0.0%) |
Time of Departure to Work by Sex in Niantic
The most frequent times of departure to work in Niantic are 7:00 AM to 7:29 AM (262, 37.2%) for males and 9:00 AM to 9:59 AM (202, 29.1%) for females.
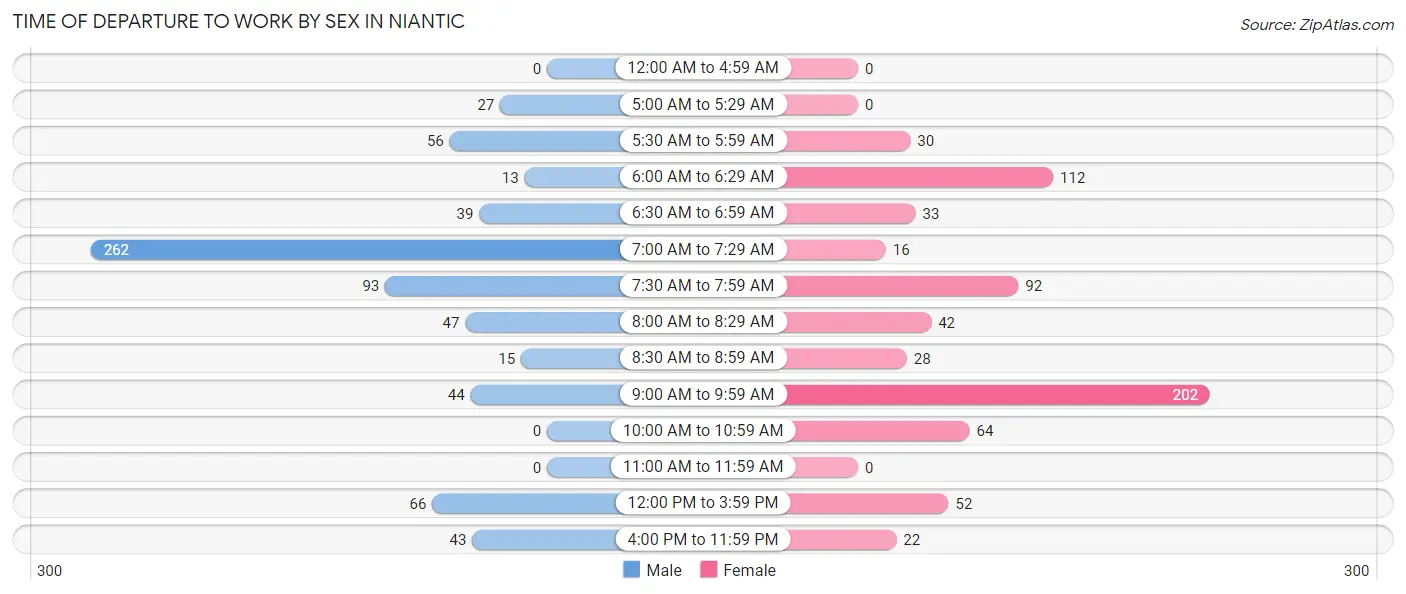
| Time of Departure | Male | Female |
| 12:00 AM to 4:59 AM | 0 (0.0%) | 0 (0.0%) |
| 5:00 AM to 5:29 AM | 27 (3.8%) | 0 (0.0%) |
| 5:30 AM to 5:59 AM | 56 (7.9%) | 30 (4.3%) |
| 6:00 AM to 6:29 AM | 13 (1.8%) | 112 (16.2%) |
| 6:30 AM to 6:59 AM | 39 (5.5%) | 33 (4.8%) |
| 7:00 AM to 7:29 AM | 262 (37.2%) | 16 (2.3%) |
| 7:30 AM to 7:59 AM | 93 (13.2%) | 92 (13.3%) |
| 8:00 AM to 8:29 AM | 47 (6.7%) | 42 (6.1%) |
| 8:30 AM to 8:59 AM | 15 (2.1%) | 28 (4.0%) |
| 9:00 AM to 9:59 AM | 44 (6.2%) | 202 (29.1%) |
| 10:00 AM to 10:59 AM | 0 (0.0%) | 64 (9.2%) |
| 11:00 AM to 11:59 AM | 0 (0.0%) | 0 (0.0%) |
| 12:00 PM to 3:59 PM | 66 (9.4%) | 52 (7.5%) |
| 4:00 PM to 11:59 PM | 43 (6.1%) | 22 (3.2%) |
| Total | 705 (100.0%) | 693 (100.0%) |
Housing Occupancy in Niantic
Occupancy by Ownership in Niantic
Of the total 1,568 dwellings in Niantic, owner-occupied units account for 1,089 (69.5%), while renter-occupied units make up 479 (30.5%).
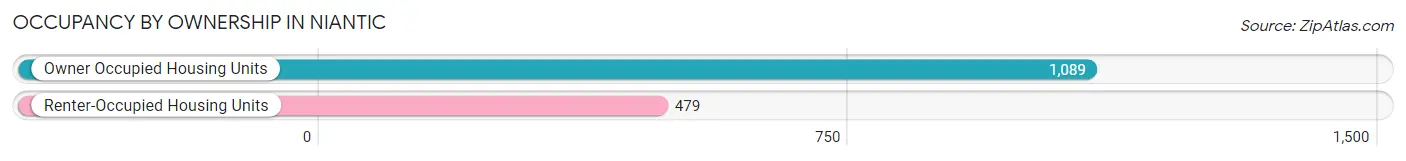
| Occupancy | # Housing Units | % Housing Units |
| Owner Occupied Housing Units | 1,089 | 69.5% |
| Renter-Occupied Housing Units | 479 | 30.5% |
| Total Occupied Housing Units | 1,568 | 100.0% |
Occupancy by Household Size in Niantic
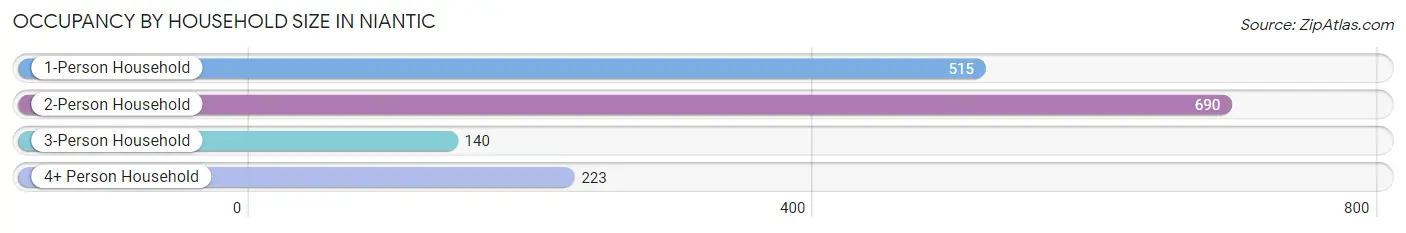
| Household Size | # Housing Units | % Housing Units |
| 1-Person Household | 515 | 32.8% |
| 2-Person Household | 690 | 44.0% |
| 3-Person Household | 140 | 8.9% |
| 4+ Person Household | 223 | 14.2% |
| Total Housing Units | 1,568 | 100.0% |
Occupancy by Ownership by Household Size in Niantic
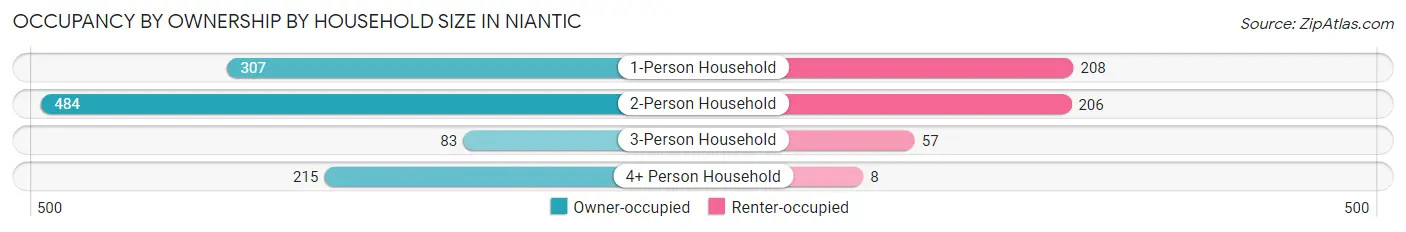
| Household Size | Owner-occupied | Renter-occupied |
| 1-Person Household | 307 (59.6%) | 208 (40.4%) |
| 2-Person Household | 484 (70.1%) | 206 (29.9%) |
| 3-Person Household | 83 (59.3%) | 57 (40.7%) |
| 4+ Person Household | 215 (96.4%) | 8 (3.6%) |
| Total Housing Units | 1,089 (69.5%) | 479 (30.5%) |
Occupancy by Educational Attainment in Niantic
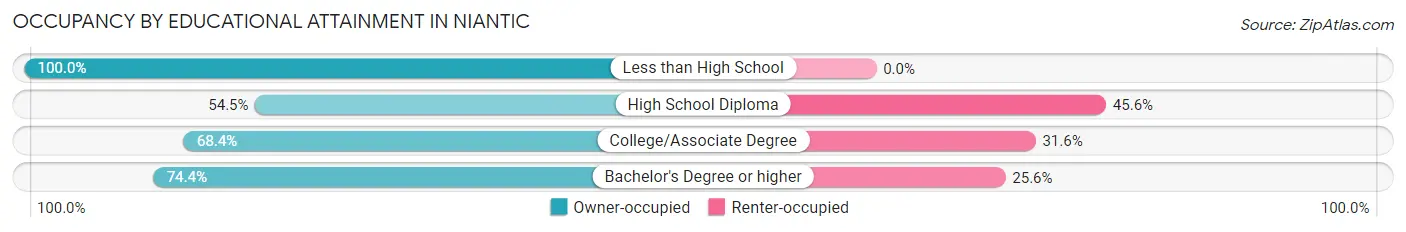
| Household Size | Owner-occupied | Renter-occupied |
| Less than High School | 19 (100.0%) | 0 (0.0%) |
| High School Diploma | 159 (54.4%) | 133 (45.6%) |
| College/Associate Degree | 275 (68.4%) | 127 (31.6%) |
| Bachelor's Degree or higher | 636 (74.4%) | 219 (25.6%) |
Occupancy by Age of Householder in Niantic
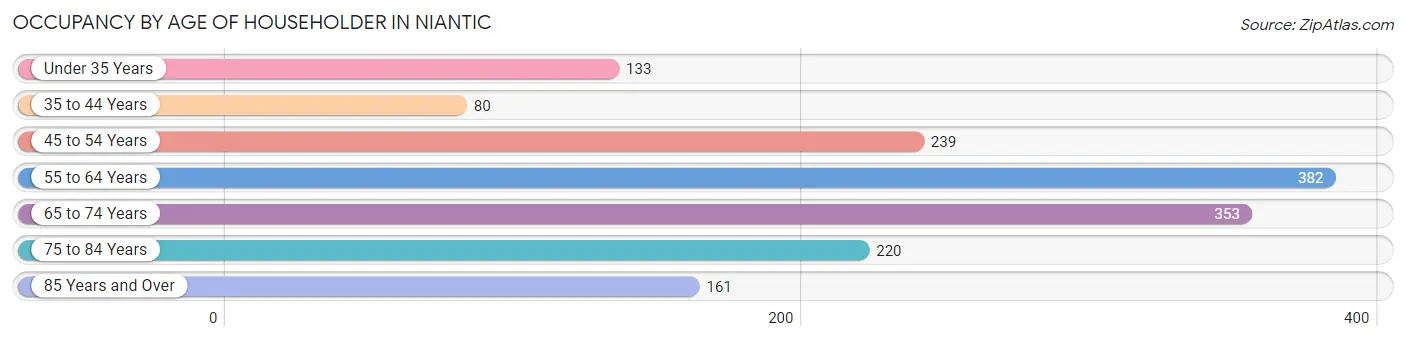
| Age Bracket | # Households | % Households |
| Under 35 Years | 133 | 8.5% |
| 35 to 44 Years | 80 | 5.1% |
| 45 to 54 Years | 239 | 15.2% |
| 55 to 64 Years | 382 | 24.4% |
| 65 to 74 Years | 353 | 22.5% |
| 75 to 84 Years | 220 | 14.0% |
| 85 Years and Over | 161 | 10.3% |
| Total | 1,568 | 100.0% |
Housing Finances in Niantic
Median Income by Occupancy in Niantic
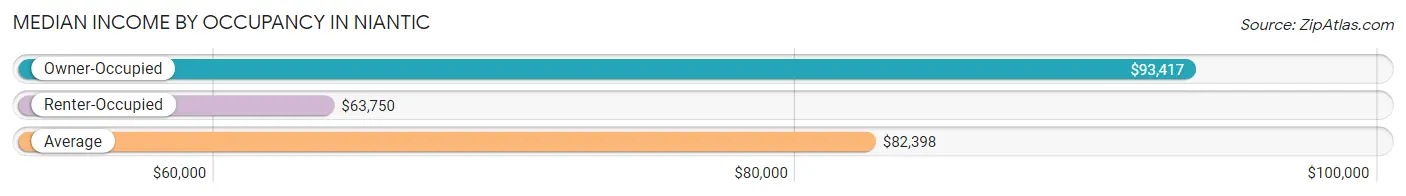
| Occupancy Type | # Households | Median Income |
| Owner-Occupied | 1,089 (69.5%) | $93,417 |
| Renter-Occupied | 479 (30.5%) | $63,750 |
| Average | 1,568 (100.0%) | $82,398 |
Occupancy by Householder Income Bracket in Niantic
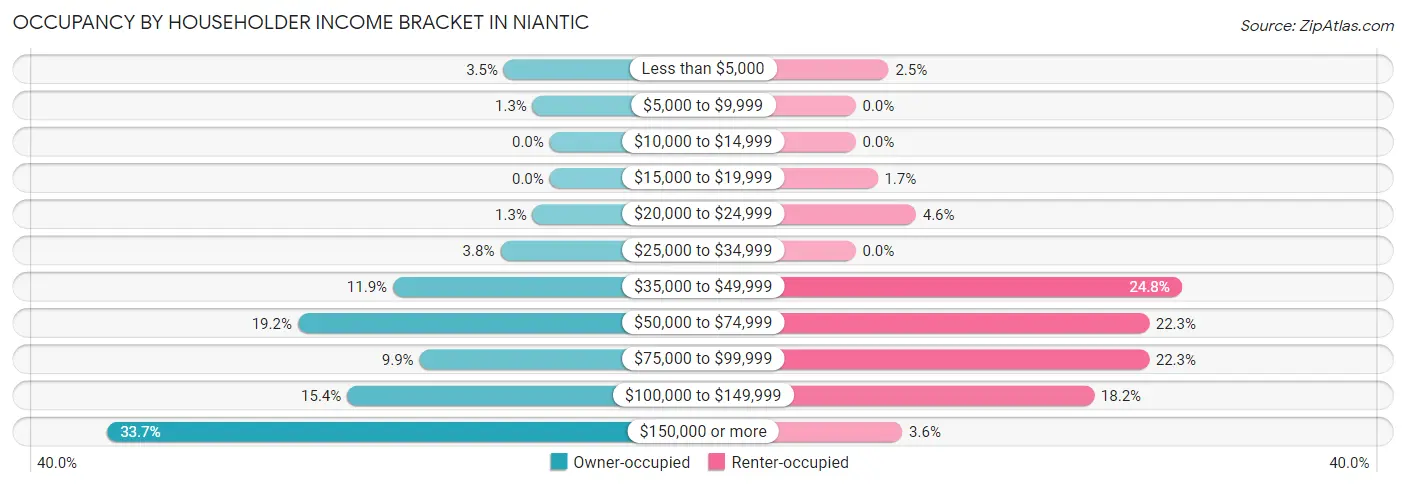
| Income Bracket | Owner-occupied | Renter-occupied |
| Less than $5,000 | 38 (3.5%) | 12 (2.5%) |
| $5,000 to $9,999 | 14 (1.3%) | 0 (0.0%) |
| $10,000 to $14,999 | 0 (0.0%) | 0 (0.0%) |
| $15,000 to $19,999 | 0 (0.0%) | 8 (1.7%) |
| $20,000 to $24,999 | 14 (1.3%) | 22 (4.6%) |
| $25,000 to $34,999 | 41 (3.8%) | 0 (0.0%) |
| $35,000 to $49,999 | 130 (11.9%) | 119 (24.8%) |
| $50,000 to $74,999 | 209 (19.2%) | 107 (22.3%) |
| $75,000 to $99,999 | 108 (9.9%) | 107 (22.3%) |
| $100,000 to $149,999 | 168 (15.4%) | 87 (18.2%) |
| $150,000 or more | 367 (33.7%) | 17 (3.5%) |
| Total | 1,089 (100.0%) | 479 (100.0%) |
Monthly Housing Cost Tiers in Niantic
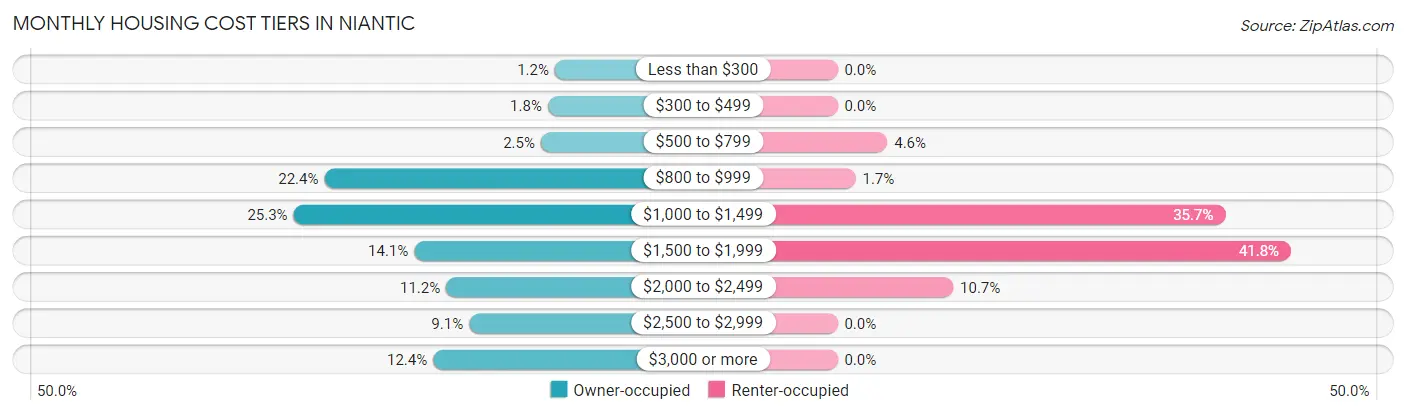
| Monthly Cost | Owner-occupied | Renter-occupied |
| Less than $300 | 13 (1.2%) | 0 (0.0%) |
| $300 to $499 | 20 (1.8%) | 0 (0.0%) |
| $500 to $799 | 27 (2.5%) | 22 (4.6%) |
| $800 to $999 | 244 (22.4%) | 8 (1.7%) |
| $1,000 to $1,499 | 275 (25.3%) | 171 (35.7%) |
| $1,500 to $1,999 | 154 (14.1%) | 200 (41.7%) |
| $2,000 to $2,499 | 122 (11.2%) | 51 (10.6%) |
| $2,500 to $2,999 | 99 (9.1%) | 0 (0.0%) |
| $3,000 or more | 135 (12.4%) | 0 (0.0%) |
| Total | 1,089 (100.0%) | 479 (100.0%) |
Physical Housing Characteristics in Niantic
Housing Structures in Niantic
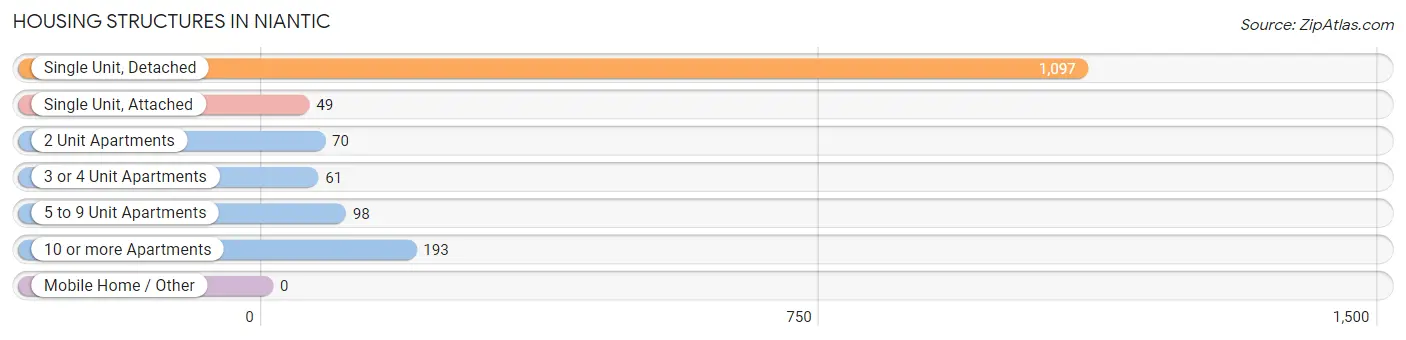
| Structure Type | # Housing Units | % Housing Units |
| Single Unit, Detached | 1,097 | 70.0% |
| Single Unit, Attached | 49 | 3.1% |
| 2 Unit Apartments | 70 | 4.5% |
| 3 or 4 Unit Apartments | 61 | 3.9% |
| 5 to 9 Unit Apartments | 98 | 6.2% |
| 10 or more Apartments | 193 | 12.3% |
| Mobile Home / Other | 0 | 0.0% |
| Total | 1,568 | 100.0% |
Housing Structures by Occupancy in Niantic
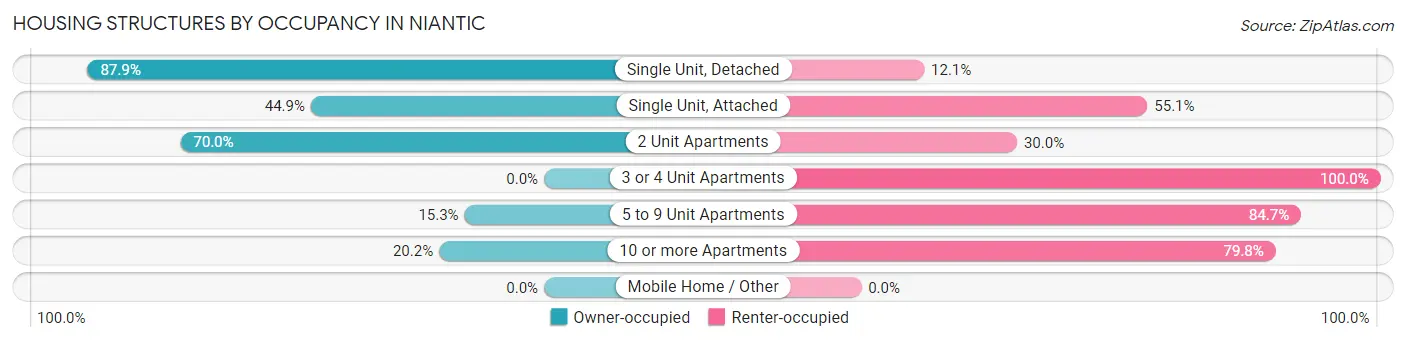
| Structure Type | Owner-occupied | Renter-occupied |
| Single Unit, Detached | 964 (87.9%) | 133 (12.1%) |
| Single Unit, Attached | 22 (44.9%) | 27 (55.1%) |
| 2 Unit Apartments | 49 (70.0%) | 21 (30.0%) |
| 3 or 4 Unit Apartments | 0 (0.0%) | 61 (100.0%) |
| 5 to 9 Unit Apartments | 15 (15.3%) | 83 (84.7%) |
| 10 or more Apartments | 39 (20.2%) | 154 (79.8%) |
| Mobile Home / Other | 0 (0.0%) | 0 (0.0%) |
| Total | 1,089 (69.5%) | 479 (30.5%) |
Housing Structures by Number of Rooms in Niantic
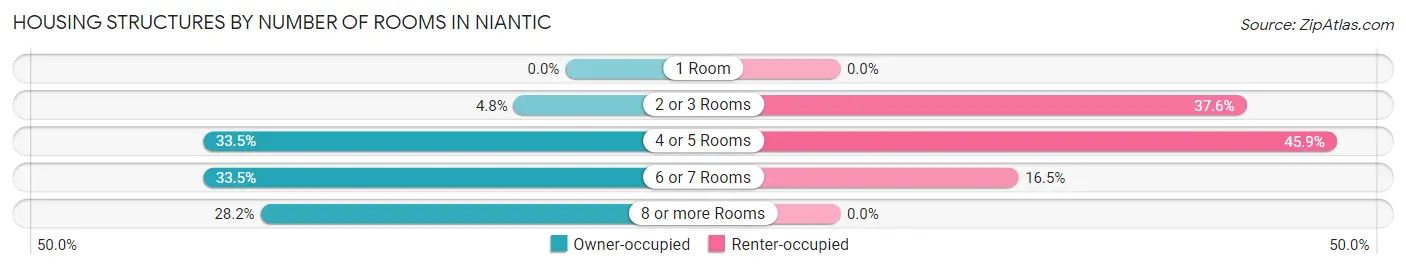
| Number of Rooms | Owner-occupied | Renter-occupied |
| 1 Room | 0 (0.0%) | 0 (0.0%) |
| 2 or 3 Rooms | 52 (4.8%) | 180 (37.6%) |
| 4 or 5 Rooms | 365 (33.5%) | 220 (45.9%) |
| 6 or 7 Rooms | 365 (33.5%) | 79 (16.5%) |
| 8 or more Rooms | 307 (28.2%) | 0 (0.0%) |
| Total | 1,089 (100.0%) | 479 (100.0%) |
Housing Structure by Heating Type in Niantic
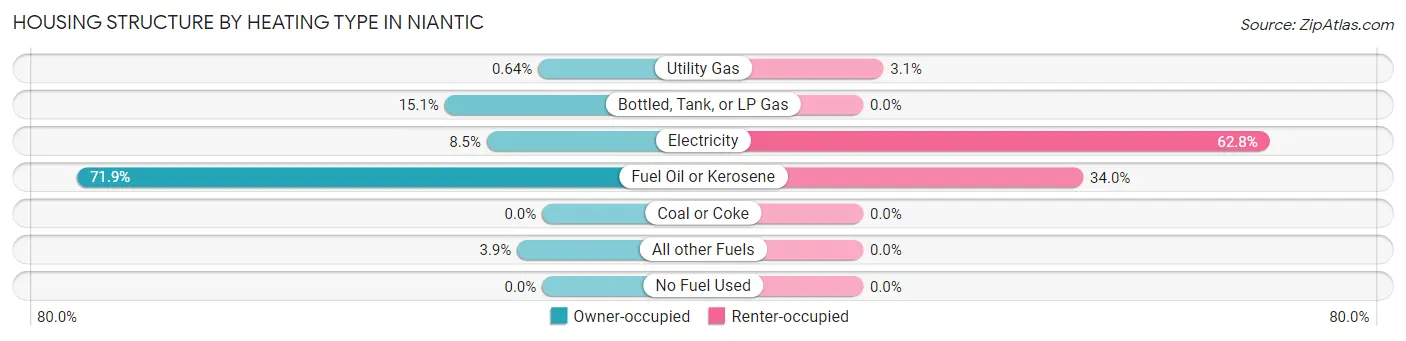
| Heating Type | Owner-occupied | Renter-occupied |
| Utility Gas | 7 (0.6%) | 15 (3.1%) |
| Bottled, Tank, or LP Gas | 164 (15.1%) | 0 (0.0%) |
| Electricity | 93 (8.5%) | 301 (62.8%) |
| Fuel Oil or Kerosene | 783 (71.9%) | 163 (34.0%) |
| Coal or Coke | 0 (0.0%) | 0 (0.0%) |
| All other Fuels | 42 (3.9%) | 0 (0.0%) |
| No Fuel Used | 0 (0.0%) | 0 (0.0%) |
| Total | 1,089 (100.0%) | 479 (100.0%) |
Household Vehicle Usage in Niantic
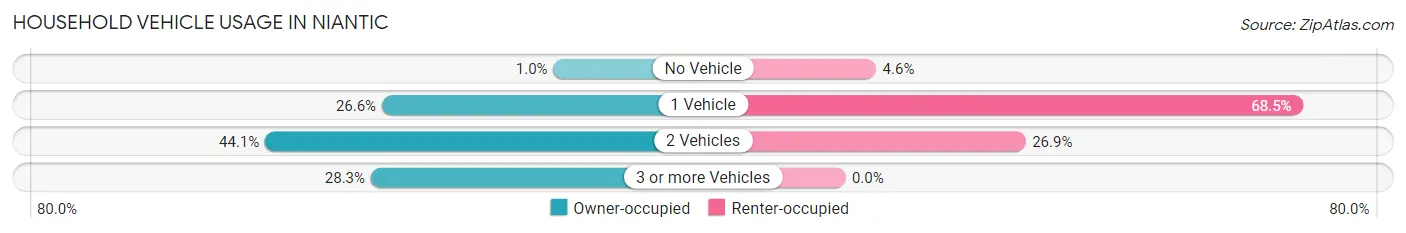
| Vehicles per Household | Owner-occupied | Renter-occupied |
| No Vehicle | 11 (1.0%) | 22 (4.6%) |
| 1 Vehicle | 290 (26.6%) | 328 (68.5%) |
| 2 Vehicles | 480 (44.1%) | 129 (26.9%) |
| 3 or more Vehicles | 308 (28.3%) | 0 (0.0%) |
| Total | 1,089 (100.0%) | 479 (100.0%) |
Real Estate & Mortgages in Niantic
Real Estate and Mortgage Overview in Niantic
| Characteristic | Without Mortgage | With Mortgage |
| Housing Units | 531 | 558 |
| Median Property Value | $412,900 | $359,400 |
| Median Household Income | $70,417 | $234 |
| Monthly Housing Costs | $979 | $135 |
| Real Estate Taxes | $6,087 | $16 |
Property Value by Mortgage Status in Niantic
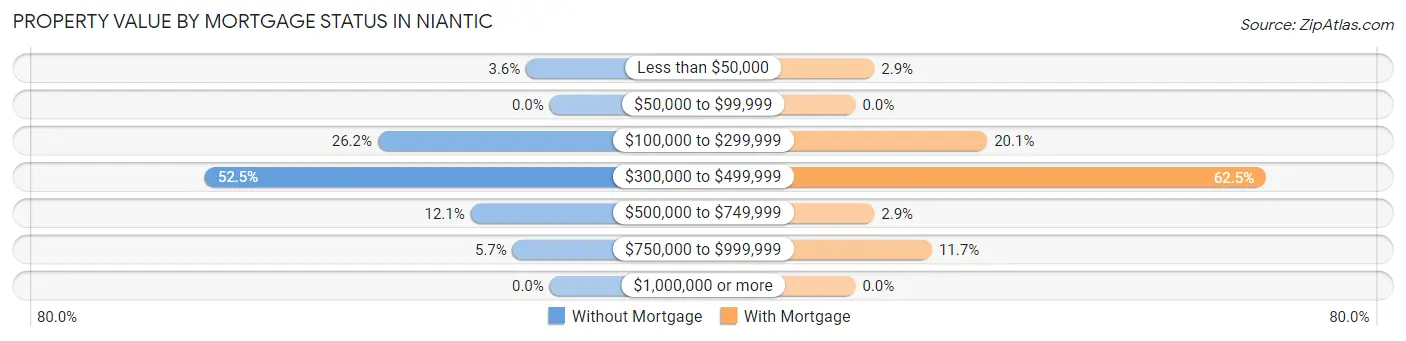
| Property Value | Without Mortgage | With Mortgage |
| Less than $50,000 | 19 (3.6%) | 16 (2.9%) |
| $50,000 to $99,999 | 0 (0.0%) | 0 (0.0%) |
| $100,000 to $299,999 | 139 (26.2%) | 112 (20.1%) |
| $300,000 to $499,999 | 279 (52.5%) | 349 (62.5%) |
| $500,000 to $749,999 | 64 (12.0%) | 16 (2.9%) |
| $750,000 to $999,999 | 30 (5.7%) | 65 (11.7%) |
| $1,000,000 or more | 0 (0.0%) | 0 (0.0%) |
| Total | 531 (100.0%) | 558 (100.0%) |
Household Income by Mortgage Status in Niantic
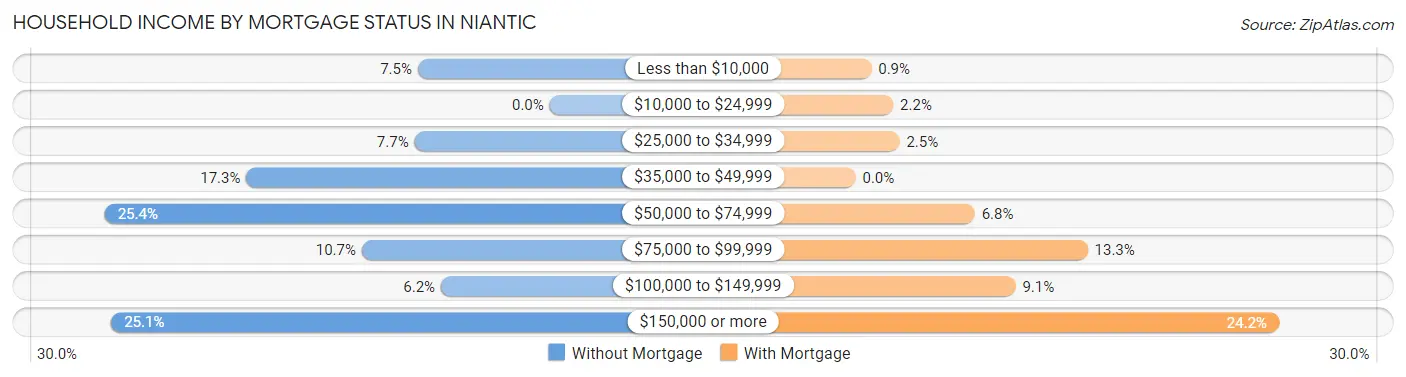
| Household Income | Without Mortgage | With Mortgage |
| Less than $10,000 | 40 (7.5%) | 5 (0.9%) |
| $10,000 to $24,999 | 0 (0.0%) | 12 (2.1%) |
| $25,000 to $34,999 | 41 (7.7%) | 14 (2.5%) |
| $35,000 to $49,999 | 92 (17.3%) | 0 (0.0%) |
| $50,000 to $74,999 | 135 (25.4%) | 38 (6.8%) |
| $75,000 to $99,999 | 57 (10.7%) | 74 (13.3%) |
| $100,000 to $149,999 | 33 (6.2%) | 51 (9.1%) |
| $150,000 or more | 133 (25.1%) | 135 (24.2%) |
| Total | 531 (100.0%) | 558 (100.0%) |
Property Value to Household Income Ratio in Niantic
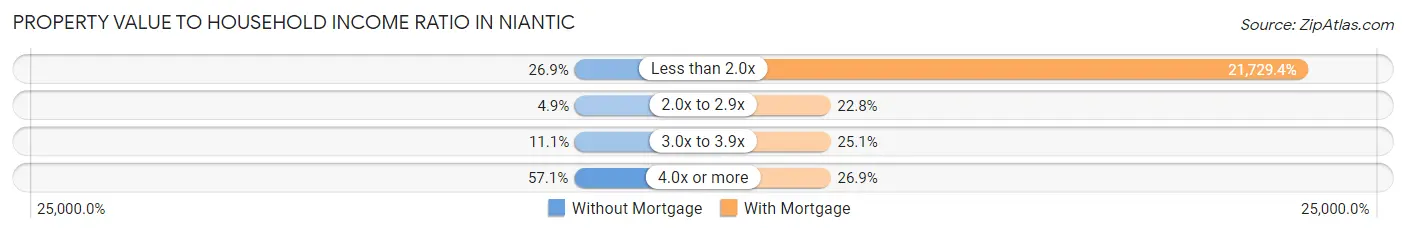
| Value-to-Income Ratio | Without Mortgage | With Mortgage |
| Less than 2.0x | 143 (26.9%) | 121,250 (21,729.4%) |
| 2.0x to 2.9x | 26 (4.9%) | 127 (22.8%) |
| 3.0x to 3.9x | 59 (11.1%) | 140 (25.1%) |
| 4.0x or more | 303 (57.1%) | 150 (26.9%) |
| Total | 531 (100.0%) | 558 (100.0%) |
Real Estate Taxes by Mortgage Status in Niantic
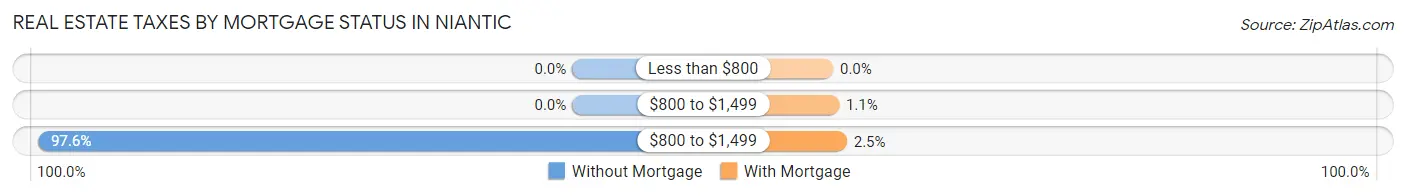
| Property Taxes | Without Mortgage | With Mortgage |
| Less than $800 | 0 (0.0%) | 0 (0.0%) |
| $800 to $1,499 | 0 (0.0%) | 6 (1.1%) |
| $800 to $1,499 | 518 (97.6%) | 14 (2.5%) |
| Total | 531 (100.0%) | 558 (100.0%) |
Health & Disability in Niantic
Health Insurance Coverage by Age in Niantic
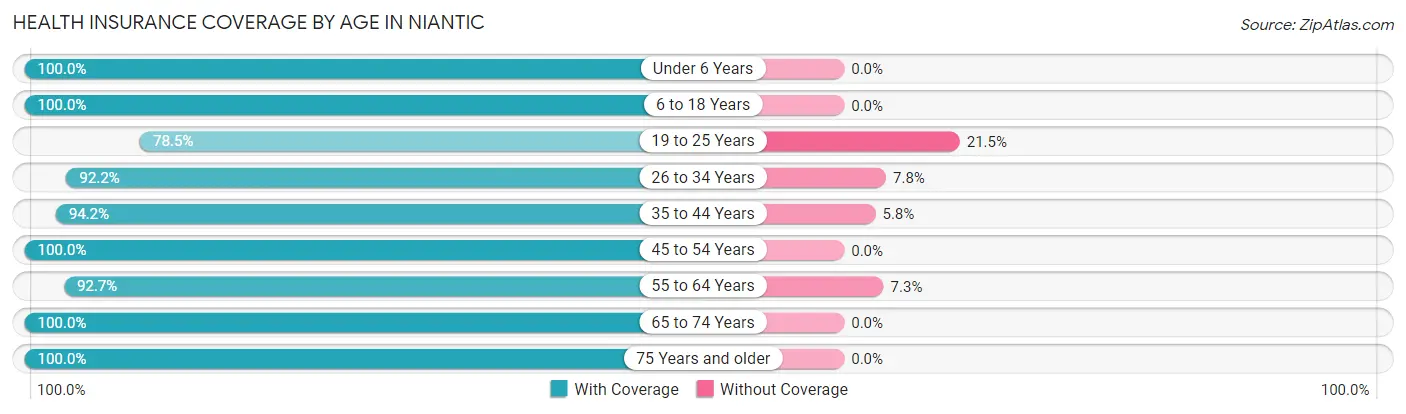
| Age Bracket | With Coverage | Without Coverage |
| Under 6 Years | 204 (100.0%) | 0 (0.0%) |
| 6 to 18 Years | 208 (100.0%) | 0 (0.0%) |
| 19 to 25 Years | 193 (78.5%) | 53 (21.5%) |
| 26 to 34 Years | 260 (92.2%) | 22 (7.8%) |
| 35 to 44 Years | 323 (94.2%) | 20 (5.8%) |
| 45 to 54 Years | 301 (100.0%) | 0 (0.0%) |
| 55 to 64 Years | 631 (92.7%) | 50 (7.3%) |
| 65 to 74 Years | 695 (100.0%) | 0 (0.0%) |
| 75 Years and older | 445 (100.0%) | 0 (0.0%) |
| Total | 3,260 (95.7%) | 145 (4.3%) |
Health Insurance Coverage by Citizenship Status in Niantic
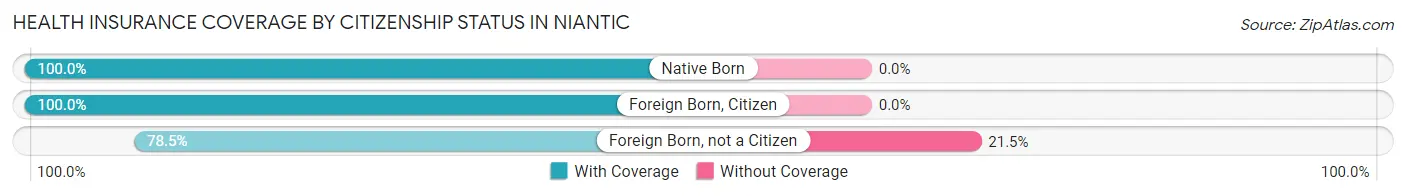
| Citizenship Status | With Coverage | Without Coverage |
| Native Born | 204 (100.0%) | 0 (0.0%) |
| Foreign Born, Citizen | 208 (100.0%) | 0 (0.0%) |
| Foreign Born, not a Citizen | 193 (78.5%) | 53 (21.5%) |
Health Insurance Coverage by Household Income in Niantic
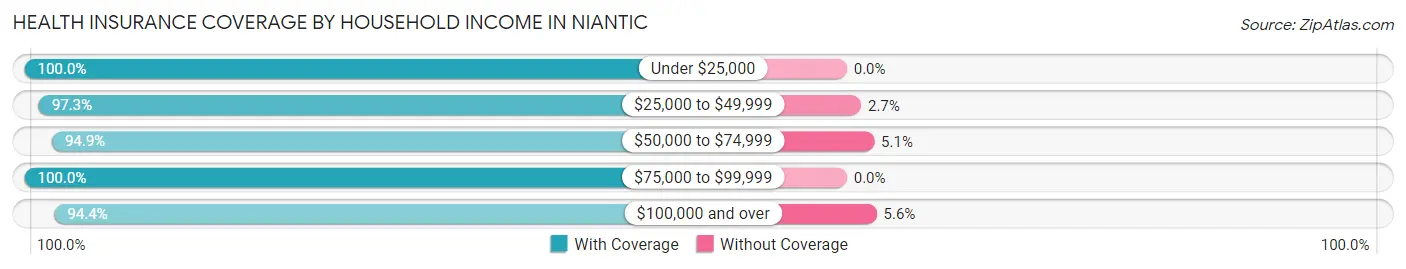
| Household Income | With Coverage | Without Coverage |
| Under $25,000 | 145 (100.0%) | 0 (0.0%) |
| $25,000 to $49,999 | 474 (97.3%) | 13 (2.7%) |
| $50,000 to $74,999 | 481 (94.9%) | 26 (5.1%) |
| $75,000 to $99,999 | 365 (100.0%) | 0 (0.0%) |
| $100,000 and over | 1,789 (94.4%) | 106 (5.6%) |
Public vs Private Health Insurance Coverage by Age in Niantic
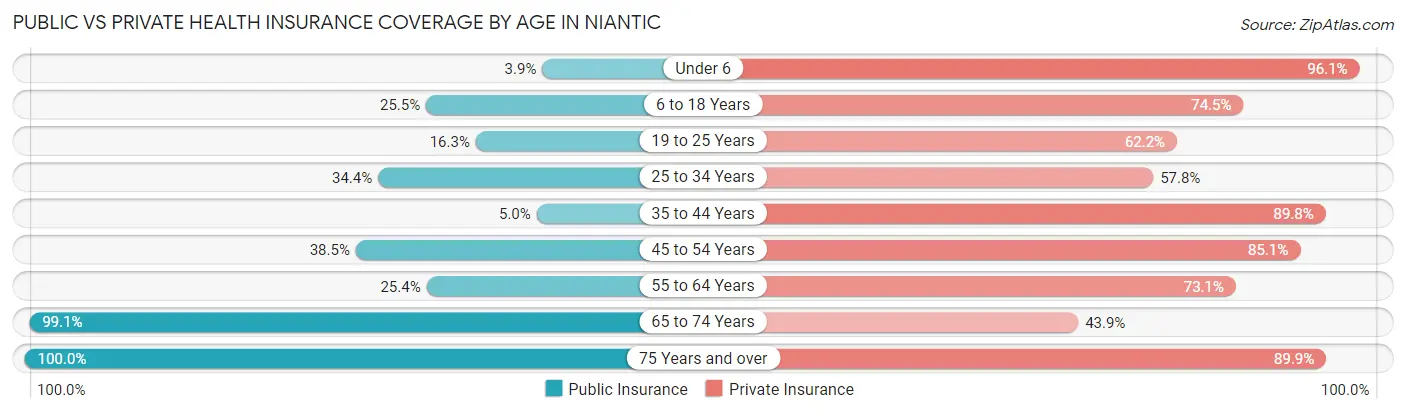
| Age Bracket | Public Insurance | Private Insurance |
| Under 6 | 8 (3.9%) | 196 (96.1%) |
| 6 to 18 Years | 53 (25.5%) | 155 (74.5%) |
| 19 to 25 Years | 40 (16.3%) | 153 (62.2%) |
| 25 to 34 Years | 97 (34.4%) | 163 (57.8%) |
| 35 to 44 Years | 17 (5.0%) | 308 (89.8%) |
| 45 to 54 Years | 116 (38.5%) | 256 (85.1%) |
| 55 to 64 Years | 173 (25.4%) | 498 (73.1%) |
| 65 to 74 Years | 689 (99.1%) | 305 (43.9%) |
| 75 Years and over | 445 (100.0%) | 400 (89.9%) |
| Total | 1,638 (48.1%) | 2,434 (71.5%) |
Disability Status by Sex by Age in Niantic
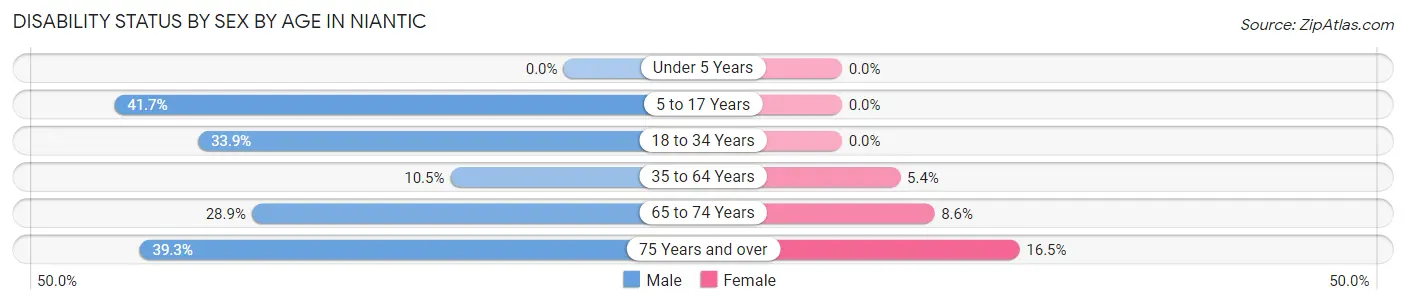
| Age Bracket | Male | Female |
| Under 5 Years | 0 (0.0%) | 0 (0.0%) |
| 5 to 17 Years | 30 (41.7%) | 0 (0.0%) |
| 18 to 34 Years | 79 (33.9%) | 0 (0.0%) |
| 35 to 64 Years | 73 (10.5%) | 34 (5.4%) |
| 65 to 74 Years | 83 (28.9%) | 35 (8.6%) |
| 75 Years and over | 70 (39.3%) | 44 (16.5%) |
Disability Class by Sex by Age in Niantic
Disability Class: Hearing Difficulty
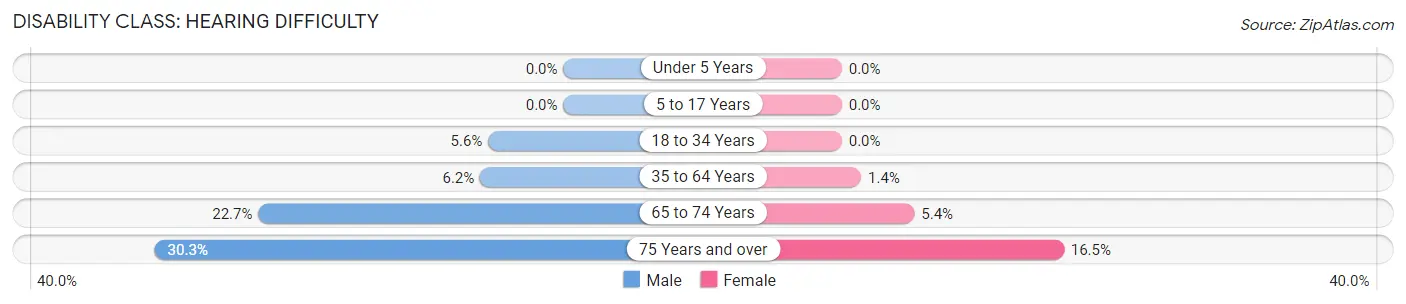
| Age Bracket | Male | Female |
| Under 5 Years | 0 (0.0%) | 0 (0.0%) |
| 5 to 17 Years | 0 (0.0%) | 0 (0.0%) |
| 18 to 34 Years | 13 (5.6%) | 0 (0.0%) |
| 35 to 64 Years | 43 (6.2%) | 9 (1.4%) |
| 65 to 74 Years | 65 (22.7%) | 22 (5.4%) |
| 75 Years and over | 54 (30.3%) | 44 (16.5%) |
Disability Class: Vision Difficulty
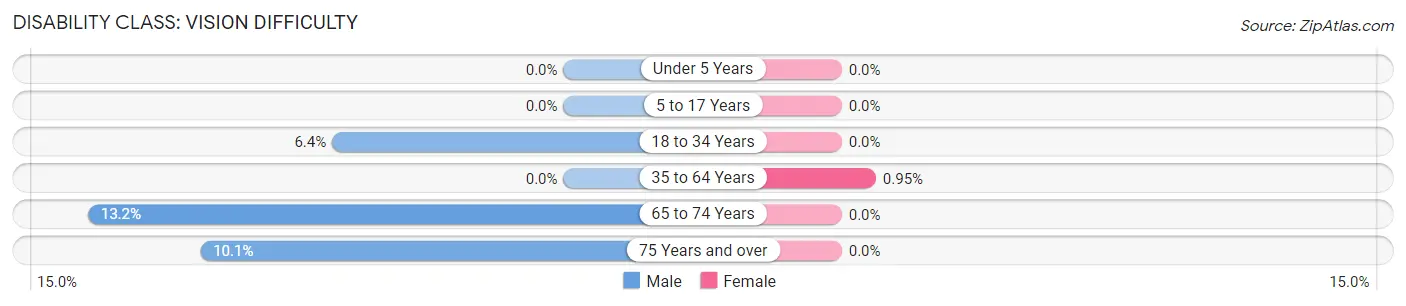
| Age Bracket | Male | Female |
| Under 5 Years | 0 (0.0%) | 0 (0.0%) |
| 5 to 17 Years | 0 (0.0%) | 0 (0.0%) |
| 18 to 34 Years | 15 (6.4%) | 0 (0.0%) |
| 35 to 64 Years | 0 (0.0%) | 6 (0.9%) |
| 65 to 74 Years | 38 (13.2%) | 0 (0.0%) |
| 75 Years and over | 18 (10.1%) | 0 (0.0%) |
Disability Class: Cognitive Difficulty
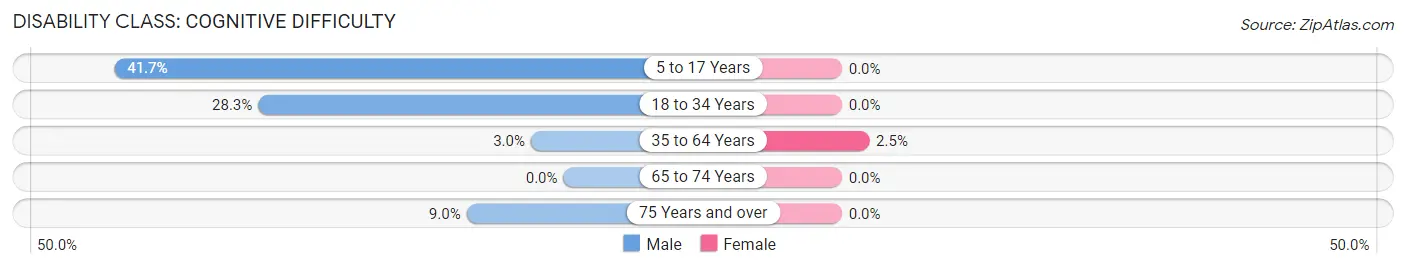
| Age Bracket | Male | Female |
| 5 to 17 Years | 30 (41.7%) | 0 (0.0%) |
| 18 to 34 Years | 66 (28.3%) | 0 (0.0%) |
| 35 to 64 Years | 21 (3.0%) | 16 (2.5%) |
| 65 to 74 Years | 0 (0.0%) | 0 (0.0%) |
| 75 Years and over | 16 (9.0%) | 0 (0.0%) |
Disability Class: Ambulatory Difficulty
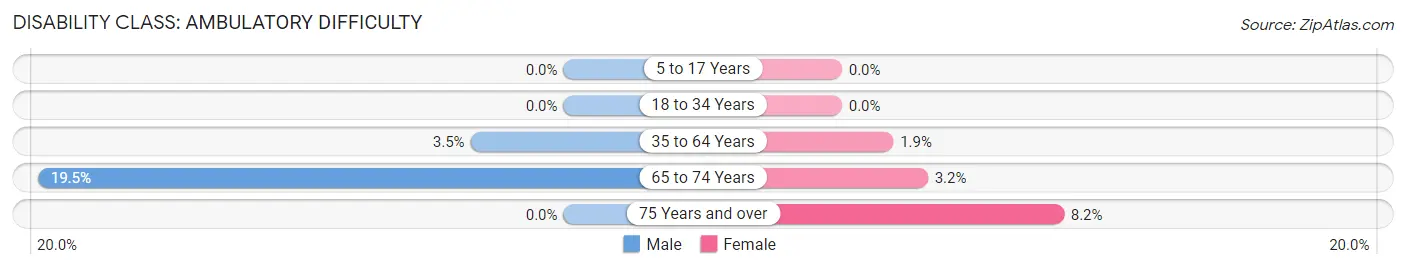
| Age Bracket | Male | Female |
| 5 to 17 Years | 0 (0.0%) | 0 (0.0%) |
| 18 to 34 Years | 0 (0.0%) | 0 (0.0%) |
| 35 to 64 Years | 24 (3.5%) | 12 (1.9%) |
| 65 to 74 Years | 56 (19.5%) | 13 (3.2%) |
| 75 Years and over | 0 (0.0%) | 22 (8.2%) |
Disability Class: Self-Care Difficulty
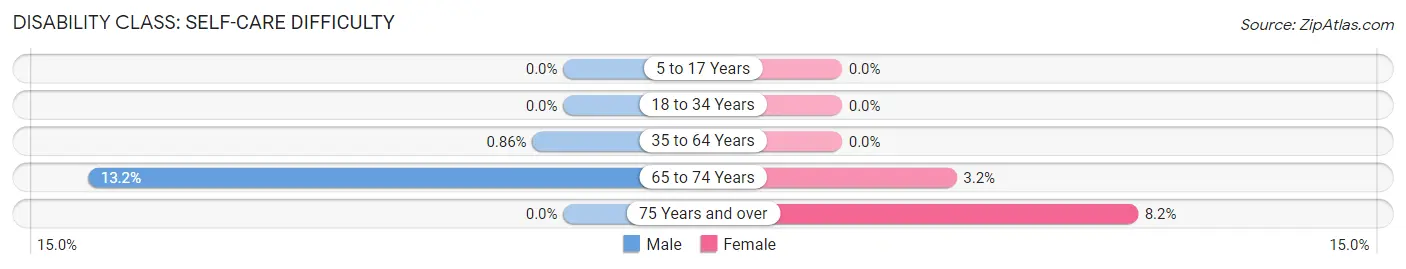
| Age Bracket | Male | Female |
| 5 to 17 Years | 0 (0.0%) | 0 (0.0%) |
| 18 to 34 Years | 0 (0.0%) | 0 (0.0%) |
| 35 to 64 Years | 6 (0.9%) | 0 (0.0%) |
| 65 to 74 Years | 38 (13.2%) | 13 (3.2%) |
| 75 Years and over | 0 (0.0%) | 22 (8.2%) |
Technology Access in Niantic
Computing Device Access in Niantic
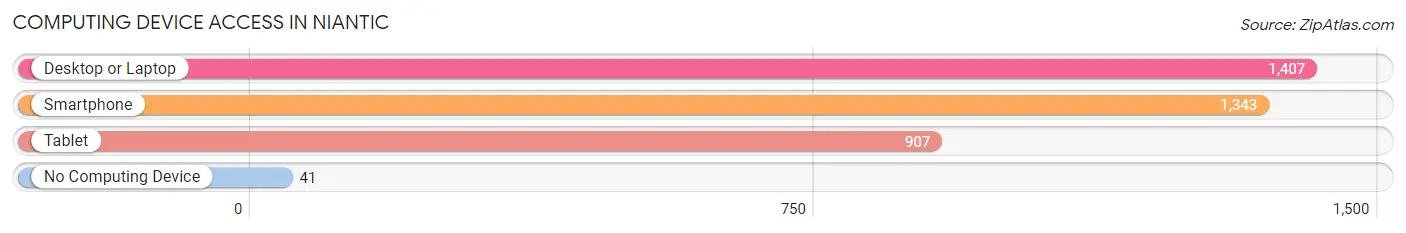
| Device Type | # Households | % Households |
| Desktop or Laptop | 1,407 | 89.7% |
| Smartphone | 1,343 | 85.7% |
| Tablet | 907 | 57.8% |
| No Computing Device | 41 | 2.6% |
| Total | 1,568 | 100.0% |
Internet Access in Niantic
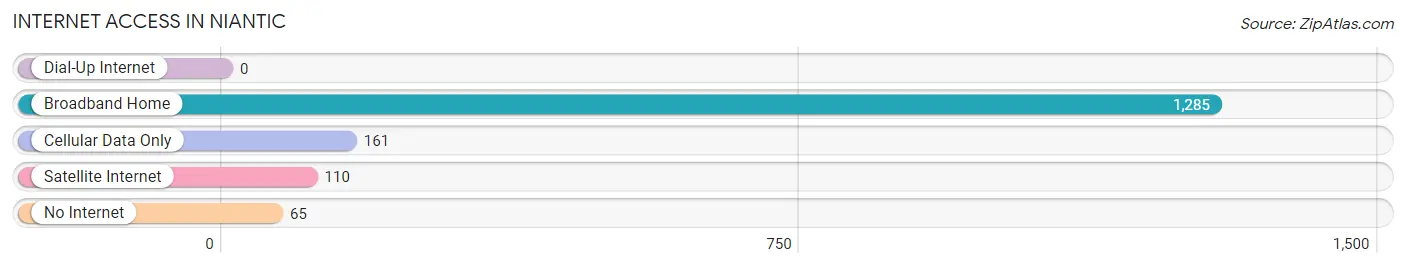
| Internet Type | # Households | % Households |
| Dial-Up Internet | 0 | 0.0% |
| Broadband Home | 1,285 | 82.0% |
| Cellular Data Only | 161 | 10.3% |
| Satellite Internet | 110 | 7.0% |
| No Internet | 65 | 4.2% |
| Total | 1,568 | 100.0% |
Niantic Summary
Niantic is a small town located in New London County, Connecticut. It is situated on the east side of the Thames River, and is bordered by the towns of East Lyme, Waterford, and Montville. The town has a population of 3,717 people, according to the 2010 census.
Geography
Niantic is located in southeastern Connecticut, on the east side of the Thames River. It is bordered by the towns of East Lyme, Waterford, and Montville. The town covers an area of 8.3 square miles, and is located approximately 10 miles east of New London. The terrain is mostly flat, with some rolling hills in the northern part of town. The highest point in Niantic is located at the intersection of Route 156 and Route 161, at an elevation of approximately 200 feet.
The town is home to several bodies of water, including Niantic Bay, Niantic River, and Niantic Pond. Niantic Bay is a shallow estuary that is connected to Long Island Sound. The Niantic River is a tidal river that flows through the town, and is a popular spot for fishing and boating. Niantic Pond is a small freshwater pond located in the northern part of town.
Economy
Niantic’s economy is largely based on tourism and retail. The town is home to several popular attractions, including the Niantic Bay Boardwalk, the Niantic Riverwalk, and the Niantic Children’s Museum. The boardwalk is a popular spot for walking, biking, and fishing, and the riverwalk is a popular spot for kayaking and canoeing. The Niantic Children’s Museum is a popular destination for families, and features interactive exhibits and educational programs.
The town is also home to several retail stores, including a grocery store, a hardware store, and several clothing stores. The town is also home to several restaurants, including a seafood restaurant, a pizza place, and a Mexican restaurant.
Demographics
As of the 2010 census, Niantic had a population of 3,717 people. The racial makeup of the town was 94.3% White, 1.7% African American, 0.7% Native American, 0.9% Asian, 0.1% Pacific Islander, 0.7% from other races, and 1.5% from two or more races. Hispanic or Latino of any race were 2.7% of the population.
The median household income in Niantic was $63,958, and the median family income was $76,944. The per capita income for the town was $30,945. About 4.3% of families and 5.7% of the population were below the poverty line, including 6.3% of those under age 18 and 4.2% of those age 65 or over.
Conclusion
Niantic is a small town located in New London County, Connecticut. It is situated on the east side of the Thames River, and is bordered by the towns of East Lyme, Waterford, and Montville. The town has a population of 3,717 people, according to the 2010 census. The town’s economy is largely based on tourism and retail, and it is home to several popular attractions, including the Niantic Bay Boardwalk, the Niantic Riverwalk, and the Niantic Children’s Museum. The racial makeup of the town was 94.3% White, 1.7% African American, 0.7% Native American, 0.9% Asian, 0.1% Pacific Islander, 0.7% from other races, and 1.5% from two or more races. The median household income in Niantic was $63,958, and the median family income was $76,944.
Common Questions
What is Per Capita Income in Niantic?
Per Capita income in Niantic is $49,192.
What is the Median Family Income in Niantic?
Median Family Income in Niantic is $108,836.
What is the Median Household income in Niantic?
Median Household Income in Niantic is $82,398.
What is Income or Wage Gap in Niantic?
Income or Wage Gap in Niantic is 61.1%.
Women in Niantic earn 38.9 cents for every dollar earned by a man.
What is Inequality or Gini Index in Niantic?
Inequality or Gini Index in Niantic is 0.39.
What is the Total Population of Niantic?
Total Population of Niantic is 3,497.
What is the Total Male Population of Niantic?
Total Male Population of Niantic is 1,639.
What is the Total Female Population of Niantic?
Total Female Population of Niantic is 1,858.
What is the Ratio of Males per 100 Females in Niantic?
There are 88.21 Males per 100 Females in Niantic.
What is the Ratio of Females per 100 Males in Niantic?
There are 113.36 Females per 100 Males in Niantic.
What is the Median Population Age in Niantic?
Median Population Age in Niantic is 57.2 Years.
What is the Average Family Size in Niantic
Average Family Size in Niantic is 2.8 People.
What is the Average Household Size in Niantic
Average Household Size in Niantic is 2.2 People.
How Large is the Labor Force in Niantic?
There are 1,699 People in the Labor Forcein in Niantic.
What is the Percentage of People in the Labor Force in Niantic?
54.0% of People are in the Labor Force in Niantic.
What is the Unemployment Rate in Niantic?
Unemployment Rate in Niantic is 2.7%.