Broad Brook, CT Map & Demographics
Broad Brook Map
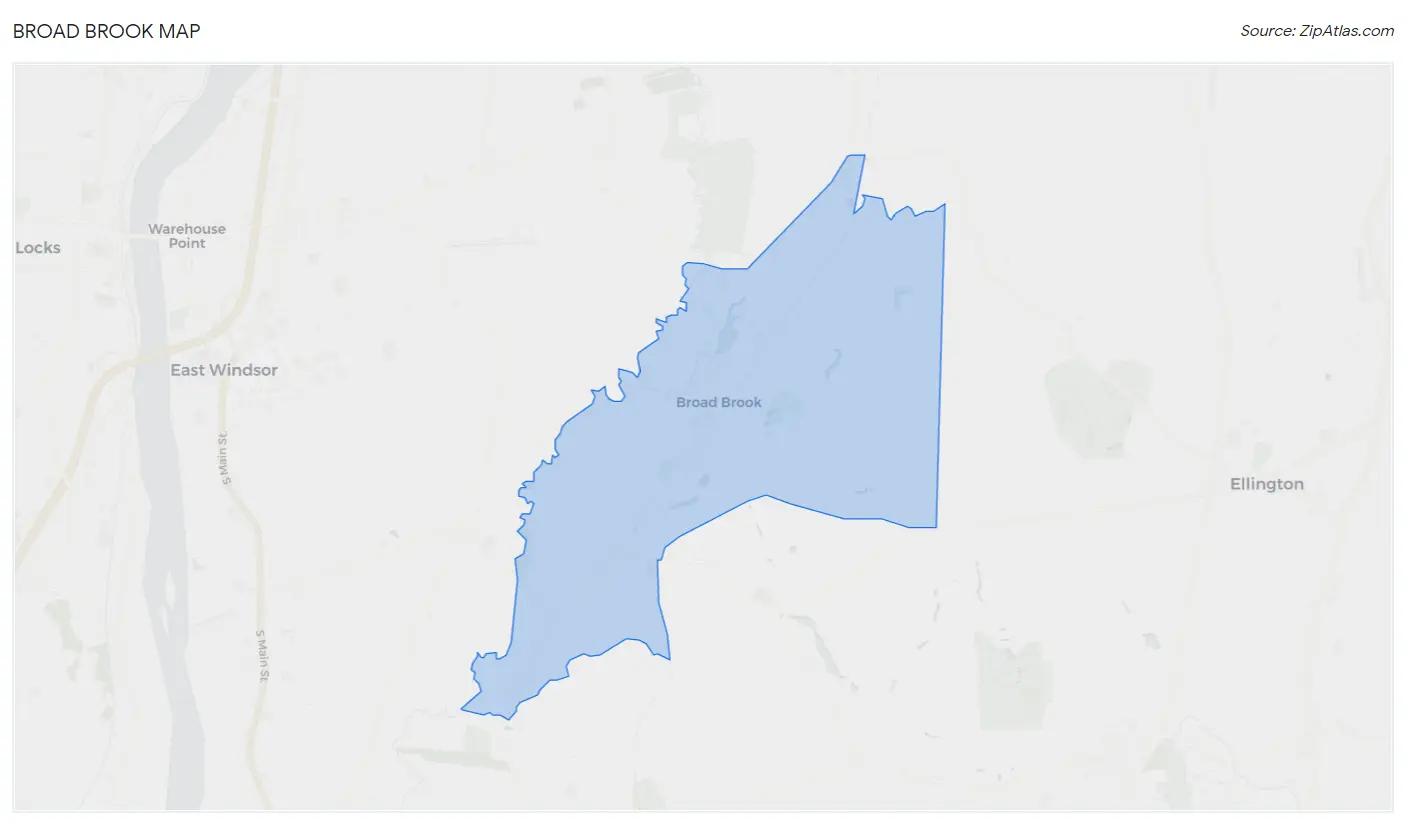
Broad Brook Overview
$40,425
PER CAPITA INCOME
$128,433
AVG FAMILY INCOME
$93,243
AVG HOUSEHOLD INCOME
41.7%
WAGE / INCOME GAP [ % ]
58.3¢/ $1
WAGE / INCOME GAP [ $ ]
$9,203
FAMILY INCOME DEFICIT
0.41
INEQUALITY / GINI INDEX
4,006
TOTAL POPULATION
1,592
MALE POPULATION
2,414
FEMALE POPULATION
65.95
MALES / 100 FEMALES
151.63
FEMALES / 100 MALES
36.9
MEDIAN AGE
3.3
AVG FAMILY SIZE
2.5
AVG HOUSEHOLD SIZE
2,176
LABOR FORCE [ PEOPLE ]
64.1%
PERCENT IN LABOR FORCE
4.1%
UNEMPLOYMENT RATE
Broad Brook Zip Codes
Broad Brook Area Codes
Income in Broad Brook
Income Overview in Broad Brook
Per Capita Income in Broad Brook is $40,425, while median incomes of families and households are $128,433 and $93,243 respectively.
| Characteristic | Number | Measure |
| Per Capita Income | 4,006 | $40,425 |
| Median Family Income | 974 | $128,433 |
| Mean Family Income | 974 | $114,631 |
| Median Household Income | 1,608 | $93,243 |
| Mean Household Income | 1,608 | $99,504 |
| Income Deficit | 974 | $9,203 |
| Wage / Income Gap (%) | 4,006 | 41.74% |
| Wage / Income Gap ($) | 4,006 | 58.26¢ per $1 |
| Gini / Inequality Index | 4,006 | 0.41 |
Earnings by Sex in Broad Brook
Average Earnings in Broad Brook are $43,188, $58,617 for men and $34,153 for women, a difference of 41.7%.
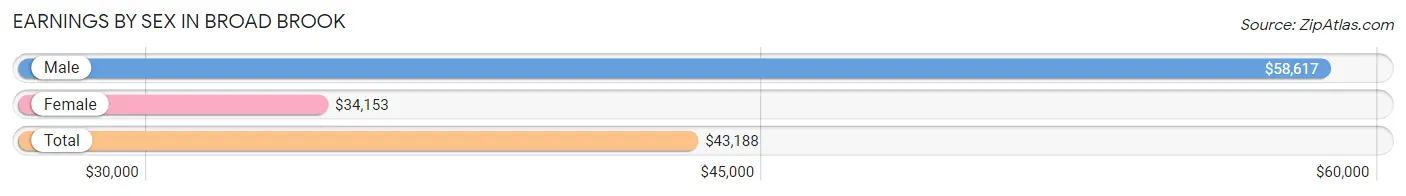
| Sex | Number | Average Earnings |
| Male | 1,039 (41.1%) | $58,617 |
| Female | 1,489 (58.9%) | $34,153 |
| Total | 2,528 (100.0%) | $43,188 |
Earnings by Sex by Income Bracket in Broad Brook
The most common earnings brackets in Broad Brook are $100,000+ for men (236 | 22.7%) and $75,000 to $99,999 for women (343 | 23.0%).
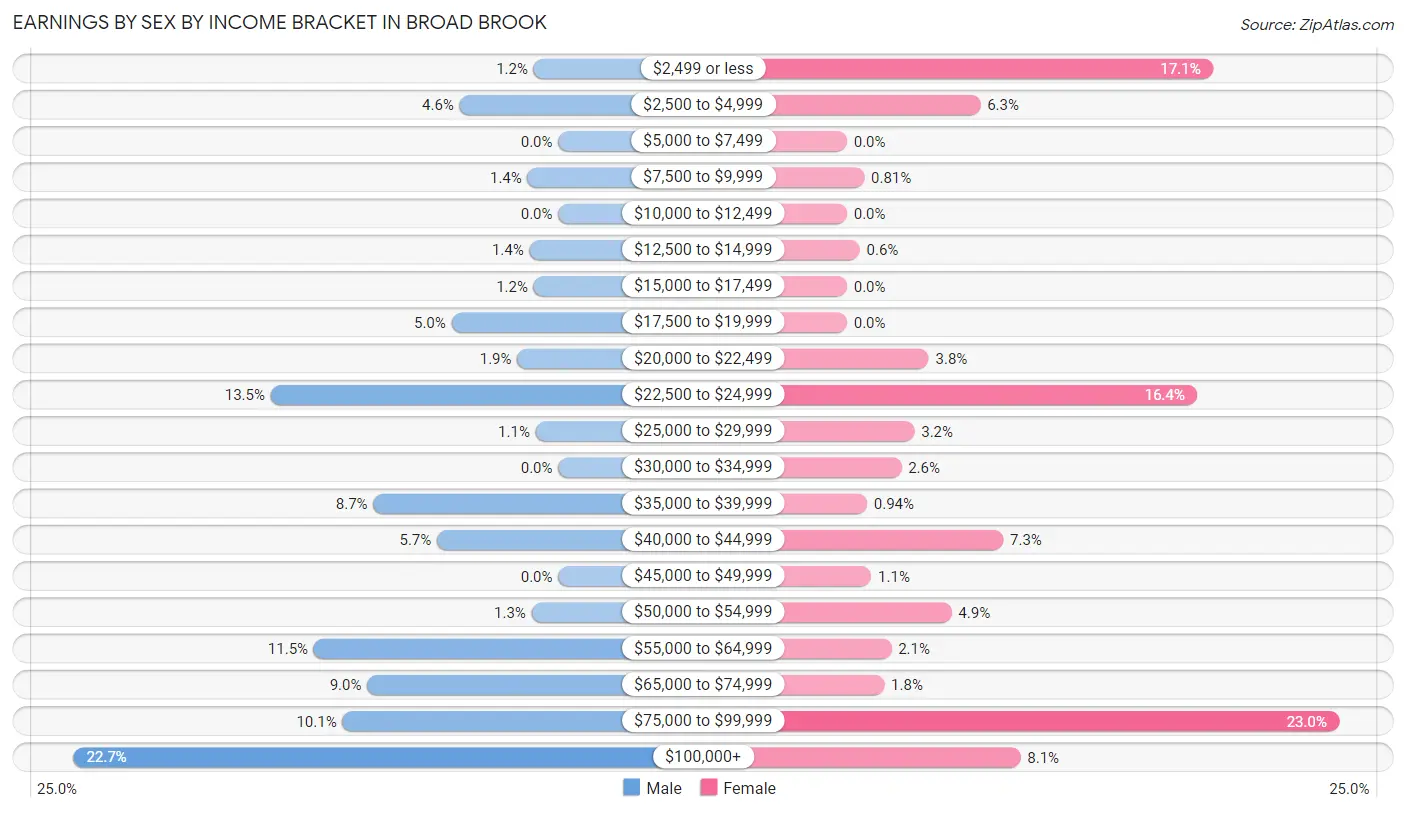
| Income | Male | Female |
| $2,499 or less | 12 (1.1%) | 255 (17.1%) |
| $2,500 to $4,999 | 48 (4.6%) | 93 (6.2%) |
| $5,000 to $7,499 | 0 (0.0%) | 0 (0.0%) |
| $7,500 to $9,999 | 15 (1.4%) | 12 (0.8%) |
| $10,000 to $12,499 | 0 (0.0%) | 0 (0.0%) |
| $12,500 to $14,999 | 14 (1.3%) | 9 (0.6%) |
| $15,000 to $17,499 | 12 (1.1%) | 0 (0.0%) |
| $17,500 to $19,999 | 52 (5.0%) | 0 (0.0%) |
| $20,000 to $22,499 | 20 (1.9%) | 57 (3.8%) |
| $22,500 to $24,999 | 140 (13.5%) | 244 (16.4%) |
| $25,000 to $29,999 | 11 (1.1%) | 47 (3.2%) |
| $30,000 to $34,999 | 0 (0.0%) | 38 (2.5%) |
| $35,000 to $39,999 | 90 (8.7%) | 14 (0.9%) |
| $40,000 to $44,999 | 59 (5.7%) | 109 (7.3%) |
| $45,000 to $49,999 | 0 (0.0%) | 17 (1.1%) |
| $50,000 to $54,999 | 13 (1.3%) | 73 (4.9%) |
| $55,000 to $64,999 | 119 (11.5%) | 31 (2.1%) |
| $65,000 to $74,999 | 93 (8.9%) | 26 (1.8%) |
| $75,000 to $99,999 | 105 (10.1%) | 343 (23.0%) |
| $100,000+ | 236 (22.7%) | 121 (8.1%) |
| Total | 1,039 (100.0%) | 1,489 (100.0%) |
Earnings by Sex by Educational Attainment in Broad Brook
Average earnings in Broad Brook are $58,883 for men and $71,538 for women, a difference of 17.7%. Men with an educational attainment of graduate degree enjoy the highest average annual earnings of $121,500, while those with college or associate's degree education earn the least with $70,734. Women with an educational attainment of graduate degree earn the most with the average annual earnings of $95,813, while those with college or associate's degree education have the smallest earnings of $34,125.
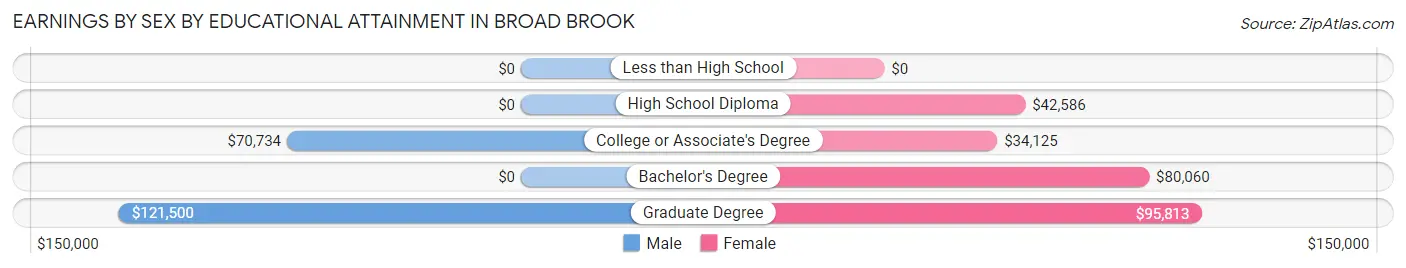
| Educational Attainment | Male Income | Female Income |
| Less than High School | - | - |
| High School Diploma | - | - |
| College or Associate's Degree | $70,734 | $34,125 |
| Bachelor's Degree | - | - |
| Graduate Degree | $121,500 | $95,813 |
| Total | $58,883 | $71,538 |
Family Income in Broad Brook
Family Income Brackets in Broad Brook
According to the Broad Brook family income data, there are 251 families falling into the $150,000 to $199,999 income range, which is the most common income bracket and makes up 25.8% of all families.
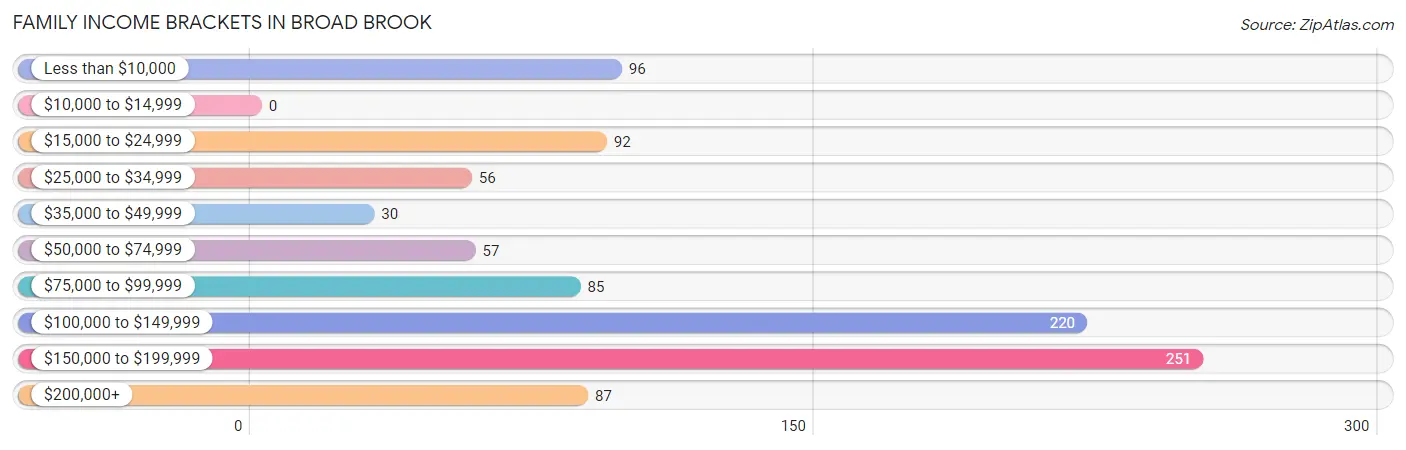
| Income Bracket | # Families | % Families |
| Less than $10,000 | 96 | 9.9% |
| $10,000 to $14,999 | 0 | 0.0% |
| $15,000 to $24,999 | 92 | 9.4% |
| $25,000 to $34,999 | 56 | 5.7% |
| $35,000 to $49,999 | 30 | 3.1% |
| $50,000 to $74,999 | 57 | 5.9% |
| $75,000 to $99,999 | 85 | 8.7% |
| $100,000 to $149,999 | 220 | 22.6% |
| $150,000 to $199,999 | 251 | 25.8% |
| $200,000+ | 87 | 8.9% |
Family Income by Famaliy Size in Broad Brook
4-person families (289 | 29.7%) account for the highest median family income in Broad Brook with $168,223 per family, while 3-person families (212 | 21.8%) have the highest median income of $51,056 per family member.
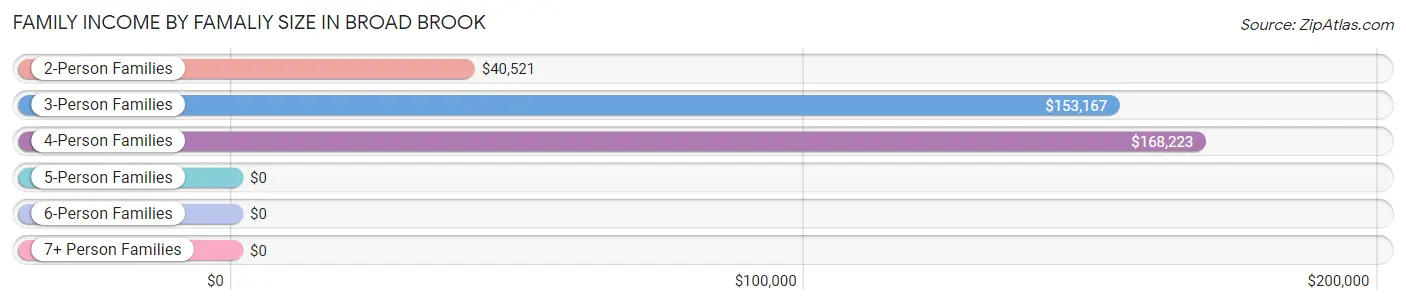
| Income Bracket | # Families | Median Income |
| 2-Person Families | 389 (39.9%) | $40,521 |
| 3-Person Families | 212 (21.8%) | $153,167 |
| 4-Person Families | 289 (29.7%) | $168,223 |
| 5-Person Families | 73 (7.5%) | $0 |
| 6-Person Families | 0 (0.0%) | $0 |
| 7+ Person Families | 11 (1.1%) | $0 |
| Total | 974 (100.0%) | $128,433 |
Family Income by Number of Earners in Broad Brook
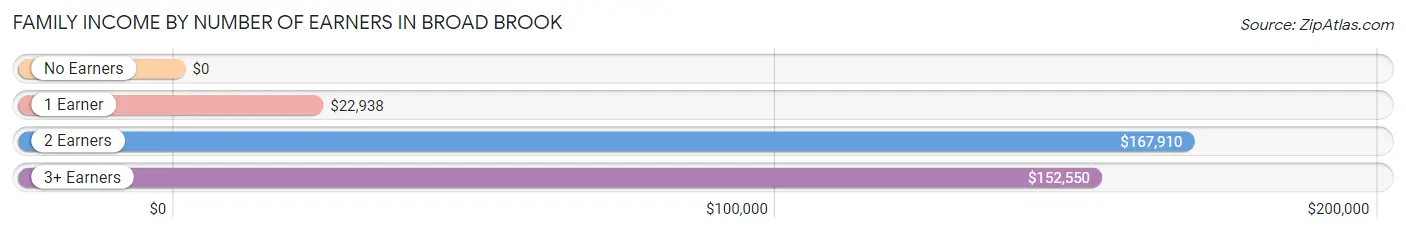
| Number of Earners | # Families | Median Income |
| No Earners | 100 (10.3%) | $0 |
| 1 Earner | 274 (28.1%) | $22,938 |
| 2 Earners | 303 (31.1%) | $167,910 |
| 3+ Earners | 297 (30.5%) | $152,550 |
| Total | 974 (100.0%) | $128,433 |
Household Income in Broad Brook
Household Income Brackets in Broad Brook
With 399 households falling in the category, the $100,000 to $149,999 income range is the most frequent in Broad Brook, accounting for 24.8% of all households.
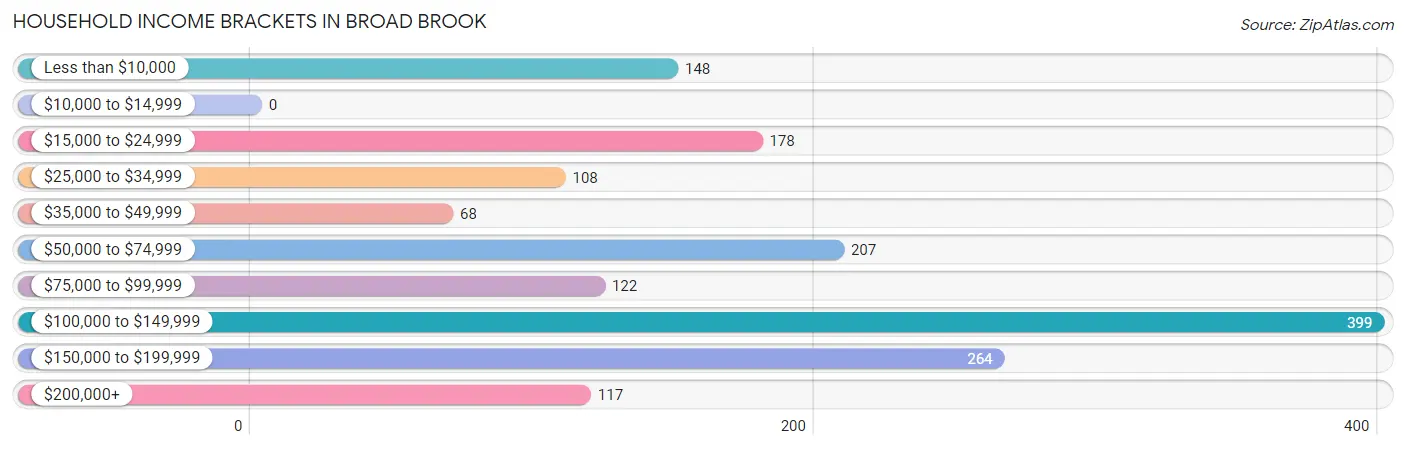
| Income Bracket | # Households | % Households |
| Less than $10,000 | 148 | 9.2% |
| $10,000 to $14,999 | 0 | 0.0% |
| $15,000 to $24,999 | 178 | 11.1% |
| $25,000 to $34,999 | 108 | 6.7% |
| $35,000 to $49,999 | 68 | 4.2% |
| $50,000 to $74,999 | 207 | 12.9% |
| $75,000 to $99,999 | 122 | 7.6% |
| $100,000 to $149,999 | 399 | 24.8% |
| $150,000 to $199,999 | 264 | 16.4% |
| $200,000+ | 117 | 7.3% |
Household Income by Householder Age in Broad Brook
The median household income in Broad Brook is $93,243, with the highest median household income of $128,591 found in the 45 to 64 years age bracket for the primary householder. A total of 772 households (48.0%) fall into this category. Meanwhile, the 15 to 24 years age bracket for the primary householder has the lowest median household income of $0, with 43 households (2.7%) in this group.
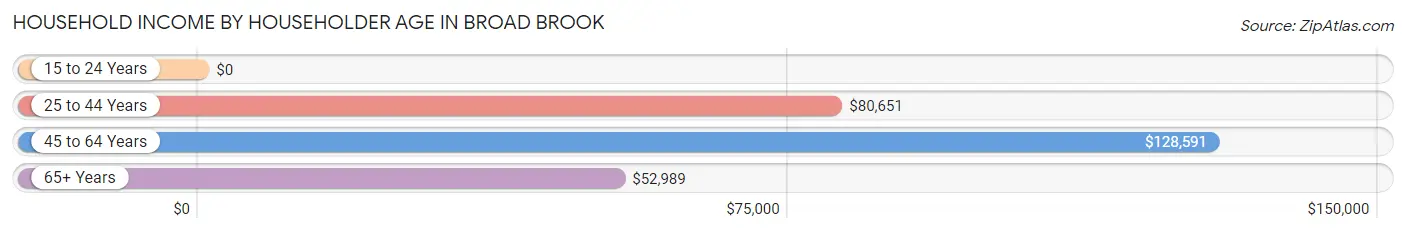
| Income Bracket | # Households | Median Income |
| 15 to 24 Years | 43 (2.7%) | $0 |
| 25 to 44 Years | 356 (22.1%) | $80,651 |
| 45 to 64 Years | 772 (48.0%) | $128,591 |
| 65+ Years | 437 (27.2%) | $52,989 |
| Total | 1,608 (100.0%) | $93,243 |
Poverty in Broad Brook
Income Below Poverty by Sex and Age in Broad Brook
With 14.4% poverty level for males and 13.7% for females among the residents of Broad Brook, 15 year old males and 12 to 14 year old females are the most vulnerable to poverty, with 18 males (100.0%) and 19 females (100.0%) in their respective age groups living below the poverty level.
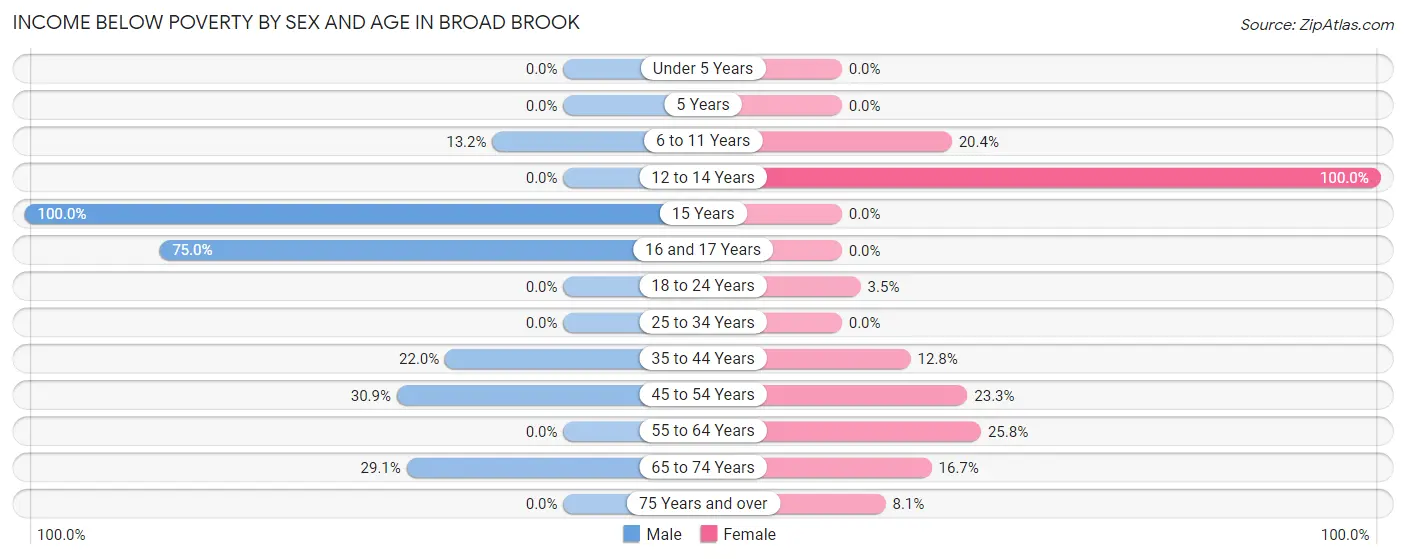
| Age Bracket | Male | Female |
| Under 5 Years | 0 (0.0%) | 0 (0.0%) |
| 5 Years | 0 (0.0%) | 0 (0.0%) |
| 6 to 11 Years | 19 (13.2%) | 40 (20.4%) |
| 12 to 14 Years | 0 (0.0%) | 19 (100.0%) |
| 15 Years | 18 (100.0%) | 0 (0.0%) |
| 16 and 17 Years | 63 (75.0%) | 0 (0.0%) |
| 18 to 24 Years | 0 (0.0%) | 14 (3.5%) |
| 25 to 34 Years | 0 (0.0%) | 0 (0.0%) |
| 35 to 44 Years | 18 (22.0%) | 18 (12.8%) |
| 45 to 54 Years | 64 (30.9%) | 55 (23.3%) |
| 55 to 64 Years | 0 (0.0%) | 139 (25.8%) |
| 65 to 74 Years | 48 (29.1%) | 32 (16.7%) |
| 75 Years and over | 0 (0.0%) | 13 (8.1%) |
| Total | 230 (14.4%) | 330 (13.7%) |
Income Above Poverty by Sex and Age in Broad Brook
According to the poverty statistics in Broad Brook, males aged under 5 years and females aged under 5 years are the age groups that are most secure financially, with 100.0% of males and 100.0% of females in these age groups living above the poverty line.
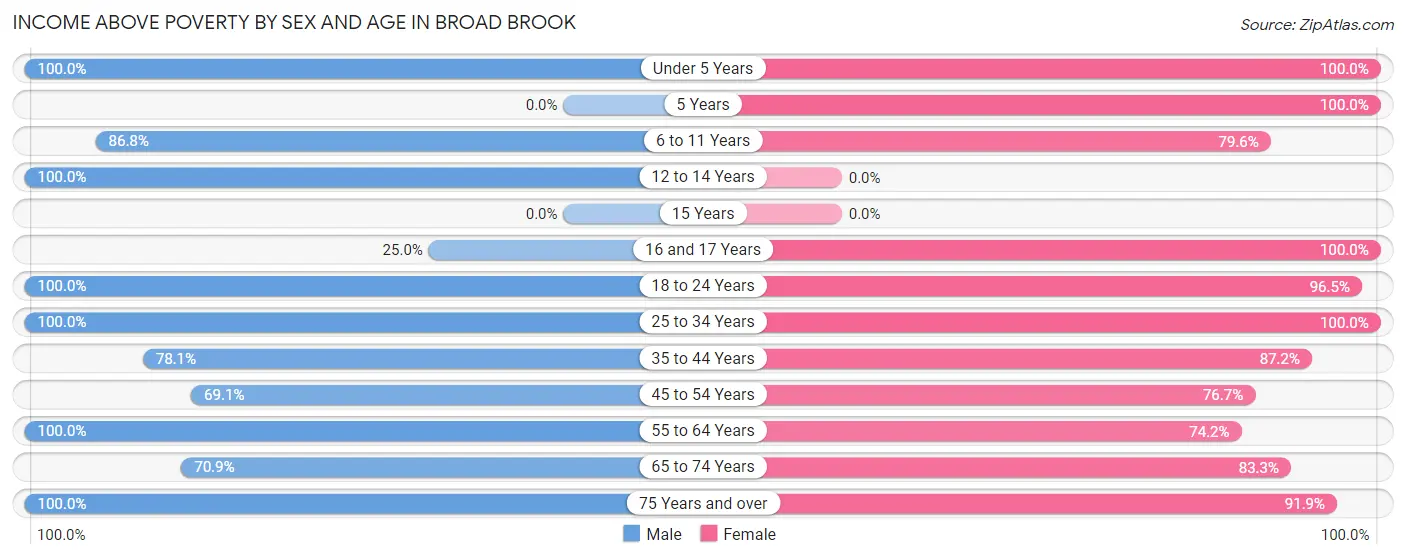
| Age Bracket | Male | Female |
| Under 5 Years | 42 (100.0%) | 71 (100.0%) |
| 5 Years | 0 (0.0%) | 62 (100.0%) |
| 6 to 11 Years | 125 (86.8%) | 156 (79.6%) |
| 12 to 14 Years | 58 (100.0%) | 0 (0.0%) |
| 15 Years | 0 (0.0%) | 0 (0.0%) |
| 16 and 17 Years | 21 (25.0%) | 151 (100.0%) |
| 18 to 24 Years | 102 (100.0%) | 386 (96.5%) |
| 25 to 34 Years | 335 (100.0%) | 244 (100.0%) |
| 35 to 44 Years | 64 (78.0%) | 123 (87.2%) |
| 45 to 54 Years | 143 (69.1%) | 181 (76.7%) |
| 55 to 64 Years | 259 (100.0%) | 399 (74.2%) |
| 65 to 74 Years | 117 (70.9%) | 160 (83.3%) |
| 75 Years and over | 96 (100.0%) | 147 (91.9%) |
| Total | 1,362 (85.6%) | 2,080 (86.3%) |
Income Below Poverty Among Married-Couple Families in Broad Brook
The poverty statistics for married-couple families in Broad Brook show that 25.0% or 159 of the total 637 families live below the poverty line. Families with 5 or more children have the highest poverty rate of 100.0%, comprising of 11 families. On the other hand, families with 1 or 2 children have the lowest poverty rate of 17.1%, which includes 52 families.
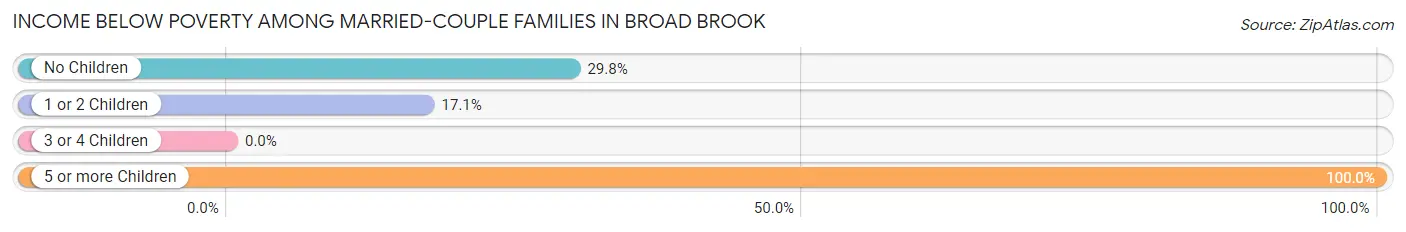
| Children | Above Poverty | Below Poverty |
| No Children | 226 (70.2%) | 96 (29.8%) |
| 1 or 2 Children | 252 (82.9%) | 52 (17.1%) |
| 3 or 4 Children | 0 (0.0%) | 0 (0.0%) |
| 5 or more Children | 0 (0.0%) | 11 (100.0%) |
| Total | 478 (75.0%) | 159 (25.0%) |
Income Below Poverty Among Single-Parent Households in Broad Brook
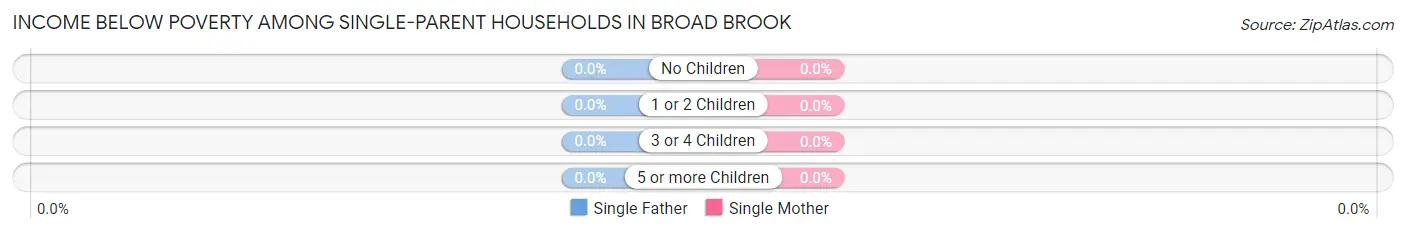
| Children | Single Father | Single Mother |
| No Children | 0 (0.0%) | 0 (0.0%) |
| 1 or 2 Children | 0 (0.0%) | 0 (0.0%) |
| 3 or 4 Children | 0 (0.0%) | 0 (0.0%) |
| 5 or more Children | 0 (0.0%) | 0 (0.0%) |
| Total | 0 (0.0%) | 0 (0.0%) |
Income Below Poverty Among Married-Couple vs Single-Parent Households in Broad Brook
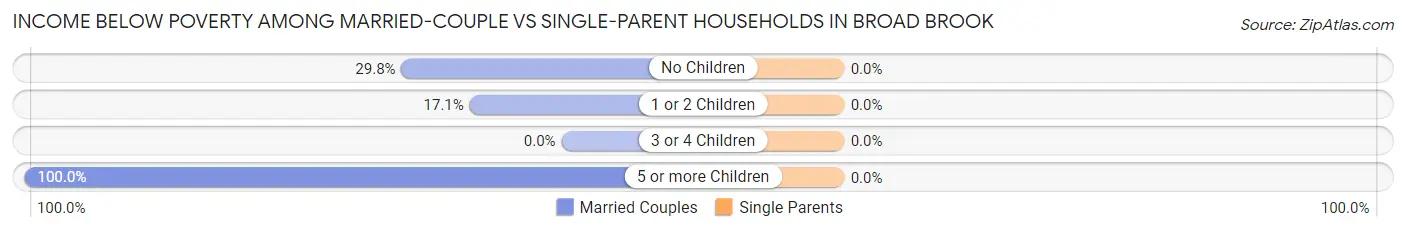
| Children | Married-Couple Families | Single-Parent Households |
| No Children | 96 (29.8%) | 0 (0.0%) |
| 1 or 2 Children | 52 (17.1%) | 0 (0.0%) |
| 3 or 4 Children | 0 (0.0%) | 0 (0.0%) |
| 5 or more Children | 11 (100.0%) | 0 (0.0%) |
| Total | 159 (25.0%) | 0 (0.0%) |
Race in Broad Brook
The most populous races in Broad Brook are White / Caucasian (2,509 | 62.6%), Black / African American (710 | 17.7%), and Hispanic or Latino (483 | 12.1%).
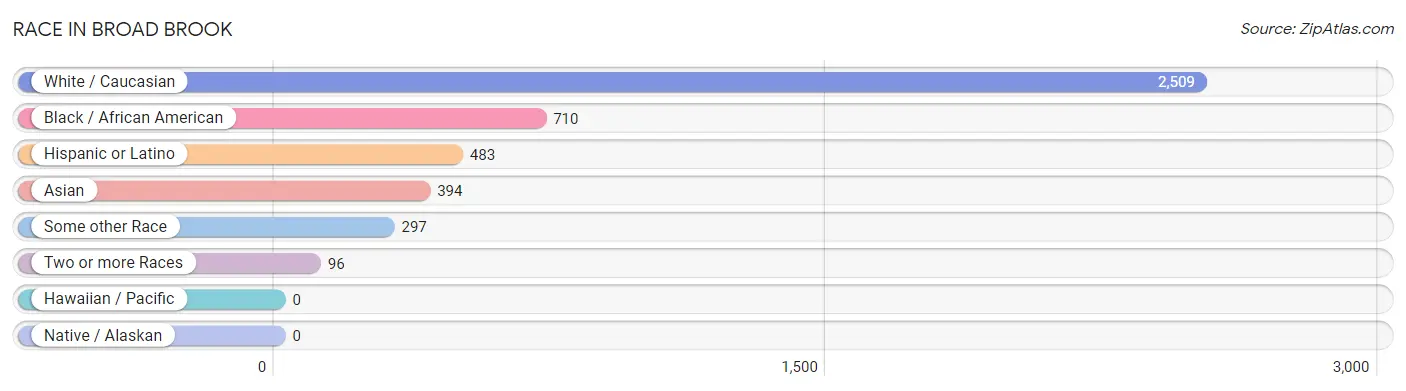
| Race | # Population | % Population |
| Asian | 394 | 9.8% |
| Black / African American | 710 | 17.7% |
| Hawaiian / Pacific | 0 | 0.0% |
| Hispanic or Latino | 483 | 12.1% |
| Native / Alaskan | 0 | 0.0% |
| White / Caucasian | 2,509 | 62.6% |
| Two or more Races | 96 | 2.4% |
| Some other Race | 297 | 7.4% |
| Total | 4,006 | 100.0% |
Ancestry in Broad Brook
The most populous ancestries reported in Broad Brook are Irish (1,341 | 33.5%), Italian (727 | 18.1%), German (491 | 12.3%), Jamaican (356 | 8.9%), and Russian (311 | 7.8%), together accounting for 80.5% of all Broad Brook residents.
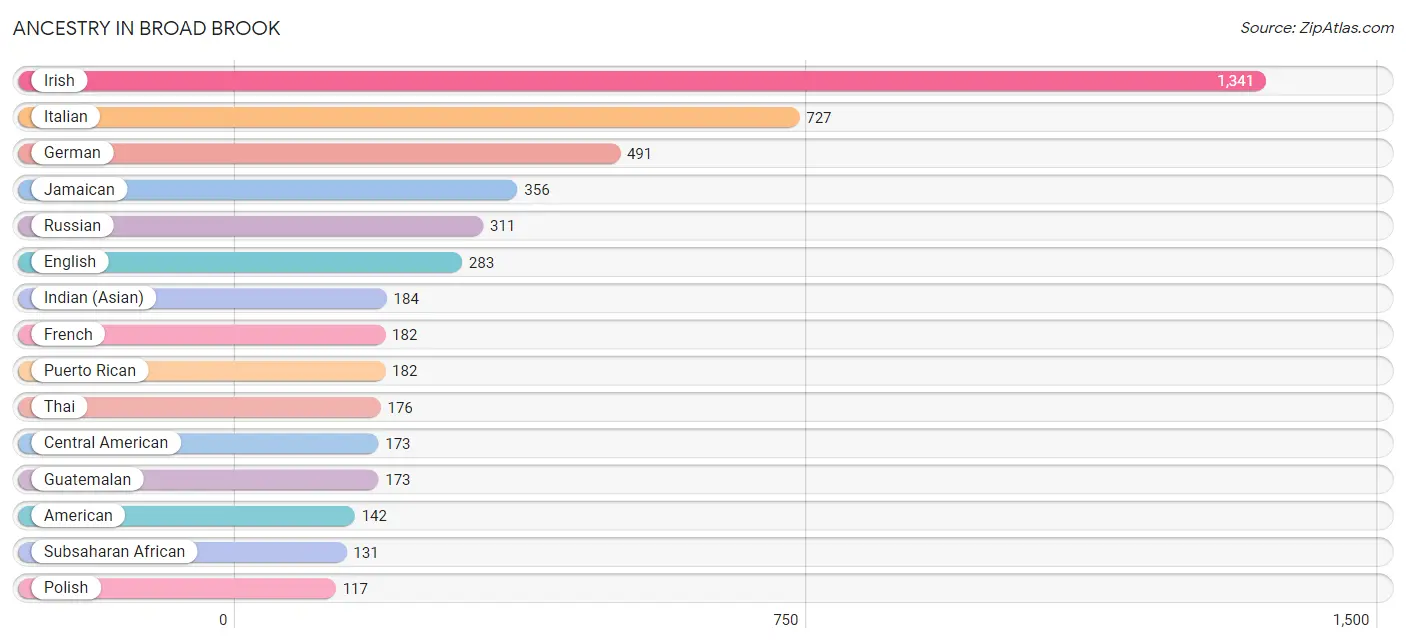
| Ancestry | # Population | % Population |
| African | 75 | 1.9% |
| American | 142 | 3.5% |
| British | 18 | 0.4% |
| Burmese | 33 | 0.8% |
| Canadian | 21 | 0.5% |
| Celtic | 12 | 0.3% |
| Central American | 173 | 4.3% |
| Colombian | 65 | 1.6% |
| Croatian | 54 | 1.3% |
| Danish | 101 | 2.5% |
| Dutch | 15 | 0.4% |
| Eastern European | 35 | 0.9% |
| English | 283 | 7.1% |
| European | 12 | 0.3% |
| French | 182 | 4.5% |
| French American Indian | 46 | 1.1% |
| French Canadian | 62 | 1.5% |
| German | 491 | 12.3% |
| Greek | 45 | 1.1% |
| Guatemalan | 173 | 4.3% |
| Guyanese | 96 | 2.4% |
| Indian (Asian) | 184 | 4.6% |
| Irish | 1,341 | 33.5% |
| Italian | 727 | 18.1% |
| Jamaican | 356 | 8.9% |
| Korean | 1 | 0.0% |
| Lithuanian | 22 | 0.5% |
| Mexican | 31 | 0.8% |
| Nigerian | 56 | 1.4% |
| Polish | 117 | 2.9% |
| Portuguese | 22 | 0.5% |
| Puerto Rican | 182 | 4.5% |
| Russian | 311 | 7.8% |
| Scottish | 75 | 1.9% |
| South American | 66 | 1.7% |
| Subsaharan African | 131 | 3.3% |
| Thai | 176 | 4.4% | View All 37 Rows |
Immigrants in Broad Brook
The most numerous immigrant groups reported in Broad Brook came from Latin America (596 | 14.9%), Caribbean (216 | 5.4%), Jamaica (216 | 5.4%), South America (207 | 5.2%), and Central America (173 | 4.3%), together accounting for 35.2% of all Broad Brook residents.
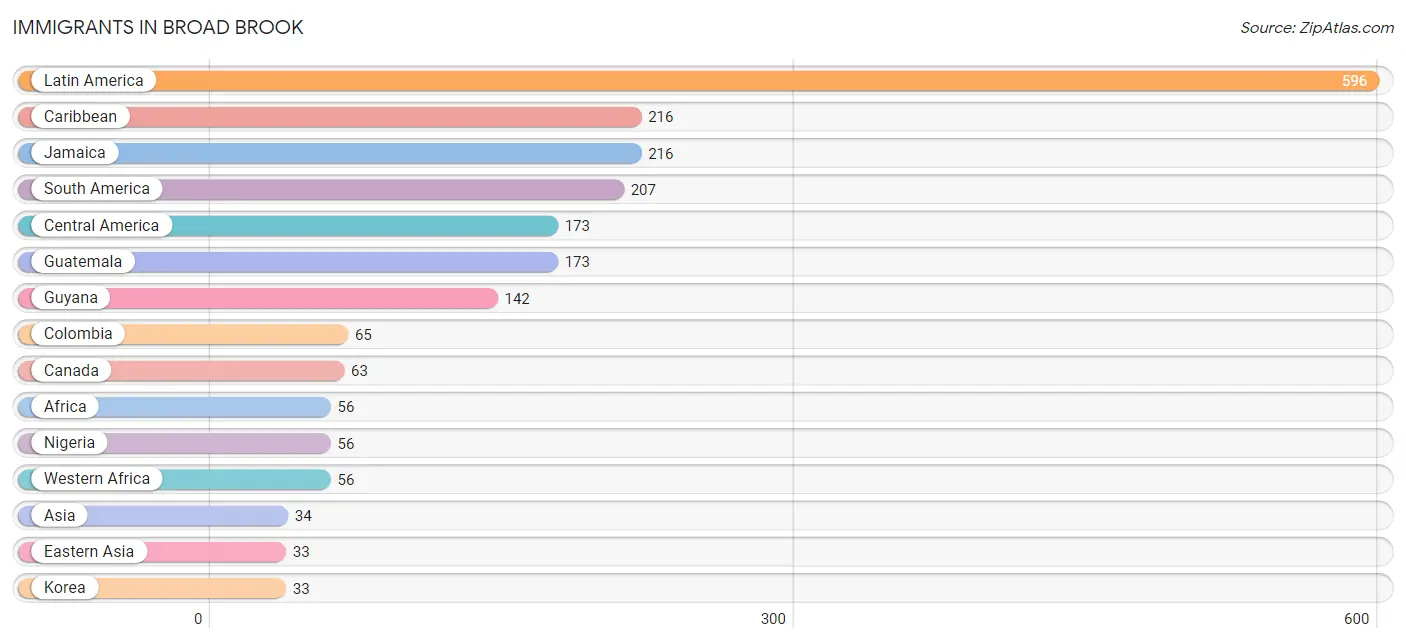
| Immigration Origin | # Population | % Population |
| Africa | 56 | 1.4% |
| Asia | 34 | 0.9% |
| Canada | 63 | 1.6% |
| Caribbean | 216 | 5.4% |
| Central America | 173 | 4.3% |
| Colombia | 65 | 1.6% |
| Eastern Asia | 33 | 0.8% |
| Eastern Europe | 12 | 0.3% |
| Europe | 12 | 0.3% |
| Guatemala | 173 | 4.3% |
| Guyana | 142 | 3.5% |
| Jamaica | 216 | 5.4% |
| Korea | 33 | 0.8% |
| Latin America | 596 | 14.9% |
| Nigeria | 56 | 1.4% |
| Philippines | 1 | 0.0% |
| Russia | 12 | 0.3% |
| South America | 207 | 5.2% |
| South Eastern Asia | 1 | 0.0% |
| Western Africa | 56 | 1.4% | View All 20 Rows |
Sex and Age in Broad Brook
Sex and Age in Broad Brook
The most populous age groups in Broad Brook are 25 to 29 Years (224 | 14.1%) for men and 55 to 59 Years (358 | 14.8%) for women.
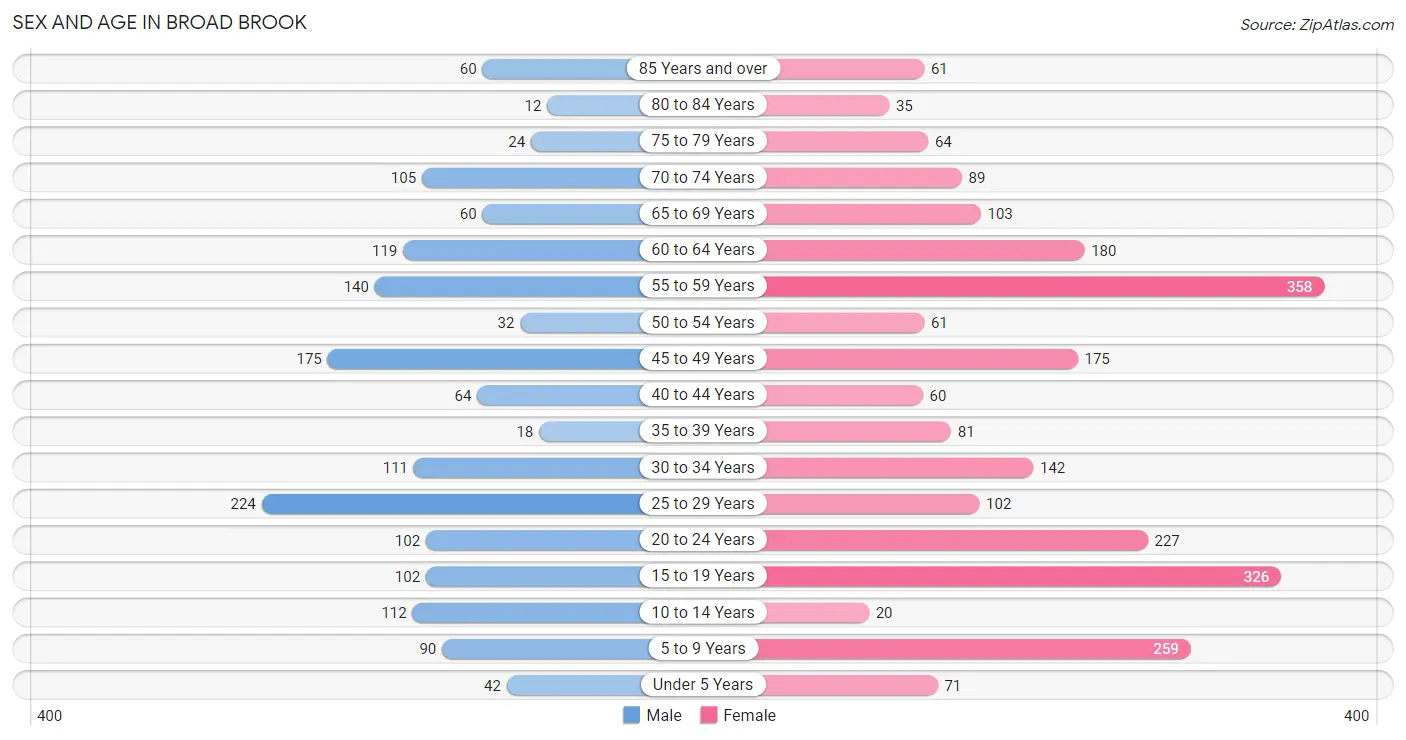
| Age Bracket | Male | Female |
| Under 5 Years | 42 (2.6%) | 71 (2.9%) |
| 5 to 9 Years | 90 (5.7%) | 259 (10.7%) |
| 10 to 14 Years | 112 (7.0%) | 20 (0.8%) |
| 15 to 19 Years | 102 (6.4%) | 326 (13.5%) |
| 20 to 24 Years | 102 (6.4%) | 227 (9.4%) |
| 25 to 29 Years | 224 (14.1%) | 102 (4.2%) |
| 30 to 34 Years | 111 (7.0%) | 142 (5.9%) |
| 35 to 39 Years | 18 (1.1%) | 81 (3.4%) |
| 40 to 44 Years | 64 (4.0%) | 60 (2.5%) |
| 45 to 49 Years | 175 (11.0%) | 175 (7.2%) |
| 50 to 54 Years | 32 (2.0%) | 61 (2.5%) |
| 55 to 59 Years | 140 (8.8%) | 358 (14.8%) |
| 60 to 64 Years | 119 (7.5%) | 180 (7.5%) |
| 65 to 69 Years | 60 (3.8%) | 103 (4.3%) |
| 70 to 74 Years | 105 (6.6%) | 89 (3.7%) |
| 75 to 79 Years | 24 (1.5%) | 64 (2.6%) |
| 80 to 84 Years | 12 (0.7%) | 35 (1.5%) |
| 85 Years and over | 60 (3.8%) | 61 (2.5%) |
| Total | 1,592 (100.0%) | 2,414 (100.0%) |
Families and Households in Broad Brook
Median Family Size in Broad Brook
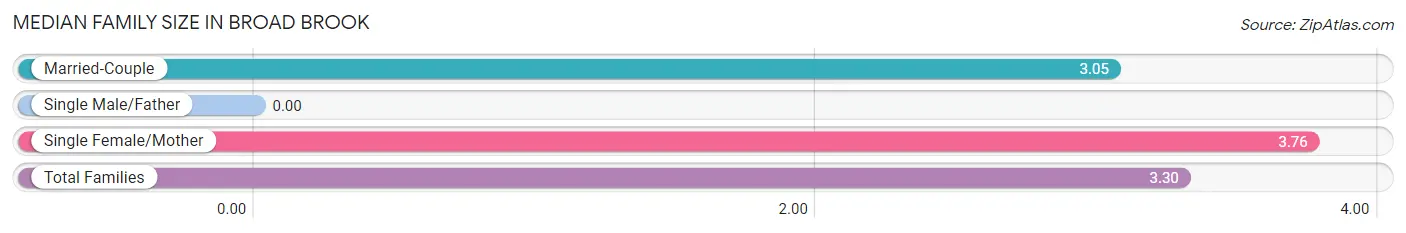
| Family Type | # Families | Family Size |
| Married-Couple | 637 (65.4%) | 3.05 |
| Single Male/Father | 0 (0.0%) | - |
| Single Female/Mother | 337 (34.6%) | 3.76 |
| Total Families | 974 (100.0%) | 3.30 |
Median Household Size in Broad Brook
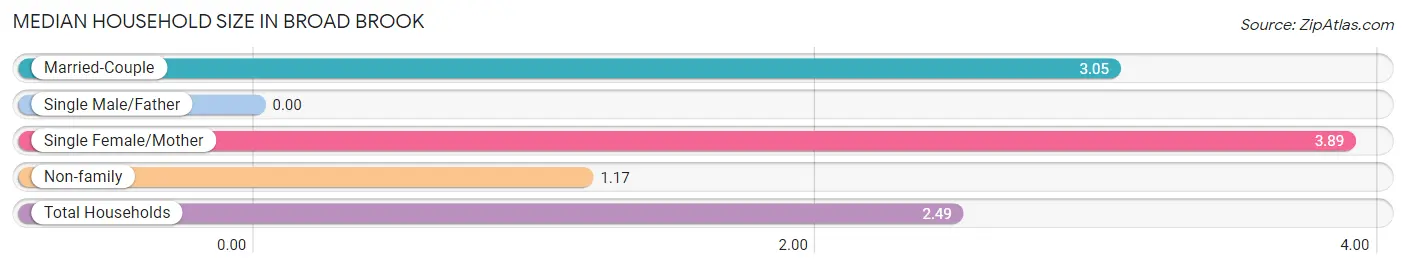
| Household Type | # Households | Household Size |
| Married-Couple | 637 (39.6%) | 3.05 |
| Single Male/Father | 0 (0.0%) | - |
| Single Female/Mother | 337 (21.0%) | 3.89 |
| Non-family | 634 (39.4%) | 1.17 |
| Total Households | 1,608 (100.0%) | 2.49 |
Household Size by Marriage Status in Broad Brook
Out of a total of 1,608 households in Broad Brook, 974 (60.6%) are family households, while 634 (39.4%) are nonfamily households. The most numerous type of family households are 2-person households, comprising 357, and the most common type of nonfamily households are 1-person households, comprising 525.
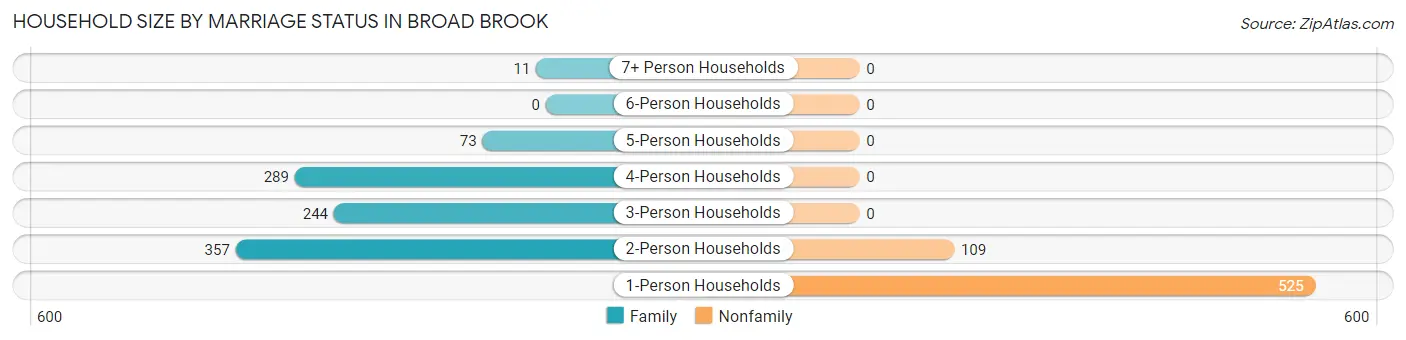
| Household Size | Family Households | Nonfamily Households |
| 1-Person Households | - | 525 (32.7%) |
| 2-Person Households | 357 (22.2%) | 109 (6.8%) |
| 3-Person Households | 244 (15.2%) | 0 (0.0%) |
| 4-Person Households | 289 (18.0%) | 0 (0.0%) |
| 5-Person Households | 73 (4.5%) | 0 (0.0%) |
| 6-Person Households | 0 (0.0%) | 0 (0.0%) |
| 7+ Person Households | 11 (0.7%) | 0 (0.0%) |
| Total | 974 (60.6%) | 634 (39.4%) |
Female Fertility in Broad Brook
Fertility by Age in Broad Brook
Average fertility rate in Broad Brook is 65.0 births per 1,000 women. Women in the age bracket of 20 to 34 years have the highest fertility rate with 155.0 births per 1,000 women. Women in the age bracket of 20 to 34 years acount for 100.0% of all women with births.
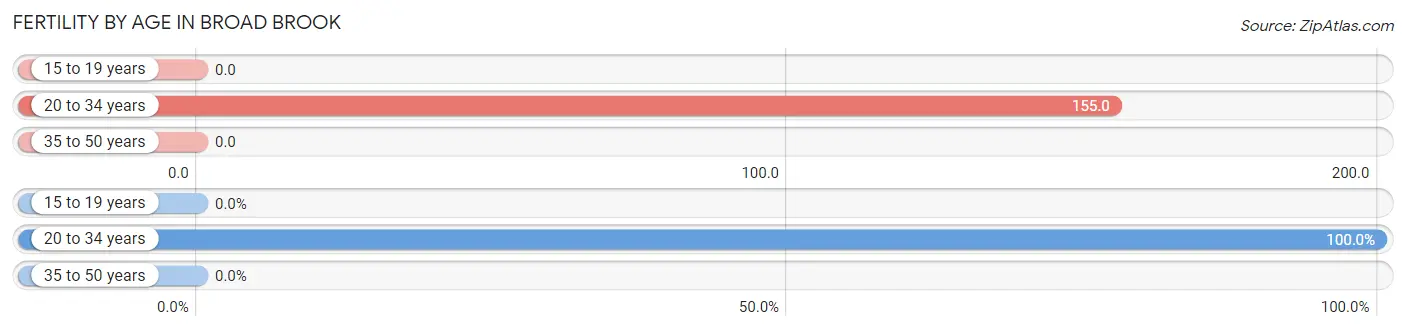
| Age Bracket | Women with Births | Births / 1,000 Women |
| 15 to 19 years | 0 (0.0%) | 0.0 |
| 20 to 34 years | 73 (100.0%) | 155.0 |
| 35 to 50 years | 0 (0.0%) | 0.0 |
| Total | 73 (100.0%) | 65.0 |
Fertility by Age by Marriage Status in Broad Brook
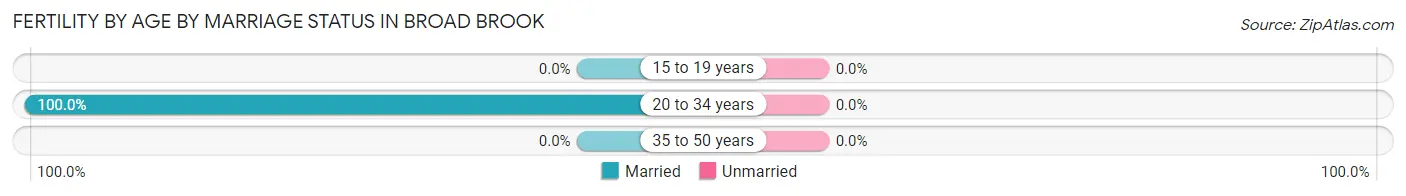
| Age Bracket | Married | Unmarried |
| 15 to 19 years | 0 (0.0%) | 0 (0.0%) |
| 20 to 34 years | 73 (100.0%) | 0 (0.0%) |
| 35 to 50 years | 0 (0.0%) | 0 (0.0%) |
| Total | 73 (100.0%) | 0 (0.0%) |
Fertility by Education in Broad Brook
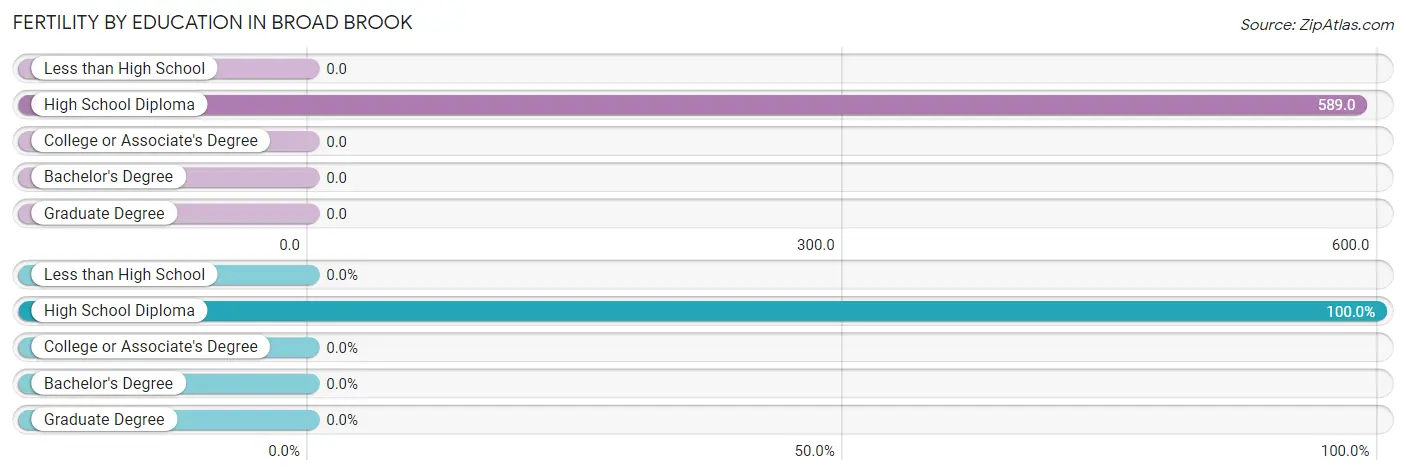
| Educational Attainment | Women with Births | Births / 1,000 Women |
| Less than High School | 0 (0.0%) | 0.0 |
| High School Diploma | 73 (100.0%) | 589.0 |
| College or Associate's Degree | 0 (0.0%) | 0.0 |
| Bachelor's Degree | 0 (0.0%) | 0.0 |
| Graduate Degree | 0 (0.0%) | 0.0 |
| Total | 73 (100.0%) | 65.0 |
Fertility by Education by Marriage Status in Broad Brook
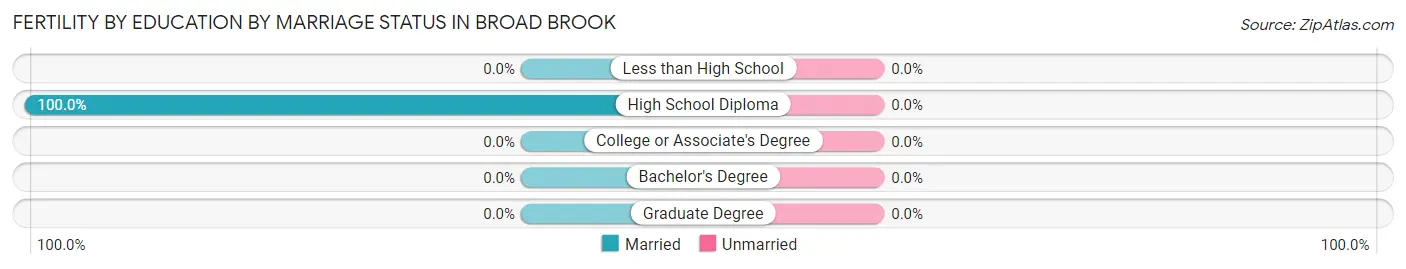
| Educational Attainment | Married | Unmarried |
| Less than High School | 0 (0.0%) | 0 (0.0%) |
| High School Diploma | 73 (100.0%) | 0 (0.0%) |
| College or Associate's Degree | 0 (0.0%) | 0 (0.0%) |
| Bachelor's Degree | 0 (0.0%) | 0 (0.0%) |
| Graduate Degree | 0 (0.0%) | 0 (0.0%) |
| Total | 73 (100.0%) | 0 (0.0%) |
Employment Characteristics in Broad Brook
Employment by Class of Employer in Broad Brook
Among the 2,014 employed individuals in Broad Brook, private company employees (1,453 | 72.1%), local government employees (279 | 13.9%), and not-for-profit organizations (173 | 8.6%) make up the most common classes of employment.
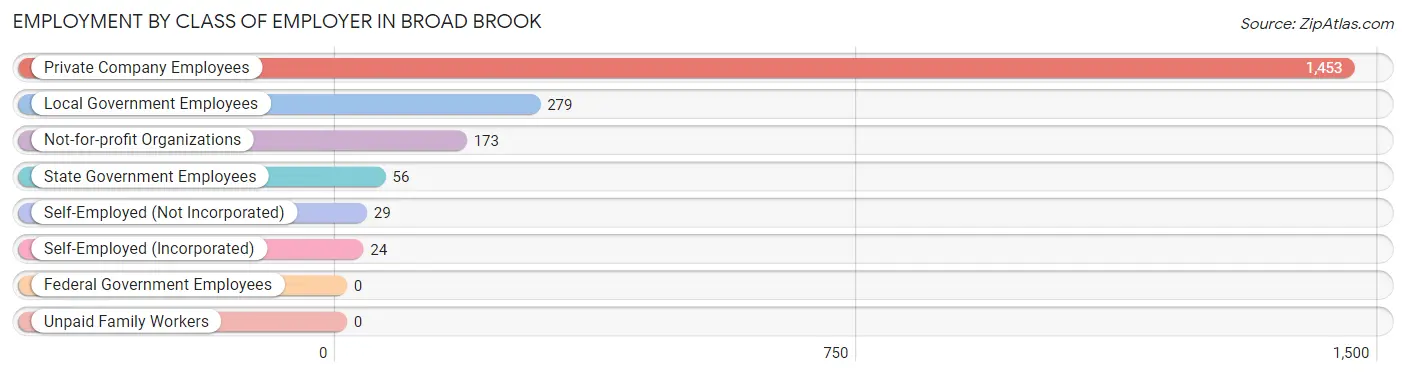
| Employer Class | # Employees | % Employees |
| Private Company Employees | 1,453 | 72.1% |
| Self-Employed (Incorporated) | 24 | 1.2% |
| Self-Employed (Not Incorporated) | 29 | 1.4% |
| Not-for-profit Organizations | 173 | 8.6% |
| Local Government Employees | 279 | 13.9% |
| State Government Employees | 56 | 2.8% |
| Federal Government Employees | 0 | 0.0% |
| Unpaid Family Workers | 0 | 0.0% |
| Total | 2,014 | 100.0% |
Employment Status by Age in Broad Brook
According to the labor force statistics for Broad Brook, out of the total population over 16 years of age (3,394), 64.1% or 2,176 individuals are in the labor force, with 4.1% or 89 of them unemployed. The age group with the highest labor force participation rate is 25 to 29 years, with 100.0% or 326 individuals in the labor force. Within the labor force, the 16 to 19 years age range has the highest percentage of unemployed individuals, with 100.0% or 72 of them being unemployed.
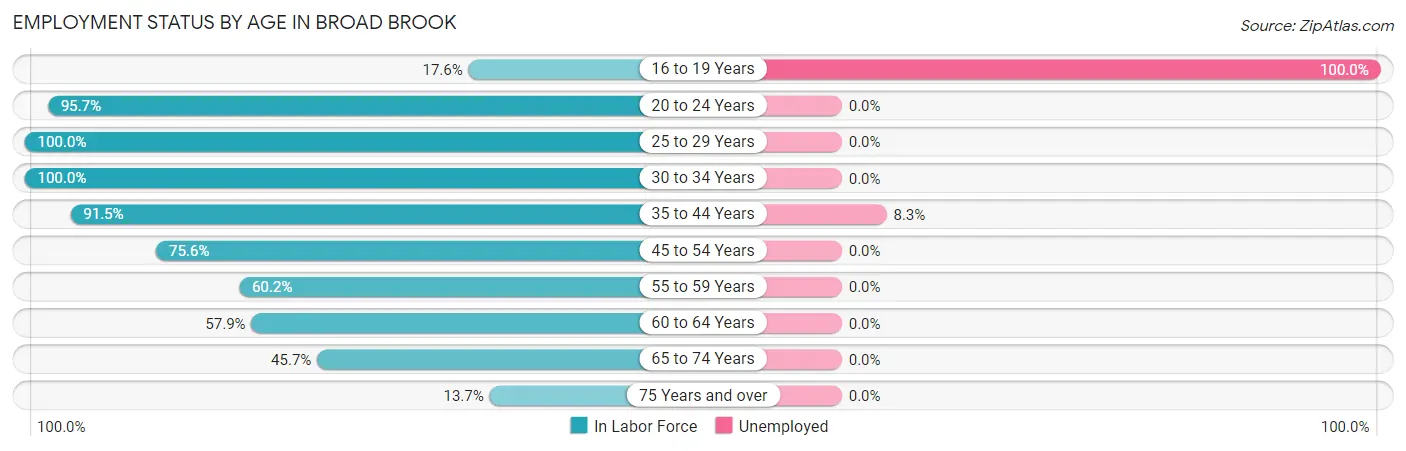
| Age Bracket | In Labor Force | Unemployed |
| 16 to 19 Years | 72 (17.6%) | 72 (100.0%) |
| 20 to 24 Years | 315 (95.7%) | 0 (0.0%) |
| 25 to 29 Years | 326 (100.0%) | 0 (0.0%) |
| 30 to 34 Years | 253 (100.0%) | 0 (0.0%) |
| 35 to 44 Years | 204 (91.5%) | 17 (8.3%) |
| 45 to 54 Years | 335 (75.6%) | 0 (0.0%) |
| 55 to 59 Years | 300 (60.2%) | 0 (0.0%) |
| 60 to 64 Years | 173 (57.9%) | 0 (0.0%) |
| 65 to 74 Years | 163 (45.7%) | 0 (0.0%) |
| 75 Years and over | 35 (13.7%) | 0 (0.0%) |
| Total | 2,176 (64.1%) | 89 (4.1%) |
Employment Status by Educational Attainment in Broad Brook
According to labor force statistics for Broad Brook, 77.9% of individuals (1,591) out of the total population between 25 and 64 years of age (2,042) are in the labor force, with 1.1% or 18 of them being unemployed. The group with the highest labor force participation rate are those with the educational attainment of bachelor's degree or higher, with 87.1% or 928 individuals in the labor force. Within the labor force, individuals with college / associate degree education have the highest percentage of unemployment, with 6.2% or 17 of them being unemployed.
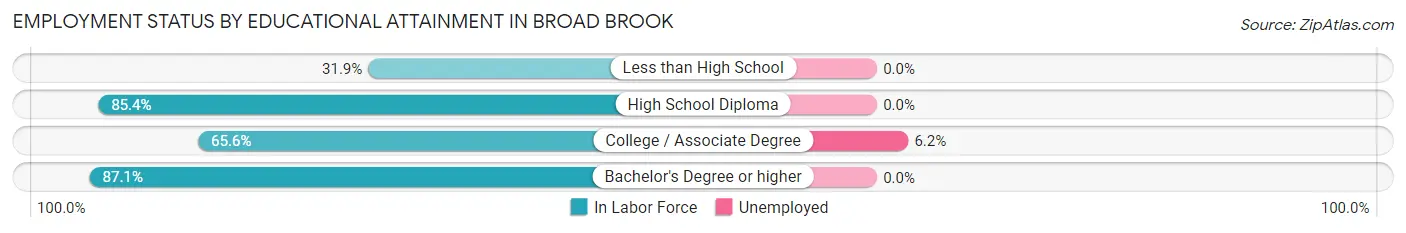
| Educational Attainment | In Labor Force | Unemployed |
| Less than High School | 53 (31.9%) | 0 (0.0%) |
| High School Diploma | 334 (85.4%) | 0 (0.0%) |
| College / Associate Degree | 275 (65.6%) | 26 (6.2%) |
| Bachelor's Degree or higher | 928 (87.1%) | 0 (0.0%) |
| Total | 1,591 (77.9%) | 22 (1.1%) |
Employment Occupations by Sex in Broad Brook
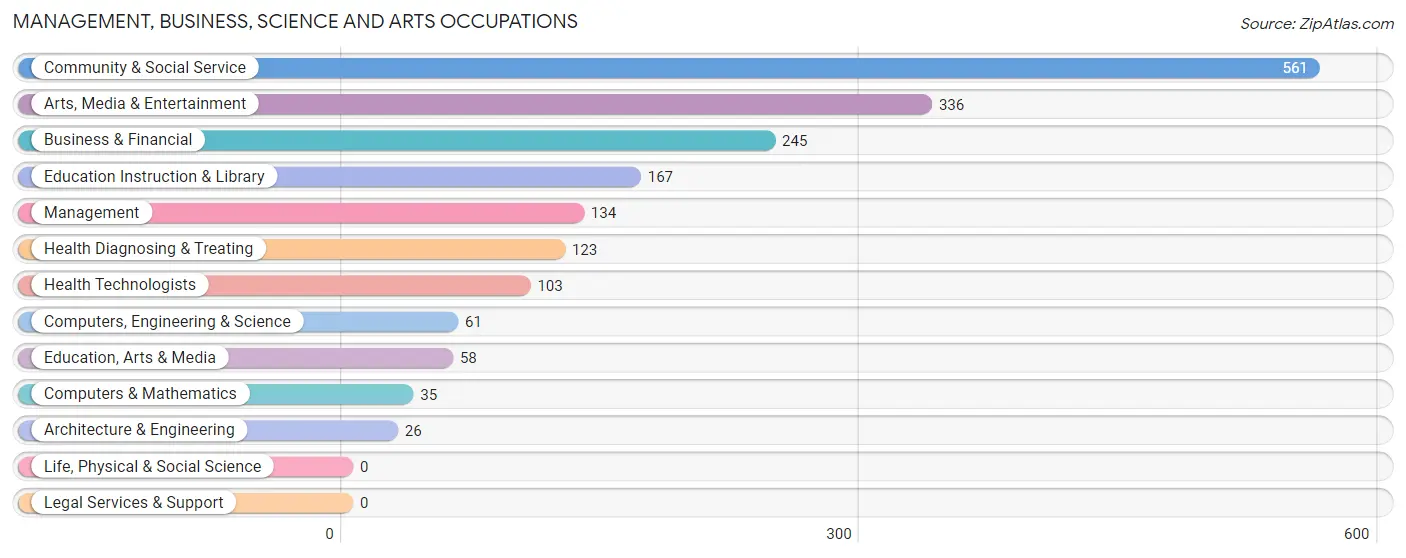
Management, Business, Science and Arts Occupations
The most common Management, Business, Science and Arts occupations in Broad Brook are Community & Social Service (561 | 26.9%), Arts, Media & Entertainment (336 | 16.1%), Business & Financial (245 | 11.7%), Education Instruction & Library (167 | 8.0%), and Management (134 | 6.4%).
Management, Business, Science and Arts Occupations by Sex
Within the Management, Business, Science and Arts occupations in Broad Brook, the most male-oriented occupations are Management (95.5%), Computers & Mathematics (65.7%), and Arts, Media & Entertainment (62.5%), while the most female-oriented occupations are Education Instruction & Library (100.0%), Health Diagnosing & Treating (90.2%), and Business & Financial (89.0%).
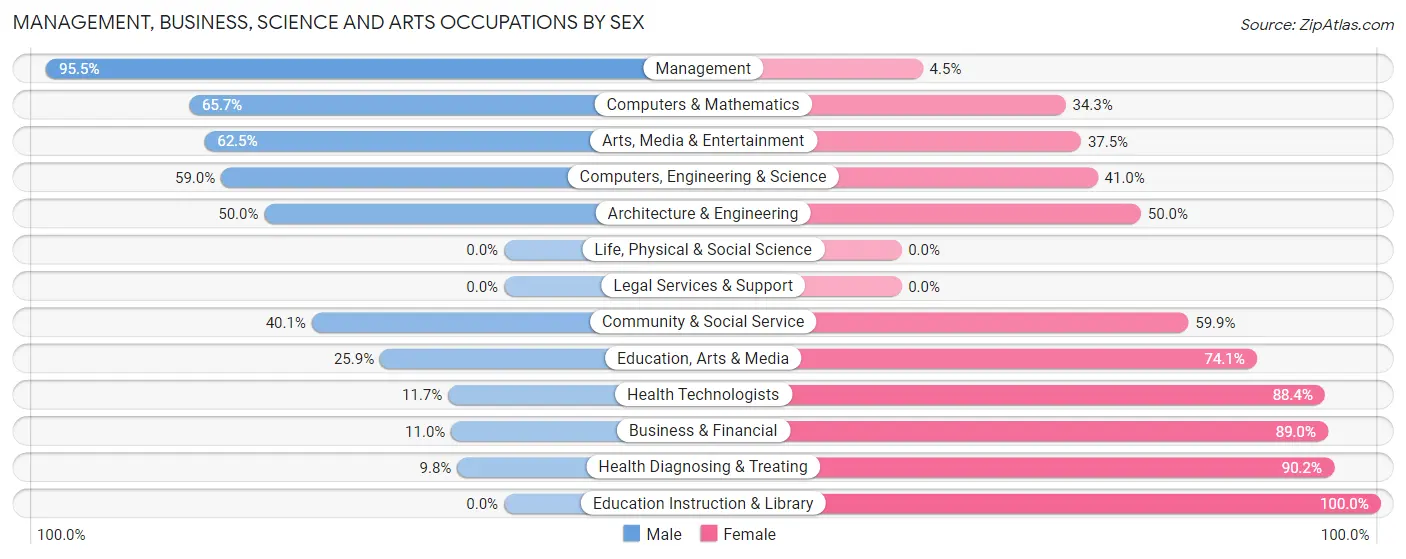
| Occupation | Male | Female |
| Management | 128 (95.5%) | 6 (4.5%) |
| Business & Financial | 27 (11.0%) | 218 (89.0%) |
| Computers, Engineering & Science | 36 (59.0%) | 25 (41.0%) |
| Computers & Mathematics | 23 (65.7%) | 12 (34.3%) |
| Architecture & Engineering | 13 (50.0%) | 13 (50.0%) |
| Life, Physical & Social Science | 0 (0.0%) | 0 (0.0%) |
| Community & Social Service | 225 (40.1%) | 336 (59.9%) |
| Education, Arts & Media | 15 (25.9%) | 43 (74.1%) |
| Legal Services & Support | 0 (0.0%) | 0 (0.0%) |
| Education Instruction & Library | 0 (0.0%) | 167 (100.0%) |
| Arts, Media & Entertainment | 210 (62.5%) | 126 (37.5%) |
| Health Diagnosing & Treating | 12 (9.8%) | 111 (90.2%) |
| Health Technologists | 12 (11.7%) | 91 (88.3%) |
| Total (Category) | 428 (38.1%) | 696 (61.9%) |
| Total (Overall) | 955 (45.8%) | 1,132 (54.2%) |
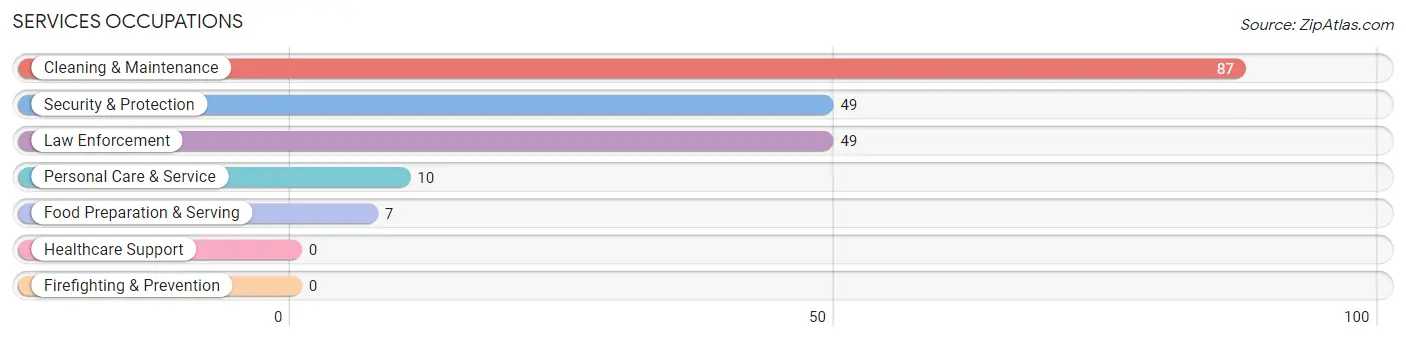
Services Occupations
The most common Services occupations in Broad Brook are Cleaning & Maintenance (87 | 4.2%), Security & Protection (49 | 2.4%), Law Enforcement (49 | 2.4%), Personal Care & Service (10 | 0.5%), and Food Preparation & Serving (7 | 0.3%).
Services Occupations by Sex
Within the Services occupations in Broad Brook, the most male-oriented occupations are Security & Protection (100.0%), Law Enforcement (100.0%), and Cleaning & Maintenance (86.2%), while the most female-oriented occupations are Food Preparation & Serving (100.0%), Personal Care & Service (100.0%), and Cleaning & Maintenance (13.8%).
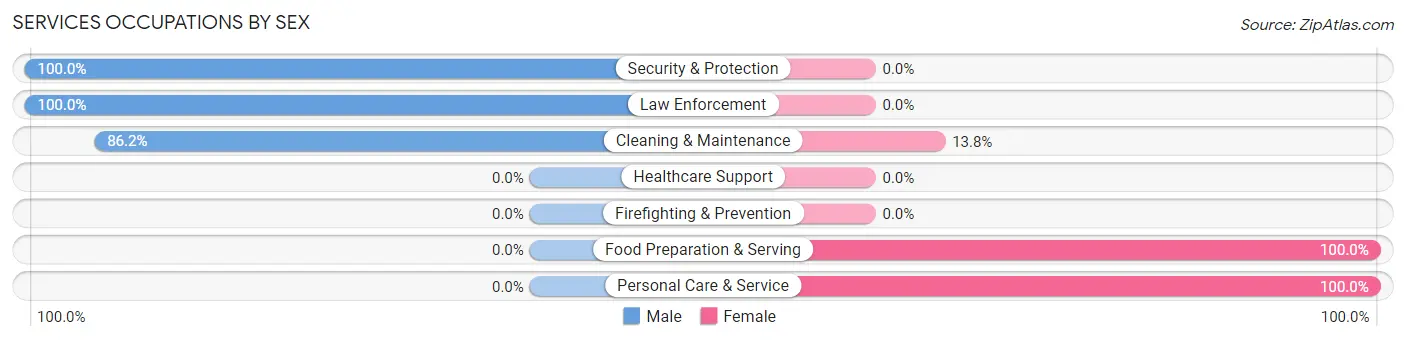
| Occupation | Male | Female |
| Healthcare Support | 0 (0.0%) | 0 (0.0%) |
| Security & Protection | 49 (100.0%) | 0 (0.0%) |
| Firefighting & Prevention | 0 (0.0%) | 0 (0.0%) |
| Law Enforcement | 49 (100.0%) | 0 (0.0%) |
| Food Preparation & Serving | 0 (0.0%) | 7 (100.0%) |
| Cleaning & Maintenance | 75 (86.2%) | 12 (13.8%) |
| Personal Care & Service | 0 (0.0%) | 10 (100.0%) |
| Total (Category) | 124 (81.0%) | 29 (19.0%) |
| Total (Overall) | 955 (45.8%) | 1,132 (54.2%) |
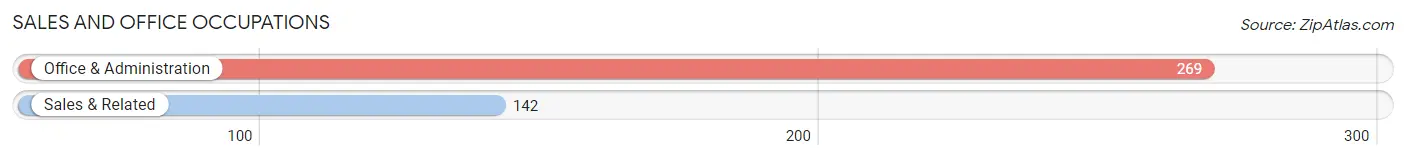
Sales and Office Occupations
The most common Sales and Office occupations in Broad Brook are Office & Administration (269 | 12.9%), and Sales & Related (142 | 6.8%).
Sales and Office Occupations by Sex
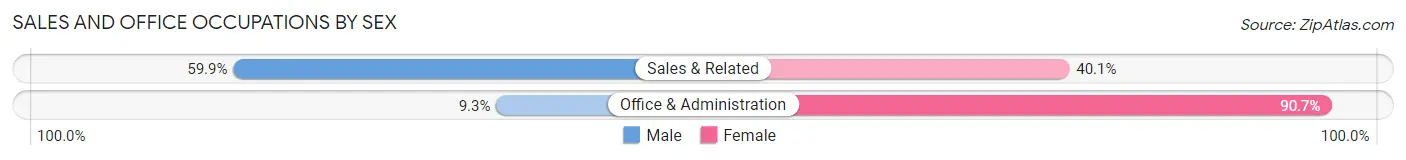
| Occupation | Male | Female |
| Sales & Related | 85 (59.9%) | 57 (40.1%) |
| Office & Administration | 25 (9.3%) | 244 (90.7%) |
| Total (Category) | 110 (26.8%) | 301 (73.2%) |
| Total (Overall) | 955 (45.8%) | 1,132 (54.2%) |
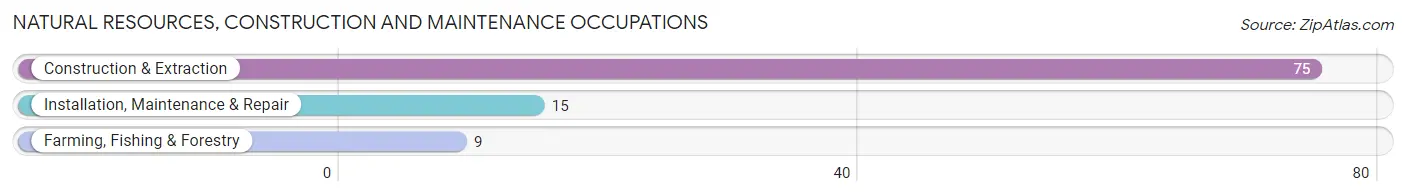
Natural Resources, Construction and Maintenance Occupations
The most common Natural Resources, Construction and Maintenance occupations in Broad Brook are Construction & Extraction (75 | 3.6%), Installation, Maintenance & Repair (15 | 0.7%), and Farming, Fishing & Forestry (9 | 0.4%).
Natural Resources, Construction and Maintenance Occupations by Sex
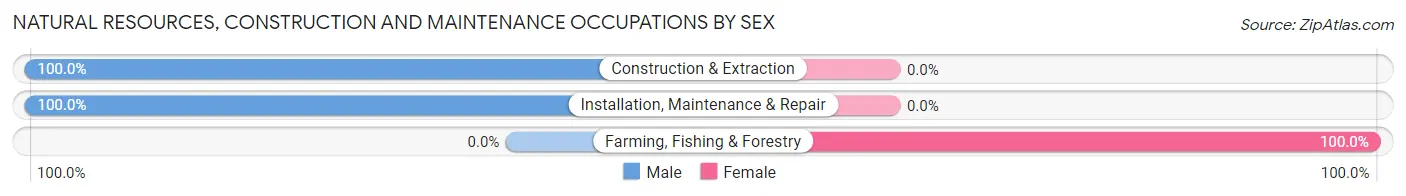
| Occupation | Male | Female |
| Farming, Fishing & Forestry | 0 (0.0%) | 9 (100.0%) |
| Construction & Extraction | 75 (100.0%) | 0 (0.0%) |
| Installation, Maintenance & Repair | 15 (100.0%) | 0 (0.0%) |
| Total (Category) | 90 (90.9%) | 9 (9.1%) |
| Total (Overall) | 955 (45.8%) | 1,132 (54.2%) |
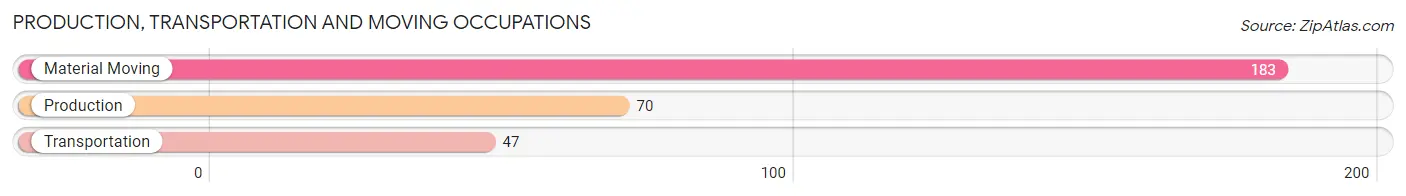
Production, Transportation and Moving Occupations
The most common Production, Transportation and Moving occupations in Broad Brook are Material Moving (183 | 8.8%), Production (70 | 3.4%), and Transportation (47 | 2.2%).
Production, Transportation and Moving Occupations by Sex
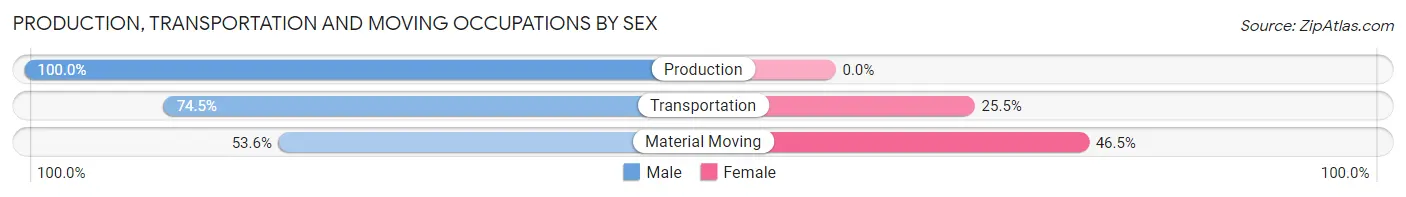
| Occupation | Male | Female |
| Production | 70 (100.0%) | 0 (0.0%) |
| Transportation | 35 (74.5%) | 12 (25.5%) |
| Material Moving | 98 (53.5%) | 85 (46.5%) |
| Total (Category) | 203 (67.7%) | 97 (32.3%) |
| Total (Overall) | 955 (45.8%) | 1,132 (54.2%) |
Employment Industries by Sex in Broad Brook
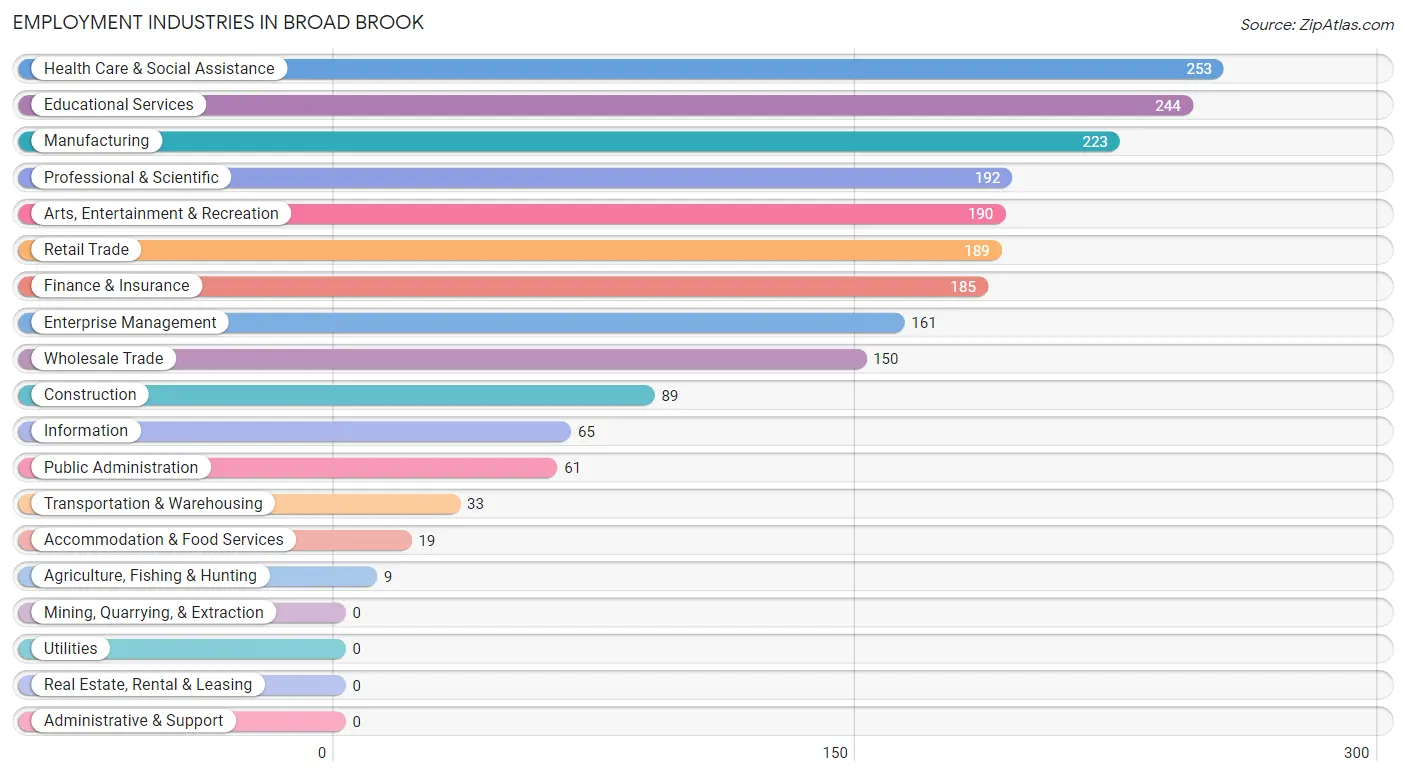
Employment Industries in Broad Brook
The major employment industries in Broad Brook include Health Care & Social Assistance (253 | 12.1%), Educational Services (244 | 11.7%), Manufacturing (223 | 10.7%), Professional & Scientific (192 | 9.2%), and Arts, Entertainment & Recreation (190 | 9.1%).
Employment Industries by Sex in Broad Brook
The Broad Brook industries that see more men than women are Construction (100.0%), Information (100.0%), and Manufacturing (86.6%), whereas the industries that tend to have a higher number of women are Agriculture, Fishing & Hunting (100.0%), Transportation & Warehousing (100.0%), and Enterprise Management (100.0%).
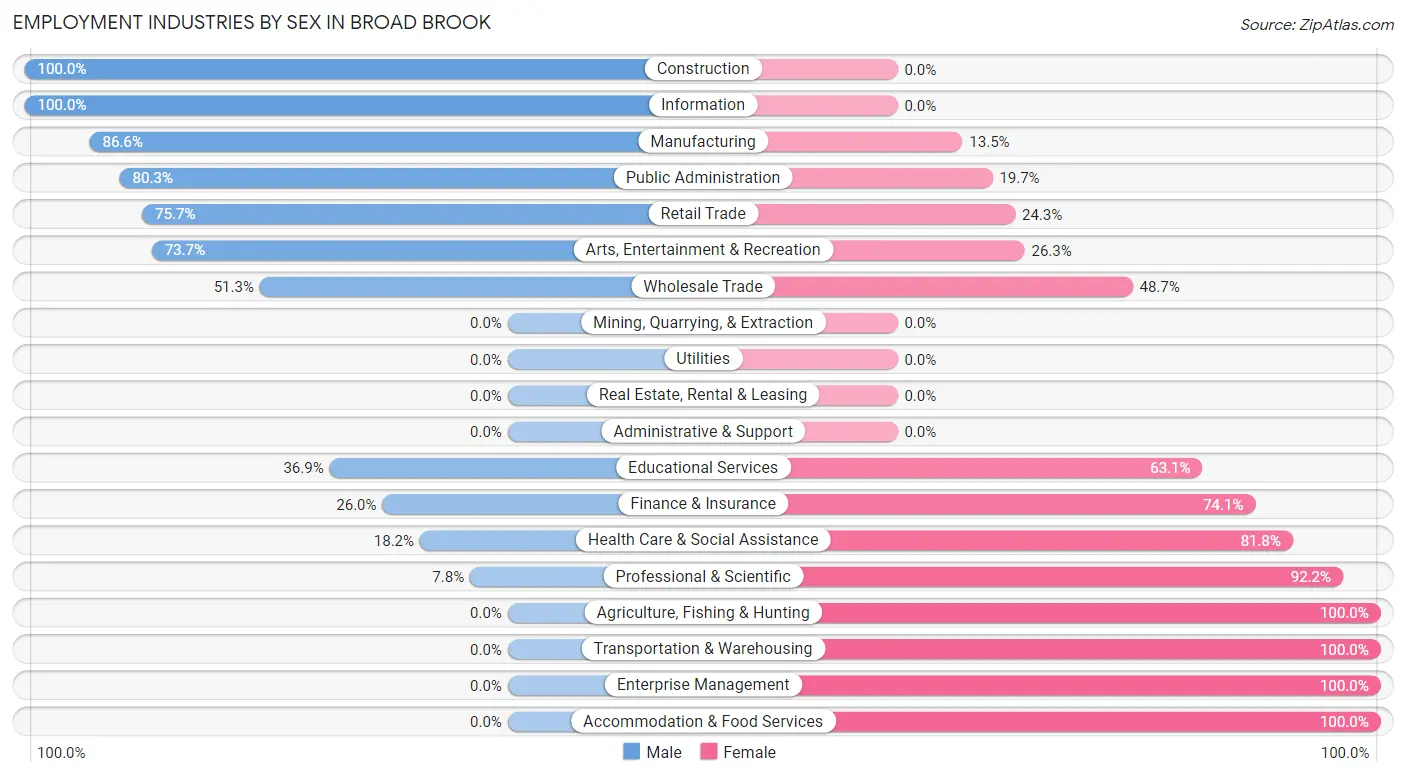
| Industry | Male | Female |
| Agriculture, Fishing & Hunting | 0 (0.0%) | 9 (100.0%) |
| Mining, Quarrying, & Extraction | 0 (0.0%) | 0 (0.0%) |
| Construction | 89 (100.0%) | 0 (0.0%) |
| Manufacturing | 193 (86.6%) | 30 (13.5%) |
| Wholesale Trade | 77 (51.3%) | 73 (48.7%) |
| Retail Trade | 143 (75.7%) | 46 (24.3%) |
| Transportation & Warehousing | 0 (0.0%) | 33 (100.0%) |
| Utilities | 0 (0.0%) | 0 (0.0%) |
| Information | 65 (100.0%) | 0 (0.0%) |
| Finance & Insurance | 48 (26.0%) | 137 (74.1%) |
| Real Estate, Rental & Leasing | 0 (0.0%) | 0 (0.0%) |
| Professional & Scientific | 15 (7.8%) | 177 (92.2%) |
| Enterprise Management | 0 (0.0%) | 161 (100.0%) |
| Administrative & Support | 0 (0.0%) | 0 (0.0%) |
| Educational Services | 90 (36.9%) | 154 (63.1%) |
| Health Care & Social Assistance | 46 (18.2%) | 207 (81.8%) |
| Arts, Entertainment & Recreation | 140 (73.7%) | 50 (26.3%) |
| Accommodation & Food Services | 0 (0.0%) | 19 (100.0%) |
| Public Administration | 49 (80.3%) | 12 (19.7%) |
| Total | 955 (45.8%) | 1,132 (54.2%) |
Education in Broad Brook
School Enrollment in Broad Brook
The most common levels of schooling among the 1,092 students in Broad Brook are high school (268 | 24.5%), elementary school (247 | 22.6%), and college / undergraduate (181 | 16.6%).
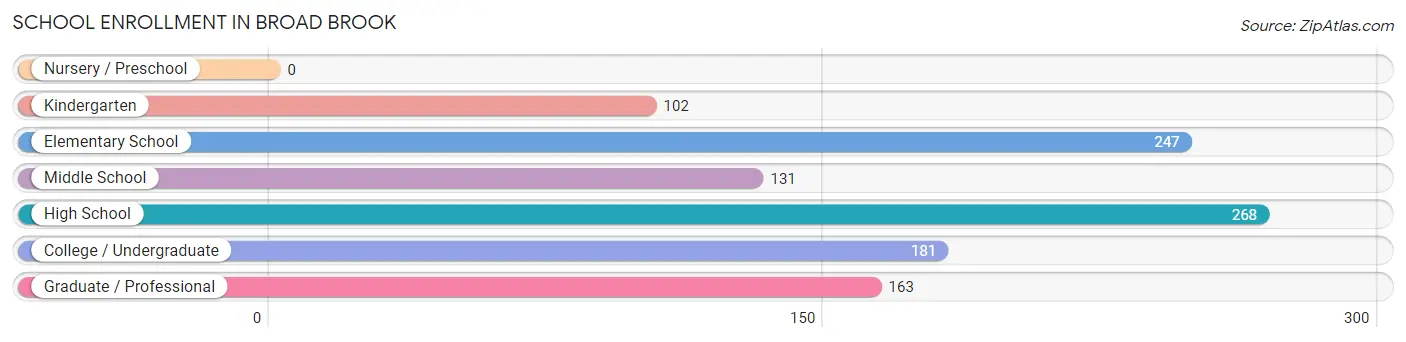
| School Level | # Students | % Students |
| Nursery / Preschool | 0 | 0.0% |
| Kindergarten | 102 | 9.3% |
| Elementary School | 247 | 22.6% |
| Middle School | 131 | 12.0% |
| High School | 268 | 24.5% |
| College / Undergraduate | 181 | 16.6% |
| Graduate / Professional | 163 | 14.9% |
| Total | 1,092 | 100.0% |
School Enrollment by Age by Funding Source in Broad Brook
Out of a total of 1,092 students who are enrolled in schools in Broad Brook, 107 (9.8%) attend a private institution, while the remaining 985 (90.2%) are enrolled in public schools. The age group of 25 to 34 year olds has the highest likelihood of being enrolled in private schools, with 35 (100.0% in the age bracket) enrolled. Conversely, the age group of 5 to 9 year old has the lowest likelihood of being enrolled in a private school, with 348 (100.0% in the age bracket) attending a public institution.
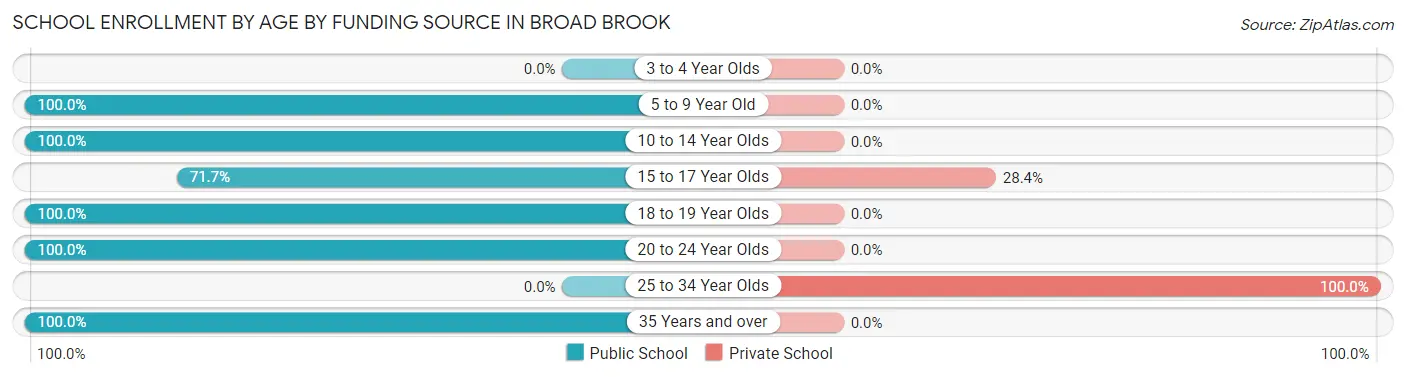
| Age Bracket | Public School | Private School |
| 3 to 4 Year Olds | 0 (0.0%) | 0 (0.0%) |
| 5 to 9 Year Old | 348 (100.0%) | 0 (0.0%) |
| 10 to 14 Year Olds | 132 (100.0%) | 0 (0.0%) |
| 15 to 17 Year Olds | 182 (71.7%) | 72 (28.3%) |
| 18 to 19 Year Olds | 174 (100.0%) | 0 (0.0%) |
| 20 to 24 Year Olds | 86 (100.0%) | 0 (0.0%) |
| 25 to 34 Year Olds | 0 (0.0%) | 35 (100.0%) |
| 35 Years and over | 63 (100.0%) | 0 (0.0%) |
| Total | 985 (90.2%) | 107 (9.8%) |
Educational Attainment by Field of Study in Broad Brook
Communications (152 | 12.0%), social sciences (146 | 11.5%), business (142 | 11.2%), visual & performing arts (139 | 11.0%), and engineering (134 | 10.6%) are the most common fields of study among 1,267 individuals in Broad Brook who have obtained a bachelor's degree or higher.
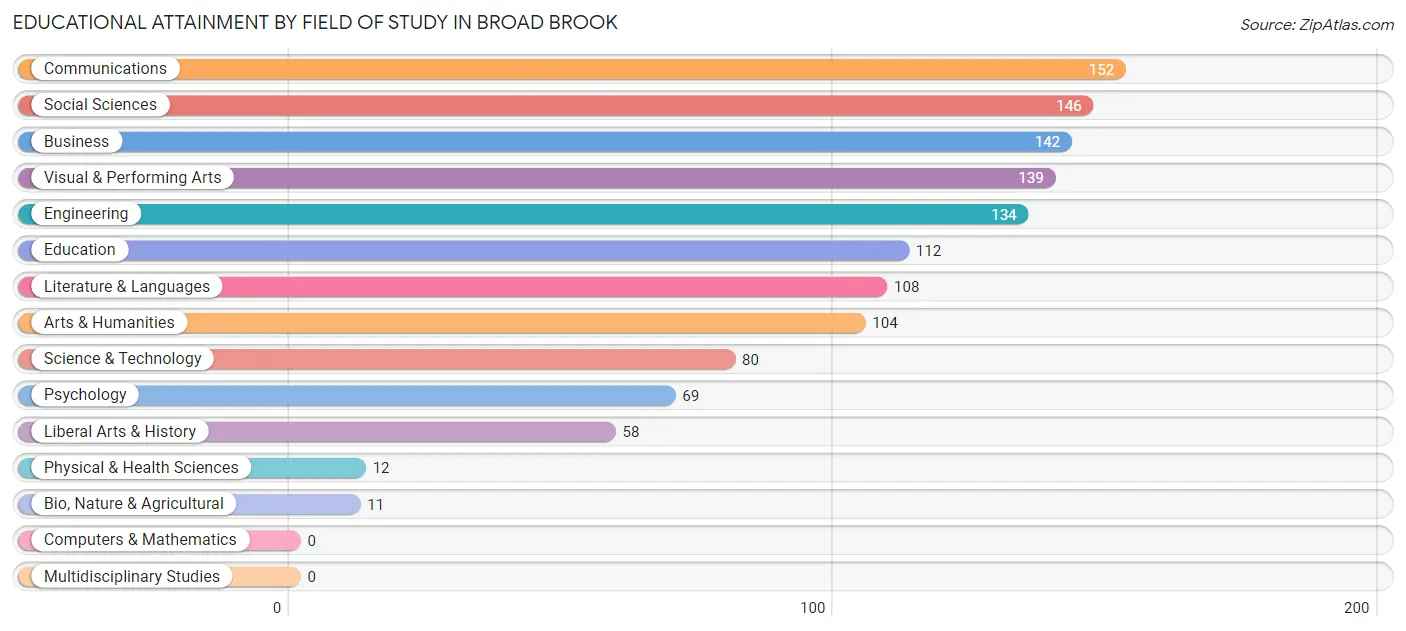
| Field of Study | # Graduates | % Graduates |
| Computers & Mathematics | 0 | 0.0% |
| Bio, Nature & Agricultural | 11 | 0.9% |
| Physical & Health Sciences | 12 | 0.9% |
| Psychology | 69 | 5.4% |
| Social Sciences | 146 | 11.5% |
| Engineering | 134 | 10.6% |
| Multidisciplinary Studies | 0 | 0.0% |
| Science & Technology | 80 | 6.3% |
| Business | 142 | 11.2% |
| Education | 112 | 8.8% |
| Literature & Languages | 108 | 8.5% |
| Liberal Arts & History | 58 | 4.6% |
| Visual & Performing Arts | 139 | 11.0% |
| Communications | 152 | 12.0% |
| Arts & Humanities | 104 | 8.2% |
| Total | 1,267 | 100.0% |
Transportation & Commute in Broad Brook
Vehicle Availability by Sex in Broad Brook
The most prevalent vehicle ownership categories in Broad Brook are males with 2 vehicles (435, accounting for 45.6%) and females with 2 vehicles (265, making up 41.1%).
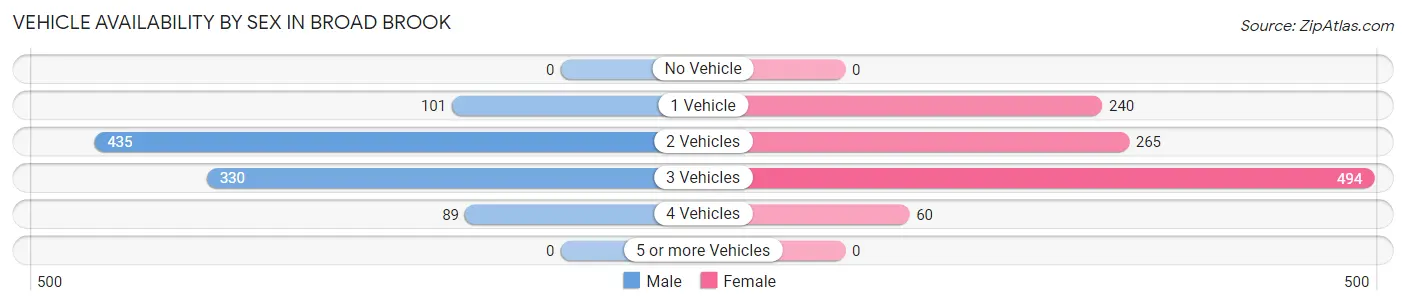
| Vehicles Available | Male | Female |
| No Vehicle | 0 (0.0%) | 0 (0.0%) |
| 1 Vehicle | 101 (10.6%) | 240 (22.7%) |
| 2 Vehicles | 435 (45.6%) | 265 (25.0%) |
| 3 Vehicles | 330 (34.5%) | 494 (46.7%) |
| 4 Vehicles | 89 (9.3%) | 60 (5.7%) |
| 5 or more Vehicles | 0 (0.0%) | 0 (0.0%) |
| Total | 955 (100.0%) | 1,059 (100.0%) |
Commute Time in Broad Brook
The most frequently occuring commute durations in Broad Brook are 30 to 34 minutes (469 commuters, 28.6%), 20 to 24 minutes (321 commuters, 19.6%), and 25 to 29 minutes (195 commuters, 11.9%).
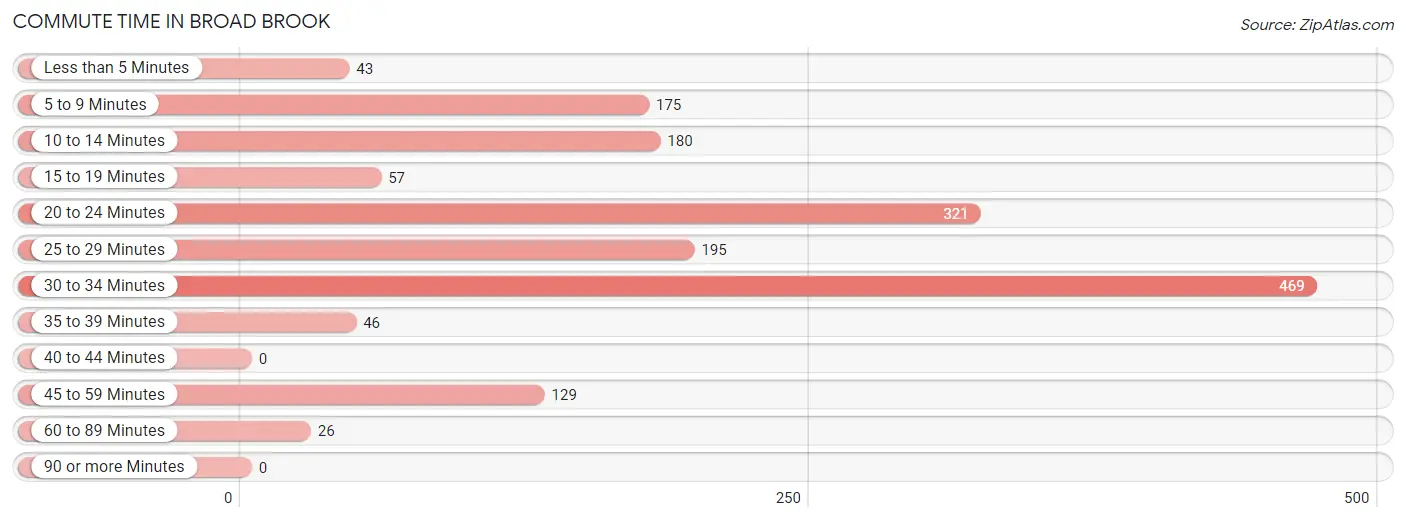
| Commute Time | # Commuters | % Commuters |
| Less than 5 Minutes | 43 | 2.6% |
| 5 to 9 Minutes | 175 | 10.7% |
| 10 to 14 Minutes | 180 | 11.0% |
| 15 to 19 Minutes | 57 | 3.5% |
| 20 to 24 Minutes | 321 | 19.6% |
| 25 to 29 Minutes | 195 | 11.9% |
| 30 to 34 Minutes | 469 | 28.6% |
| 35 to 39 Minutes | 46 | 2.8% |
| 40 to 44 Minutes | 0 | 0.0% |
| 45 to 59 Minutes | 129 | 7.9% |
| 60 to 89 Minutes | 26 | 1.6% |
| 90 or more Minutes | 0 | 0.0% |
Commute Time by Sex in Broad Brook
The most common commute times in Broad Brook are 5 to 9 minutes (175 commuters, 22.9%) for males and 30 to 34 minutes (310 commuters, 35.4%) for females.
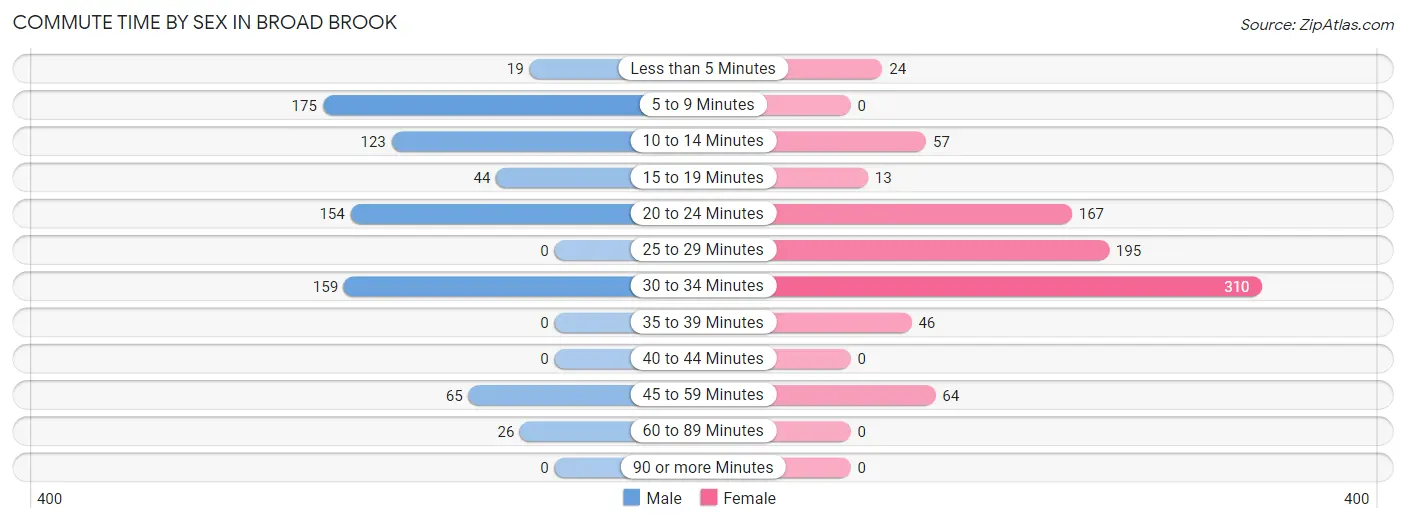
| Commute Time | Male | Female |
| Less than 5 Minutes | 19 (2.5%) | 24 (2.7%) |
| 5 to 9 Minutes | 175 (22.9%) | 0 (0.0%) |
| 10 to 14 Minutes | 123 (16.1%) | 57 (6.5%) |
| 15 to 19 Minutes | 44 (5.8%) | 13 (1.5%) |
| 20 to 24 Minutes | 154 (20.1%) | 167 (19.1%) |
| 25 to 29 Minutes | 0 (0.0%) | 195 (22.3%) |
| 30 to 34 Minutes | 159 (20.8%) | 310 (35.4%) |
| 35 to 39 Minutes | 0 (0.0%) | 46 (5.2%) |
| 40 to 44 Minutes | 0 (0.0%) | 0 (0.0%) |
| 45 to 59 Minutes | 65 (8.5%) | 64 (7.3%) |
| 60 to 89 Minutes | 26 (3.4%) | 0 (0.0%) |
| 90 or more Minutes | 0 (0.0%) | 0 (0.0%) |
Time of Departure to Work by Sex in Broad Brook
The most frequent times of departure to work in Broad Brook are 8:00 AM to 8:29 AM (175, 22.9%) for males and 7:30 AM to 7:59 AM (188, 21.5%) for females.
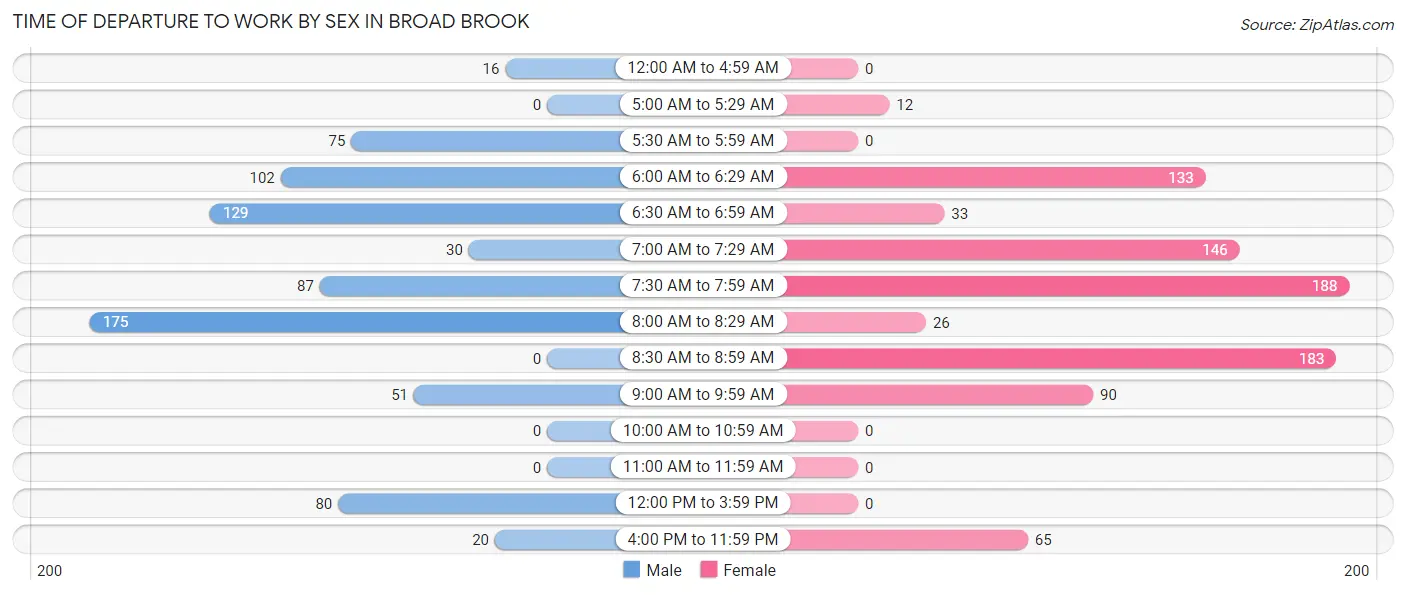
| Time of Departure | Male | Female |
| 12:00 AM to 4:59 AM | 16 (2.1%) | 0 (0.0%) |
| 5:00 AM to 5:29 AM | 0 (0.0%) | 12 (1.4%) |
| 5:30 AM to 5:59 AM | 75 (9.8%) | 0 (0.0%) |
| 6:00 AM to 6:29 AM | 102 (13.3%) | 133 (15.2%) |
| 6:30 AM to 6:59 AM | 129 (16.9%) | 33 (3.8%) |
| 7:00 AM to 7:29 AM | 30 (3.9%) | 146 (16.7%) |
| 7:30 AM to 7:59 AM | 87 (11.4%) | 188 (21.5%) |
| 8:00 AM to 8:29 AM | 175 (22.9%) | 26 (3.0%) |
| 8:30 AM to 8:59 AM | 0 (0.0%) | 183 (20.9%) |
| 9:00 AM to 9:59 AM | 51 (6.7%) | 90 (10.3%) |
| 10:00 AM to 10:59 AM | 0 (0.0%) | 0 (0.0%) |
| 11:00 AM to 11:59 AM | 0 (0.0%) | 0 (0.0%) |
| 12:00 PM to 3:59 PM | 80 (10.5%) | 0 (0.0%) |
| 4:00 PM to 11:59 PM | 20 (2.6%) | 65 (7.4%) |
| Total | 765 (100.0%) | 876 (100.0%) |
Housing Occupancy in Broad Brook
Occupancy by Ownership in Broad Brook
Of the total 1,608 dwellings in Broad Brook, owner-occupied units account for 1,145 (71.2%), while renter-occupied units make up 463 (28.8%).
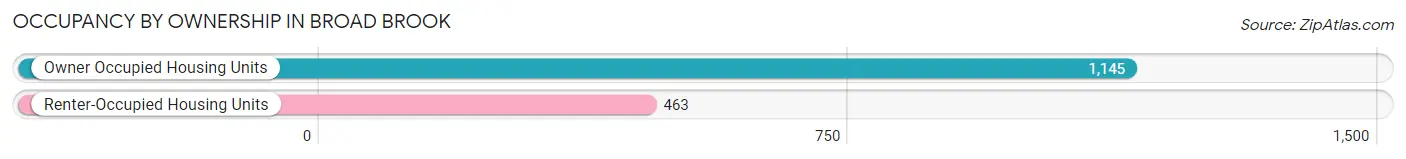
| Occupancy | # Housing Units | % Housing Units |
| Owner Occupied Housing Units | 1,145 | 71.2% |
| Renter-Occupied Housing Units | 463 | 28.8% |
| Total Occupied Housing Units | 1,608 | 100.0% |
Occupancy by Household Size in Broad Brook
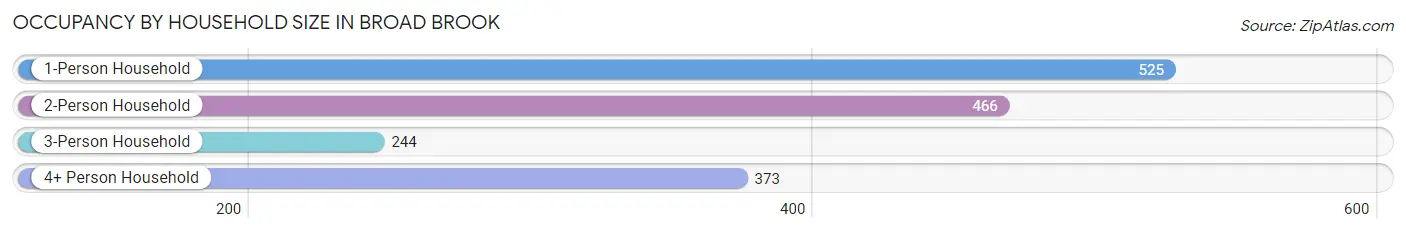
| Household Size | # Housing Units | % Housing Units |
| 1-Person Household | 525 | 32.7% |
| 2-Person Household | 466 | 29.0% |
| 3-Person Household | 244 | 15.2% |
| 4+ Person Household | 373 | 23.2% |
| Total Housing Units | 1,608 | 100.0% |
Occupancy by Ownership by Household Size in Broad Brook
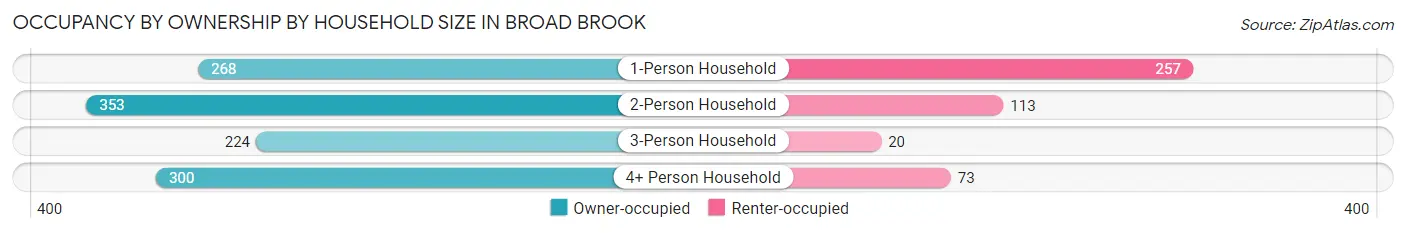
| Household Size | Owner-occupied | Renter-occupied |
| 1-Person Household | 268 (51.0%) | 257 (48.9%) |
| 2-Person Household | 353 (75.7%) | 113 (24.2%) |
| 3-Person Household | 224 (91.8%) | 20 (8.2%) |
| 4+ Person Household | 300 (80.4%) | 73 (19.6%) |
| Total Housing Units | 1,145 (71.2%) | 463 (28.8%) |
Occupancy by Educational Attainment in Broad Brook
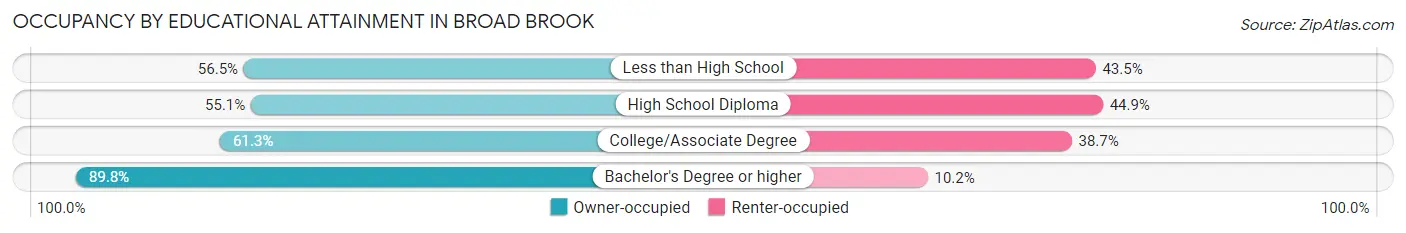
| Household Size | Owner-occupied | Renter-occupied |
| Less than High School | 52 (56.5%) | 40 (43.5%) |
| High School Diploma | 211 (55.1%) | 172 (44.9%) |
| College/Associate Degree | 291 (61.3%) | 184 (38.7%) |
| Bachelor's Degree or higher | 591 (89.8%) | 67 (10.2%) |
Occupancy by Age of Householder in Broad Brook
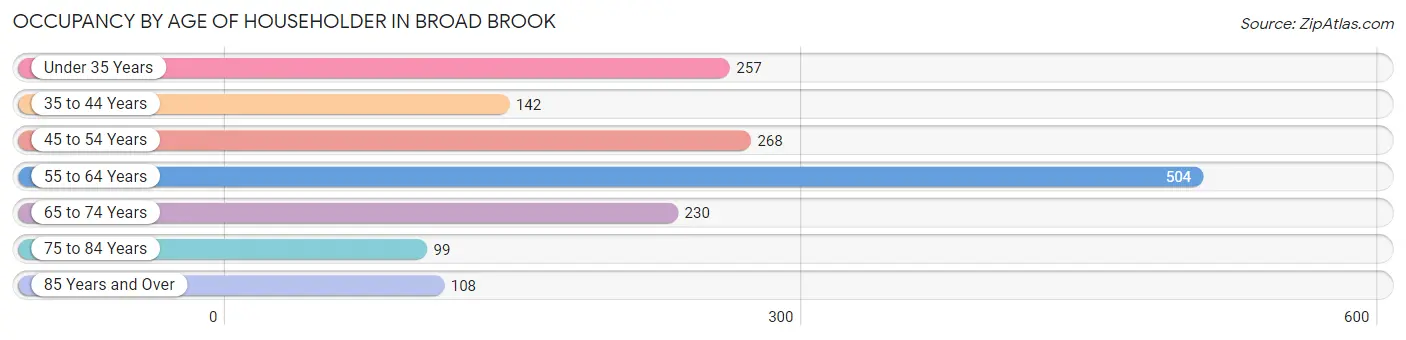
| Age Bracket | # Households | % Households |
| Under 35 Years | 257 | 16.0% |
| 35 to 44 Years | 142 | 8.8% |
| 45 to 54 Years | 268 | 16.7% |
| 55 to 64 Years | 504 | 31.3% |
| 65 to 74 Years | 230 | 14.3% |
| 75 to 84 Years | 99 | 6.2% |
| 85 Years and Over | 108 | 6.7% |
| Total | 1,608 | 100.0% |
Housing Finances in Broad Brook
Median Income by Occupancy in Broad Brook
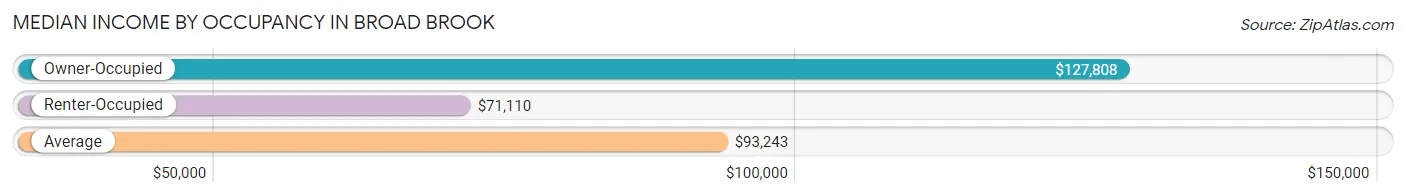
| Occupancy Type | # Households | Median Income |
| Owner-Occupied | 1,145 (71.2%) | $127,808 |
| Renter-Occupied | 463 (28.8%) | $71,110 |
| Average | 1,608 (100.0%) | $93,243 |
Occupancy by Householder Income Bracket in Broad Brook
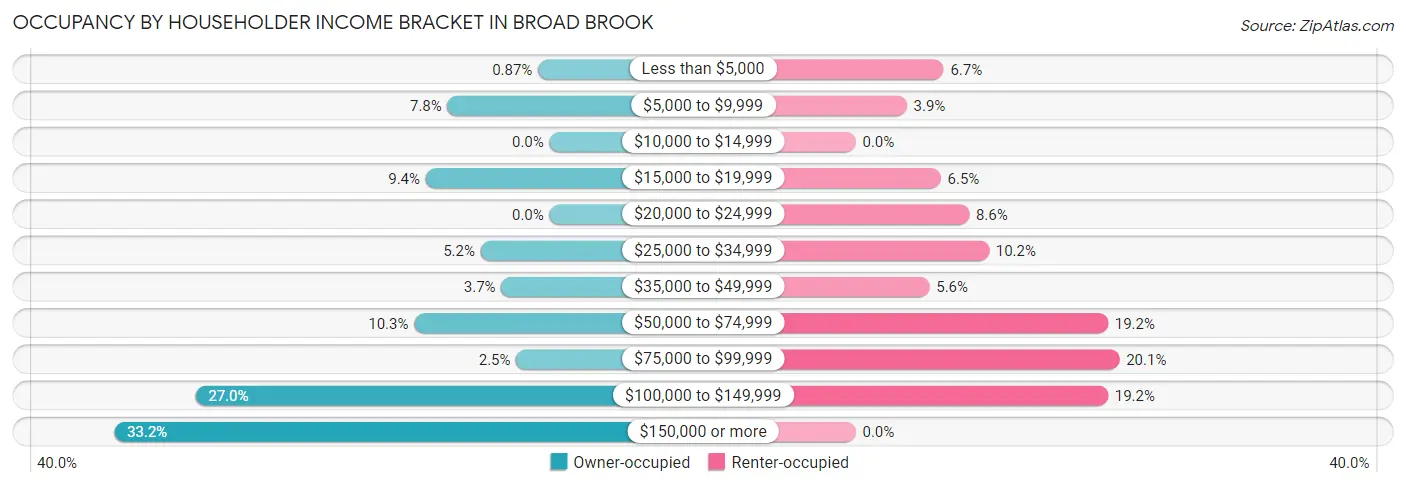
| Income Bracket | Owner-occupied | Renter-occupied |
| Less than $5,000 | 10 (0.9%) | 31 (6.7%) |
| $5,000 to $9,999 | 89 (7.8%) | 18 (3.9%) |
| $10,000 to $14,999 | 0 (0.0%) | 0 (0.0%) |
| $15,000 to $19,999 | 108 (9.4%) | 30 (6.5%) |
| $20,000 to $24,999 | 0 (0.0%) | 40 (8.6%) |
| $25,000 to $34,999 | 60 (5.2%) | 47 (10.2%) |
| $35,000 to $49,999 | 42 (3.7%) | 26 (5.6%) |
| $50,000 to $74,999 | 118 (10.3%) | 89 (19.2%) |
| $75,000 to $99,999 | 29 (2.5%) | 93 (20.1%) |
| $100,000 to $149,999 | 309 (27.0%) | 89 (19.2%) |
| $150,000 or more | 380 (33.2%) | 0 (0.0%) |
| Total | 1,145 (100.0%) | 463 (100.0%) |
Monthly Housing Cost Tiers in Broad Brook
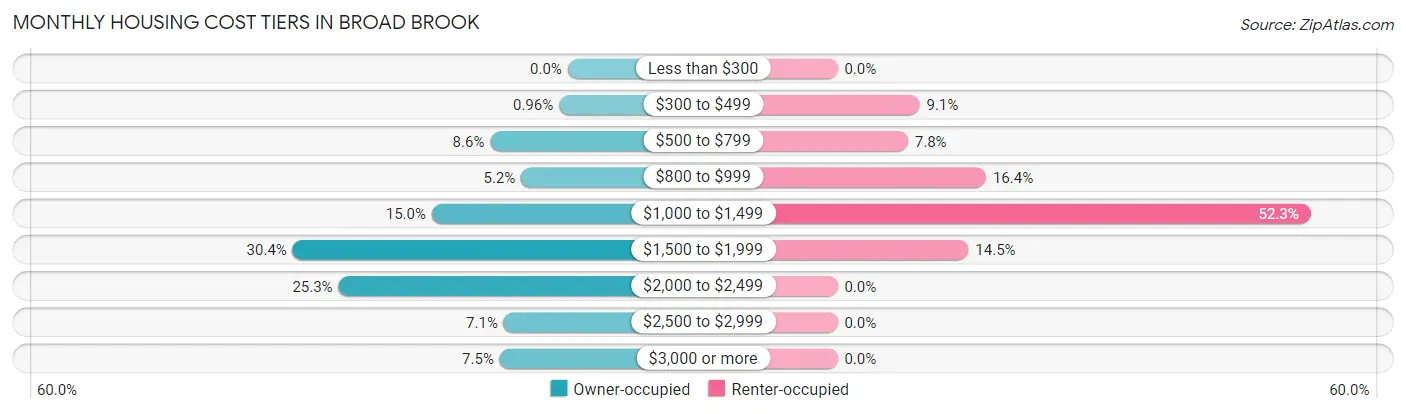
| Monthly Cost | Owner-occupied | Renter-occupied |
| Less than $300 | 0 (0.0%) | 0 (0.0%) |
| $300 to $499 | 11 (1.0%) | 42 (9.1%) |
| $500 to $799 | 98 (8.6%) | 36 (7.8%) |
| $800 to $999 | 59 (5.1%) | 76 (16.4%) |
| $1,000 to $1,499 | 172 (15.0%) | 242 (52.3%) |
| $1,500 to $1,999 | 348 (30.4%) | 67 (14.5%) |
| $2,000 to $2,499 | 290 (25.3%) | 0 (0.0%) |
| $2,500 to $2,999 | 81 (7.1%) | 0 (0.0%) |
| $3,000 or more | 86 (7.5%) | 0 (0.0%) |
| Total | 1,145 (100.0%) | 463 (100.0%) |
Physical Housing Characteristics in Broad Brook
Housing Structures in Broad Brook
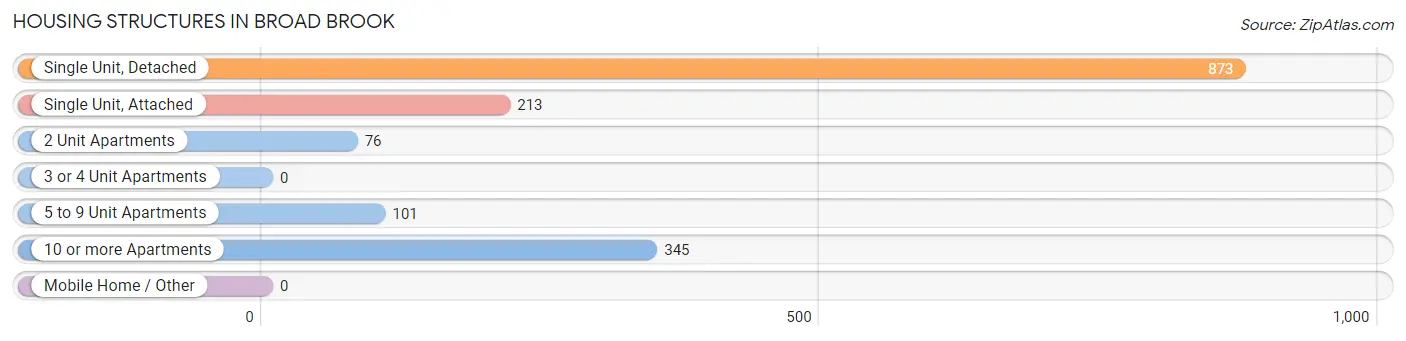
| Structure Type | # Housing Units | % Housing Units |
| Single Unit, Detached | 873 | 54.3% |
| Single Unit, Attached | 213 | 13.3% |
| 2 Unit Apartments | 76 | 4.7% |
| 3 or 4 Unit Apartments | 0 | 0.0% |
| 5 to 9 Unit Apartments | 101 | 6.3% |
| 10 or more Apartments | 345 | 21.5% |
| Mobile Home / Other | 0 | 0.0% |
| Total | 1,608 | 100.0% |
Housing Structures by Occupancy in Broad Brook
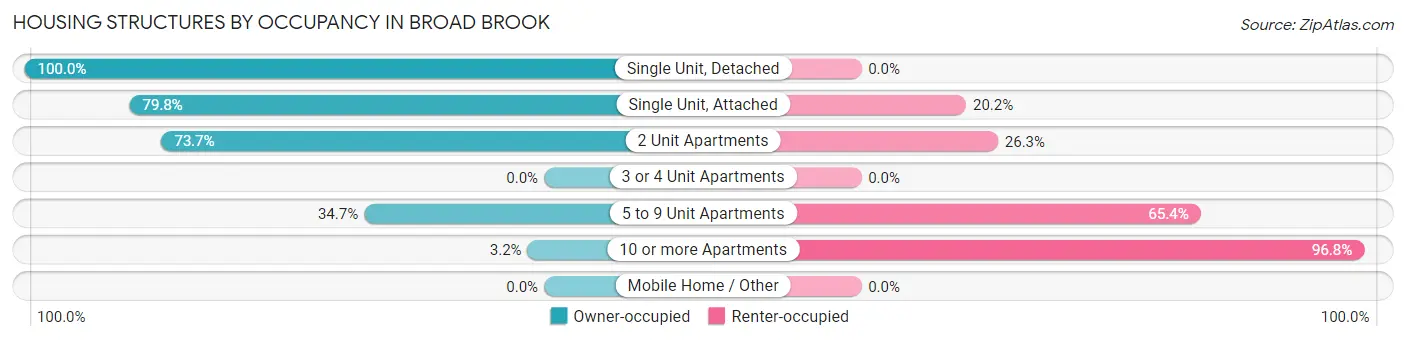
| Structure Type | Owner-occupied | Renter-occupied |
| Single Unit, Detached | 873 (100.0%) | 0 (0.0%) |
| Single Unit, Attached | 170 (79.8%) | 43 (20.2%) |
| 2 Unit Apartments | 56 (73.7%) | 20 (26.3%) |
| 3 or 4 Unit Apartments | 0 (0.0%) | 0 (0.0%) |
| 5 to 9 Unit Apartments | 35 (34.6%) | 66 (65.3%) |
| 10 or more Apartments | 11 (3.2%) | 334 (96.8%) |
| Mobile Home / Other | 0 (0.0%) | 0 (0.0%) |
| Total | 1,145 (71.2%) | 463 (28.8%) |
Housing Structures by Number of Rooms in Broad Brook
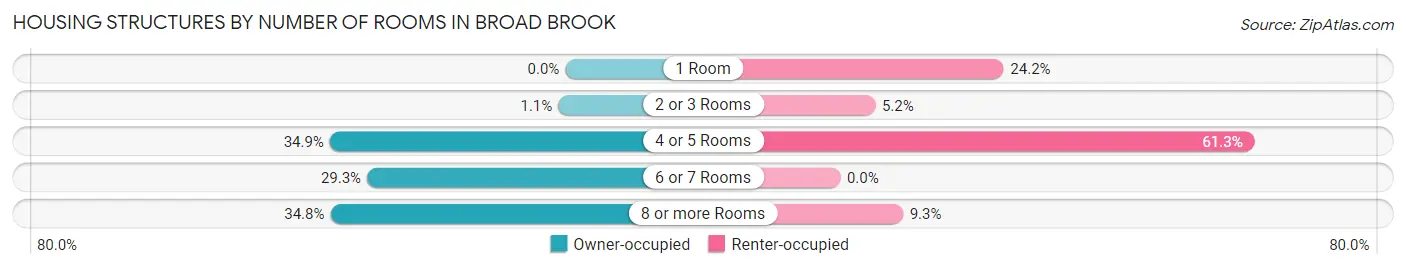
| Number of Rooms | Owner-occupied | Renter-occupied |
| 1 Room | 0 (0.0%) | 112 (24.2%) |
| 2 or 3 Rooms | 12 (1.1%) | 24 (5.2%) |
| 4 or 5 Rooms | 399 (34.8%) | 284 (61.3%) |
| 6 or 7 Rooms | 336 (29.3%) | 0 (0.0%) |
| 8 or more Rooms | 398 (34.8%) | 43 (9.3%) |
| Total | 1,145 (100.0%) | 463 (100.0%) |
Housing Structure by Heating Type in Broad Brook
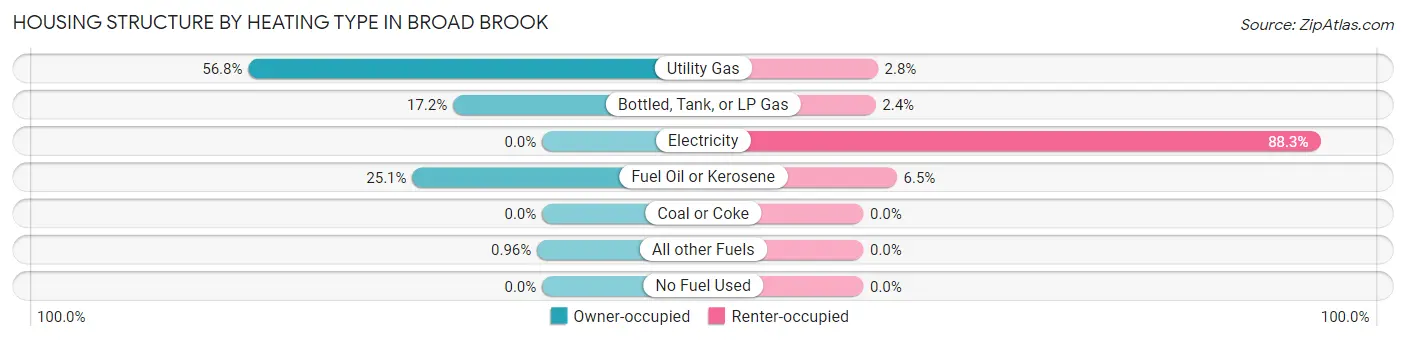
| Heating Type | Owner-occupied | Renter-occupied |
| Utility Gas | 650 (56.8%) | 13 (2.8%) |
| Bottled, Tank, or LP Gas | 197 (17.2%) | 11 (2.4%) |
| Electricity | 0 (0.0%) | 409 (88.3%) |
| Fuel Oil or Kerosene | 287 (25.1%) | 30 (6.5%) |
| Coal or Coke | 0 (0.0%) | 0 (0.0%) |
| All other Fuels | 11 (1.0%) | 0 (0.0%) |
| No Fuel Used | 0 (0.0%) | 0 (0.0%) |
| Total | 1,145 (100.0%) | 463 (100.0%) |
Household Vehicle Usage in Broad Brook
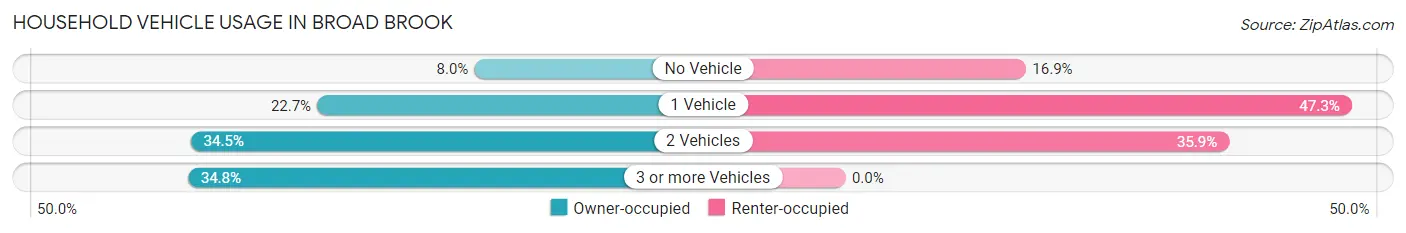
| Vehicles per Household | Owner-occupied | Renter-occupied |
| No Vehicle | 92 (8.0%) | 78 (16.9%) |
| 1 Vehicle | 260 (22.7%) | 219 (47.3%) |
| 2 Vehicles | 395 (34.5%) | 166 (35.8%) |
| 3 or more Vehicles | 398 (34.8%) | 0 (0.0%) |
| Total | 1,145 (100.0%) | 463 (100.0%) |
Real Estate & Mortgages in Broad Brook
Real Estate and Mortgage Overview in Broad Brook
| Characteristic | Without Mortgage | With Mortgage |
| Housing Units | 306 | 839 |
| Median Property Value | $260,300 | $315,200 |
| Median Household Income | $55,990 | $314 |
| Monthly Housing Costs | $935 | $86 |
| Real Estate Taxes | $5,151 | $12 |
Property Value by Mortgage Status in Broad Brook
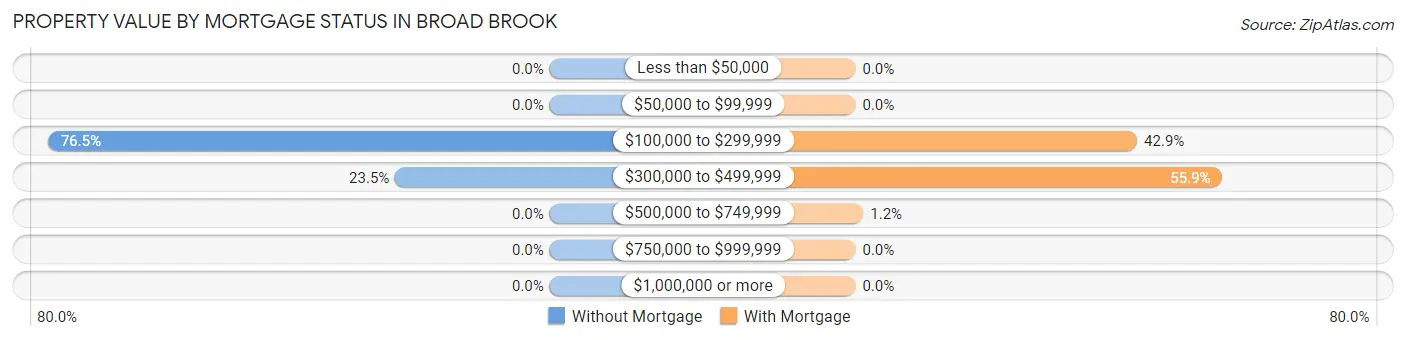
| Property Value | Without Mortgage | With Mortgage |
| Less than $50,000 | 0 (0.0%) | 0 (0.0%) |
| $50,000 to $99,999 | 0 (0.0%) | 0 (0.0%) |
| $100,000 to $299,999 | 234 (76.5%) | 360 (42.9%) |
| $300,000 to $499,999 | 72 (23.5%) | 469 (55.9%) |
| $500,000 to $749,999 | 0 (0.0%) | 10 (1.2%) |
| $750,000 to $999,999 | 0 (0.0%) | 0 (0.0%) |
| $1,000,000 or more | 0 (0.0%) | 0 (0.0%) |
| Total | 306 (100.0%) | 839 (100.0%) |
Household Income by Mortgage Status in Broad Brook
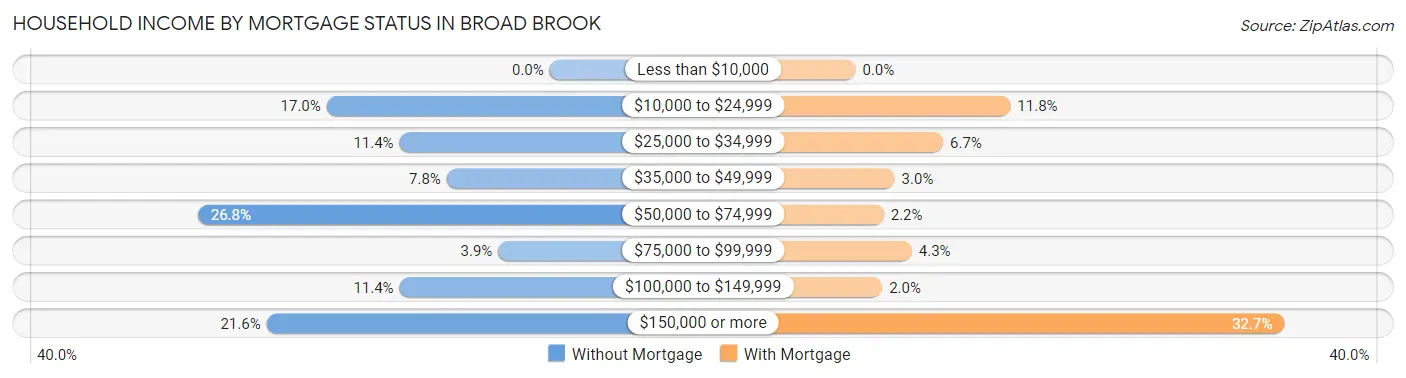
| Household Income | Without Mortgage | With Mortgage |
| Less than $10,000 | 0 (0.0%) | 0 (0.0%) |
| $10,000 to $24,999 | 52 (17.0%) | 99 (11.8%) |
| $25,000 to $34,999 | 35 (11.4%) | 56 (6.7%) |
| $35,000 to $49,999 | 24 (7.8%) | 25 (3.0%) |
| $50,000 to $74,999 | 82 (26.8%) | 18 (2.1%) |
| $75,000 to $99,999 | 12 (3.9%) | 36 (4.3%) |
| $100,000 to $149,999 | 35 (11.4%) | 17 (2.0%) |
| $150,000 or more | 66 (21.6%) | 274 (32.7%) |
| Total | 306 (100.0%) | 839 (100.0%) |
Property Value to Household Income Ratio in Broad Brook
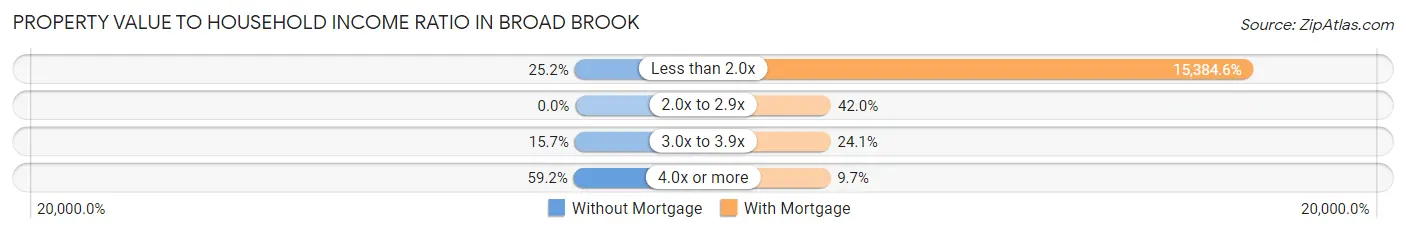
| Value-to-Income Ratio | Without Mortgage | With Mortgage |
| Less than 2.0x | 77 (25.2%) | 129,077 (15,384.6%) |
| 2.0x to 2.9x | 0 (0.0%) | 352 (41.9%) |
| 3.0x to 3.9x | 48 (15.7%) | 202 (24.1%) |
| 4.0x or more | 181 (59.2%) | 81 (9.7%) |
| Total | 306 (100.0%) | 839 (100.0%) |
Real Estate Taxes by Mortgage Status in Broad Brook
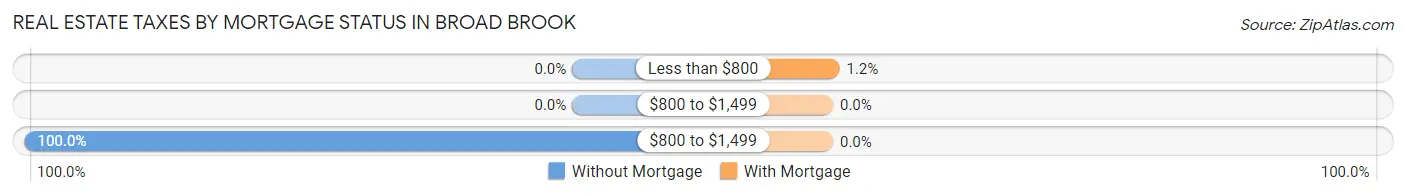
| Property Taxes | Without Mortgage | With Mortgage |
| Less than $800 | 0 (0.0%) | 10 (1.2%) |
| $800 to $1,499 | 0 (0.0%) | 0 (0.0%) |
| $800 to $1,499 | 306 (100.0%) | 0 (0.0%) |
| Total | 306 (100.0%) | 839 (100.0%) |
Health & Disability in Broad Brook
Health Insurance Coverage by Age in Broad Brook
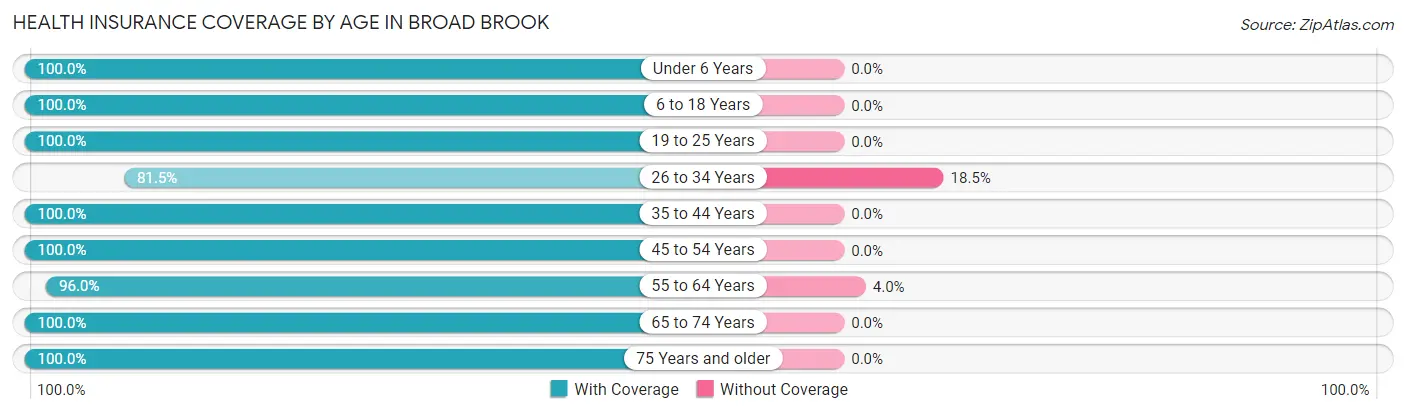
| Age Bracket | With Coverage | Without Coverage |
| Under 6 Years | 175 (100.0%) | 0 (0.0%) |
| 6 to 18 Years | 670 (100.0%) | 0 (0.0%) |
| 19 to 25 Years | 552 (100.0%) | 0 (0.0%) |
| 26 to 34 Years | 431 (81.5%) | 98 (18.5%) |
| 35 to 44 Years | 223 (100.0%) | 0 (0.0%) |
| 45 to 54 Years | 443 (100.0%) | 0 (0.0%) |
| 55 to 64 Years | 765 (96.0%) | 32 (4.0%) |
| 65 to 74 Years | 357 (100.0%) | 0 (0.0%) |
| 75 Years and older | 256 (100.0%) | 0 (0.0%) |
| Total | 3,872 (96.8%) | 130 (3.3%) |
Health Insurance Coverage by Citizenship Status in Broad Brook
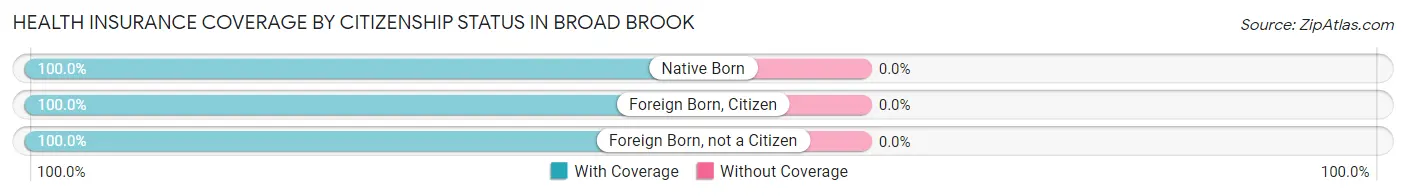
| Citizenship Status | With Coverage | Without Coverage |
| Native Born | 175 (100.0%) | 0 (0.0%) |
| Foreign Born, Citizen | 670 (100.0%) | 0 (0.0%) |
| Foreign Born, not a Citizen | 552 (100.0%) | 0 (0.0%) |
Health Insurance Coverage by Household Income in Broad Brook
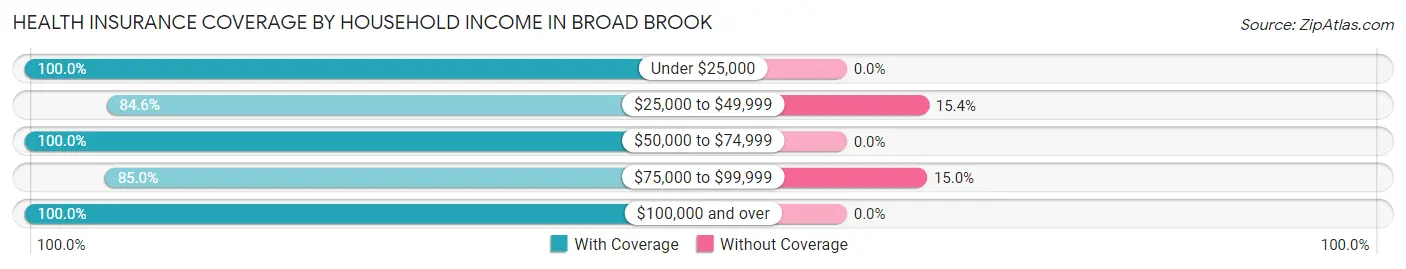
| Household Income | With Coverage | Without Coverage |
| Under $25,000 | 568 (100.0%) | 0 (0.0%) |
| $25,000 to $49,999 | 314 (84.6%) | 57 (15.4%) |
| $50,000 to $74,999 | 273 (100.0%) | 0 (0.0%) |
| $75,000 to $99,999 | 413 (85.0%) | 73 (15.0%) |
| $100,000 and over | 2,301 (100.0%) | 0 (0.0%) |
Public vs Private Health Insurance Coverage by Age in Broad Brook
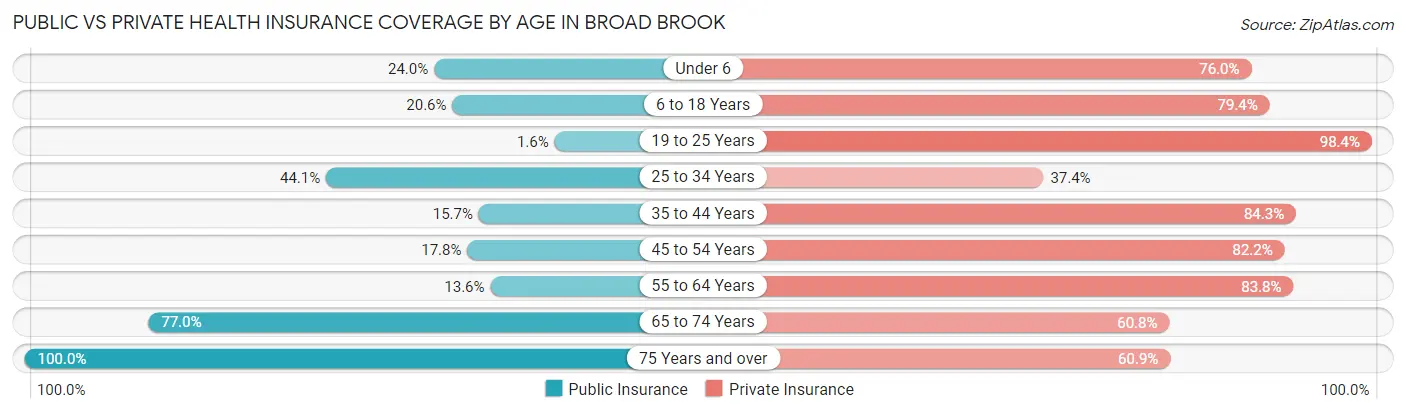
| Age Bracket | Public Insurance | Private Insurance |
| Under 6 | 42 (24.0%) | 133 (76.0%) |
| 6 to 18 Years | 138 (20.6%) | 532 (79.4%) |
| 19 to 25 Years | 9 (1.6%) | 543 (98.4%) |
| 25 to 34 Years | 233 (44.1%) | 198 (37.4%) |
| 35 to 44 Years | 35 (15.7%) | 188 (84.3%) |
| 45 to 54 Years | 79 (17.8%) | 364 (82.2%) |
| 55 to 64 Years | 108 (13.6%) | 668 (83.8%) |
| 65 to 74 Years | 275 (77.0%) | 217 (60.8%) |
| 75 Years and over | 256 (100.0%) | 156 (60.9%) |
| Total | 1,175 (29.4%) | 2,999 (74.9%) |
Disability Status by Sex by Age in Broad Brook
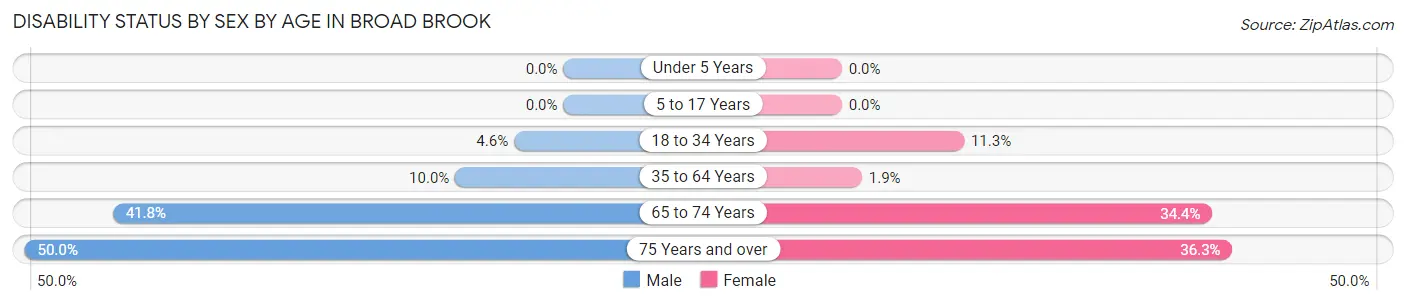
| Age Bracket | Male | Female |
| Under 5 Years | 0 (0.0%) | 0 (0.0%) |
| 5 to 17 Years | 0 (0.0%) | 0 (0.0%) |
| 18 to 34 Years | 20 (4.6%) | 73 (11.3%) |
| 35 to 64 Years | 55 (10.0%) | 17 (1.9%) |
| 65 to 74 Years | 69 (41.8%) | 66 (34.4%) |
| 75 Years and over | 48 (50.0%) | 58 (36.2%) |
Disability Class by Sex by Age in Broad Brook
Disability Class: Hearing Difficulty
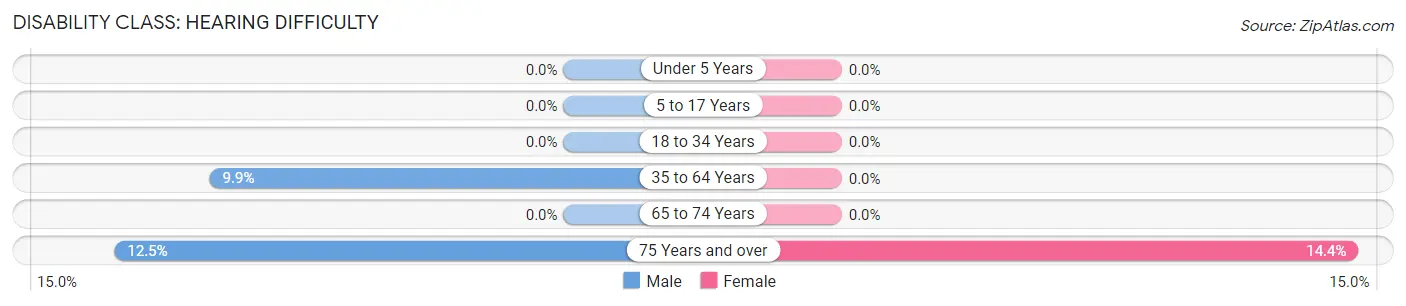
| Age Bracket | Male | Female |
| Under 5 Years | 0 (0.0%) | 0 (0.0%) |
| 5 to 17 Years | 0 (0.0%) | 0 (0.0%) |
| 18 to 34 Years | 0 (0.0%) | 0 (0.0%) |
| 35 to 64 Years | 54 (9.9%) | 0 (0.0%) |
| 65 to 74 Years | 0 (0.0%) | 0 (0.0%) |
| 75 Years and over | 12 (12.5%) | 23 (14.4%) |
Disability Class: Vision Difficulty
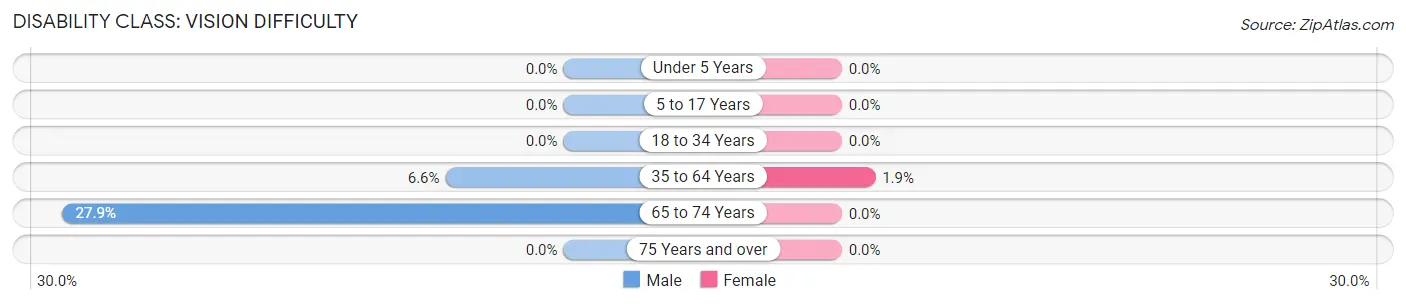
| Age Bracket | Male | Female |
| Under 5 Years | 0 (0.0%) | 0 (0.0%) |
| 5 to 17 Years | 0 (0.0%) | 0 (0.0%) |
| 18 to 34 Years | 0 (0.0%) | 0 (0.0%) |
| 35 to 64 Years | 36 (6.6%) | 17 (1.9%) |
| 65 to 74 Years | 46 (27.9%) | 0 (0.0%) |
| 75 Years and over | 0 (0.0%) | 0 (0.0%) |
Disability Class: Cognitive Difficulty
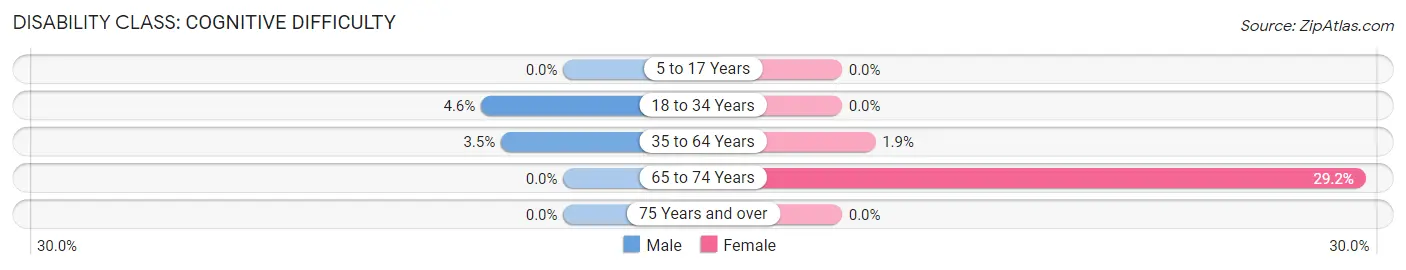
| Age Bracket | Male | Female |
| 5 to 17 Years | 0 (0.0%) | 0 (0.0%) |
| 18 to 34 Years | 20 (4.6%) | 0 (0.0%) |
| 35 to 64 Years | 19 (3.5%) | 17 (1.9%) |
| 65 to 74 Years | 0 (0.0%) | 56 (29.2%) |
| 75 Years and over | 0 (0.0%) | 0 (0.0%) |
Disability Class: Ambulatory Difficulty
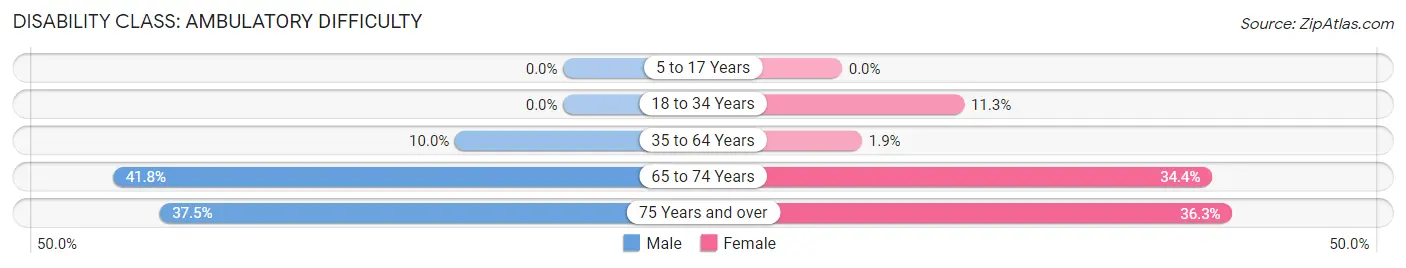
| Age Bracket | Male | Female |
| 5 to 17 Years | 0 (0.0%) | 0 (0.0%) |
| 18 to 34 Years | 0 (0.0%) | 73 (11.3%) |
| 35 to 64 Years | 55 (10.0%) | 17 (1.9%) |
| 65 to 74 Years | 69 (41.8%) | 66 (34.4%) |
| 75 Years and over | 36 (37.5%) | 58 (36.2%) |
Disability Class: Self-Care Difficulty
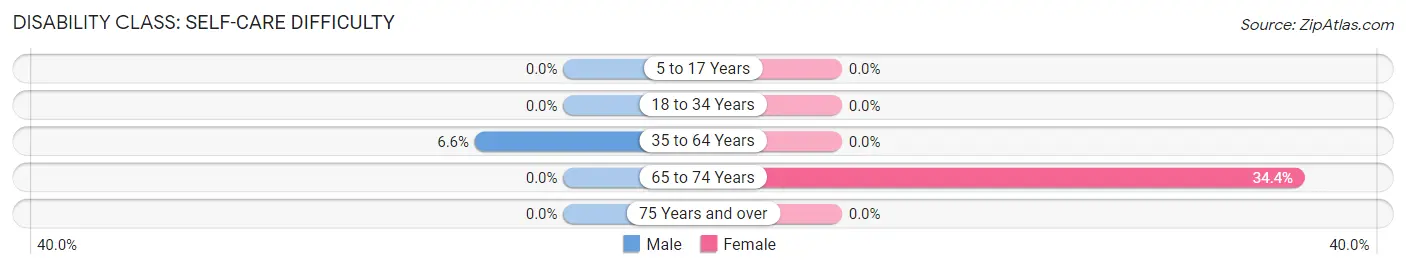
| Age Bracket | Male | Female |
| 5 to 17 Years | 0 (0.0%) | 0 (0.0%) |
| 18 to 34 Years | 0 (0.0%) | 0 (0.0%) |
| 35 to 64 Years | 36 (6.6%) | 0 (0.0%) |
| 65 to 74 Years | 0 (0.0%) | 66 (34.4%) |
| 75 Years and over | 0 (0.0%) | 0 (0.0%) |
Technology Access in Broad Brook
Computing Device Access in Broad Brook
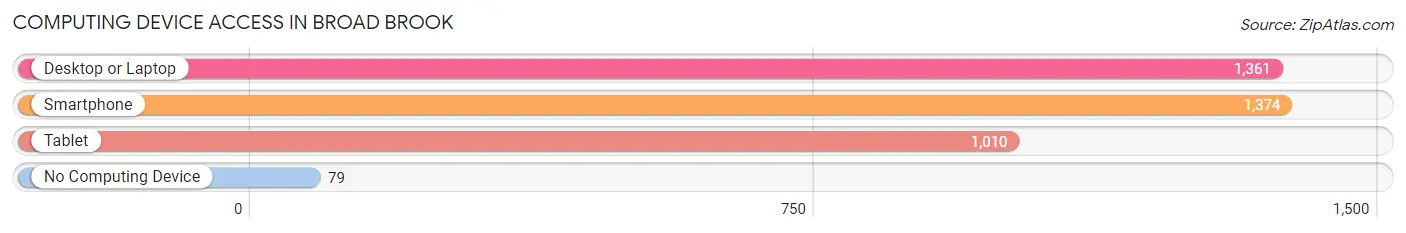
| Device Type | # Households | % Households |
| Desktop or Laptop | 1,361 | 84.6% |
| Smartphone | 1,374 | 85.5% |
| Tablet | 1,010 | 62.8% |
| No Computing Device | 79 | 4.9% |
| Total | 1,608 | 100.0% |
Internet Access in Broad Brook
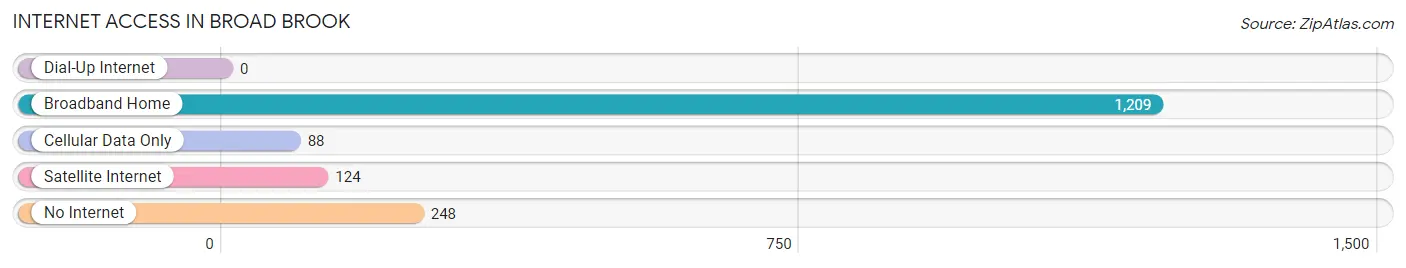
| Internet Type | # Households | % Households |
| Dial-Up Internet | 0 | 0.0% |
| Broadband Home | 1,209 | 75.2% |
| Cellular Data Only | 88 | 5.5% |
| Satellite Internet | 124 | 7.7% |
| No Internet | 248 | 15.4% |
| Total | 1,608 | 100.0% |
Broad Brook Summary
Broad Brook is a small town located in the northeastern part of Connecticut, in the town of East Windsor. It is bordered by the towns of Enfield, Windsor Locks, and East Windsor. The town has a population of approximately 4,000 people, and is located in Hartford County.
History
The area that is now Broad Brook was originally inhabited by the Podunk Indians, who were part of the Algonquin tribe. The first European settlers arrived in the area in the late 1600s, and the town was officially incorporated in 1845. The town was named after the nearby Broad Brook, which was a tributary of the Connecticut River.
The town was primarily an agricultural community for much of its history, with the main crops being corn, potatoes, and hay. The town also had several mills, including a grist mill, a saw mill, and a paper mill. The paper mill was the largest employer in the town, and it closed in the late 1970s.
Geography
Broad Brook is located in the northeastern part of Connecticut, in the town of East Windsor. It is bordered by the towns of Enfield, Windsor Locks, and East Windsor. The town has a total area of 4.2 square miles, all of which is land. The town is located in the Connecticut River Valley, and is part of the Hartford metropolitan area.
The town is located in a hilly area, with the highest point being the summit of Broad Brook Hill, which is located at an elevation of 590 feet. The town is located in a humid continental climate zone, with cold winters and hot, humid summers.
Economy
Broad Brook is primarily a residential community, and the town does not have any major industries. The town does have several small businesses, including a few restaurants, a grocery store, and a few retail stores. The town also has a few small manufacturing companies, including a plastics company and a machine shop.
The town is also home to several small farms, which produce a variety of crops, including corn, potatoes, hay, and vegetables. The town also has a few wineries, which produce a variety of wines.
Demographics
As of the 2010 census, the town had a population of 4,062 people. The racial makeup of the town was 94.3% White, 1.7% African American, 0.3% Native American, 1.2% Asian, 0.1% Pacific Islander, 0.9% from other races, and 1.6% from two or more races. Hispanic or Latino of any race were 3.2% of the population.
The median household income in the town was $68,958, and the median family income was $77,917. The per capita income in the town was $30,945. About 4.3% of the population was below the poverty line.
The town is served by the East Windsor Public Schools, which includes two elementary schools, one middle school, and one high school. The town also has a public library, which is part of the Hartford Public Library system.
Common Questions
What is Per Capita Income in Broad Brook?
Per Capita income in Broad Brook is $40,425.
What is the Median Family Income in Broad Brook?
Median Family Income in Broad Brook is $128,433.
What is the Median Household income in Broad Brook?
Median Household Income in Broad Brook is $93,243.
What is Income or Wage Gap in Broad Brook?
Income or Wage Gap in Broad Brook is 41.7%.
Women in Broad Brook earn 58.3 cents for every dollar earned by a man.
What is Family Income Deficit in Broad Brook?
Family Income Deficit in Broad Brook is $9,203.
Families that are below poverty line in Broad Brook earn $9,203 less on average than the poverty threshold level.
What is Inequality or Gini Index in Broad Brook?
Inequality or Gini Index in Broad Brook is 0.41.
What is the Total Population of Broad Brook?
Total Population of Broad Brook is 4,006.
What is the Total Male Population of Broad Brook?
Total Male Population of Broad Brook is 1,592.
What is the Total Female Population of Broad Brook?
Total Female Population of Broad Brook is 2,414.
What is the Ratio of Males per 100 Females in Broad Brook?
There are 65.95 Males per 100 Females in Broad Brook.
What is the Ratio of Females per 100 Males in Broad Brook?
There are 151.63 Females per 100 Males in Broad Brook.
What is the Median Population Age in Broad Brook?
Median Population Age in Broad Brook is 36.9 Years.
What is the Average Family Size in Broad Brook
Average Family Size in Broad Brook is 3.3 People.
What is the Average Household Size in Broad Brook
Average Household Size in Broad Brook is 2.5 People.
How Large is the Labor Force in Broad Brook?
There are 2,176 People in the Labor Forcein in Broad Brook.
What is the Percentage of People in the Labor Force in Broad Brook?
64.1% of People are in the Labor Force in Broad Brook.
What is the Unemployment Rate in Broad Brook?
Unemployment Rate in Broad Brook is 4.1%.