Glenville, CT Map & Demographics
Glenville Map
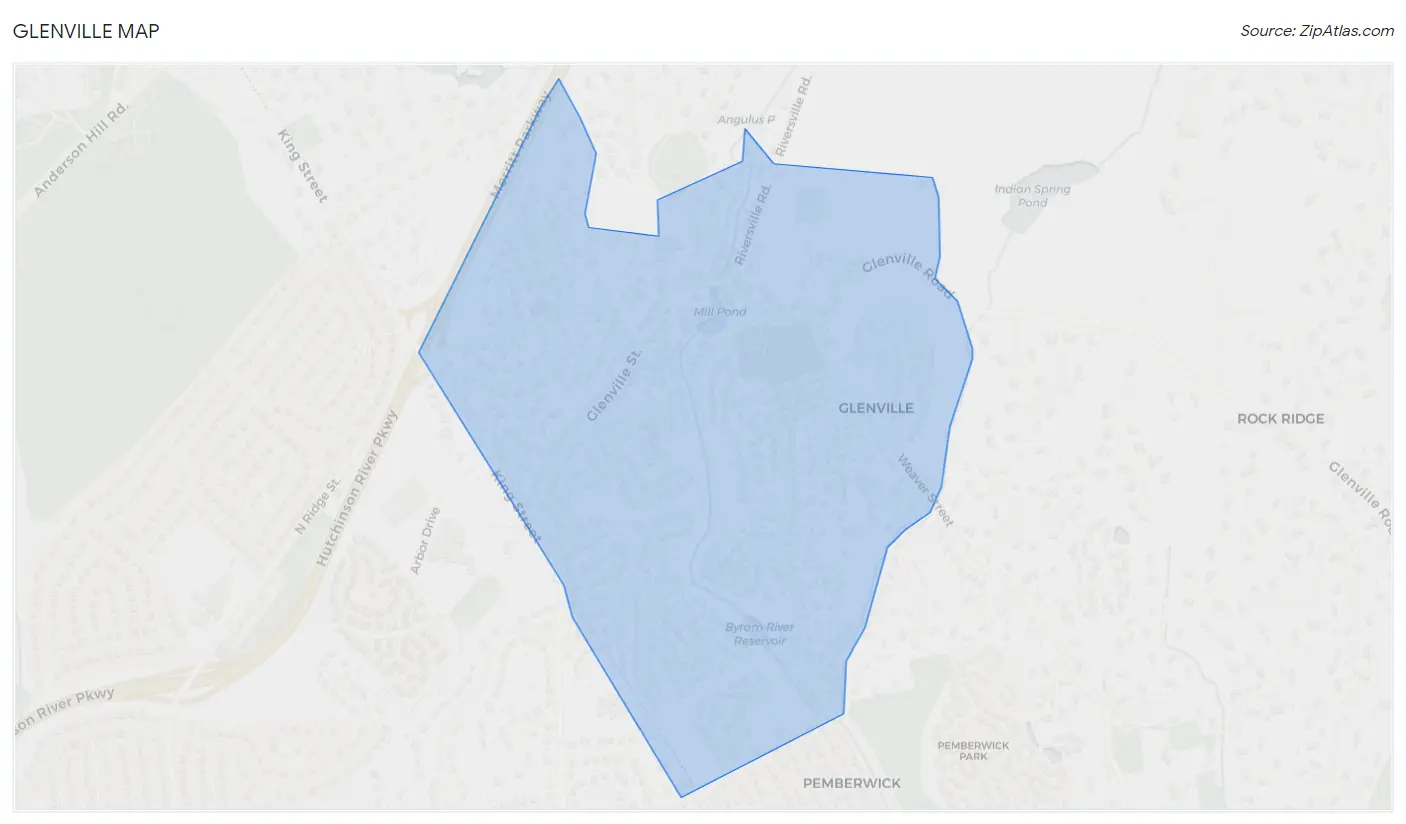
Glenville Overview
$115,516
PER CAPITA INCOME
$225,313
AVG FAMILY INCOME
$197,619
AVG HOUSEHOLD INCOME
52.6%
WAGE / INCOME GAP [ % ]
47.4¢/ $1
WAGE / INCOME GAP [ $ ]
0.51
INEQUALITY / GINI INDEX
3,112
TOTAL POPULATION
1,365
MALE POPULATION
1,747
FEMALE POPULATION
78.13
MALES / 100 FEMALES
127.99
FEMALES / 100 MALES
41.8
MEDIAN AGE
3.2
AVG FAMILY SIZE
2.8
AVG HOUSEHOLD SIZE
2,029
LABOR FORCE [ PEOPLE ]
74.4%
PERCENT IN LABOR FORCE
7.4%
UNEMPLOYMENT RATE
Income in Glenville
Income Overview in Glenville
Per Capita Income in Glenville is $115,516, while median incomes of families and households are $225,313 and $197,619 respectively.
| Characteristic | Number | Measure |
| Per Capita Income | 3,112 | $115,516 |
| Median Family Income | 851 | $225,313 |
| Mean Family Income | 851 | $343,994 |
| Median Household Income | 1,096 | $197,619 |
| Mean Household Income | 1,096 | $289,609 |
| Income Deficit | 851 | $0 |
| Wage / Income Gap (%) | 3,112 | 52.58% |
| Wage / Income Gap ($) | 3,112 | 47.42¢ per $1 |
| Gini / Inequality Index | 3,112 | 0.51 |
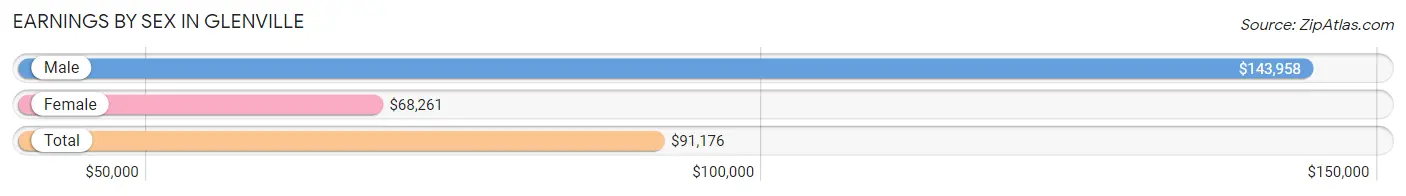
Earnings by Sex in Glenville
Average Earnings in Glenville are $91,176, $143,958 for men and $68,261 for women, a difference of 52.6%.
| Sex | Number | Average Earnings |
| Male | 892 (43.7%) | $143,958 |
| Female | 1,150 (56.3%) | $68,261 |
| Total | 2,042 (100.0%) | $91,176 |
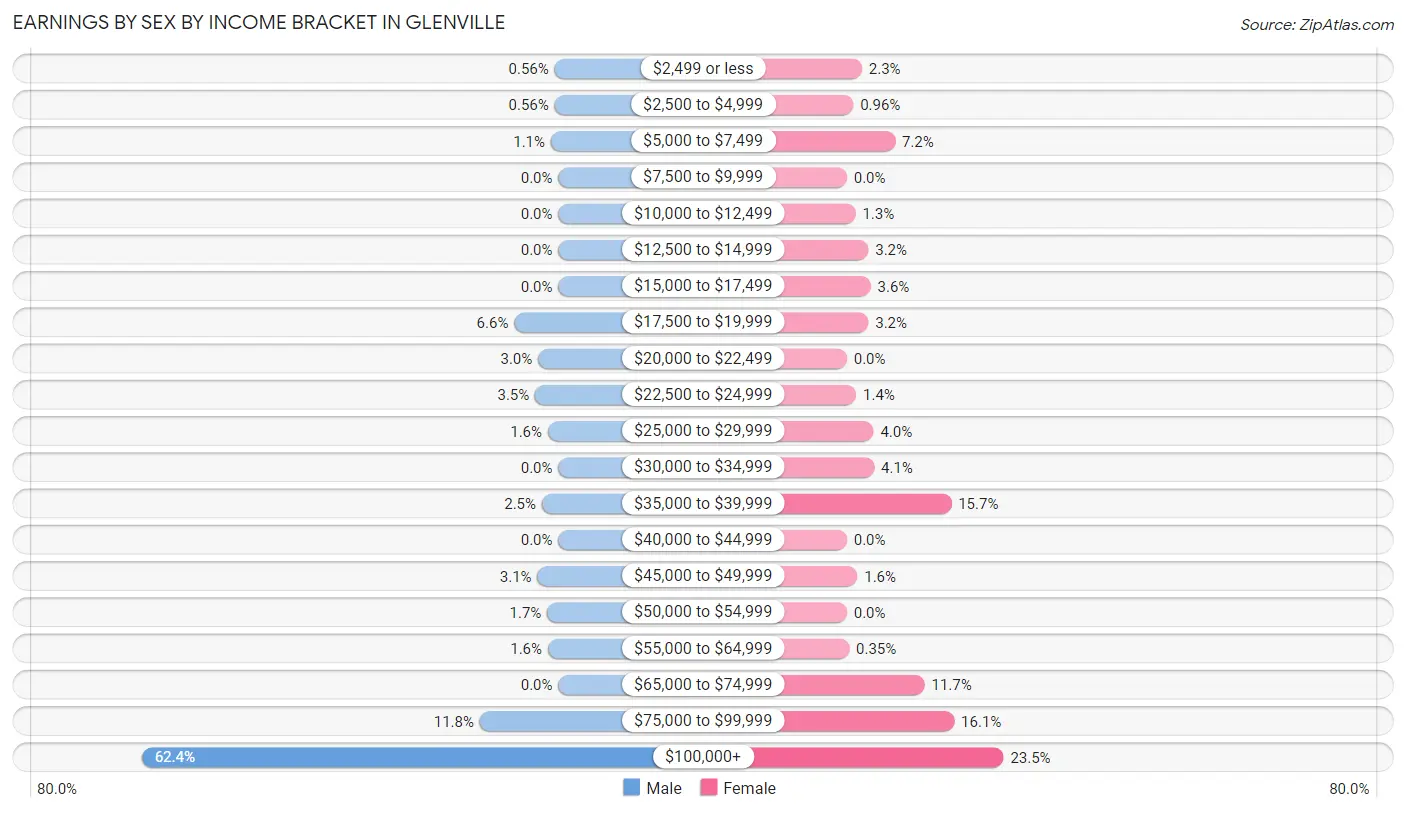
Earnings by Sex by Income Bracket in Glenville
The most common earnings brackets in Glenville are $100,000+ for men (557 | 62.4%) and $100,000+ for women (270 | 23.5%).
| Income | Male | Female |
| $2,499 or less | 5 (0.6%) | 26 (2.3%) |
| $2,500 to $4,999 | 5 (0.6%) | 11 (1.0%) |
| $5,000 to $7,499 | 10 (1.1%) | 83 (7.2%) |
| $7,500 to $9,999 | 0 (0.0%) | 0 (0.0%) |
| $10,000 to $12,499 | 0 (0.0%) | 15 (1.3%) |
| $12,500 to $14,999 | 0 (0.0%) | 37 (3.2%) |
| $15,000 to $17,499 | 0 (0.0%) | 41 (3.6%) |
| $17,500 to $19,999 | 59 (6.6%) | 37 (3.2%) |
| $20,000 to $22,499 | 27 (3.0%) | 0 (0.0%) |
| $22,500 to $24,999 | 31 (3.5%) | 16 (1.4%) |
| $25,000 to $29,999 | 14 (1.6%) | 46 (4.0%) |
| $30,000 to $34,999 | 0 (0.0%) | 47 (4.1%) |
| $35,000 to $39,999 | 22 (2.5%) | 180 (15.7%) |
| $40,000 to $44,999 | 0 (0.0%) | 0 (0.0%) |
| $45,000 to $49,999 | 28 (3.1%) | 18 (1.6%) |
| $50,000 to $54,999 | 15 (1.7%) | 0 (0.0%) |
| $55,000 to $64,999 | 14 (1.6%) | 4 (0.4%) |
| $65,000 to $74,999 | 0 (0.0%) | 134 (11.7%) |
| $75,000 to $99,999 | 105 (11.8%) | 185 (16.1%) |
| $100,000+ | 557 (62.4%) | 270 (23.5%) |
| Total | 892 (100.0%) | 1,150 (100.0%) |
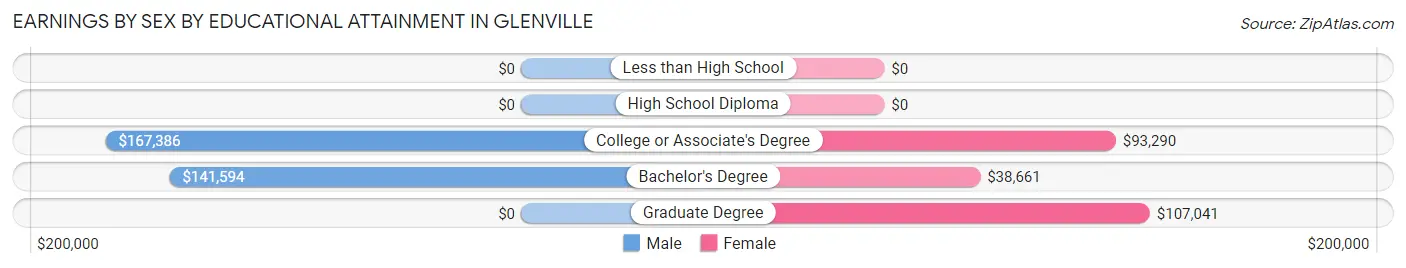
Earnings by Sex by Educational Attainment in Glenville
Average earnings in Glenville are $152,547 for men and $71,775 for women, a difference of 52.9%. Men with an educational attainment of college or associate's degree enjoy the highest average annual earnings of $167,386, while those with bachelor's degree education earn the least with $141,594. Women with an educational attainment of graduate degree earn the most with the average annual earnings of $107,041, while those with bachelor's degree education have the smallest earnings of $38,661.
| Educational Attainment | Male Income | Female Income |
| Less than High School | - | - |
| High School Diploma | - | - |
| College or Associate's Degree | $167,386 | $93,290 |
| Bachelor's Degree | $141,594 | $38,661 |
| Graduate Degree | - | - |
| Total | $152,547 | $71,775 |
Family Income in Glenville
Family Income Brackets in Glenville
According to the Glenville family income data, there are 468 families falling into the $200,000+ income range, which is the most common income bracket and makes up 55.0% of all families.
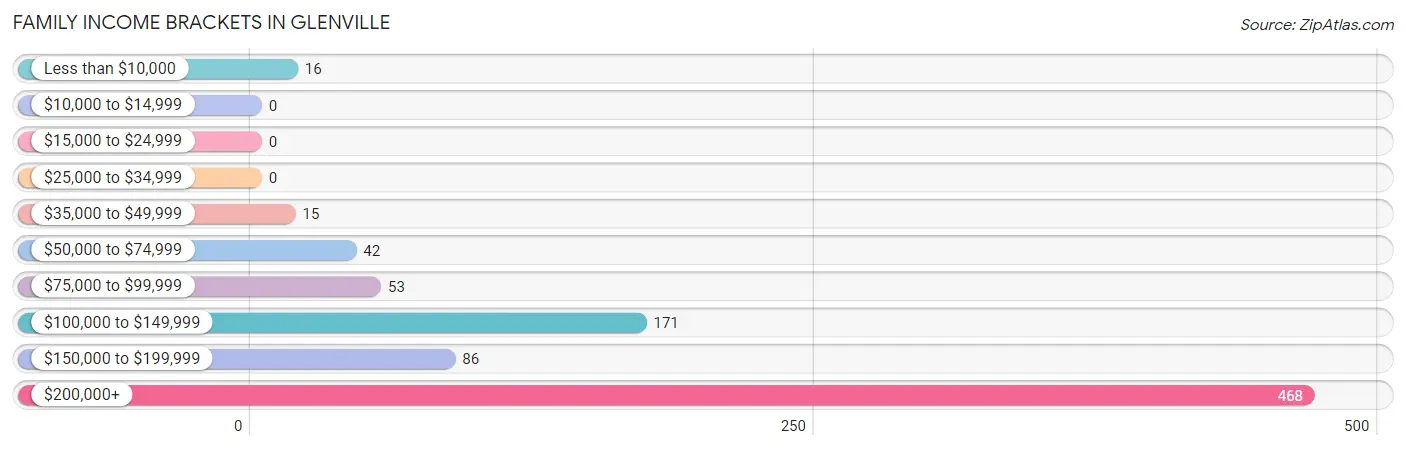
| Income Bracket | # Families | % Families |
| Less than $10,000 | 16 | 1.9% |
| $10,000 to $14,999 | 0 | 0.0% |
| $15,000 to $24,999 | 0 | 0.0% |
| $25,000 to $34,999 | 0 | 0.0% |
| $35,000 to $49,999 | 15 | 1.8% |
| $50,000 to $74,999 | 42 | 4.9% |
| $75,000 to $99,999 | 53 | 6.2% |
| $100,000 to $149,999 | 171 | 20.1% |
| $150,000 to $199,999 | 86 | 10.1% |
| $200,000+ | 468 | 55.0% |
Family Income by Famaliy Size in Glenville
4-person families (168 | 19.7%) account for the highest median family income in Glenville with $250,001 per family, while 2-person families (349 | 41.0%) have the highest median income of $85,842 per family member.
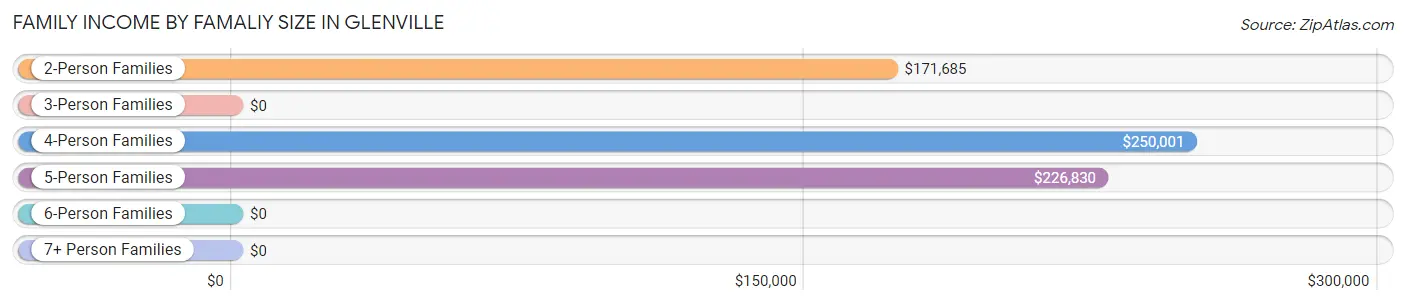
| Income Bracket | # Families | Median Income |
| 2-Person Families | 349 (41.0%) | $171,685 |
| 3-Person Families | 249 (29.3%) | $0 |
| 4-Person Families | 168 (19.7%) | $250,001 |
| 5-Person Families | 85 (10.0%) | $226,830 |
| 6-Person Families | 0 (0.0%) | $0 |
| 7+ Person Families | 0 (0.0%) | $0 |
| Total | 851 (100.0%) | $225,313 |
Family Income by Number of Earners in Glenville
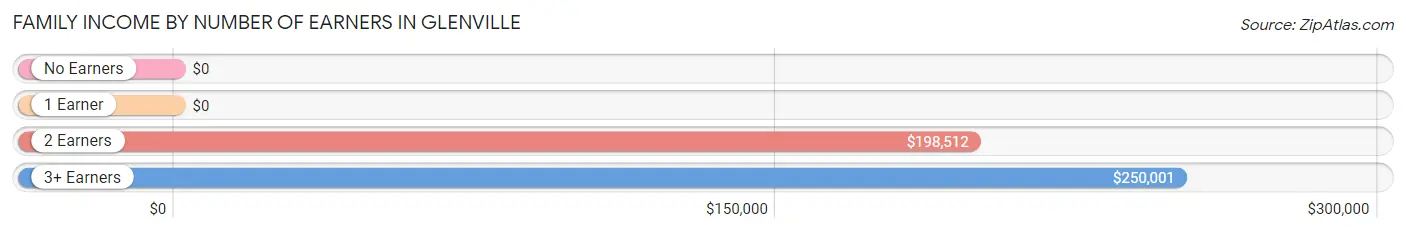
| Number of Earners | # Families | Median Income |
| No Earners | 73 (8.6%) | $0 |
| 1 Earner | 110 (12.9%) | $0 |
| 2 Earners | 479 (56.3%) | $198,512 |
| 3+ Earners | 189 (22.2%) | $250,001 |
| Total | 851 (100.0%) | $225,313 |
Household Income in Glenville
Household Income Brackets in Glenville
With 528 households falling in the category, the $200,000+ income range is the most frequent in Glenville, accounting for 48.2% of all households.

| Income Bracket | # Households | % Households |
| Less than $10,000 | 77 | 7.0% |
| $10,000 to $14,999 | 0 | 0.0% |
| $15,000 to $24,999 | 8 | 0.7% |
| $25,000 to $34,999 | 0 | 0.0% |
| $35,000 to $49,999 | 34 | 3.1% |
| $50,000 to $74,999 | 98 | 8.9% |
| $75,000 to $99,999 | 62 | 5.7% |
| $100,000 to $149,999 | 196 | 17.9% |
| $150,000 to $199,999 | 92 | 8.4% |
| $200,000+ | 528 | 48.2% |
Household Income by Householder Age in Glenville
The median household income in Glenville is $197,619, with the highest median household income of $245,893 found in the 25 to 44 years age bracket for the primary householder. A total of 260 households (23.7%) fall into this category.
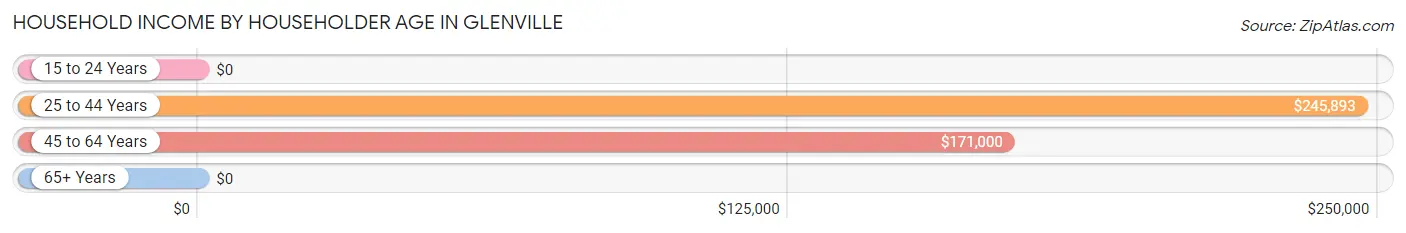
| Income Bracket | # Households | Median Income |
| 15 to 24 Years | 0 (0.0%) | $0 |
| 25 to 44 Years | 260 (23.7%) | $245,893 |
| 45 to 64 Years | 558 (50.9%) | $171,000 |
| 65+ Years | 278 (25.4%) | $0 |
| Total | 1,096 (100.0%) | $197,619 |
Poverty in Glenville
Income Below Poverty by Sex and Age in Glenville
With 7.5% poverty level for males and 4.3% for females among the residents of Glenville, 75 year old and over males and under 5 year old females are the most vulnerable to poverty, with 42 males (38.2%) and 23 females (100.0%) in their respective age groups living below the poverty level.
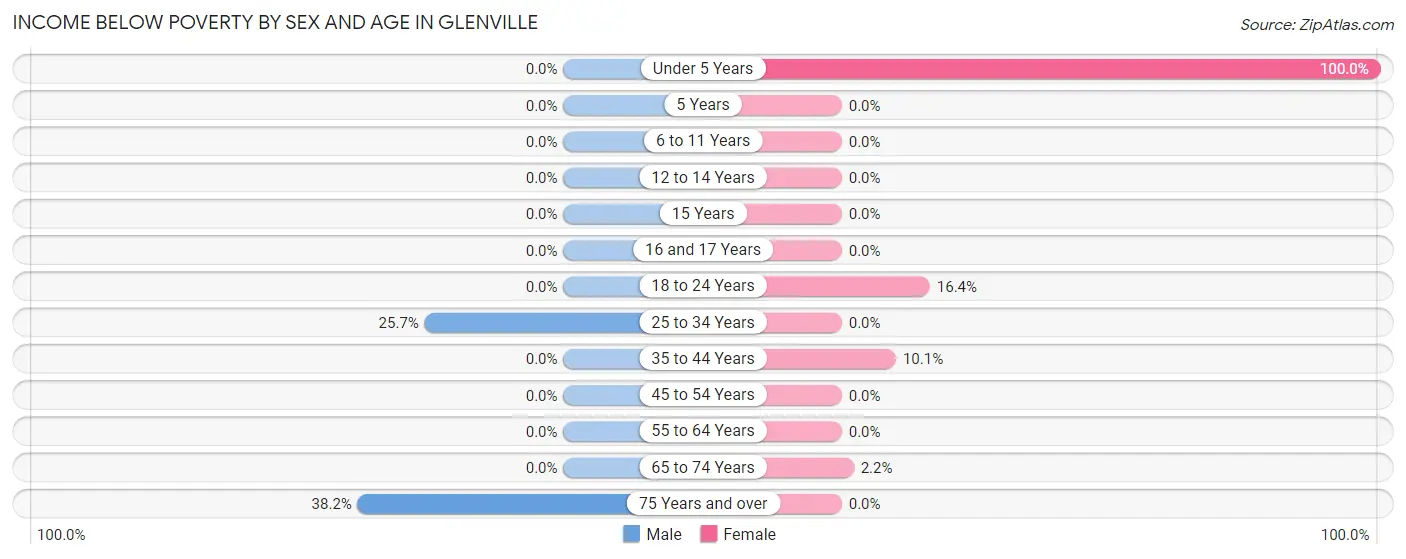
| Age Bracket | Male | Female |
| Under 5 Years | 0 (0.0%) | 23 (100.0%) |
| 5 Years | 0 (0.0%) | 0 (0.0%) |
| 6 to 11 Years | 0 (0.0%) | 0 (0.0%) |
| 12 to 14 Years | 0 (0.0%) | 0 (0.0%) |
| 15 Years | 0 (0.0%) | 0 (0.0%) |
| 16 and 17 Years | 0 (0.0%) | 0 (0.0%) |
| 18 to 24 Years | 0 (0.0%) | 34 (16.4%) |
| 25 to 34 Years | 61 (25.7%) | 0 (0.0%) |
| 35 to 44 Years | 0 (0.0%) | 16 (10.1%) |
| 45 to 54 Years | 0 (0.0%) | 0 (0.0%) |
| 55 to 64 Years | 0 (0.0%) | 0 (0.0%) |
| 65 to 74 Years | 0 (0.0%) | 3 (2.2%) |
| 75 Years and over | 42 (38.2%) | 0 (0.0%) |
| Total | 103 (7.5%) | 76 (4.3%) |
Income Above Poverty by Sex and Age in Glenville
According to the poverty statistics in Glenville, males aged under 5 years and females aged 5 years are the age groups that are most secure financially, with 100.0% of males and 100.0% of females in these age groups living above the poverty line.
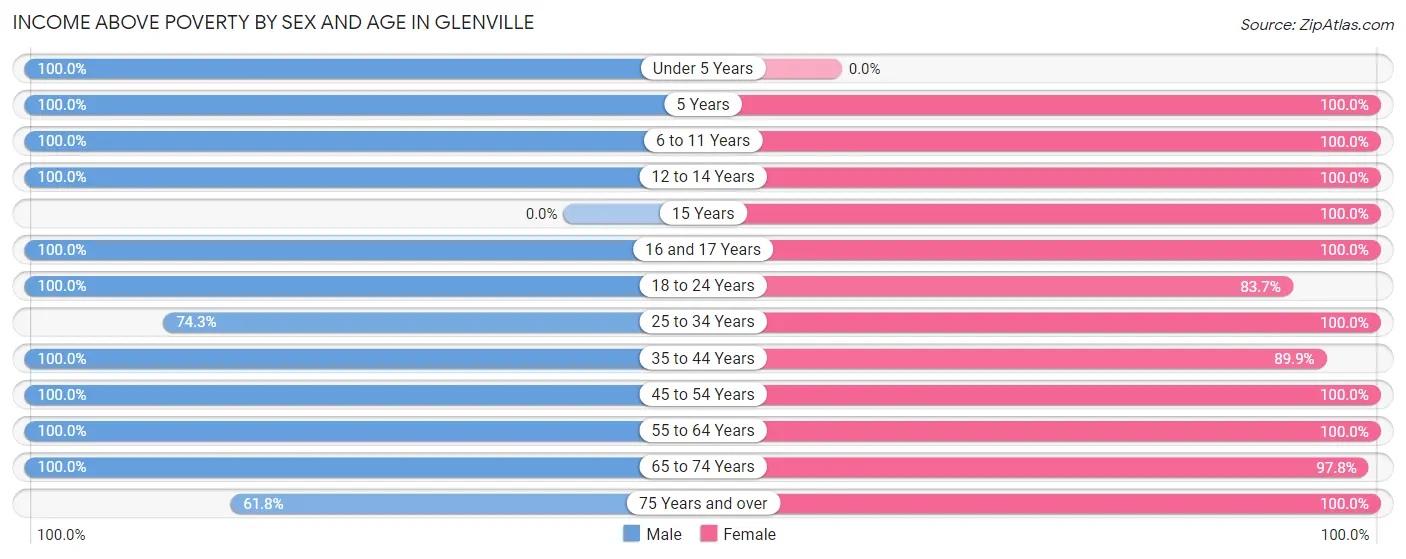
| Age Bracket | Male | Female |
| Under 5 Years | 19 (100.0%) | 0 (0.0%) |
| 5 Years | 20 (100.0%) | 34 (100.0%) |
| 6 to 11 Years | 97 (100.0%) | 17 (100.0%) |
| 12 to 14 Years | 84 (100.0%) | 65 (100.0%) |
| 15 Years | 0 (0.0%) | 26 (100.0%) |
| 16 and 17 Years | 42 (100.0%) | 109 (100.0%) |
| 18 to 24 Years | 69 (100.0%) | 174 (83.7%) |
| 25 to 34 Years | 176 (74.3%) | 311 (100.0%) |
| 35 to 44 Years | 114 (100.0%) | 143 (89.9%) |
| 45 to 54 Years | 211 (100.0%) | 359 (100.0%) |
| 55 to 64 Years | 217 (100.0%) | 233 (100.0%) |
| 65 to 74 Years | 145 (100.0%) | 133 (97.8%) |
| 75 Years and over | 68 (61.8%) | 67 (100.0%) |
| Total | 1,262 (92.4%) | 1,671 (95.7%) |
Income Below Poverty Among Married-Couple Families in Glenville
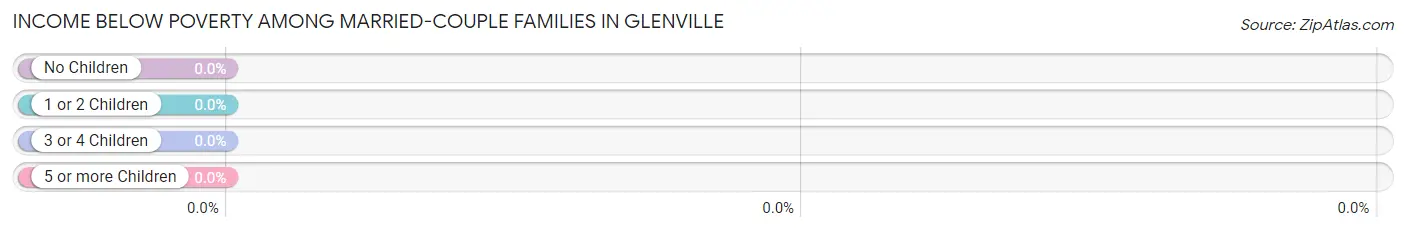
| Children | Above Poverty | Below Poverty |
| No Children | 521 (100.0%) | 0 (0.0%) |
| 1 or 2 Children | 104 (100.0%) | 0 (0.0%) |
| 3 or 4 Children | 63 (100.0%) | 0 (0.0%) |
| 5 or more Children | 0 (0.0%) | 0 (0.0%) |
| Total | 688 (100.0%) | 0 (0.0%) |
Income Below Poverty Among Single-Parent Households in Glenville
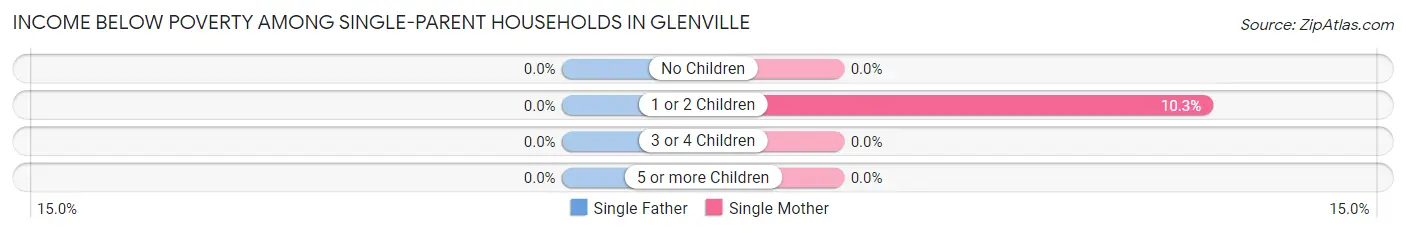
| Children | Single Father | Single Mother |
| No Children | 0 (0.0%) | 0 (0.0%) |
| 1 or 2 Children | 0 (0.0%) | 16 (10.3%) |
| 3 or 4 Children | 0 (0.0%) | 0 (0.0%) |
| 5 or more Children | 0 (0.0%) | 0 (0.0%) |
| Total | 0 (0.0%) | 16 (10.3%) |
Income Below Poverty Among Married-Couple vs Single-Parent Households in Glenville
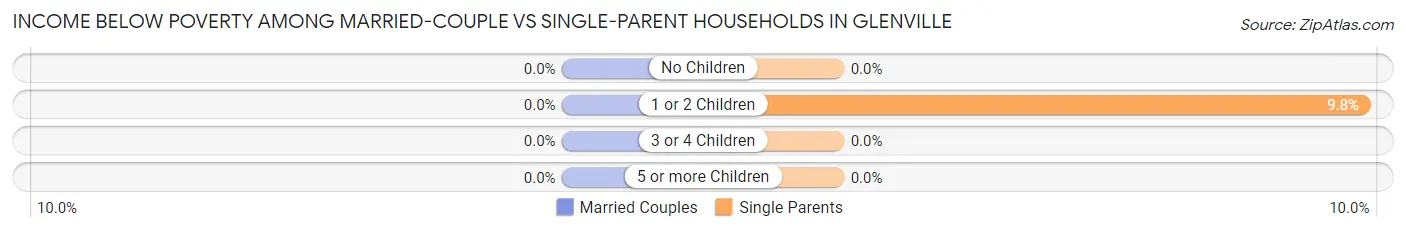
| Children | Married-Couple Families | Single-Parent Households |
| No Children | 0 (0.0%) | 0 (0.0%) |
| 1 or 2 Children | 0 (0.0%) | 16 (9.8%) |
| 3 or 4 Children | 0 (0.0%) | 0 (0.0%) |
| 5 or more Children | 0 (0.0%) | 0 (0.0%) |
| Total | 0 (0.0%) | 16 (9.8%) |
Race in Glenville
The most populous races in Glenville are White / Caucasian (2,554 | 82.1%), Black / African American (339 | 10.9%), and Hispanic or Latino (184 | 5.9%).
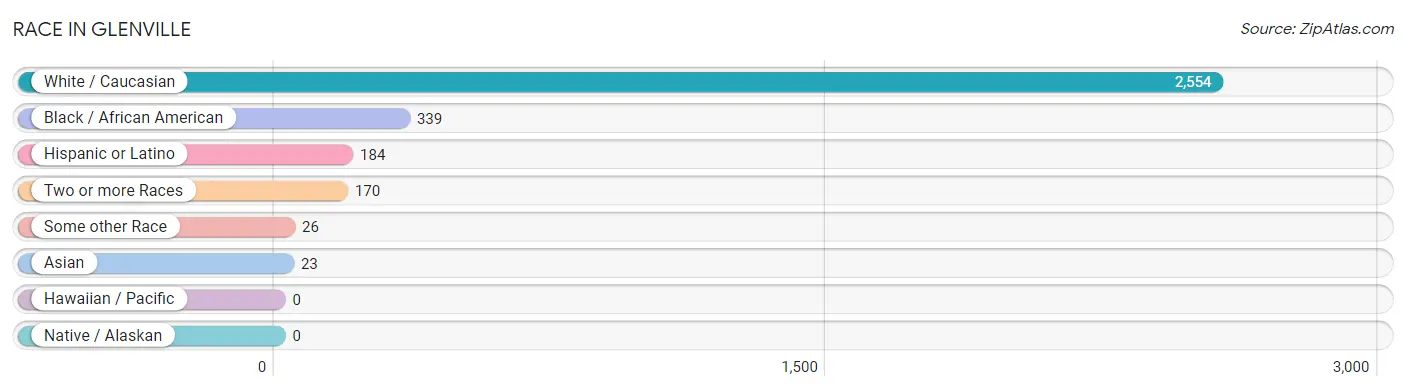
| Race | # Population | % Population |
| Asian | 23 | 0.7% |
| Black / African American | 339 | 10.9% |
| Hawaiian / Pacific | 0 | 0.0% |
| Hispanic or Latino | 184 | 5.9% |
| Native / Alaskan | 0 | 0.0% |
| White / Caucasian | 2,554 | 82.1% |
| Two or more Races | 170 | 5.5% |
| Some other Race | 26 | 0.8% |
| Total | 3,112 | 100.0% |
Ancestry in Glenville
The most populous ancestries reported in Glenville are Italian (987 | 31.7%), Irish (385 | 12.4%), German (341 | 11.0%), English (323 | 10.4%), and Russian (151 | 4.9%), together accounting for 70.3% of all Glenville residents.
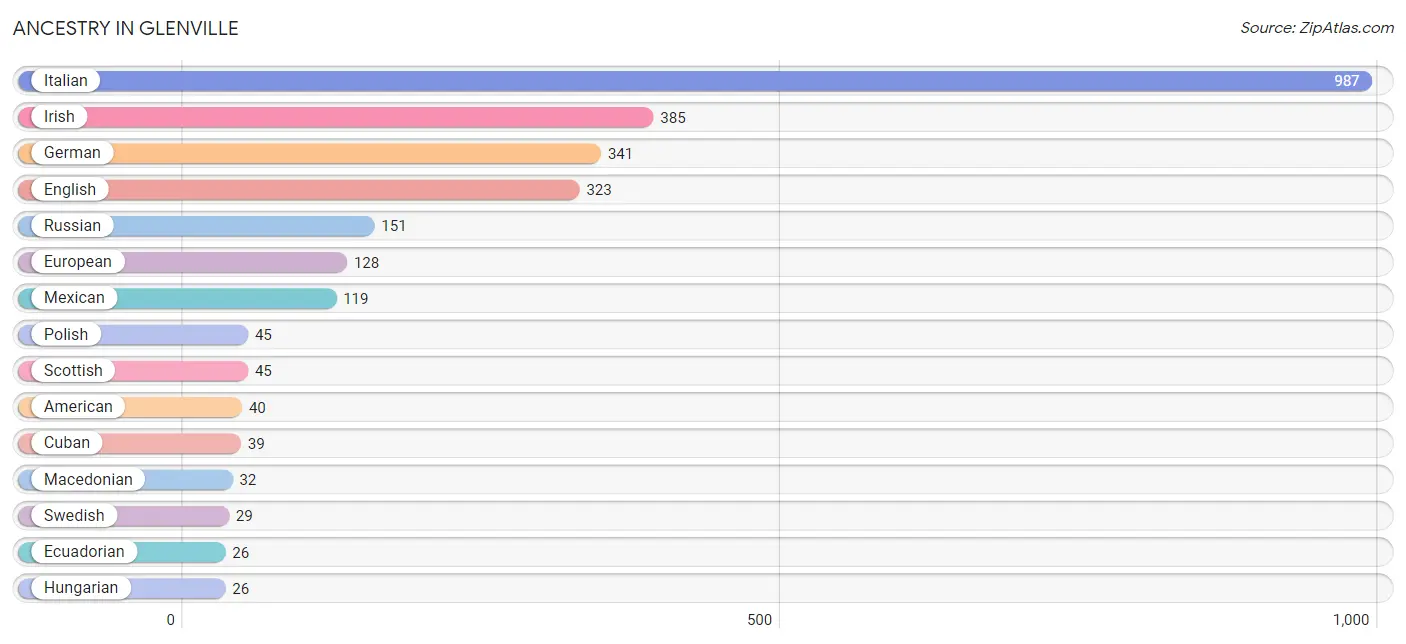
| Ancestry | # Population | % Population |
| American | 40 | 1.3% |
| Australian | 5 | 0.2% |
| Austrian | 8 | 0.3% |
| Cuban | 39 | 1.3% |
| Czech | 4 | 0.1% |
| Danish | 15 | 0.5% |
| Ecuadorian | 26 | 0.8% |
| English | 323 | 10.4% |
| European | 128 | 4.1% |
| French | 14 | 0.4% |
| German | 341 | 11.0% |
| Greek | 16 | 0.5% |
| Hungarian | 26 | 0.8% |
| Indian (Asian) | 18 | 0.6% |
| Irish | 385 | 12.4% |
| Italian | 987 | 31.7% |
| Macedonian | 32 | 1.0% |
| Mexican | 119 | 3.8% |
| Polish | 45 | 1.5% |
| Portuguese | 4 | 0.1% |
| Russian | 151 | 4.9% |
| Scotch-Irish | 25 | 0.8% |
| Scottish | 45 | 1.5% |
| Slavic | 11 | 0.4% |
| South American | 26 | 0.8% |
| Swedish | 29 | 0.9% |
| Ukrainian | 22 | 0.7% | View All 27 Rows |
Immigrants in Glenville
The most numerous immigrant groups reported in Glenville came from Europe (139 | 4.5%), Western Europe (51 | 1.6%), Eastern Europe (43 | 1.4%), Russia (43 | 1.4%), and Asia (33 | 1.1%), together accounting for 9.9% of all Glenville residents.
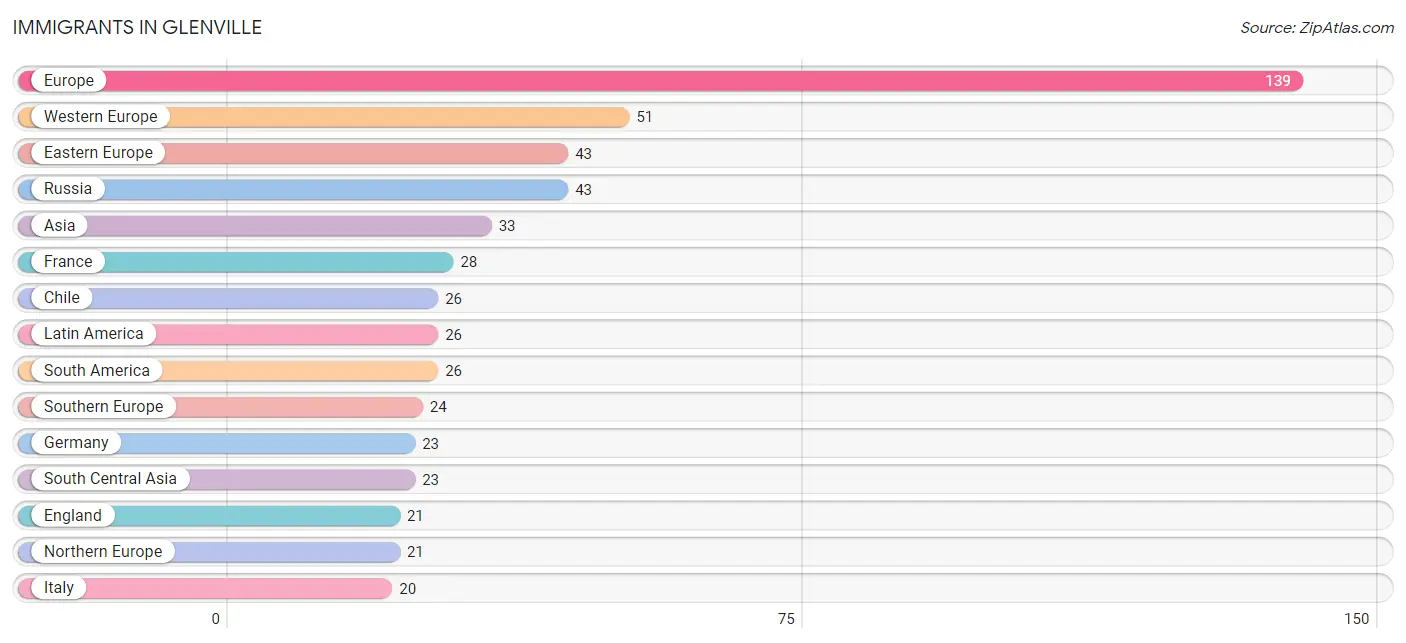
| Immigration Origin | # Population | % Population |
| Asia | 33 | 1.1% |
| Australia | 5 | 0.2% |
| Chile | 26 | 0.8% |
| Eastern Europe | 43 | 1.4% |
| England | 21 | 0.7% |
| Europe | 139 | 4.5% |
| France | 28 | 0.9% |
| Germany | 23 | 0.7% |
| Israel | 10 | 0.3% |
| Italy | 20 | 0.6% |
| Latin America | 26 | 0.8% |
| Northern Europe | 21 | 0.7% |
| Oceania | 5 | 0.2% |
| Pakistan | 6 | 0.2% |
| Portugal | 4 | 0.1% |
| Russia | 43 | 1.4% |
| South America | 26 | 0.8% |
| South Central Asia | 23 | 0.7% |
| Southern Europe | 24 | 0.8% |
| Sri Lanka | 17 | 0.5% |
| Western Asia | 10 | 0.3% |
| Western Europe | 51 | 1.6% | View All 22 Rows |
Sex and Age in Glenville
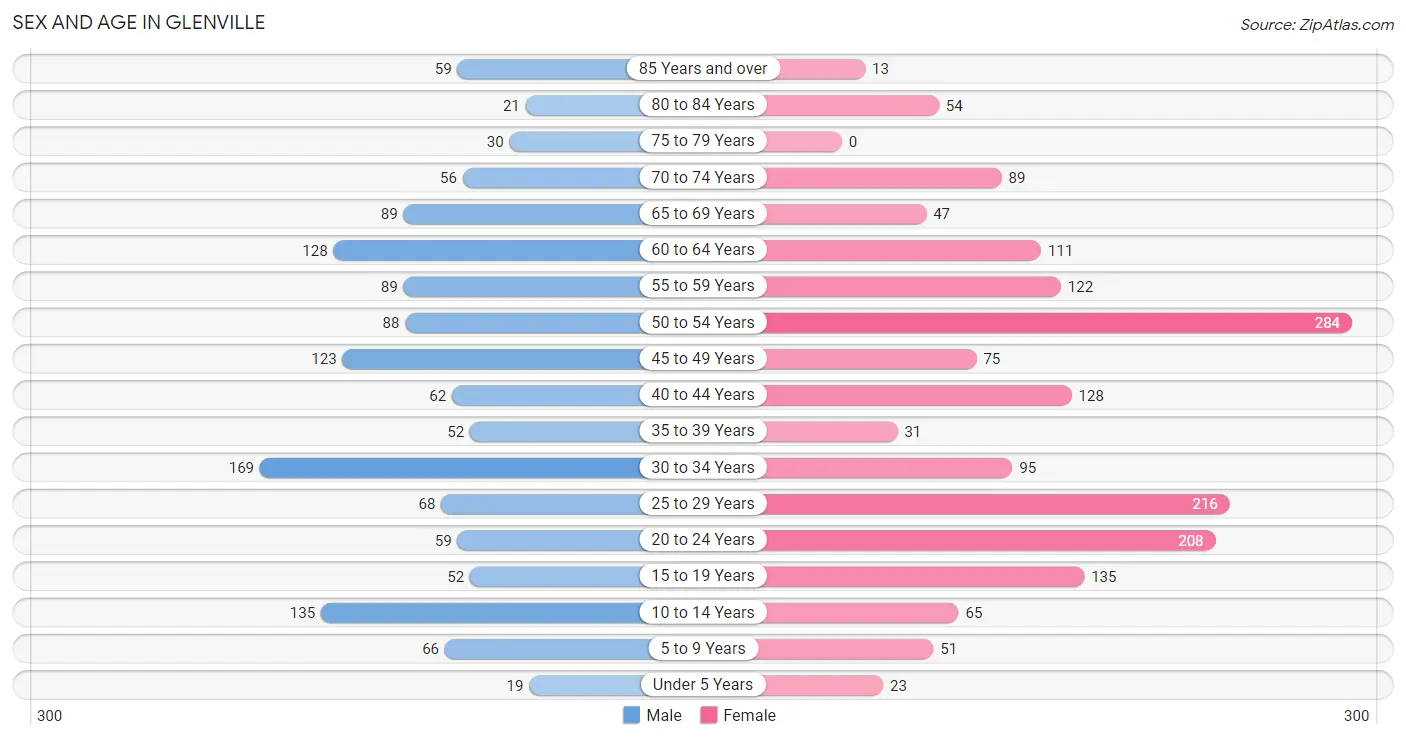
Sex and Age in Glenville
The most populous age groups in Glenville are 30 to 34 Years (169 | 12.4%) for men and 50 to 54 Years (284 | 16.3%) for women.
| Age Bracket | Male | Female |
| Under 5 Years | 19 (1.4%) | 23 (1.3%) |
| 5 to 9 Years | 66 (4.8%) | 51 (2.9%) |
| 10 to 14 Years | 135 (9.9%) | 65 (3.7%) |
| 15 to 19 Years | 52 (3.8%) | 135 (7.7%) |
| 20 to 24 Years | 59 (4.3%) | 208 (11.9%) |
| 25 to 29 Years | 68 (5.0%) | 216 (12.4%) |
| 30 to 34 Years | 169 (12.4%) | 95 (5.4%) |
| 35 to 39 Years | 52 (3.8%) | 31 (1.8%) |
| 40 to 44 Years | 62 (4.5%) | 128 (7.3%) |
| 45 to 49 Years | 123 (9.0%) | 75 (4.3%) |
| 50 to 54 Years | 88 (6.5%) | 284 (16.3%) |
| 55 to 59 Years | 89 (6.5%) | 122 (7.0%) |
| 60 to 64 Years | 128 (9.4%) | 111 (6.4%) |
| 65 to 69 Years | 89 (6.5%) | 47 (2.7%) |
| 70 to 74 Years | 56 (4.1%) | 89 (5.1%) |
| 75 to 79 Years | 30 (2.2%) | 0 (0.0%) |
| 80 to 84 Years | 21 (1.5%) | 54 (3.1%) |
| 85 Years and over | 59 (4.3%) | 13 (0.7%) |
| Total | 1,365 (100.0%) | 1,747 (100.0%) |
Families and Households in Glenville
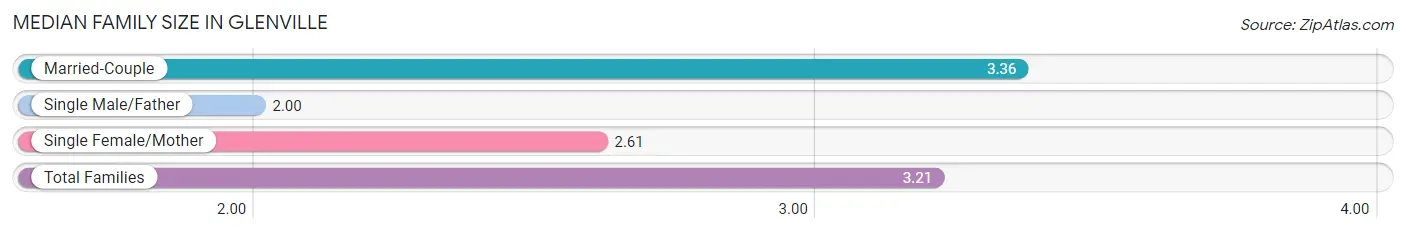
Median Family Size in Glenville
The median family size in Glenville is 3.21 persons per family, with married-couple families (688 | 80.8%) accounting for the largest median family size of 3.36 persons per family. On the other hand, single male/father families (8 | 0.9%) represent the smallest median family size with 2.00 persons per family.
| Family Type | # Families | Family Size |
| Married-Couple | 688 (80.8%) | 3.36 |
| Single Male/Father | 8 (0.9%) | 2.00 |
| Single Female/Mother | 155 (18.2%) | 2.61 |
| Total Families | 851 (100.0%) | 3.21 |
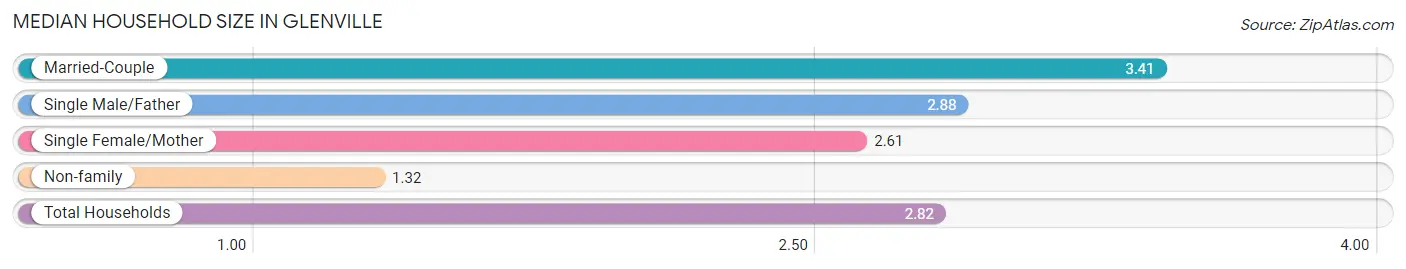
Median Household Size in Glenville
The median household size in Glenville is 2.82 persons per household, with married-couple households (688 | 62.8%) accounting for the largest median household size of 3.41 persons per household. non-family households (245 | 22.4%) represent the smallest median household size with 1.32 persons per household.
| Household Type | # Households | Household Size |
| Married-Couple | 688 (62.8%) | 3.41 |
| Single Male/Father | 8 (0.7%) | 2.88 |
| Single Female/Mother | 155 (14.1%) | 2.61 |
| Non-family | 245 (22.4%) | 1.32 |
| Total Households | 1,096 (100.0%) | 2.82 |
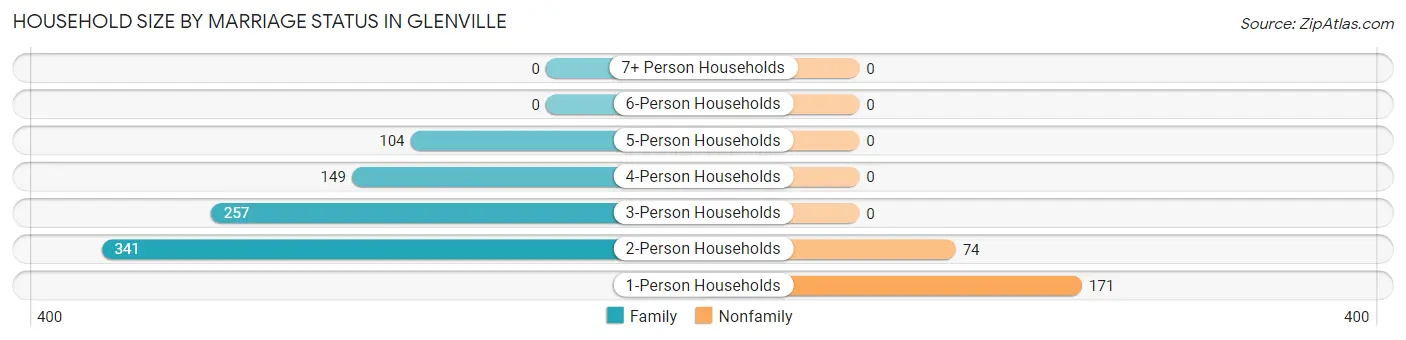
Household Size by Marriage Status in Glenville
Out of a total of 1,096 households in Glenville, 851 (77.6%) are family households, while 245 (22.4%) are nonfamily households. The most numerous type of family households are 2-person households, comprising 341, and the most common type of nonfamily households are 1-person households, comprising 171.
| Household Size | Family Households | Nonfamily Households |
| 1-Person Households | - | 171 (15.6%) |
| 2-Person Households | 341 (31.1%) | 74 (6.8%) |
| 3-Person Households | 257 (23.4%) | 0 (0.0%) |
| 4-Person Households | 149 (13.6%) | 0 (0.0%) |
| 5-Person Households | 104 (9.5%) | 0 (0.0%) |
| 6-Person Households | 0 (0.0%) | 0 (0.0%) |
| 7+ Person Households | 0 (0.0%) | 0 (0.0%) |
| Total | 851 (77.6%) | 245 (22.4%) |
Female Fertility in Glenville
Fertility by Age in Glenville
| Age Bracket | Women with Births | Births / 1,000 Women |
| 15 to 19 years | 0 (0.0%) | 0.0 |
| 20 to 34 years | 0 (0.0%) | 0.0 |
| 35 to 50 years | 0 (0.0%) | 0.0 |
| Total | 0 (0.0%) | 0.0 |
Fertility by Age by Marriage Status in Glenville
| Age Bracket | Married | Unmarried |
| 15 to 19 years | 0 (0.0%) | 0 (0.0%) |
| 20 to 34 years | 0 (0.0%) | 0 (0.0%) |
| 35 to 50 years | 0 (0.0%) | 0 (0.0%) |
| Total | 0 (0.0%) | 0 (0.0%) |
Fertility by Education in Glenville
| Educational Attainment | Women with Births | Births / 1,000 Women |
| Less than High School | 0 (0.0%) | 0.0 |
| High School Diploma | 0 (0.0%) | 0.0 |
| College or Associate's Degree | 0 (0.0%) | 0.0 |
| Bachelor's Degree | 0 (0.0%) | 0.0 |
| Graduate Degree | 0 (0.0%) | 0.0 |
| Total | 0 (0.0%) | 0.0 |
Fertility by Education by Marriage Status in Glenville
| Educational Attainment | Married | Unmarried |
| Less than High School | 0 (0.0%) | 0 (0.0%) |
| High School Diploma | 0 (0.0%) | 0 (0.0%) |
| College or Associate's Degree | 0 (0.0%) | 0 (0.0%) |
| Bachelor's Degree | 0 (0.0%) | 0 (0.0%) |
| Graduate Degree | 0 (0.0%) | 0 (0.0%) |
| Total | 0 (0.0%) | 0 (0.0%) |
Employment Characteristics in Glenville
Employment by Class of Employer in Glenville
Among the 1,854 employed individuals in Glenville, private company employees (1,163 | 62.7%), local government employees (259 | 14.0%), and not-for-profit organizations (163 | 8.8%) make up the most common classes of employment.
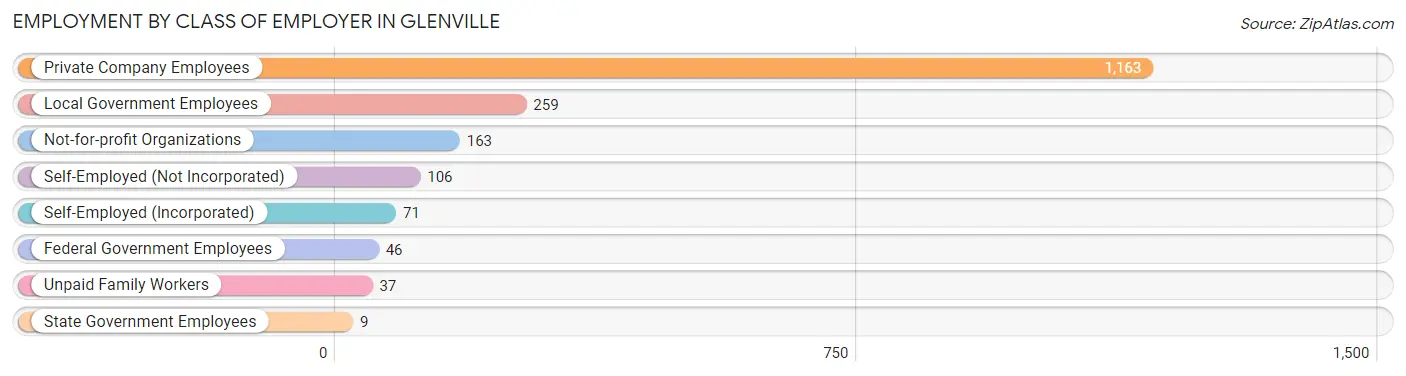
| Employer Class | # Employees | % Employees |
| Private Company Employees | 1,163 | 62.7% |
| Self-Employed (Incorporated) | 71 | 3.8% |
| Self-Employed (Not Incorporated) | 106 | 5.7% |
| Not-for-profit Organizations | 163 | 8.8% |
| Local Government Employees | 259 | 14.0% |
| State Government Employees | 9 | 0.5% |
| Federal Government Employees | 46 | 2.5% |
| Unpaid Family Workers | 37 | 2.0% |
| Total | 1,854 | 100.0% |
Employment Status by Age in Glenville
According to the labor force statistics for Glenville, out of the total population over 16 years of age (2,727), 74.4% or 2,029 individuals are in the labor force, with 7.4% or 150 of them unemployed. The age group with the highest labor force participation rate is 30 to 34 years, with 100.0% or 264 individuals in the labor force. Within the labor force, the 20 to 24 years age range has the highest percentage of unemployed individuals, with 42.7% or 73 of them being unemployed.
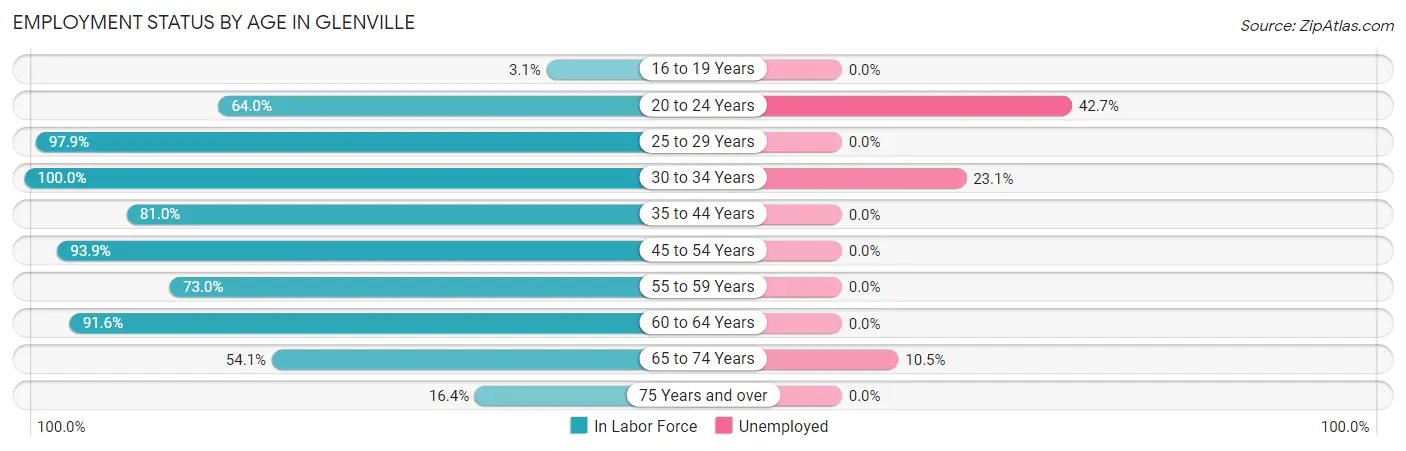
| Age Bracket | In Labor Force | Unemployed |
| 16 to 19 Years | 5 (3.1%) | 0 (0.0%) |
| 20 to 24 Years | 171 (64.0%) | 73 (42.7%) |
| 25 to 29 Years | 278 (97.9%) | 0 (0.0%) |
| 30 to 34 Years | 264 (100.0%) | 61 (23.1%) |
| 35 to 44 Years | 221 (81.0%) | 0 (0.0%) |
| 45 to 54 Years | 535 (93.9%) | 0 (0.0%) |
| 55 to 59 Years | 154 (73.0%) | 0 (0.0%) |
| 60 to 64 Years | 219 (91.6%) | 0 (0.0%) |
| 65 to 74 Years | 152 (54.1%) | 16 (10.5%) |
| 75 Years and over | 29 (16.4%) | 0 (0.0%) |
| Total | 2,029 (74.4%) | 150 (7.4%) |
Employment Status by Educational Attainment in Glenville
According to labor force statistics for Glenville, 90.8% of individuals (1,672) out of the total population between 25 and 64 years of age (1,841) are in the labor force, with 3.7% or 62 of them being unemployed. The group with the highest labor force participation rate are those with the educational attainment of bachelor's degree or higher, with 91.4% or 1,153 individuals in the labor force. Within the labor force, individuals with bachelor's degree or higher education have the highest percentage of unemployment, with 5.3% or 61 of them being unemployed.
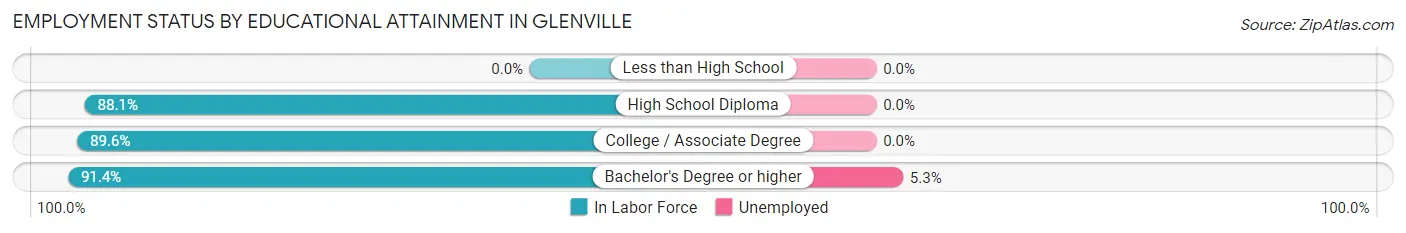
| Educational Attainment | In Labor Force | Unemployed |
| Less than High School | 0 (0.0%) | 0 (0.0%) |
| High School Diploma | 119 (88.1%) | 0 (0.0%) |
| College / Associate Degree | 398 (89.6%) | 0 (0.0%) |
| Bachelor's Degree or higher | 1,153 (91.4%) | 67 (5.3%) |
| Total | 1,672 (90.8%) | 68 (3.7%) |
Employment Occupations by Sex in Glenville
Management, Business, Science and Arts Occupations
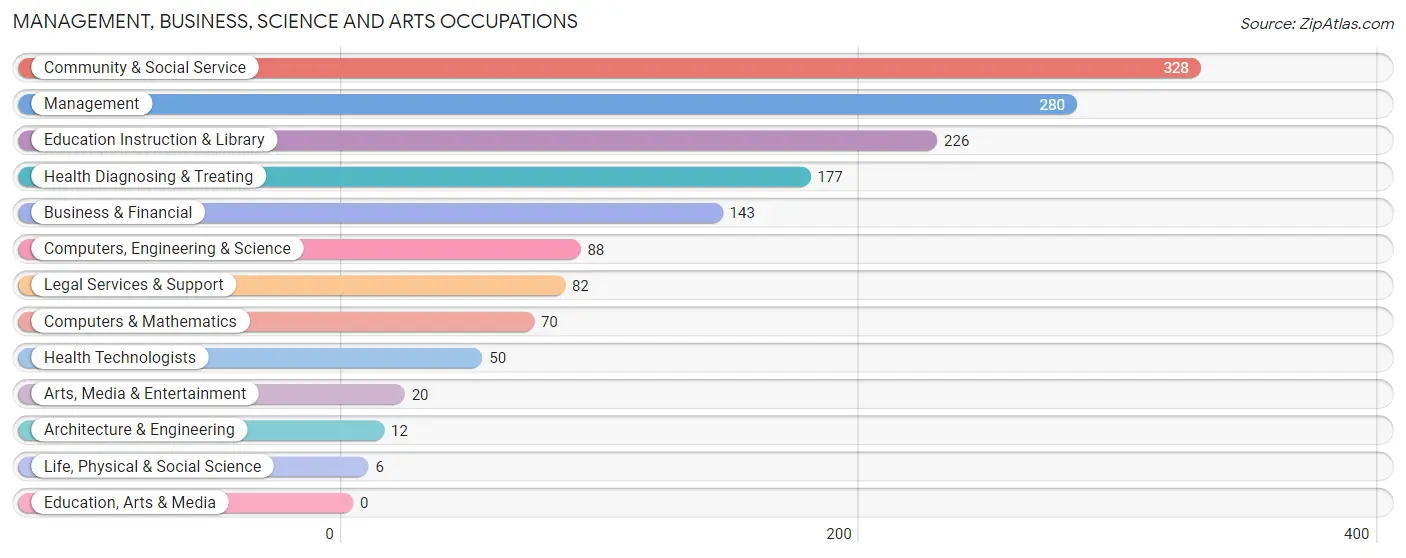
The most common Management, Business, Science and Arts occupations in Glenville are Community & Social Service (328 | 17.5%), Management (280 | 14.9%), Education Instruction & Library (226 | 12.0%), Health Diagnosing & Treating (177 | 9.4%), and Business & Financial (143 | 7.6%).
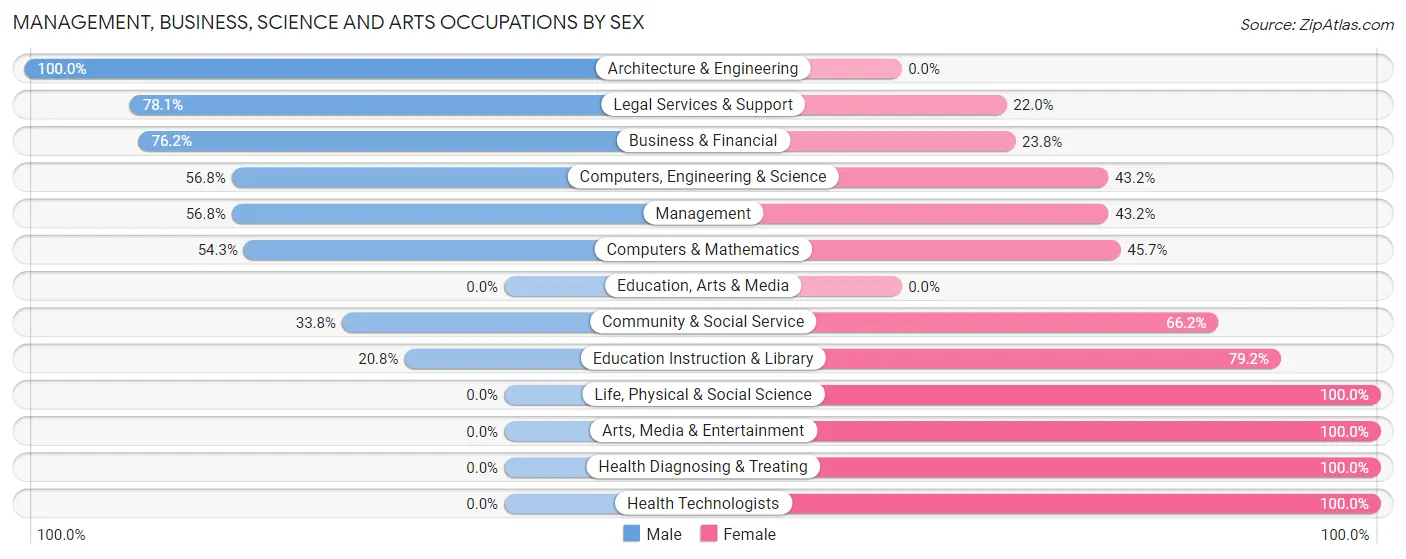
Management, Business, Science and Arts Occupations by Sex
Within the Management, Business, Science and Arts occupations in Glenville, the most male-oriented occupations are Architecture & Engineering (100.0%), Legal Services & Support (78.0%), and Business & Financial (76.2%), while the most female-oriented occupations are Life, Physical & Social Science (100.0%), Arts, Media & Entertainment (100.0%), and Health Diagnosing & Treating (100.0%).
| Occupation | Male | Female |
| Management | 159 (56.8%) | 121 (43.2%) |
| Business & Financial | 109 (76.2%) | 34 (23.8%) |
| Computers, Engineering & Science | 50 (56.8%) | 38 (43.2%) |
| Computers & Mathematics | 38 (54.3%) | 32 (45.7%) |
| Architecture & Engineering | 12 (100.0%) | 0 (0.0%) |
| Life, Physical & Social Science | 0 (0.0%) | 6 (100.0%) |
| Community & Social Service | 111 (33.8%) | 217 (66.2%) |
| Education, Arts & Media | 0 (0.0%) | 0 (0.0%) |
| Legal Services & Support | 64 (78.0%) | 18 (22.0%) |
| Education Instruction & Library | 47 (20.8%) | 179 (79.2%) |
| Arts, Media & Entertainment | 0 (0.0%) | 20 (100.0%) |
| Health Diagnosing & Treating | 0 (0.0%) | 177 (100.0%) |
| Health Technologists | 0 (0.0%) | 50 (100.0%) |
| Total (Category) | 429 (42.2%) | 587 (57.8%) |
| Total (Overall) | 791 (42.1%) | 1,087 (57.9%) |
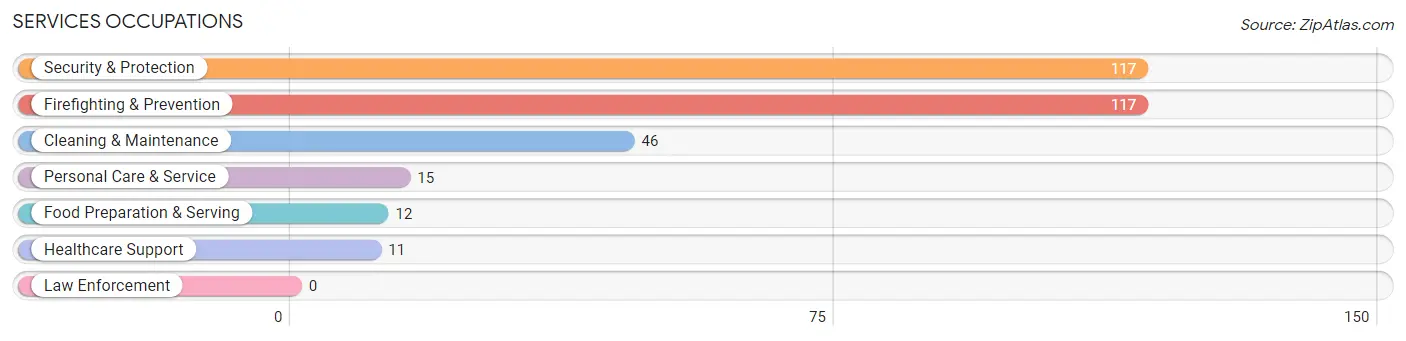
Services Occupations
The most common Services occupations in Glenville are Security & Protection (117 | 6.2%), Firefighting & Prevention (117 | 6.2%), Cleaning & Maintenance (46 | 2.5%), Personal Care & Service (15 | 0.8%), and Food Preparation & Serving (12 | 0.6%).
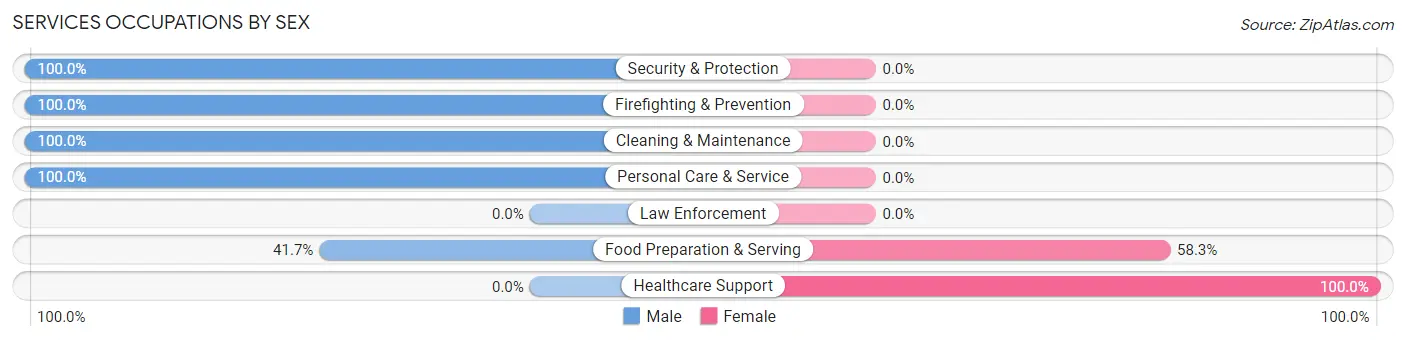
Services Occupations by Sex
Within the Services occupations in Glenville, the most male-oriented occupations are Security & Protection (100.0%), Firefighting & Prevention (100.0%), and Cleaning & Maintenance (100.0%), while the most female-oriented occupations are Healthcare Support (100.0%), and Food Preparation & Serving (58.3%).
| Occupation | Male | Female |
| Healthcare Support | 0 (0.0%) | 11 (100.0%) |
| Security & Protection | 117 (100.0%) | 0 (0.0%) |
| Firefighting & Prevention | 117 (100.0%) | 0 (0.0%) |
| Law Enforcement | 0 (0.0%) | 0 (0.0%) |
| Food Preparation & Serving | 5 (41.7%) | 7 (58.3%) |
| Cleaning & Maintenance | 46 (100.0%) | 0 (0.0%) |
| Personal Care & Service | 15 (100.0%) | 0 (0.0%) |
| Total (Category) | 183 (91.0%) | 18 (9.0%) |
| Total (Overall) | 791 (42.1%) | 1,087 (57.9%) |
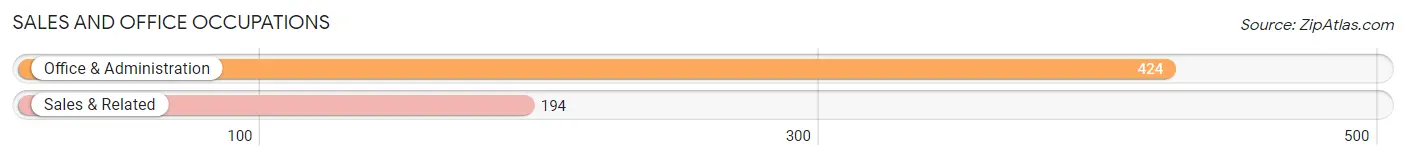
Sales and Office Occupations
The most common Sales and Office occupations in Glenville are Office & Administration (424 | 22.6%), and Sales & Related (194 | 10.3%).
Sales and Office Occupations by Sex
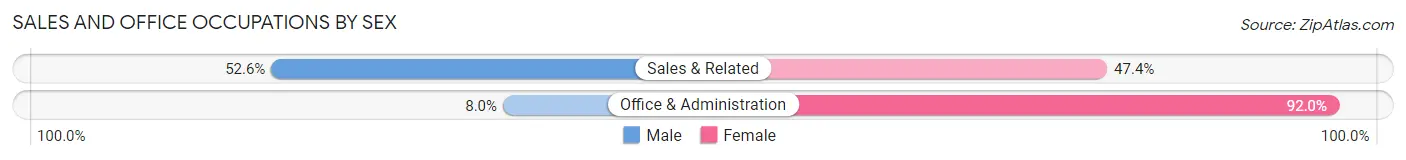
| Occupation | Male | Female |
| Sales & Related | 102 (52.6%) | 92 (47.4%) |
| Office & Administration | 34 (8.0%) | 390 (92.0%) |
| Total (Category) | 136 (22.0%) | 482 (78.0%) |
| Total (Overall) | 791 (42.1%) | 1,087 (57.9%) |
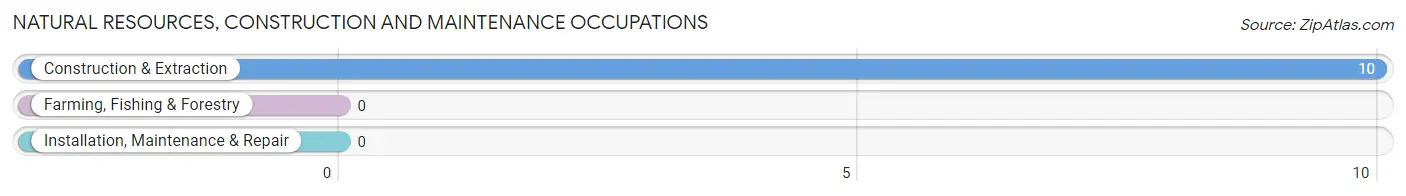
Natural Resources, Construction and Maintenance Occupations
The most common Natural Resources, Construction and Maintenance occupations in Glenville are , and Construction & Extraction (10 | 0.5%).
Natural Resources, Construction and Maintenance Occupations by Sex
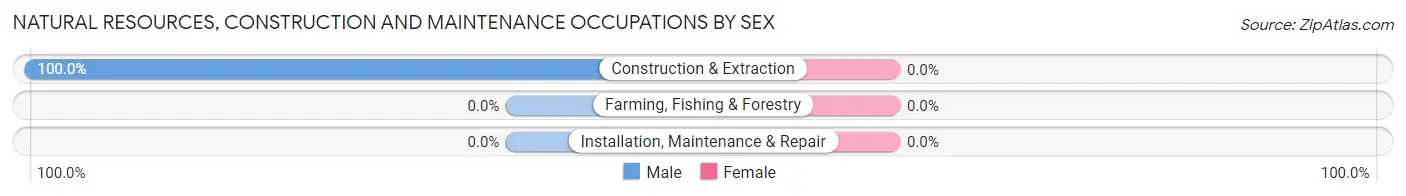
| Occupation | Male | Female |
| Farming, Fishing & Forestry | 0 (0.0%) | 0 (0.0%) |
| Construction & Extraction | 10 (100.0%) | 0 (0.0%) |
| Installation, Maintenance & Repair | 0 (0.0%) | 0 (0.0%) |
| Total (Category) | 10 (100.0%) | 0 (0.0%) |
| Total (Overall) | 791 (42.1%) | 1,087 (57.9%) |
Production, Transportation and Moving Occupations
The most common Production, Transportation and Moving occupations in Glenville are Material Moving (28 | 1.5%), and Transportation (5 | 0.3%).
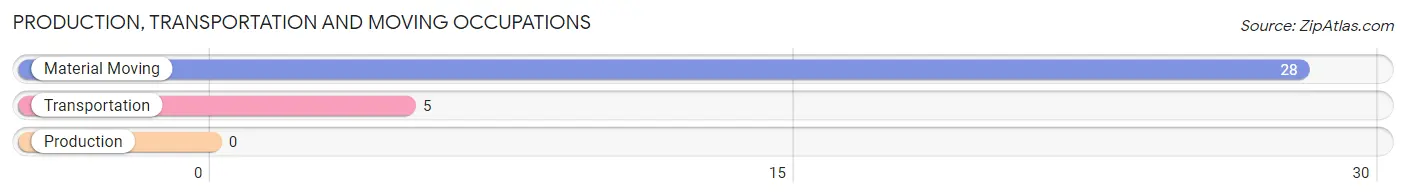
Production, Transportation and Moving Occupations by Sex
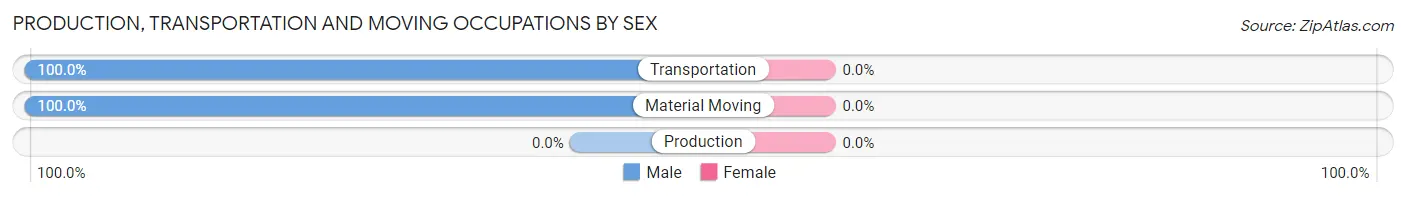
| Occupation | Male | Female |
| Production | 0 (0.0%) | 0 (0.0%) |
| Transportation | 5 (100.0%) | 0 (0.0%) |
| Material Moving | 28 (100.0%) | 0 (0.0%) |
| Total (Category) | 33 (100.0%) | 0 (0.0%) |
| Total (Overall) | 791 (42.1%) | 1,087 (57.9%) |
Employment Industries by Sex in Glenville
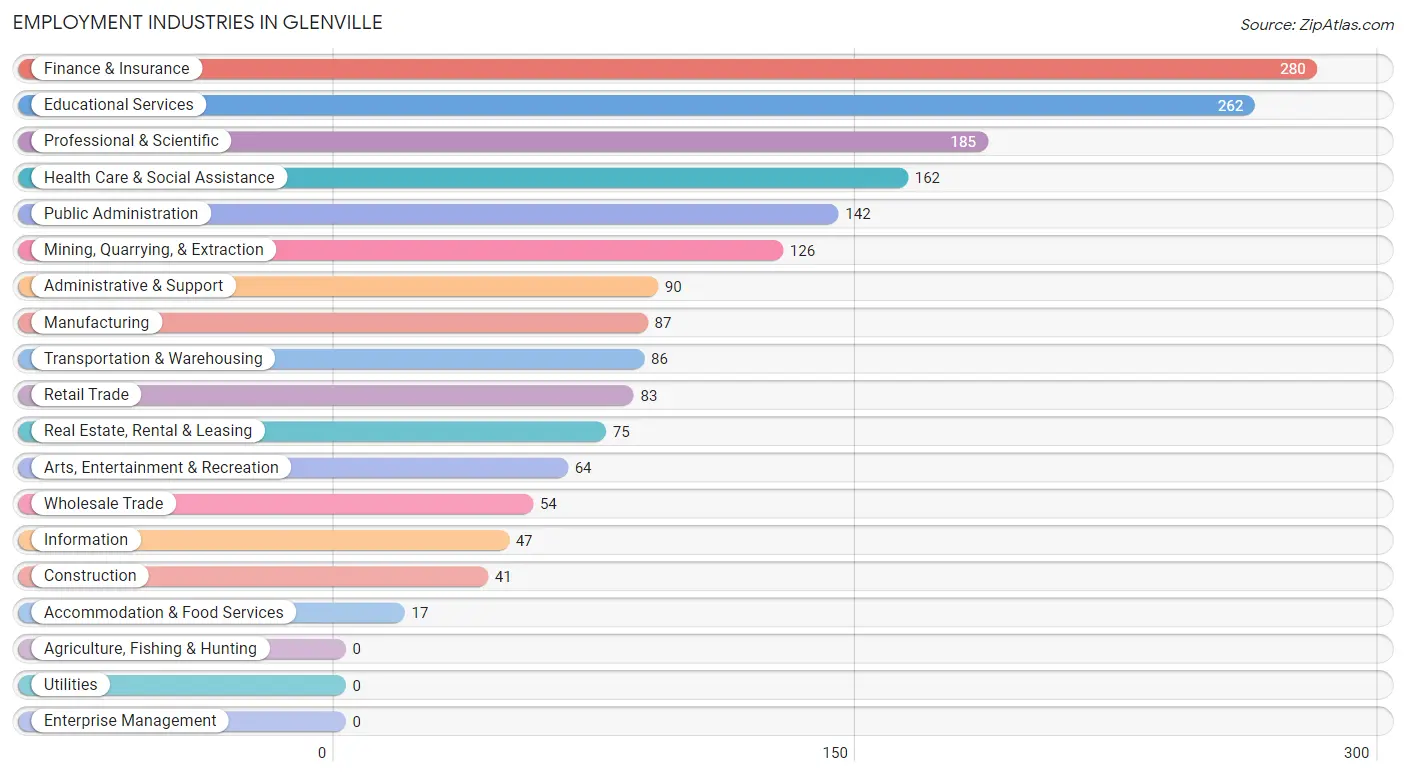
Employment Industries in Glenville
The major employment industries in Glenville include Finance & Insurance (280 | 14.9%), Educational Services (262 | 14.0%), Professional & Scientific (185 | 9.9%), Health Care & Social Assistance (162 | 8.6%), and Public Administration (142 | 7.6%).
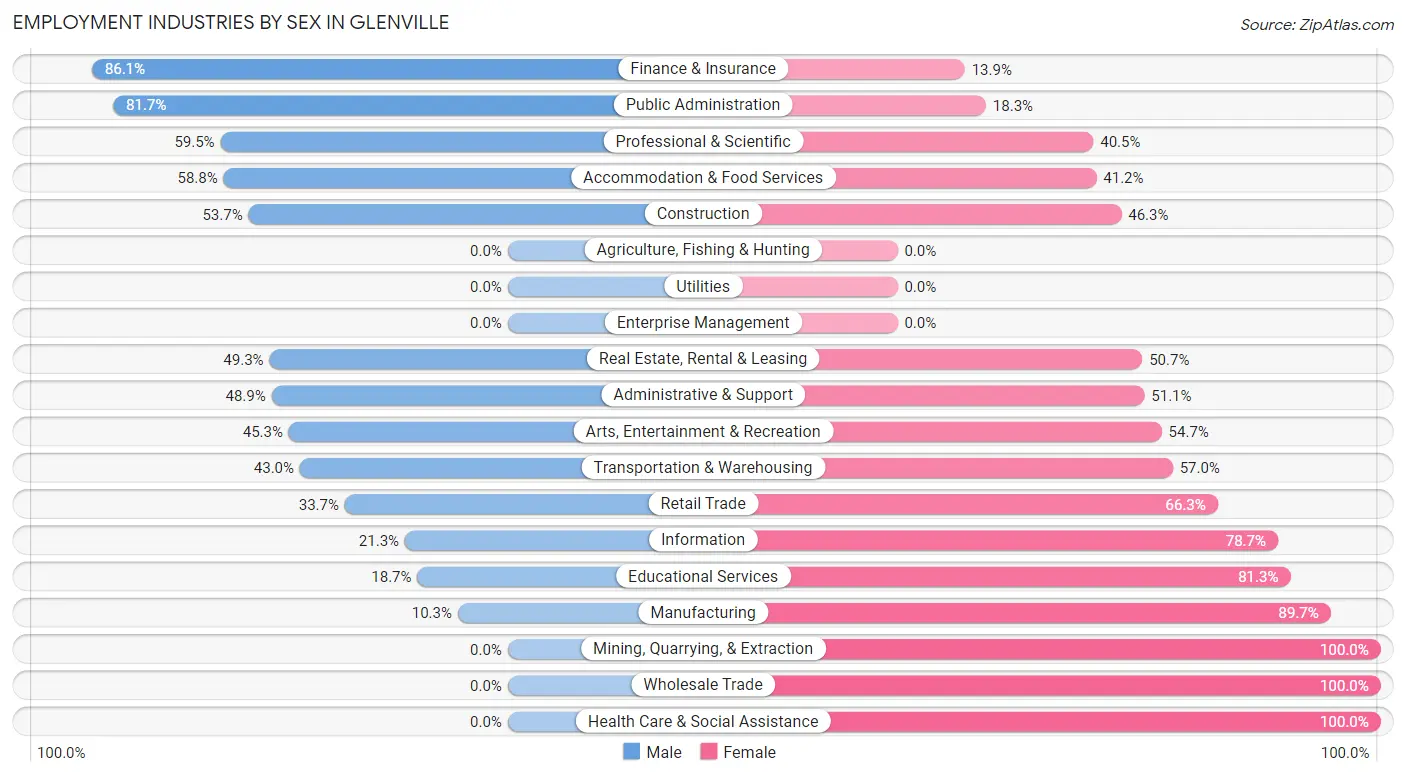
Employment Industries by Sex in Glenville
The Glenville industries that see more men than women are Finance & Insurance (86.1%), Public Administration (81.7%), and Professional & Scientific (59.5%), whereas the industries that tend to have a higher number of women are Mining, Quarrying, & Extraction (100.0%), Wholesale Trade (100.0%), and Health Care & Social Assistance (100.0%).
| Industry | Male | Female |
| Agriculture, Fishing & Hunting | 0 (0.0%) | 0 (0.0%) |
| Mining, Quarrying, & Extraction | 0 (0.0%) | 126 (100.0%) |
| Construction | 22 (53.7%) | 19 (46.3%) |
| Manufacturing | 9 (10.3%) | 78 (89.7%) |
| Wholesale Trade | 0 (0.0%) | 54 (100.0%) |
| Retail Trade | 28 (33.7%) | 55 (66.3%) |
| Transportation & Warehousing | 37 (43.0%) | 49 (57.0%) |
| Utilities | 0 (0.0%) | 0 (0.0%) |
| Information | 10 (21.3%) | 37 (78.7%) |
| Finance & Insurance | 241 (86.1%) | 39 (13.9%) |
| Real Estate, Rental & Leasing | 37 (49.3%) | 38 (50.7%) |
| Professional & Scientific | 110 (59.5%) | 75 (40.5%) |
| Enterprise Management | 0 (0.0%) | 0 (0.0%) |
| Administrative & Support | 44 (48.9%) | 46 (51.1%) |
| Educational Services | 49 (18.7%) | 213 (81.3%) |
| Health Care & Social Assistance | 0 (0.0%) | 162 (100.0%) |
| Arts, Entertainment & Recreation | 29 (45.3%) | 35 (54.7%) |
| Accommodation & Food Services | 10 (58.8%) | 7 (41.2%) |
| Public Administration | 116 (81.7%) | 26 (18.3%) |
| Total | 791 (42.1%) | 1,087 (57.9%) |
Education in Glenville
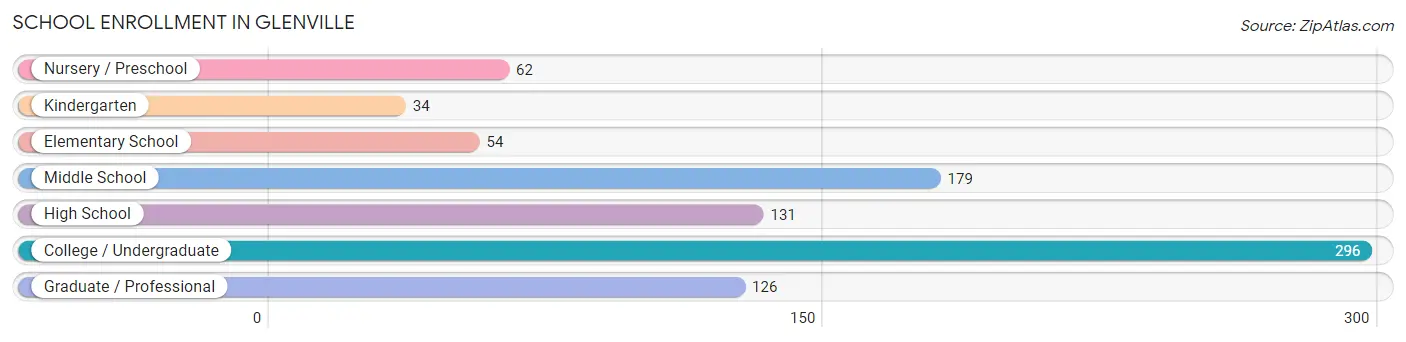
School Enrollment in Glenville
The most common levels of schooling among the 882 students in Glenville are college / undergraduate (296 | 33.6%), middle school (179 | 20.3%), and high school (131 | 14.8%).
| School Level | # Students | % Students |
| Nursery / Preschool | 62 | 7.0% |
| Kindergarten | 34 | 3.8% |
| Elementary School | 54 | 6.1% |
| Middle School | 179 | 20.3% |
| High School | 131 | 14.8% |
| College / Undergraduate | 296 | 33.6% |
| Graduate / Professional | 126 | 14.3% |
| Total | 882 | 100.0% |
School Enrollment by Age by Funding Source in Glenville
Out of a total of 882 students who are enrolled in schools in Glenville, 239 (27.1%) attend a private institution, while the remaining 643 (72.9%) are enrolled in public schools. The age group of 25 to 34 year olds has the highest likelihood of being enrolled in private schools, with 67 (46.9% in the age bracket) enrolled. Conversely, the age group of 18 to 19 year olds has the lowest likelihood of being enrolled in a private school, with 10 (100.0% in the age bracket) attending a public institution.
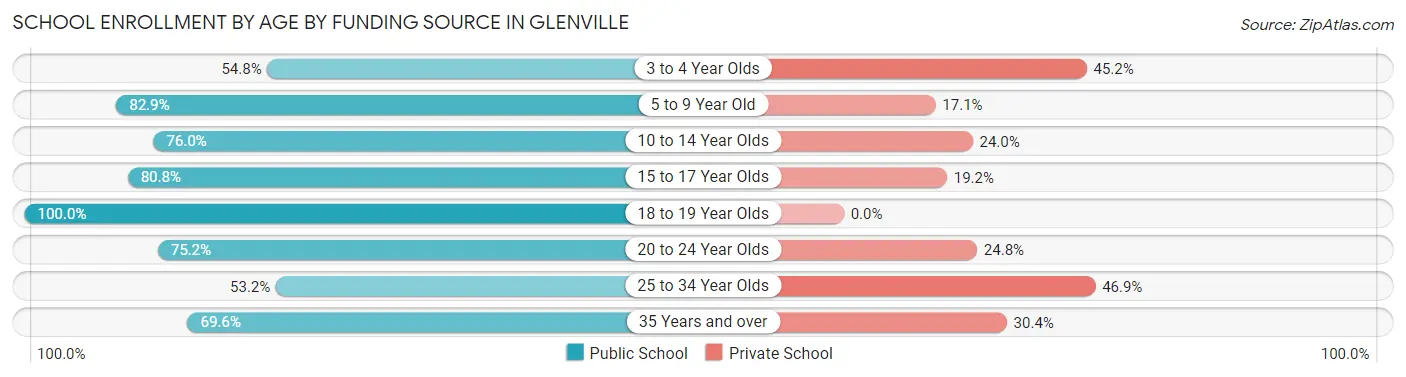
| Age Bracket | Public School | Private School |
| 3 to 4 Year Olds | 23 (54.8%) | 19 (45.2%) |
| 5 to 9 Year Old | 97 (82.9%) | 20 (17.1%) |
| 10 to 14 Year Olds | 152 (76.0%) | 48 (24.0%) |
| 15 to 17 Year Olds | 143 (80.8%) | 34 (19.2%) |
| 18 to 19 Year Olds | 10 (100.0%) | 0 (0.0%) |
| 20 to 24 Year Olds | 103 (75.2%) | 34 (24.8%) |
| 25 to 34 Year Olds | 76 (53.1%) | 67 (46.9%) |
| 35 Years and over | 39 (69.6%) | 17 (30.4%) |
| Total | 643 (72.9%) | 239 (27.1%) |
Educational Attainment by Field of Study in Glenville
Business (315 | 19.0%), communications (247 | 14.9%), social sciences (212 | 12.8%), liberal arts & history (173 | 10.4%), and education (157 | 9.5%) are the most common fields of study among 1,656 individuals in Glenville who have obtained a bachelor's degree or higher.
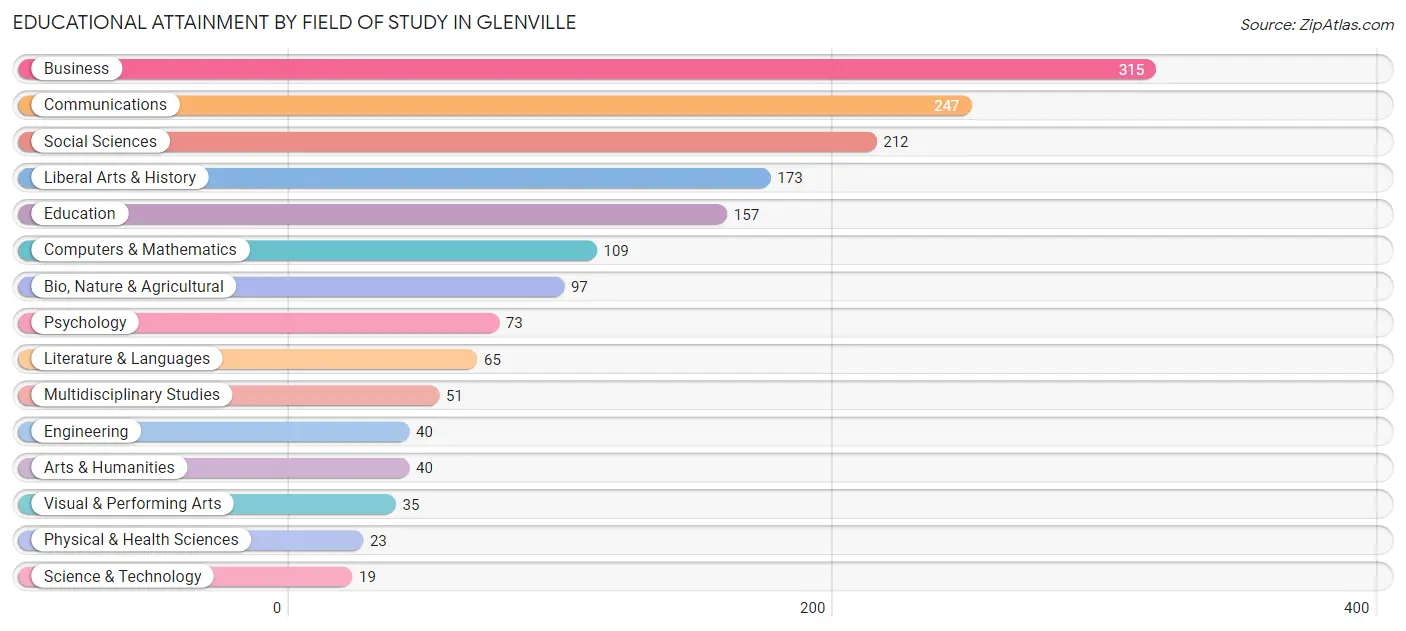
| Field of Study | # Graduates | % Graduates |
| Computers & Mathematics | 109 | 6.6% |
| Bio, Nature & Agricultural | 97 | 5.9% |
| Physical & Health Sciences | 23 | 1.4% |
| Psychology | 73 | 4.4% |
| Social Sciences | 212 | 12.8% |
| Engineering | 40 | 2.4% |
| Multidisciplinary Studies | 51 | 3.1% |
| Science & Technology | 19 | 1.1% |
| Business | 315 | 19.0% |
| Education | 157 | 9.5% |
| Literature & Languages | 65 | 3.9% |
| Liberal Arts & History | 173 | 10.4% |
| Visual & Performing Arts | 35 | 2.1% |
| Communications | 247 | 14.9% |
| Arts & Humanities | 40 | 2.4% |
| Total | 1,656 | 100.0% |
Transportation & Commute in Glenville
Vehicle Availability by Sex in Glenville
The most prevalent vehicle ownership categories in Glenville are males with 3 vehicles (334, accounting for 44.0%) and females with 3 vehicles (325, making up 30.8%).
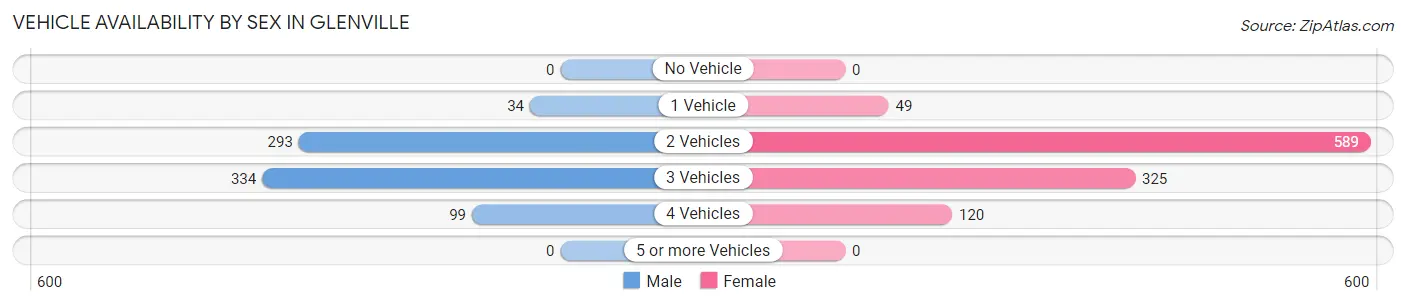
| Vehicles Available | Male | Female |
| No Vehicle | 0 (0.0%) | 0 (0.0%) |
| 1 Vehicle | 34 (4.5%) | 49 (4.5%) |
| 2 Vehicles | 293 (38.6%) | 589 (54.4%) |
| 3 Vehicles | 334 (44.0%) | 325 (30.0%) |
| 4 Vehicles | 99 (13.0%) | 120 (11.1%) |
| 5 or more Vehicles | 0 (0.0%) | 0 (0.0%) |
| Total | 760 (100.0%) | 1,083 (100.0%) |
Commute Time in Glenville
The most frequently occuring commute durations in Glenville are 10 to 14 minutes (300 commuters, 19.6%), 15 to 19 minutes (246 commuters, 16.1%), and 5 to 9 minutes (243 commuters, 15.9%).
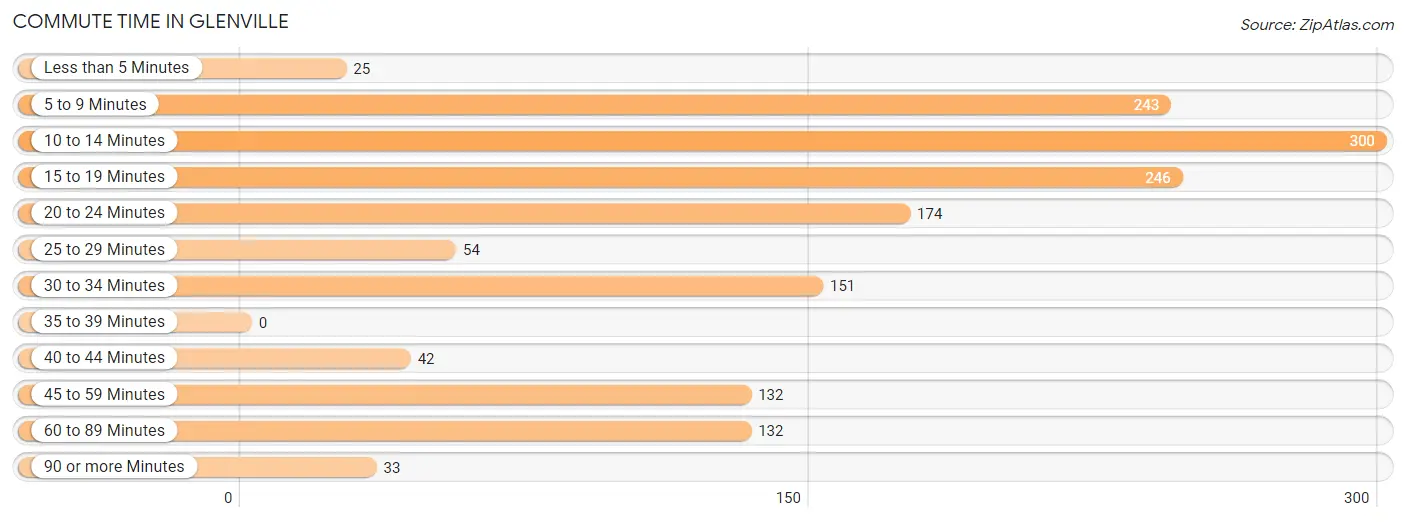
| Commute Time | # Commuters | % Commuters |
| Less than 5 Minutes | 25 | 1.6% |
| 5 to 9 Minutes | 243 | 15.9% |
| 10 to 14 Minutes | 300 | 19.6% |
| 15 to 19 Minutes | 246 | 16.1% |
| 20 to 24 Minutes | 174 | 11.4% |
| 25 to 29 Minutes | 54 | 3.5% |
| 30 to 34 Minutes | 151 | 9.9% |
| 35 to 39 Minutes | 0 | 0.0% |
| 40 to 44 Minutes | 42 | 2.7% |
| 45 to 59 Minutes | 132 | 8.6% |
| 60 to 89 Minutes | 132 | 8.6% |
| 90 or more Minutes | 33 | 2.1% |
Commute Time by Sex in Glenville
The most common commute times in Glenville are 45 to 59 minutes (121 commuters, 19.5%) for males and 10 to 14 minutes (240 commuters, 26.4%) for females.
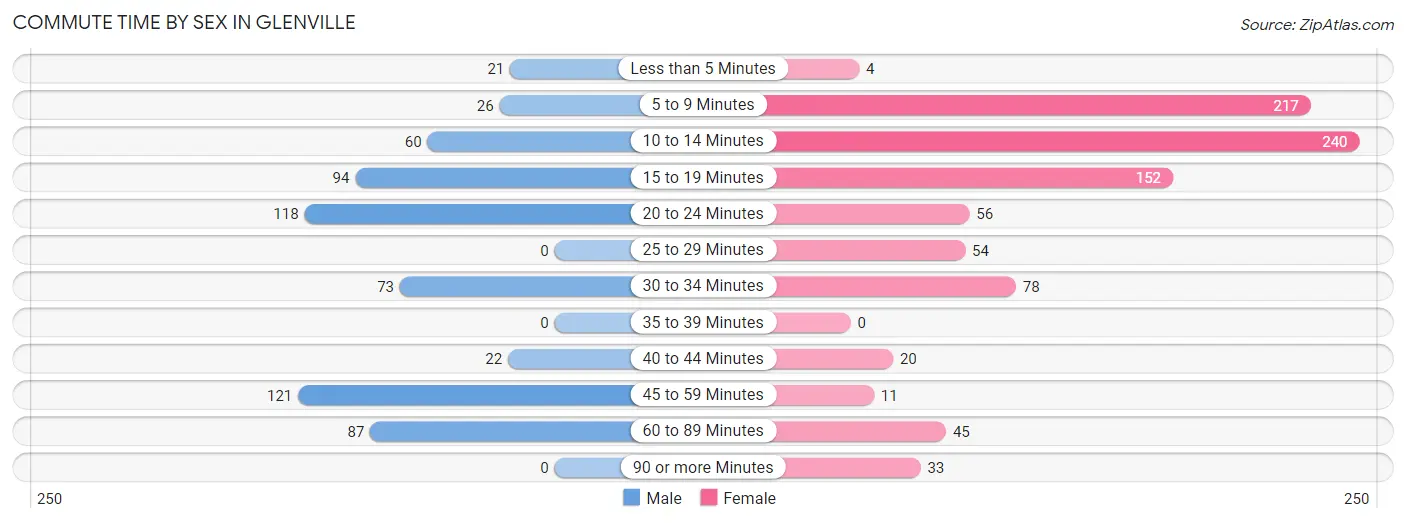
| Commute Time | Male | Female |
| Less than 5 Minutes | 21 (3.4%) | 4 (0.4%) |
| 5 to 9 Minutes | 26 (4.2%) | 217 (23.8%) |
| 10 to 14 Minutes | 60 (9.7%) | 240 (26.4%) |
| 15 to 19 Minutes | 94 (15.1%) | 152 (16.7%) |
| 20 to 24 Minutes | 118 (19.0%) | 56 (6.1%) |
| 25 to 29 Minutes | 0 (0.0%) | 54 (5.9%) |
| 30 to 34 Minutes | 73 (11.7%) | 78 (8.6%) |
| 35 to 39 Minutes | 0 (0.0%) | 0 (0.0%) |
| 40 to 44 Minutes | 22 (3.5%) | 20 (2.2%) |
| 45 to 59 Minutes | 121 (19.5%) | 11 (1.2%) |
| 60 to 89 Minutes | 87 (14.0%) | 45 (5.0%) |
| 90 or more Minutes | 0 (0.0%) | 33 (3.6%) |
Time of Departure to Work by Sex in Glenville
The most frequent times of departure to work in Glenville are 7:30 AM to 7:59 AM (143, 23.0%) for males and 8:00 AM to 8:29 AM (238, 26.2%) for females.
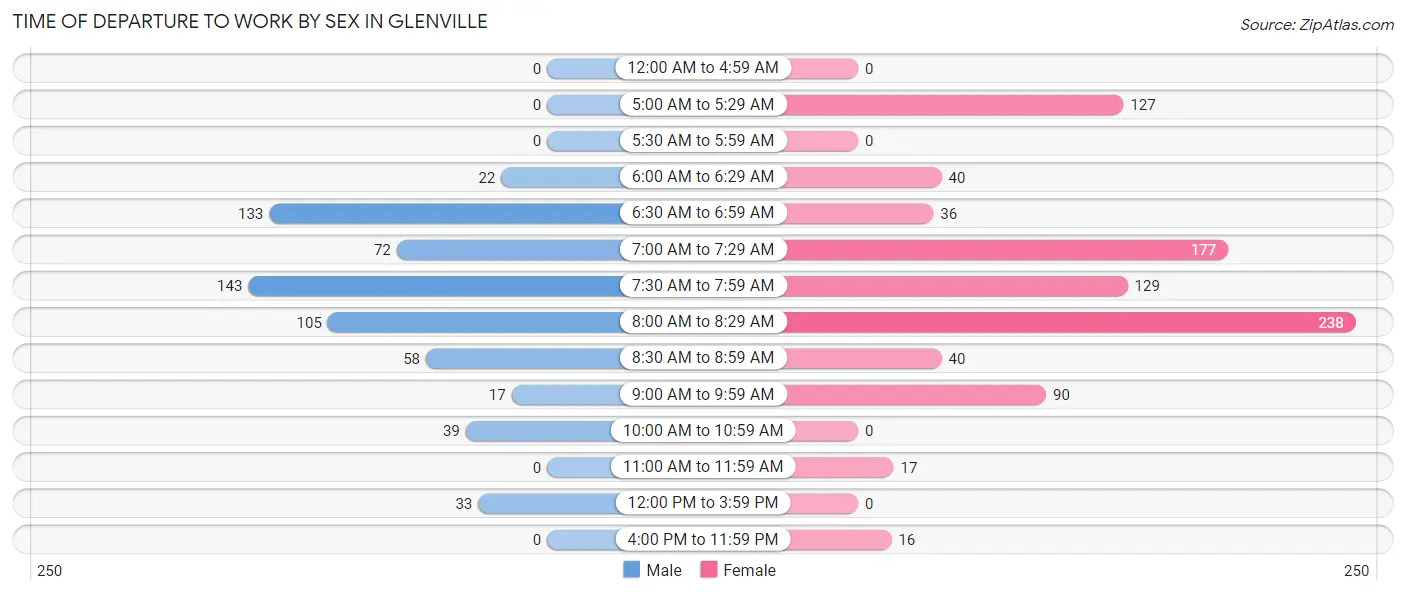
| Time of Departure | Male | Female |
| 12:00 AM to 4:59 AM | 0 (0.0%) | 0 (0.0%) |
| 5:00 AM to 5:29 AM | 0 (0.0%) | 127 (14.0%) |
| 5:30 AM to 5:59 AM | 0 (0.0%) | 0 (0.0%) |
| 6:00 AM to 6:29 AM | 22 (3.5%) | 40 (4.4%) |
| 6:30 AM to 6:59 AM | 133 (21.4%) | 36 (4.0%) |
| 7:00 AM to 7:29 AM | 72 (11.6%) | 177 (19.5%) |
| 7:30 AM to 7:59 AM | 143 (23.0%) | 129 (14.2%) |
| 8:00 AM to 8:29 AM | 105 (16.9%) | 238 (26.2%) |
| 8:30 AM to 8:59 AM | 58 (9.3%) | 40 (4.4%) |
| 9:00 AM to 9:59 AM | 17 (2.7%) | 90 (9.9%) |
| 10:00 AM to 10:59 AM | 39 (6.3%) | 0 (0.0%) |
| 11:00 AM to 11:59 AM | 0 (0.0%) | 17 (1.9%) |
| 12:00 PM to 3:59 PM | 33 (5.3%) | 0 (0.0%) |
| 4:00 PM to 11:59 PM | 0 (0.0%) | 16 (1.8%) |
| Total | 622 (100.0%) | 910 (100.0%) |
Housing Occupancy in Glenville
Occupancy by Ownership in Glenville
Of the total 1,096 dwellings in Glenville, owner-occupied units account for 790 (72.1%), while renter-occupied units make up 306 (27.9%).
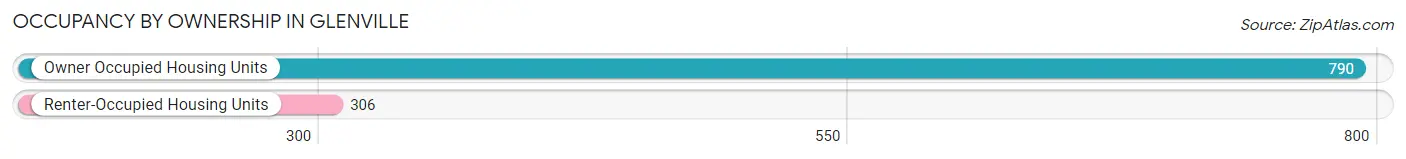
| Occupancy | # Housing Units | % Housing Units |
| Owner Occupied Housing Units | 790 | 72.1% |
| Renter-Occupied Housing Units | 306 | 27.9% |
| Total Occupied Housing Units | 1,096 | 100.0% |
Occupancy by Household Size in Glenville
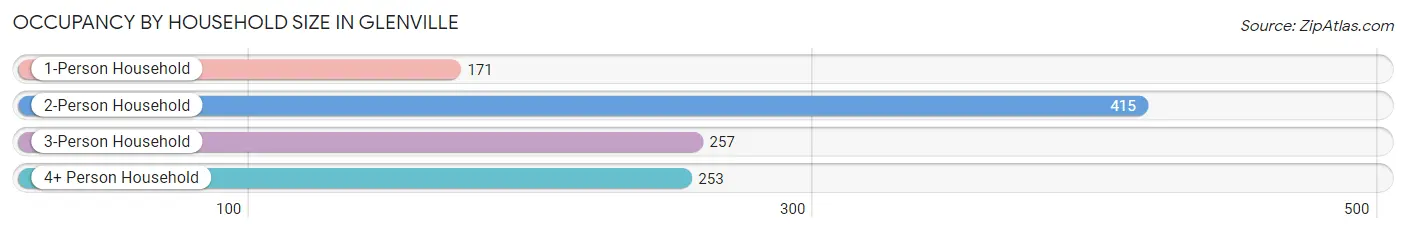
| Household Size | # Housing Units | % Housing Units |
| 1-Person Household | 171 | 15.6% |
| 2-Person Household | 415 | 37.9% |
| 3-Person Household | 257 | 23.4% |
| 4+ Person Household | 253 | 23.1% |
| Total Housing Units | 1,096 | 100.0% |
Occupancy by Ownership by Household Size in Glenville
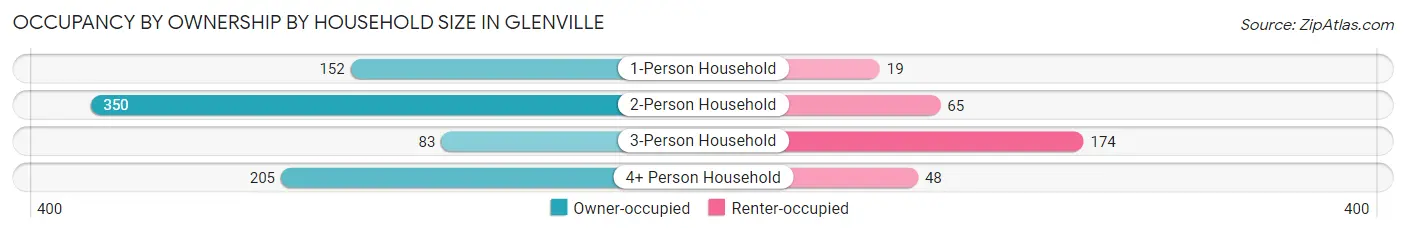
| Household Size | Owner-occupied | Renter-occupied |
| 1-Person Household | 152 (88.9%) | 19 (11.1%) |
| 2-Person Household | 350 (84.3%) | 65 (15.7%) |
| 3-Person Household | 83 (32.3%) | 174 (67.7%) |
| 4+ Person Household | 205 (81.0%) | 48 (19.0%) |
| Total Housing Units | 790 (72.1%) | 306 (27.9%) |
Occupancy by Educational Attainment in Glenville
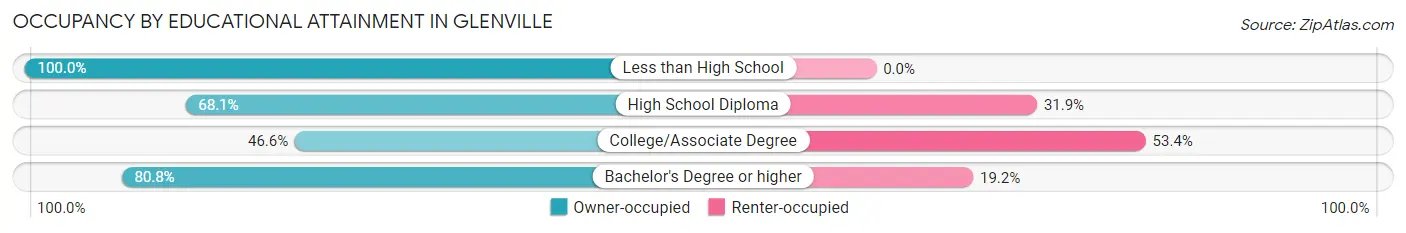
| Household Size | Owner-occupied | Renter-occupied |
| Less than High School | 42 (100.0%) | 0 (0.0%) |
| High School Diploma | 47 (68.1%) | 22 (31.9%) |
| College/Associate Degree | 129 (46.6%) | 148 (53.4%) |
| Bachelor's Degree or higher | 572 (80.8%) | 136 (19.2%) |
Occupancy by Age of Householder in Glenville
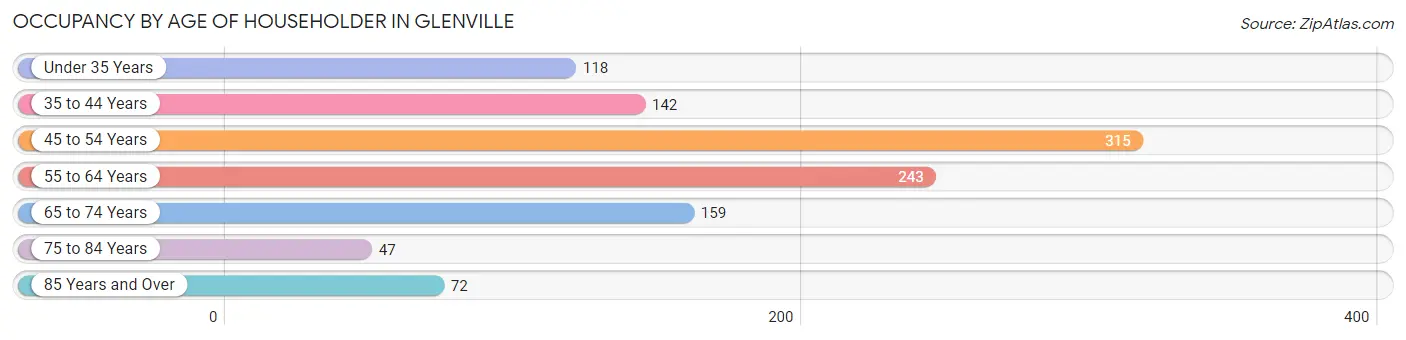
| Age Bracket | # Households | % Households |
| Under 35 Years | 118 | 10.8% |
| 35 to 44 Years | 142 | 13.0% |
| 45 to 54 Years | 315 | 28.7% |
| 55 to 64 Years | 243 | 22.2% |
| 65 to 74 Years | 159 | 14.5% |
| 75 to 84 Years | 47 | 4.3% |
| 85 Years and Over | 72 | 6.6% |
| Total | 1,096 | 100.0% |
Housing Finances in Glenville
Median Income by Occupancy in Glenville
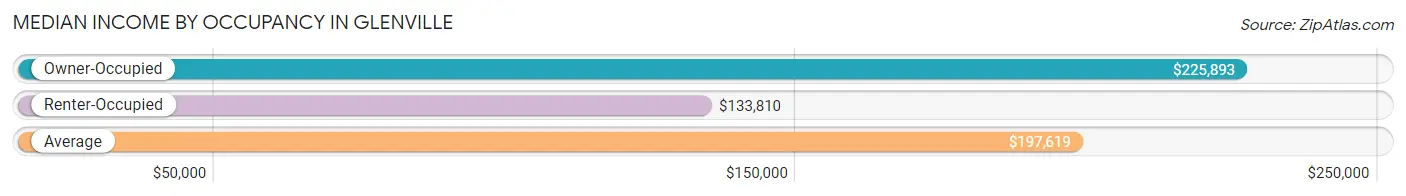
| Occupancy Type | # Households | Median Income |
| Owner-Occupied | 790 (72.1%) | $225,893 |
| Renter-Occupied | 306 (27.9%) | $133,810 |
| Average | 1,096 (100.0%) | $197,619 |
Occupancy by Householder Income Bracket in Glenville
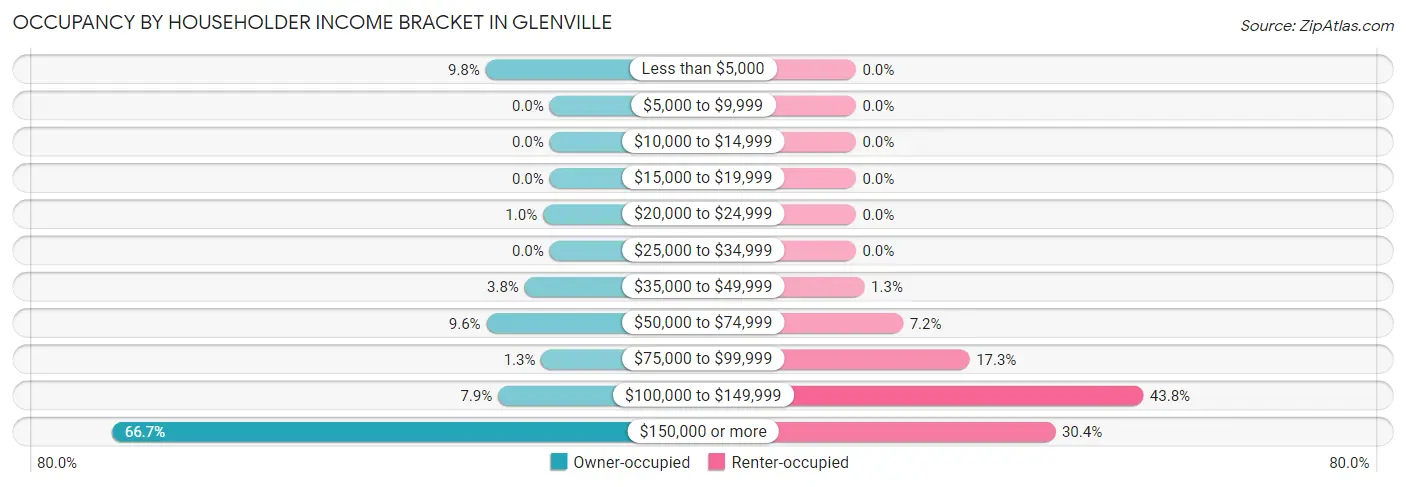
| Income Bracket | Owner-occupied | Renter-occupied |
| Less than $5,000 | 77 (9.8%) | 0 (0.0%) |
| $5,000 to $9,999 | 0 (0.0%) | 0 (0.0%) |
| $10,000 to $14,999 | 0 (0.0%) | 0 (0.0%) |
| $15,000 to $19,999 | 0 (0.0%) | 0 (0.0%) |
| $20,000 to $24,999 | 8 (1.0%) | 0 (0.0%) |
| $25,000 to $34,999 | 0 (0.0%) | 0 (0.0%) |
| $35,000 to $49,999 | 30 (3.8%) | 4 (1.3%) |
| $50,000 to $74,999 | 76 (9.6%) | 22 (7.2%) |
| $75,000 to $99,999 | 10 (1.3%) | 53 (17.3%) |
| $100,000 to $149,999 | 62 (7.9%) | 134 (43.8%) |
| $150,000 or more | 527 (66.7%) | 93 (30.4%) |
| Total | 790 (100.0%) | 306 (100.0%) |
Monthly Housing Cost Tiers in Glenville
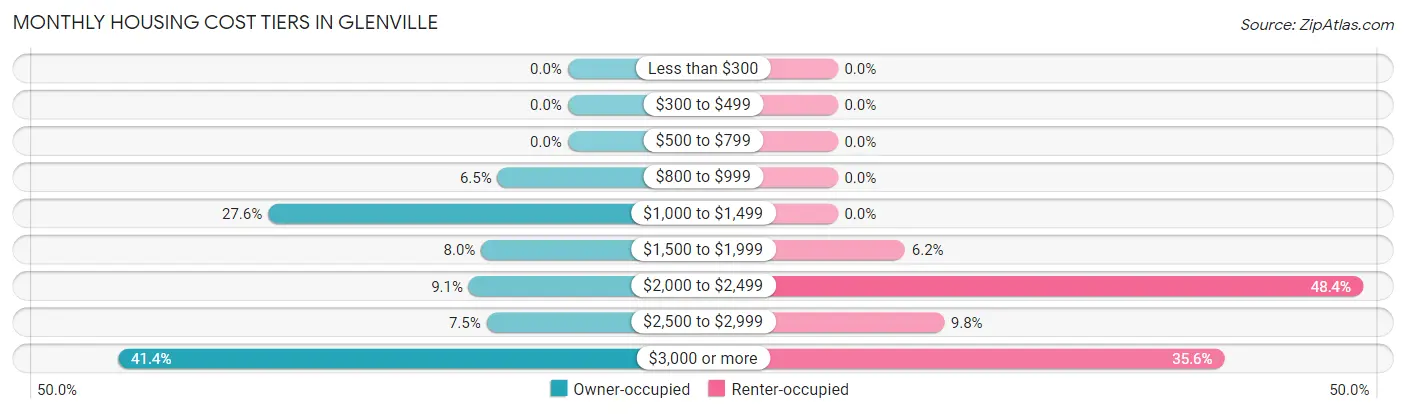
| Monthly Cost | Owner-occupied | Renter-occupied |
| Less than $300 | 0 (0.0%) | 0 (0.0%) |
| $300 to $499 | 0 (0.0%) | 0 (0.0%) |
| $500 to $799 | 0 (0.0%) | 0 (0.0%) |
| $800 to $999 | 51 (6.5%) | 0 (0.0%) |
| $1,000 to $1,499 | 218 (27.6%) | 0 (0.0%) |
| $1,500 to $1,999 | 63 (8.0%) | 19 (6.2%) |
| $2,000 to $2,499 | 72 (9.1%) | 148 (48.4%) |
| $2,500 to $2,999 | 59 (7.5%) | 30 (9.8%) |
| $3,000 or more | 327 (41.4%) | 109 (35.6%) |
| Total | 790 (100.0%) | 306 (100.0%) |
Physical Housing Characteristics in Glenville
Housing Structures in Glenville
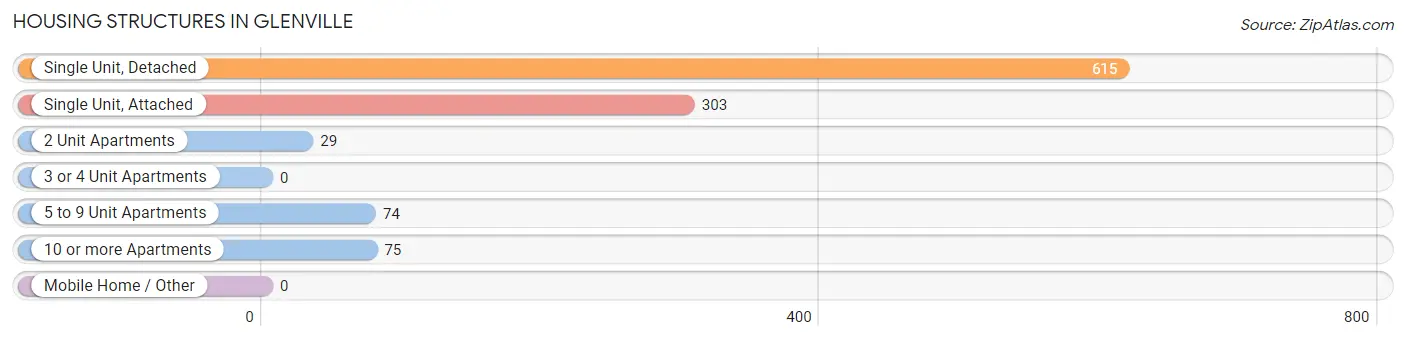
| Structure Type | # Housing Units | % Housing Units |
| Single Unit, Detached | 615 | 56.1% |
| Single Unit, Attached | 303 | 27.7% |
| 2 Unit Apartments | 29 | 2.6% |
| 3 or 4 Unit Apartments | 0 | 0.0% |
| 5 to 9 Unit Apartments | 74 | 6.8% |
| 10 or more Apartments | 75 | 6.8% |
| Mobile Home / Other | 0 | 0.0% |
| Total | 1,096 | 100.0% |
Housing Structures by Occupancy in Glenville
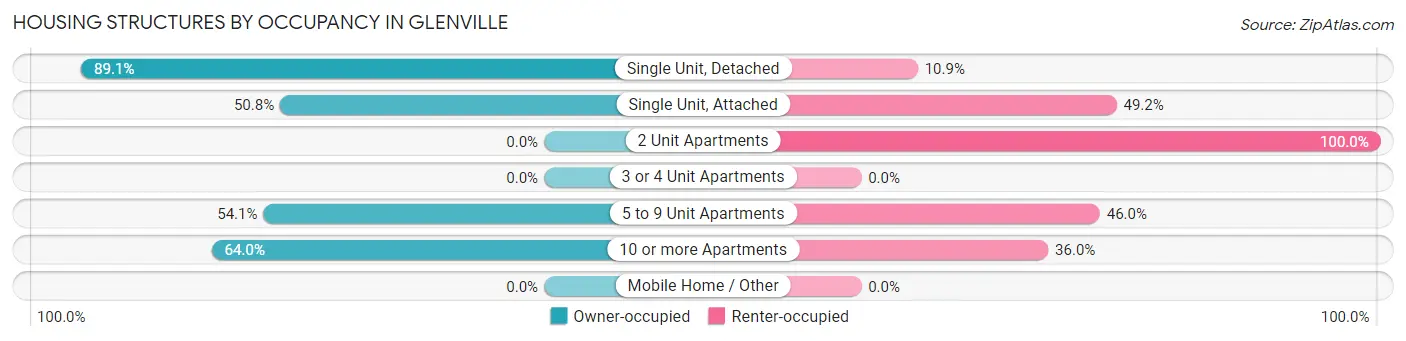
| Structure Type | Owner-occupied | Renter-occupied |
| Single Unit, Detached | 548 (89.1%) | 67 (10.9%) |
| Single Unit, Attached | 154 (50.8%) | 149 (49.2%) |
| 2 Unit Apartments | 0 (0.0%) | 29 (100.0%) |
| 3 or 4 Unit Apartments | 0 (0.0%) | 0 (0.0%) |
| 5 to 9 Unit Apartments | 40 (54.0%) | 34 (46.0%) |
| 10 or more Apartments | 48 (64.0%) | 27 (36.0%) |
| Mobile Home / Other | 0 (0.0%) | 0 (0.0%) |
| Total | 790 (72.1%) | 306 (27.9%) |
Housing Structures by Number of Rooms in Glenville
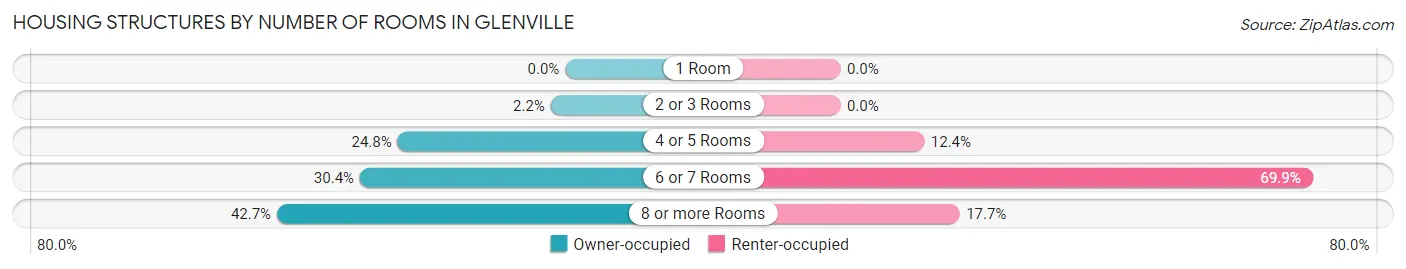
| Number of Rooms | Owner-occupied | Renter-occupied |
| 1 Room | 0 (0.0%) | 0 (0.0%) |
| 2 or 3 Rooms | 17 (2.1%) | 0 (0.0%) |
| 4 or 5 Rooms | 196 (24.8%) | 38 (12.4%) |
| 6 or 7 Rooms | 240 (30.4%) | 214 (69.9%) |
| 8 or more Rooms | 337 (42.7%) | 54 (17.6%) |
| Total | 790 (100.0%) | 306 (100.0%) |
Housing Structure by Heating Type in Glenville
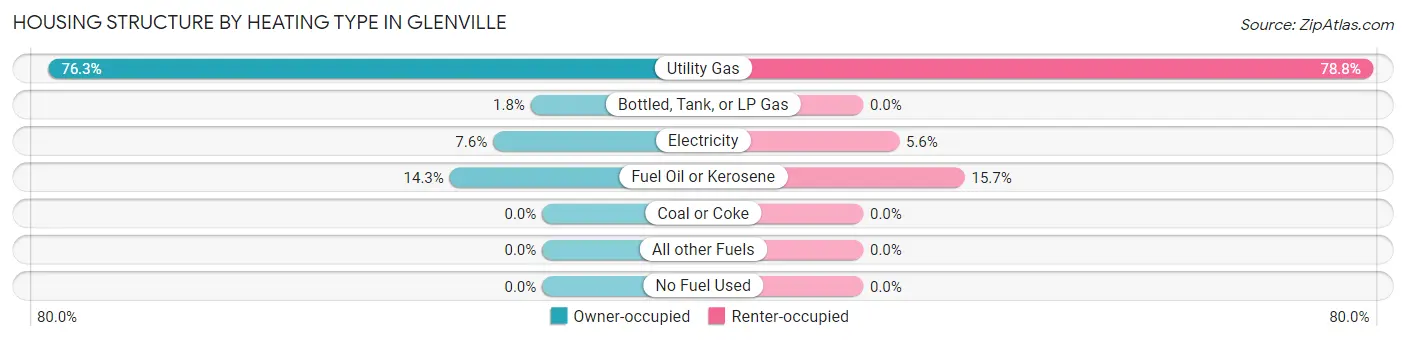
| Heating Type | Owner-occupied | Renter-occupied |
| Utility Gas | 603 (76.3%) | 241 (78.8%) |
| Bottled, Tank, or LP Gas | 14 (1.8%) | 0 (0.0%) |
| Electricity | 60 (7.6%) | 17 (5.6%) |
| Fuel Oil or Kerosene | 113 (14.3%) | 48 (15.7%) |
| Coal or Coke | 0 (0.0%) | 0 (0.0%) |
| All other Fuels | 0 (0.0%) | 0 (0.0%) |
| No Fuel Used | 0 (0.0%) | 0 (0.0%) |
| Total | 790 (100.0%) | 306 (100.0%) |
Household Vehicle Usage in Glenville

| Vehicles per Household | Owner-occupied | Renter-occupied |
| No Vehicle | 61 (7.7%) | 0 (0.0%) |
| 1 Vehicle | 140 (17.7%) | 19 (6.2%) |
| 2 Vehicles | 366 (46.3%) | 177 (57.8%) |
| 3 or more Vehicles | 223 (28.2%) | 110 (35.9%) |
| Total | 790 (100.0%) | 306 (100.0%) |
Real Estate & Mortgages in Glenville
Real Estate and Mortgage Overview in Glenville
| Characteristic | Without Mortgage | With Mortgage |
| Housing Units | 313 | 477 |
| Median Property Value | $1,038,900 | $957,900 |
| Median Household Income | - | - |
| Monthly Housing Costs | $1,207 | $319 |
| Real Estate Taxes | $6,476 | $0 |
Property Value by Mortgage Status in Glenville
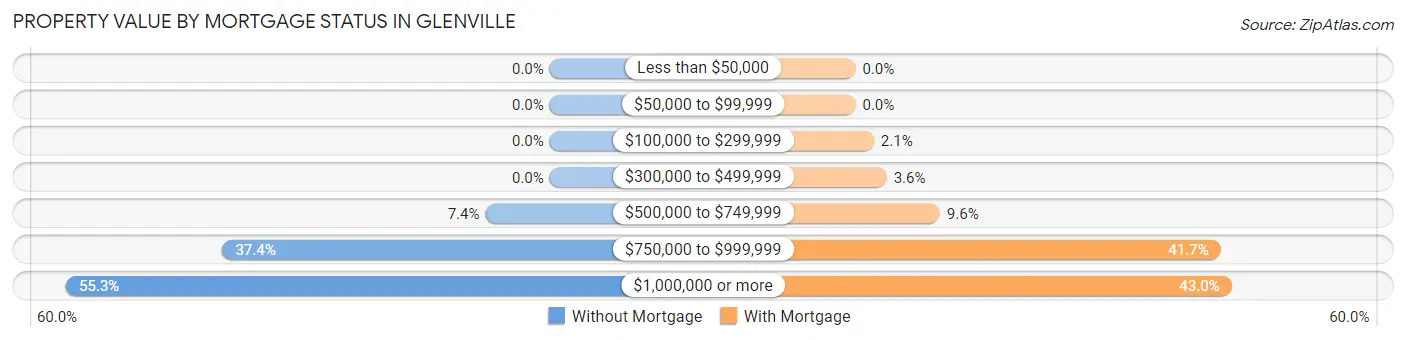
| Property Value | Without Mortgage | With Mortgage |
| Less than $50,000 | 0 (0.0%) | 0 (0.0%) |
| $50,000 to $99,999 | 0 (0.0%) | 0 (0.0%) |
| $100,000 to $299,999 | 0 (0.0%) | 10 (2.1%) |
| $300,000 to $499,999 | 0 (0.0%) | 17 (3.6%) |
| $500,000 to $749,999 | 23 (7.3%) | 46 (9.6%) |
| $750,000 to $999,999 | 117 (37.4%) | 199 (41.7%) |
| $1,000,000 or more | 173 (55.3%) | 205 (43.0%) |
| Total | 313 (100.0%) | 477 (100.0%) |
Household Income by Mortgage Status in Glenville
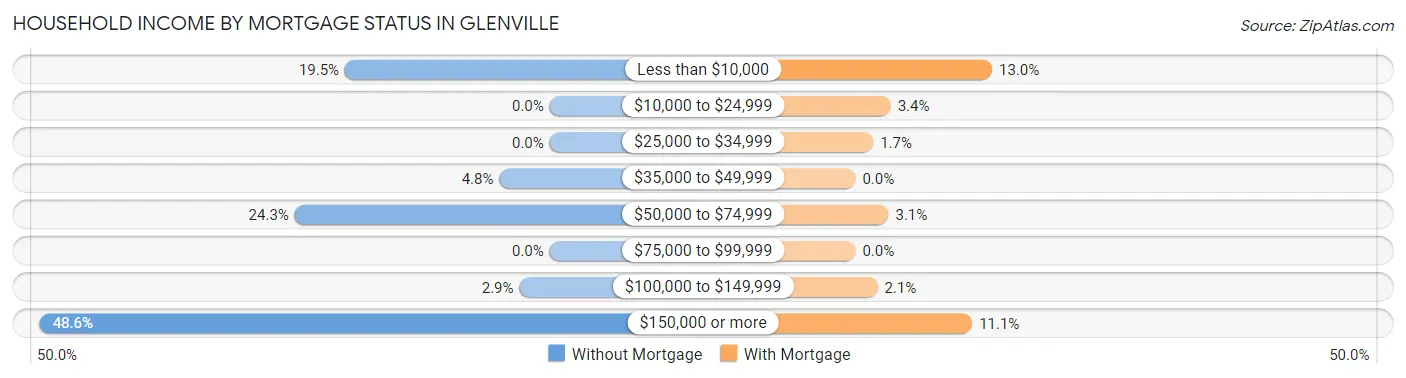
| Household Income | Without Mortgage | With Mortgage |
| Less than $10,000 | 61 (19.5%) | 62 (13.0%) |
| $10,000 to $24,999 | 0 (0.0%) | 16 (3.4%) |
| $25,000 to $34,999 | 0 (0.0%) | 8 (1.7%) |
| $35,000 to $49,999 | 15 (4.8%) | 0 (0.0%) |
| $50,000 to $74,999 | 76 (24.3%) | 15 (3.1%) |
| $75,000 to $99,999 | 0 (0.0%) | 0 (0.0%) |
| $100,000 to $149,999 | 9 (2.9%) | 10 (2.1%) |
| $150,000 or more | 152 (48.6%) | 53 (11.1%) |
| Total | 313 (100.0%) | 477 (100.0%) |
Property Value to Household Income Ratio in Glenville
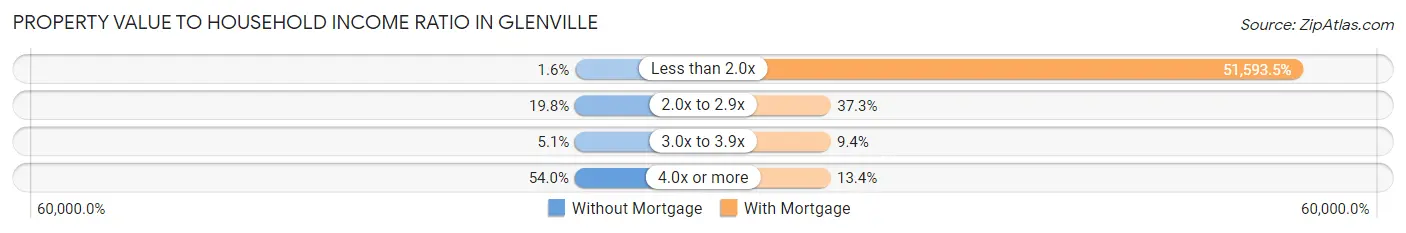
| Value-to-Income Ratio | Without Mortgage | With Mortgage |
| Less than 2.0x | 5 (1.6%) | 246,101 (51,593.5%) |
| 2.0x to 2.9x | 62 (19.8%) | 178 (37.3%) |
| 3.0x to 3.9x | 16 (5.1%) | 45 (9.4%) |
| 4.0x or more | 169 (54.0%) | 64 (13.4%) |
| Total | 313 (100.0%) | 477 (100.0%) |
Real Estate Taxes by Mortgage Status in Glenville
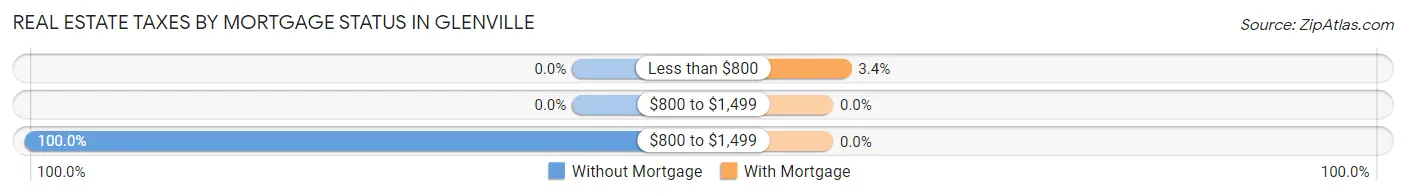
| Property Taxes | Without Mortgage | With Mortgage |
| Less than $800 | 0 (0.0%) | 16 (3.4%) |
| $800 to $1,499 | 0 (0.0%) | 0 (0.0%) |
| $800 to $1,499 | 313 (100.0%) | 0 (0.0%) |
| Total | 313 (100.0%) | 477 (100.0%) |
Health & Disability in Glenville
Health Insurance Coverage by Age in Glenville
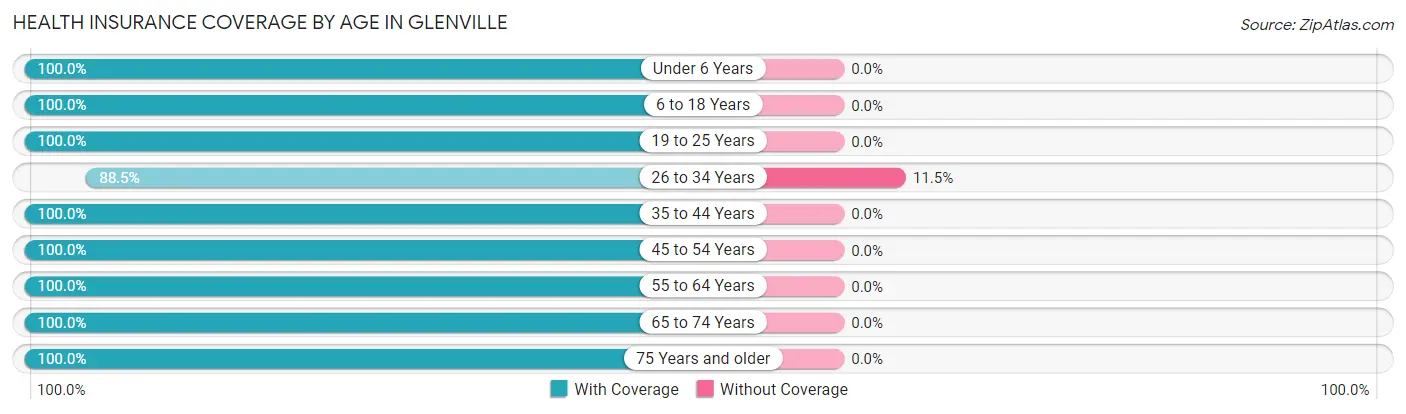
| Age Bracket | With Coverage | Without Coverage |
| Under 6 Years | 96 (100.0%) | 0 (0.0%) |
| 6 to 18 Years | 450 (100.0%) | 0 (0.0%) |
| 19 to 25 Years | 285 (100.0%) | 0 (0.0%) |
| 26 to 34 Years | 469 (88.5%) | 61 (11.5%) |
| 35 to 44 Years | 273 (100.0%) | 0 (0.0%) |
| 45 to 54 Years | 570 (100.0%) | 0 (0.0%) |
| 55 to 64 Years | 450 (100.0%) | 0 (0.0%) |
| 65 to 74 Years | 281 (100.0%) | 0 (0.0%) |
| 75 Years and older | 177 (100.0%) | 0 (0.0%) |
| Total | 3,051 (98.0%) | 61 (2.0%) |
Health Insurance Coverage by Citizenship Status in Glenville
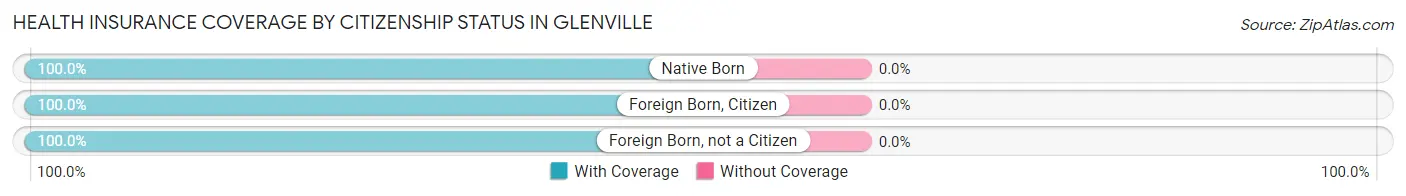
| Citizenship Status | With Coverage | Without Coverage |
| Native Born | 96 (100.0%) | 0 (0.0%) |
| Foreign Born, Citizen | 450 (100.0%) | 0 (0.0%) |
| Foreign Born, not a Citizen | 285 (100.0%) | 0 (0.0%) |
Health Insurance Coverage by Household Income in Glenville
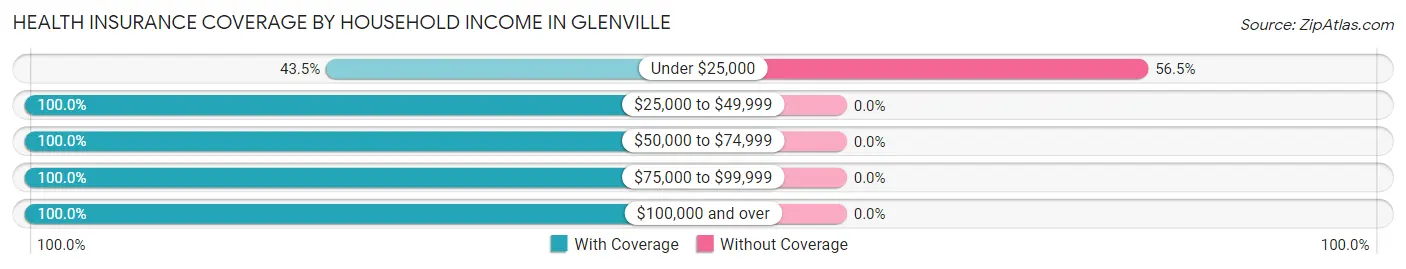
| Household Income | With Coverage | Without Coverage |
| Under $25,000 | 47 (43.5%) | 61 (56.5%) |
| $25,000 to $49,999 | 47 (100.0%) | 0 (0.0%) |
| $50,000 to $74,999 | 228 (100.0%) | 0 (0.0%) |
| $75,000 to $99,999 | 216 (100.0%) | 0 (0.0%) |
| $100,000 and over | 2,495 (100.0%) | 0 (0.0%) |
Public vs Private Health Insurance Coverage by Age in Glenville
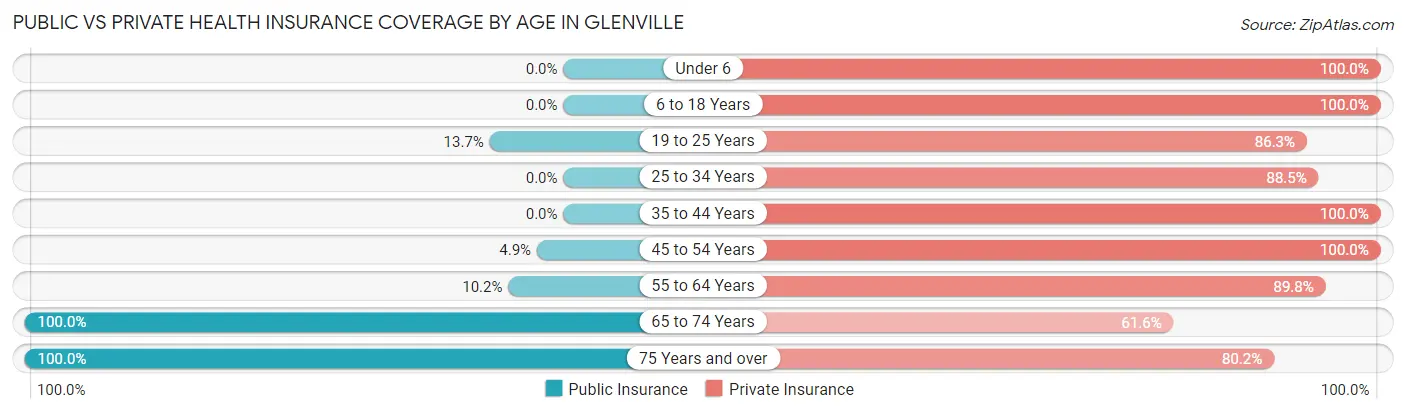
| Age Bracket | Public Insurance | Private Insurance |
| Under 6 | 0 (0.0%) | 96 (100.0%) |
| 6 to 18 Years | 0 (0.0%) | 450 (100.0%) |
| 19 to 25 Years | 39 (13.7%) | 246 (86.3%) |
| 25 to 34 Years | 0 (0.0%) | 469 (88.5%) |
| 35 to 44 Years | 0 (0.0%) | 273 (100.0%) |
| 45 to 54 Years | 28 (4.9%) | 570 (100.0%) |
| 55 to 64 Years | 46 (10.2%) | 404 (89.8%) |
| 65 to 74 Years | 281 (100.0%) | 173 (61.6%) |
| 75 Years and over | 177 (100.0%) | 142 (80.2%) |
| Total | 571 (18.3%) | 2,823 (90.7%) |
Disability Status by Sex by Age in Glenville
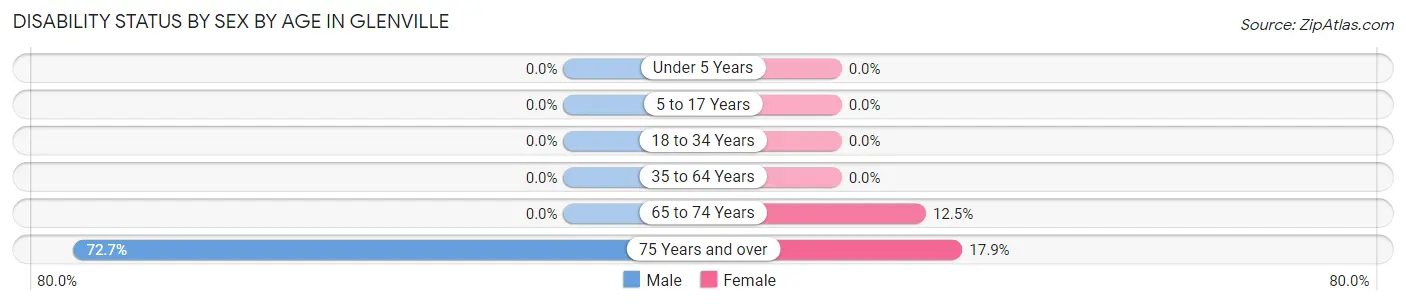
| Age Bracket | Male | Female |
| Under 5 Years | 0 (0.0%) | 0 (0.0%) |
| 5 to 17 Years | 0 (0.0%) | 0 (0.0%) |
| 18 to 34 Years | 0 (0.0%) | 0 (0.0%) |
| 35 to 64 Years | 0 (0.0%) | 0 (0.0%) |
| 65 to 74 Years | 0 (0.0%) | 17 (12.5%) |
| 75 Years and over | 80 (72.7%) | 12 (17.9%) |
Disability Class by Sex by Age in Glenville
Disability Class: Hearing Difficulty
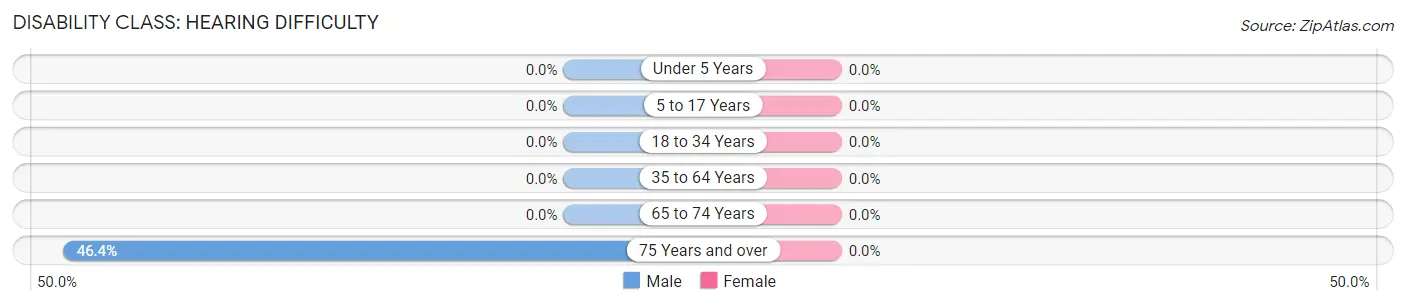
| Age Bracket | Male | Female |
| Under 5 Years | 0 (0.0%) | 0 (0.0%) |
| 5 to 17 Years | 0 (0.0%) | 0 (0.0%) |
| 18 to 34 Years | 0 (0.0%) | 0 (0.0%) |
| 35 to 64 Years | 0 (0.0%) | 0 (0.0%) |
| 65 to 74 Years | 0 (0.0%) | 0 (0.0%) |
| 75 Years and over | 51 (46.4%) | 0 (0.0%) |
Disability Class: Vision Difficulty
| Age Bracket | Male | Female |
| Under 5 Years | 0 (0.0%) | 0 (0.0%) |
| 5 to 17 Years | 0 (0.0%) | 0 (0.0%) |
| 18 to 34 Years | 0 (0.0%) | 0 (0.0%) |
| 35 to 64 Years | 0 (0.0%) | 0 (0.0%) |
| 65 to 74 Years | 0 (0.0%) | 0 (0.0%) |
| 75 Years and over | 0 (0.0%) | 0 (0.0%) |
Disability Class: Cognitive Difficulty
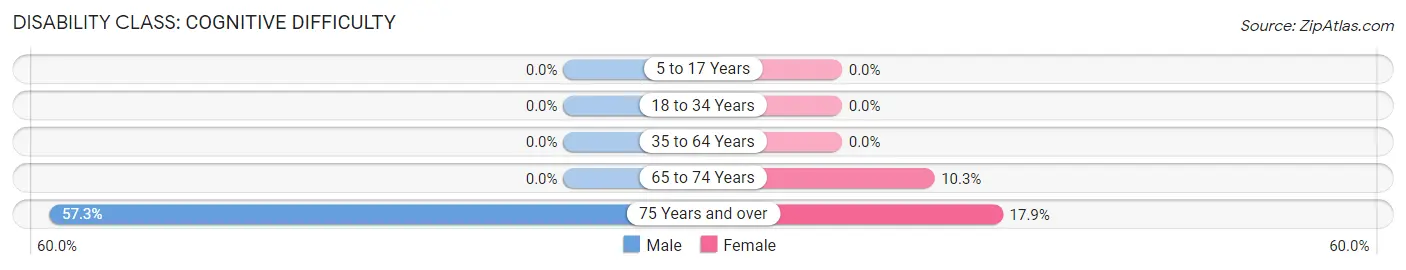
| Age Bracket | Male | Female |
| 5 to 17 Years | 0 (0.0%) | 0 (0.0%) |
| 18 to 34 Years | 0 (0.0%) | 0 (0.0%) |
| 35 to 64 Years | 0 (0.0%) | 0 (0.0%) |
| 65 to 74 Years | 0 (0.0%) | 14 (10.3%) |
| 75 Years and over | 63 (57.3%) | 12 (17.9%) |
Disability Class: Ambulatory Difficulty
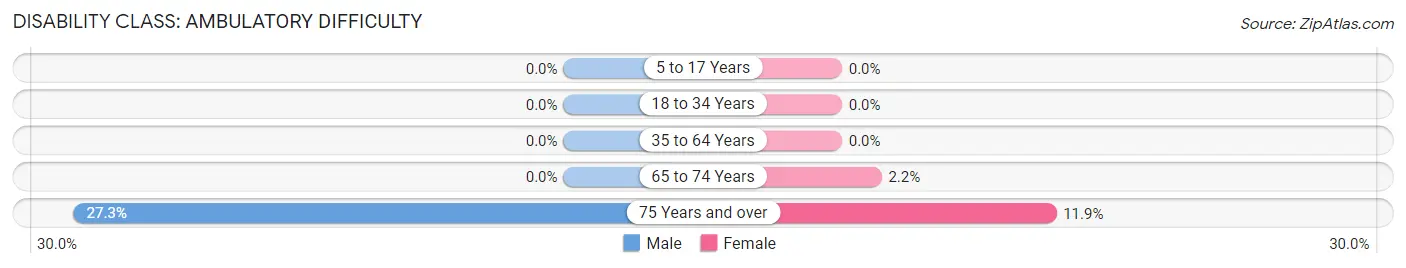
| Age Bracket | Male | Female |
| 5 to 17 Years | 0 (0.0%) | 0 (0.0%) |
| 18 to 34 Years | 0 (0.0%) | 0 (0.0%) |
| 35 to 64 Years | 0 (0.0%) | 0 (0.0%) |
| 65 to 74 Years | 0 (0.0%) | 3 (2.2%) |
| 75 Years and over | 30 (27.3%) | 8 (11.9%) |
Disability Class: Self-Care Difficulty
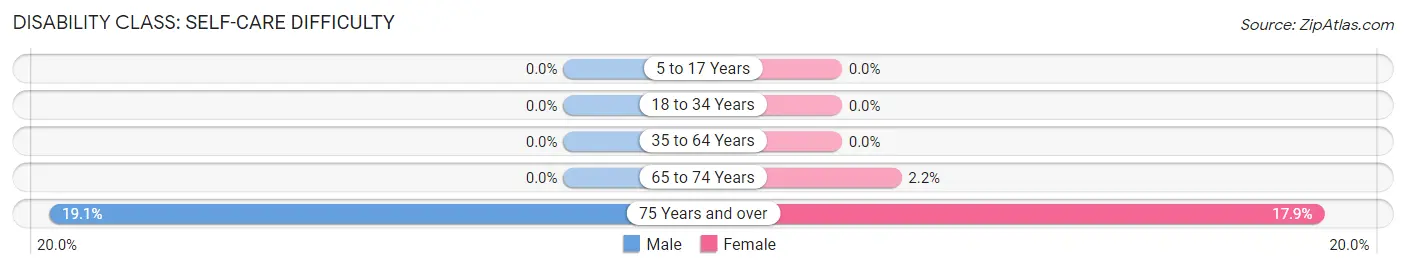
| Age Bracket | Male | Female |
| 5 to 17 Years | 0 (0.0%) | 0 (0.0%) |
| 18 to 34 Years | 0 (0.0%) | 0 (0.0%) |
| 35 to 64 Years | 0 (0.0%) | 0 (0.0%) |
| 65 to 74 Years | 0 (0.0%) | 3 (2.2%) |
| 75 Years and over | 21 (19.1%) | 12 (17.9%) |
Technology Access in Glenville
Computing Device Access in Glenville
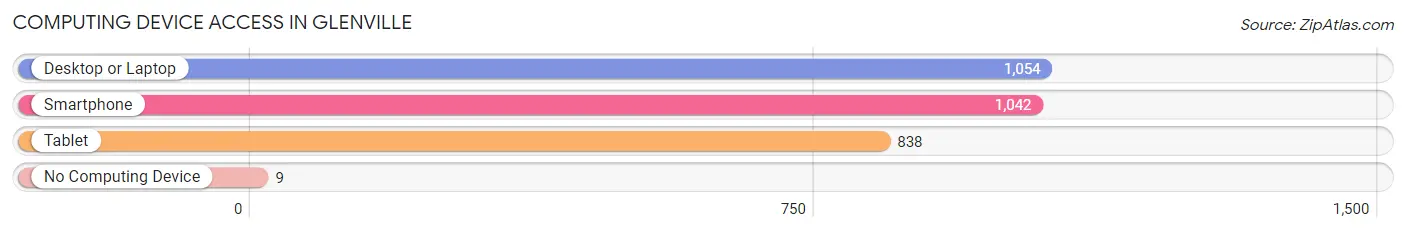
| Device Type | # Households | % Households |
| Desktop or Laptop | 1,054 | 96.2% |
| Smartphone | 1,042 | 95.1% |
| Tablet | 838 | 76.5% |
| No Computing Device | 9 | 0.8% |
| Total | 1,096 | 100.0% |
Internet Access in Glenville
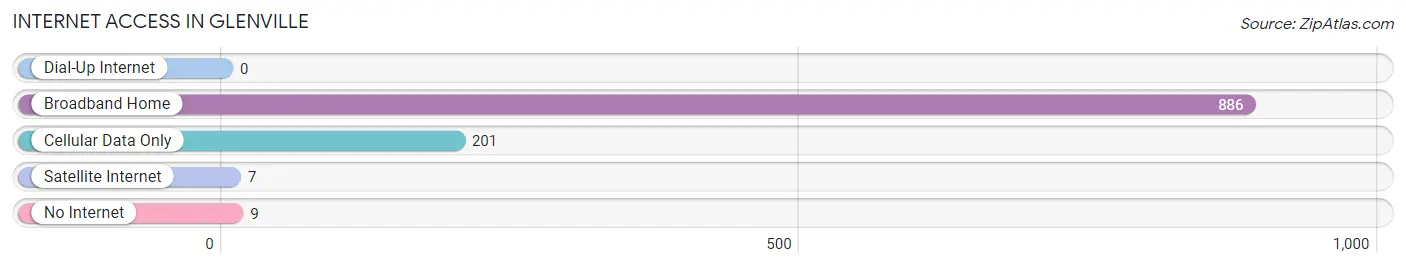
| Internet Type | # Households | % Households |
| Dial-Up Internet | 0 | 0.0% |
| Broadband Home | 886 | 80.8% |
| Cellular Data Only | 201 | 18.3% |
| Satellite Internet | 7 | 0.6% |
| No Internet | 9 | 0.8% |
| Total | 1,096 | 100.0% |
Glenville Summary
Glenville is a town located in Fairfield County, Connecticut. It is situated in the southwestern corner of the state, and is bordered by the towns of Greenwich, Stamford, and New Canaan. The town has a population of approximately 10,000 people, and is part of the greater Bridgeport-Stamford-Norwalk metropolitan area.
History
The area that is now Glenville was originally inhabited by the Paugussett Native American tribe. The first European settlers arrived in the area in the late 17th century, and the town was officially incorporated in 1848. The town was named after the Glenville Iron Works, which was established in the area in the early 19th century. The iron works was a major employer in the area, and the town grew rapidly in the late 19th and early 20th centuries.
Geography
Glenville is located in southwestern Connecticut, and is bordered by the towns of Greenwich, Stamford, and New Canaan. The town covers an area of approximately 8.5 square miles, and is situated at an elevation of approximately 200 feet above sea level. The town is located in the Housatonic River Valley, and is home to several small lakes and ponds.
Economy
Glenville is home to a variety of businesses, including manufacturing, retail, and service industries. The town is also home to several corporate headquarters, including the headquarters of the Xerox Corporation. The town is also home to several small businesses, including restaurants, shops, and professional services.
Demographics
As of the 2010 census, the population of Glenville was 10,000. The racial makeup of the town was 87.3% White, 5.2% African American, 0.7% Native American, 2.7% Asian, and 3.1% from other races. The median household income in the town was $90,000, and the median family income was $103,000. The per capita income in the town was $41,000.
Conclusion
Glenville is a small town located in Fairfield County, Connecticut. It has a population of approximately 10,000 people, and is part of the greater Bridgeport-Stamford-Norwalk metropolitan area. The town has a long history, and was originally inhabited by the Paugussett Native American tribe. The town is home to a variety of businesses, including manufacturing, retail, and service industries. The population of the town is predominantly White, with a small percentage of African American, Native American, and Asian residents. The median household income in the town is $90,000, and the median family income is $103,000.
Common Questions
What is Per Capita Income in Glenville?
Per Capita income in Glenville is $115,516.
What is the Median Family Income in Glenville?
Median Family Income in Glenville is $225,313.
What is the Median Household income in Glenville?
Median Household Income in Glenville is $197,619.
What is Income or Wage Gap in Glenville?
Income or Wage Gap in Glenville is 52.6%.
Women in Glenville earn 47.4 cents for every dollar earned by a man.
What is Inequality or Gini Index in Glenville?
Inequality or Gini Index in Glenville is 0.51.
What is the Total Population of Glenville?
Total Population of Glenville is 3,112.
What is the Total Male Population of Glenville?
Total Male Population of Glenville is 1,365.
What is the Total Female Population of Glenville?
Total Female Population of Glenville is 1,747.
What is the Ratio of Males per 100 Females in Glenville?
There are 78.13 Males per 100 Females in Glenville.
What is the Ratio of Females per 100 Males in Glenville?
There are 127.99 Females per 100 Males in Glenville.
What is the Median Population Age in Glenville?
Median Population Age in Glenville is 41.8 Years.
What is the Average Family Size in Glenville
Average Family Size in Glenville is 3.2 People.
What is the Average Household Size in Glenville
Average Household Size in Glenville is 2.8 People.
How Large is the Labor Force in Glenville?
There are 2,029 People in the Labor Forcein in Glenville.
What is the Percentage of People in the Labor Force in Glenville?
74.4% of People are in the Labor Force in Glenville.
What is the Unemployment Rate in Glenville?
Unemployment Rate in Glenville is 7.4%.