Southwood Acres, CT Map & Demographics
Southwood Acres Map
Southwood Acres Overview
$45,992
PER CAPITA INCOME
$123,533
AVG FAMILY INCOME
$101,939
AVG HOUSEHOLD INCOME
24.9%
WAGE / INCOME GAP [ % ]
75.1¢/ $1
WAGE / INCOME GAP [ $ ]
0.34
INEQUALITY / GINI INDEX
7,928
TOTAL POPULATION
3,831
MALE POPULATION
4,097
FEMALE POPULATION
93.51
MALES / 100 FEMALES
106.94
FEMALES / 100 MALES
42.2
MEDIAN AGE
2.8
AVG FAMILY SIZE
2.4
AVG HOUSEHOLD SIZE
4,787
LABOR FORCE [ PEOPLE ]
70.7%
PERCENT IN LABOR FORCE
3.1%
UNEMPLOYMENT RATE
Income in Southwood Acres
Income Overview in Southwood Acres
Per Capita Income in Southwood Acres is $45,992, while median incomes of families and households are $123,533 and $101,939 respectively.
| Characteristic | Number | Measure |
| Per Capita Income | 7,928 | $45,992 |
| Median Family Income | 2,205 | $123,533 |
| Mean Family Income | 2,205 | $123,209 |
| Median Household Income | 3,332 | $101,939 |
| Mean Household Income | 3,332 | $109,427 |
| Income Deficit | 2,205 | $0 |
| Wage / Income Gap (%) | 7,928 | 24.89% |
| Wage / Income Gap ($) | 7,928 | 75.11¢ per $1 |
| Gini / Inequality Index | 7,928 | 0.34 |
Earnings by Sex in Southwood Acres
Average Earnings in Southwood Acres are $54,167, $62,461 for men and $46,912 for women, a difference of 24.9%.
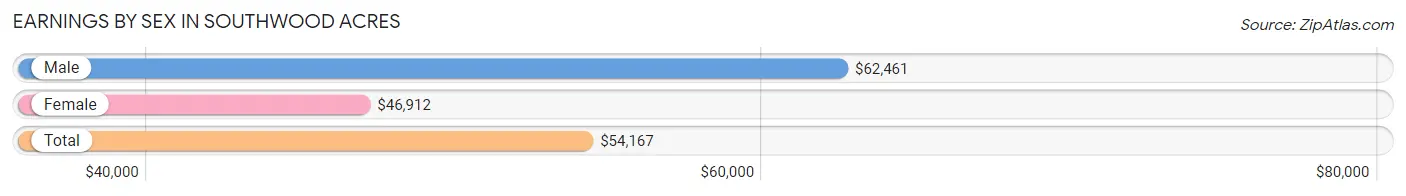
| Sex | Number | Average Earnings |
| Male | 2,378 (47.8%) | $62,461 |
| Female | 2,592 (52.1%) | $46,912 |
| Total | 4,970 (100.0%) | $54,167 |
Earnings by Sex by Income Bracket in Southwood Acres
The most common earnings brackets in Southwood Acres are $100,000+ for men (480 | 20.2%) and $65,000 to $74,999 for women (288 | 11.1%).
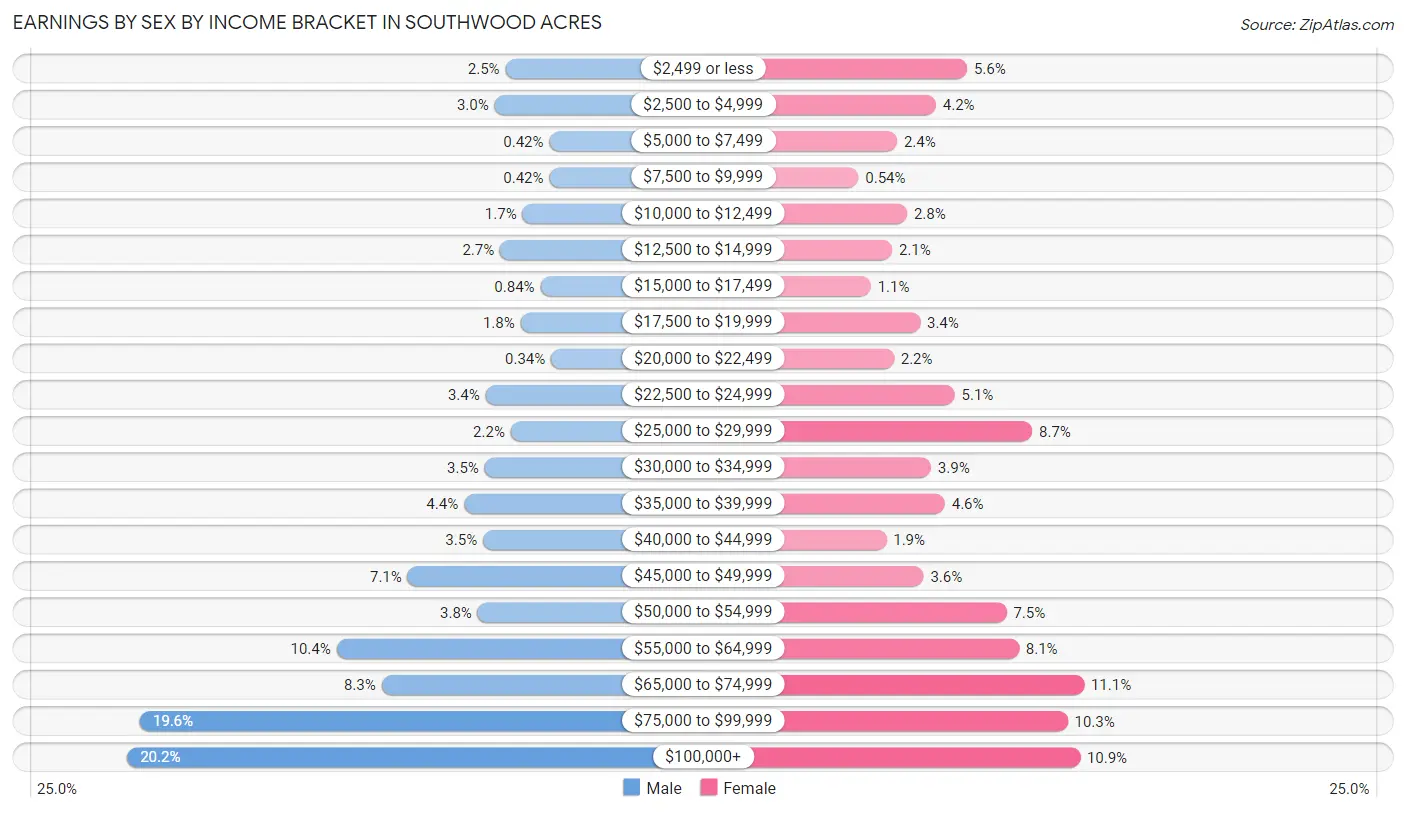
| Income | Male | Female |
| $2,499 or less | 59 (2.5%) | 146 (5.6%) |
| $2,500 to $4,999 | 71 (3.0%) | 108 (4.2%) |
| $5,000 to $7,499 | 10 (0.4%) | 61 (2.4%) |
| $7,500 to $9,999 | 10 (0.4%) | 14 (0.5%) |
| $10,000 to $12,499 | 40 (1.7%) | 73 (2.8%) |
| $12,500 to $14,999 | 65 (2.7%) | 55 (2.1%) |
| $15,000 to $17,499 | 20 (0.8%) | 29 (1.1%) |
| $17,500 to $19,999 | 42 (1.8%) | 89 (3.4%) |
| $20,000 to $22,499 | 8 (0.3%) | 57 (2.2%) |
| $22,500 to $24,999 | 81 (3.4%) | 131 (5.1%) |
| $25,000 to $29,999 | 53 (2.2%) | 225 (8.7%) |
| $30,000 to $34,999 | 82 (3.5%) | 102 (3.9%) |
| $35,000 to $39,999 | 105 (4.4%) | 119 (4.6%) |
| $40,000 to $44,999 | 84 (3.5%) | 48 (1.8%) |
| $45,000 to $49,999 | 168 (7.1%) | 93 (3.6%) |
| $50,000 to $54,999 | 90 (3.8%) | 194 (7.5%) |
| $55,000 to $64,999 | 247 (10.4%) | 209 (8.1%) |
| $65,000 to $74,999 | 197 (8.3%) | 288 (11.1%) |
| $75,000 to $99,999 | 466 (19.6%) | 268 (10.3%) |
| $100,000+ | 480 (20.2%) | 283 (10.9%) |
| Total | 2,378 (100.0%) | 2,592 (100.0%) |
Earnings by Sex by Educational Attainment in Southwood Acres
Average earnings in Southwood Acres are $68,162 for men and $50,733 for women, a difference of 25.6%. Men with an educational attainment of bachelor's degree enjoy the highest average annual earnings of $84,583, while those with less than high school education earn the least with $46,023. Women with an educational attainment of bachelor's degree earn the most with the average annual earnings of $70,000, while those with high school diploma education have the smallest earnings of $26,778.
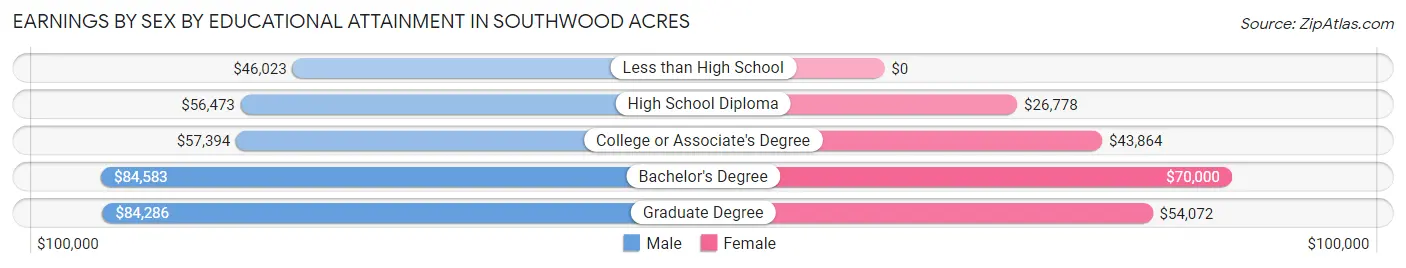
| Educational Attainment | Male Income | Female Income |
| Less than High School | $46,023 | $0 |
| High School Diploma | $56,473 | $26,778 |
| College or Associate's Degree | $57,394 | $43,864 |
| Bachelor's Degree | $84,583 | $70,000 |
| Graduate Degree | $84,286 | $54,072 |
| Total | $68,162 | $50,733 |
Family Income in Southwood Acres
Family Income Brackets in Southwood Acres
According to the Southwood Acres family income data, there are 739 families falling into the $100,000 to $149,999 income range, which is the most common income bracket and makes up 33.5% of all families. Conversely, the $10,000 to $14,999 income bracket is the least frequent group with only 2 families (0.1%) belonging to this category.
| Income Bracket | # Families | % Families |
| Less than $10,000 | 60 | 2.7% |
| $10,000 to $14,999 | 2 | 0.1% |
| $15,000 to $24,999 | 53 | 2.4% |
| $25,000 to $34,999 | 75 | 3.4% |
| $35,000 to $49,999 | 163 | 7.4% |
| $50,000 to $74,999 | 289 | 13.1% |
| $75,000 to $99,999 | 205 | 9.3% |
| $100,000 to $149,999 | 739 | 33.5% |
| $150,000 to $199,999 | 351 | 15.9% |
| $200,000+ | 267 | 12.1% |
Family Income by Famaliy Size in Southwood Acres
5-person families (147 | 6.7%) account for the highest median family income in Southwood Acres with $168,355 per family, while 2-person families (1,224 | 55.5%) have the highest median income of $53,958 per family member.
| Income Bracket | # Families | Median Income |
| 2-Person Families | 1,224 (55.5%) | $107,917 |
| 3-Person Families | 514 (23.3%) | $122,500 |
| 4-Person Families | 296 (13.4%) | $128,600 |
| 5-Person Families | 147 (6.7%) | $168,355 |
| 6-Person Families | 7 (0.3%) | $0 |
| 7+ Person Families | 17 (0.8%) | $0 |
| Total | 2,205 (100.0%) | $123,533 |
Family Income by Number of Earners in Southwood Acres
The median family income in Southwood Acres is $123,533, with families comprising 3+ earners (338) having the highest median family income of $173,295, while families with no earners (324) have the lowest median family income of $57,692, accounting for 15.3% and 14.7% of families, respectively.
| Number of Earners | # Families | Median Income |
| No Earners | 324 (14.7%) | $57,692 |
| 1 Earner | 541 (24.5%) | $87,188 |
| 2 Earners | 1,002 (45.4%) | $128,975 |
| 3+ Earners | 338 (15.3%) | $173,295 |
| Total | 2,205 (100.0%) | $123,533 |
Household Income in Southwood Acres
Household Income Brackets in Southwood Acres
With 1,056 households falling in the category, the $100,000 to $149,999 income range is the most frequent in Southwood Acres, accounting for 31.7% of all households. In contrast, only 47 households (1.4%) fall into the $10,000 to $14,999 income bracket, making it the least populous group.
| Income Bracket | # Households | % Households |
| Less than $10,000 | 93 | 2.8% |
| $10,000 to $14,999 | 47 | 1.4% |
| $15,000 to $24,999 | 103 | 3.1% |
| $25,000 to $34,999 | 180 | 5.4% |
| $35,000 to $49,999 | 337 | 10.1% |
| $50,000 to $74,999 | 403 | 12.1% |
| $75,000 to $99,999 | 420 | 12.6% |
| $100,000 to $149,999 | 1,056 | 31.7% |
| $150,000 to $199,999 | 387 | 11.6% |
| $200,000+ | 307 | 9.2% |
Household Income by Householder Age in Southwood Acres
The median household income in Southwood Acres is $101,939, with the highest median household income of $122,885 found in the 15 to 24 years age bracket for the primary householder. A total of 104 households (3.1%) fall into this category. Meanwhile, the 65+ years age bracket for the primary householder has the lowest median household income of $62,143, with 874 households (26.2%) in this group.
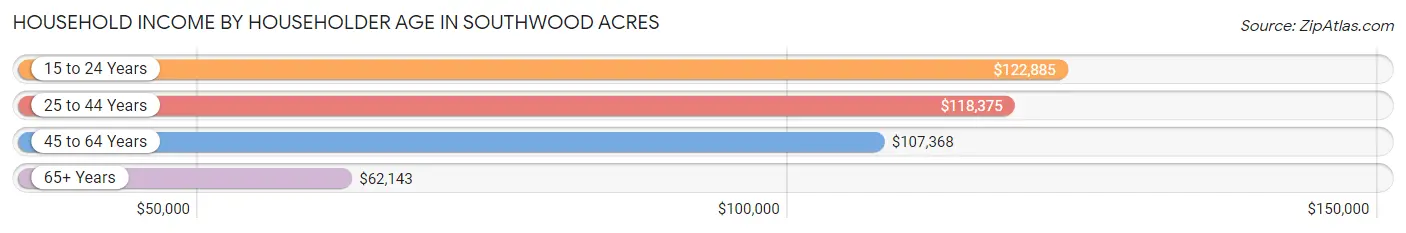
| Income Bracket | # Households | Median Income |
| 15 to 24 Years | 104 (3.1%) | $122,885 |
| 25 to 44 Years | 1,018 (30.5%) | $118,375 |
| 45 to 64 Years | 1,336 (40.1%) | $107,368 |
| 65+ Years | 874 (26.2%) | $62,143 |
| Total | 3,332 (100.0%) | $101,939 |
Poverty in Southwood Acres
Income Below Poverty by Sex and Age in Southwood Acres
With 6.5% poverty level for males and 6.7% for females among the residents of Southwood Acres, 35 to 44 year old males and 12 to 14 year old females are the most vulnerable to poverty, with 78 males (16.2%) and 62 females (47.0%) in their respective age groups living below the poverty level.
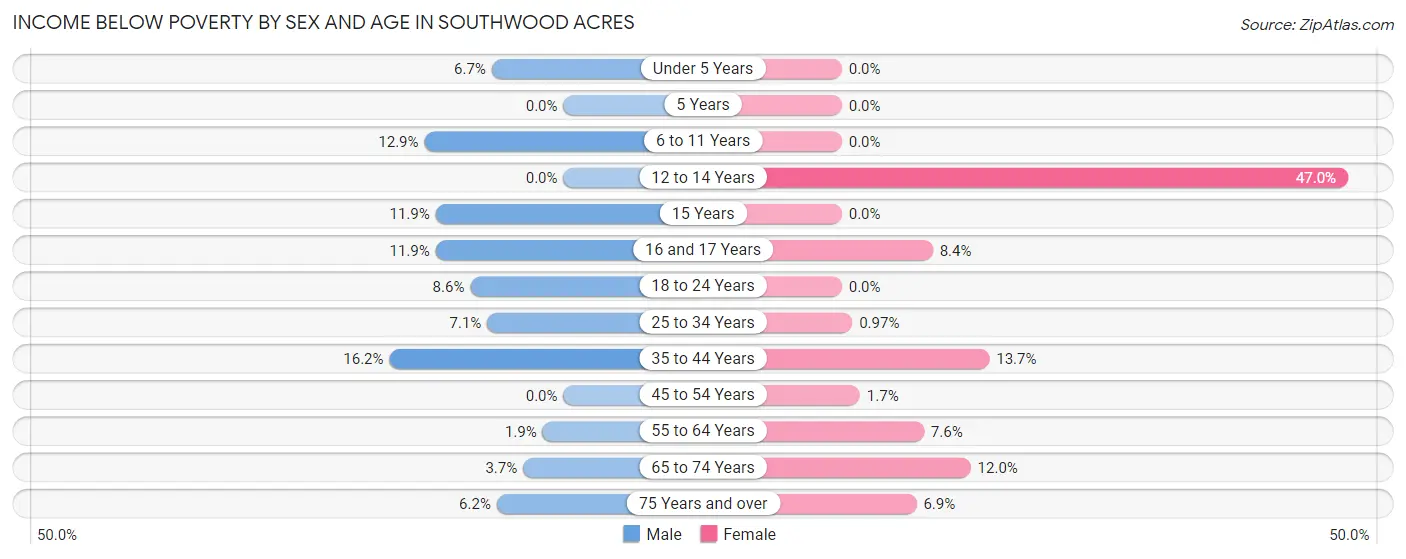
| Age Bracket | Male | Female |
| Under 5 Years | 23 (6.7%) | 0 (0.0%) |
| 5 Years | 0 (0.0%) | 0 (0.0%) |
| 6 to 11 Years | 20 (12.9%) | 0 (0.0%) |
| 12 to 14 Years | 0 (0.0%) | 62 (47.0%) |
| 15 Years | 7 (11.9%) | 0 (0.0%) |
| 16 and 17 Years | 7 (11.9%) | 19 (8.4%) |
| 18 to 24 Years | 31 (8.6%) | 0 (0.0%) |
| 25 to 34 Years | 42 (7.1%) | 7 (1.0%) |
| 35 to 44 Years | 78 (16.2%) | 46 (13.7%) |
| 45 to 54 Years | 0 (0.0%) | 10 (1.7%) |
| 55 to 64 Years | 11 (1.9%) | 56 (7.6%) |
| 65 to 74 Years | 13 (3.7%) | 44 (12.0%) |
| 75 Years and over | 16 (6.2%) | 32 (6.9%) |
| Total | 248 (6.5%) | 276 (6.7%) |
Income Above Poverty by Sex and Age in Southwood Acres
According to the poverty statistics in Southwood Acres, males aged 5 years and females aged under 5 years are the age groups that are most secure financially, with 100.0% of males and 100.0% of females in these age groups living above the poverty line.
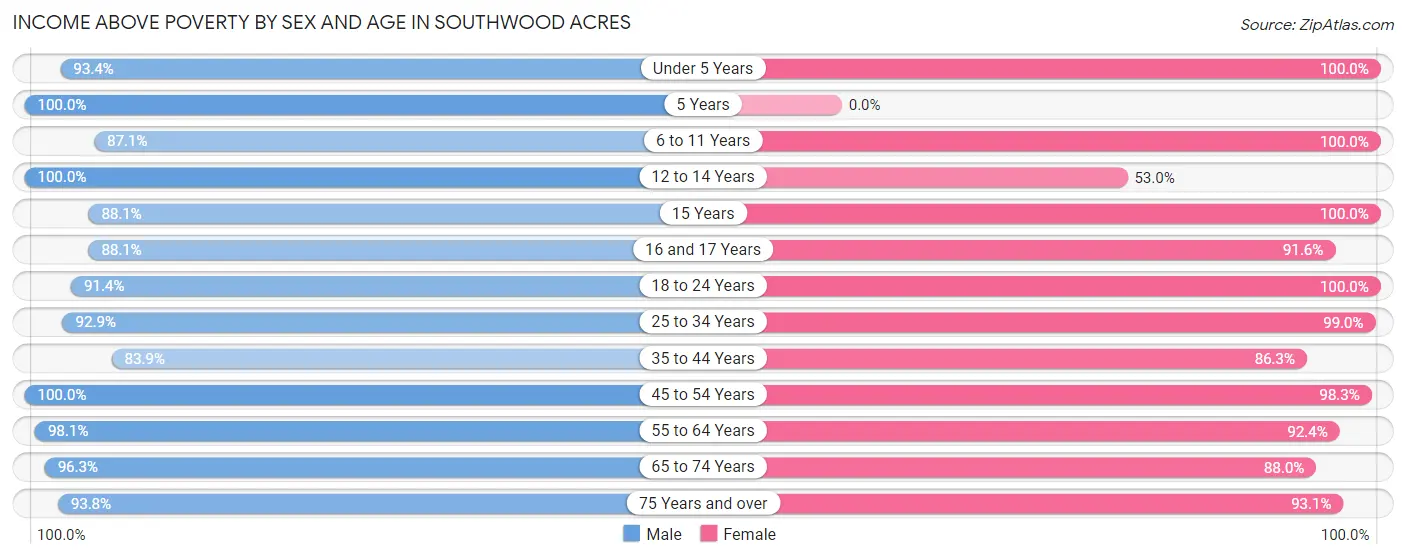
| Age Bracket | Male | Female |
| Under 5 Years | 323 (93.3%) | 118 (100.0%) |
| 5 Years | 25 (100.0%) | 0 (0.0%) |
| 6 to 11 Years | 135 (87.1%) | 126 (100.0%) |
| 12 to 14 Years | 135 (100.0%) | 70 (53.0%) |
| 15 Years | 52 (88.1%) | 61 (100.0%) |
| 16 and 17 Years | 52 (88.1%) | 206 (91.6%) |
| 18 to 24 Years | 328 (91.4%) | 213 (100.0%) |
| 25 to 34 Years | 552 (92.9%) | 718 (99.0%) |
| 35 to 44 Years | 405 (83.9%) | 290 (86.3%) |
| 45 to 54 Years | 438 (100.0%) | 586 (98.3%) |
| 55 to 64 Years | 560 (98.1%) | 679 (92.4%) |
| 65 to 74 Years | 335 (96.3%) | 324 (88.0%) |
| 75 Years and over | 243 (93.8%) | 430 (93.1%) |
| Total | 3,583 (93.5%) | 3,821 (93.3%) |
Income Below Poverty Among Married-Couple Families in Southwood Acres
The poverty statistics for married-couple families in Southwood Acres show that 3.2% or 57 of the total 1,781 families live below the poverty line. Families with no children have the highest poverty rate of 3.8%, comprising of 44 families. On the other hand, families with 3 or 4 children have the lowest poverty rate of 0.0%, which includes 0 families.
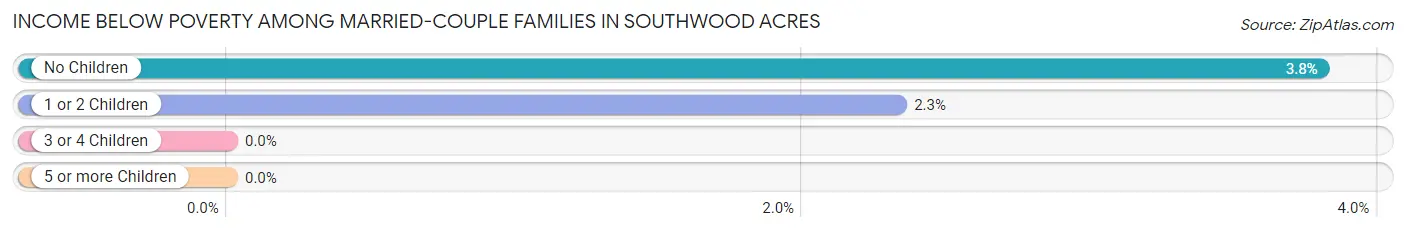
| Children | Above Poverty | Below Poverty |
| No Children | 1,114 (96.2%) | 44 (3.8%) |
| 1 or 2 Children | 544 (97.7%) | 13 (2.3%) |
| 3 or 4 Children | 66 (100.0%) | 0 (0.0%) |
| 5 or more Children | 0 (0.0%) | 0 (0.0%) |
| Total | 1,724 (96.8%) | 57 (3.2%) |
Income Below Poverty Among Single-Parent Households in Southwood Acres
According to the poverty data in Southwood Acres, 24.2% or 24 single-father households and 7.4% or 24 single-mother households are living below the poverty line. Among single-father households, those with 1 or 2 children have the highest poverty rate, with 24 households (42.1%) experiencing poverty. Likewise, among single-mother households, those with 1 or 2 children have the highest poverty rate, with 24 households (13.3%) falling below the poverty line.
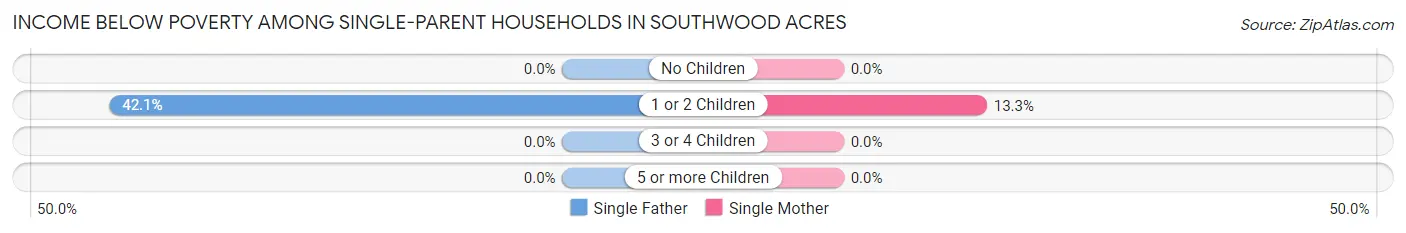
| Children | Single Father | Single Mother |
| No Children | 0 (0.0%) | 0 (0.0%) |
| 1 or 2 Children | 24 (42.1%) | 24 (13.3%) |
| 3 or 4 Children | 0 (0.0%) | 0 (0.0%) |
| 5 or more Children | 0 (0.0%) | 0 (0.0%) |
| Total | 24 (24.2%) | 24 (7.4%) |
Income Below Poverty Among Married-Couple vs Single-Parent Households in Southwood Acres
The poverty data for Southwood Acres shows that 57 of the married-couple family households (3.2%) and 48 of the single-parent households (11.3%) are living below the poverty level. Within the married-couple family households, those with no children have the highest poverty rate, with 44 households (3.8%) falling below the poverty line. Among the single-parent households, those with 1 or 2 children have the highest poverty rate, with 48 household (20.3%) living below poverty.
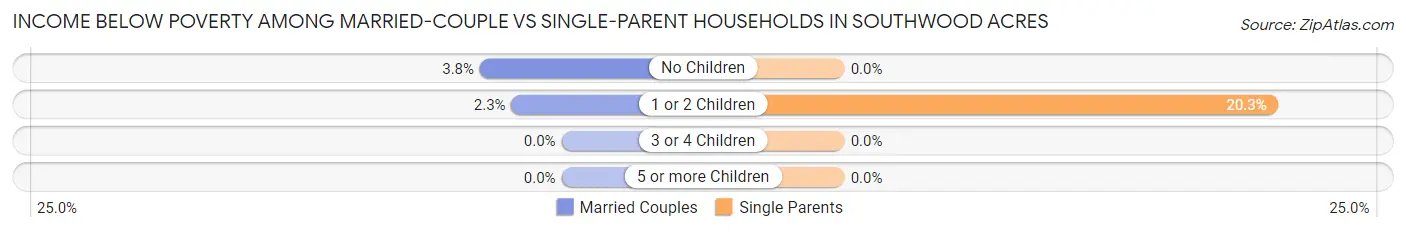
| Children | Married-Couple Families | Single-Parent Households |
| No Children | 44 (3.8%) | 0 (0.0%) |
| 1 or 2 Children | 13 (2.3%) | 48 (20.3%) |
| 3 or 4 Children | 0 (0.0%) | 0 (0.0%) |
| 5 or more Children | 0 (0.0%) | 0 (0.0%) |
| Total | 57 (3.2%) | 48 (11.3%) |
Race in Southwood Acres
The most populous races in Southwood Acres are White / Caucasian (6,694 | 84.4%), Hispanic or Latino (1,036 | 13.1%), and Two or more Races (753 | 9.5%).
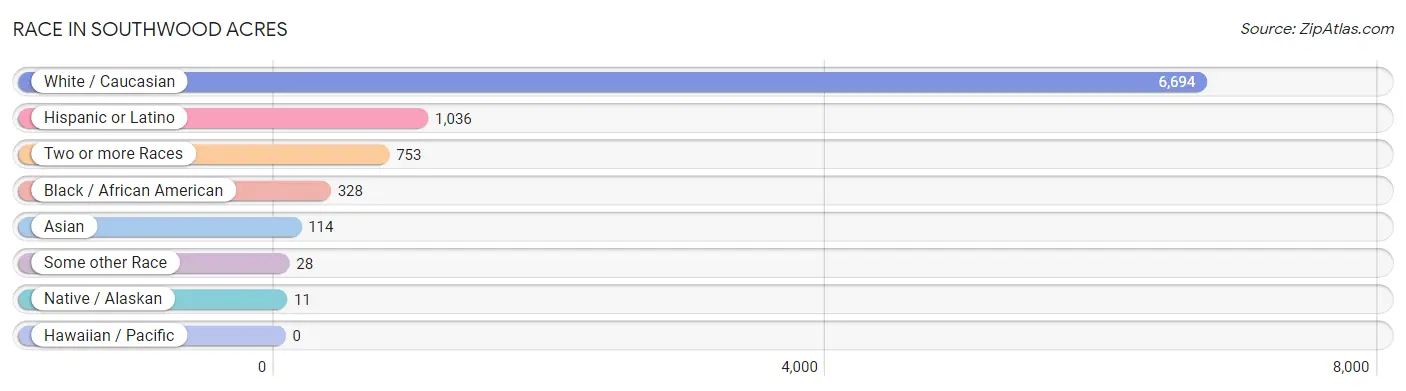
| Race | # Population | % Population |
| Asian | 114 | 1.4% |
| Black / African American | 328 | 4.1% |
| Hawaiian / Pacific | 0 | 0.0% |
| Hispanic or Latino | 1,036 | 13.1% |
| Native / Alaskan | 11 | 0.1% |
| White / Caucasian | 6,694 | 84.4% |
| Two or more Races | 753 | 9.5% |
| Some other Race | 28 | 0.4% |
| Total | 7,928 | 100.0% |
Ancestry in Southwood Acres
The most populous ancestries reported in Southwood Acres are Irish (1,509 | 19.0%), Italian (1,319 | 16.6%), English (912 | 11.5%), German (836 | 10.5%), and French (759 | 9.6%), together accounting for 67.3% of all Southwood Acres residents.
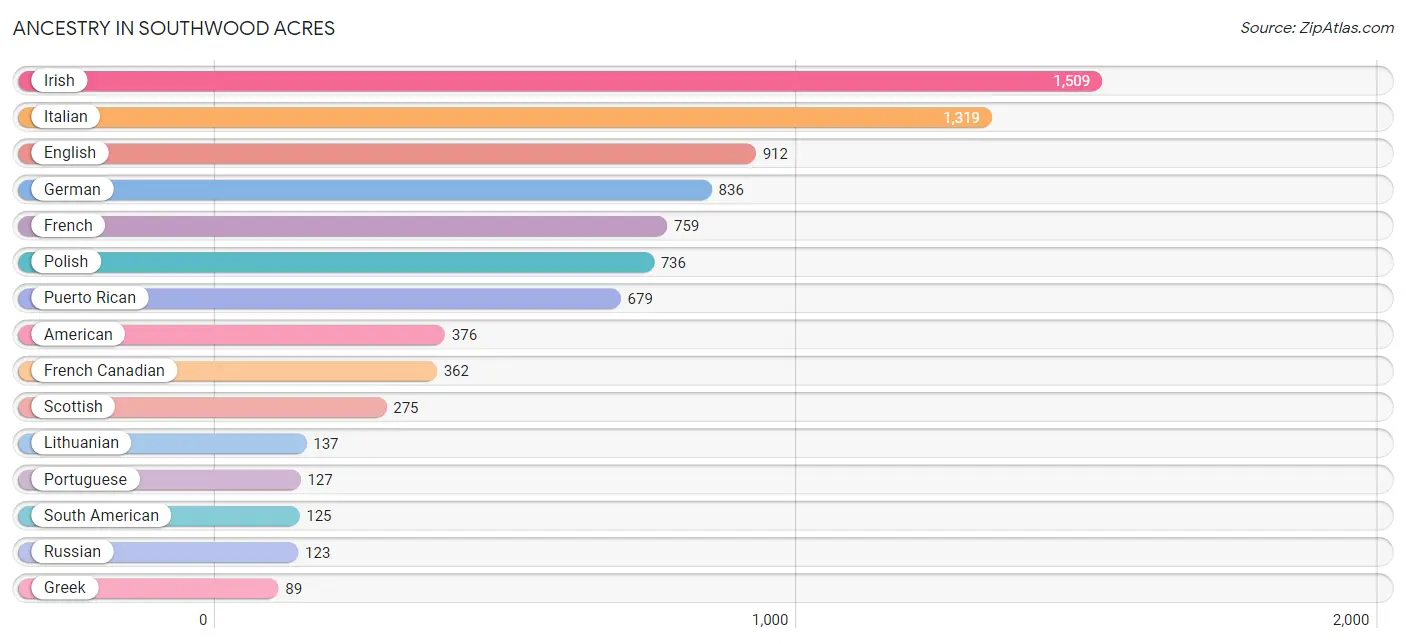
| Ancestry | # Population | % Population |
| African | 34 | 0.4% |
| American | 376 | 4.7% |
| Arab | 16 | 0.2% |
| Austrian | 21 | 0.3% |
| Bangladeshi | 23 | 0.3% |
| British | 21 | 0.3% |
| Burmese | 17 | 0.2% |
| Canadian | 63 | 0.8% |
| Central American | 49 | 0.6% |
| Czech | 16 | 0.2% |
| Danish | 63 | 0.8% |
| Dominican | 11 | 0.1% |
| Eastern European | 17 | 0.2% |
| English | 912 | 11.5% |
| Estonian | 38 | 0.5% |
| European | 25 | 0.3% |
| Finnish | 8 | 0.1% |
| French | 759 | 9.6% |
| French Canadian | 362 | 4.6% |
| German | 836 | 10.5% |
| Greek | 89 | 1.1% |
| Haitian | 14 | 0.2% |
| Hungarian | 71 | 0.9% |
| Indian (Asian) | 39 | 0.5% |
| Irish | 1,509 | 19.0% |
| Italian | 1,319 | 16.6% |
| Jamaican | 33 | 0.4% |
| Japanese | 51 | 0.6% |
| Latvian | 8 | 0.1% |
| Lebanese | 16 | 0.2% |
| Lithuanian | 137 | 1.7% |
| Mexican | 67 | 0.9% |
| Norwegian | 33 | 0.4% |
| Panamanian | 49 | 0.6% |
| Peruvian | 89 | 1.1% |
| Polish | 736 | 9.3% |
| Portuguese | 127 | 1.6% |
| Puerto Rican | 679 | 8.6% |
| Romanian | 32 | 0.4% |
| Russian | 123 | 1.5% |
| Samoan | 8 | 0.1% |
| Scandinavian | 7 | 0.1% |
| Scotch-Irish | 12 | 0.2% |
| Scottish | 275 | 3.5% |
| Slovak | 3 | 0.0% |
| South American | 125 | 1.6% |
| Spaniard | 19 | 0.2% |
| Sri Lankan | 34 | 0.4% |
| Subsaharan African | 34 | 0.4% |
| Swedish | 52 | 0.7% |
| Swiss | 20 | 0.3% |
| Welsh | 19 | 0.2% | View All 52 Rows |
Immigrants in Southwood Acres
The most numerous immigrant groups reported in Southwood Acres came from Europe (233 | 2.9%), Eastern Europe (166 | 2.1%), Latin America (138 | 1.7%), Poland (85 | 1.1%), and Asia (73 | 0.9%), together accounting for 8.8% of all Southwood Acres residents.
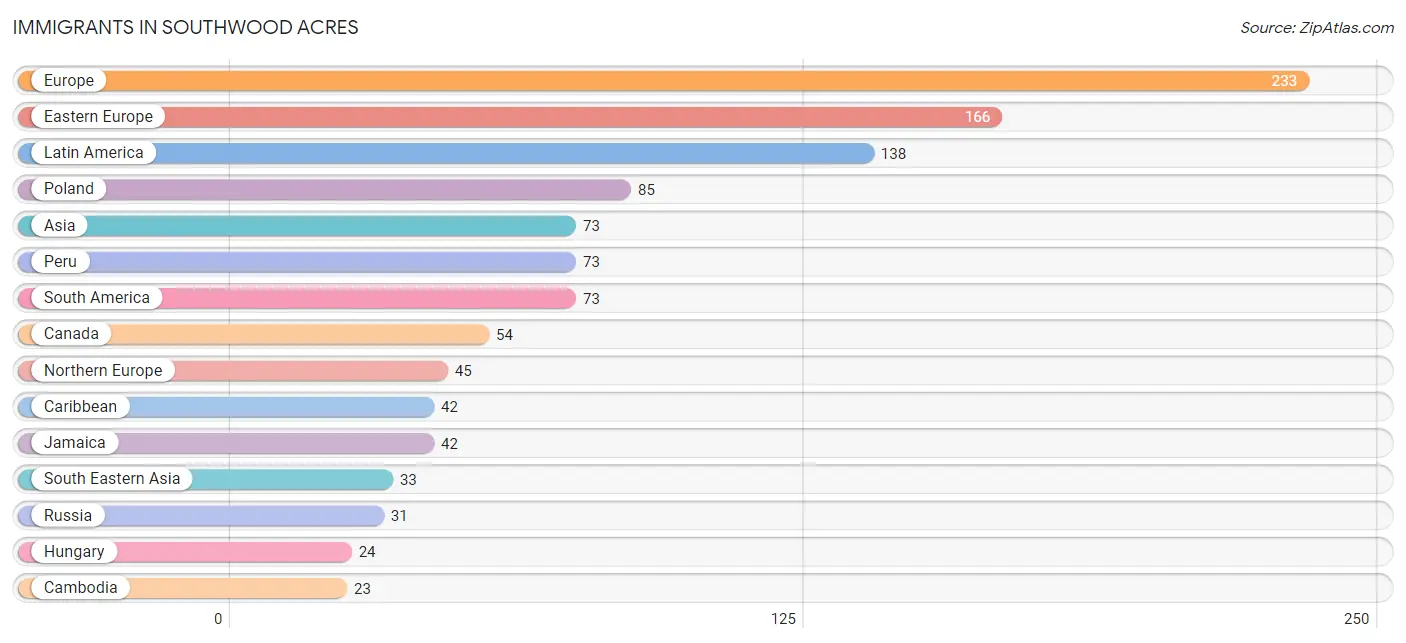
| Immigration Origin | # Population | % Population |
| Africa | 22 | 0.3% |
| Asia | 73 | 0.9% |
| Cambodia | 23 | 0.3% |
| Canada | 54 | 0.7% |
| Caribbean | 42 | 0.5% |
| Central America | 23 | 0.3% |
| China | 3 | 0.0% |
| Eastern Asia | 20 | 0.3% |
| Eastern Europe | 166 | 2.1% |
| England | 11 | 0.1% |
| Europe | 233 | 2.9% |
| Hungary | 24 | 0.3% |
| Ireland | 6 | 0.1% |
| Jamaica | 42 | 0.5% |
| Korea | 17 | 0.2% |
| Latin America | 138 | 1.7% |
| Middle Africa | 22 | 0.3% |
| Moldova | 6 | 0.1% |
| Nepal | 20 | 0.3% |
| Northern Europe | 45 | 0.6% |
| Panama | 23 | 0.3% |
| Peru | 73 | 0.9% |
| Poland | 85 | 1.1% |
| Portugal | 22 | 0.3% |
| Russia | 31 | 0.4% |
| Scotland | 17 | 0.2% |
| South America | 73 | 0.9% |
| South Central Asia | 20 | 0.3% |
| South Eastern Asia | 33 | 0.4% |
| Southern Europe | 22 | 0.3% |
| Ukraine | 20 | 0.3% |
| Vietnam | 10 | 0.1% |
| Zaire | 22 | 0.3% | View All 33 Rows |
Sex and Age in Southwood Acres
Sex and Age in Southwood Acres
The most populous age groups in Southwood Acres are 30 to 34 Years (364 | 9.5%) for men and 60 to 64 Years (408 | 10.0%) for women.
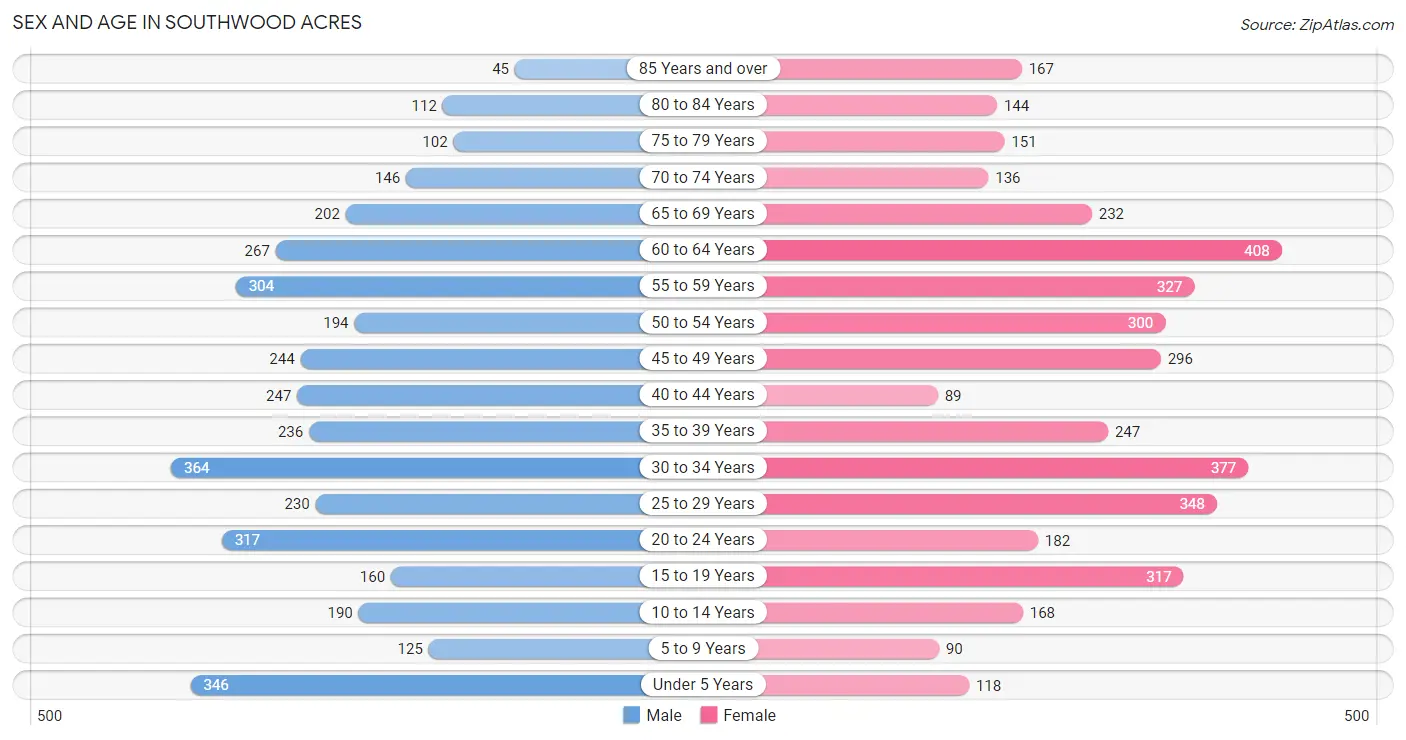
| Age Bracket | Male | Female |
| Under 5 Years | 346 (9.0%) | 118 (2.9%) |
| 5 to 9 Years | 125 (3.3%) | 90 (2.2%) |
| 10 to 14 Years | 190 (5.0%) | 168 (4.1%) |
| 15 to 19 Years | 160 (4.2%) | 317 (7.7%) |
| 20 to 24 Years | 317 (8.3%) | 182 (4.4%) |
| 25 to 29 Years | 230 (6.0%) | 348 (8.5%) |
| 30 to 34 Years | 364 (9.5%) | 377 (9.2%) |
| 35 to 39 Years | 236 (6.2%) | 247 (6.0%) |
| 40 to 44 Years | 247 (6.5%) | 89 (2.2%) |
| 45 to 49 Years | 244 (6.4%) | 296 (7.2%) |
| 50 to 54 Years | 194 (5.1%) | 300 (7.3%) |
| 55 to 59 Years | 304 (7.9%) | 327 (8.0%) |
| 60 to 64 Years | 267 (7.0%) | 408 (10.0%) |
| 65 to 69 Years | 202 (5.3%) | 232 (5.7%) |
| 70 to 74 Years | 146 (3.8%) | 136 (3.3%) |
| 75 to 79 Years | 102 (2.7%) | 151 (3.7%) |
| 80 to 84 Years | 112 (2.9%) | 144 (3.5%) |
| 85 Years and over | 45 (1.2%) | 167 (4.1%) |
| Total | 3,831 (100.0%) | 4,097 (100.0%) |
Families and Households in Southwood Acres
Median Family Size in Southwood Acres
The median family size in Southwood Acres is 2.83 persons per family, with single female/mother families (325 | 14.7%) accounting for the largest median family size of 2.86 persons per family. On the other hand, single male/father families (99 | 4.5%) represent the smallest median family size with 2.54 persons per family.
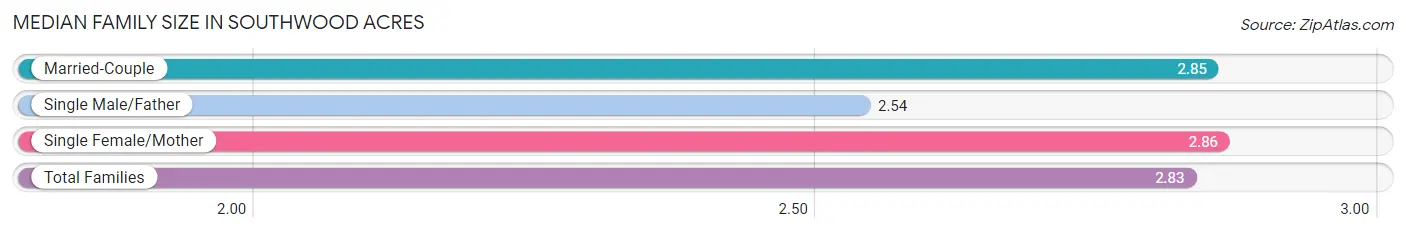
| Family Type | # Families | Family Size |
| Married-Couple | 1,781 (80.8%) | 2.85 |
| Single Male/Father | 99 (4.5%) | 2.54 |
| Single Female/Mother | 325 (14.7%) | 2.86 |
| Total Families | 2,205 (100.0%) | 2.83 |
Median Household Size in Southwood Acres
The median household size in Southwood Acres is 2.38 persons per household, with single female/mother households (325 | 9.8%) accounting for the largest median household size of 3.14 persons per household. non-family households (1,127 | 33.8%) represent the smallest median household size with 1.38 persons per household.
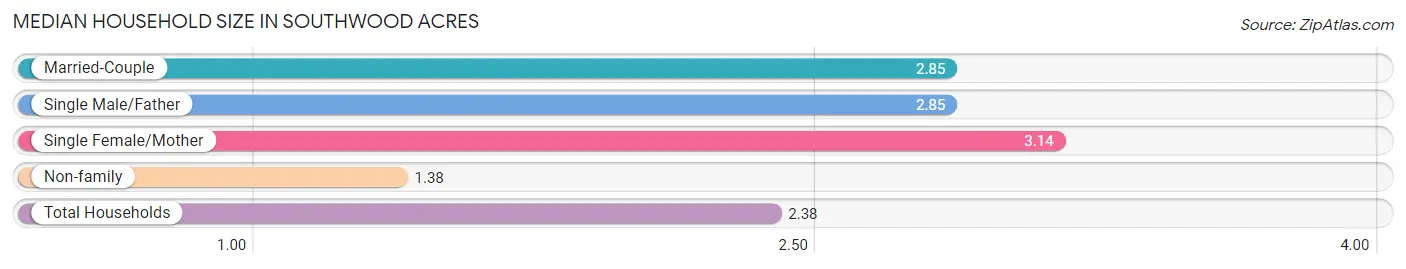
| Household Type | # Households | Household Size |
| Married-Couple | 1,781 (53.4%) | 2.85 |
| Single Male/Father | 99 (3.0%) | 2.85 |
| Single Female/Mother | 325 (9.8%) | 3.14 |
| Non-family | 1,127 (33.8%) | 1.38 |
| Total Households | 3,332 (100.0%) | 2.38 |
Household Size by Marriage Status in Southwood Acres
Out of a total of 3,332 households in Southwood Acres, 2,205 (66.2%) are family households, while 1,127 (33.8%) are nonfamily households. The most numerous type of family households are 2-person households, comprising 1,173, and the most common type of nonfamily households are 1-person households, comprising 765.
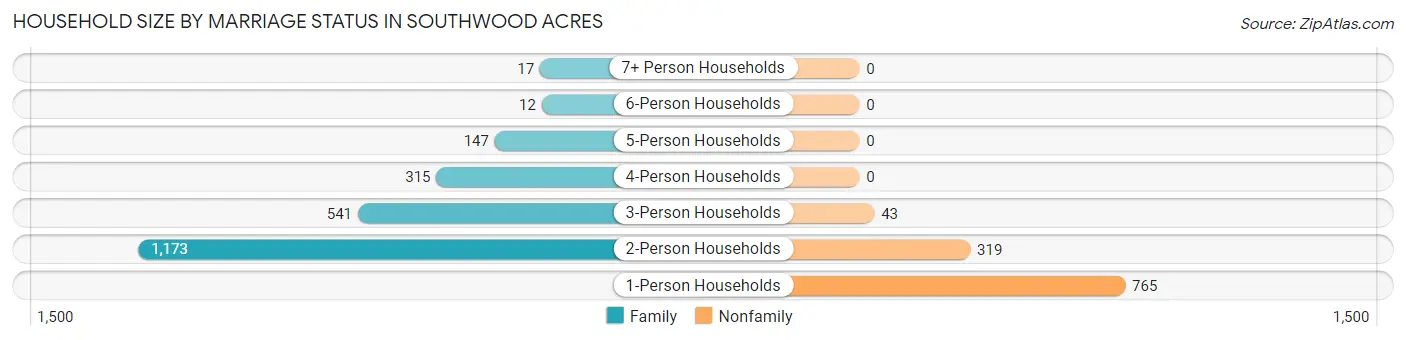
| Household Size | Family Households | Nonfamily Households |
| 1-Person Households | - | 765 (23.0%) |
| 2-Person Households | 1,173 (35.2%) | 319 (9.6%) |
| 3-Person Households | 541 (16.2%) | 43 (1.3%) |
| 4-Person Households | 315 (9.5%) | 0 (0.0%) |
| 5-Person Households | 147 (4.4%) | 0 (0.0%) |
| 6-Person Households | 12 (0.4%) | 0 (0.0%) |
| 7+ Person Households | 17 (0.5%) | 0 (0.0%) |
| Total | 2,205 (66.2%) | 1,127 (33.8%) |
Female Fertility in Southwood Acres
Fertility by Age in Southwood Acres
Average fertility rate in Southwood Acres is 67.0 births per 1,000 women. Women in the age bracket of 20 to 34 years have the highest fertility rate with 101.0 births per 1,000 women. Women in the age bracket of 20 to 34 years acount for 70.8% of all women with births.
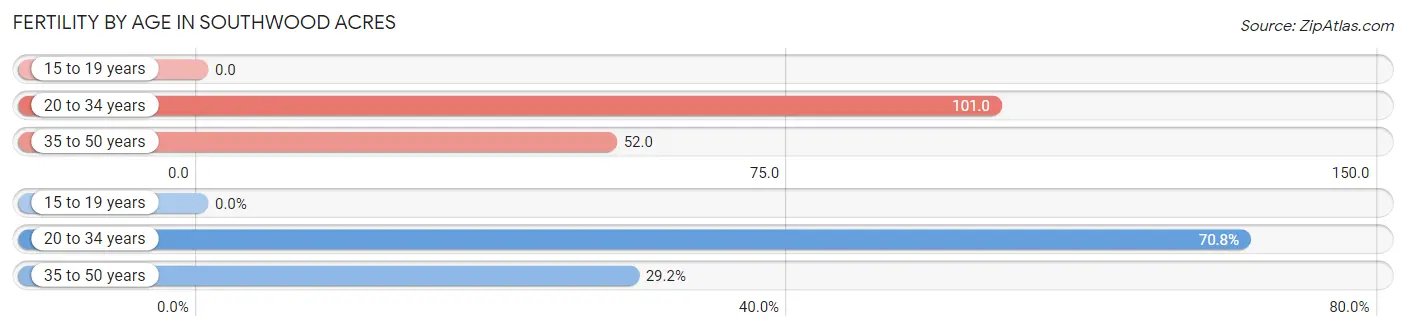
| Age Bracket | Women with Births | Births / 1,000 Women |
| 15 to 19 years | 0 (0.0%) | 0.0 |
| 20 to 34 years | 92 (70.8%) | 101.0 |
| 35 to 50 years | 38 (29.2%) | 52.0 |
| Total | 130 (100.0%) | 67.0 |
Fertility by Age by Marriage Status in Southwood Acres
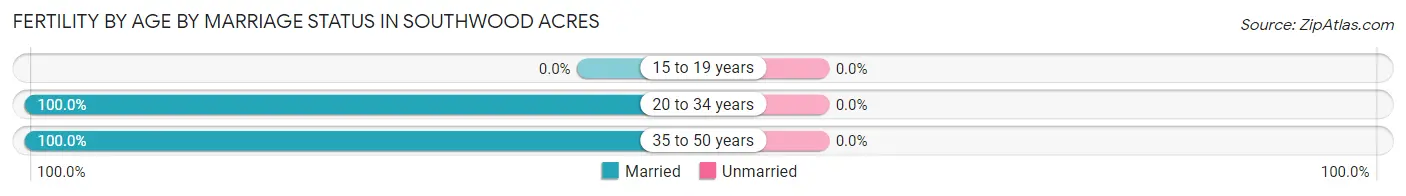
| Age Bracket | Married | Unmarried |
| 15 to 19 years | 0 (0.0%) | 0 (0.0%) |
| 20 to 34 years | 92 (100.0%) | 0 (0.0%) |
| 35 to 50 years | 38 (100.0%) | 0 (0.0%) |
| Total | 130 (100.0%) | 0 (0.0%) |
Fertility by Education in Southwood Acres
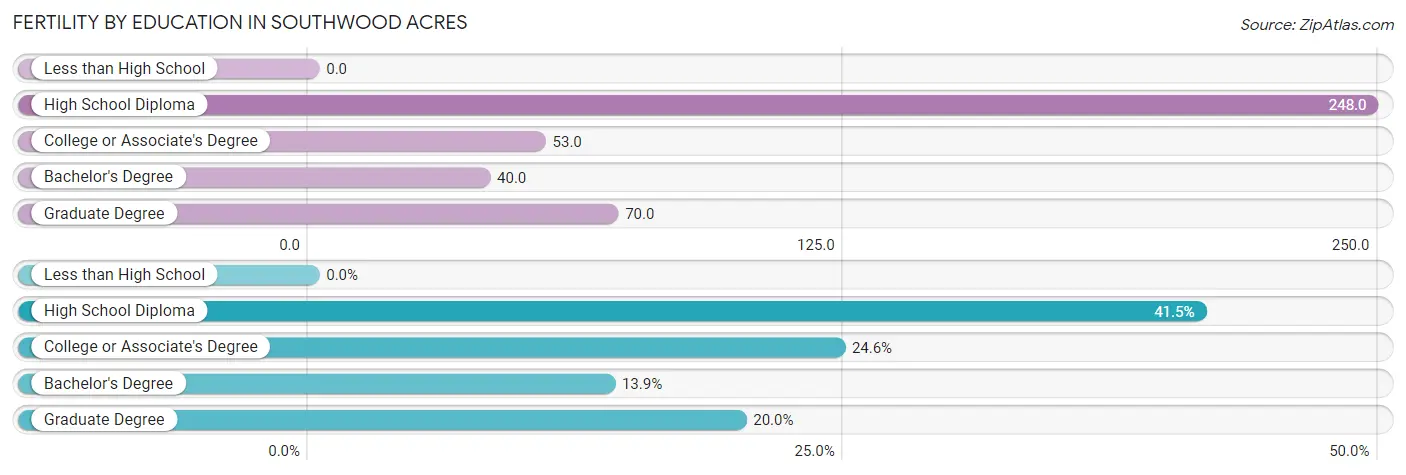
| Educational Attainment | Women with Births | Births / 1,000 Women |
| Less than High School | 0 (0.0%) | 0.0 |
| High School Diploma | 54 (41.5%) | 248.0 |
| College or Associate's Degree | 32 (24.6%) | 53.0 |
| Bachelor's Degree | 18 (13.9%) | 40.0 |
| Graduate Degree | 26 (20.0%) | 70.0 |
| Total | 130 (100.0%) | 67.0 |
Fertility by Education by Marriage Status in Southwood Acres
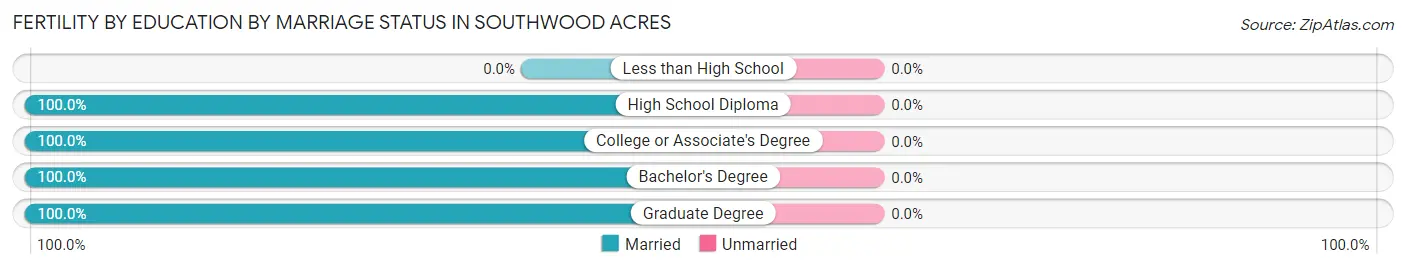
| Educational Attainment | Married | Unmarried |
| Less than High School | 0 (0.0%) | 0 (0.0%) |
| High School Diploma | 54 (100.0%) | 0 (0.0%) |
| College or Associate's Degree | 32 (100.0%) | 0 (0.0%) |
| Bachelor's Degree | 18 (100.0%) | 0 (0.0%) |
| Graduate Degree | 26 (100.0%) | 0 (0.0%) |
| Total | 130 (100.0%) | 0 (0.0%) |
Employment Characteristics in Southwood Acres
Employment by Class of Employer in Southwood Acres
Among the 4,365 employed individuals in Southwood Acres, private company employees (2,989 | 68.5%), not-for-profit organizations (459 | 10.5%), and local government employees (379 | 8.7%) make up the most common classes of employment.
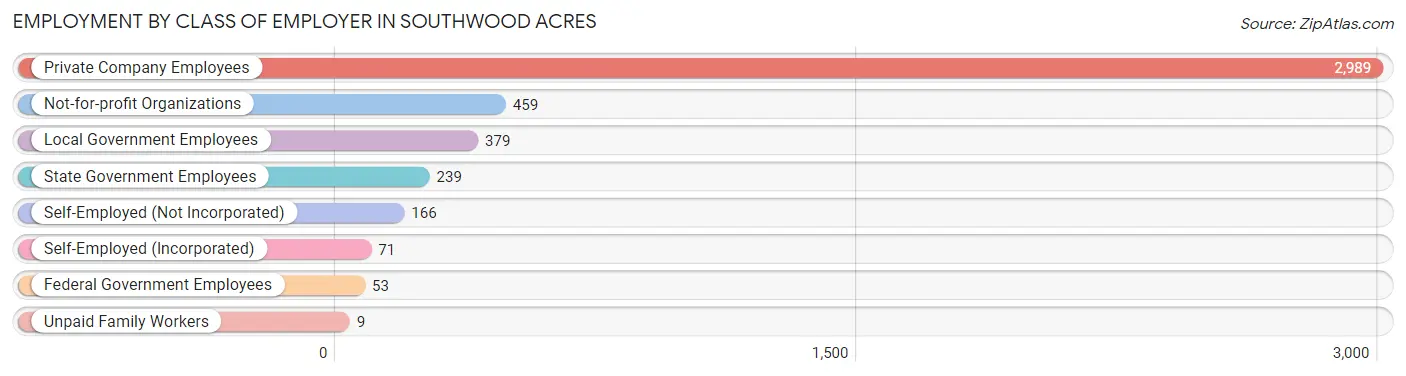
| Employer Class | # Employees | % Employees |
| Private Company Employees | 2,989 | 68.5% |
| Self-Employed (Incorporated) | 71 | 1.6% |
| Self-Employed (Not Incorporated) | 166 | 3.8% |
| Not-for-profit Organizations | 459 | 10.5% |
| Local Government Employees | 379 | 8.7% |
| State Government Employees | 239 | 5.5% |
| Federal Government Employees | 53 | 1.2% |
| Unpaid Family Workers | 9 | 0.2% |
| Total | 4,365 | 100.0% |
Employment Status by Age in Southwood Acres
According to the labor force statistics for Southwood Acres, out of the total population over 16 years of age (6,771), 70.7% or 4,787 individuals are in the labor force, with 3.1% or 148 of them unemployed. The age group with the highest labor force participation rate is 30 to 34 years, with 98.4% or 729 individuals in the labor force. Within the labor force, the 60 to 64 years age range has the highest percentage of unemployed individuals, with 6.4% or 34 of them being unemployed.
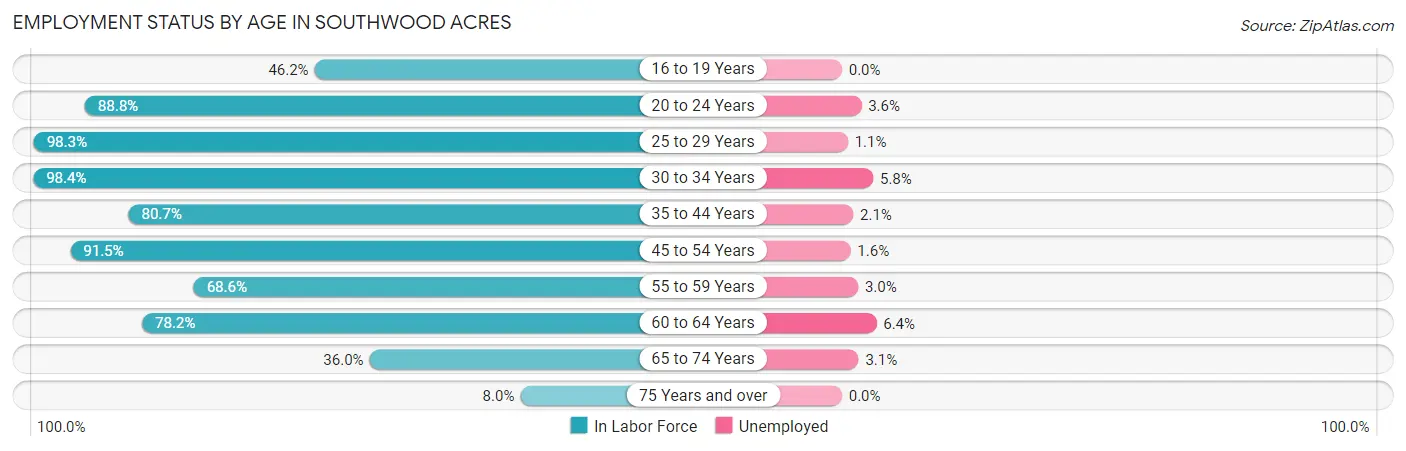
| Age Bracket | In Labor Force | Unemployed |
| 16 to 19 Years | 165 (46.2%) | 0 (0.0%) |
| 20 to 24 Years | 443 (88.8%) | 16 (3.6%) |
| 25 to 29 Years | 568 (98.3%) | 6 (1.1%) |
| 30 to 34 Years | 729 (98.4%) | 42 (5.8%) |
| 35 to 44 Years | 661 (80.7%) | 14 (2.1%) |
| 45 to 54 Years | 946 (91.5%) | 15 (1.6%) |
| 55 to 59 Years | 433 (68.6%) | 13 (3.0%) |
| 60 to 64 Years | 528 (78.2%) | 34 (6.4%) |
| 65 to 74 Years | 258 (36.0%) | 8 (3.1%) |
| 75 Years and over | 58 (8.0%) | 0 (0.0%) |
| Total | 4,787 (70.7%) | 148 (3.1%) |
Employment Status by Educational Attainment in Southwood Acres
According to labor force statistics for Southwood Acres, 86.3% of individuals (3,865) out of the total population between 25 and 64 years of age (4,478) are in the labor force, with 3.2% or 124 of them being unemployed. The group with the highest labor force participation rate are those with the educational attainment of college / associate degree, with 92.3% or 1,242 individuals in the labor force. Within the labor force, individuals with college / associate degree education have the highest percentage of unemployment, with 6.3% or 78 of them being unemployed.
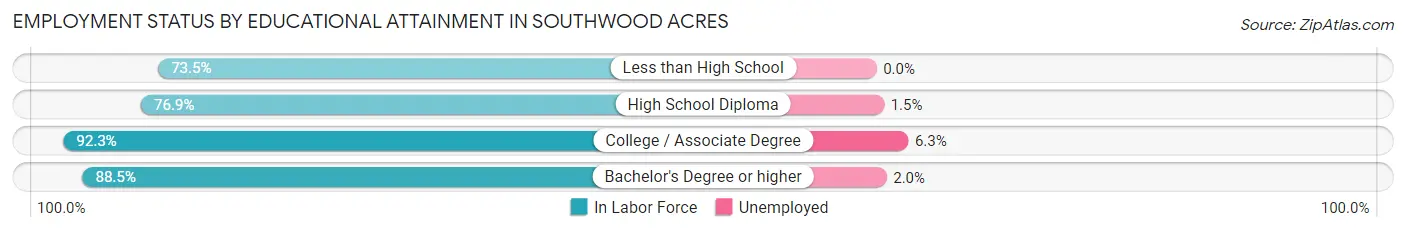
| Educational Attainment | In Labor Force | Unemployed |
| Less than High School | 86 (73.5%) | 0 (0.0%) |
| High School Diploma | 879 (76.9%) | 17 (1.5%) |
| College / Associate Degree | 1,242 (92.3%) | 85 (6.3%) |
| Bachelor's Degree or higher | 1,657 (88.5%) | 37 (2.0%) |
| Total | 3,865 (86.3%) | 143 (3.2%) |
Employment Occupations by Sex in Southwood Acres
Management, Business, Science and Arts Occupations
The most common Management, Business, Science and Arts occupations in Southwood Acres are Community & Social Service (593 | 12.8%), Computers, Engineering & Science (457 | 9.9%), Business & Financial (426 | 9.2%), Education Instruction & Library (345 | 7.4%), and Health Diagnosing & Treating (285 | 6.2%).
Management, Business, Science and Arts Occupations by Sex
Within the Management, Business, Science and Arts occupations in Southwood Acres, the most male-oriented occupations are Arts, Media & Entertainment (86.8%), Architecture & Engineering (82.4%), and Computers & Mathematics (72.7%), while the most female-oriented occupations are Legal Services & Support (100.0%), Health Technologists (100.0%), and Health Diagnosing & Treating (93.7%).
| Occupation | Male | Female |
| Management | 111 (43.7%) | 143 (56.3%) |
| Business & Financial | 127 (29.8%) | 299 (70.2%) |
| Computers, Engineering & Science | 330 (72.2%) | 127 (27.8%) |
| Computers & Mathematics | 157 (72.7%) | 59 (27.3%) |
| Architecture & Engineering | 169 (82.4%) | 36 (17.6%) |
| Life, Physical & Social Science | 4 (11.1%) | 32 (88.9%) |
| Community & Social Service | 211 (35.6%) | 382 (64.4%) |
| Education, Arts & Media | 46 (32.6%) | 95 (67.4%) |
| Legal Services & Support | 0 (0.0%) | 31 (100.0%) |
| Education Instruction & Library | 99 (28.7%) | 246 (71.3%) |
| Arts, Media & Entertainment | 66 (86.8%) | 10 (13.2%) |
| Health Diagnosing & Treating | 18 (6.3%) | 267 (93.7%) |
| Health Technologists | 0 (0.0%) | 191 (100.0%) |
| Total (Category) | 797 (39.6%) | 1,218 (60.5%) |
| Total (Overall) | 2,253 (48.7%) | 2,377 (51.3%) |
Services Occupations
The most common Services occupations in Southwood Acres are Security & Protection (140 | 3.0%), Food Preparation & Serving (133 | 2.9%), Healthcare Support (129 | 2.8%), Cleaning & Maintenance (102 | 2.2%), and Law Enforcement (79 | 1.7%).
Services Occupations by Sex
Within the Services occupations in Southwood Acres, the most male-oriented occupations are Law Enforcement (86.1%), Cleaning & Maintenance (73.5%), and Security & Protection (62.1%), while the most female-oriented occupations are Healthcare Support (100.0%), Personal Care & Service (74.1%), and Firefighting & Prevention (68.9%).
| Occupation | Male | Female |
| Healthcare Support | 0 (0.0%) | 129 (100.0%) |
| Security & Protection | 87 (62.1%) | 53 (37.9%) |
| Firefighting & Prevention | 19 (31.1%) | 42 (68.9%) |
| Law Enforcement | 68 (86.1%) | 11 (13.9%) |
| Food Preparation & Serving | 46 (34.6%) | 87 (65.4%) |
| Cleaning & Maintenance | 75 (73.5%) | 27 (26.5%) |
| Personal Care & Service | 15 (25.9%) | 43 (74.1%) |
| Total (Category) | 223 (39.7%) | 339 (60.3%) |
| Total (Overall) | 2,253 (48.7%) | 2,377 (51.3%) |
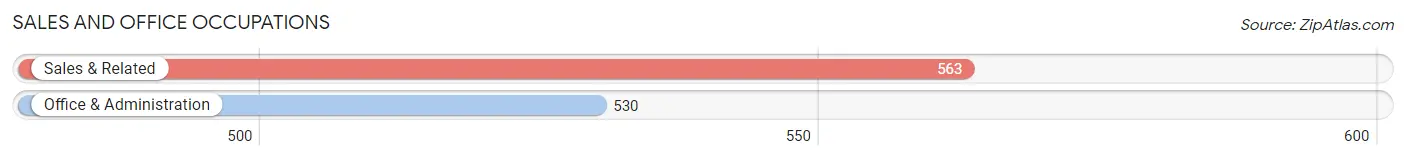
Sales and Office Occupations
The most common Sales and Office occupations in Southwood Acres are Sales & Related (563 | 12.2%), and Office & Administration (530 | 11.5%).
Sales and Office Occupations by Sex
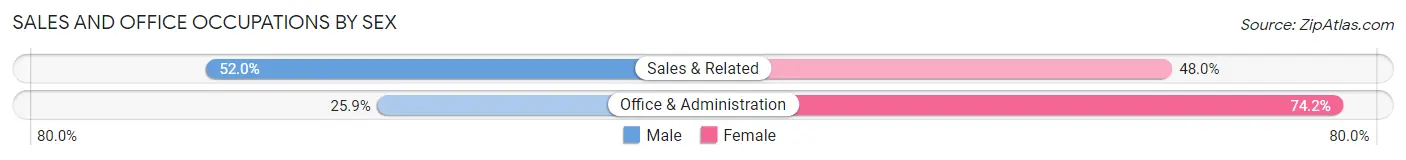
| Occupation | Male | Female |
| Sales & Related | 293 (52.0%) | 270 (48.0%) |
| Office & Administration | 137 (25.9%) | 393 (74.2%) |
| Total (Category) | 430 (39.3%) | 663 (60.7%) |
| Total (Overall) | 2,253 (48.7%) | 2,377 (51.3%) |
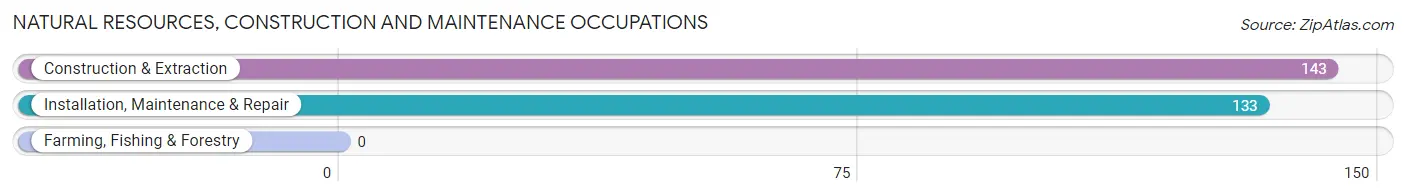
Natural Resources, Construction and Maintenance Occupations
The most common Natural Resources, Construction and Maintenance occupations in Southwood Acres are Construction & Extraction (143 | 3.1%), and Installation, Maintenance & Repair (133 | 2.9%).
Natural Resources, Construction and Maintenance Occupations by Sex
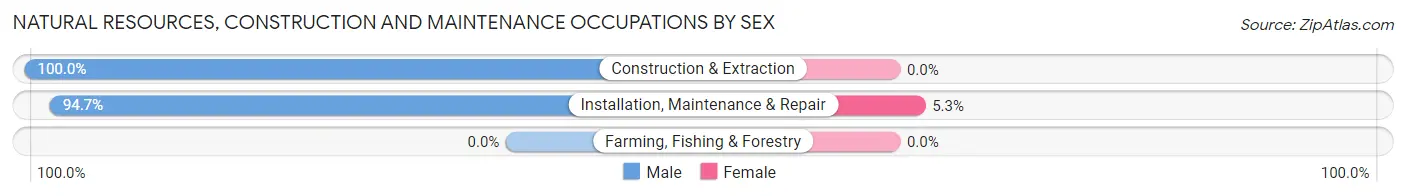
| Occupation | Male | Female |
| Farming, Fishing & Forestry | 0 (0.0%) | 0 (0.0%) |
| Construction & Extraction | 143 (100.0%) | 0 (0.0%) |
| Installation, Maintenance & Repair | 126 (94.7%) | 7 (5.3%) |
| Total (Category) | 269 (97.5%) | 7 (2.5%) |
| Total (Overall) | 2,253 (48.7%) | 2,377 (51.3%) |
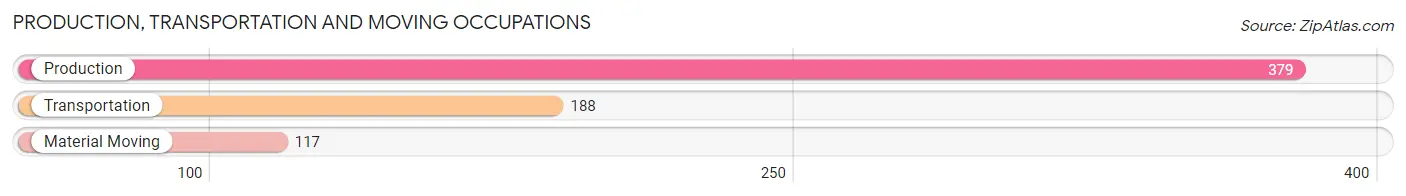
Production, Transportation and Moving Occupations
The most common Production, Transportation and Moving occupations in Southwood Acres are Production (379 | 8.2%), Transportation (188 | 4.1%), and Material Moving (117 | 2.5%).
Production, Transportation and Moving Occupations by Sex
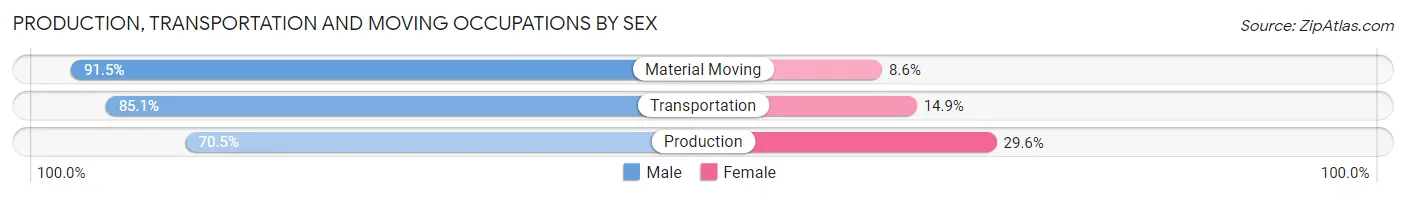
| Occupation | Male | Female |
| Production | 267 (70.5%) | 112 (29.5%) |
| Transportation | 160 (85.1%) | 28 (14.9%) |
| Material Moving | 107 (91.4%) | 10 (8.6%) |
| Total (Category) | 534 (78.1%) | 150 (21.9%) |
| Total (Overall) | 2,253 (48.7%) | 2,377 (51.3%) |
Employment Industries by Sex in Southwood Acres
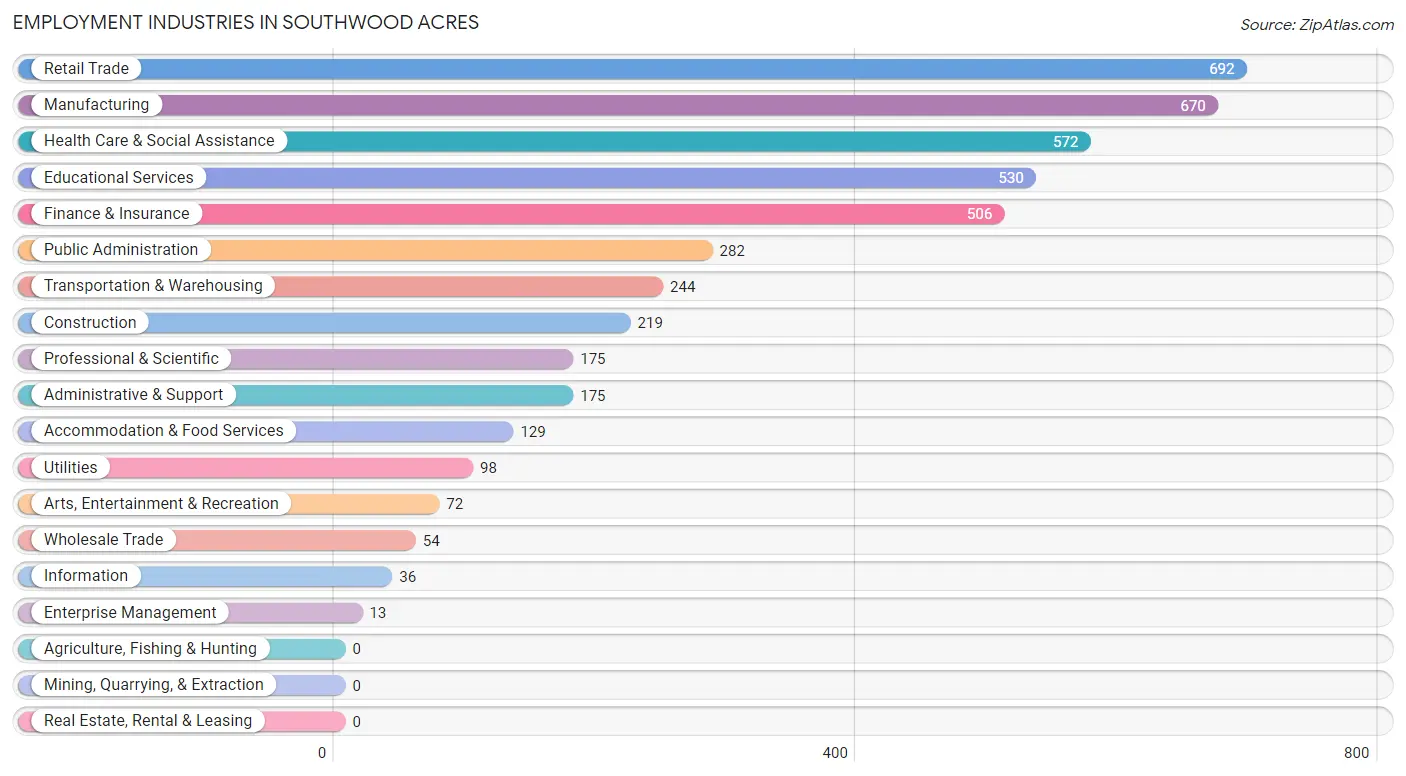
Employment Industries in Southwood Acres
The major employment industries in Southwood Acres include Retail Trade (692 | 14.9%), Manufacturing (670 | 14.5%), Health Care & Social Assistance (572 | 12.3%), Educational Services (530 | 11.5%), and Finance & Insurance (506 | 10.9%).
Employment Industries by Sex in Southwood Acres
The Southwood Acres industries that see more men than women are Wholesale Trade (100.0%), Construction (98.2%), and Utilities (79.6%), whereas the industries that tend to have a higher number of women are Enterprise Management (100.0%), Health Care & Social Assistance (89.5%), and Accommodation & Food Services (73.6%).
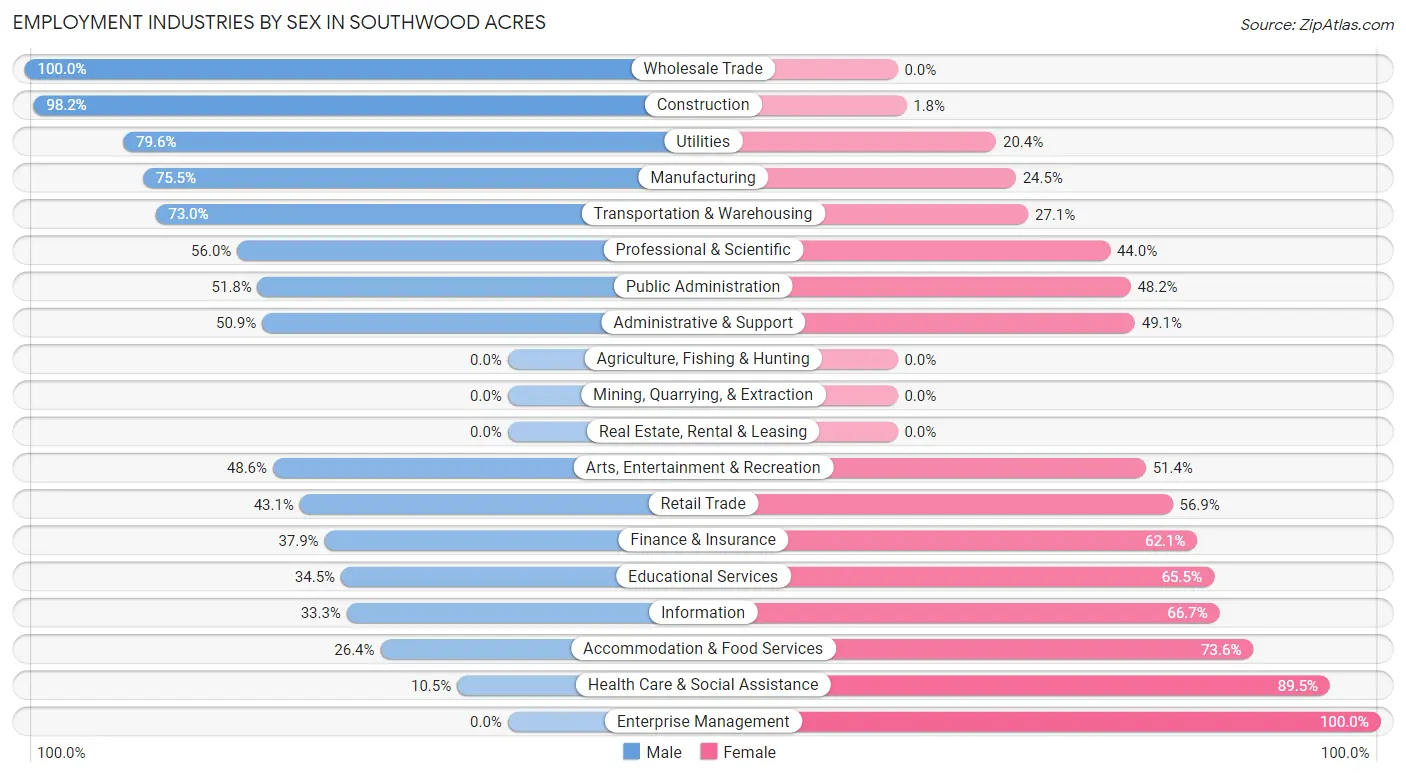
| Industry | Male | Female |
| Agriculture, Fishing & Hunting | 0 (0.0%) | 0 (0.0%) |
| Mining, Quarrying, & Extraction | 0 (0.0%) | 0 (0.0%) |
| Construction | 215 (98.2%) | 4 (1.8%) |
| Manufacturing | 506 (75.5%) | 164 (24.5%) |
| Wholesale Trade | 54 (100.0%) | 0 (0.0%) |
| Retail Trade | 298 (43.1%) | 394 (56.9%) |
| Transportation & Warehousing | 178 (73.0%) | 66 (27.1%) |
| Utilities | 78 (79.6%) | 20 (20.4%) |
| Information | 12 (33.3%) | 24 (66.7%) |
| Finance & Insurance | 192 (37.9%) | 314 (62.1%) |
| Real Estate, Rental & Leasing | 0 (0.0%) | 0 (0.0%) |
| Professional & Scientific | 98 (56.0%) | 77 (44.0%) |
| Enterprise Management | 0 (0.0%) | 13 (100.0%) |
| Administrative & Support | 89 (50.9%) | 86 (49.1%) |
| Educational Services | 183 (34.5%) | 347 (65.5%) |
| Health Care & Social Assistance | 60 (10.5%) | 512 (89.5%) |
| Arts, Entertainment & Recreation | 35 (48.6%) | 37 (51.4%) |
| Accommodation & Food Services | 34 (26.4%) | 95 (73.6%) |
| Public Administration | 146 (51.8%) | 136 (48.2%) |
| Total | 2,253 (48.7%) | 2,377 (51.3%) |
Education in Southwood Acres
School Enrollment in Southwood Acres
The most common levels of schooling among the 1,576 students in Southwood Acres are high school (547 | 34.7%), college / undergraduate (314 | 19.9%), and middle school (233 | 14.8%).
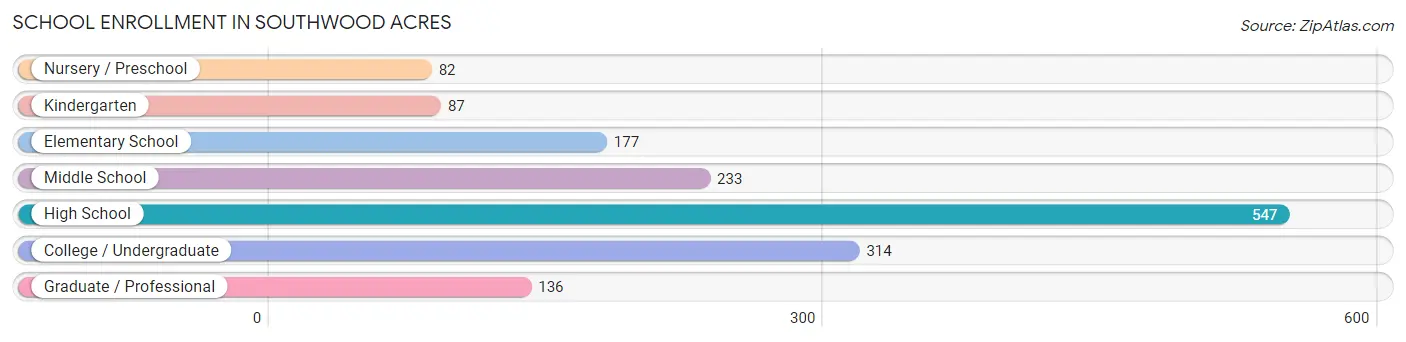
| School Level | # Students | % Students |
| Nursery / Preschool | 82 | 5.2% |
| Kindergarten | 87 | 5.5% |
| Elementary School | 177 | 11.2% |
| Middle School | 233 | 14.8% |
| High School | 547 | 34.7% |
| College / Undergraduate | 314 | 19.9% |
| Graduate / Professional | 136 | 8.6% |
| Total | 1,576 | 100.0% |
School Enrollment by Age by Funding Source in Southwood Acres
Out of a total of 1,576 students who are enrolled in schools in Southwood Acres, 333 (21.1%) attend a private institution, while the remaining 1,243 (78.9%) are enrolled in public schools. The age group of 20 to 24 year olds has the highest likelihood of being enrolled in private schools, with 103 (76.9% in the age bracket) enrolled. Conversely, the age group of 10 to 14 year olds has the lowest likelihood of being enrolled in a private school, with 341 (100.0% in the age bracket) attending a public institution.
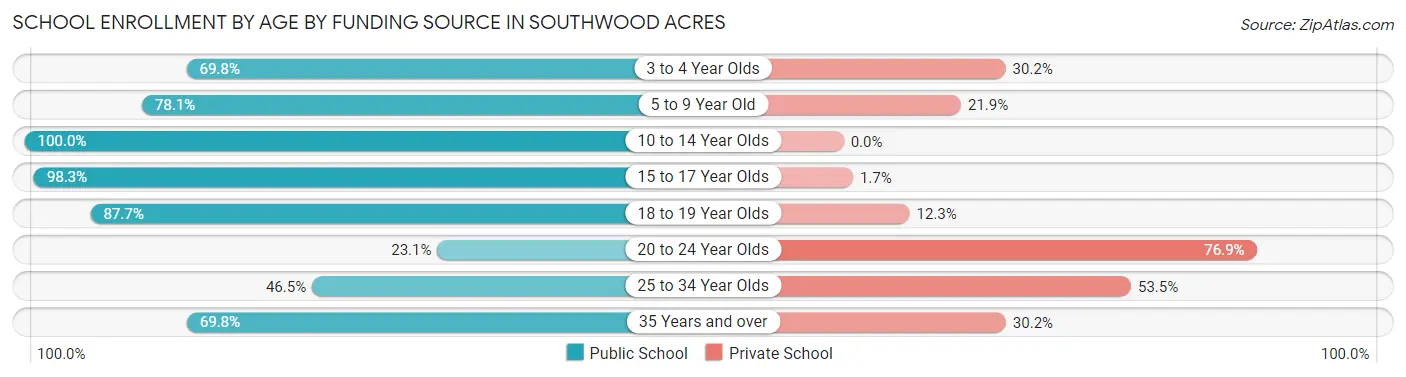
| Age Bracket | Public School | Private School |
| 3 to 4 Year Olds | 81 (69.8%) | 35 (30.2%) |
| 5 to 9 Year Old | 168 (78.1%) | 47 (21.9%) |
| 10 to 14 Year Olds | 341 (100.0%) | 0 (0.0%) |
| 15 to 17 Year Olds | 397 (98.3%) | 7 (1.7%) |
| 18 to 19 Year Olds | 50 (87.7%) | 7 (12.3%) |
| 20 to 24 Year Olds | 31 (23.1%) | 103 (76.9%) |
| 25 to 34 Year Olds | 79 (46.5%) | 91 (53.5%) |
| 35 Years and over | 97 (69.8%) | 42 (30.2%) |
| Total | 1,243 (78.9%) | 333 (21.1%) |
Educational Attainment by Field of Study in Southwood Acres
Business (382 | 15.0%), education (331 | 13.0%), science & technology (274 | 10.7%), psychology (250 | 9.8%), and engineering (245 | 9.6%) are the most common fields of study among 2,549 individuals in Southwood Acres who have obtained a bachelor's degree or higher.
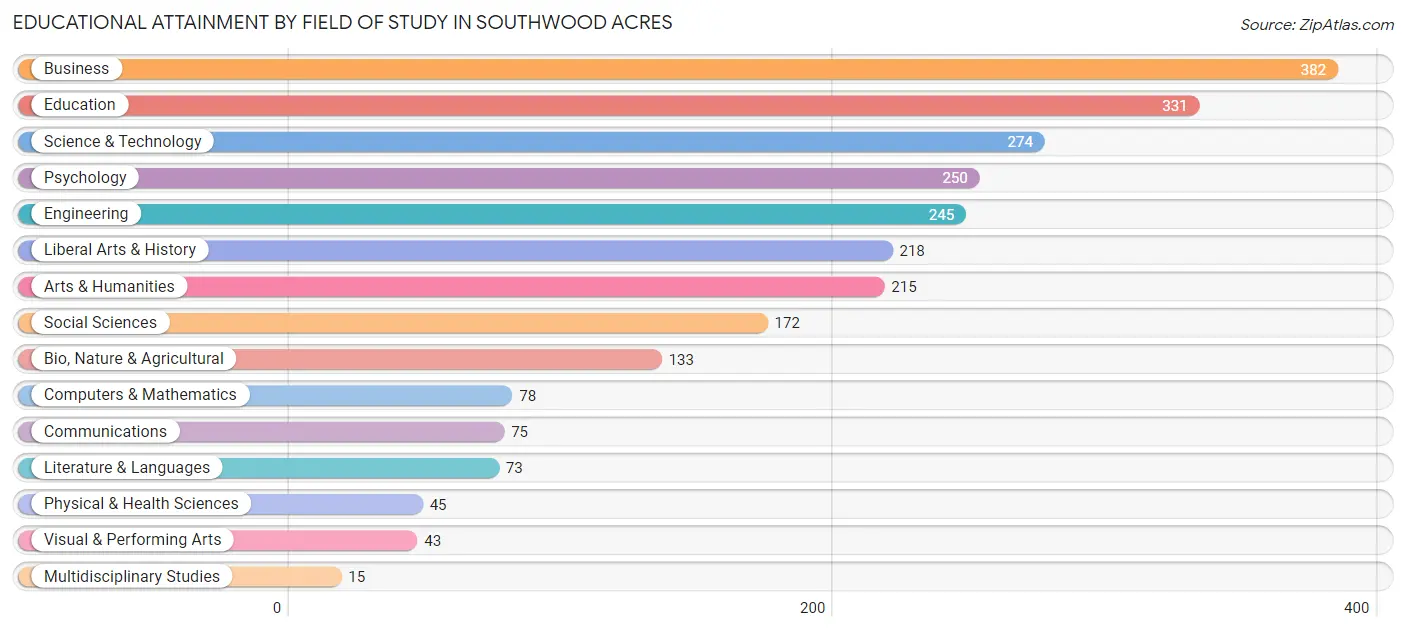
| Field of Study | # Graduates | % Graduates |
| Computers & Mathematics | 78 | 3.1% |
| Bio, Nature & Agricultural | 133 | 5.2% |
| Physical & Health Sciences | 45 | 1.8% |
| Psychology | 250 | 9.8% |
| Social Sciences | 172 | 6.8% |
| Engineering | 245 | 9.6% |
| Multidisciplinary Studies | 15 | 0.6% |
| Science & Technology | 274 | 10.7% |
| Business | 382 | 15.0% |
| Education | 331 | 13.0% |
| Literature & Languages | 73 | 2.9% |
| Liberal Arts & History | 218 | 8.6% |
| Visual & Performing Arts | 43 | 1.7% |
| Communications | 75 | 2.9% |
| Arts & Humanities | 215 | 8.4% |
| Total | 2,549 | 100.0% |
Transportation & Commute in Southwood Acres
Vehicle Availability by Sex in Southwood Acres
The most prevalent vehicle ownership categories in Southwood Acres are males with 2 vehicles (1,109, accounting for 51.1%) and females with 2 vehicles (1,099, making up 50.6%).
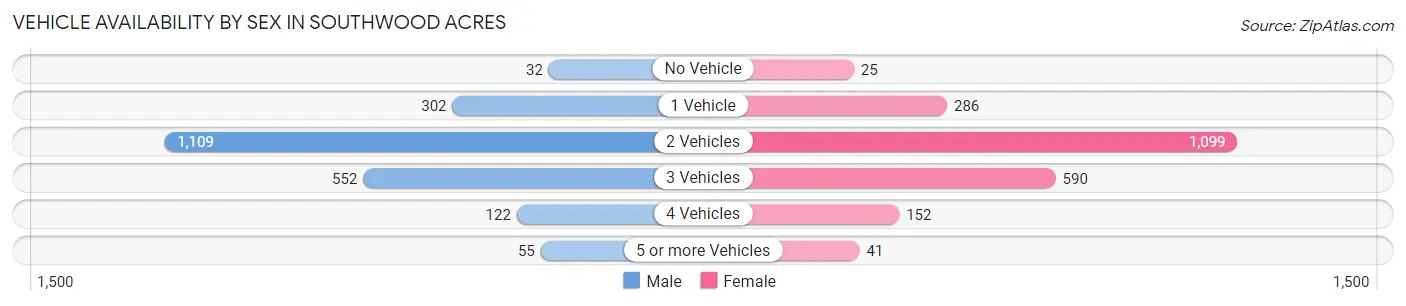
| Vehicles Available | Male | Female |
| No Vehicle | 32 (1.5%) | 25 (1.1%) |
| 1 Vehicle | 302 (13.9%) | 286 (13.0%) |
| 2 Vehicles | 1,109 (51.1%) | 1,099 (50.1%) |
| 3 Vehicles | 552 (25.4%) | 590 (26.9%) |
| 4 Vehicles | 122 (5.6%) | 152 (6.9%) |
| 5 or more Vehicles | 55 (2.5%) | 41 (1.9%) |
| Total | 2,172 (100.0%) | 2,193 (100.0%) |
Commute Time in Southwood Acres
The most frequently occuring commute durations in Southwood Acres are 10 to 14 minutes (686 commuters, 18.5%), 30 to 34 minutes (611 commuters, 16.5%), and 20 to 24 minutes (585 commuters, 15.8%).
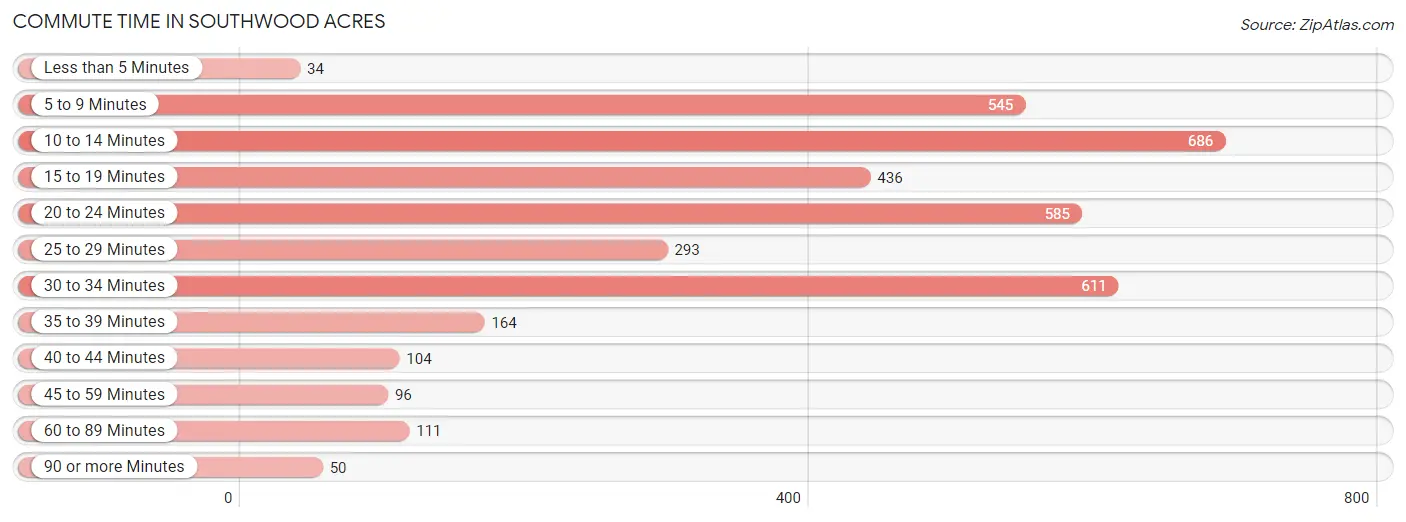
| Commute Time | # Commuters | % Commuters |
| Less than 5 Minutes | 34 | 0.9% |
| 5 to 9 Minutes | 545 | 14.7% |
| 10 to 14 Minutes | 686 | 18.5% |
| 15 to 19 Minutes | 436 | 11.7% |
| 20 to 24 Minutes | 585 | 15.8% |
| 25 to 29 Minutes | 293 | 7.9% |
| 30 to 34 Minutes | 611 | 16.5% |
| 35 to 39 Minutes | 164 | 4.4% |
| 40 to 44 Minutes | 104 | 2.8% |
| 45 to 59 Minutes | 96 | 2.6% |
| 60 to 89 Minutes | 111 | 3.0% |
| 90 or more Minutes | 50 | 1.3% |
Commute Time by Sex in Southwood Acres
The most common commute times in Southwood Acres are 20 to 24 minutes (294 commuters, 15.8%) for males and 10 to 14 minutes (419 commuters, 22.5%) for females.
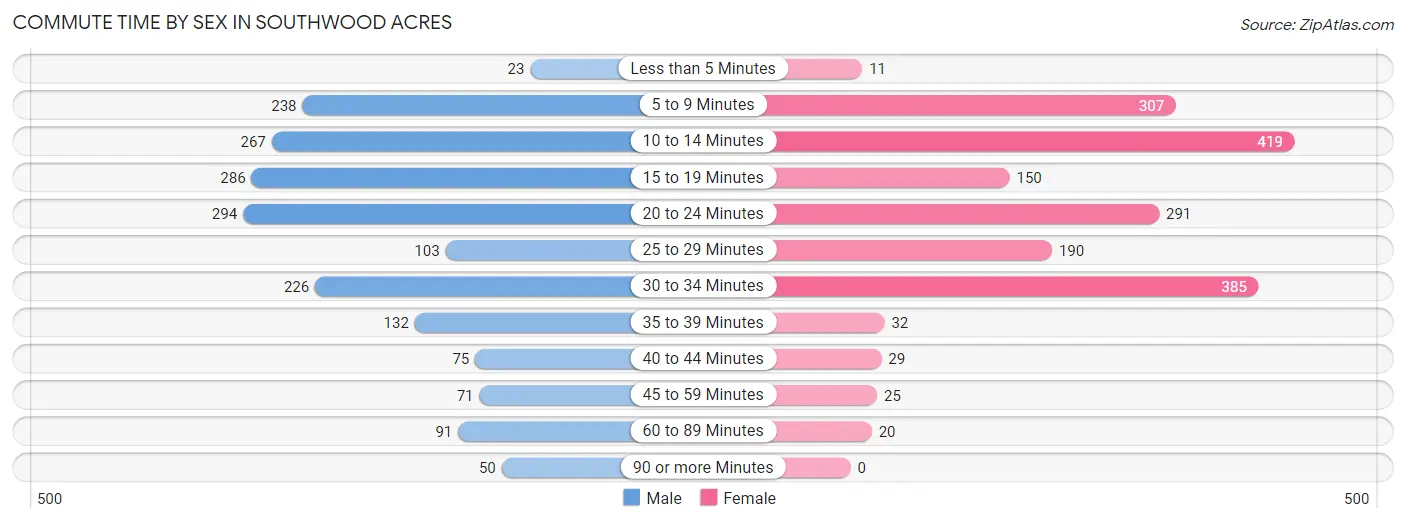
| Commute Time | Male | Female |
| Less than 5 Minutes | 23 (1.2%) | 11 (0.6%) |
| 5 to 9 Minutes | 238 (12.8%) | 307 (16.5%) |
| 10 to 14 Minutes | 267 (14.4%) | 419 (22.5%) |
| 15 to 19 Minutes | 286 (15.4%) | 150 (8.1%) |
| 20 to 24 Minutes | 294 (15.8%) | 291 (15.7%) |
| 25 to 29 Minutes | 103 (5.6%) | 190 (10.2%) |
| 30 to 34 Minutes | 226 (12.2%) | 385 (20.7%) |
| 35 to 39 Minutes | 132 (7.1%) | 32 (1.7%) |
| 40 to 44 Minutes | 75 (4.0%) | 29 (1.6%) |
| 45 to 59 Minutes | 71 (3.8%) | 25 (1.3%) |
| 60 to 89 Minutes | 91 (4.9%) | 20 (1.1%) |
| 90 or more Minutes | 50 (2.7%) | 0 (0.0%) |
Time of Departure to Work by Sex in Southwood Acres
The most frequent times of departure to work in Southwood Acres are 6:30 AM to 6:59 AM (311, 16.8%) for males and 7:30 AM to 7:59 AM (340, 18.3%) for females.
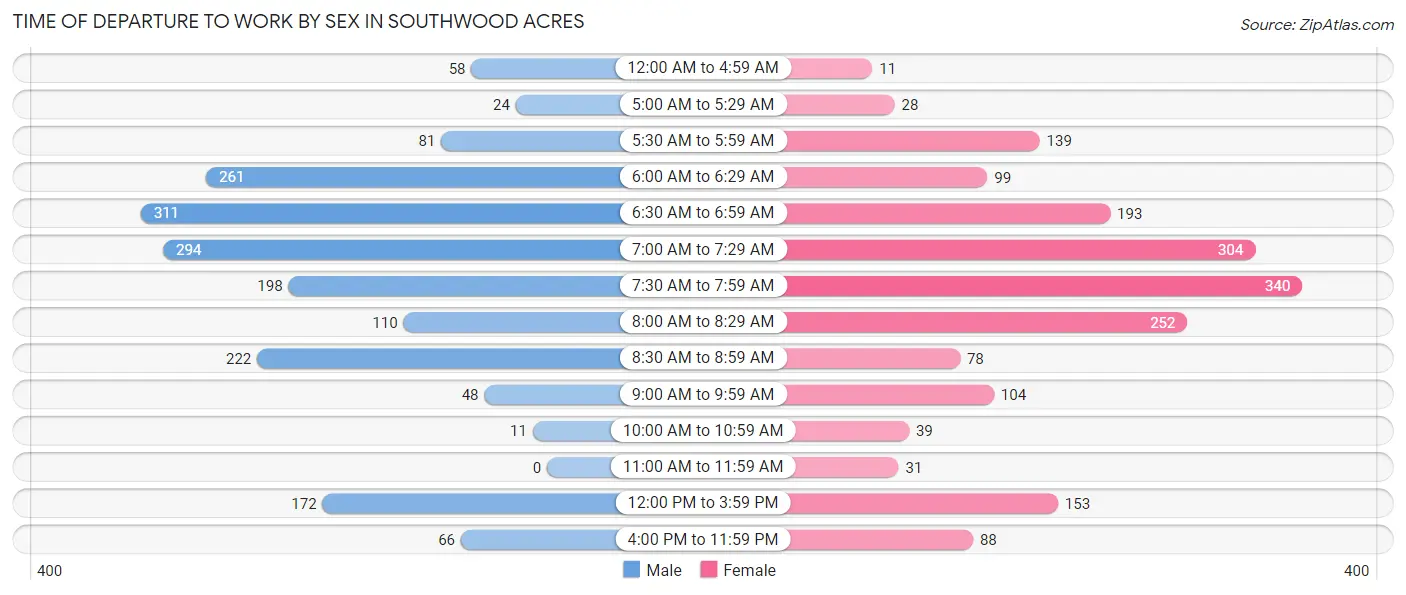
| Time of Departure | Male | Female |
| 12:00 AM to 4:59 AM | 58 (3.1%) | 11 (0.6%) |
| 5:00 AM to 5:29 AM | 24 (1.3%) | 28 (1.5%) |
| 5:30 AM to 5:59 AM | 81 (4.4%) | 139 (7.5%) |
| 6:00 AM to 6:29 AM | 261 (14.1%) | 99 (5.3%) |
| 6:30 AM to 6:59 AM | 311 (16.8%) | 193 (10.4%) |
| 7:00 AM to 7:29 AM | 294 (15.8%) | 304 (16.4%) |
| 7:30 AM to 7:59 AM | 198 (10.7%) | 340 (18.3%) |
| 8:00 AM to 8:29 AM | 110 (5.9%) | 252 (13.6%) |
| 8:30 AM to 8:59 AM | 222 (12.0%) | 78 (4.2%) |
| 9:00 AM to 9:59 AM | 48 (2.6%) | 104 (5.6%) |
| 10:00 AM to 10:59 AM | 11 (0.6%) | 39 (2.1%) |
| 11:00 AM to 11:59 AM | 0 (0.0%) | 31 (1.7%) |
| 12:00 PM to 3:59 PM | 172 (9.3%) | 153 (8.2%) |
| 4:00 PM to 11:59 PM | 66 (3.6%) | 88 (4.7%) |
| Total | 1,856 (100.0%) | 1,859 (100.0%) |
Housing Occupancy in Southwood Acres
Occupancy by Ownership in Southwood Acres
Of the total 3,332 dwellings in Southwood Acres, owner-occupied units account for 2,916 (87.5%), while renter-occupied units make up 416 (12.5%).
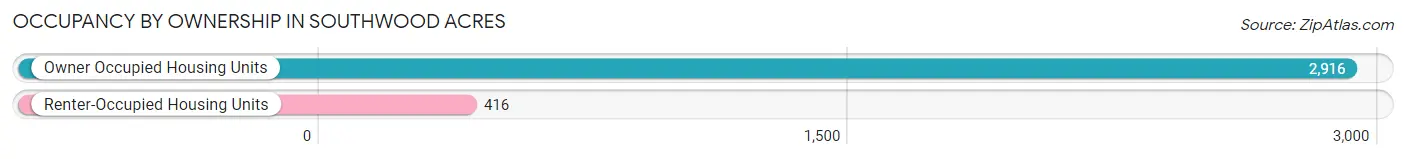
| Occupancy | # Housing Units | % Housing Units |
| Owner Occupied Housing Units | 2,916 | 87.5% |
| Renter-Occupied Housing Units | 416 | 12.5% |
| Total Occupied Housing Units | 3,332 | 100.0% |
Occupancy by Household Size in Southwood Acres
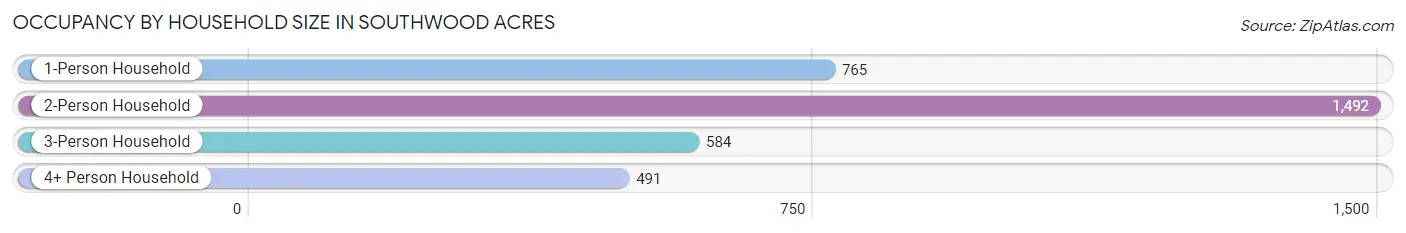
| Household Size | # Housing Units | % Housing Units |
| 1-Person Household | 765 | 23.0% |
| 2-Person Household | 1,492 | 44.8% |
| 3-Person Household | 584 | 17.5% |
| 4+ Person Household | 491 | 14.7% |
| Total Housing Units | 3,332 | 100.0% |
Occupancy by Ownership by Household Size in Southwood Acres
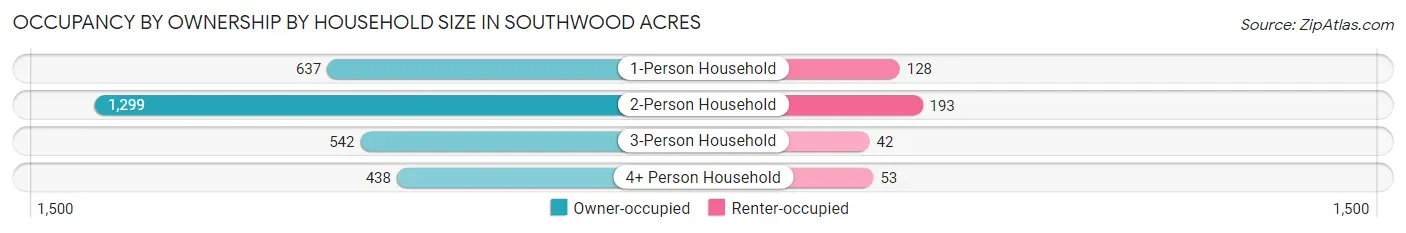
| Household Size | Owner-occupied | Renter-occupied |
| 1-Person Household | 637 (83.3%) | 128 (16.7%) |
| 2-Person Household | 1,299 (87.1%) | 193 (12.9%) |
| 3-Person Household | 542 (92.8%) | 42 (7.2%) |
| 4+ Person Household | 438 (89.2%) | 53 (10.8%) |
| Total Housing Units | 2,916 (87.5%) | 416 (12.5%) |
Occupancy by Educational Attainment in Southwood Acres
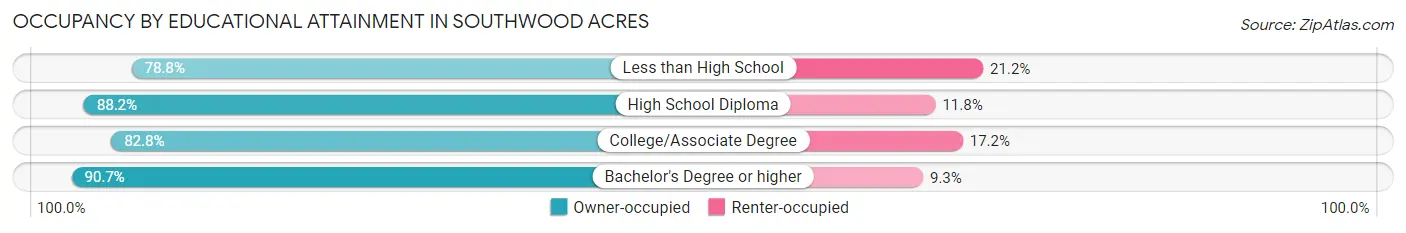
| Household Size | Owner-occupied | Renter-occupied |
| Less than High School | 52 (78.8%) | 14 (21.2%) |
| High School Diploma | 698 (88.2%) | 93 (11.8%) |
| College/Associate Degree | 829 (82.8%) | 172 (17.2%) |
| Bachelor's Degree or higher | 1,337 (90.7%) | 137 (9.3%) |
Occupancy by Age of Householder in Southwood Acres
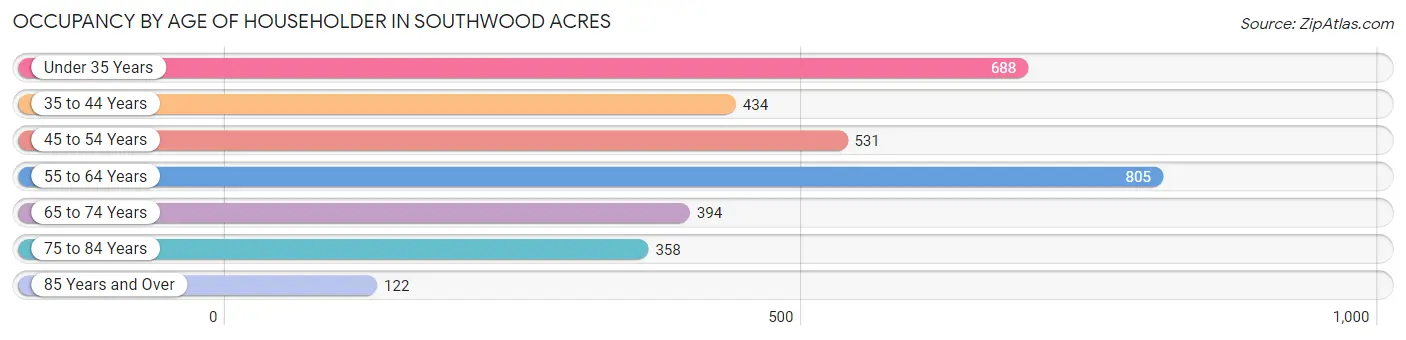
| Age Bracket | # Households | % Households |
| Under 35 Years | 688 | 20.6% |
| 35 to 44 Years | 434 | 13.0% |
| 45 to 54 Years | 531 | 15.9% |
| 55 to 64 Years | 805 | 24.2% |
| 65 to 74 Years | 394 | 11.8% |
| 75 to 84 Years | 358 | 10.7% |
| 85 Years and Over | 122 | 3.7% |
| Total | 3,332 | 100.0% |
Housing Finances in Southwood Acres
Median Income by Occupancy in Southwood Acres
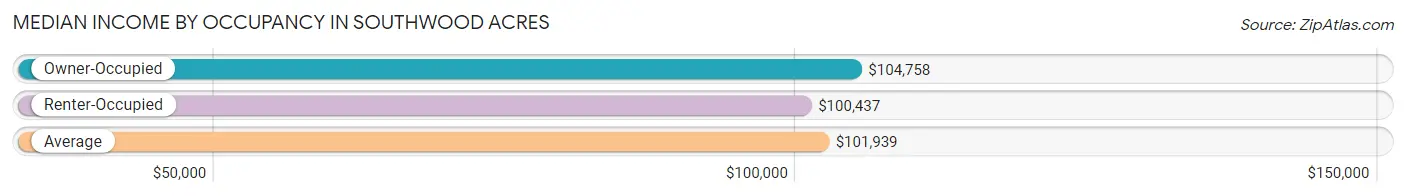
| Occupancy Type | # Households | Median Income |
| Owner-Occupied | 2,916 (87.5%) | $104,758 |
| Renter-Occupied | 416 (12.5%) | $100,437 |
| Average | 3,332 (100.0%) | $101,939 |
Occupancy by Householder Income Bracket in Southwood Acres
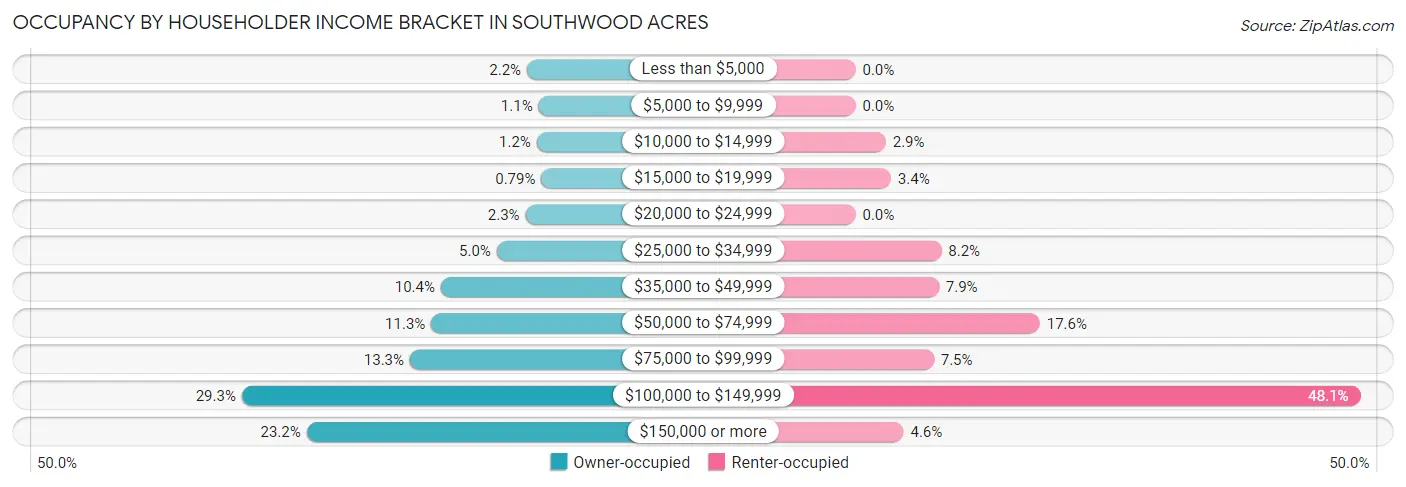
| Income Bracket | Owner-occupied | Renter-occupied |
| Less than $5,000 | 63 (2.2%) | 0 (0.0%) |
| $5,000 to $9,999 | 31 (1.1%) | 0 (0.0%) |
| $10,000 to $14,999 | 36 (1.2%) | 12 (2.9%) |
| $15,000 to $19,999 | 23 (0.8%) | 14 (3.4%) |
| $20,000 to $24,999 | 67 (2.3%) | 0 (0.0%) |
| $25,000 to $34,999 | 147 (5.0%) | 34 (8.2%) |
| $35,000 to $49,999 | 302 (10.4%) | 33 (7.9%) |
| $50,000 to $74,999 | 329 (11.3%) | 73 (17.5%) |
| $75,000 to $99,999 | 388 (13.3%) | 31 (7.4%) |
| $100,000 to $149,999 | 855 (29.3%) | 200 (48.1%) |
| $150,000 or more | 675 (23.2%) | 19 (4.6%) |
| Total | 2,916 (100.0%) | 416 (100.0%) |
Monthly Housing Cost Tiers in Southwood Acres
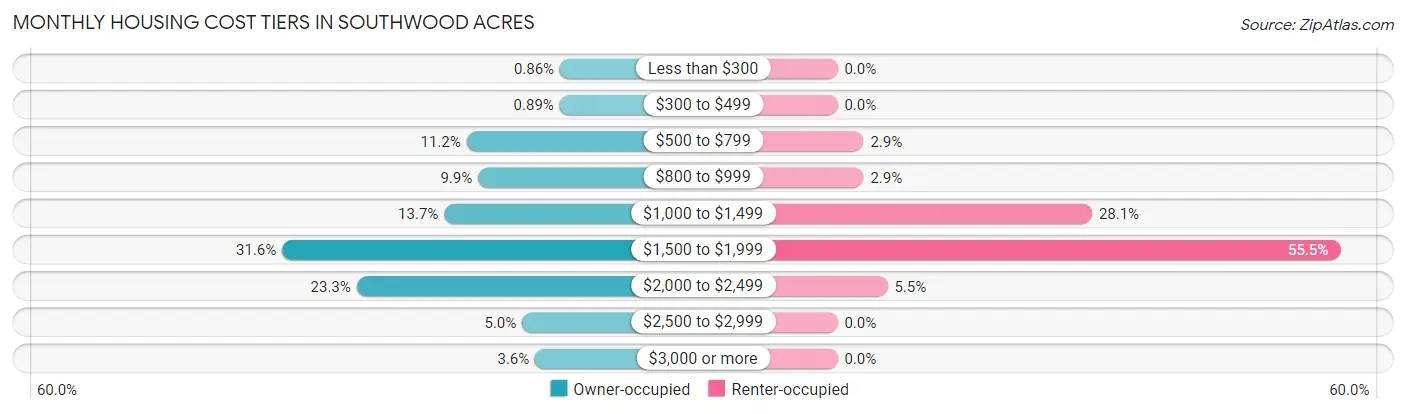
| Monthly Cost | Owner-occupied | Renter-occupied |
| Less than $300 | 25 (0.9%) | 0 (0.0%) |
| $300 to $499 | 26 (0.9%) | 0 (0.0%) |
| $500 to $799 | 326 (11.2%) | 12 (2.9%) |
| $800 to $999 | 289 (9.9%) | 12 (2.9%) |
| $1,000 to $1,499 | 398 (13.7%) | 117 (28.1%) |
| $1,500 to $1,999 | 920 (31.6%) | 231 (55.5%) |
| $2,000 to $2,499 | 680 (23.3%) | 23 (5.5%) |
| $2,500 to $2,999 | 147 (5.0%) | 0 (0.0%) |
| $3,000 or more | 105 (3.6%) | 0 (0.0%) |
| Total | 2,916 (100.0%) | 416 (100.0%) |
Physical Housing Characteristics in Southwood Acres
Housing Structures in Southwood Acres
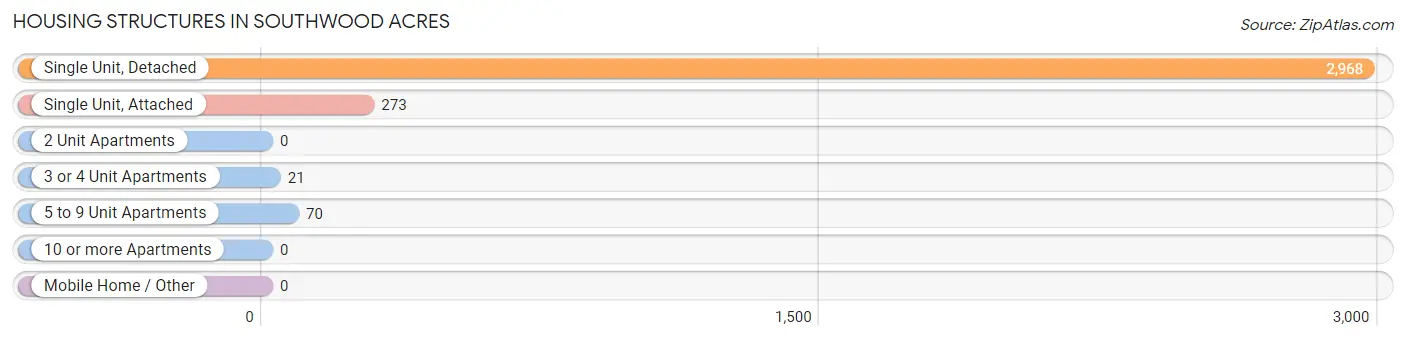
| Structure Type | # Housing Units | % Housing Units |
| Single Unit, Detached | 2,968 | 89.1% |
| Single Unit, Attached | 273 | 8.2% |
| 2 Unit Apartments | 0 | 0.0% |
| 3 or 4 Unit Apartments | 21 | 0.6% |
| 5 to 9 Unit Apartments | 70 | 2.1% |
| 10 or more Apartments | 0 | 0.0% |
| Mobile Home / Other | 0 | 0.0% |
| Total | 3,332 | 100.0% |
Housing Structures by Occupancy in Southwood Acres
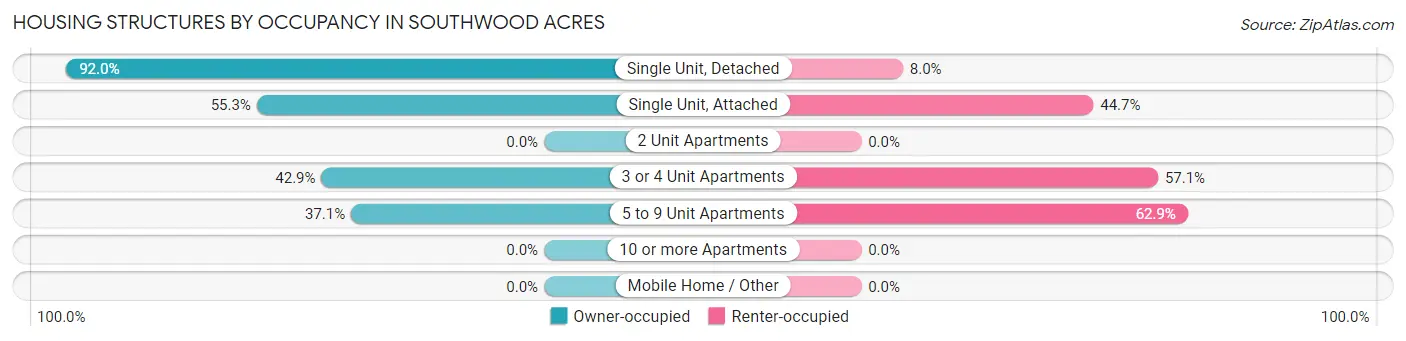
| Structure Type | Owner-occupied | Renter-occupied |
| Single Unit, Detached | 2,730 (92.0%) | 238 (8.0%) |
| Single Unit, Attached | 151 (55.3%) | 122 (44.7%) |
| 2 Unit Apartments | 0 (0.0%) | 0 (0.0%) |
| 3 or 4 Unit Apartments | 9 (42.9%) | 12 (57.1%) |
| 5 to 9 Unit Apartments | 26 (37.1%) | 44 (62.9%) |
| 10 or more Apartments | 0 (0.0%) | 0 (0.0%) |
| Mobile Home / Other | 0 (0.0%) | 0 (0.0%) |
| Total | 2,916 (87.5%) | 416 (12.5%) |
Housing Structures by Number of Rooms in Southwood Acres
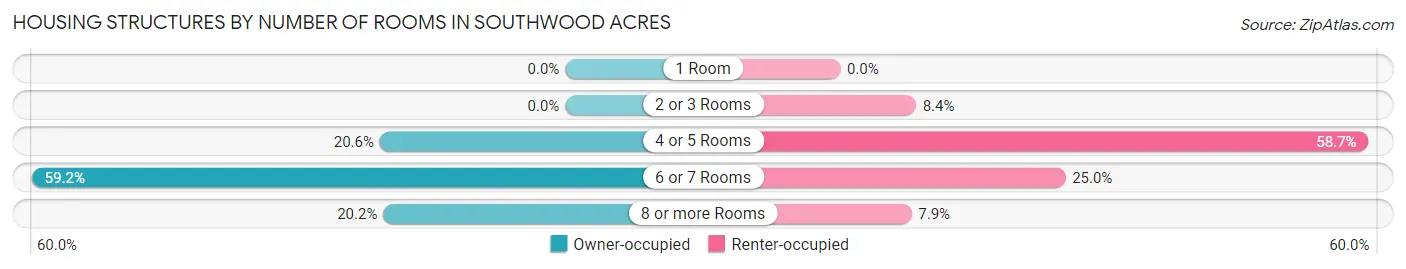
| Number of Rooms | Owner-occupied | Renter-occupied |
| 1 Room | 0 (0.0%) | 0 (0.0%) |
| 2 or 3 Rooms | 0 (0.0%) | 35 (8.4%) |
| 4 or 5 Rooms | 600 (20.6%) | 244 (58.7%) |
| 6 or 7 Rooms | 1,727 (59.2%) | 104 (25.0%) |
| 8 or more Rooms | 589 (20.2%) | 33 (7.9%) |
| Total | 2,916 (100.0%) | 416 (100.0%) |
Housing Structure by Heating Type in Southwood Acres
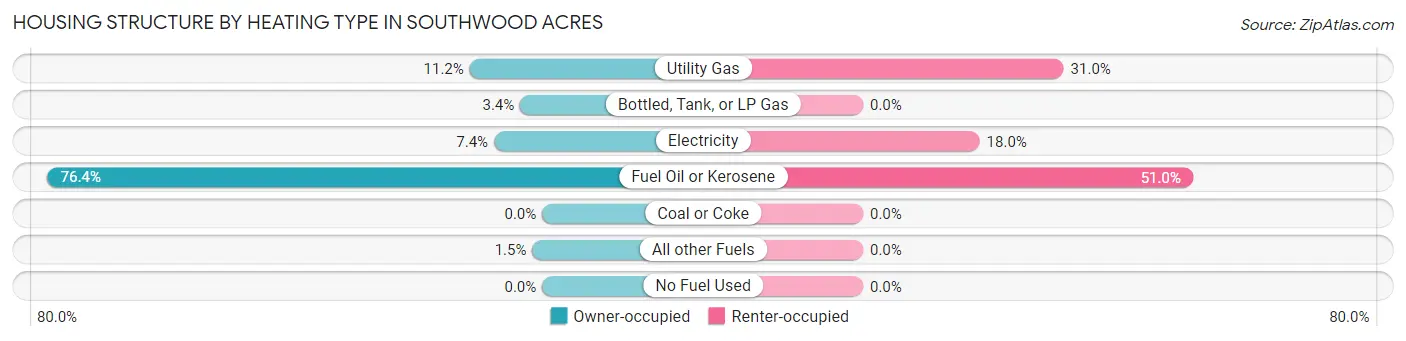
| Heating Type | Owner-occupied | Renter-occupied |
| Utility Gas | 327 (11.2%) | 129 (31.0%) |
| Bottled, Tank, or LP Gas | 99 (3.4%) | 0 (0.0%) |
| Electricity | 217 (7.4%) | 75 (18.0%) |
| Fuel Oil or Kerosene | 2,229 (76.4%) | 212 (51.0%) |
| Coal or Coke | 0 (0.0%) | 0 (0.0%) |
| All other Fuels | 44 (1.5%) | 0 (0.0%) |
| No Fuel Used | 0 (0.0%) | 0 (0.0%) |
| Total | 2,916 (100.0%) | 416 (100.0%) |
Household Vehicle Usage in Southwood Acres
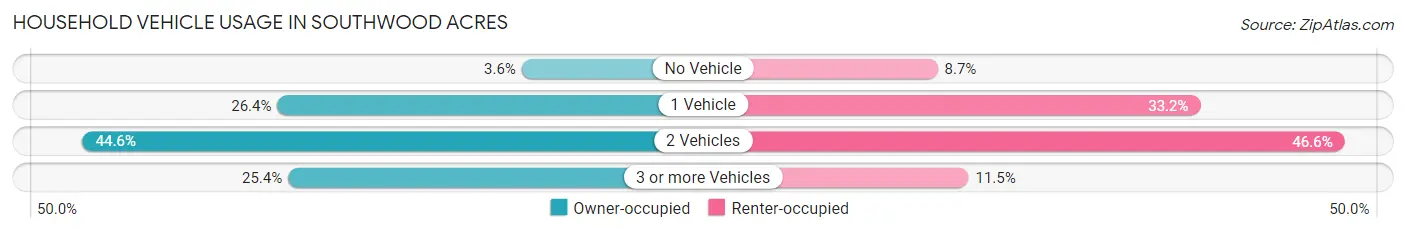
| Vehicles per Household | Owner-occupied | Renter-occupied |
| No Vehicle | 105 (3.6%) | 36 (8.6%) |
| 1 Vehicle | 770 (26.4%) | 138 (33.2%) |
| 2 Vehicles | 1,300 (44.6%) | 194 (46.6%) |
| 3 or more Vehicles | 741 (25.4%) | 48 (11.5%) |
| Total | 2,916 (100.0%) | 416 (100.0%) |
Real Estate & Mortgages in Southwood Acres
Real Estate and Mortgage Overview in Southwood Acres
| Characteristic | Without Mortgage | With Mortgage |
| Housing Units | 770 | 2,146 |
| Median Property Value | $230,500 | $236,400 |
| Median Household Income | $70,714 | $583 |
| Monthly Housing Costs | $804 | $100 |
| Real Estate Taxes | $4,866 | $12 |
Property Value by Mortgage Status in Southwood Acres
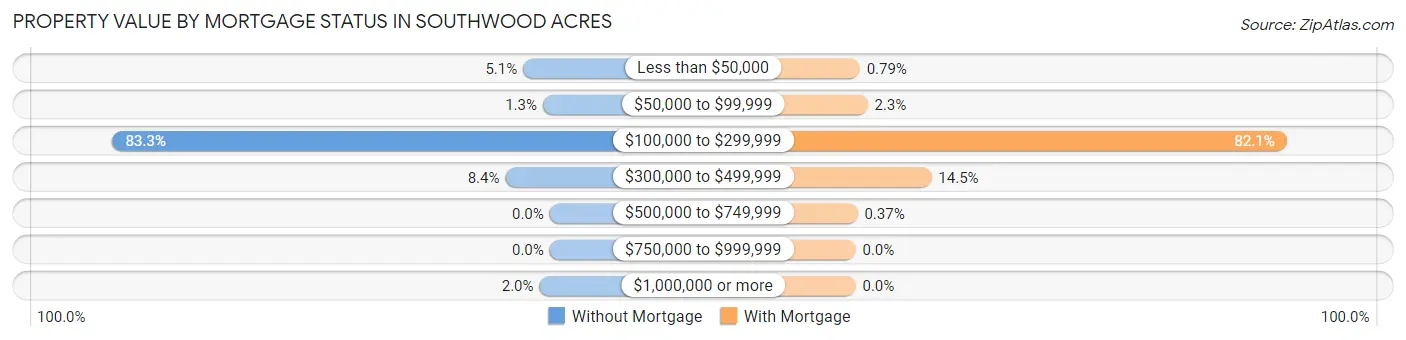
| Property Value | Without Mortgage | With Mortgage |
| Less than $50,000 | 39 (5.1%) | 17 (0.8%) |
| $50,000 to $99,999 | 10 (1.3%) | 49 (2.3%) |
| $100,000 to $299,999 | 641 (83.3%) | 1,762 (82.1%) |
| $300,000 to $499,999 | 65 (8.4%) | 310 (14.4%) |
| $500,000 to $749,999 | 0 (0.0%) | 8 (0.4%) |
| $750,000 to $999,999 | 0 (0.0%) | 0 (0.0%) |
| $1,000,000 or more | 15 (1.9%) | 0 (0.0%) |
| Total | 770 (100.0%) | 2,146 (100.0%) |
Household Income by Mortgage Status in Southwood Acres
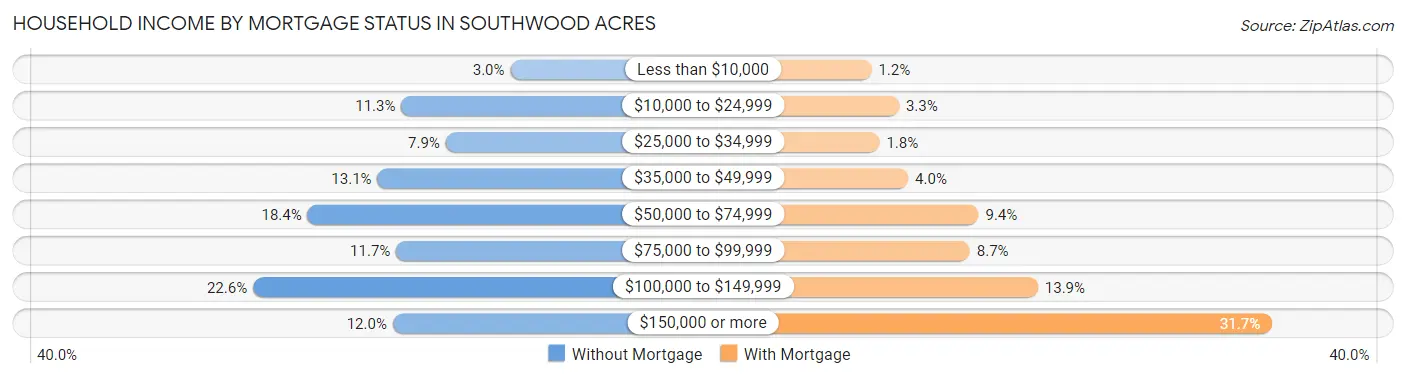
| Household Income | Without Mortgage | With Mortgage |
| Less than $10,000 | 23 (3.0%) | 26 (1.2%) |
| $10,000 to $24,999 | 87 (11.3%) | 71 (3.3%) |
| $25,000 to $34,999 | 61 (7.9%) | 39 (1.8%) |
| $35,000 to $49,999 | 101 (13.1%) | 86 (4.0%) |
| $50,000 to $74,999 | 142 (18.4%) | 201 (9.4%) |
| $75,000 to $99,999 | 90 (11.7%) | 187 (8.7%) |
| $100,000 to $149,999 | 174 (22.6%) | 298 (13.9%) |
| $150,000 or more | 92 (11.9%) | 681 (31.7%) |
| Total | 770 (100.0%) | 2,146 (100.0%) |
Property Value to Household Income Ratio in Southwood Acres
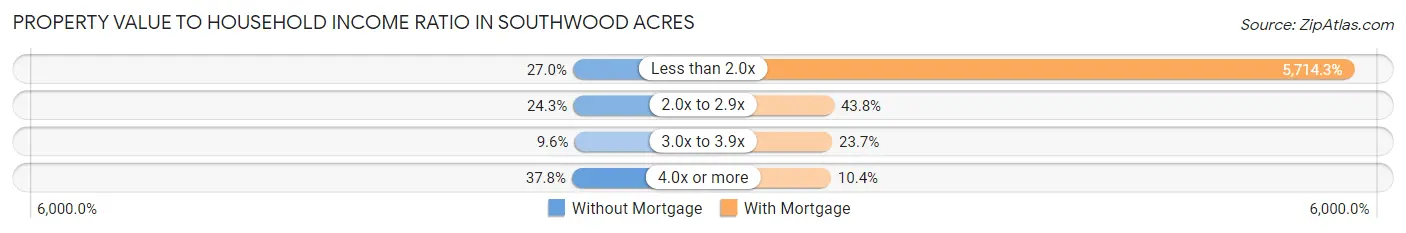
| Value-to-Income Ratio | Without Mortgage | With Mortgage |
| Less than 2.0x | 208 (27.0%) | 122,629 (5,714.3%) |
| 2.0x to 2.9x | 187 (24.3%) | 939 (43.8%) |
| 3.0x to 3.9x | 74 (9.6%) | 508 (23.7%) |
| 4.0x or more | 291 (37.8%) | 224 (10.4%) |
| Total | 770 (100.0%) | 2,146 (100.0%) |
Real Estate Taxes by Mortgage Status in Southwood Acres
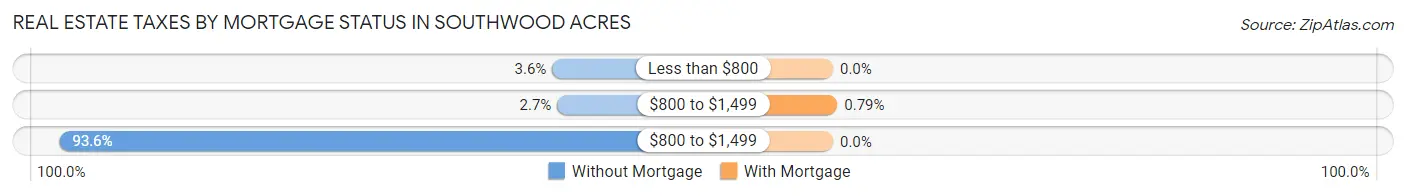
| Property Taxes | Without Mortgage | With Mortgage |
| Less than $800 | 28 (3.6%) | 0 (0.0%) |
| $800 to $1,499 | 21 (2.7%) | 17 (0.8%) |
| $800 to $1,499 | 721 (93.6%) | 0 (0.0%) |
| Total | 770 (100.0%) | 2,146 (100.0%) |
Health & Disability in Southwood Acres
Health Insurance Coverage by Age in Southwood Acres
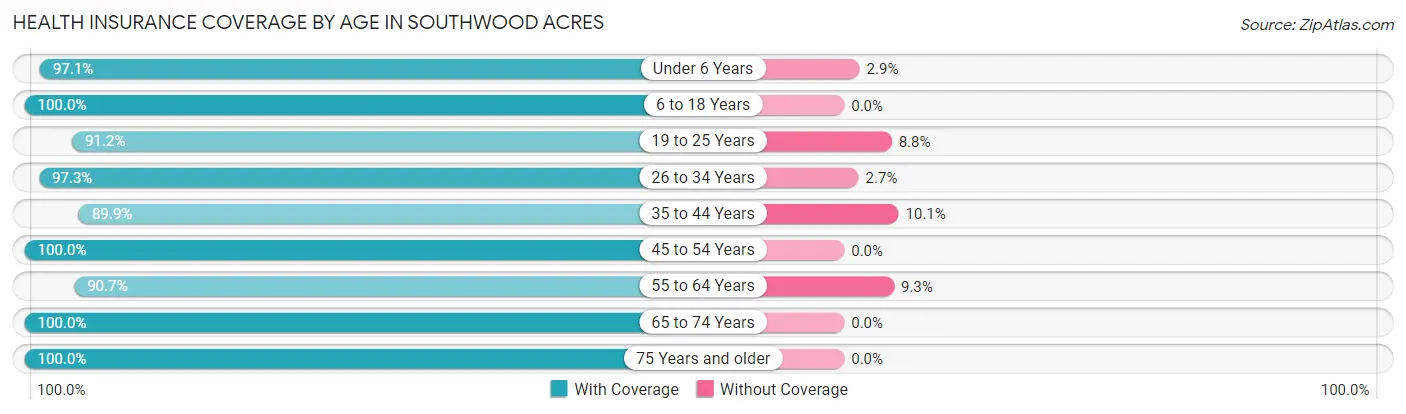
| Age Bracket | With Coverage | Without Coverage |
| Under 6 Years | 475 (97.1%) | 14 (2.9%) |
| 6 to 18 Years | 973 (100.0%) | 0 (0.0%) |
| 19 to 25 Years | 639 (91.2%) | 62 (8.8%) |
| 26 to 34 Years | 1,127 (97.3%) | 31 (2.7%) |
| 35 to 44 Years | 736 (89.9%) | 83 (10.1%) |
| 45 to 54 Years | 1,034 (100.0%) | 0 (0.0%) |
| 55 to 64 Years | 1,185 (90.7%) | 121 (9.3%) |
| 65 to 74 Years | 716 (100.0%) | 0 (0.0%) |
| 75 Years and older | 721 (100.0%) | 0 (0.0%) |
| Total | 7,606 (96.1%) | 311 (3.9%) |
Health Insurance Coverage by Citizenship Status in Southwood Acres
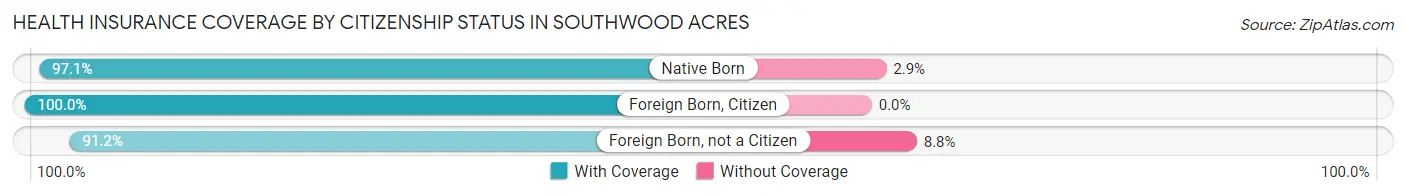
| Citizenship Status | With Coverage | Without Coverage |
| Native Born | 475 (97.1%) | 14 (2.9%) |
| Foreign Born, Citizen | 973 (100.0%) | 0 (0.0%) |
| Foreign Born, not a Citizen | 639 (91.2%) | 62 (8.8%) |
Health Insurance Coverage by Household Income in Southwood Acres
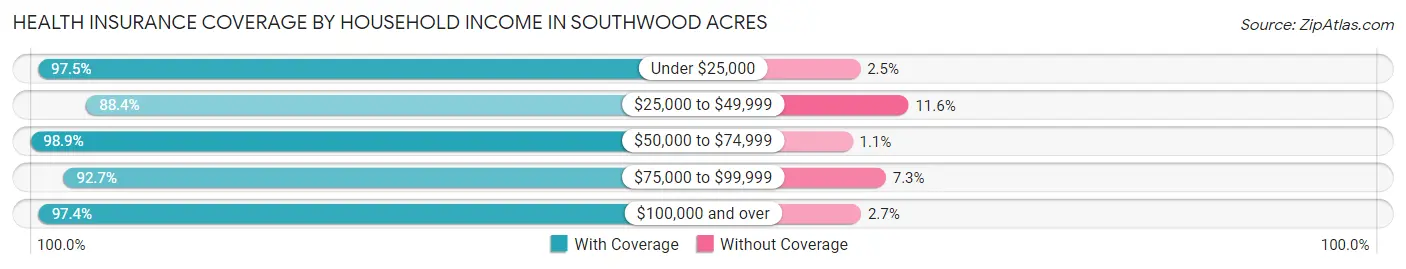
| Household Income | With Coverage | Without Coverage |
| Under $25,000 | 464 (97.5%) | 12 (2.5%) |
| $25,000 to $49,999 | 780 (88.4%) | 102 (11.6%) |
| $50,000 to $74,999 | 927 (98.9%) | 10 (1.1%) |
| $75,000 to $99,999 | 761 (92.7%) | 60 (7.3%) |
| $100,000 and over | 4,674 (97.4%) | 127 (2.6%) |
Public vs Private Health Insurance Coverage by Age in Southwood Acres
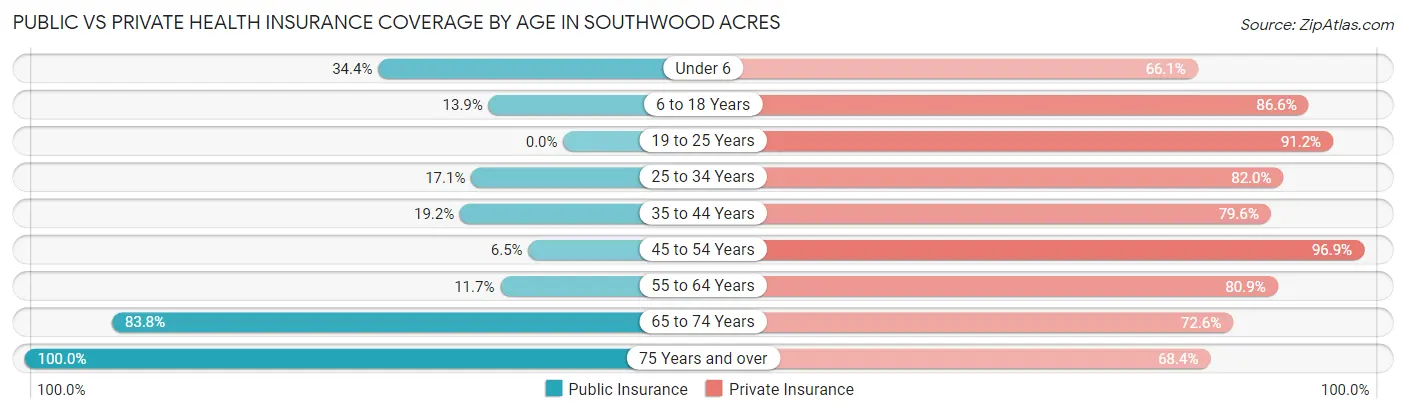
| Age Bracket | Public Insurance | Private Insurance |
| Under 6 | 168 (34.4%) | 323 (66.0%) |
| 6 to 18 Years | 135 (13.9%) | 843 (86.6%) |
| 19 to 25 Years | 0 (0.0%) | 639 (91.2%) |
| 25 to 34 Years | 198 (17.1%) | 949 (82.0%) |
| 35 to 44 Years | 157 (19.2%) | 652 (79.6%) |
| 45 to 54 Years | 67 (6.5%) | 1,002 (96.9%) |
| 55 to 64 Years | 153 (11.7%) | 1,056 (80.9%) |
| 65 to 74 Years | 600 (83.8%) | 520 (72.6%) |
| 75 Years and over | 721 (100.0%) | 493 (68.4%) |
| Total | 2,199 (27.8%) | 6,477 (81.8%) |
Disability Status by Sex by Age in Southwood Acres
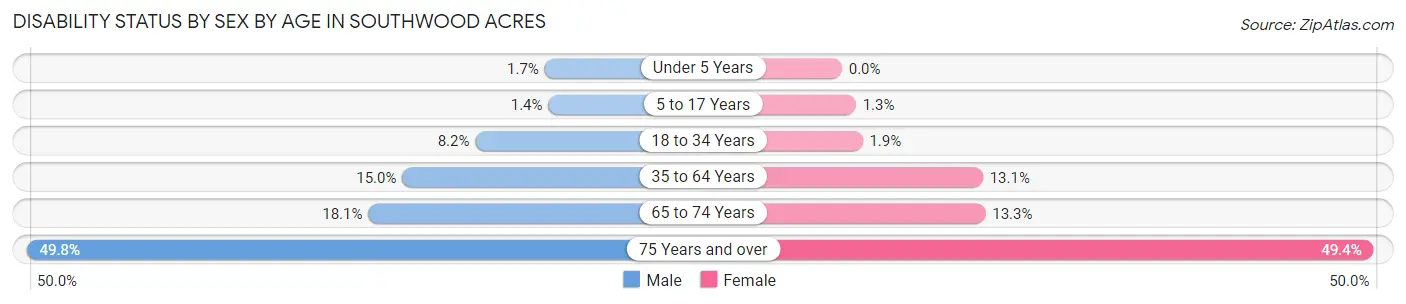
| Age Bracket | Male | Female |
| Under 5 Years | 6 (1.7%) | 0 (0.0%) |
| 5 to 17 Years | 6 (1.4%) | 7 (1.3%) |
| 18 to 34 Years | 77 (8.2%) | 18 (1.9%) |
| 35 to 64 Years | 223 (14.9%) | 218 (13.1%) |
| 65 to 74 Years | 63 (18.1%) | 49 (13.3%) |
| 75 Years and over | 129 (49.8%) | 228 (49.3%) |
Disability Class by Sex by Age in Southwood Acres
Disability Class: Hearing Difficulty
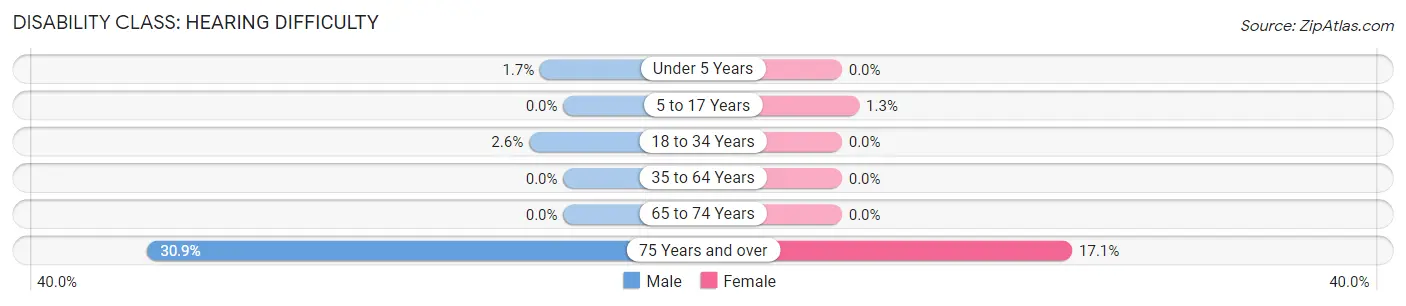
| Age Bracket | Male | Female |
| Under 5 Years | 6 (1.7%) | 0 (0.0%) |
| 5 to 17 Years | 0 (0.0%) | 7 (1.3%) |
| 18 to 34 Years | 24 (2.5%) | 0 (0.0%) |
| 35 to 64 Years | 0 (0.0%) | 0 (0.0%) |
| 65 to 74 Years | 0 (0.0%) | 0 (0.0%) |
| 75 Years and over | 80 (30.9%) | 79 (17.1%) |
Disability Class: Vision Difficulty
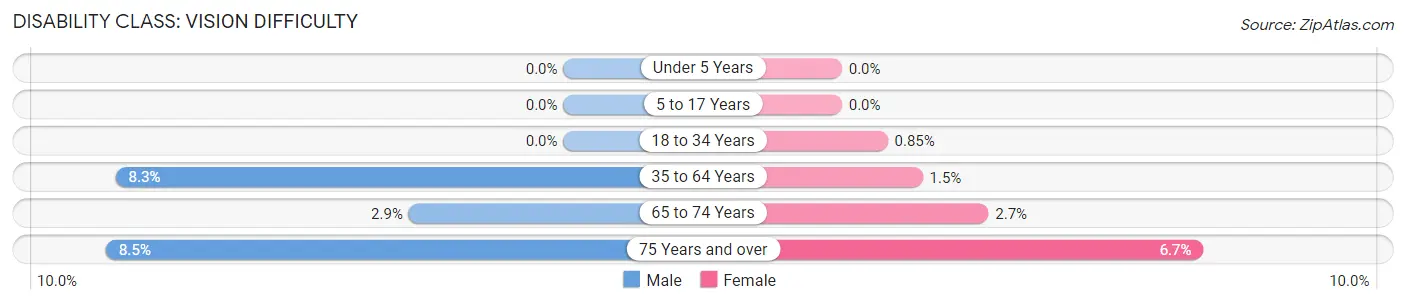
| Age Bracket | Male | Female |
| Under 5 Years | 0 (0.0%) | 0 (0.0%) |
| 5 to 17 Years | 0 (0.0%) | 0 (0.0%) |
| 18 to 34 Years | 0 (0.0%) | 8 (0.9%) |
| 35 to 64 Years | 124 (8.3%) | 25 (1.5%) |
| 65 to 74 Years | 10 (2.9%) | 10 (2.7%) |
| 75 Years and over | 22 (8.5%) | 31 (6.7%) |
Disability Class: Cognitive Difficulty
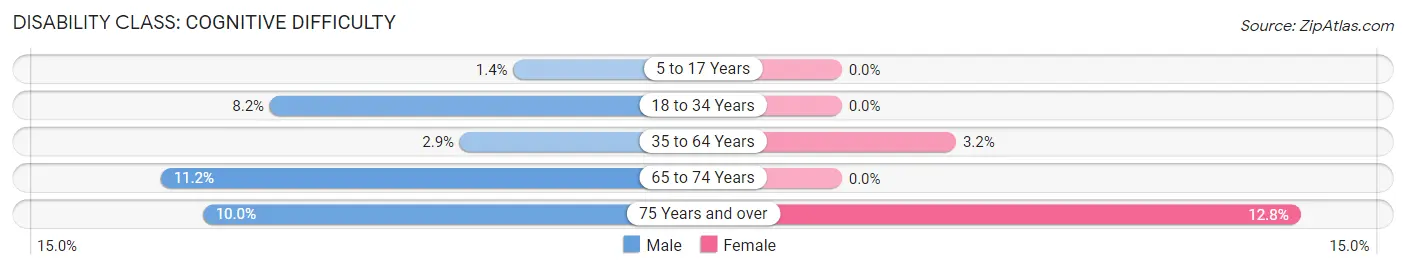
| Age Bracket | Male | Female |
| 5 to 17 Years | 6 (1.4%) | 0 (0.0%) |
| 18 to 34 Years | 77 (8.2%) | 0 (0.0%) |
| 35 to 64 Years | 43 (2.9%) | 53 (3.2%) |
| 65 to 74 Years | 39 (11.2%) | 0 (0.0%) |
| 75 Years and over | 26 (10.0%) | 59 (12.8%) |
Disability Class: Ambulatory Difficulty
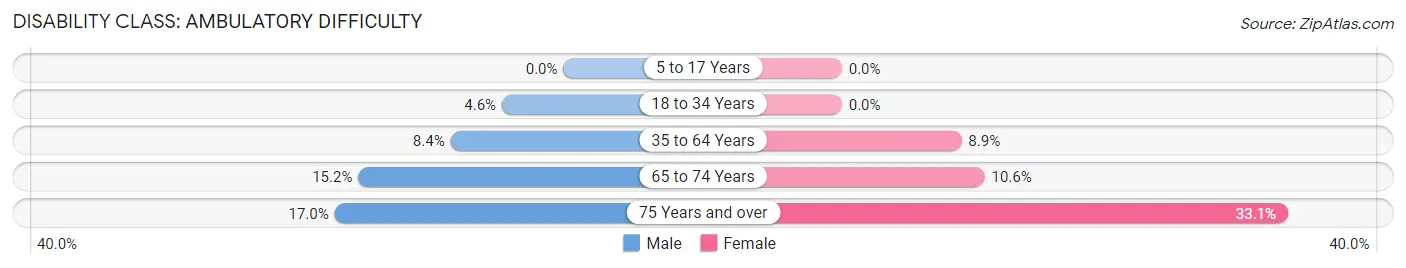
| Age Bracket | Male | Female |
| 5 to 17 Years | 0 (0.0%) | 0 (0.0%) |
| 18 to 34 Years | 43 (4.6%) | 0 (0.0%) |
| 35 to 64 Years | 125 (8.4%) | 148 (8.9%) |
| 65 to 74 Years | 53 (15.2%) | 39 (10.6%) |
| 75 Years and over | 44 (17.0%) | 153 (33.1%) |
Disability Class: Self-Care Difficulty
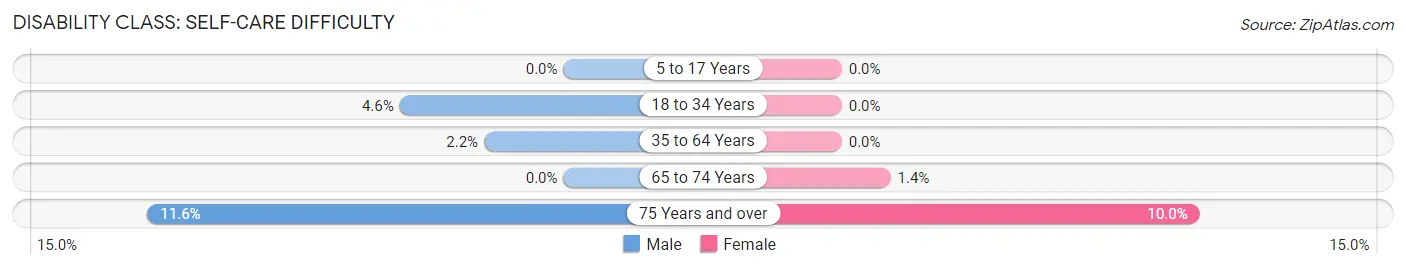
| Age Bracket | Male | Female |
| 5 to 17 Years | 0 (0.0%) | 0 (0.0%) |
| 18 to 34 Years | 43 (4.6%) | 0 (0.0%) |
| 35 to 64 Years | 33 (2.2%) | 0 (0.0%) |
| 65 to 74 Years | 0 (0.0%) | 5 (1.4%) |
| 75 Years and over | 30 (11.6%) | 46 (10.0%) |
Technology Access in Southwood Acres
Computing Device Access in Southwood Acres
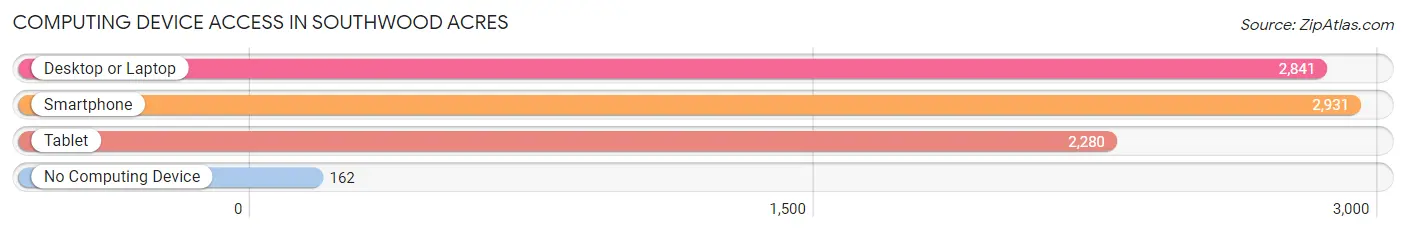
| Device Type | # Households | % Households |
| Desktop or Laptop | 2,841 | 85.3% |
| Smartphone | 2,931 | 88.0% |
| Tablet | 2,280 | 68.4% |
| No Computing Device | 162 | 4.9% |
| Total | 3,332 | 100.0% |
Internet Access in Southwood Acres
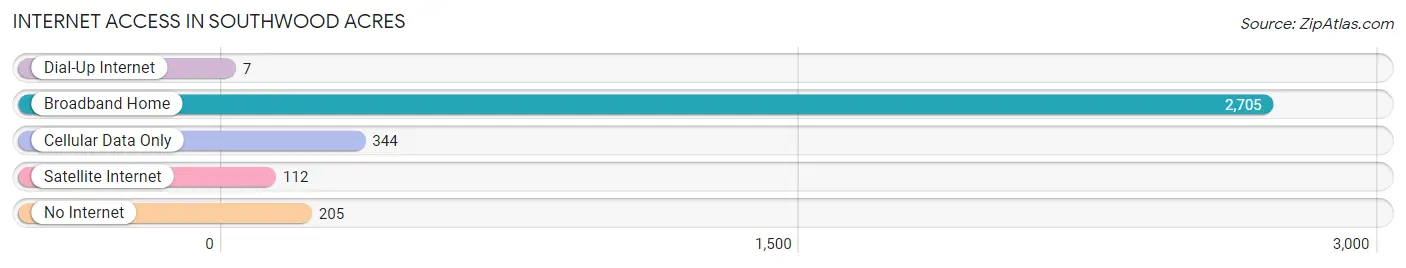
| Internet Type | # Households | % Households |
| Dial-Up Internet | 7 | 0.2% |
| Broadband Home | 2,705 | 81.2% |
| Cellular Data Only | 344 | 10.3% |
| Satellite Internet | 112 | 3.4% |
| No Internet | 205 | 6.1% |
| Total | 3,332 | 100.0% |
Southwood Acres Summary
Wood Acres, CT is a small town located in the state of Connecticut. It is situated in the southwestern corner of the state, just north of the city of New Haven. The town is bordered by the towns of Hamden, North Haven, and Wallingford. The population of Wood Acres was estimated to be 8,845 in the year 2000, making it the second smallest town in the state of Connecticut.
History
Wood Acres was first settled in the early 1700s by a group of English settlers. The town was originally known as “Wooden Acres” due to the abundance of trees in the area. The town was officially incorporated in 1786 and was named after the original settlers.
In the late 1800s, the town began to experience a period of growth and development. The town was home to several factories, including a paper mill, a sawmill, and a grist mill. These factories provided employment for many of the town’s residents.
In the early 1900s, the town began to experience a decline in population as many of the factories closed down. This decline continued until the 1950s when the town began to experience a period of growth and development once again. This period of growth was largely due to the construction of Interstate 91, which provided easy access to the town from other parts of the state.
Geography
Wood Acres is located in the southwestern corner of the state of Connecticut. It is bordered by the towns of Hamden, North Haven, and Wallingford. The town is situated on the banks of the Quinnipiac River, which flows through the town. The town is also home to several small lakes, including Lake Whitney, Lake Saltonstall, and Lake Wintergreen.
The town is located in a region of rolling hills and forests. The town is home to several parks, including the Wood Acres Park, which is located on the banks of the Quinnipiac River. The town is also home to several nature preserves, including the Wood Acres Nature Preserve and the Wood Acres State Park.
Economy
The economy of Wood Acres is largely based on the service industry. The town is home to several small businesses, including restaurants, retail stores, and professional services. The town is also home to several large employers, including the University of New Haven, Yale-New Haven Hospital, and the Connecticut Department of Transportation.
The town is also home to several manufacturing companies, including the Wood Acres Manufacturing Company, which produces furniture and other wood products. The town is also home to several technology companies, including the Wood Acres Technology Center, which provides software development and other technology services.
Demographics
The population of Wood Acres was estimated to be 8,845 in the year 2000. The town has a diverse population, with a large percentage of African Americans, Hispanics, and Asians. The town also has a large percentage of people who identify as LGBT.
The median household income in Wood Acres is $60,000, which is slightly higher than the state average. The town also has a higher percentage of people with college degrees than the state average.
Conclusion
Wood Acres, CT is a small town located in the southwestern corner of the state of Connecticut. The town has a long history of growth and development, and is home to several small businesses and large employers. The town has a diverse population and a higher median household income than the state average. Wood Acres is a great place to live and work, and is a great example of a small town in Connecticut.
Common Questions
What is Per Capita Income in Southwood Acres?
Per Capita income in Southwood Acres is $45,992.
What is the Median Family Income in Southwood Acres?
Median Family Income in Southwood Acres is $123,533.
What is the Median Household income in Southwood Acres?
Median Household Income in Southwood Acres is $101,939.
What is Income or Wage Gap in Southwood Acres?
Income or Wage Gap in Southwood Acres is 24.9%.
Women in Southwood Acres earn 75.1 cents for every dollar earned by a man.
What is Inequality or Gini Index in Southwood Acres?
Inequality or Gini Index in Southwood Acres is 0.34.
What is the Total Population of Southwood Acres?
Total Population of Southwood Acres is 7,928.
What is the Total Male Population of Southwood Acres?
Total Male Population of Southwood Acres is 3,831.
What is the Total Female Population of Southwood Acres?
Total Female Population of Southwood Acres is 4,097.
What is the Ratio of Males per 100 Females in Southwood Acres?
There are 93.51 Males per 100 Females in Southwood Acres.
What is the Ratio of Females per 100 Males in Southwood Acres?
There are 106.94 Females per 100 Males in Southwood Acres.
What is the Median Population Age in Southwood Acres?
Median Population Age in Southwood Acres is 42.2 Years.
What is the Average Family Size in Southwood Acres
Average Family Size in Southwood Acres is 2.8 People.
What is the Average Household Size in Southwood Acres
Average Household Size in Southwood Acres is 2.4 People.
How Large is the Labor Force in Southwood Acres?
There are 4,787 People in the Labor Forcein in Southwood Acres.
What is the Percentage of People in the Labor Force in Southwood Acres?
70.7% of People are in the Labor Force in Southwood Acres.
What is the Unemployment Rate in Southwood Acres?
Unemployment Rate in Southwood Acres is 3.1%.