Zip Codes with the Highest Percentage of Population Employed in Security & Protection in Connecticut
RELATED REPORTS & OPTIONS
Security & Protection
Connecticut
Compare Zip Codes
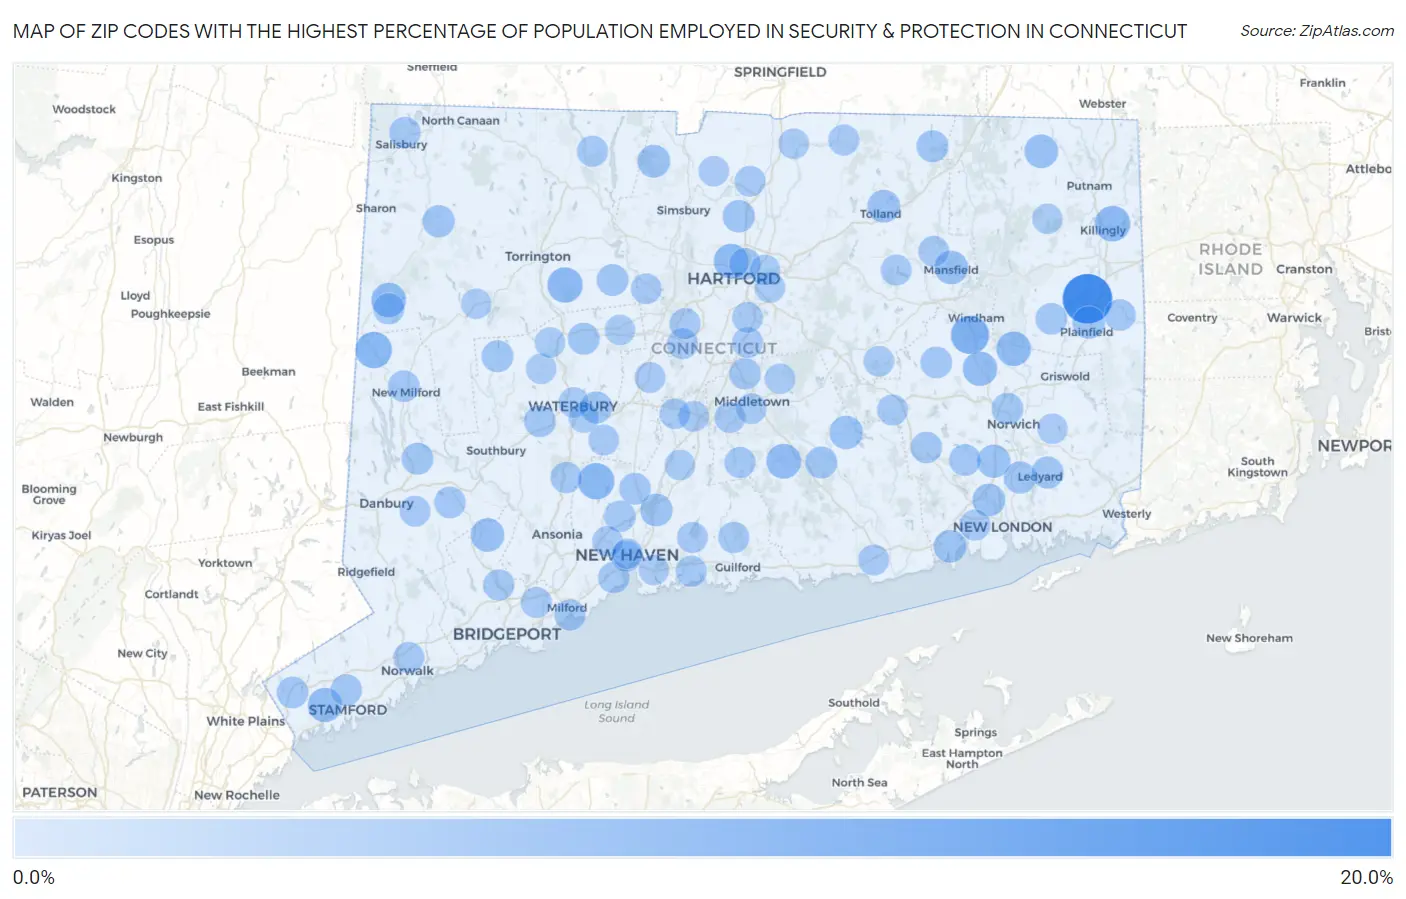
Map of Zip Codes with the Highest Percentage of Population Employed in Security & Protection in Connecticut
0.0%
20.0%
Zip Codes with the Highest Percentage of Population Employed in Security & Protection in Connecticut
| Zip Code | % Employed | vs State | vs National | |
| 1. | 06332 | 17.6% | 1.8%(+15.8)#1 | 2.1%(+15.4)#267 |
| 2. | 06266 | 8.1% | 1.8%(+6.28)#2 | 2.1%(+5.94)#1,134 |
| 3. | 06755 | 6.7% | 1.8%(+4.92)#3 | 2.1%(+4.59)#1,664 |
| 4. | 06524 | 6.7% | 1.8%(+4.88)#4 | 2.1%(+4.55)#1,690 |
| 5. | 06241 | 6.1% | 1.8%(+4.25)#5 | 2.1%(+3.92)#2,032 |
| 6. | 06791 | 5.9% | 1.8%(+4.12)#6 | 2.1%(+3.78)#2,127 |
| 7. | 06112 | 5.6% | 1.8%(+3.77)#7 | 2.1%(+3.43)#2,389 |
| 8. | 06441 | 5.5% | 1.8%(+3.70)#8 | 2.1%(+3.37)#2,445 |
| 9. | 06330 | 5.3% | 1.8%(+3.47)#9 | 2.1%(+3.13)#2,646 |
| 10. | 06757 | 5.3% | 1.8%(+3.46)#10 | 2.1%(+3.12)#2,659 |
| 11. | 06254 | 5.1% | 1.8%(+3.31)#11 | 2.1%(+2.97)#2,794 |
| 12. | 06807 | 5.1% | 1.8%(+3.25)#12 | 2.1%(+2.92)#2,846 |
| 13. | 06281 | 4.5% | 1.8%(+2.73)#13 | 2.1%(+2.40)#3,525 |
| 14. | 06468 | 4.5% | 1.8%(+2.69)#14 | 2.1%(+2.35)#3,613 |
| 15. | 06250 | 4.4% | 1.8%(+2.63)#15 | 2.1%(+2.30)#3,694 |
| 16. | 06469 | 4.3% | 1.8%(+2.50)#16 | 2.1%(+2.17)#3,920 |
| 17. | 06382 | 4.2% | 1.8%(+2.35)#17 | 2.1%(+2.01)#4,195 |
| 18. | 06090 | 3.9% | 1.8%(+2.08)#18 | 2.1%(+1.75)#4,703 |
| 19. | 06084 | 3.8% | 1.8%(+2.01)#19 | 2.1%(+1.68)#4,849 |
| 20. | 06357 | 3.8% | 1.8%(+1.96)#20 | 2.1%(+1.63)#4,958 |
| 21. | 06375 | 3.8% | 1.8%(+1.94)#21 | 2.1%(+1.61)#5,020 |
| 22. | 06473 | 3.7% | 1.8%(+1.91)#22 | 2.1%(+1.57)#5,089 |
| 23. | 06374 | 3.7% | 1.8%(+1.88)#23 | 2.1%(+1.54)#5,180 |
| 24. | 06095 | 3.5% | 1.8%(+1.70)#24 | 2.1%(+1.36)#5,636 |
| 25. | 06335 | 3.5% | 1.8%(+1.67)#25 | 2.1%(+1.33)#5,725 |
| 26. | 06796 | 3.4% | 1.8%(+1.61)#26 | 2.1%(+1.27)#5,867 |
| 27. | 06339 | 3.3% | 1.8%(+1.50)#27 | 2.1%(+1.16)#6,214 |
| 28. | 06705 | 3.3% | 1.8%(+1.46)#28 | 2.1%(+1.12)#6,336 |
| 29. | 06438 | 3.2% | 1.8%(+1.36)#29 | 2.1%(+1.02)#6,636 |
| 30. | 06751 | 3.1% | 1.8%(+1.32)#30 | 2.1%(+0.982)#6,771 |
| 31. | 06076 | 3.1% | 1.8%(+1.32)#31 | 2.1%(+0.979)#6,785 |
| 32. | 06786 | 3.1% | 1.8%(+1.29)#32 | 2.1%(+0.955)#6,873 |
| 33. | 06804 | 3.1% | 1.8%(+1.27)#33 | 2.1%(+0.938)#6,926 |
| 34. | 06013 | 3.1% | 1.8%(+1.27)#34 | 2.1%(+0.937)#6,932 |
| 35. | 06762 | 3.1% | 1.8%(+1.25)#35 | 2.1%(+0.918)#6,996 |
| 36. | 06360 | 3.1% | 1.8%(+1.25)#36 | 2.1%(+0.916)#7,001 |
| 37. | 06518 | 3.1% | 1.8%(+1.24)#37 | 2.1%(+0.907)#7,023 |
| 38. | 06249 | 3.0% | 1.8%(+1.20)#38 | 2.1%(+0.865)#7,175 |
| 39. | 06470 | 3.0% | 1.8%(+1.15)#39 | 2.1%(+0.811)#7,391 |
| 40. | 06370 | 2.9% | 1.8%(+1.13)#40 | 2.1%(+0.791)#7,481 |
| 41. | 06776 | 2.9% | 1.8%(+1.12)#41 | 2.1%(+0.781)#7,515 |
| 42. | 06831 | 2.9% | 1.8%(+1.11)#42 | 2.1%(+0.773)#7,547 |
| 43. | 06120 | 2.9% | 1.8%(+1.09)#43 | 2.1%(+0.750)#7,641 |
| 44. | 06331 | 2.9% | 1.8%(+1.08)#44 | 2.1%(+0.744)#7,684 |
| 45. | 06354 | 2.9% | 1.8%(+1.04)#45 | 2.1%(+0.709)#7,827 |
| 46. | 06416 | 2.8% | 1.8%(+1.01)#46 | 2.1%(+0.672)#8,015 |
| 47. | 06905 | 2.8% | 1.8%(+0.994)#47 | 2.1%(+0.658)#8,091 |
| 48. | 06420 | 2.8% | 1.8%(+0.943)#48 | 2.1%(+0.607)#8,294 |
| 49. | 06068 | 2.7% | 1.8%(+0.927)#49 | 2.1%(+0.591)#8,351 |
| 50. | 06516 | 2.7% | 1.8%(+0.927)#50 | 2.1%(+0.591)#8,357 |
| 51. | 06514 | 2.7% | 1.8%(+0.883)#51 | 2.1%(+0.547)#8,554 |
| 52. | 06460 | 2.6% | 1.8%(+0.829)#52 | 2.1%(+0.493)#8,817 |
| 53. | 06403 | 2.6% | 1.8%(+0.797)#53 | 2.1%(+0.461)#8,964 |
| 54. | 06611 | 2.6% | 1.8%(+0.783)#54 | 2.1%(+0.447)#9,025 |
| 55. | 06785 | 2.6% | 1.8%(+0.758)#55 | 2.1%(+0.422)#9,157 |
| 56. | 06405 | 2.5% | 1.8%(+0.720)#56 | 2.1%(+0.384)#9,337 |
| 57. | 06437 | 2.5% | 1.8%(+0.716)#57 | 2.1%(+0.380)#9,367 |
| 58. | 06422 | 2.5% | 1.8%(+0.683)#58 | 2.1%(+0.347)#9,533 |
| 59. | 06851 | 2.5% | 1.8%(+0.652)#59 | 2.1%(+0.316)#9,704 |
| 60. | 06065 | 2.5% | 1.8%(+0.640)#60 | 2.1%(+0.304)#9,773 |
| 61. | 06415 | 2.4% | 1.8%(+0.637)#61 | 2.1%(+0.301)#9,783 |
| 62. | 06071 | 2.4% | 1.8%(+0.632)#62 | 2.1%(+0.296)#9,826 |
| 63. | 06614 | 2.4% | 1.8%(+0.614)#63 | 2.1%(+0.278)#9,923 |
| 64. | 06238 | 2.4% | 1.8%(+0.558)#64 | 2.1%(+0.222)#10,224 |
| 65. | 06269 | 2.4% | 1.8%(+0.555)#65 | 2.1%(+0.219)#10,239 |
| 66. | 06475 | 2.4% | 1.8%(+0.555)#66 | 2.1%(+0.219)#10,240 |
| 67. | 06052 | 2.4% | 1.8%(+0.554)#67 | 2.1%(+0.218)#10,250 |
| 68. | 06067 | 2.4% | 1.8%(+0.550)#68 | 2.1%(+0.214)#10,264 |
| 69. | 06053 | 2.4% | 1.8%(+0.542)#69 | 2.1%(+0.206)#10,305 |
| 70. | 06385 | 2.4% | 1.8%(+0.540)#70 | 2.1%(+0.204)#10,313 |
| 71. | 06489 | 2.3% | 1.8%(+0.536)#71 | 2.1%(+0.200)#10,335 |
| 72. | 06510 | 2.3% | 1.8%(+0.521)#72 | 2.1%(+0.185)#10,440 |
| 73. | 06712 | 2.3% | 1.8%(+0.520)#73 | 2.1%(+0.184)#10,444 |
| 74. | 06481 | 2.3% | 1.8%(+0.517)#74 | 2.1%(+0.181)#10,460 |
| 75. | 06471 | 2.3% | 1.8%(+0.515)#75 | 2.1%(+0.179)#10,469 |
| 76. | 06801 | 2.3% | 1.8%(+0.496)#76 | 2.1%(+0.160)#10,598 |
| 77. | 06109 | 2.3% | 1.8%(+0.468)#77 | 2.1%(+0.132)#10,764 |
| 78. | 06096 | 2.3% | 1.8%(+0.467)#78 | 2.1%(+0.131)#10,767 |
| 79. | 06450 | 2.3% | 1.8%(+0.440)#79 | 2.1%(+0.104)#10,934 |
| 80. | 06515 | 2.2% | 1.8%(+0.409)#80 | 2.1%(+0.073)#11,129 |
| 81. | 06085 | 2.2% | 1.8%(+0.379)#81 | 2.1%(+0.043)#11,312 |
| 82. | 06231 | 2.2% | 1.8%(+0.349)#82 | 2.1%(+0.013)#11,498 |
| 83. | 06457 | 2.2% | 1.8%(+0.343)#83 | 2.1%(+0.007)#11,539 |
| 84. | 06118 | 2.1% | 1.8%(+0.289)#84 | 2.1%(-0.047)#11,893 |
| 85. | 06480 | 2.1% | 1.8%(+0.288)#85 | 2.1%(-0.048)#11,903 |
| 86. | 06795 | 2.1% | 1.8%(+0.282)#86 | 2.1%(-0.054)#11,949 |
| 87. | 06108 | 2.1% | 1.8%(+0.279)#87 | 2.1%(-0.057)#11,970 |
| 88. | 06082 | 2.1% | 1.8%(+0.267)#88 | 2.1%(-0.069)#12,055 |
| 89. | 06702 | 2.1% | 1.8%(+0.265)#89 | 2.1%(-0.071)#12,070 |
| 90. | 06451 | 2.1% | 1.8%(+0.255)#90 | 2.1%(-0.081)#12,134 |
| 91. | 06706 | 2.1% | 1.8%(+0.245)#91 | 2.1%(-0.091)#12,199 |
| 92. | 06026 | 2.1% | 1.8%(+0.242)#92 | 2.1%(-0.094)#12,214 |
| 93. | 06492 | 2.0% | 1.8%(+0.218)#93 | 2.1%(-0.118)#12,361 |
| 94. | 06787 | 2.0% | 1.8%(+0.204)#94 | 2.1%(-0.132)#12,455 |
| 95. | 06259 | 2.0% | 1.8%(+0.182)#95 | 2.1%(-0.154)#12,593 |
| 96. | 06750 | 2.0% | 1.8%(+0.175)#96 | 2.1%(-0.161)#12,634 |
| 97. | 06365 | 2.0% | 1.8%(+0.175)#97 | 2.1%(-0.161)#12,642 |
| 98. | 06511 | 2.0% | 1.8%(+0.171)#98 | 2.1%(-0.165)#12,658 |
| 99. | 06512 | 2.0% | 1.8%(+0.170)#99 | 2.1%(-0.166)#12,667 |
| 100. | 06010 | 2.0% | 1.8%(+0.169)#100 | 2.1%(-0.167)#12,681 |
Common Questions
What are the Top 10 Zip Codes with the Highest Percentage of Population Employed in Security & Protection in Connecticut?
Top 10 Zip Codes with the Highest Percentage of Population Employed in Security & Protection in Connecticut are:
What zip code has the Highest Percentage of Population Employed in Security & Protection in Connecticut?
06332 has the Highest Percentage of Population Employed in Security & Protection in Connecticut with 17.6%.
What is the Percentage of Population Employed in Security & Protection in the State of Connecticut?
Percentage of Population Employed in Security & Protection in Connecticut is 1.8%.
What is the Percentage of Population Employed in Security & Protection in the United States?
Percentage of Population Employed in Security & Protection in the United States is 2.1%.