Old Mystic, CT Map & Demographics
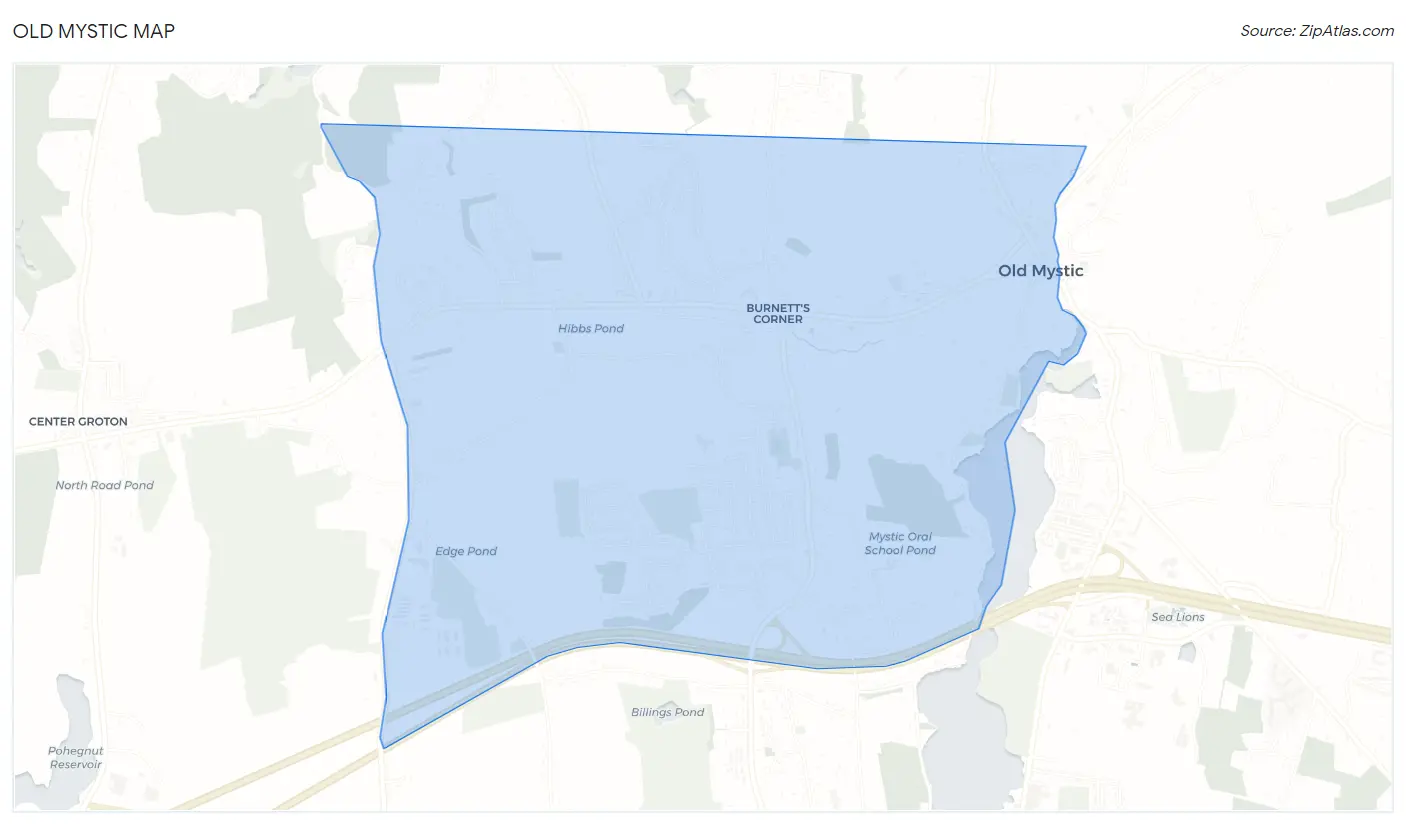
Old Mystic Map
Old Mystic Overview
$49,133
PER CAPITA INCOME
$130,833
AVG FAMILY INCOME
$112,734
AVG HOUSEHOLD INCOME
46.2%
WAGE / INCOME GAP [ % ]
53.8¢/ $1
WAGE / INCOME GAP [ $ ]
0.35
INEQUALITY / GINI INDEX
3,385
TOTAL POPULATION
1,797
MALE POPULATION
1,588
FEMALE POPULATION
113.16
MALES / 100 FEMALES
88.37
FEMALES / 100 MALES
47.1
MEDIAN AGE
3.0
AVG FAMILY SIZE
2.6
AVG HOUSEHOLD SIZE
1,770
LABOR FORCE [ PEOPLE ]
63.1%
PERCENT IN LABOR FORCE
5.6%
UNEMPLOYMENT RATE
Old Mystic Area Codes
Income in Old Mystic
Income Overview in Old Mystic
Per Capita Income in Old Mystic is $49,133, while median incomes of families and households are $130,833 and $112,734 respectively.
| Characteristic | Number | Measure |
| Per Capita Income | 3,385 | $49,133 |
| Median Family Income | 982 | $130,833 |
| Mean Family Income | 982 | $143,260 |
| Median Household Income | 1,311 | $112,734 |
| Mean Household Income | 1,311 | $128,603 |
| Income Deficit | 982 | $0 |
| Wage / Income Gap (%) | 3,385 | 46.23% |
| Wage / Income Gap ($) | 3,385 | 53.77¢ per $1 |
| Gini / Inequality Index | 3,385 | 0.35 |
Earnings by Sex in Old Mystic
Average Earnings in Old Mystic are $59,797, $78,023 for men and $41,950 for women, a difference of 46.2%.
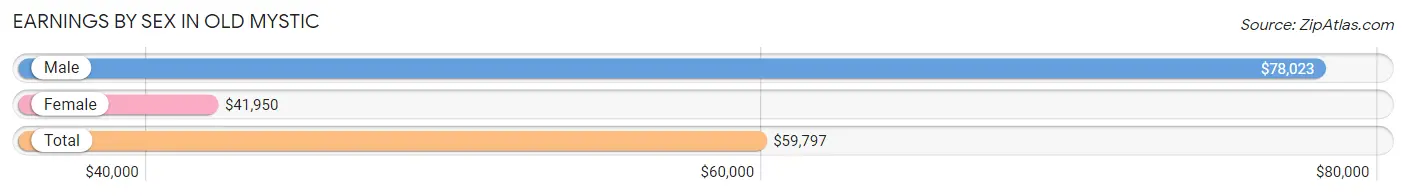
| Sex | Number | Average Earnings |
| Male | 931 (52.4%) | $78,023 |
| Female | 846 (47.6%) | $41,950 |
| Total | 1,777 (100.0%) | $59,797 |
Earnings by Sex by Income Bracket in Old Mystic
The most common earnings brackets in Old Mystic are $100,000+ for men (302 | 32.4%) and $75,000 to $99,999 for women (151 | 17.8%).
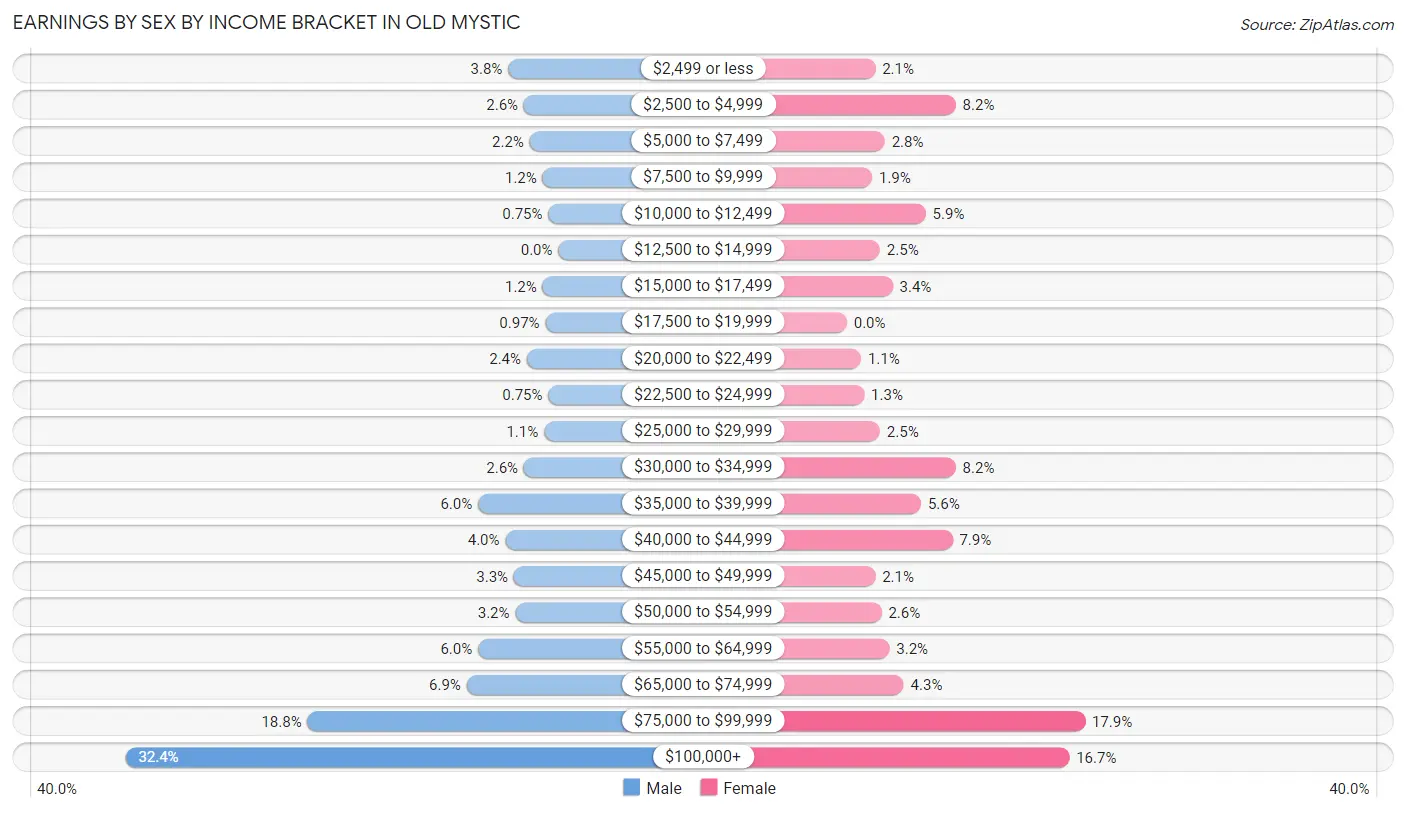
| Income | Male | Female |
| $2,499 or less | 35 (3.8%) | 18 (2.1%) |
| $2,500 to $4,999 | 24 (2.6%) | 69 (8.2%) |
| $5,000 to $7,499 | 20 (2.1%) | 24 (2.8%) |
| $7,500 to $9,999 | 11 (1.2%) | 16 (1.9%) |
| $10,000 to $12,499 | 7 (0.7%) | 50 (5.9%) |
| $12,500 to $14,999 | 0 (0.0%) | 21 (2.5%) |
| $15,000 to $17,499 | 11 (1.2%) | 29 (3.4%) |
| $17,500 to $19,999 | 9 (1.0%) | 0 (0.0%) |
| $20,000 to $22,499 | 22 (2.4%) | 9 (1.1%) |
| $22,500 to $24,999 | 7 (0.7%) | 11 (1.3%) |
| $25,000 to $29,999 | 10 (1.1%) | 21 (2.5%) |
| $30,000 to $34,999 | 24 (2.6%) | 69 (8.2%) |
| $35,000 to $39,999 | 56 (6.0%) | 47 (5.6%) |
| $40,000 to $44,999 | 37 (4.0%) | 67 (7.9%) |
| $45,000 to $49,999 | 31 (3.3%) | 18 (2.1%) |
| $50,000 to $54,999 | 30 (3.2%) | 22 (2.6%) |
| $55,000 to $64,999 | 56 (6.0%) | 27 (3.2%) |
| $65,000 to $74,999 | 64 (6.9%) | 36 (4.3%) |
| $75,000 to $99,999 | 175 (18.8%) | 151 (17.8%) |
| $100,000+ | 302 (32.4%) | 141 (16.7%) |
| Total | 931 (100.0%) | 846 (100.0%) |
Earnings by Sex by Educational Attainment in Old Mystic
Average earnings in Old Mystic are $79,795 for men and $44,559 for women, a difference of 44.2%. Men with an educational attainment of graduate degree enjoy the highest average annual earnings of $150,109, while those with high school diploma education earn the least with $55,250. Women with an educational attainment of graduate degree earn the most with the average annual earnings of $69,167, while those with high school diploma education have the smallest earnings of $25,909.
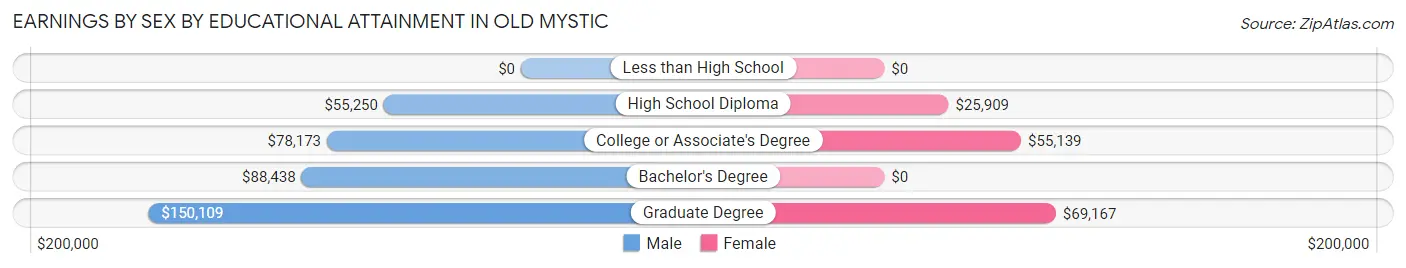
| Educational Attainment | Male Income | Female Income |
| Less than High School | - | - |
| High School Diploma | $55,250 | $25,909 |
| College or Associate's Degree | $78,173 | $55,139 |
| Bachelor's Degree | $88,438 | $0 |
| Graduate Degree | $150,109 | $69,167 |
| Total | $79,795 | $44,559 |
Family Income in Old Mystic
Family Income Brackets in Old Mystic
According to the Old Mystic family income data, there are 249 families falling into the $100,000 to $149,999 income range, which is the most common income bracket and makes up 25.4% of all families.
| Income Bracket | # Families | % Families |
| Less than $10,000 | 16 | 1.6% |
| $10,000 to $14,999 | 0 | 0.0% |
| $15,000 to $24,999 | 34 | 3.5% |
| $25,000 to $34,999 | 41 | 4.2% |
| $35,000 to $49,999 | 23 | 2.3% |
| $50,000 to $74,999 | 123 | 12.5% |
| $75,000 to $99,999 | 100 | 10.2% |
| $100,000 to $149,999 | 249 | 25.4% |
| $150,000 to $199,999 | 190 | 19.3% |
| $200,000+ | 206 | 21.0% |
Family Income by Famaliy Size in Old Mystic
3-person families (219 | 22.3%) account for the highest median family income in Old Mystic with $178,073 per family, while 3-person families (219 | 22.3%) have the highest median income of $59,358 per family member.
| Income Bracket | # Families | Median Income |
| 2-Person Families | 498 (50.7%) | $112,188 |
| 3-Person Families | 219 (22.3%) | $178,073 |
| 4-Person Families | 186 (18.9%) | $159,286 |
| 5-Person Families | 34 (3.5%) | $0 |
| 6-Person Families | 25 (2.5%) | $149,107 |
| 7+ Person Families | 20 (2.0%) | $0 |
| Total | 982 (100.0%) | $130,833 |
Family Income by Number of Earners in Old Mystic
The median family income in Old Mystic is $130,833, with families comprising 3+ earners (143) having the highest median family income of $250,001, while families with no earners (175) have the lowest median family income of $44,306, accounting for 14.6% and 17.8% of families, respectively.
| Number of Earners | # Families | Median Income |
| No Earners | 175 (17.8%) | $44,306 |
| 1 Earner | 194 (19.8%) | $107,000 |
| 2 Earners | 470 (47.9%) | $141,389 |
| 3+ Earners | 143 (14.6%) | $250,001 |
| Total | 982 (100.0%) | $130,833 |
Household Income in Old Mystic
Household Income Brackets in Old Mystic
With 304 households falling in the category, the $100,000 to $149,999 income range is the most frequent in Old Mystic, accounting for 23.2% of all households. In contrast, only 8 households (0.6%) fall into the $10,000 to $14,999 income bracket, making it the least populous group.
| Income Bracket | # Households | % Households |
| Less than $10,000 | 24 | 1.8% |
| $10,000 to $14,999 | 8 | 0.6% |
| $15,000 to $24,999 | 28 | 2.1% |
| $25,000 to $34,999 | 88 | 6.7% |
| $35,000 to $49,999 | 31 | 2.4% |
| $50,000 to $74,999 | 197 | 15.0% |
| $75,000 to $99,999 | 218 | 16.6% |
| $100,000 to $149,999 | 304 | 23.2% |
| $150,000 to $199,999 | 201 | 15.3% |
| $200,000+ | 216 | 16.5% |
Household Income by Householder Age in Old Mystic
The median household income in Old Mystic is $112,734, with the highest median household income of $141,806 found in the 25 to 44 years age bracket for the primary householder. A total of 311 households (23.7%) fall into this category. Meanwhile, the 15 to 24 years age bracket for the primary householder has the lowest median household income of $0, with 13 households (1.0%) in this group.
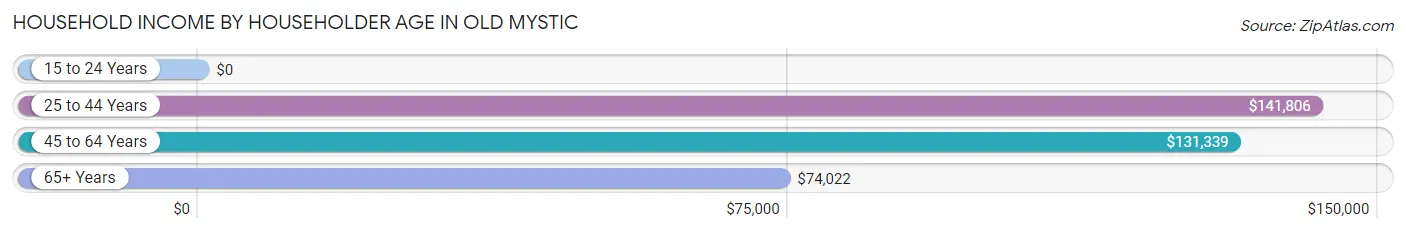
| Income Bracket | # Households | Median Income |
| 15 to 24 Years | 13 (1.0%) | $0 |
| 25 to 44 Years | 311 (23.7%) | $141,806 |
| 45 to 64 Years | 613 (46.8%) | $131,339 |
| 65+ Years | 374 (28.5%) | $74,022 |
| Total | 1,311 (100.0%) | $112,734 |
Poverty in Old Mystic
Income Below Poverty by Sex and Age in Old Mystic
With 8.1% poverty level for males and 4.3% for females among the residents of Old Mystic, 65 to 74 year old males and 6 to 11 year old females are the most vulnerable to poverty, with 51 males (34.2%) and 10 females (13.2%) in their respective age groups living below the poverty level.
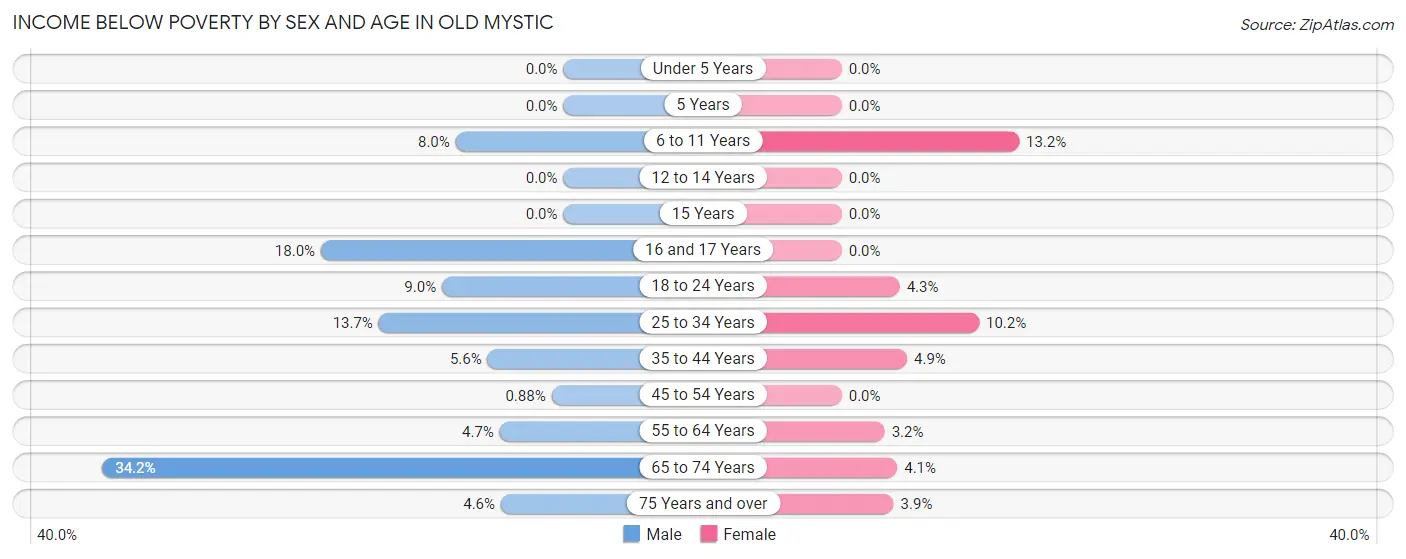
| Age Bracket | Male | Female |
| Under 5 Years | 0 (0.0%) | 0 (0.0%) |
| 5 Years | 0 (0.0%) | 0 (0.0%) |
| 6 to 11 Years | 8 (8.0%) | 10 (13.2%) |
| 12 to 14 Years | 0 (0.0%) | 0 (0.0%) |
| 15 Years | 0 (0.0%) | 0 (0.0%) |
| 16 and 17 Years | 9 (18.0%) | 0 (0.0%) |
| 18 to 24 Years | 10 (9.0%) | 4 (4.3%) |
| 25 to 34 Years | 34 (13.7%) | 21 (10.2%) |
| 35 to 44 Years | 8 (5.6%) | 8 (4.9%) |
| 45 to 54 Years | 2 (0.9%) | 0 (0.0%) |
| 55 to 64 Years | 16 (4.7%) | 9 (3.2%) |
| 65 to 74 Years | 51 (34.2%) | 8 (4.1%) |
| 75 Years and over | 7 (4.6%) | 8 (3.8%) |
| Total | 145 (8.1%) | 68 (4.3%) |
Income Above Poverty by Sex and Age in Old Mystic
According to the poverty statistics in Old Mystic, males aged under 5 years and females aged under 5 years are the age groups that are most secure financially, with 100.0% of males and 100.0% of females in these age groups living above the poverty line.
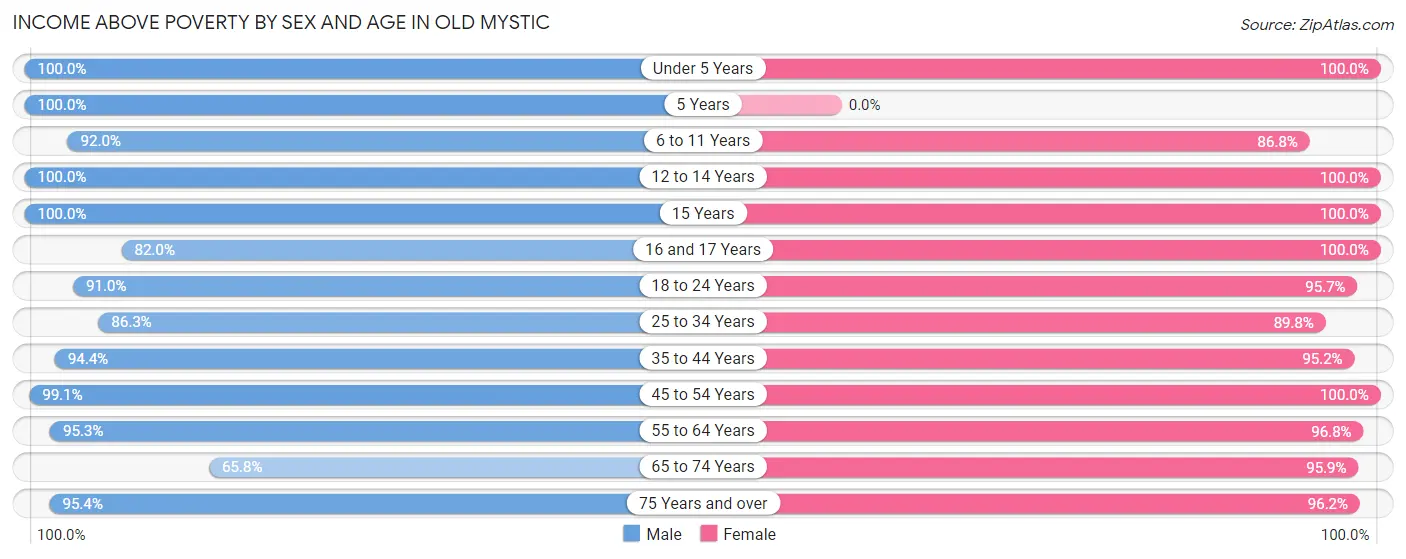
| Age Bracket | Male | Female |
| Under 5 Years | 83 (100.0%) | 82 (100.0%) |
| 5 Years | 7 (100.0%) | 0 (0.0%) |
| 6 to 11 Years | 92 (92.0%) | 66 (86.8%) |
| 12 to 14 Years | 87 (100.0%) | 33 (100.0%) |
| 15 Years | 104 (100.0%) | 8 (100.0%) |
| 16 and 17 Years | 41 (82.0%) | 33 (100.0%) |
| 18 to 24 Years | 101 (91.0%) | 89 (95.7%) |
| 25 to 34 Years | 214 (86.3%) | 185 (89.8%) |
| 35 to 44 Years | 134 (94.4%) | 157 (95.2%) |
| 45 to 54 Years | 225 (99.1%) | 208 (100.0%) |
| 55 to 64 Years | 322 (95.3%) | 273 (96.8%) |
| 65 to 74 Years | 98 (65.8%) | 186 (95.9%) |
| 75 Years and over | 144 (95.4%) | 200 (96.2%) |
| Total | 1,652 (91.9%) | 1,520 (95.7%) |
Income Below Poverty Among Married-Couple Families in Old Mystic
The poverty statistics for married-couple families in Old Mystic show that 2.9% or 24 of the total 814 families live below the poverty line. Families with 3 or 4 children have the highest poverty rate of 22.9%, comprising of 8 families. On the other hand, families with 1 or 2 children have the lowest poverty rate of 0.0%, which includes 0 families.
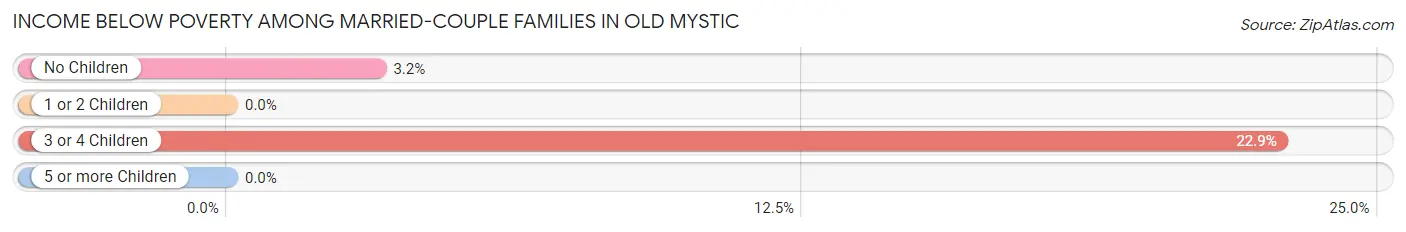
| Children | Above Poverty | Below Poverty |
| No Children | 479 (96.8%) | 16 (3.2%) |
| 1 or 2 Children | 284 (100.0%) | 0 (0.0%) |
| 3 or 4 Children | 27 (77.1%) | 8 (22.9%) |
| 5 or more Children | 0 (0.0%) | 0 (0.0%) |
| Total | 790 (97.1%) | 24 (2.9%) |
Income Below Poverty Among Single-Parent Households in Old Mystic
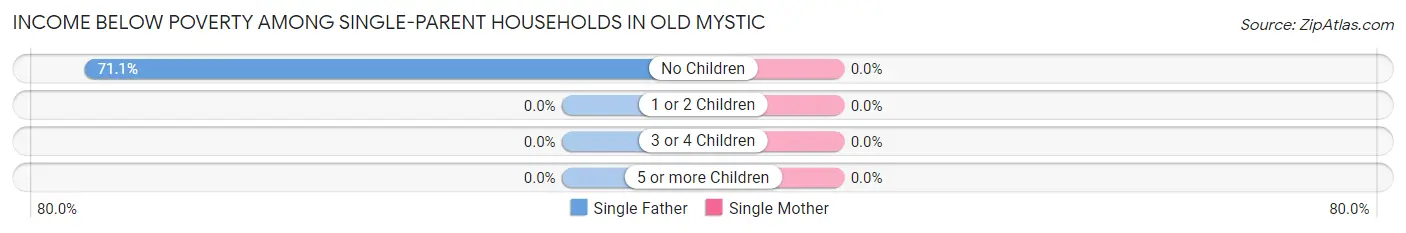
| Children | Single Father | Single Mother |
| No Children | 27 (71.1%) | 0 (0.0%) |
| 1 or 2 Children | 0 (0.0%) | 0 (0.0%) |
| 3 or 4 Children | 0 (0.0%) | 0 (0.0%) |
| 5 or more Children | 0 (0.0%) | 0 (0.0%) |
| Total | 27 (71.1%) | 0 (0.0%) |
Income Below Poverty Among Married-Couple vs Single-Parent Households in Old Mystic
The poverty data for Old Mystic shows that 24 of the married-couple family households (2.9%) and 27 of the single-parent households (16.1%) are living below the poverty level. Within the married-couple family households, those with 3 or 4 children have the highest poverty rate, with 8 households (22.9%) falling below the poverty line. Among the single-parent households, those with no children have the highest poverty rate, with 27 household (28.1%) living below poverty.
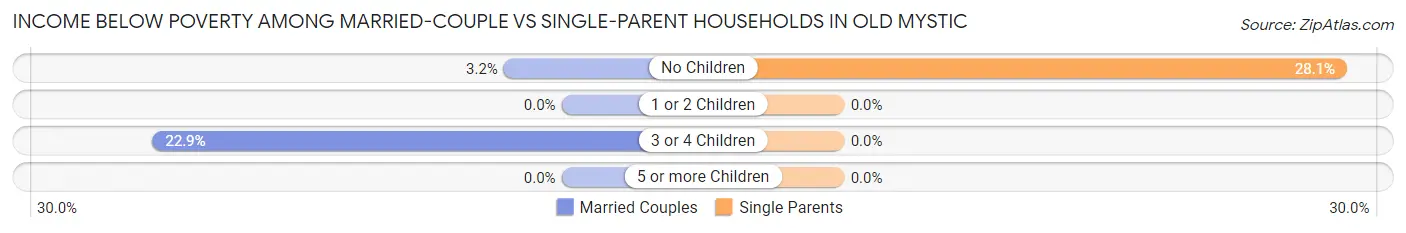
| Children | Married-Couple Families | Single-Parent Households |
| No Children | 16 (3.2%) | 27 (28.1%) |
| 1 or 2 Children | 0 (0.0%) | 0 (0.0%) |
| 3 or 4 Children | 8 (22.9%) | 0 (0.0%) |
| 5 or more Children | 0 (0.0%) | 0 (0.0%) |
| Total | 24 (2.9%) | 27 (16.1%) |
Race in Old Mystic
The most populous races in Old Mystic are White / Caucasian (2,883 | 85.2%), Asian (213 | 6.3%), and Two or more Races (191 | 5.6%).
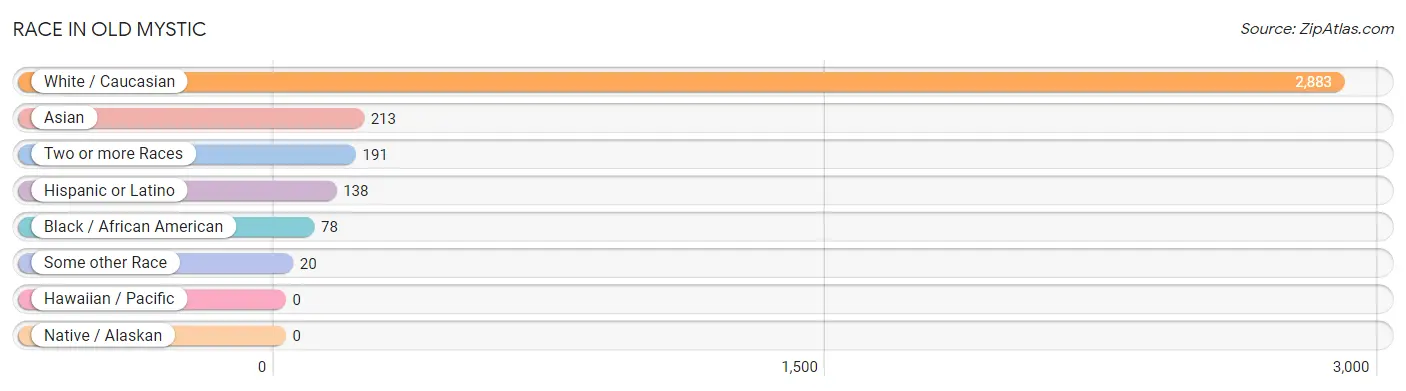
| Race | # Population | % Population |
| Asian | 213 | 6.3% |
| Black / African American | 78 | 2.3% |
| Hawaiian / Pacific | 0 | 0.0% |
| Hispanic or Latino | 138 | 4.1% |
| Native / Alaskan | 0 | 0.0% |
| White / Caucasian | 2,883 | 85.2% |
| Two or more Races | 191 | 5.6% |
| Some other Race | 20 | 0.6% |
| Total | 3,385 | 100.0% |
Ancestry in Old Mystic
The most populous ancestries reported in Old Mystic are Irish (654 | 19.3%), English (648 | 19.1%), Italian (466 | 13.8%), German (442 | 13.1%), and French (248 | 7.3%), together accounting for 72.6% of all Old Mystic residents.
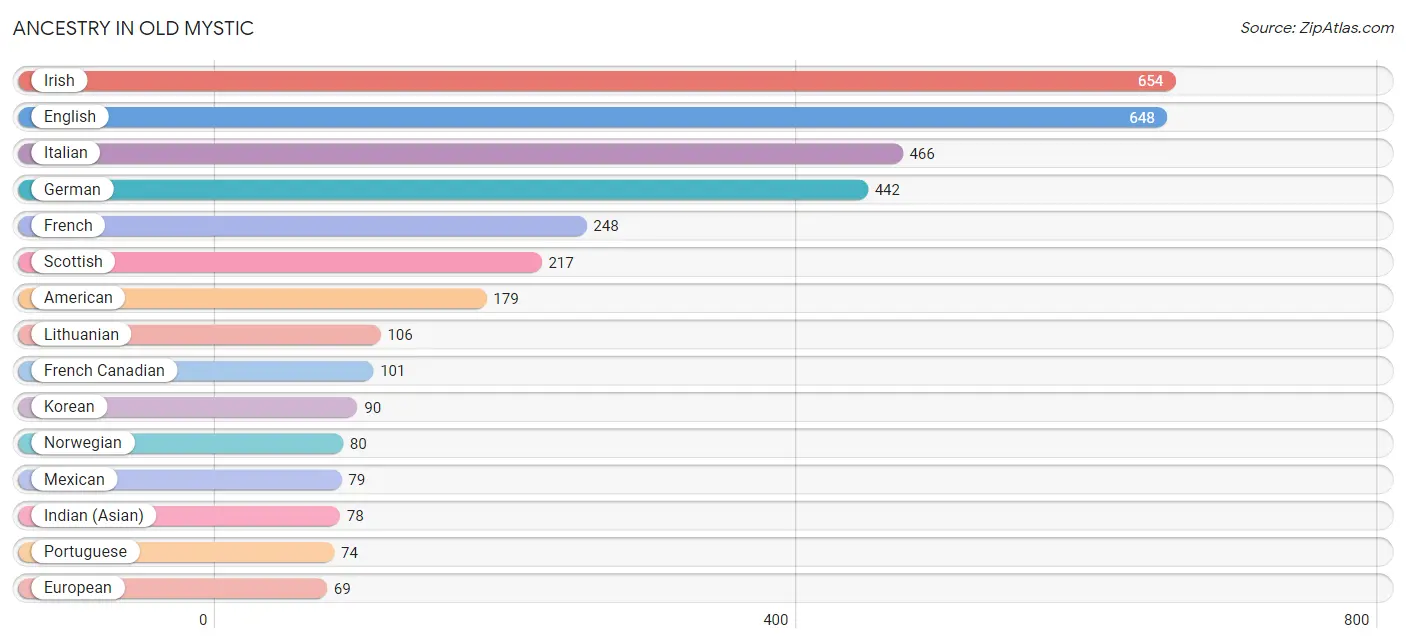
| Ancestry | # Population | % Population |
| American | 179 | 5.3% |
| Arab | 9 | 0.3% |
| Austrian | 31 | 0.9% |
| British | 35 | 1.0% |
| Canadian | 26 | 0.8% |
| Central American | 14 | 0.4% |
| Danish | 25 | 0.7% |
| Dutch | 54 | 1.6% |
| Eastern European | 13 | 0.4% |
| English | 648 | 19.1% |
| European | 69 | 2.0% |
| Finnish | 9 | 0.3% |
| French | 248 | 7.3% |
| French Canadian | 101 | 3.0% |
| German | 442 | 13.1% |
| Greek | 34 | 1.0% |
| Guamanian / Chamorro | 14 | 0.4% |
| Honduran | 7 | 0.2% |
| Hungarian | 9 | 0.3% |
| Indian (Asian) | 78 | 2.3% |
| Irish | 654 | 19.3% |
| Italian | 466 | 13.8% |
| Jamaican | 7 | 0.2% |
| Korean | 90 | 2.7% |
| Lithuanian | 106 | 3.1% |
| Mexican | 79 | 2.3% |
| Native Hawaiian | 12 | 0.4% |
| Norwegian | 80 | 2.4% |
| Panamanian | 7 | 0.2% |
| Peruvian | 24 | 0.7% |
| Polish | 59 | 1.7% |
| Portuguese | 74 | 2.2% |
| Puerto Rican | 21 | 0.6% |
| Scandinavian | 14 | 0.4% |
| Scotch-Irish | 34 | 1.0% |
| Scottish | 217 | 6.4% |
| Slovak | 11 | 0.3% |
| South American | 24 | 0.7% |
| Swedish | 51 | 1.5% |
| Syrian | 9 | 0.3% |
| Thai | 52 | 1.5% | View All 41 Rows |
Immigrants in Old Mystic
The most numerous immigrant groups reported in Old Mystic came from Asia (175 | 5.2%), Europe (136 | 4.0%), Philippines (106 | 3.1%), South Eastern Asia (106 | 3.1%), and Northern Europe (71 | 2.1%), together accounting for 17.5% of all Old Mystic residents.
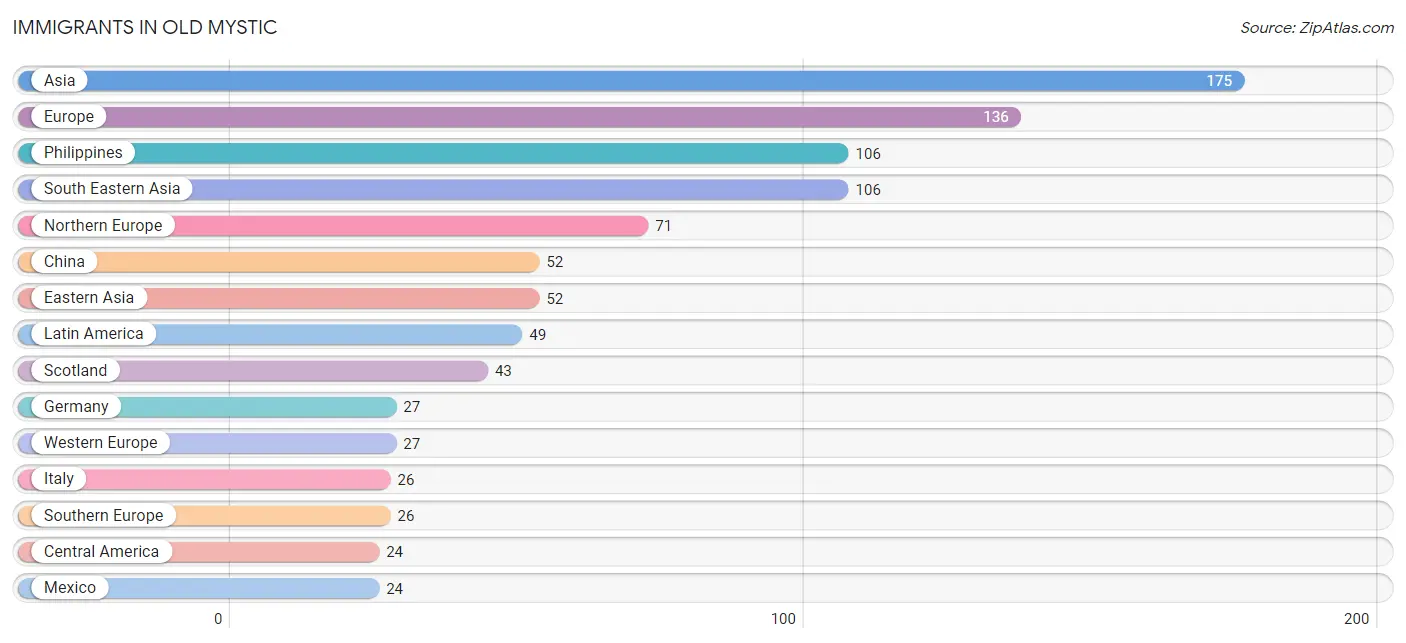
| Immigration Origin | # Population | % Population |
| Albania | 12 | 0.4% |
| Asia | 175 | 5.2% |
| Barbados | 12 | 0.4% |
| Caribbean | 19 | 0.6% |
| Central America | 24 | 0.7% |
| China | 52 | 1.5% |
| Eastern Asia | 52 | 1.5% |
| Eastern Europe | 12 | 0.4% |
| England | 7 | 0.2% |
| Europe | 136 | 4.0% |
| Germany | 27 | 0.8% |
| Hong Kong | 8 | 0.2% |
| India | 17 | 0.5% |
| Ireland | 21 | 0.6% |
| Italy | 26 | 0.8% |
| Jamaica | 7 | 0.2% |
| Latin America | 49 | 1.5% |
| Mexico | 24 | 0.7% |
| Northern Europe | 71 | 2.1% |
| Peru | 6 | 0.2% |
| Philippines | 106 | 3.1% |
| Scotland | 43 | 1.3% |
| South America | 6 | 0.2% |
| South Central Asia | 17 | 0.5% |
| South Eastern Asia | 106 | 3.1% |
| Southern Europe | 26 | 0.8% |
| Western Europe | 27 | 0.8% | View All 27 Rows |
Sex and Age in Old Mystic
Sex and Age in Old Mystic
The most populous age groups in Old Mystic are 60 to 64 Years (251 | 14.0%) for men and 60 to 64 Years (164 | 10.3%) for women.
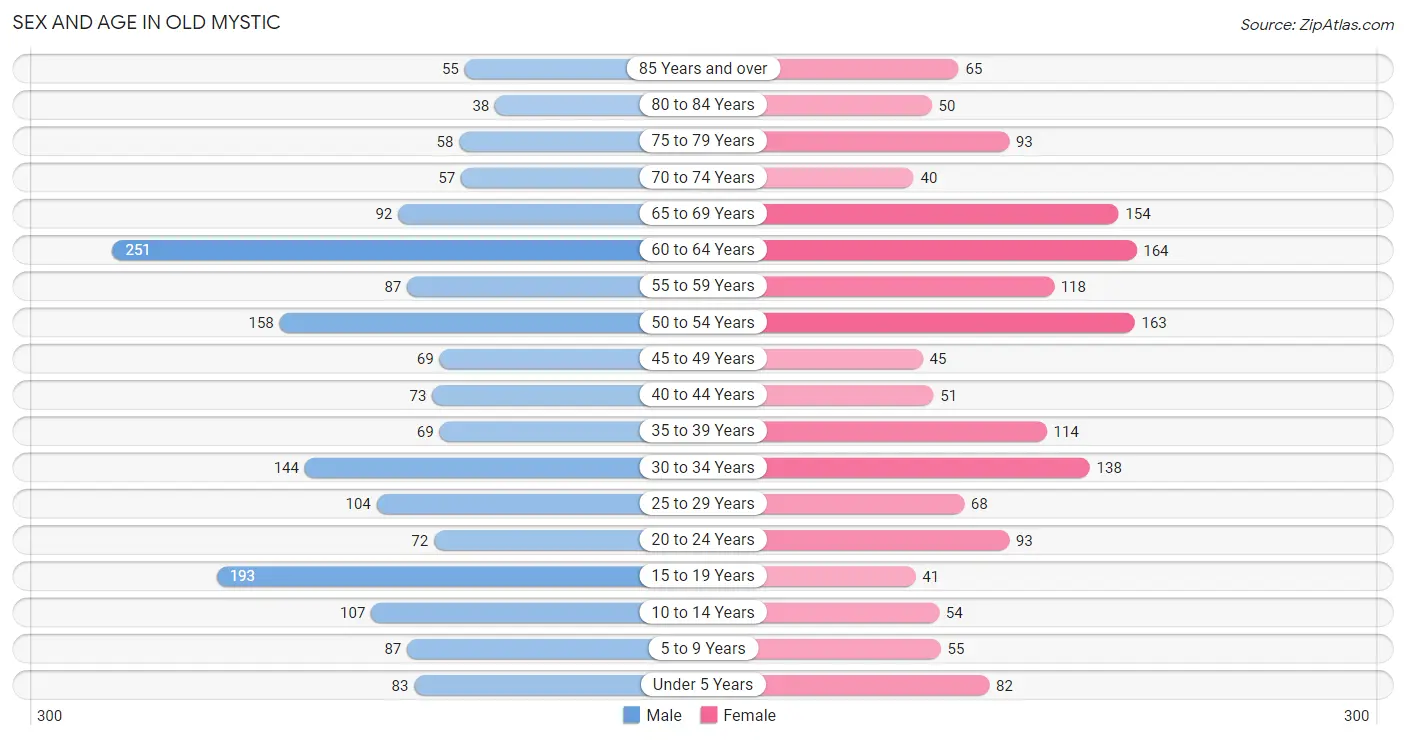
| Age Bracket | Male | Female |
| Under 5 Years | 83 (4.6%) | 82 (5.2%) |
| 5 to 9 Years | 87 (4.8%) | 55 (3.5%) |
| 10 to 14 Years | 107 (5.9%) | 54 (3.4%) |
| 15 to 19 Years | 193 (10.7%) | 41 (2.6%) |
| 20 to 24 Years | 72 (4.0%) | 93 (5.9%) |
| 25 to 29 Years | 104 (5.8%) | 68 (4.3%) |
| 30 to 34 Years | 144 (8.0%) | 138 (8.7%) |
| 35 to 39 Years | 69 (3.8%) | 114 (7.2%) |
| 40 to 44 Years | 73 (4.1%) | 51 (3.2%) |
| 45 to 49 Years | 69 (3.8%) | 45 (2.8%) |
| 50 to 54 Years | 158 (8.8%) | 163 (10.3%) |
| 55 to 59 Years | 87 (4.8%) | 118 (7.4%) |
| 60 to 64 Years | 251 (14.0%) | 164 (10.3%) |
| 65 to 69 Years | 92 (5.1%) | 154 (9.7%) |
| 70 to 74 Years | 57 (3.2%) | 40 (2.5%) |
| 75 to 79 Years | 58 (3.2%) | 93 (5.9%) |
| 80 to 84 Years | 38 (2.1%) | 50 (3.2%) |
| 85 Years and over | 55 (3.1%) | 65 (4.1%) |
| Total | 1,797 (100.0%) | 1,588 (100.0%) |
Families and Households in Old Mystic
Median Family Size in Old Mystic
The median family size in Old Mystic is 2.97 persons per family, with married-couple families (814 | 82.9%) accounting for the largest median family size of 3.04 persons per family. On the other hand, single male/father families (38 | 3.9%) represent the smallest median family size with 2.16 persons per family.
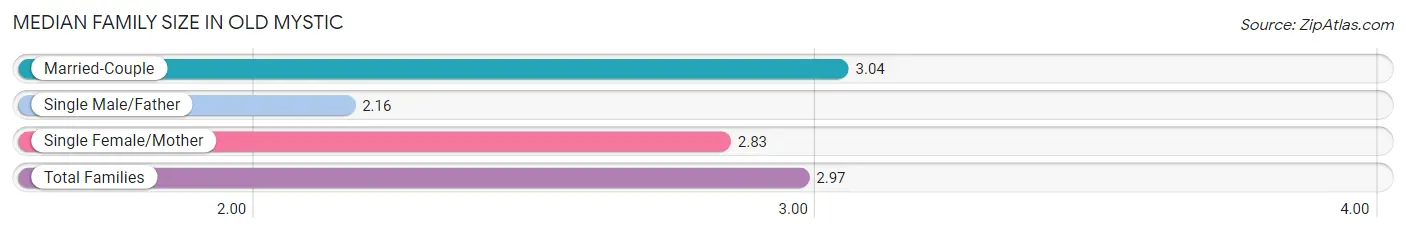
| Family Type | # Families | Family Size |
| Married-Couple | 814 (82.9%) | 3.04 |
| Single Male/Father | 38 (3.9%) | 2.16 |
| Single Female/Mother | 130 (13.2%) | 2.83 |
| Total Families | 982 (100.0%) | 2.97 |
Median Household Size in Old Mystic
The median household size in Old Mystic is 2.57 persons per household, with single female/mother households (130 | 9.9%) accounting for the largest median household size of 3.25 persons per household. non-family households (329 | 25.1%) represent the smallest median household size with 1.15 persons per household.
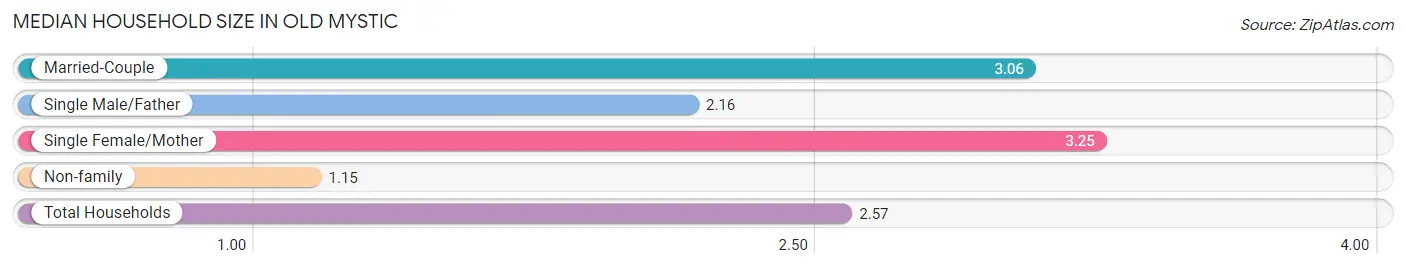
| Household Type | # Households | Household Size |
| Married-Couple | 814 (62.1%) | 3.06 |
| Single Male/Father | 38 (2.9%) | 2.16 |
| Single Female/Mother | 130 (9.9%) | 3.25 |
| Non-family | 329 (25.1%) | 1.15 |
| Total Households | 1,311 (100.0%) | 2.57 |
Household Size by Marriage Status in Old Mystic
Out of a total of 1,311 households in Old Mystic, 982 (74.9%) are family households, while 329 (25.1%) are nonfamily households. The most numerous type of family households are 2-person households, comprising 466, and the most common type of nonfamily households are 1-person households, comprising 280.
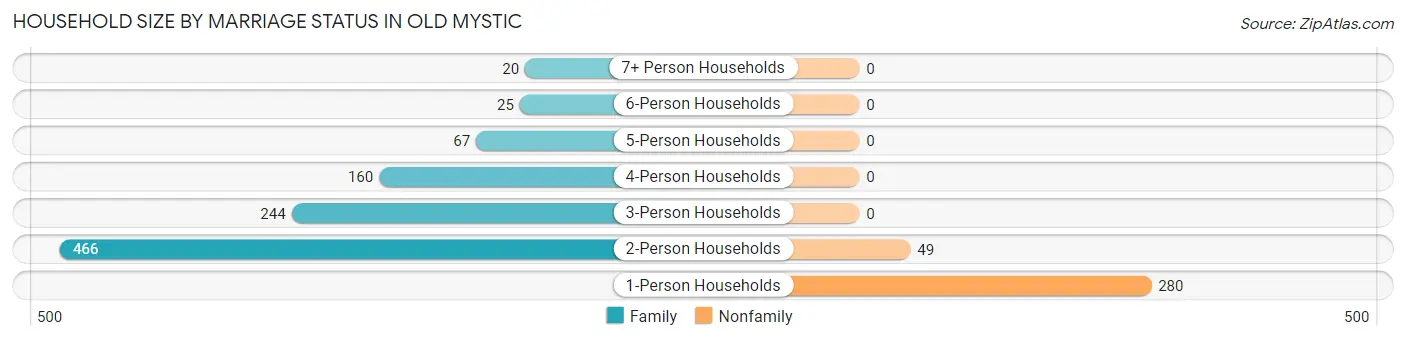
| Household Size | Family Households | Nonfamily Households |
| 1-Person Households | - | 280 (21.4%) |
| 2-Person Households | 466 (35.5%) | 49 (3.7%) |
| 3-Person Households | 244 (18.6%) | 0 (0.0%) |
| 4-Person Households | 160 (12.2%) | 0 (0.0%) |
| 5-Person Households | 67 (5.1%) | 0 (0.0%) |
| 6-Person Households | 25 (1.9%) | 0 (0.0%) |
| 7+ Person Households | 20 (1.5%) | 0 (0.0%) |
| Total | 982 (74.9%) | 329 (25.1%) |
Female Fertility in Old Mystic
Fertility by Age in Old Mystic
Average fertility rate in Old Mystic is 53.0 births per 1,000 women. Women in the age bracket of 20 to 34 years have the highest fertility rate with 70.0 births per 1,000 women. Women in the age bracket of 20 to 34 years acount for 65.6% of all women with births.
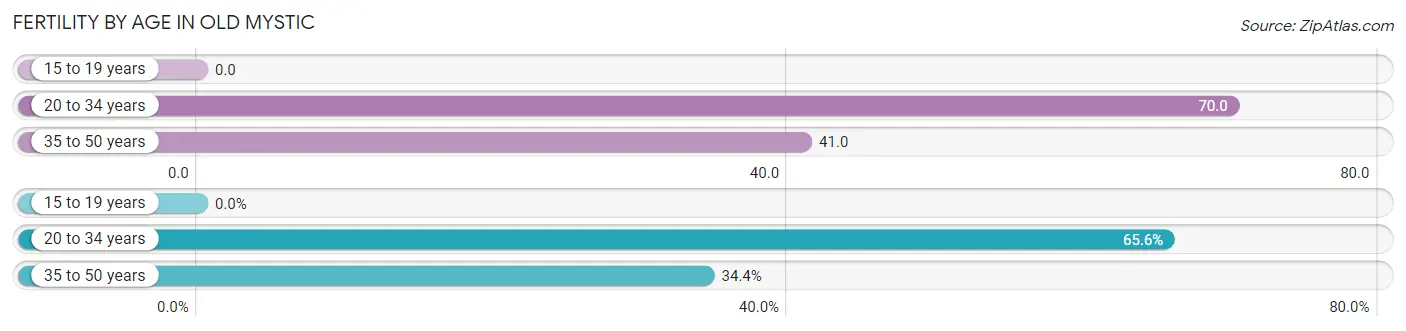
| Age Bracket | Women with Births | Births / 1,000 Women |
| 15 to 19 years | 0 (0.0%) | 0.0 |
| 20 to 34 years | 21 (65.6%) | 70.0 |
| 35 to 50 years | 11 (34.4%) | 41.0 |
| Total | 32 (100.0%) | 53.0 |
Fertility by Age by Marriage Status in Old Mystic
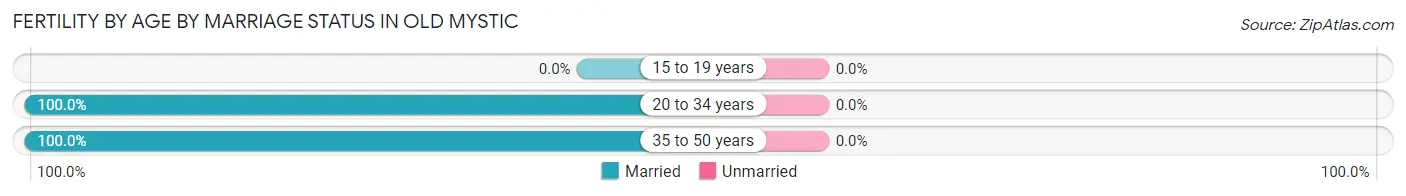
| Age Bracket | Married | Unmarried |
| 15 to 19 years | 0 (0.0%) | 0 (0.0%) |
| 20 to 34 years | 21 (100.0%) | 0 (0.0%) |
| 35 to 50 years | 11 (100.0%) | 0 (0.0%) |
| Total | 32 (100.0%) | 0 (0.0%) |
Fertility by Education in Old Mystic
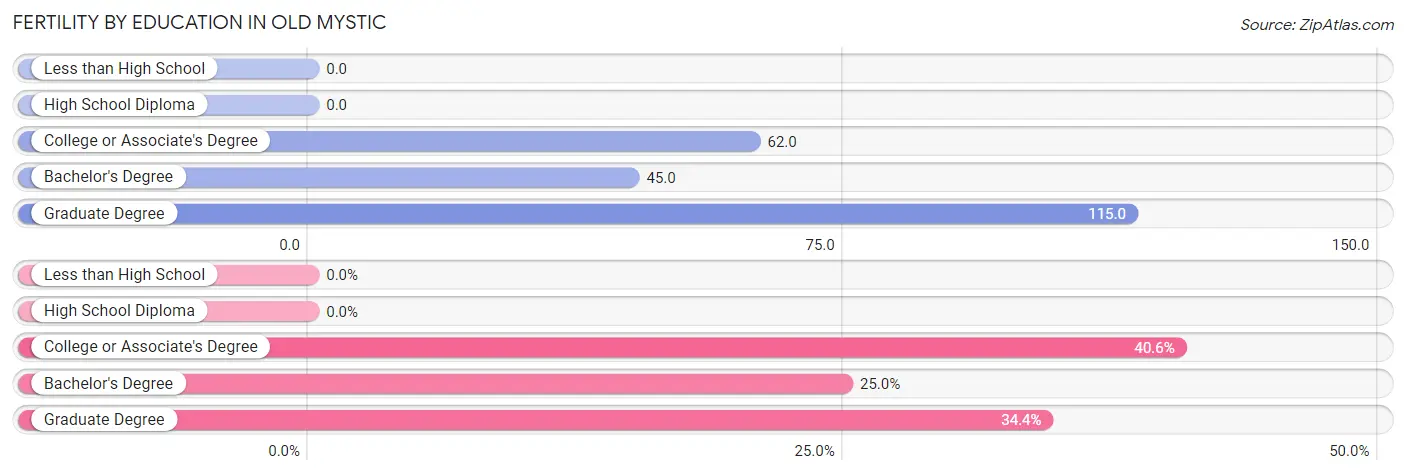
| Educational Attainment | Women with Births | Births / 1,000 Women |
| Less than High School | 0 (0.0%) | 0.0 |
| High School Diploma | 0 (0.0%) | 0.0 |
| College or Associate's Degree | 13 (40.6%) | 62.0 |
| Bachelor's Degree | 8 (25.0%) | 45.0 |
| Graduate Degree | 11 (34.4%) | 115.0 |
| Total | 32 (100.0%) | 53.0 |
Fertility by Education by Marriage Status in Old Mystic
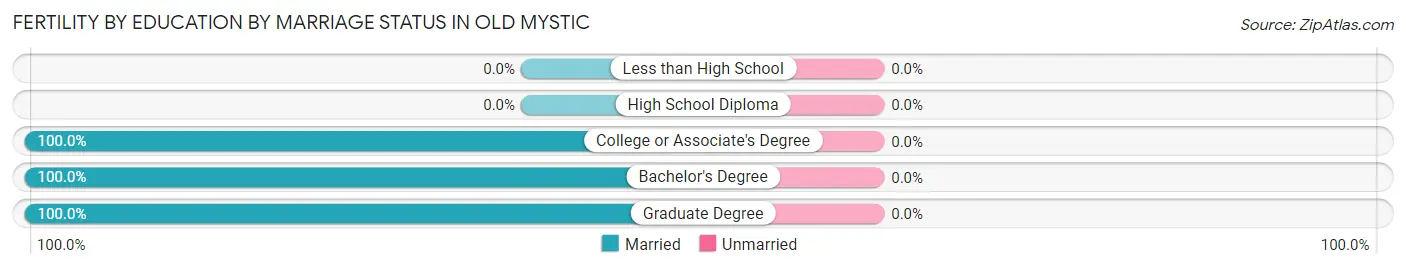
| Educational Attainment | Married | Unmarried |
| Less than High School | 0 (0.0%) | 0 (0.0%) |
| High School Diploma | 0 (0.0%) | 0 (0.0%) |
| College or Associate's Degree | 13 (100.0%) | 0 (0.0%) |
| Bachelor's Degree | 8 (100.0%) | 0 (0.0%) |
| Graduate Degree | 11 (100.0%) | 0 (0.0%) |
| Total | 32 (100.0%) | 0 (0.0%) |
Employment Characteristics in Old Mystic
Employment by Class of Employer in Old Mystic
Among the 1,588 employed individuals in Old Mystic, private company employees (1,011 | 63.7%), not-for-profit organizations (190 | 12.0%), and federal government employees (141 | 8.9%) make up the most common classes of employment.
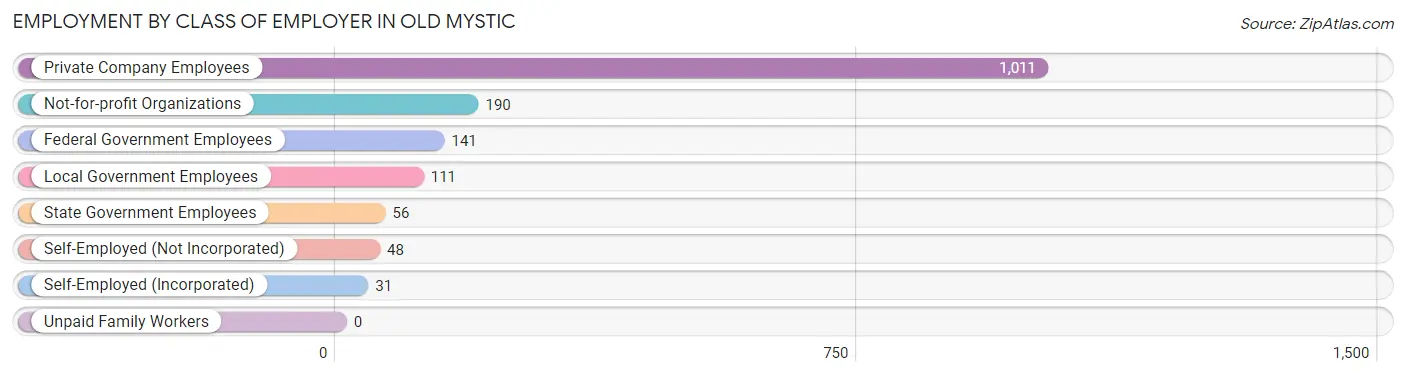
| Employer Class | # Employees | % Employees |
| Private Company Employees | 1,011 | 63.7% |
| Self-Employed (Incorporated) | 31 | 1.9% |
| Self-Employed (Not Incorporated) | 48 | 3.0% |
| Not-for-profit Organizations | 190 | 12.0% |
| Local Government Employees | 111 | 7.0% |
| State Government Employees | 56 | 3.5% |
| Federal Government Employees | 141 | 8.9% |
| Unpaid Family Workers | 0 | 0.0% |
| Total | 1,588 | 100.0% |
Employment Status by Age in Old Mystic
According to the labor force statistics for Old Mystic, out of the total population over 16 years of age (2,805), 63.1% or 1,770 individuals are in the labor force, with 5.6% or 99 of them unemployed. The age group with the highest labor force participation rate is 25 to 29 years, with 94.2% or 162 individuals in the labor force. Within the labor force, the 25 to 29 years age range has the highest percentage of unemployed individuals, with 21.0% or 34 of them being unemployed.
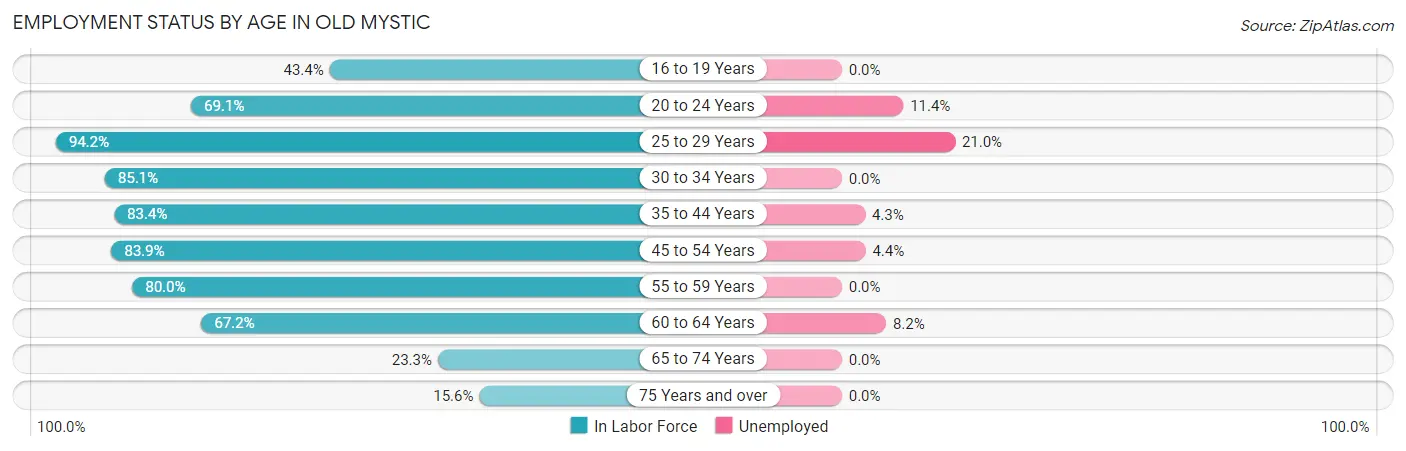
| Age Bracket | In Labor Force | Unemployed |
| 16 to 19 Years | 53 (43.4%) | 0 (0.0%) |
| 20 to 24 Years | 114 (69.1%) | 13 (11.4%) |
| 25 to 29 Years | 162 (94.2%) | 34 (21.0%) |
| 30 to 34 Years | 240 (85.1%) | 0 (0.0%) |
| 35 to 44 Years | 256 (83.4%) | 11 (4.3%) |
| 45 to 54 Years | 365 (83.9%) | 16 (4.4%) |
| 55 to 59 Years | 164 (80.0%) | 0 (0.0%) |
| 60 to 64 Years | 279 (67.2%) | 23 (8.2%) |
| 65 to 74 Years | 80 (23.3%) | 0 (0.0%) |
| 75 Years and over | 56 (15.6%) | 0 (0.0%) |
| Total | 1,770 (63.1%) | 99 (5.6%) |
Employment Status by Educational Attainment in Old Mystic
According to labor force statistics for Old Mystic, 80.7% of individuals (1,466) out of the total population between 25 and 64 years of age (1,816) are in the labor force, with 5.9% or 86 of them being unemployed. The group with the highest labor force participation rate are those with the educational attainment of bachelor's degree or higher, with 84.7% or 715 individuals in the labor force. Within the labor force, individuals with college / associate degree education have the highest percentage of unemployment, with 7.0% or 36 of them being unemployed.
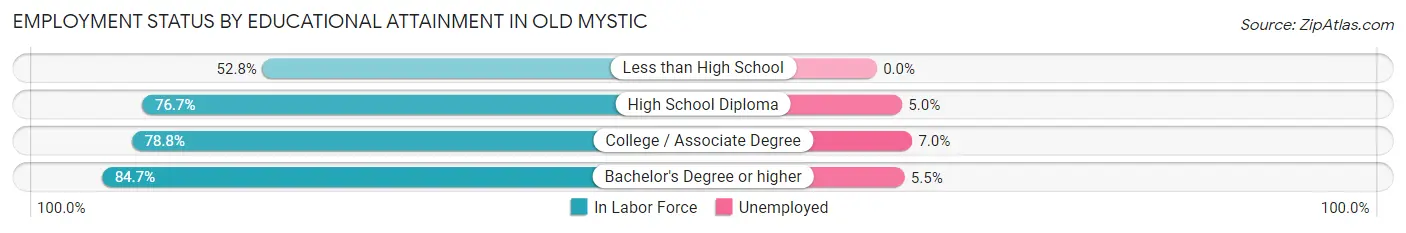
| Educational Attainment | In Labor Force | Unemployed |
| Less than High School | 19 (52.8%) | 0 (0.0%) |
| High School Diploma | 211 (76.7%) | 14 (5.0%) |
| College / Associate Degree | 521 (78.8%) | 46 (7.0%) |
| Bachelor's Degree or higher | 715 (84.7%) | 46 (5.5%) |
| Total | 1,466 (80.7%) | 107 (5.9%) |
Employment Occupations by Sex in Old Mystic
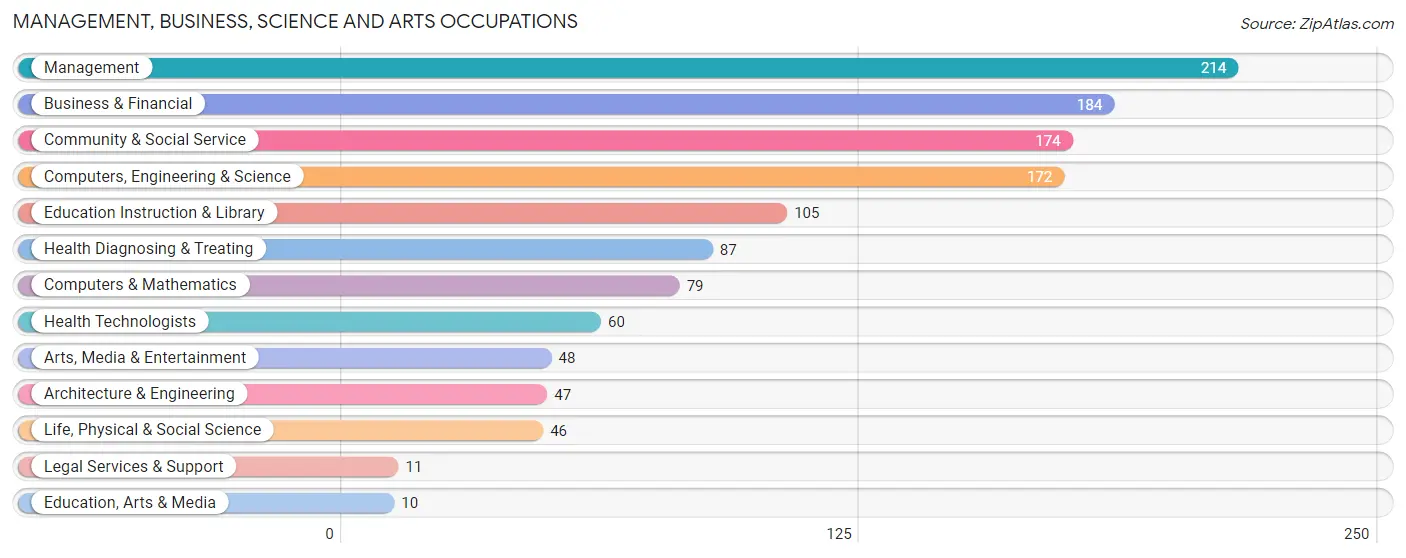
Management, Business, Science and Arts Occupations
The most common Management, Business, Science and Arts occupations in Old Mystic are Management (214 | 13.2%), Business & Financial (184 | 11.3%), Community & Social Service (174 | 10.7%), Computers, Engineering & Science (172 | 10.6%), and Education Instruction & Library (105 | 6.5%).
Management, Business, Science and Arts Occupations by Sex
Within the Management, Business, Science and Arts occupations in Old Mystic, the most male-oriented occupations are Architecture & Engineering (100.0%), Legal Services & Support (100.0%), and Arts, Media & Entertainment (83.3%), while the most female-oriented occupations are Education, Arts & Media (100.0%), Health Diagnosing & Treating (100.0%), and Health Technologists (100.0%).
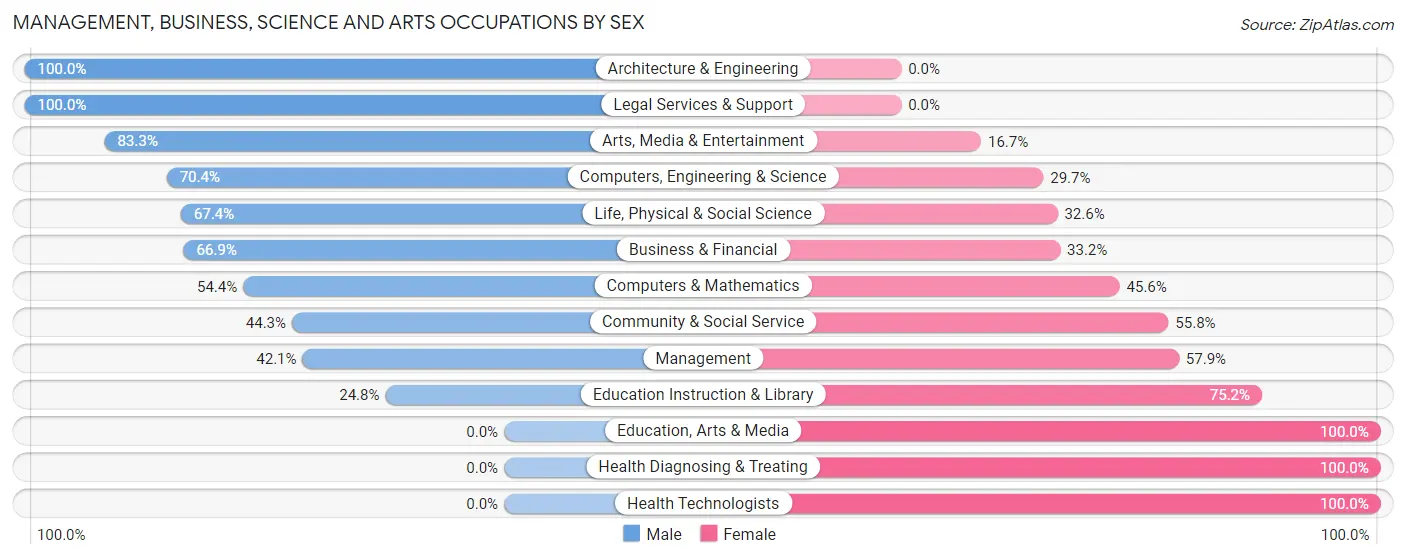
| Occupation | Male | Female |
| Management | 90 (42.1%) | 124 (57.9%) |
| Business & Financial | 123 (66.8%) | 61 (33.2%) |
| Computers, Engineering & Science | 121 (70.4%) | 51 (29.6%) |
| Computers & Mathematics | 43 (54.4%) | 36 (45.6%) |
| Architecture & Engineering | 47 (100.0%) | 0 (0.0%) |
| Life, Physical & Social Science | 31 (67.4%) | 15 (32.6%) |
| Community & Social Service | 77 (44.3%) | 97 (55.7%) |
| Education, Arts & Media | 0 (0.0%) | 10 (100.0%) |
| Legal Services & Support | 11 (100.0%) | 0 (0.0%) |
| Education Instruction & Library | 26 (24.8%) | 79 (75.2%) |
| Arts, Media & Entertainment | 40 (83.3%) | 8 (16.7%) |
| Health Diagnosing & Treating | 0 (0.0%) | 87 (100.0%) |
| Health Technologists | 0 (0.0%) | 60 (100.0%) |
| Total (Category) | 411 (49.5%) | 420 (50.5%) |
| Total (Overall) | 854 (52.5%) | 771 (47.4%) |
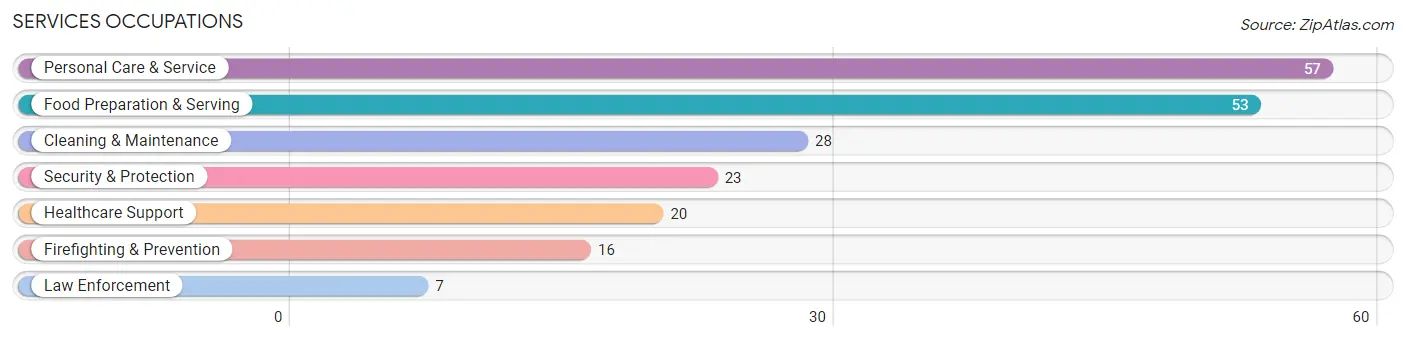
Services Occupations
The most common Services occupations in Old Mystic are Personal Care & Service (57 | 3.5%), Food Preparation & Serving (53 | 3.3%), Cleaning & Maintenance (28 | 1.7%), Security & Protection (23 | 1.4%), and Healthcare Support (20 | 1.2%).
Services Occupations by Sex
Within the Services occupations in Old Mystic, the most male-oriented occupations are Security & Protection (100.0%), Firefighting & Prevention (100.0%), and Law Enforcement (100.0%), while the most female-oriented occupations are Personal Care & Service (82.5%), Healthcare Support (65.0%), and Cleaning & Maintenance (57.1%).
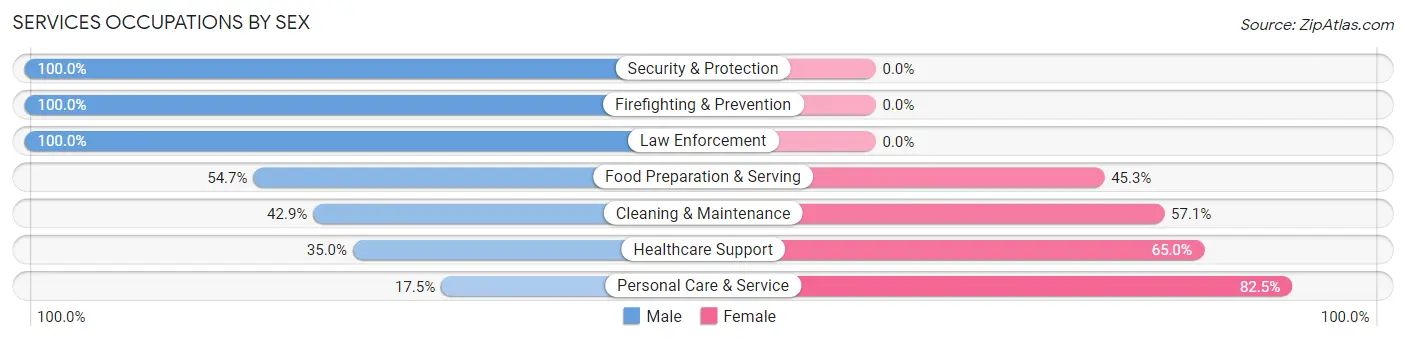
| Occupation | Male | Female |
| Healthcare Support | 7 (35.0%) | 13 (65.0%) |
| Security & Protection | 23 (100.0%) | 0 (0.0%) |
| Firefighting & Prevention | 16 (100.0%) | 0 (0.0%) |
| Law Enforcement | 7 (100.0%) | 0 (0.0%) |
| Food Preparation & Serving | 29 (54.7%) | 24 (45.3%) |
| Cleaning & Maintenance | 12 (42.9%) | 16 (57.1%) |
| Personal Care & Service | 10 (17.5%) | 47 (82.5%) |
| Total (Category) | 81 (44.8%) | 100 (55.2%) |
| Total (Overall) | 854 (52.5%) | 771 (47.4%) |
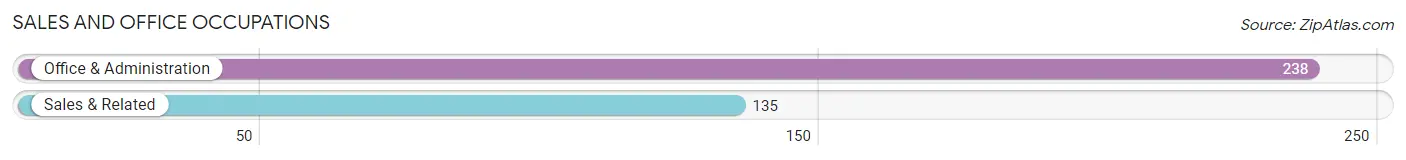
Sales and Office Occupations
The most common Sales and Office occupations in Old Mystic are Office & Administration (238 | 14.6%), and Sales & Related (135 | 8.3%).
Sales and Office Occupations by Sex
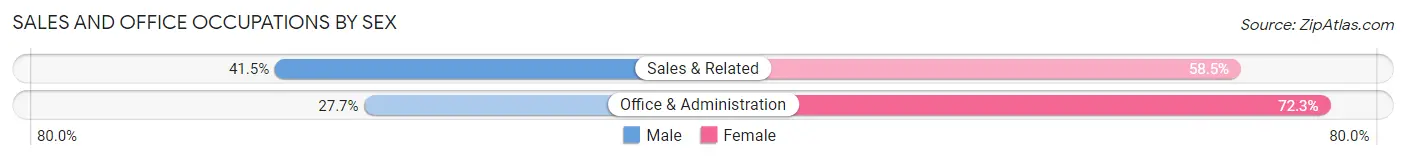
| Occupation | Male | Female |
| Sales & Related | 56 (41.5%) | 79 (58.5%) |
| Office & Administration | 66 (27.7%) | 172 (72.3%) |
| Total (Category) | 122 (32.7%) | 251 (67.3%) |
| Total (Overall) | 854 (52.5%) | 771 (47.4%) |
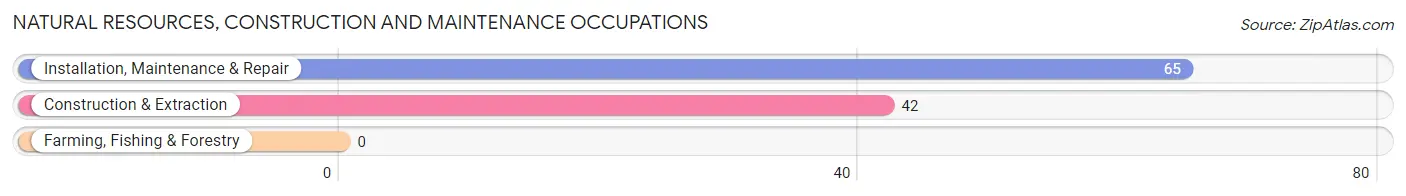
Natural Resources, Construction and Maintenance Occupations
The most common Natural Resources, Construction and Maintenance occupations in Old Mystic are Installation, Maintenance & Repair (65 | 4.0%), and Construction & Extraction (42 | 2.6%).
Natural Resources, Construction and Maintenance Occupations by Sex
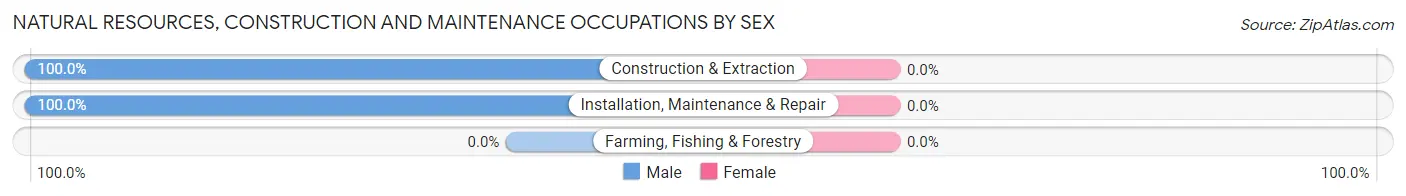
| Occupation | Male | Female |
| Farming, Fishing & Forestry | 0 (0.0%) | 0 (0.0%) |
| Construction & Extraction | 42 (100.0%) | 0 (0.0%) |
| Installation, Maintenance & Repair | 65 (100.0%) | 0 (0.0%) |
| Total (Category) | 107 (100.0%) | 0 (0.0%) |
| Total (Overall) | 854 (52.5%) | 771 (47.4%) |
Production, Transportation and Moving Occupations
The most common Production, Transportation and Moving occupations in Old Mystic are Production (106 | 6.5%), Transportation (17 | 1.1%), and Material Moving (10 | 0.6%).
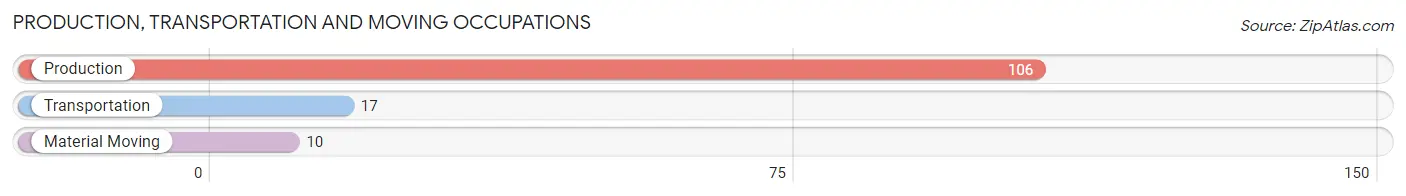
Production, Transportation and Moving Occupations by Sex
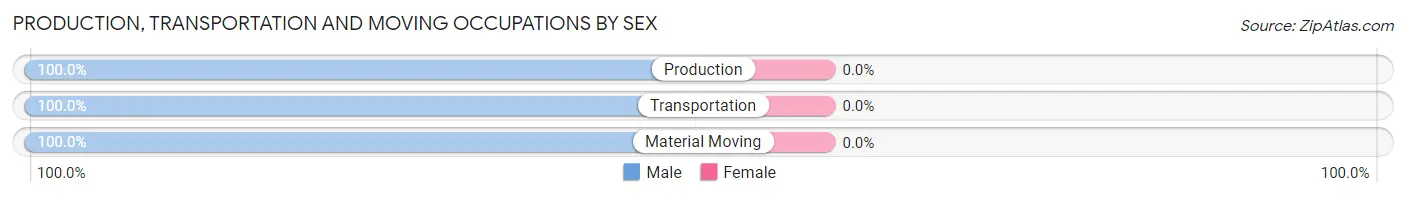
| Occupation | Male | Female |
| Production | 106 (100.0%) | 0 (0.0%) |
| Transportation | 17 (100.0%) | 0 (0.0%) |
| Material Moving | 10 (100.0%) | 0 (0.0%) |
| Total (Category) | 133 (100.0%) | 0 (0.0%) |
| Total (Overall) | 854 (52.5%) | 771 (47.4%) |
Employment Industries by Sex in Old Mystic
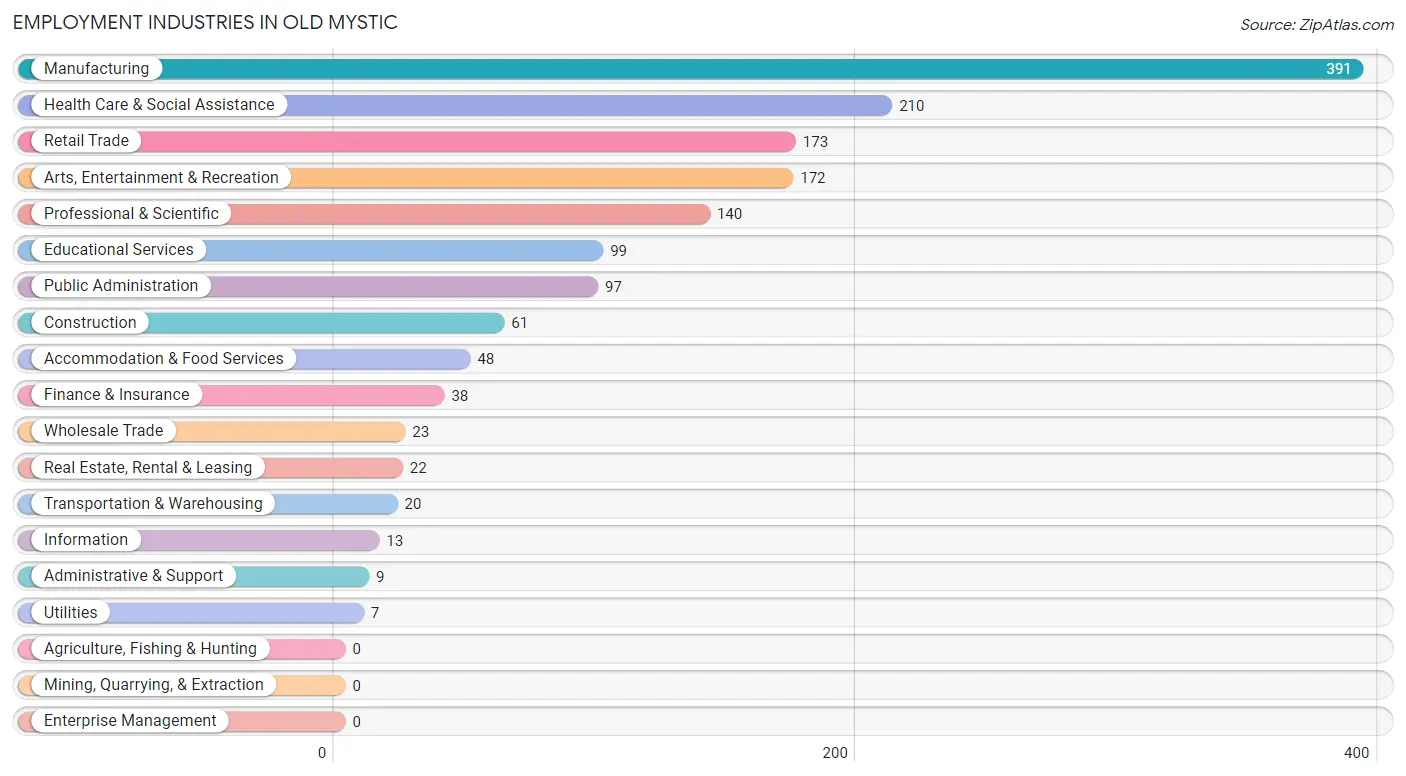
Employment Industries in Old Mystic
The major employment industries in Old Mystic include Manufacturing (391 | 24.1%), Health Care & Social Assistance (210 | 12.9%), Retail Trade (173 | 10.6%), Arts, Entertainment & Recreation (172 | 10.6%), and Professional & Scientific (140 | 8.6%).
Employment Industries by Sex in Old Mystic
The Old Mystic industries that see more men than women are Construction (100.0%), Wholesale Trade (100.0%), and Transportation & Warehousing (100.0%), whereas the industries that tend to have a higher number of women are Finance & Insurance (100.0%), Health Care & Social Assistance (82.9%), and Educational Services (66.7%).
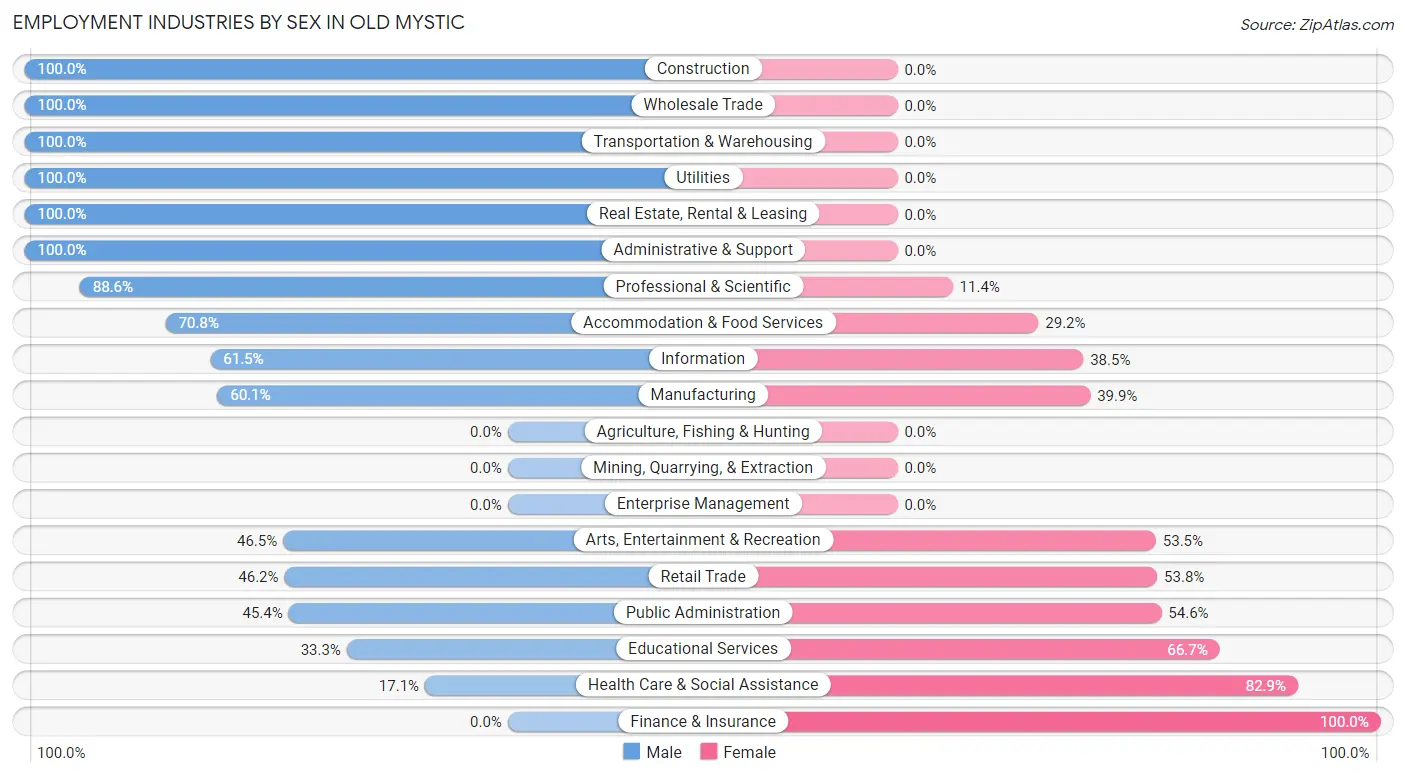
| Industry | Male | Female |
| Agriculture, Fishing & Hunting | 0 (0.0%) | 0 (0.0%) |
| Mining, Quarrying, & Extraction | 0 (0.0%) | 0 (0.0%) |
| Construction | 61 (100.0%) | 0 (0.0%) |
| Manufacturing | 235 (60.1%) | 156 (39.9%) |
| Wholesale Trade | 23 (100.0%) | 0 (0.0%) |
| Retail Trade | 80 (46.2%) | 93 (53.8%) |
| Transportation & Warehousing | 20 (100.0%) | 0 (0.0%) |
| Utilities | 7 (100.0%) | 0 (0.0%) |
| Information | 8 (61.5%) | 5 (38.5%) |
| Finance & Insurance | 0 (0.0%) | 38 (100.0%) |
| Real Estate, Rental & Leasing | 22 (100.0%) | 0 (0.0%) |
| Professional & Scientific | 124 (88.6%) | 16 (11.4%) |
| Enterprise Management | 0 (0.0%) | 0 (0.0%) |
| Administrative & Support | 9 (100.0%) | 0 (0.0%) |
| Educational Services | 33 (33.3%) | 66 (66.7%) |
| Health Care & Social Assistance | 36 (17.1%) | 174 (82.9%) |
| Arts, Entertainment & Recreation | 80 (46.5%) | 92 (53.5%) |
| Accommodation & Food Services | 34 (70.8%) | 14 (29.2%) |
| Public Administration | 44 (45.4%) | 53 (54.6%) |
| Total | 854 (52.5%) | 771 (47.4%) |
Education in Old Mystic
School Enrollment in Old Mystic
The most common levels of schooling among the 757 students in Old Mystic are high school (224 | 29.6%), college / undergraduate (157 | 20.7%), and middle school (143 | 18.9%).
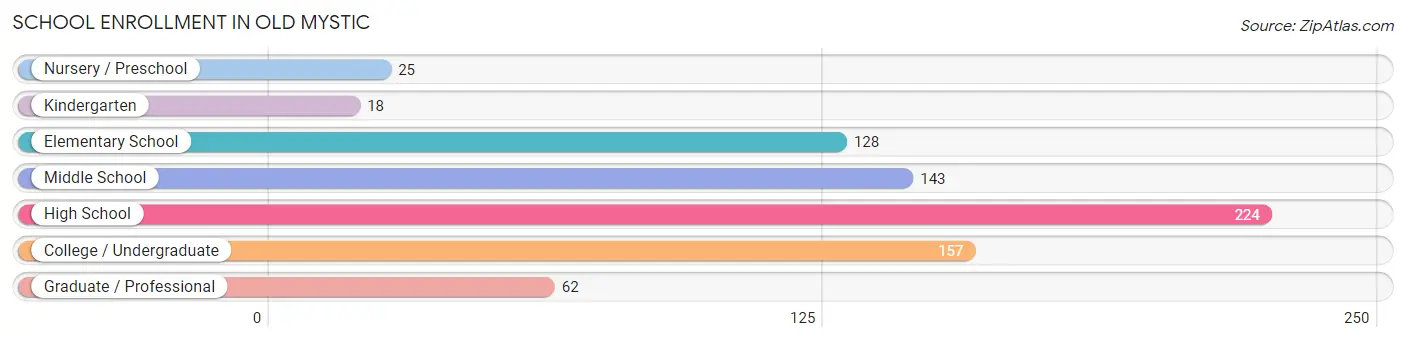
| School Level | # Students | % Students |
| Nursery / Preschool | 25 | 3.3% |
| Kindergarten | 18 | 2.4% |
| Elementary School | 128 | 16.9% |
| Middle School | 143 | 18.9% |
| High School | 224 | 29.6% |
| College / Undergraduate | 157 | 20.7% |
| Graduate / Professional | 62 | 8.2% |
| Total | 757 | 100.0% |
School Enrollment by Age by Funding Source in Old Mystic
Out of a total of 757 students who are enrolled in schools in Old Mystic, 156 (20.6%) attend a private institution, while the remaining 601 (79.4%) are enrolled in public schools. The age group of 3 to 4 year olds has the highest likelihood of being enrolled in private schools, with 17 (58.6% in the age bracket) enrolled. Conversely, the age group of 5 to 9 year old has the lowest likelihood of being enrolled in a private school, with 142 (100.0% in the age bracket) attending a public institution.
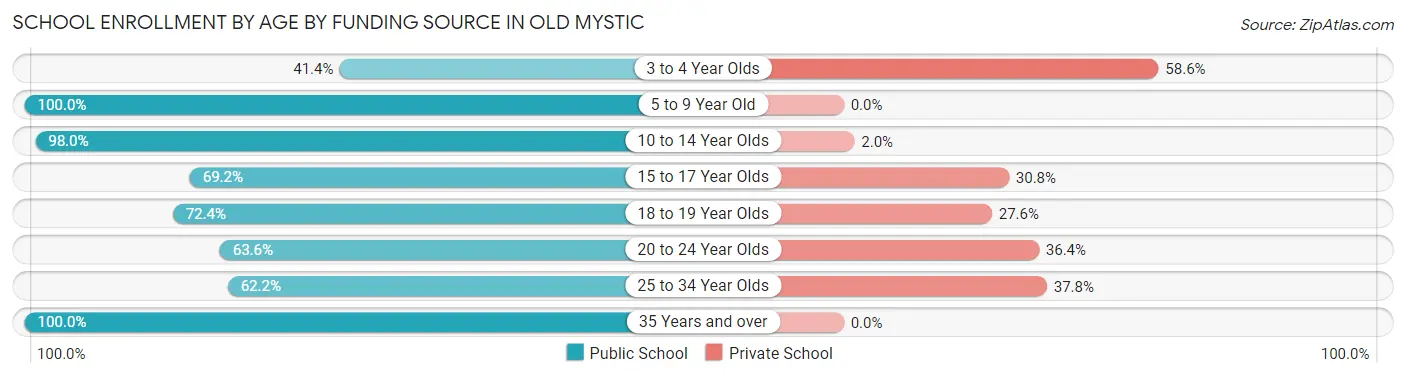
| Age Bracket | Public School | Private School |
| 3 to 4 Year Olds | 12 (41.4%) | 17 (58.6%) |
| 5 to 9 Year Old | 142 (100.0%) | 0 (0.0%) |
| 10 to 14 Year Olds | 148 (98.0%) | 3 (2.0%) |
| 15 to 17 Year Olds | 135 (69.2%) | 60 (30.8%) |
| 18 to 19 Year Olds | 21 (72.4%) | 8 (27.6%) |
| 20 to 24 Year Olds | 70 (63.6%) | 40 (36.4%) |
| 25 to 34 Year Olds | 46 (62.2%) | 28 (37.8%) |
| 35 Years and over | 27 (100.0%) | 0 (0.0%) |
| Total | 601 (79.4%) | 156 (20.6%) |
Educational Attainment by Field of Study in Old Mystic
Business (144 | 13.5%), bio, nature & agricultural (130 | 12.1%), social sciences (121 | 11.3%), liberal arts & history (106 | 9.9%), and education (105 | 9.8%) are the most common fields of study among 1,071 individuals in Old Mystic who have obtained a bachelor's degree or higher.
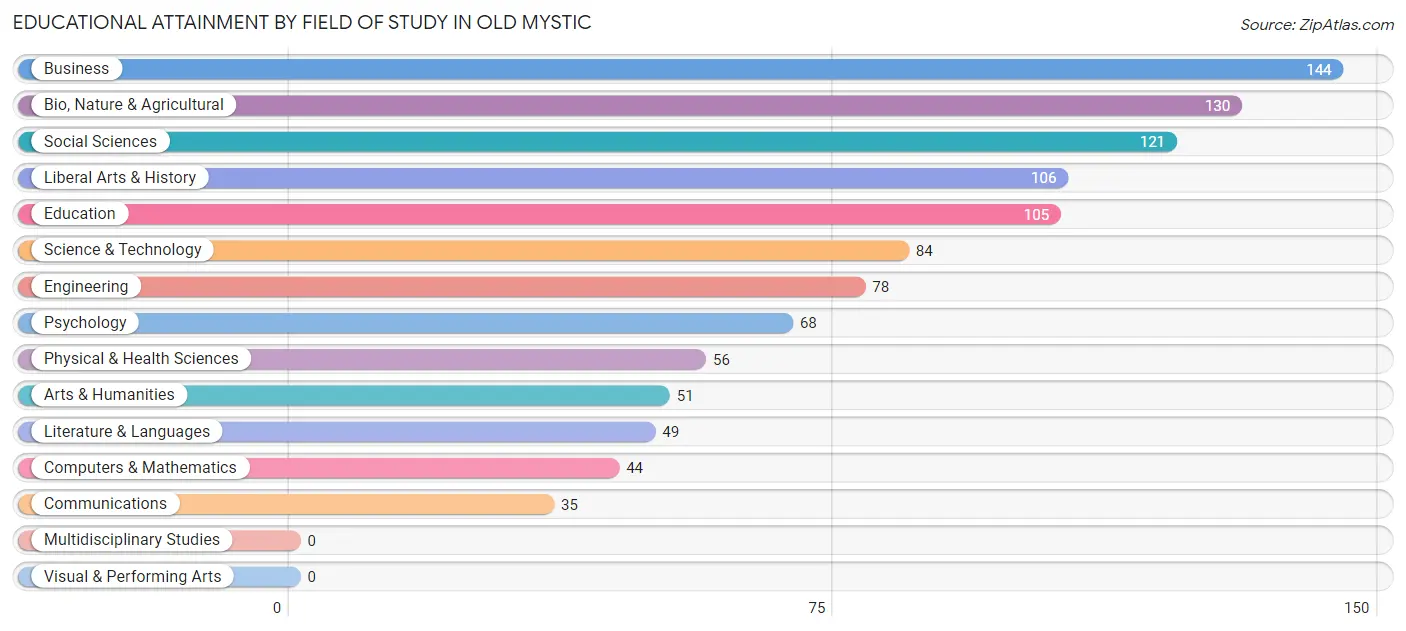
| Field of Study | # Graduates | % Graduates |
| Computers & Mathematics | 44 | 4.1% |
| Bio, Nature & Agricultural | 130 | 12.1% |
| Physical & Health Sciences | 56 | 5.2% |
| Psychology | 68 | 6.4% |
| Social Sciences | 121 | 11.3% |
| Engineering | 78 | 7.3% |
| Multidisciplinary Studies | 0 | 0.0% |
| Science & Technology | 84 | 7.8% |
| Business | 144 | 13.5% |
| Education | 105 | 9.8% |
| Literature & Languages | 49 | 4.6% |
| Liberal Arts & History | 106 | 9.9% |
| Visual & Performing Arts | 0 | 0.0% |
| Communications | 35 | 3.3% |
| Arts & Humanities | 51 | 4.8% |
| Total | 1,071 | 100.0% |
Transportation & Commute in Old Mystic
Vehicle Availability by Sex in Old Mystic
The most prevalent vehicle ownership categories in Old Mystic are males with 2 vehicles (374, accounting for 43.0%) and females with 2 vehicles (288, making up 52.0%).
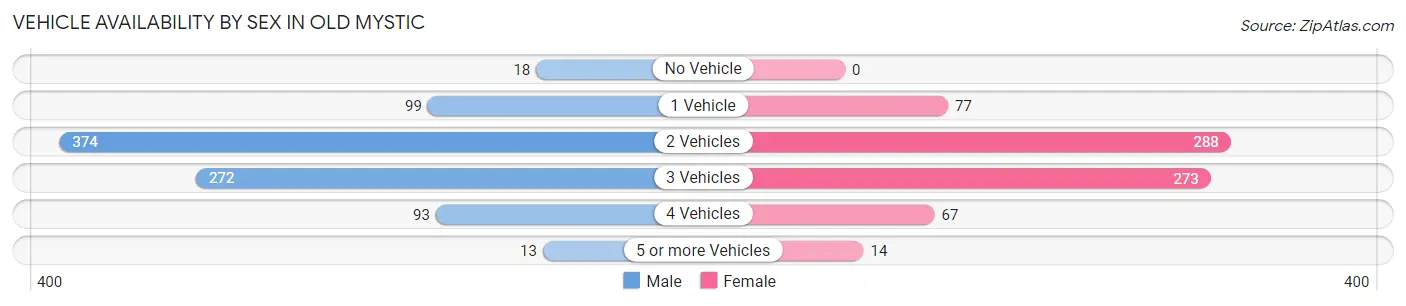
| Vehicles Available | Male | Female |
| No Vehicle | 18 (2.1%) | 0 (0.0%) |
| 1 Vehicle | 99 (11.4%) | 77 (10.7%) |
| 2 Vehicles | 374 (43.0%) | 288 (40.1%) |
| 3 Vehicles | 272 (31.3%) | 273 (38.0%) |
| 4 Vehicles | 93 (10.7%) | 67 (9.3%) |
| 5 or more Vehicles | 13 (1.5%) | 14 (1.9%) |
| Total | 869 (100.0%) | 719 (100.0%) |
Commute Time in Old Mystic
The most frequently occuring commute durations in Old Mystic are 10 to 14 minutes (349 commuters, 25.5%), 15 to 19 minutes (330 commuters, 24.1%), and 20 to 24 minutes (193 commuters, 14.1%).
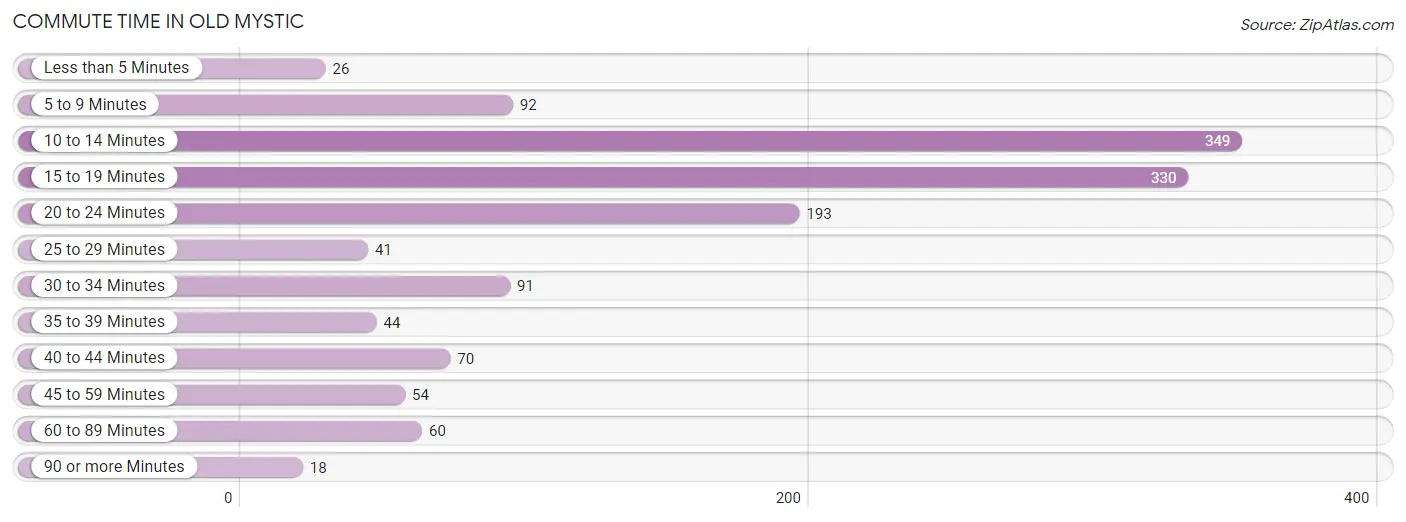
| Commute Time | # Commuters | % Commuters |
| Less than 5 Minutes | 26 | 1.9% |
| 5 to 9 Minutes | 92 | 6.7% |
| 10 to 14 Minutes | 349 | 25.5% |
| 15 to 19 Minutes | 330 | 24.1% |
| 20 to 24 Minutes | 193 | 14.1% |
| 25 to 29 Minutes | 41 | 3.0% |
| 30 to 34 Minutes | 91 | 6.7% |
| 35 to 39 Minutes | 44 | 3.2% |
| 40 to 44 Minutes | 70 | 5.1% |
| 45 to 59 Minutes | 54 | 4.0% |
| 60 to 89 Minutes | 60 | 4.4% |
| 90 or more Minutes | 18 | 1.3% |
Commute Time by Sex in Old Mystic
The most common commute times in Old Mystic are 10 to 14 minutes (209 commuters, 26.9%) for males and 15 to 19 minutes (141 commuters, 23.9%) for females.
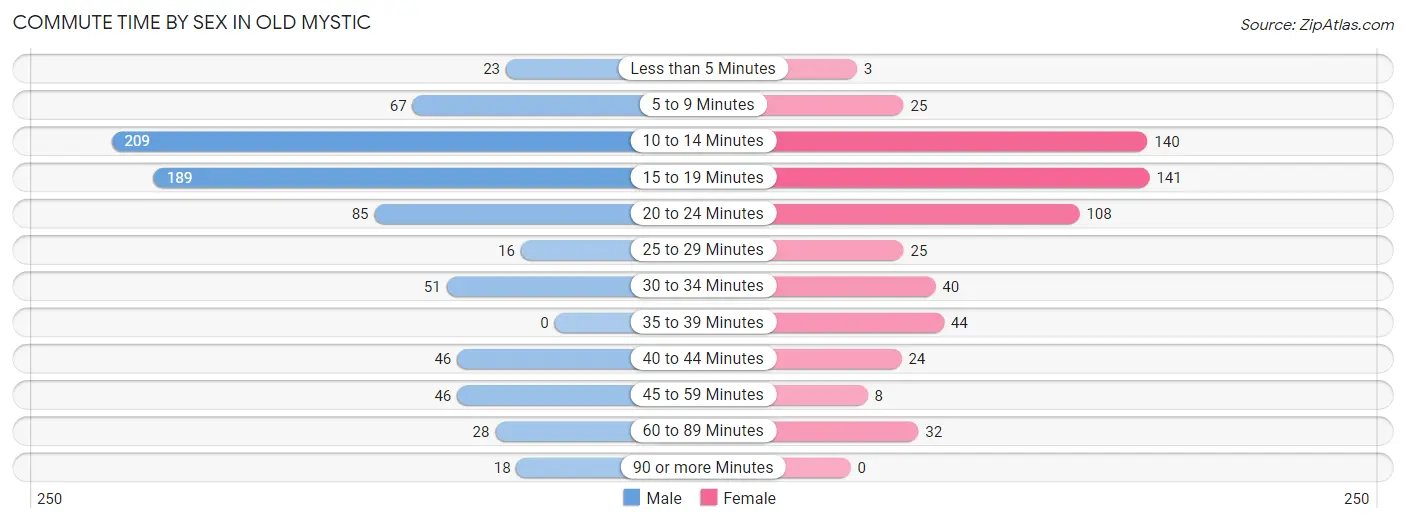
| Commute Time | Male | Female |
| Less than 5 Minutes | 23 (3.0%) | 3 (0.5%) |
| 5 to 9 Minutes | 67 (8.6%) | 25 (4.2%) |
| 10 to 14 Minutes | 209 (26.9%) | 140 (23.7%) |
| 15 to 19 Minutes | 189 (24.3%) | 141 (23.9%) |
| 20 to 24 Minutes | 85 (10.9%) | 108 (18.3%) |
| 25 to 29 Minutes | 16 (2.1%) | 25 (4.2%) |
| 30 to 34 Minutes | 51 (6.6%) | 40 (6.8%) |
| 35 to 39 Minutes | 0 (0.0%) | 44 (7.5%) |
| 40 to 44 Minutes | 46 (5.9%) | 24 (4.1%) |
| 45 to 59 Minutes | 46 (5.9%) | 8 (1.4%) |
| 60 to 89 Minutes | 28 (3.6%) | 32 (5.4%) |
| 90 or more Minutes | 18 (2.3%) | 0 (0.0%) |
Time of Departure to Work by Sex in Old Mystic
The most frequent times of departure to work in Old Mystic are 7:00 AM to 7:29 AM (182, 23.4%) for males and 8:30 AM to 8:59 AM (149, 25.3%) for females.
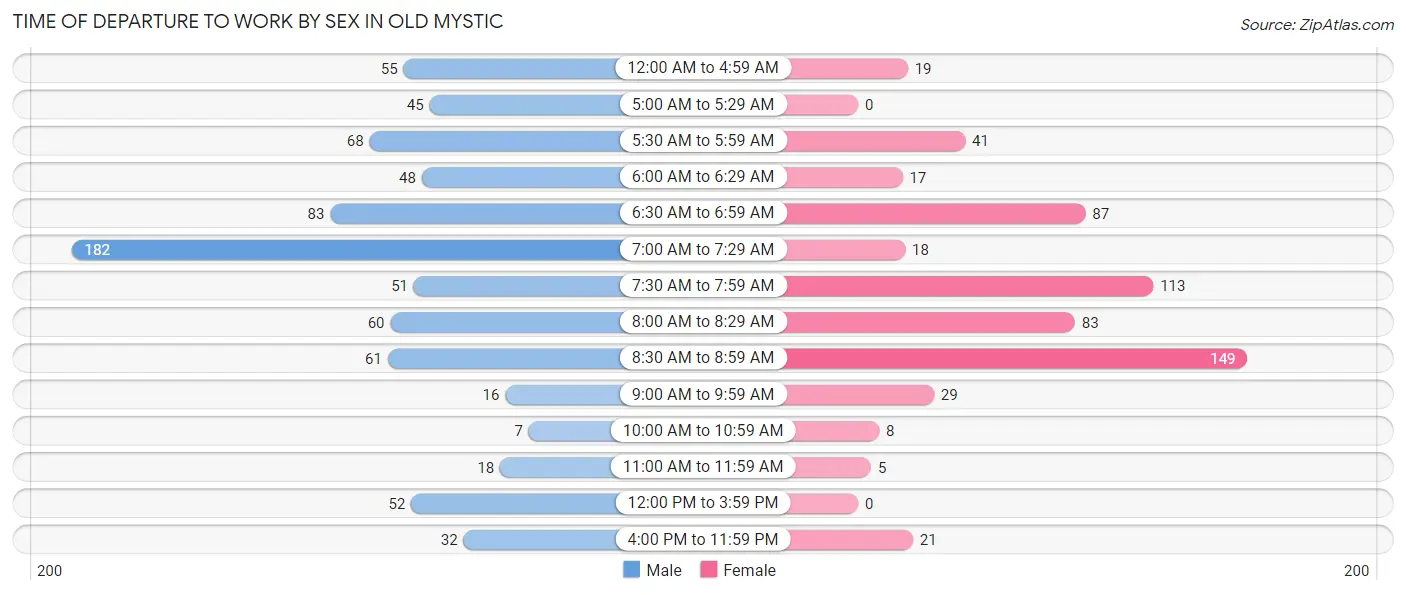
| Time of Departure | Male | Female |
| 12:00 AM to 4:59 AM | 55 (7.1%) | 19 (3.2%) |
| 5:00 AM to 5:29 AM | 45 (5.8%) | 0 (0.0%) |
| 5:30 AM to 5:59 AM | 68 (8.7%) | 41 (7.0%) |
| 6:00 AM to 6:29 AM | 48 (6.2%) | 17 (2.9%) |
| 6:30 AM to 6:59 AM | 83 (10.7%) | 87 (14.7%) |
| 7:00 AM to 7:29 AM | 182 (23.4%) | 18 (3.0%) |
| 7:30 AM to 7:59 AM | 51 (6.6%) | 113 (19.2%) |
| 8:00 AM to 8:29 AM | 60 (7.7%) | 83 (14.1%) |
| 8:30 AM to 8:59 AM | 61 (7.8%) | 149 (25.3%) |
| 9:00 AM to 9:59 AM | 16 (2.1%) | 29 (4.9%) |
| 10:00 AM to 10:59 AM | 7 (0.9%) | 8 (1.4%) |
| 11:00 AM to 11:59 AM | 18 (2.3%) | 5 (0.9%) |
| 12:00 PM to 3:59 PM | 52 (6.7%) | 0 (0.0%) |
| 4:00 PM to 11:59 PM | 32 (4.1%) | 21 (3.6%) |
| Total | 778 (100.0%) | 590 (100.0%) |
Housing Occupancy in Old Mystic
Occupancy by Ownership in Old Mystic
Of the total 1,311 dwellings in Old Mystic, owner-occupied units account for 1,160 (88.5%), while renter-occupied units make up 151 (11.5%).
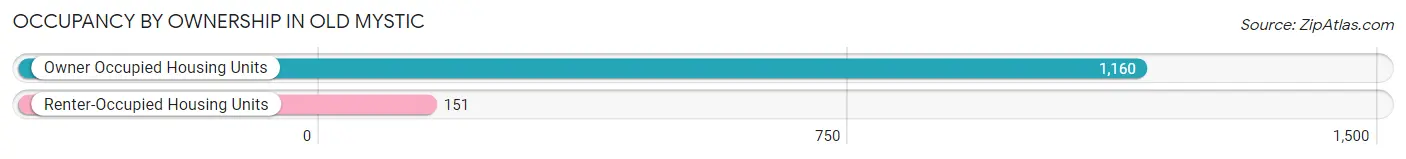
| Occupancy | # Housing Units | % Housing Units |
| Owner Occupied Housing Units | 1,160 | 88.5% |
| Renter-Occupied Housing Units | 151 | 11.5% |
| Total Occupied Housing Units | 1,311 | 100.0% |
Occupancy by Household Size in Old Mystic
| Household Size | # Housing Units | % Housing Units |
| 1-Person Household | 280 | 21.4% |
| 2-Person Household | 515 | 39.3% |
| 3-Person Household | 244 | 18.6% |
| 4+ Person Household | 272 | 20.7% |
| Total Housing Units | 1,311 | 100.0% |
Occupancy by Ownership by Household Size in Old Mystic
| Household Size | Owner-occupied | Renter-occupied |
| 1-Person Household | 208 (74.3%) | 72 (25.7%) |
| 2-Person Household | 472 (91.6%) | 43 (8.4%) |
| 3-Person Household | 222 (91.0%) | 22 (9.0%) |
| 4+ Person Household | 258 (94.9%) | 14 (5.1%) |
| Total Housing Units | 1,160 (88.5%) | 151 (11.5%) |
Occupancy by Educational Attainment in Old Mystic
| Household Size | Owner-occupied | Renter-occupied |
| Less than High School | 30 (78.9%) | 8 (21.0%) |
| High School Diploma | 187 (80.6%) | 45 (19.4%) |
| College/Associate Degree | 353 (84.3%) | 66 (15.8%) |
| Bachelor's Degree or higher | 590 (94.9%) | 32 (5.1%) |
Occupancy by Age of Householder in Old Mystic
| Age Bracket | # Households | % Households |
| Under 35 Years | 186 | 14.2% |
| 35 to 44 Years | 138 | 10.5% |
| 45 to 54 Years | 271 | 20.7% |
| 55 to 64 Years | 342 | 26.1% |
| 65 to 74 Years | 209 | 15.9% |
| 75 to 84 Years | 71 | 5.4% |
| 85 Years and Over | 94 | 7.2% |
| Total | 1,311 | 100.0% |
Housing Finances in Old Mystic
Median Income by Occupancy in Old Mystic
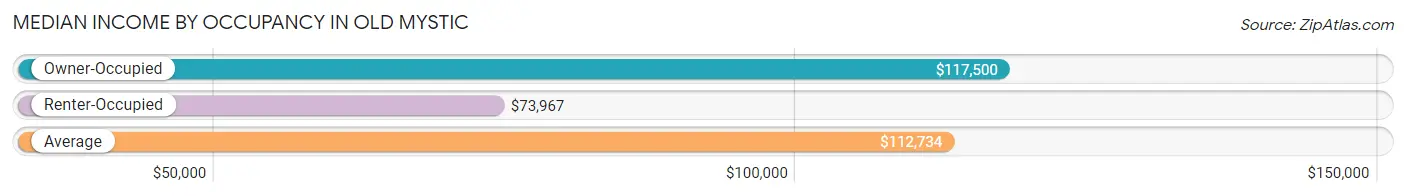
| Occupancy Type | # Households | Median Income |
| Owner-Occupied | 1,160 (88.5%) | $117,500 |
| Renter-Occupied | 151 (11.5%) | $73,967 |
| Average | 1,311 (100.0%) | $112,734 |
Occupancy by Householder Income Bracket in Old Mystic
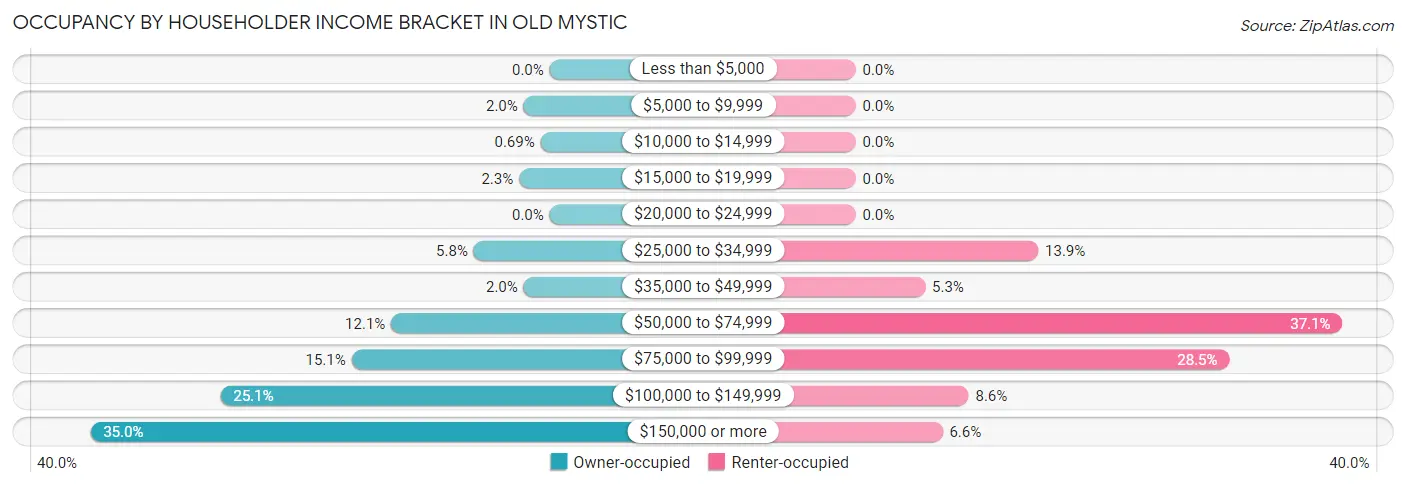
| Income Bracket | Owner-occupied | Renter-occupied |
| Less than $5,000 | 0 (0.0%) | 0 (0.0%) |
| $5,000 to $9,999 | 23 (2.0%) | 0 (0.0%) |
| $10,000 to $14,999 | 8 (0.7%) | 0 (0.0%) |
| $15,000 to $19,999 | 27 (2.3%) | 0 (0.0%) |
| $20,000 to $24,999 | 0 (0.0%) | 0 (0.0%) |
| $25,000 to $34,999 | 67 (5.8%) | 21 (13.9%) |
| $35,000 to $49,999 | 23 (2.0%) | 8 (5.3%) |
| $50,000 to $74,999 | 140 (12.1%) | 56 (37.1%) |
| $75,000 to $99,999 | 175 (15.1%) | 43 (28.5%) |
| $100,000 to $149,999 | 291 (25.1%) | 13 (8.6%) |
| $150,000 or more | 406 (35.0%) | 10 (6.6%) |
| Total | 1,160 (100.0%) | 151 (100.0%) |
Monthly Housing Cost Tiers in Old Mystic
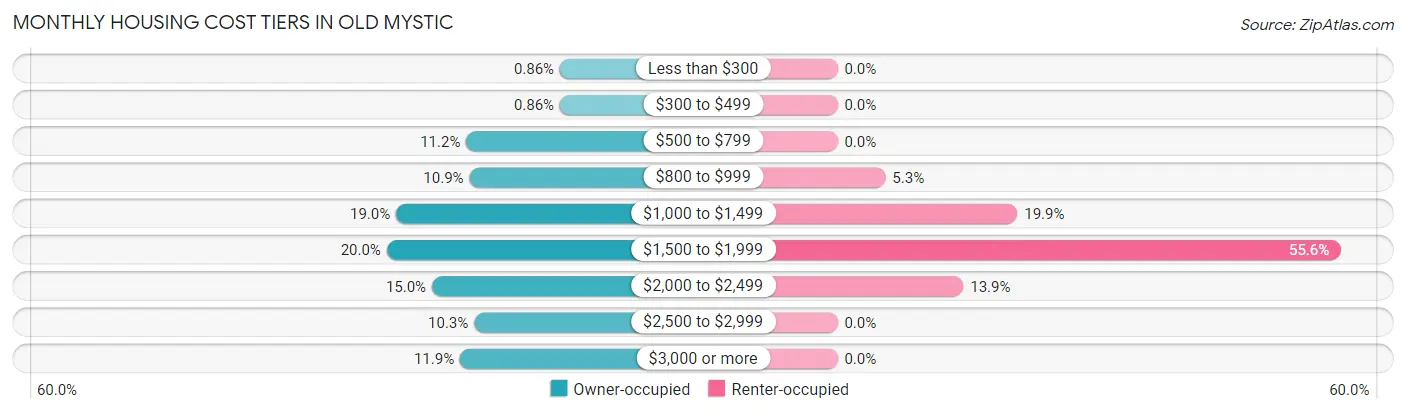
| Monthly Cost | Owner-occupied | Renter-occupied |
| Less than $300 | 10 (0.9%) | 0 (0.0%) |
| $300 to $499 | 10 (0.9%) | 0 (0.0%) |
| $500 to $799 | 130 (11.2%) | 0 (0.0%) |
| $800 to $999 | 126 (10.9%) | 8 (5.3%) |
| $1,000 to $1,499 | 220 (19.0%) | 30 (19.9%) |
| $1,500 to $1,999 | 232 (20.0%) | 84 (55.6%) |
| $2,000 to $2,499 | 174 (15.0%) | 21 (13.9%) |
| $2,500 to $2,999 | 120 (10.3%) | 0 (0.0%) |
| $3,000 or more | 138 (11.9%) | 0 (0.0%) |
| Total | 1,160 (100.0%) | 151 (100.0%) |
Physical Housing Characteristics in Old Mystic
Housing Structures in Old Mystic
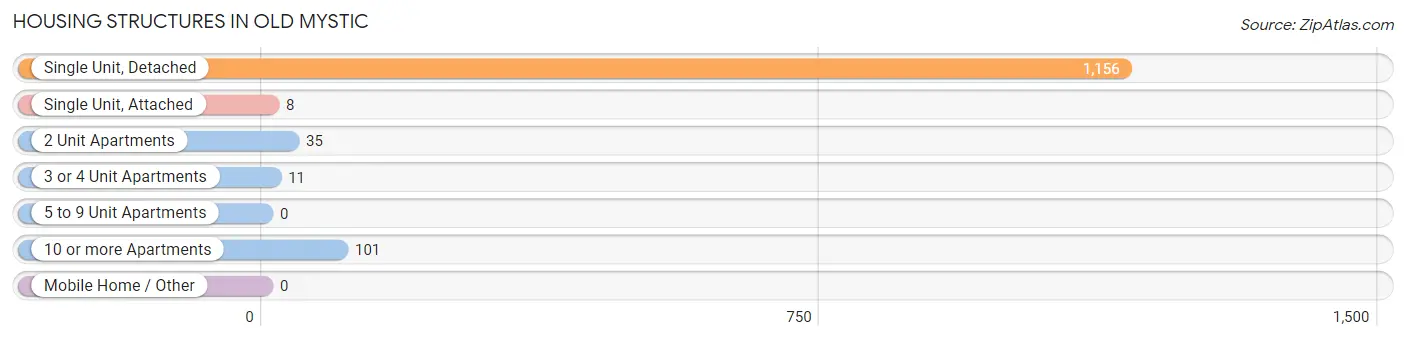
| Structure Type | # Housing Units | % Housing Units |
| Single Unit, Detached | 1,156 | 88.2% |
| Single Unit, Attached | 8 | 0.6% |
| 2 Unit Apartments | 35 | 2.7% |
| 3 or 4 Unit Apartments | 11 | 0.8% |
| 5 to 9 Unit Apartments | 0 | 0.0% |
| 10 or more Apartments | 101 | 7.7% |
| Mobile Home / Other | 0 | 0.0% |
| Total | 1,311 | 100.0% |
Housing Structures by Occupancy in Old Mystic
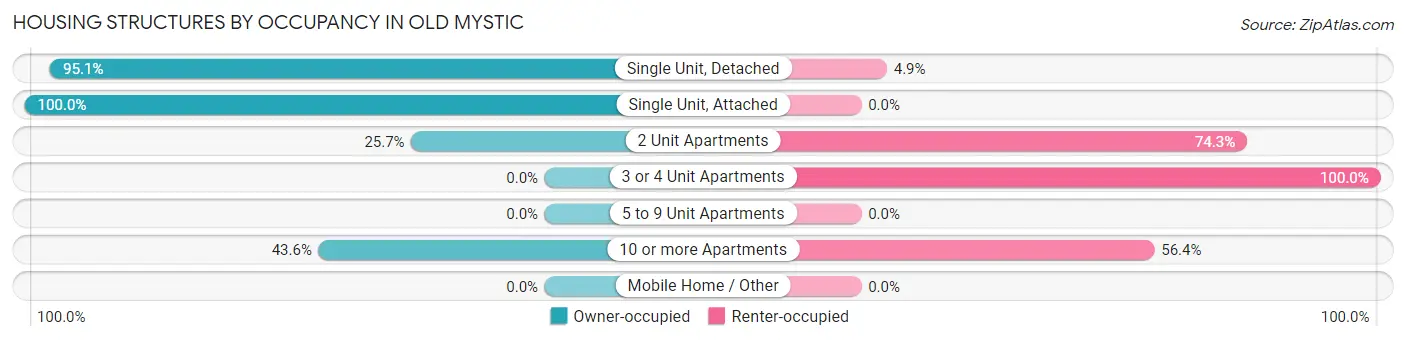
| Structure Type | Owner-occupied | Renter-occupied |
| Single Unit, Detached | 1,099 (95.1%) | 57 (4.9%) |
| Single Unit, Attached | 8 (100.0%) | 0 (0.0%) |
| 2 Unit Apartments | 9 (25.7%) | 26 (74.3%) |
| 3 or 4 Unit Apartments | 0 (0.0%) | 11 (100.0%) |
| 5 to 9 Unit Apartments | 0 (0.0%) | 0 (0.0%) |
| 10 or more Apartments | 44 (43.6%) | 57 (56.4%) |
| Mobile Home / Other | 0 (0.0%) | 0 (0.0%) |
| Total | 1,160 (88.5%) | 151 (11.5%) |
Housing Structures by Number of Rooms in Old Mystic
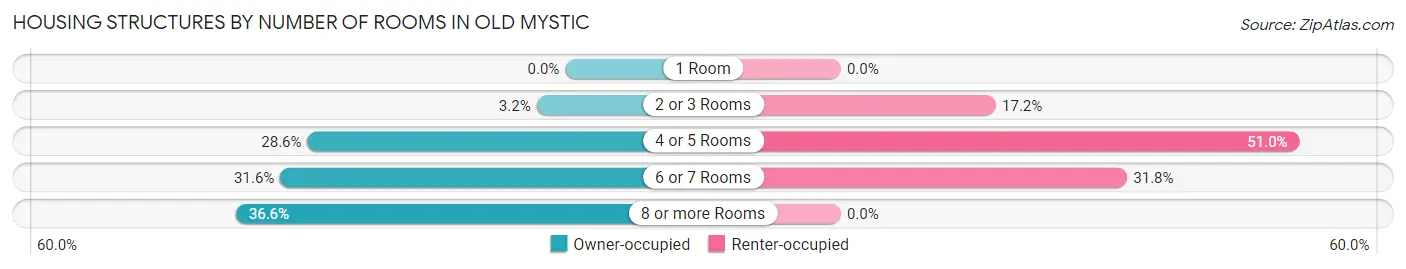
| Number of Rooms | Owner-occupied | Renter-occupied |
| 1 Room | 0 (0.0%) | 0 (0.0%) |
| 2 or 3 Rooms | 37 (3.2%) | 26 (17.2%) |
| 4 or 5 Rooms | 332 (28.6%) | 77 (51.0%) |
| 6 or 7 Rooms | 367 (31.6%) | 48 (31.8%) |
| 8 or more Rooms | 424 (36.5%) | 0 (0.0%) |
| Total | 1,160 (100.0%) | 151 (100.0%) |
Housing Structure by Heating Type in Old Mystic
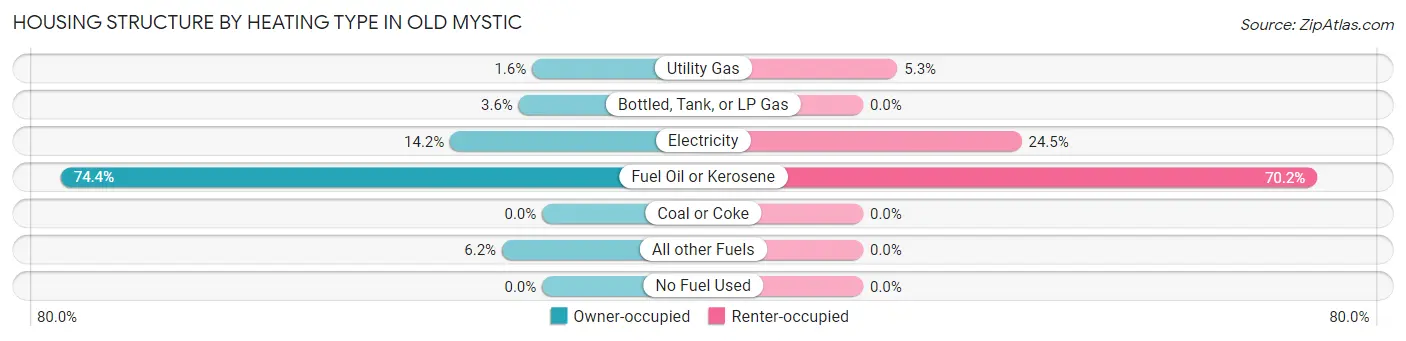
| Heating Type | Owner-occupied | Renter-occupied |
| Utility Gas | 18 (1.5%) | 8 (5.3%) |
| Bottled, Tank, or LP Gas | 42 (3.6%) | 0 (0.0%) |
| Electricity | 165 (14.2%) | 37 (24.5%) |
| Fuel Oil or Kerosene | 863 (74.4%) | 106 (70.2%) |
| Coal or Coke | 0 (0.0%) | 0 (0.0%) |
| All other Fuels | 72 (6.2%) | 0 (0.0%) |
| No Fuel Used | 0 (0.0%) | 0 (0.0%) |
| Total | 1,160 (100.0%) | 151 (100.0%) |
Household Vehicle Usage in Old Mystic
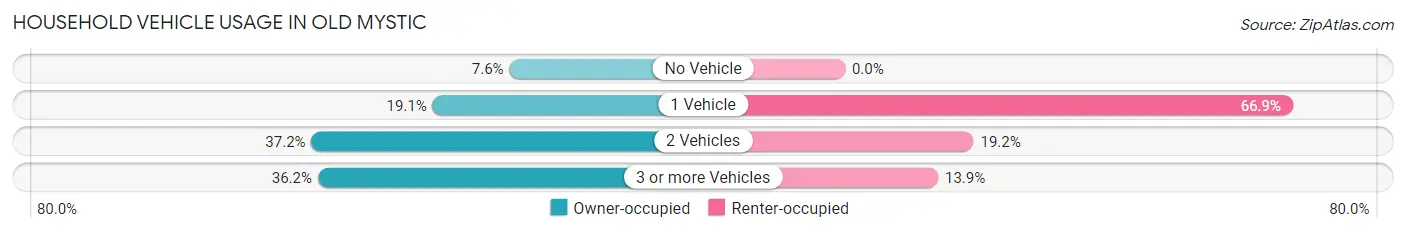
| Vehicles per Household | Owner-occupied | Renter-occupied |
| No Vehicle | 88 (7.6%) | 0 (0.0%) |
| 1 Vehicle | 221 (19.1%) | 101 (66.9%) |
| 2 Vehicles | 431 (37.2%) | 29 (19.2%) |
| 3 or more Vehicles | 420 (36.2%) | 21 (13.9%) |
| Total | 1,160 (100.0%) | 151 (100.0%) |
Real Estate & Mortgages in Old Mystic
Real Estate and Mortgage Overview in Old Mystic
| Characteristic | Without Mortgage | With Mortgage |
| Housing Units | 388 | 772 |
| Median Property Value | $281,700 | $316,200 |
| Median Household Income | $94,327 | $347 |
| Monthly Housing Costs | $845 | $138 |
| Real Estate Taxes | $4,689 | $0 |
Property Value by Mortgage Status in Old Mystic
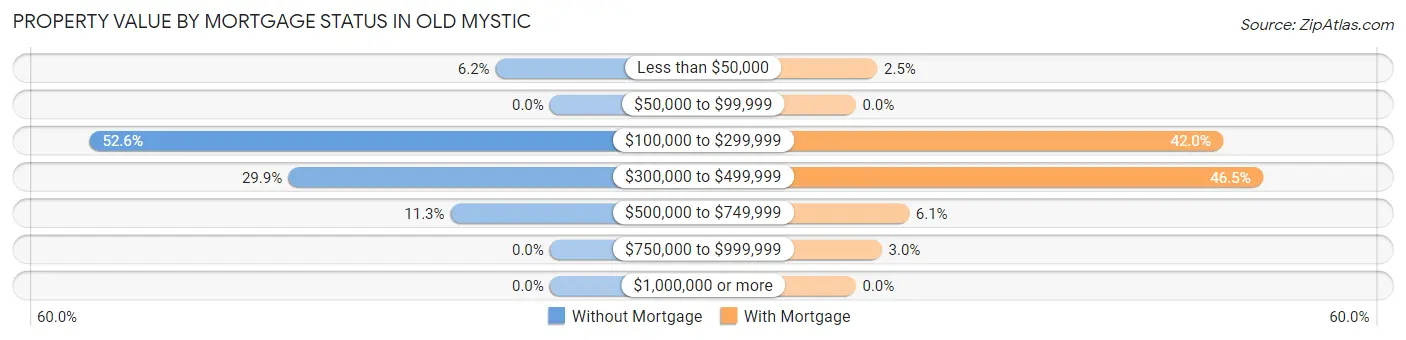
| Property Value | Without Mortgage | With Mortgage |
| Less than $50,000 | 24 (6.2%) | 19 (2.5%) |
| $50,000 to $99,999 | 0 (0.0%) | 0 (0.0%) |
| $100,000 to $299,999 | 204 (52.6%) | 324 (42.0%) |
| $300,000 to $499,999 | 116 (29.9%) | 359 (46.5%) |
| $500,000 to $749,999 | 44 (11.3%) | 47 (6.1%) |
| $750,000 to $999,999 | 0 (0.0%) | 23 (3.0%) |
| $1,000,000 or more | 0 (0.0%) | 0 (0.0%) |
| Total | 388 (100.0%) | 772 (100.0%) |
Household Income by Mortgage Status in Old Mystic
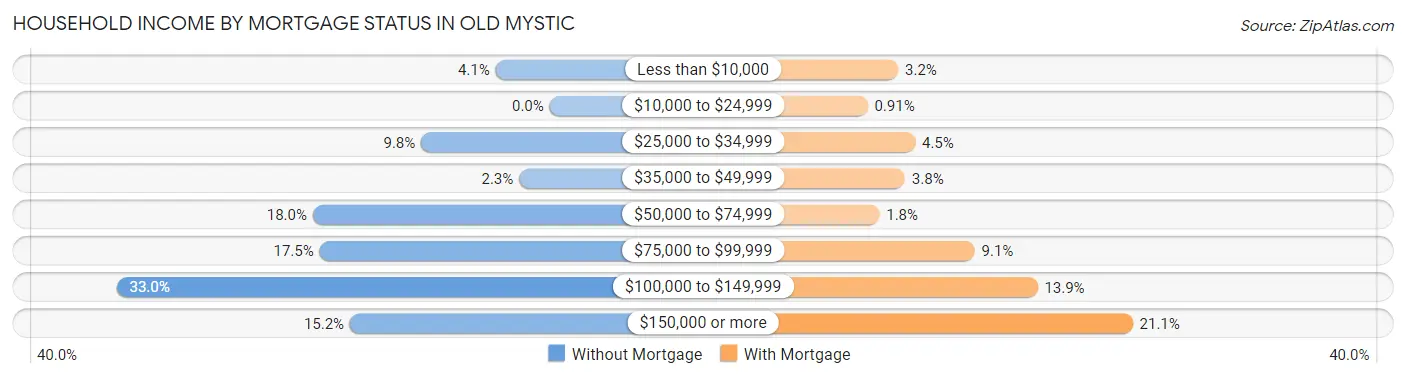
| Household Income | Without Mortgage | With Mortgage |
| Less than $10,000 | 16 (4.1%) | 25 (3.2%) |
| $10,000 to $24,999 | 0 (0.0%) | 7 (0.9%) |
| $25,000 to $34,999 | 38 (9.8%) | 35 (4.5%) |
| $35,000 to $49,999 | 9 (2.3%) | 29 (3.8%) |
| $50,000 to $74,999 | 70 (18.0%) | 14 (1.8%) |
| $75,000 to $99,999 | 68 (17.5%) | 70 (9.1%) |
| $100,000 to $149,999 | 128 (33.0%) | 107 (13.9%) |
| $150,000 or more | 59 (15.2%) | 163 (21.1%) |
| Total | 388 (100.0%) | 772 (100.0%) |
Property Value to Household Income Ratio in Old Mystic
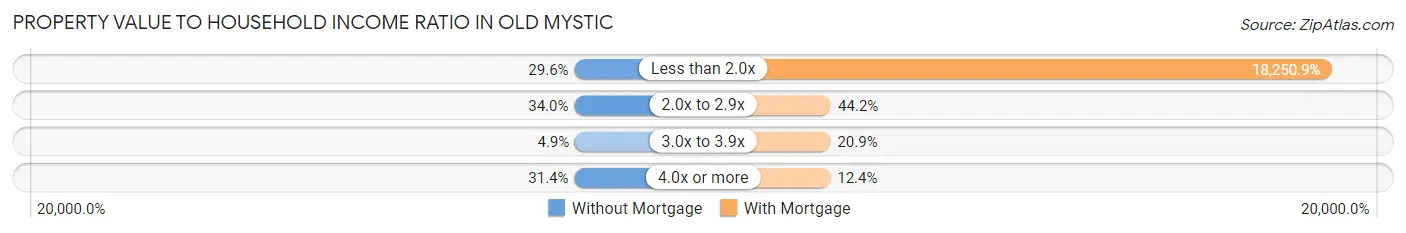
| Value-to-Income Ratio | Without Mortgage | With Mortgage |
| Less than 2.0x | 115 (29.6%) | 140,897 (18,250.9%) |
| 2.0x to 2.9x | 132 (34.0%) | 341 (44.2%) |
| 3.0x to 3.9x | 19 (4.9%) | 161 (20.8%) |
| 4.0x or more | 122 (31.4%) | 96 (12.4%) |
| Total | 388 (100.0%) | 772 (100.0%) |
Real Estate Taxes by Mortgage Status in Old Mystic
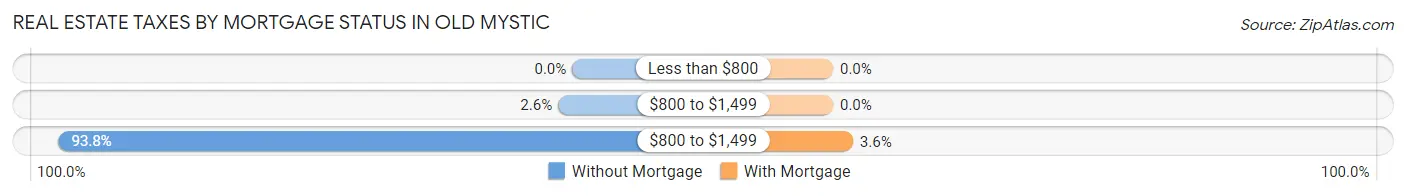
| Property Taxes | Without Mortgage | With Mortgage |
| Less than $800 | 0 (0.0%) | 0 (0.0%) |
| $800 to $1,499 | 10 (2.6%) | 0 (0.0%) |
| $800 to $1,499 | 364 (93.8%) | 28 (3.6%) |
| Total | 388 (100.0%) | 772 (100.0%) |
Health & Disability in Old Mystic
Health Insurance Coverage by Age in Old Mystic
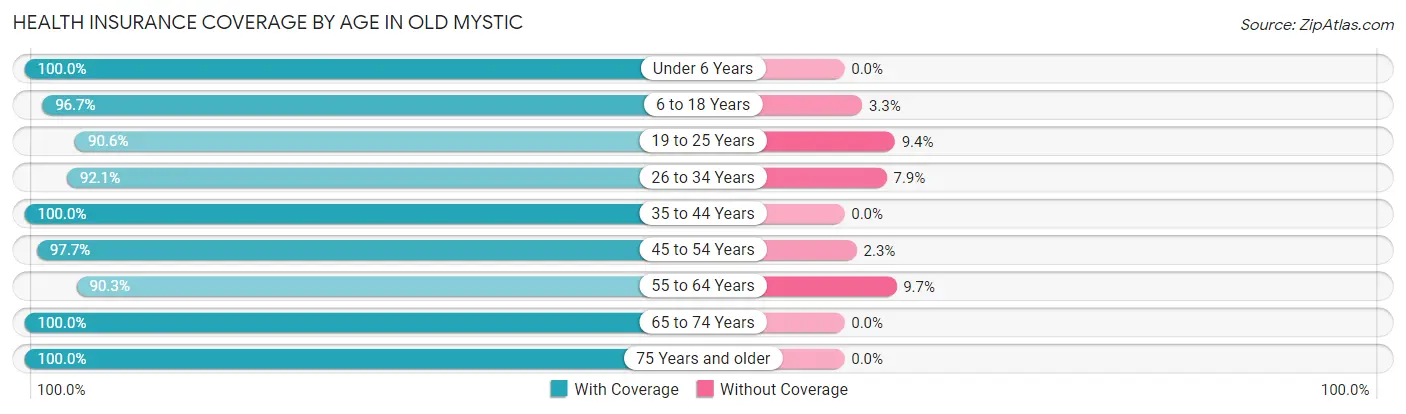
| Age Bracket | With Coverage | Without Coverage |
| Under 6 Years | 172 (100.0%) | 0 (0.0%) |
| 6 to 18 Years | 500 (96.7%) | 17 (3.3%) |
| 19 to 25 Years | 183 (90.6%) | 19 (9.4%) |
| 26 to 34 Years | 374 (92.1%) | 32 (7.9%) |
| 35 to 44 Years | 283 (100.0%) | 0 (0.0%) |
| 45 to 54 Years | 425 (97.7%) | 10 (2.3%) |
| 55 to 64 Years | 560 (90.3%) | 60 (9.7%) |
| 65 to 74 Years | 343 (100.0%) | 0 (0.0%) |
| 75 Years and older | 359 (100.0%) | 0 (0.0%) |
| Total | 3,199 (95.9%) | 138 (4.1%) |
Health Insurance Coverage by Citizenship Status in Old Mystic
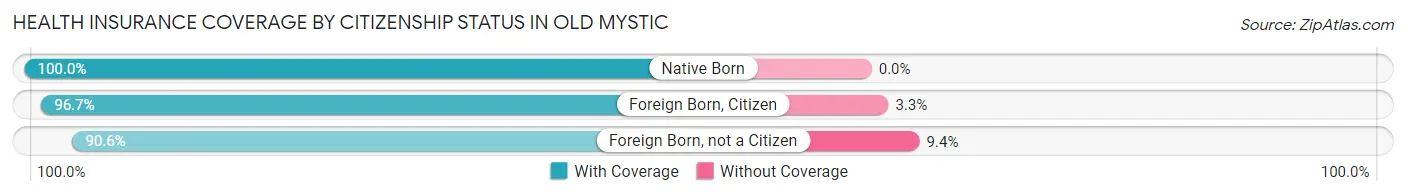
| Citizenship Status | With Coverage | Without Coverage |
| Native Born | 172 (100.0%) | 0 (0.0%) |
| Foreign Born, Citizen | 500 (96.7%) | 17 (3.3%) |
| Foreign Born, not a Citizen | 183 (90.6%) | 19 (9.4%) |
Health Insurance Coverage by Household Income in Old Mystic
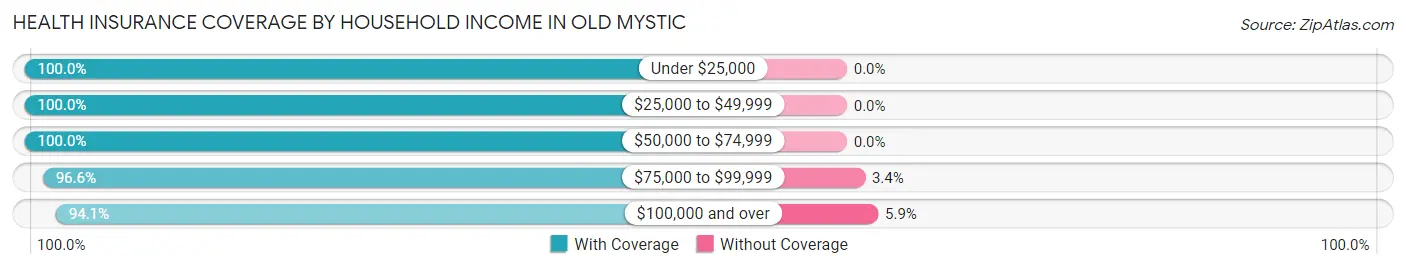
| Household Income | With Coverage | Without Coverage |
| Under $25,000 | 109 (100.0%) | 0 (0.0%) |
| $25,000 to $49,999 | 267 (100.0%) | 0 (0.0%) |
| $50,000 to $74,999 | 347 (100.0%) | 0 (0.0%) |
| $75,000 to $99,999 | 568 (96.6%) | 20 (3.4%) |
| $100,000 and over | 1,897 (94.1%) | 118 (5.9%) |
Public vs Private Health Insurance Coverage by Age in Old Mystic
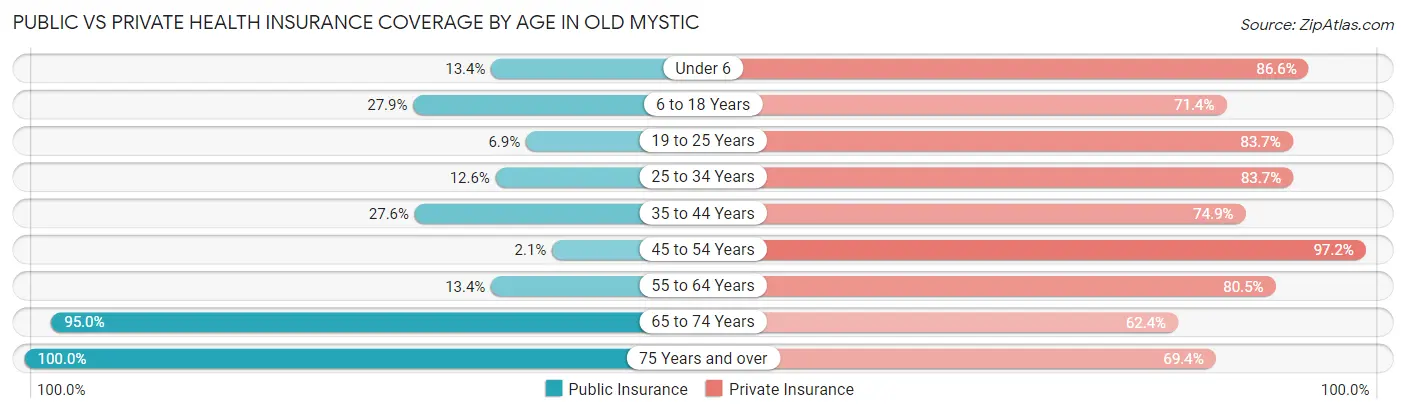
| Age Bracket | Public Insurance | Private Insurance |
| Under 6 | 23 (13.4%) | 149 (86.6%) |
| 6 to 18 Years | 144 (27.9%) | 369 (71.4%) |
| 19 to 25 Years | 14 (6.9%) | 169 (83.7%) |
| 25 to 34 Years | 51 (12.6%) | 340 (83.7%) |
| 35 to 44 Years | 78 (27.6%) | 212 (74.9%) |
| 45 to 54 Years | 9 (2.1%) | 423 (97.2%) |
| 55 to 64 Years | 83 (13.4%) | 499 (80.5%) |
| 65 to 74 Years | 326 (95.0%) | 214 (62.4%) |
| 75 Years and over | 359 (100.0%) | 249 (69.4%) |
| Total | 1,087 (32.6%) | 2,624 (78.6%) |
Disability Status by Sex by Age in Old Mystic
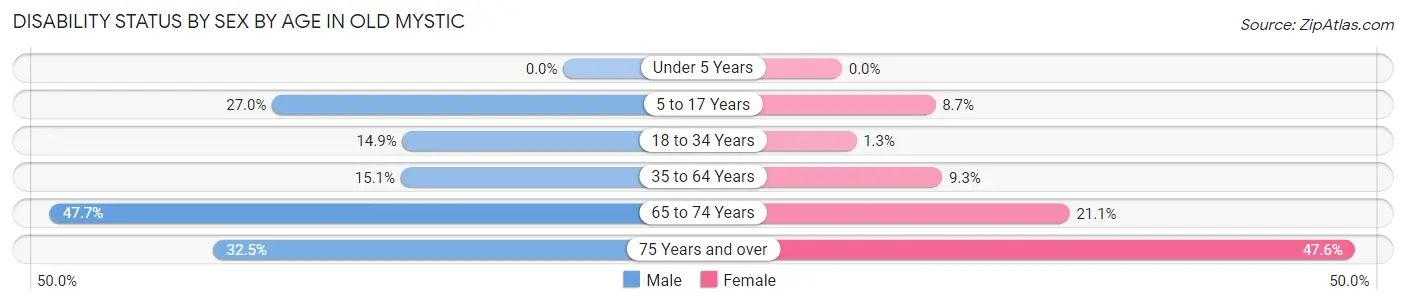
| Age Bracket | Male | Female |
| Under 5 Years | 0 (0.0%) | 0 (0.0%) |
| 5 to 17 Years | 94 (27.0%) | 13 (8.7%) |
| 18 to 34 Years | 50 (14.9%) | 4 (1.3%) |
| 35 to 64 Years | 103 (15.1%) | 61 (9.3%) |
| 65 to 74 Years | 71 (47.6%) | 41 (21.1%) |
| 75 Years and over | 49 (32.5%) | 99 (47.6%) |
Disability Class by Sex by Age in Old Mystic
Disability Class: Hearing Difficulty
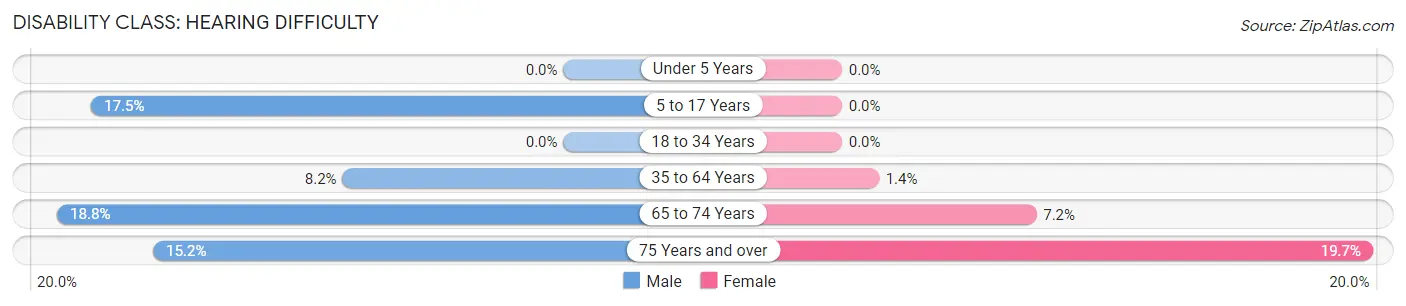
| Age Bracket | Male | Female |
| Under 5 Years | 0 (0.0%) | 0 (0.0%) |
| 5 to 17 Years | 61 (17.5%) | 0 (0.0%) |
| 18 to 34 Years | 0 (0.0%) | 0 (0.0%) |
| 35 to 64 Years | 56 (8.2%) | 9 (1.4%) |
| 65 to 74 Years | 28 (18.8%) | 14 (7.2%) |
| 75 Years and over | 23 (15.2%) | 41 (19.7%) |
Disability Class: Vision Difficulty
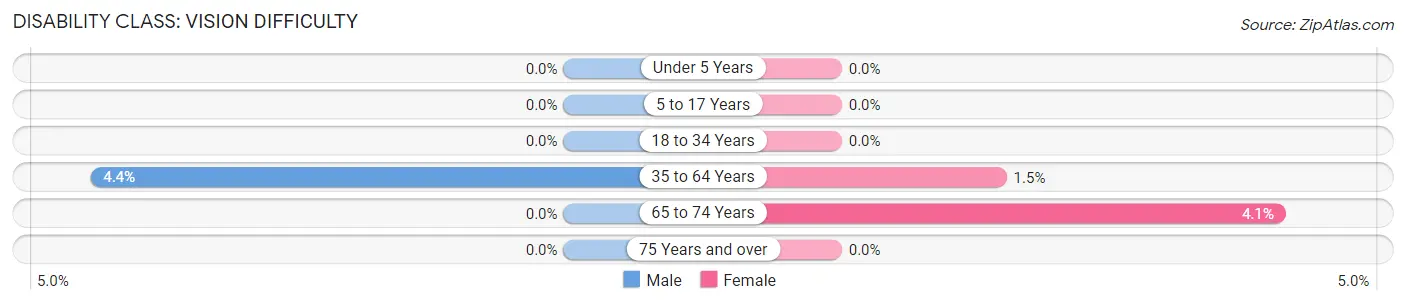
| Age Bracket | Male | Female |
| Under 5 Years | 0 (0.0%) | 0 (0.0%) |
| 5 to 17 Years | 0 (0.0%) | 0 (0.0%) |
| 18 to 34 Years | 0 (0.0%) | 0 (0.0%) |
| 35 to 64 Years | 30 (4.4%) | 10 (1.5%) |
| 65 to 74 Years | 0 (0.0%) | 8 (4.1%) |
| 75 Years and over | 0 (0.0%) | 0 (0.0%) |
Disability Class: Cognitive Difficulty
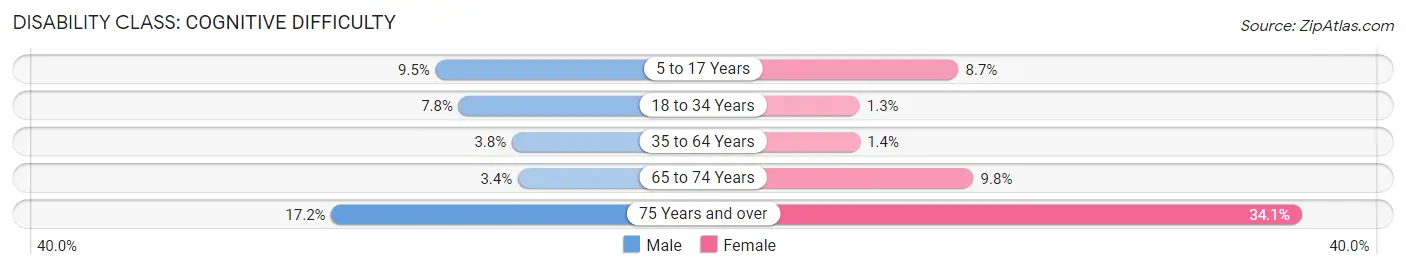
| Age Bracket | Male | Female |
| 5 to 17 Years | 33 (9.5%) | 13 (8.7%) |
| 18 to 34 Years | 26 (7.8%) | 4 (1.3%) |
| 35 to 64 Years | 26 (3.8%) | 9 (1.4%) |
| 65 to 74 Years | 5 (3.4%) | 19 (9.8%) |
| 75 Years and over | 26 (17.2%) | 71 (34.1%) |
Disability Class: Ambulatory Difficulty
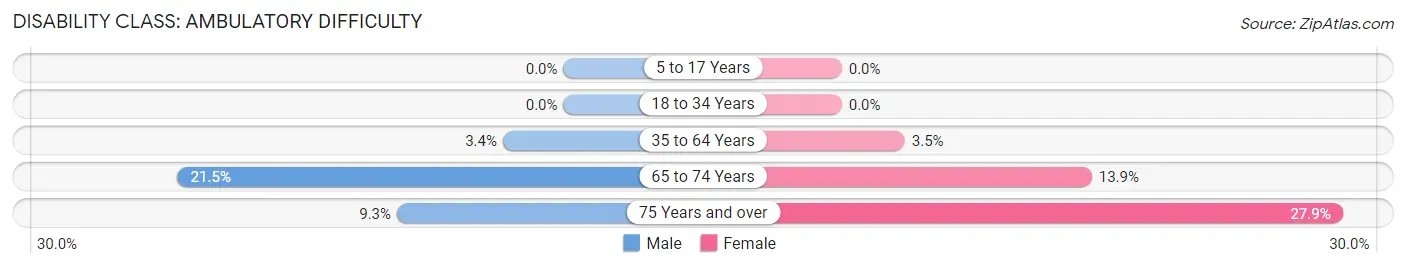
| Age Bracket | Male | Female |
| 5 to 17 Years | 0 (0.0%) | 0 (0.0%) |
| 18 to 34 Years | 0 (0.0%) | 0 (0.0%) |
| 35 to 64 Years | 23 (3.4%) | 23 (3.5%) |
| 65 to 74 Years | 32 (21.5%) | 27 (13.9%) |
| 75 Years and over | 14 (9.3%) | 58 (27.9%) |
Disability Class: Self-Care Difficulty
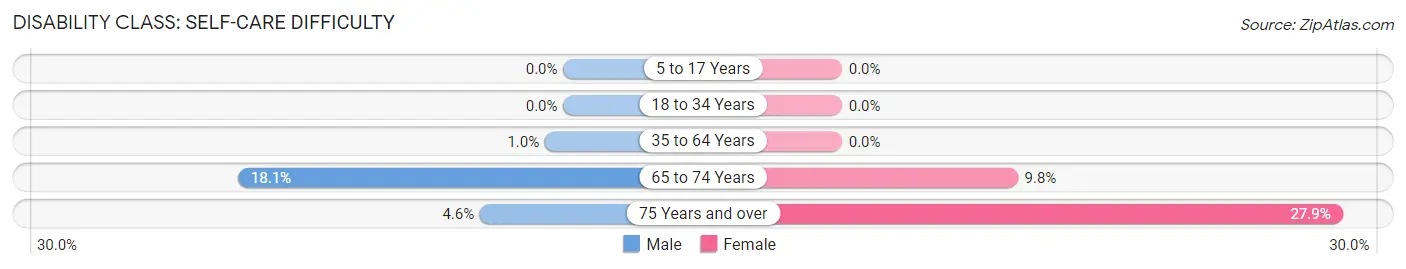
| Age Bracket | Male | Female |
| 5 to 17 Years | 0 (0.0%) | 0 (0.0%) |
| 18 to 34 Years | 0 (0.0%) | 0 (0.0%) |
| 35 to 64 Years | 7 (1.0%) | 0 (0.0%) |
| 65 to 74 Years | 27 (18.1%) | 19 (9.8%) |
| 75 Years and over | 7 (4.6%) | 58 (27.9%) |
Technology Access in Old Mystic
Computing Device Access in Old Mystic
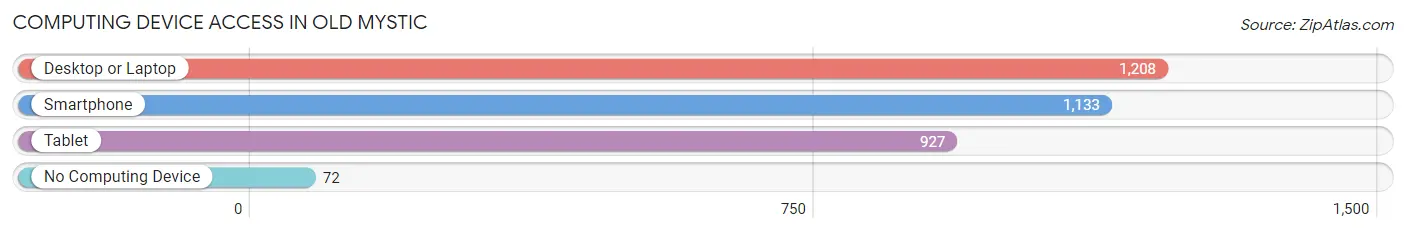
| Device Type | # Households | % Households |
| Desktop or Laptop | 1,208 | 92.1% |
| Smartphone | 1,133 | 86.4% |
| Tablet | 927 | 70.7% |
| No Computing Device | 72 | 5.5% |
| Total | 1,311 | 100.0% |
Internet Access in Old Mystic
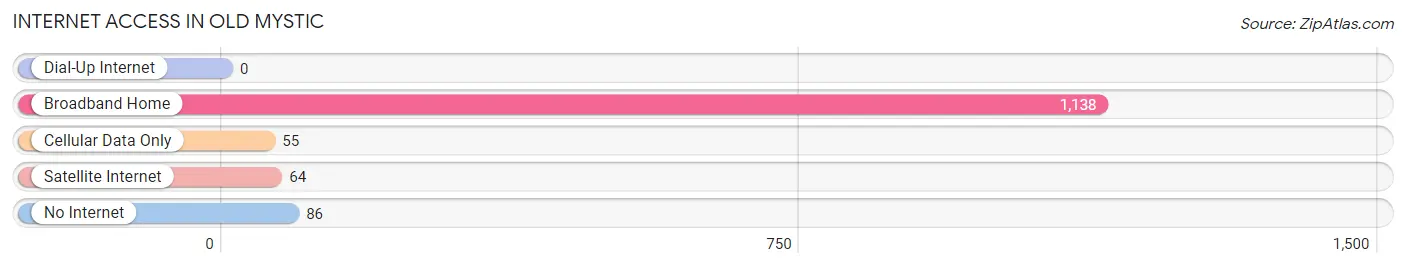
| Internet Type | # Households | % Households |
| Dial-Up Internet | 0 | 0.0% |
| Broadband Home | 1,138 | 86.8% |
| Cellular Data Only | 55 | 4.2% |
| Satellite Internet | 64 | 4.9% |
| No Internet | 86 | 6.6% |
| Total | 1,311 | 100.0% |
Old Mystic Summary
Mystic, Connecticut is a small town located in New London County, Connecticut. It is situated on the Mystic River, which flows into Long Island Sound. The town has a population of 4,205 as of the 2010 census.
History
Mystic was first settled in 1654 by Thomas Minor and John Winthrop, Jr. The town was originally part of Stonington, Connecticut, but was incorporated as its own town in 1856. The town was named after the Mystic River, which was named by the Pequot Indians.
The town was a major shipbuilding center in the 19th century, and was home to the famous Mystic Seaport Museum. The museum is dedicated to preserving the history of the maritime industry in the area.
Geography
Mystic is located in southeastern Connecticut, about 10 miles east of New London. It is bordered by Stonington to the east, Groton to the south, and North Stonington to the west. The town covers an area of 8.3 square miles, with a population density of 511 people per square mile.
The Mystic River flows through the town, and is a popular spot for fishing, boating, and other recreational activities. The Mystic River Valley is also home to several parks and nature preserves, including the Denison Pequotsepos Nature Center and the Mystic Seaport Museum.
Economy
Mystic is a popular tourist destination, and the town’s economy is largely based on tourism. The Mystic Seaport Museum is the town’s main attraction, and draws thousands of visitors each year. The museum features a variety of exhibits, including a replica of a 19th century whaling ship.
The town is also home to several marinas, which provide services for recreational boaters. The Mystic Aquarium is another popular attraction, and is home to a variety of marine life, including beluga whales, seals, and penguins.
Demographics
As of the 2010 census, the population of Mystic was 4,205. The racial makeup of the town was 94.3% White, 1.7% African American, 0.4% Native American, 1.2% Asian, 0.1% Pacific Islander, 0.7% from other races, and 1.8% from two or more races. Hispanic or Latino of any race were 3.2% of the population.
The median household income in Mystic was $63,944, and the median family income was $76,944. The per capita income for the town was $32,944. About 5.2% of families and 7.2% of the population were below the poverty line, including 8.3% of those under age 18 and 5.2% of those age 65 or over.
Mystic is a small town with a rich history and a vibrant economy. The town is home to a variety of attractions, including the Mystic Seaport Museum and the Mystic Aquarium. The town’s population is diverse, with a mix of races and ethnicities. The town is a popular tourist destination, and its economy is largely based on tourism.
Common Questions
What is Per Capita Income in Old Mystic?
Per Capita income in Old Mystic is $49,133.
What is the Median Family Income in Old Mystic?
Median Family Income in Old Mystic is $130,833.
What is the Median Household income in Old Mystic?
Median Household Income in Old Mystic is $112,734.
What is Income or Wage Gap in Old Mystic?
Income or Wage Gap in Old Mystic is 46.2%.
Women in Old Mystic earn 53.8 cents for every dollar earned by a man.
What is Inequality or Gini Index in Old Mystic?
Inequality or Gini Index in Old Mystic is 0.35.
What is the Total Population of Old Mystic?
Total Population of Old Mystic is 3,385.
What is the Total Male Population of Old Mystic?
Total Male Population of Old Mystic is 1,797.
What is the Total Female Population of Old Mystic?
Total Female Population of Old Mystic is 1,588.
What is the Ratio of Males per 100 Females in Old Mystic?
There are 113.16 Males per 100 Females in Old Mystic.
What is the Ratio of Females per 100 Males in Old Mystic?
There are 88.37 Females per 100 Males in Old Mystic.
What is the Median Population Age in Old Mystic?
Median Population Age in Old Mystic is 47.1 Years.
What is the Average Family Size in Old Mystic
Average Family Size in Old Mystic is 3.0 People.
What is the Average Household Size in Old Mystic
Average Household Size in Old Mystic is 2.6 People.
How Large is the Labor Force in Old Mystic?
There are 1,770 People in the Labor Forcein in Old Mystic.
What is the Percentage of People in the Labor Force in Old Mystic?
63.1% of People are in the Labor Force in Old Mystic.
What is the Unemployment Rate in Old Mystic?
Unemployment Rate in Old Mystic is 5.6%.