Canaan, CT Map & Demographics
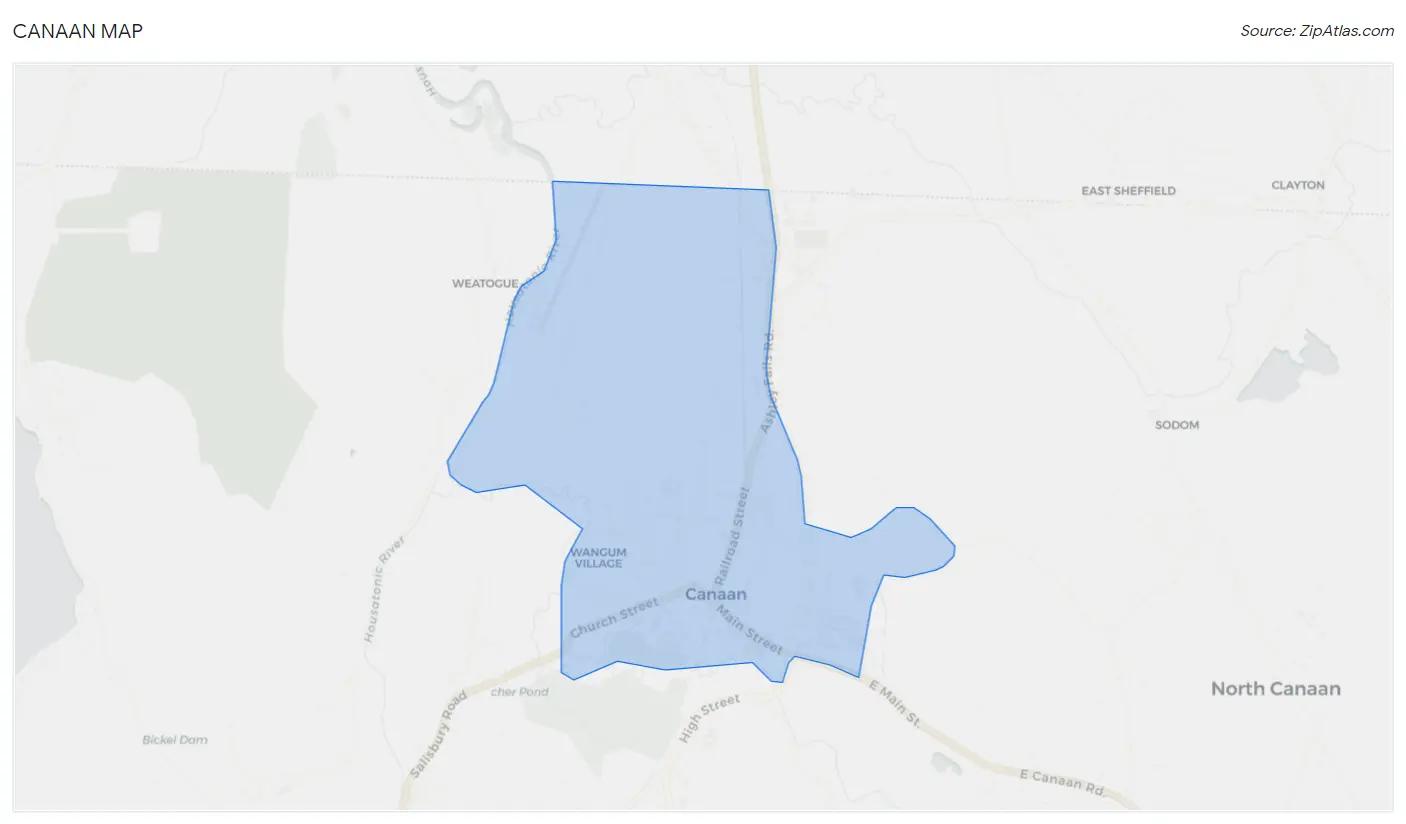
Canaan Map
Canaan Overview
$30,944
PER CAPITA INCOME
$31,130
AVG HOUSEHOLD INCOME
59.4%
WAGE / INCOME GAP [ % ]
40.6¢/ $1
WAGE / INCOME GAP [ $ ]
0.55
INEQUALITY / GINI INDEX
1,353
TOTAL POPULATION
767
MALE POPULATION
586
FEMALE POPULATION
130.89
MALES / 100 FEMALES
76.40
FEMALES / 100 MALES
36.6
MEDIAN AGE
2.9
AVG FAMILY SIZE
2.4
AVG HOUSEHOLD SIZE
594
LABOR FORCE [ PEOPLE ]
57.7%
PERCENT IN LABOR FORCE
12.7%
UNEMPLOYMENT RATE
Canaan Zip Codes
Canaan Area Codes
Income in Canaan
Income Overview in Canaan
| Characteristic | Number | Measure |
| Per Capita Income | 1,353 | $30,944 |
| Median Family Income | 301 | $0 |
| Mean Family Income | 301 | $83,875 |
| Median Household Income | 566 | $31,130 |
| Mean Household Income | 566 | $64,159 |
| Income Deficit | 301 | $0 |
| Wage / Income Gap (%) | 1,353 | 59.35% |
| Wage / Income Gap ($) | 1,353 | 40.65¢ per $1 |
| Gini / Inequality Index | 1,353 | 0.55 |
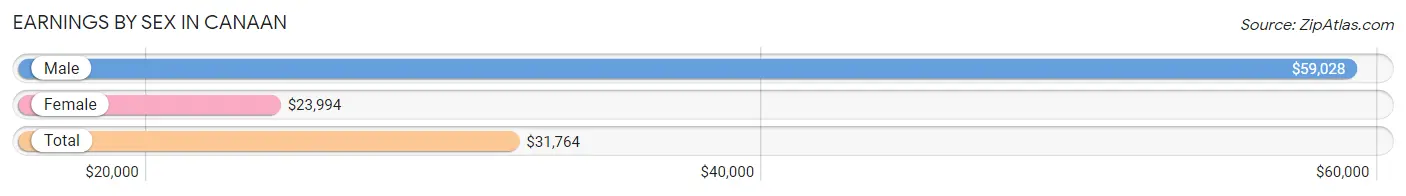
Earnings by Sex in Canaan
Average Earnings in Canaan are $31,764, $59,028 for men and $23,994 for women, a difference of 59.4%.
| Sex | Number | Average Earnings |
| Male | 397 (63.9%) | $59,028 |
| Female | 224 (36.1%) | $23,994 |
| Total | 621 (100.0%) | $31,764 |
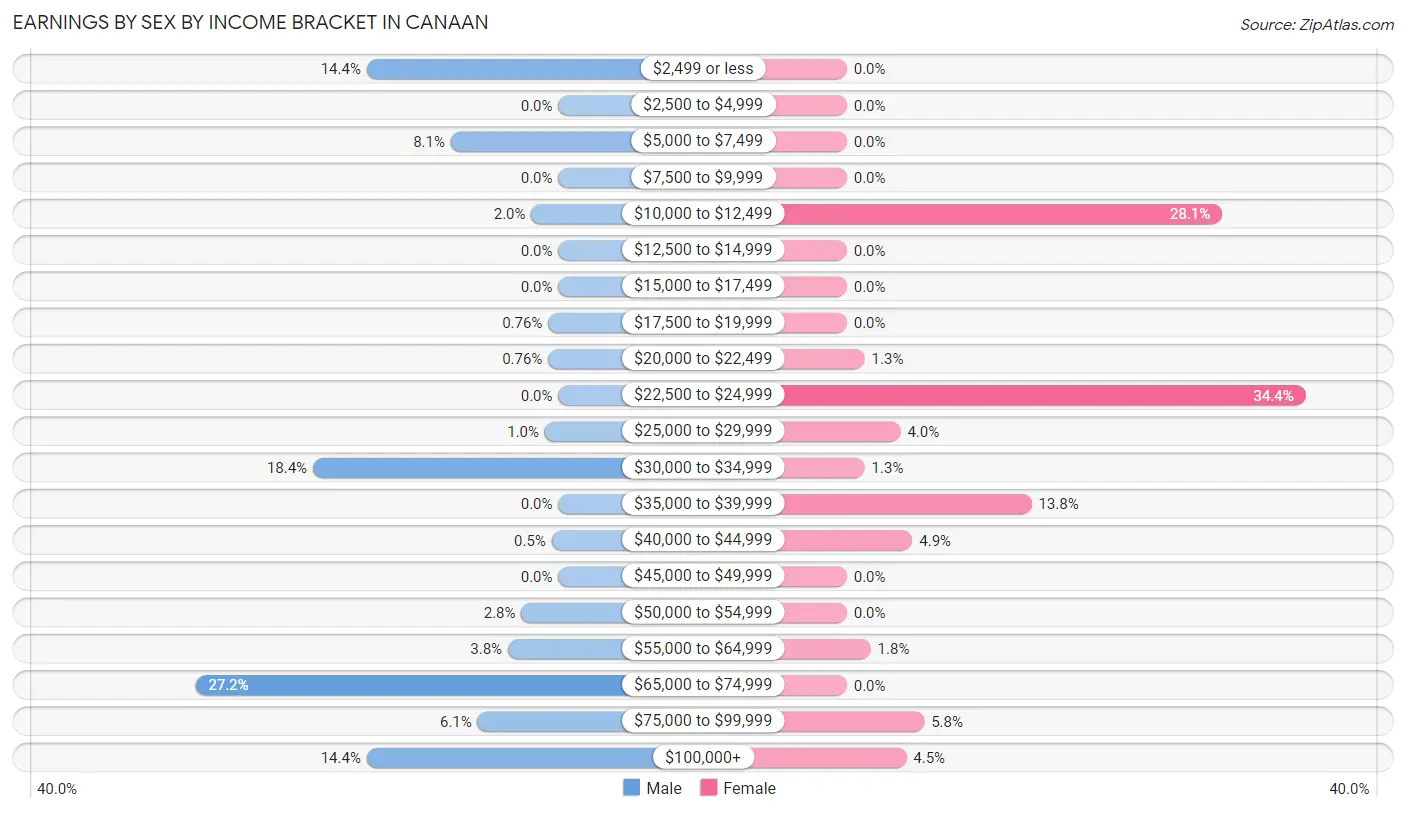
Earnings by Sex by Income Bracket in Canaan
The most common earnings brackets in Canaan are $65,000 to $74,999 for men (108 | 27.2%) and $22,500 to $24,999 for women (77 | 34.4%).
| Income | Male | Female |
| $2,499 or less | 57 (14.4%) | 0 (0.0%) |
| $2,500 to $4,999 | 0 (0.0%) | 0 (0.0%) |
| $5,000 to $7,499 | 32 (8.1%) | 0 (0.0%) |
| $7,500 to $9,999 | 0 (0.0%) | 0 (0.0%) |
| $10,000 to $12,499 | 8 (2.0%) | 63 (28.1%) |
| $12,500 to $14,999 | 0 (0.0%) | 0 (0.0%) |
| $15,000 to $17,499 | 0 (0.0%) | 0 (0.0%) |
| $17,500 to $19,999 | 3 (0.8%) | 0 (0.0%) |
| $20,000 to $22,499 | 3 (0.8%) | 3 (1.3%) |
| $22,500 to $24,999 | 0 (0.0%) | 77 (34.4%) |
| $25,000 to $29,999 | 4 (1.0%) | 9 (4.0%) |
| $30,000 to $34,999 | 73 (18.4%) | 3 (1.3%) |
| $35,000 to $39,999 | 0 (0.0%) | 31 (13.8%) |
| $40,000 to $44,999 | 2 (0.5%) | 11 (4.9%) |
| $45,000 to $49,999 | 0 (0.0%) | 0 (0.0%) |
| $50,000 to $54,999 | 11 (2.8%) | 0 (0.0%) |
| $55,000 to $64,999 | 15 (3.8%) | 4 (1.8%) |
| $65,000 to $74,999 | 108 (27.2%) | 0 (0.0%) |
| $75,000 to $99,999 | 24 (6.0%) | 13 (5.8%) |
| $100,000+ | 57 (14.4%) | 10 (4.5%) |
| Total | 397 (100.0%) | 224 (100.0%) |
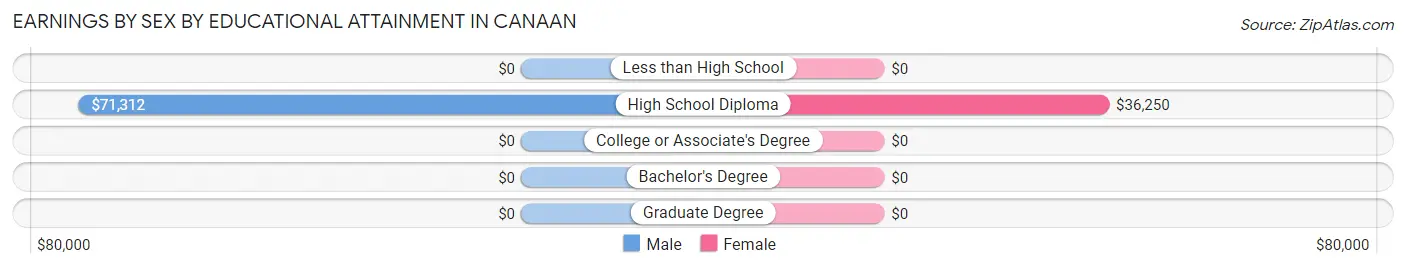
Earnings by Sex by Educational Attainment in Canaan
Average earnings in Canaan are $70,186 for men and $27,000 for women, a difference of 61.5%. Men with an educational attainment of high school diploma enjoy the highest average annual earnings of $71,312, while those with high school diploma education earn the least with $71,312. Women with an educational attainment of high school diploma earn the most with the average annual earnings of $36,250, while those with high school diploma education have the smallest earnings of $36,250.
| Educational Attainment | Male Income | Female Income |
| Less than High School | - | - |
| High School Diploma | $71,312 | $36,250 |
| College or Associate's Degree | - | - |
| Bachelor's Degree | - | - |
| Graduate Degree | - | - |
| Total | $70,186 | $27,000 |
Family Income in Canaan
Family Income Brackets in Canaan
According to the Canaan family income data, there are 73 families falling into the $25,000 to $34,999 income range, which is the most common income bracket and makes up 24.2% of all families.
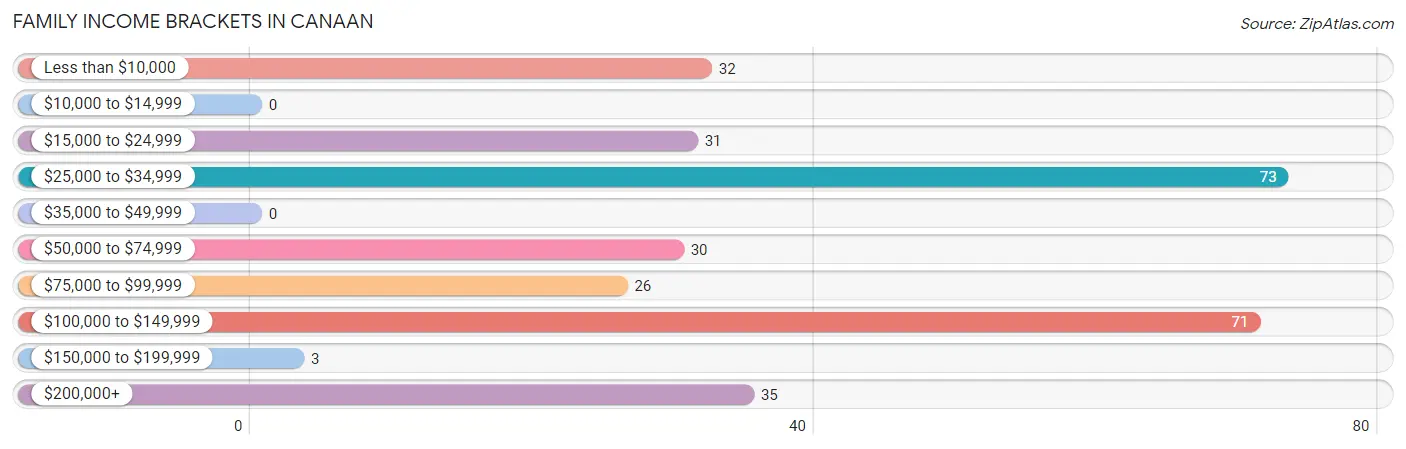
| Income Bracket | # Families | % Families |
| Less than $10,000 | 32 | 10.6% |
| $10,000 to $14,999 | 0 | 0.0% |
| $15,000 to $24,999 | 31 | 10.3% |
| $25,000 to $34,999 | 73 | 24.3% |
| $35,000 to $49,999 | 0 | 0.0% |
| $50,000 to $74,999 | 30 | 10.0% |
| $75,000 to $99,999 | 26 | 8.6% |
| $100,000 to $149,999 | 71 | 23.6% |
| $150,000 to $199,999 | 3 | 1.0% |
| $200,000+ | 35 | 11.6% |
Family Income by Famaliy Size in Canaan
2-person families (130 | 43.2%) account for the highest median family income in Canaan with $97,632 per family, while 2-person families (130 | 43.2%) have the highest median income of $48,816 per family member.
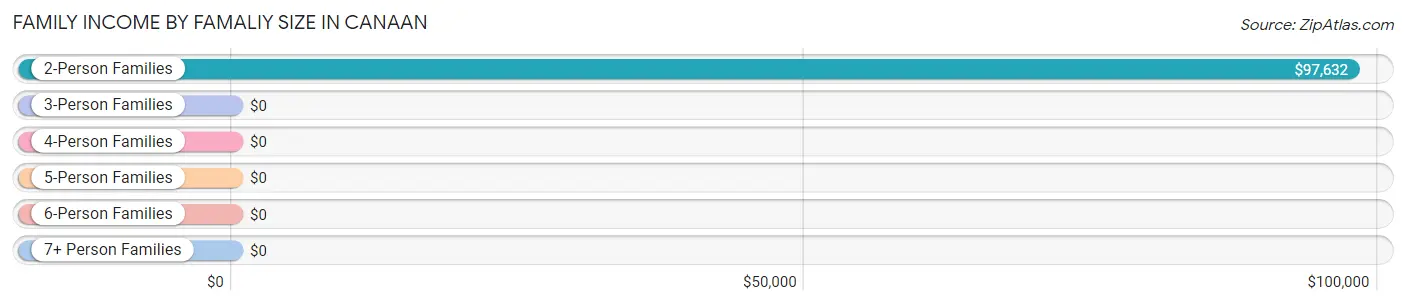
| Income Bracket | # Families | Median Income |
| 2-Person Families | 130 (43.2%) | $97,632 |
| 3-Person Families | 60 (19.9%) | $0 |
| 4-Person Families | 3 (1.0%) | $0 |
| 5-Person Families | 105 (34.9%) | $0 |
| 6-Person Families | 0 (0.0%) | $0 |
| 7+ Person Families | 3 (1.0%) | $0 |
| Total | 301 (100.0%) | $0 |
Family Income by Number of Earners in Canaan
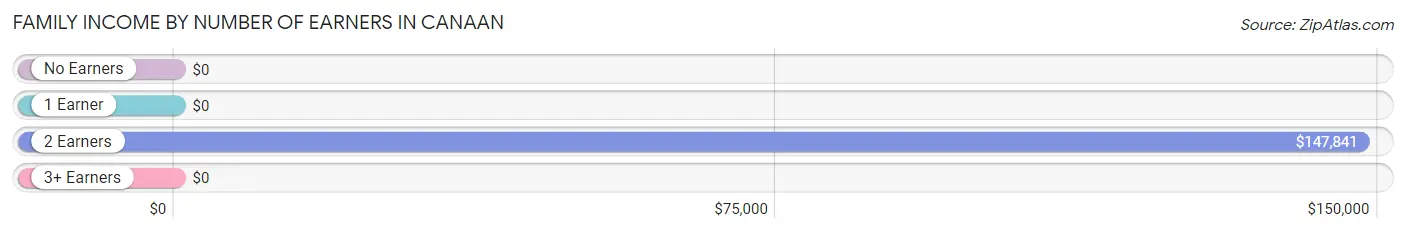
| Number of Earners | # Families | Median Income |
| No Earners | 41 (13.6%) | $0 |
| 1 Earner | 168 (55.8%) | $0 |
| 2 Earners | 89 (29.6%) | $147,841 |
| 3+ Earners | 3 (1.0%) | $0 |
| Total | 301 (100.0%) | $0 |
Household Income in Canaan
Household Income Brackets in Canaan
With 91 households falling in the category, the $15,000 to $24,999 income range is the most frequent in Canaan, accounting for 16.1% of all households. In contrast, only 14 households (2.5%) fall into the $150,000 to $199,999 income bracket, making it the least populous group.
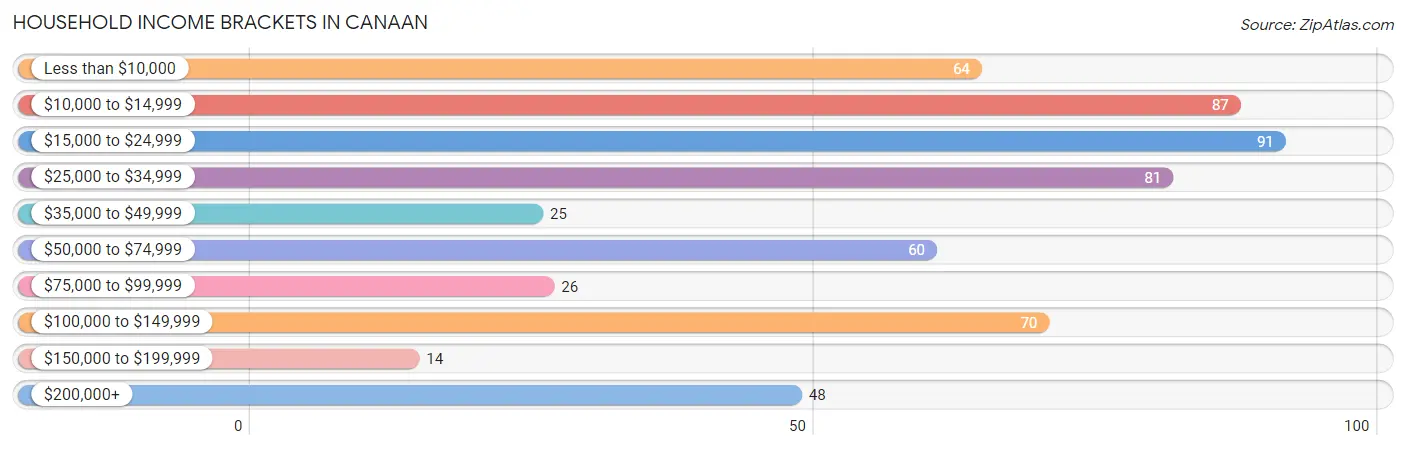
| Income Bracket | # Households | % Households |
| Less than $10,000 | 64 | 11.3% |
| $10,000 to $14,999 | 87 | 15.4% |
| $15,000 to $24,999 | 91 | 16.1% |
| $25,000 to $34,999 | 81 | 14.3% |
| $35,000 to $49,999 | 25 | 4.4% |
| $50,000 to $74,999 | 60 | 10.6% |
| $75,000 to $99,999 | 26 | 4.6% |
| $100,000 to $149,999 | 70 | 12.4% |
| $150,000 to $199,999 | 14 | 2.5% |
| $200,000+ | 48 | 8.5% |
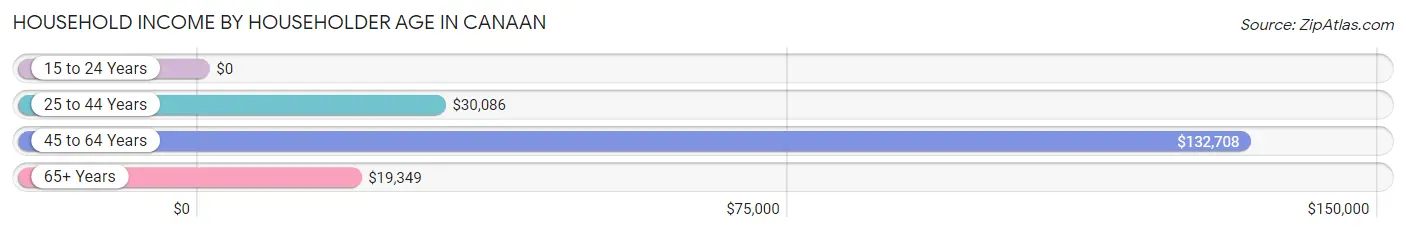
Household Income by Householder Age in Canaan
The median household income in Canaan is $31,130, with the highest median household income of $132,708 found in the 45 to 64 years age bracket for the primary householder. A total of 190 households (33.6%) fall into this category.
| Income Bracket | # Households | Median Income |
| 15 to 24 Years | 0 (0.0%) | $0 |
| 25 to 44 Years | 195 (34.4%) | $30,086 |
| 45 to 64 Years | 190 (33.6%) | $132,708 |
| 65+ Years | 181 (32.0%) | $19,349 |
| Total | 566 (100.0%) | $31,130 |
Poverty in Canaan
Income Below Poverty by Sex and Age in Canaan
With 37.8% poverty level for males and 44.6% for females among the residents of Canaan, 35 to 44 year old males and 5 year old females are the most vulnerable to poverty, with 105 males (94.6%) and 20 females (100.0%) in their respective age groups living below the poverty level.
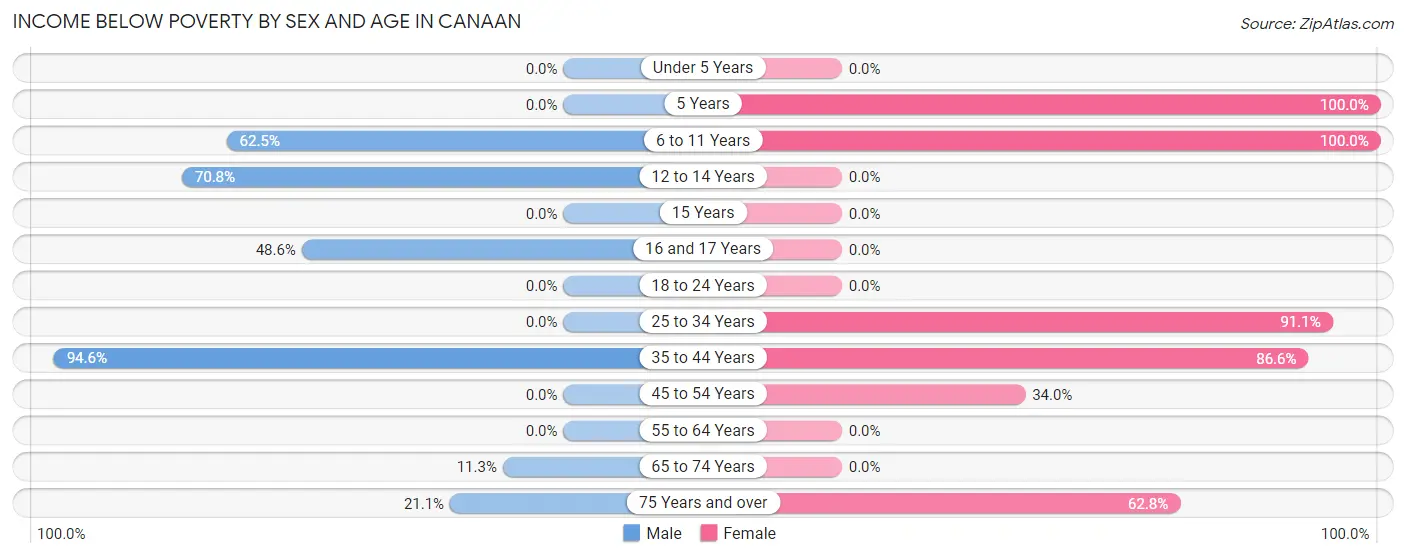
| Age Bracket | Male | Female |
| Under 5 Years | 0 (0.0%) | 0 (0.0%) |
| 5 Years | 0 (0.0%) | 20 (100.0%) |
| 6 to 11 Years | 50 (62.5%) | 27 (100.0%) |
| 12 to 14 Years | 80 (70.8%) | 0 (0.0%) |
| 15 Years | 0 (0.0%) | 0 (0.0%) |
| 16 and 17 Years | 34 (48.6%) | 0 (0.0%) |
| 18 to 24 Years | 0 (0.0%) | 0 (0.0%) |
| 25 to 34 Years | 0 (0.0%) | 51 (91.1%) |
| 35 to 44 Years | 105 (94.6%) | 71 (86.6%) |
| 45 to 54 Years | 0 (0.0%) | 32 (34.0%) |
| 55 to 64 Years | 0 (0.0%) | 0 (0.0%) |
| 65 to 74 Years | 9 (11.3%) | 0 (0.0%) |
| 75 Years and over | 12 (21.0%) | 27 (62.8%) |
| Total | 290 (37.8%) | 228 (44.6%) |
Income Above Poverty by Sex and Age in Canaan
According to the poverty statistics in Canaan, males aged 18 to 24 years and females aged under 5 years are the age groups that are most secure financially, with 100.0% of males and 100.0% of females in these age groups living above the poverty line.
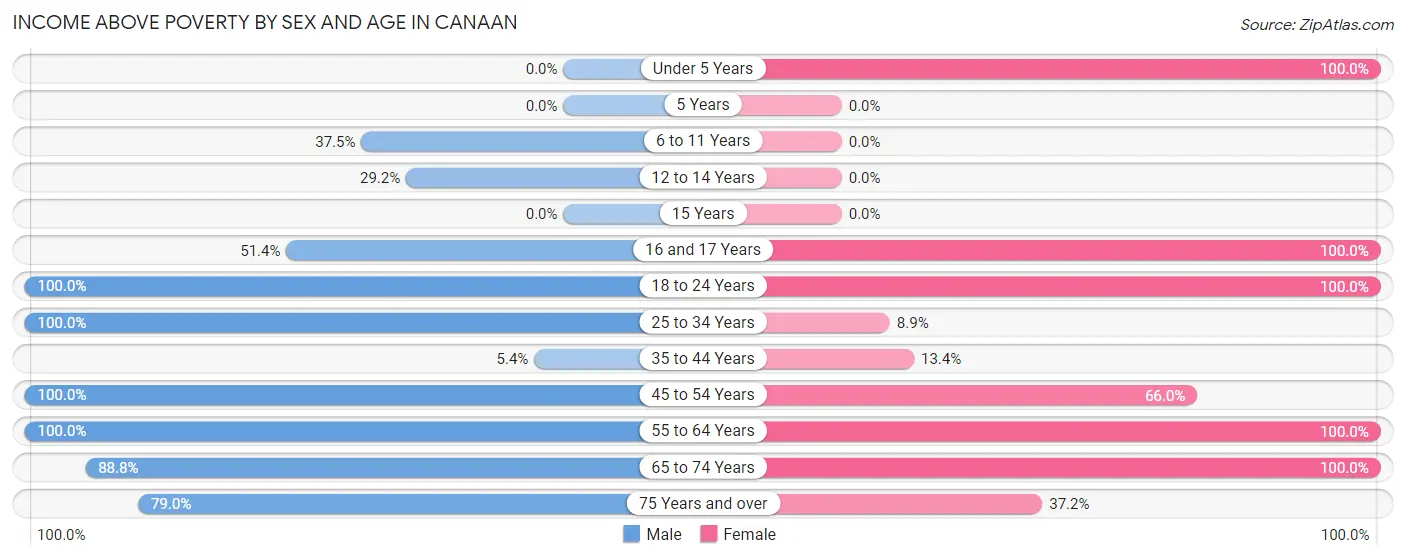
| Age Bracket | Male | Female |
| Under 5 Years | 0 (0.0%) | 9 (100.0%) |
| 5 Years | 0 (0.0%) | 0 (0.0%) |
| 6 to 11 Years | 30 (37.5%) | 0 (0.0%) |
| 12 to 14 Years | 33 (29.2%) | 0 (0.0%) |
| 15 Years | 0 (0.0%) | 0 (0.0%) |
| 16 and 17 Years | 36 (51.4%) | 16 (100.0%) |
| 18 to 24 Years | 15 (100.0%) | 70 (100.0%) |
| 25 to 34 Years | 119 (100.0%) | 5 (8.9%) |
| 35 to 44 Years | 6 (5.4%) | 11 (13.4%) |
| 45 to 54 Years | 60 (100.0%) | 62 (66.0%) |
| 55 to 64 Years | 62 (100.0%) | 51 (100.0%) |
| 65 to 74 Years | 71 (88.7%) | 43 (100.0%) |
| 75 Years and over | 45 (78.9%) | 16 (37.2%) |
| Total | 477 (62.2%) | 283 (55.4%) |
Income Below Poverty Among Married-Couple Families in Canaan
The poverty statistics for married-couple families in Canaan show that 38.4% or 73 of the total 190 families live below the poverty line. Families with 3 or 4 children have the highest poverty rate of 69.5%, comprising of 73 families. On the other hand, families with no children have the lowest poverty rate of 0.0%, which includes 0 families.
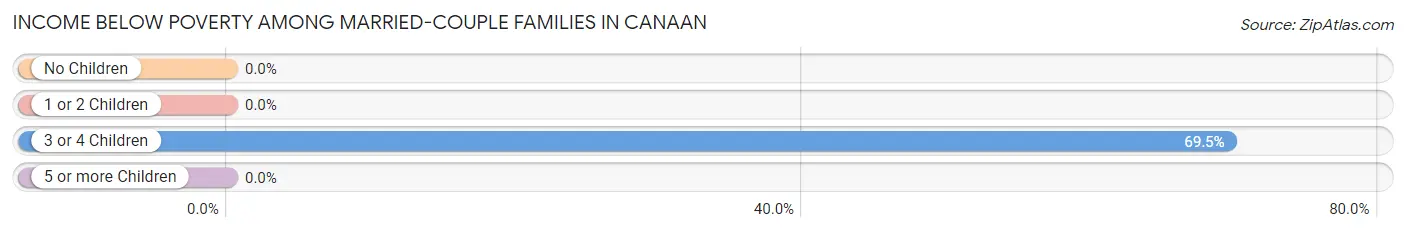
| Children | Above Poverty | Below Poverty |
| No Children | 55 (100.0%) | 0 (0.0%) |
| 1 or 2 Children | 30 (100.0%) | 0 (0.0%) |
| 3 or 4 Children | 32 (30.5%) | 73 (69.5%) |
| 5 or more Children | 0 (0.0%) | 0 (0.0%) |
| Total | 117 (61.6%) | 73 (38.4%) |
Income Below Poverty Among Single-Parent Households in Canaan
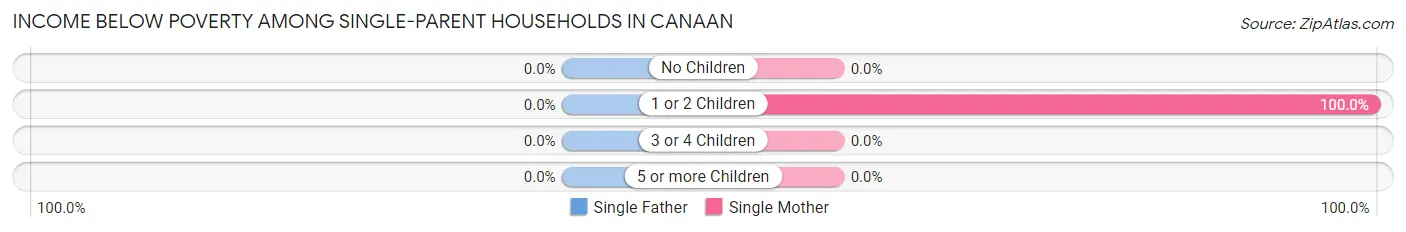
| Children | Single Father | Single Mother |
| No Children | 0 (0.0%) | 0 (0.0%) |
| 1 or 2 Children | 0 (0.0%) | 63 (100.0%) |
| 3 or 4 Children | 0 (0.0%) | 0 (0.0%) |
| 5 or more Children | 0 (0.0%) | 0 (0.0%) |
| Total | 0 (0.0%) | 63 (75.0%) |
Income Below Poverty Among Married-Couple vs Single-Parent Households in Canaan
The poverty data for Canaan shows that 73 of the married-couple family households (38.4%) and 63 of the single-parent households (56.8%) are living below the poverty level. Within the married-couple family households, those with 3 or 4 children have the highest poverty rate, with 73 households (69.5%) falling below the poverty line. Among the single-parent households, those with 1 or 2 children have the highest poverty rate, with 63 household (100.0%) living below poverty.
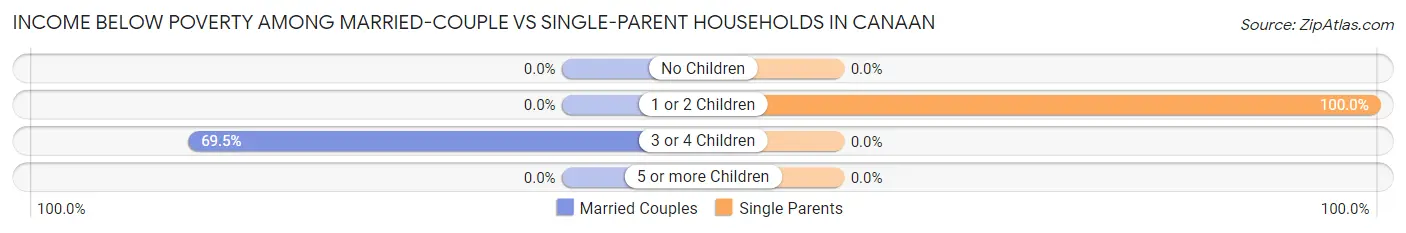
| Children | Married-Couple Families | Single-Parent Households |
| No Children | 0 (0.0%) | 0 (0.0%) |
| 1 or 2 Children | 0 (0.0%) | 63 (100.0%) |
| 3 or 4 Children | 73 (69.5%) | 0 (0.0%) |
| 5 or more Children | 0 (0.0%) | 0 (0.0%) |
| Total | 73 (38.4%) | 63 (56.8%) |
Race in Canaan
The most populous races in Canaan are White / Caucasian (1,045 | 77.2%), Hispanic or Latino (288 | 21.3%), and Two or more Races (169 | 12.5%).
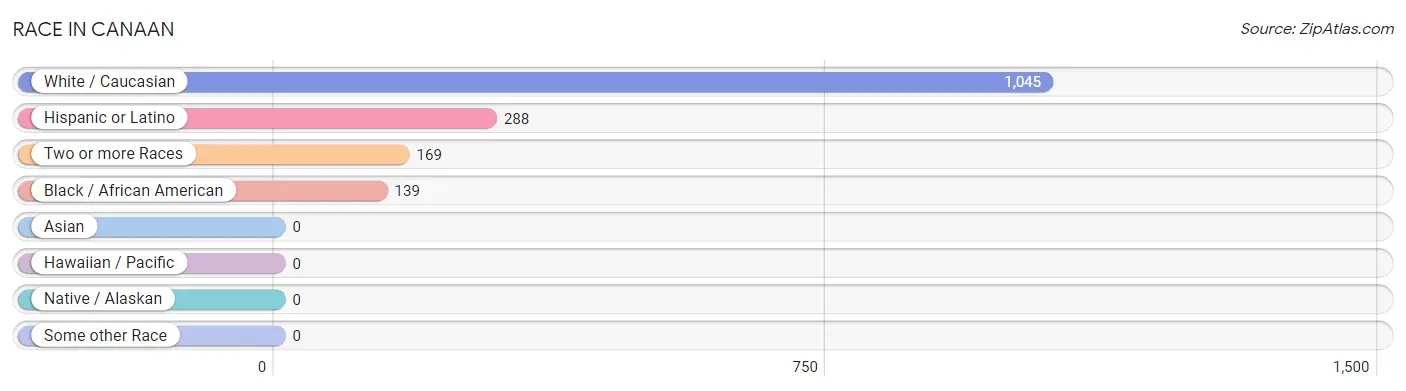
| Race | # Population | % Population |
| Asian | 0 | 0.0% |
| Black / African American | 139 | 10.3% |
| Hawaiian / Pacific | 0 | 0.0% |
| Hispanic or Latino | 288 | 21.3% |
| Native / Alaskan | 0 | 0.0% |
| White / Caucasian | 1,045 | 77.2% |
| Two or more Races | 169 | 12.5% |
| Some other Race | 0 | 0.0% |
| Total | 1,353 | 100.0% |
Ancestry in Canaan
The most populous ancestries reported in Canaan are Mexican (248 | 18.3%), Italian (234 | 17.3%), Irish (188 | 13.9%), English (153 | 11.3%), and Danish (128 | 9.5%), together accounting for 70.3% of all Canaan residents.
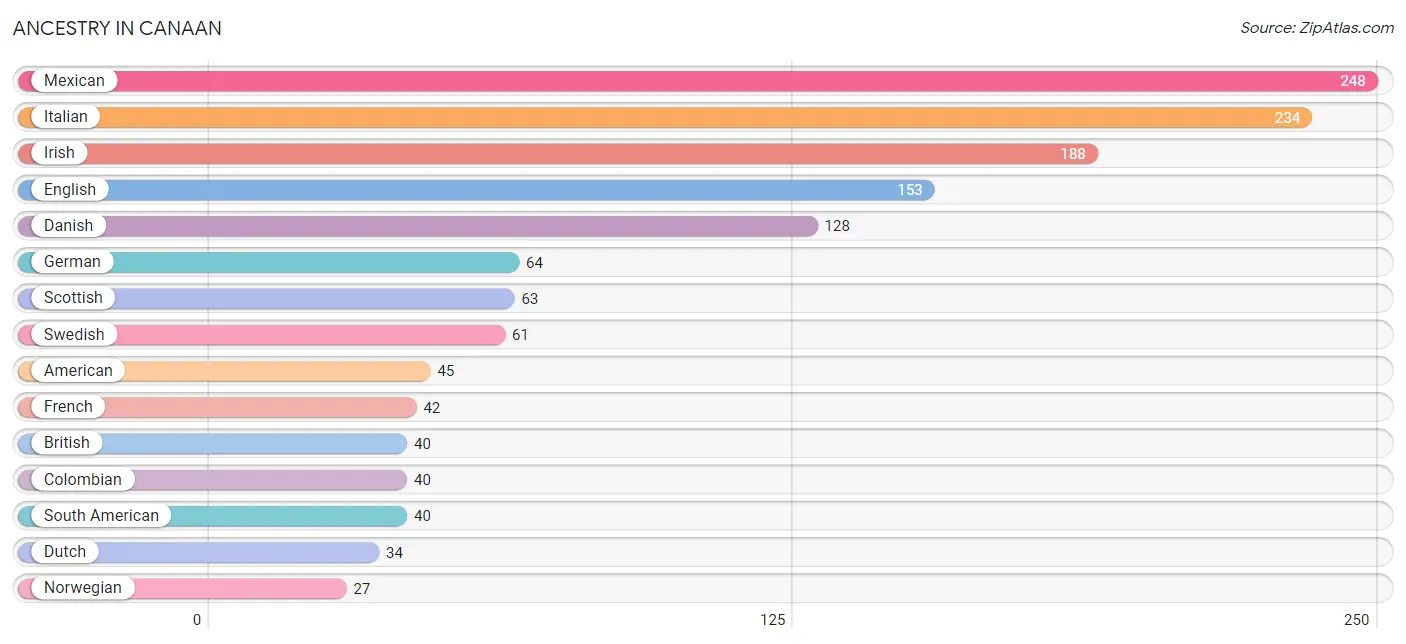
| Ancestry | # Population | % Population |
| American | 45 | 3.3% |
| Armenian | 11 | 0.8% |
| British | 40 | 3.0% |
| Colombian | 40 | 3.0% |
| Danish | 128 | 9.5% |
| Dutch | 34 | 2.5% |
| English | 153 | 11.3% |
| European | 3 | 0.2% |
| French | 42 | 3.1% |
| French Canadian | 24 | 1.8% |
| German | 64 | 4.7% |
| Irish | 188 | 13.9% |
| Italian | 234 | 17.3% |
| Mexican | 248 | 18.3% |
| Norwegian | 27 | 2.0% |
| Polish | 23 | 1.7% |
| Scottish | 63 | 4.7% |
| South American | 40 | 3.0% |
| Swedish | 61 | 4.5% |
| Swiss | 8 | 0.6% | View All 20 Rows |
Immigrants in Canaan
The most numerous immigrant groups reported in Canaan came from Central America (147 | 10.9%), Latin America (147 | 10.9%), Mexico (147 | 10.9%), and Canada (15 | 1.1%), together accounting for 33.7% of all Canaan residents.
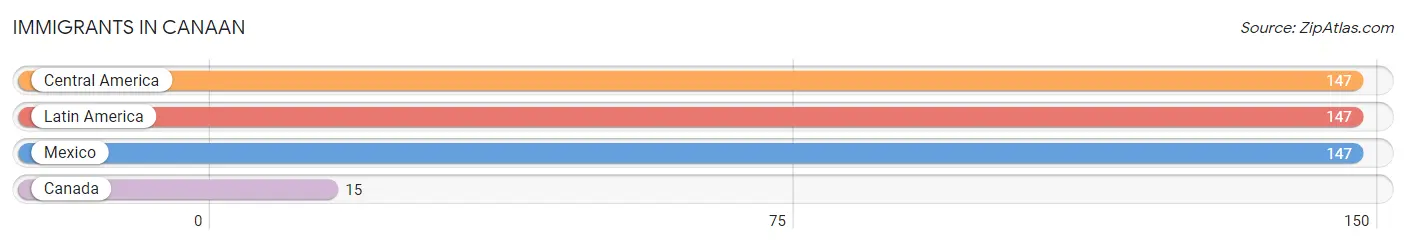
| Immigration Origin | # Population | % Population |
| Canada | 15 | 1.1% |
| Central America | 147 | 10.9% |
| Latin America | 147 | 10.9% |
| Mexico | 147 | 10.9% | View All 4 Rows |
Sex and Age in Canaan
Sex and Age in Canaan
The most populous age groups in Canaan are 10 to 14 Years (193 | 25.2%) for men and 35 to 39 Years (82 | 14.0%) for women.
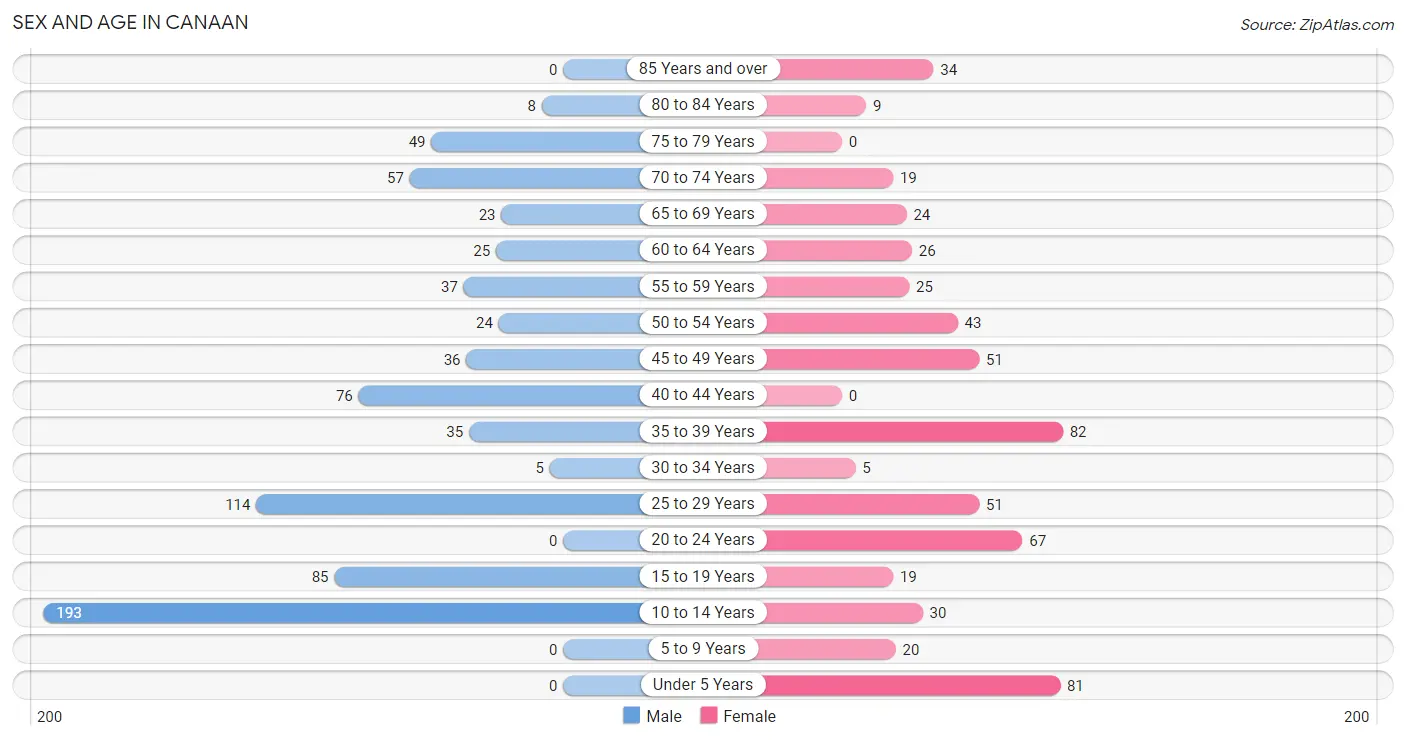
| Age Bracket | Male | Female |
| Under 5 Years | 0 (0.0%) | 81 (13.8%) |
| 5 to 9 Years | 0 (0.0%) | 20 (3.4%) |
| 10 to 14 Years | 193 (25.2%) | 30 (5.1%) |
| 15 to 19 Years | 85 (11.1%) | 19 (3.2%) |
| 20 to 24 Years | 0 (0.0%) | 67 (11.4%) |
| 25 to 29 Years | 114 (14.9%) | 51 (8.7%) |
| 30 to 34 Years | 5 (0.6%) | 5 (0.9%) |
| 35 to 39 Years | 35 (4.6%) | 82 (14.0%) |
| 40 to 44 Years | 76 (9.9%) | 0 (0.0%) |
| 45 to 49 Years | 36 (4.7%) | 51 (8.7%) |
| 50 to 54 Years | 24 (3.1%) | 43 (7.3%) |
| 55 to 59 Years | 37 (4.8%) | 25 (4.3%) |
| 60 to 64 Years | 25 (3.3%) | 26 (4.4%) |
| 65 to 69 Years | 23 (3.0%) | 24 (4.1%) |
| 70 to 74 Years | 57 (7.4%) | 19 (3.2%) |
| 75 to 79 Years | 49 (6.4%) | 0 (0.0%) |
| 80 to 84 Years | 8 (1.0%) | 9 (1.5%) |
| 85 Years and over | 0 (0.0%) | 34 (5.8%) |
| Total | 767 (100.0%) | 586 (100.0%) |
Families and Households in Canaan
Median Family Size in Canaan
The median family size in Canaan is 2.87 persons per family, with married-couple families (190 | 63.1%) accounting for the largest median family size of 3.26 persons per family. On the other hand, single female/mother families (84 | 27.9%) represent the smallest median family size with 2.19 persons per family.
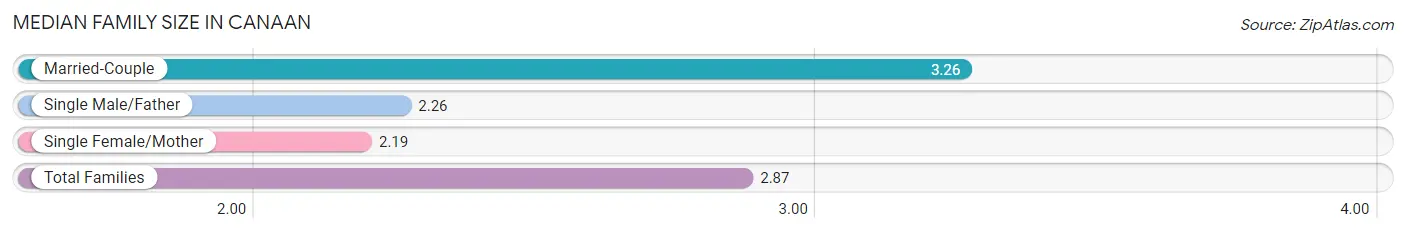
| Family Type | # Families | Family Size |
| Married-Couple | 190 (63.1%) | 3.26 |
| Single Male/Father | 27 (9.0%) | 2.26 |
| Single Female/Mother | 84 (27.9%) | 2.19 |
| Total Families | 301 (100.0%) | 2.87 |
Median Household Size in Canaan
The median household size in Canaan is 2.39 persons per household, with single male/father households (27 | 4.8%) accounting for the largest median household size of 7.41 persons per household. non-family households (265 | 46.8%) represent the smallest median household size with 1.28 persons per household.
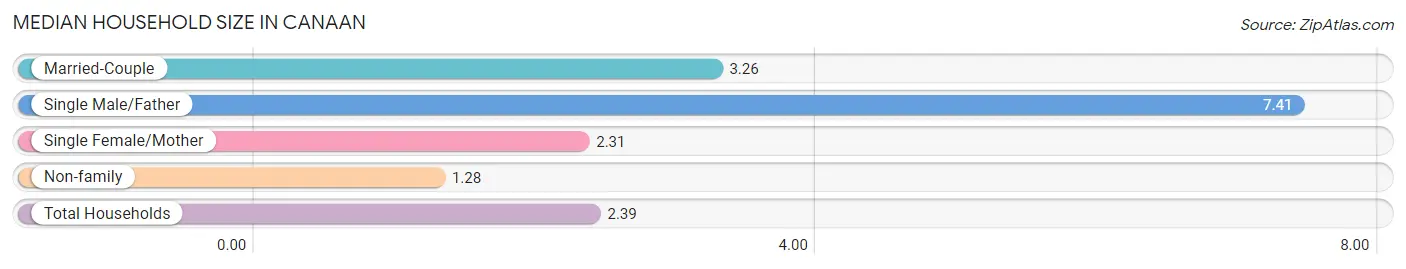
| Household Type | # Households | Household Size |
| Married-Couple | 190 (33.6%) | 3.26 |
| Single Male/Father | 27 (4.8%) | 7.41 |
| Single Female/Mother | 84 (14.8%) | 2.31 |
| Non-family | 265 (46.8%) | 1.28 |
| Total Households | 566 (100.0%) | 2.39 |
Household Size by Marriage Status in Canaan
Out of a total of 566 households in Canaan, 301 (53.2%) are family households, while 265 (46.8%) are nonfamily households. The most numerous type of family households are 5-person households, comprising 105, and the most common type of nonfamily households are 1-person households, comprising 241.
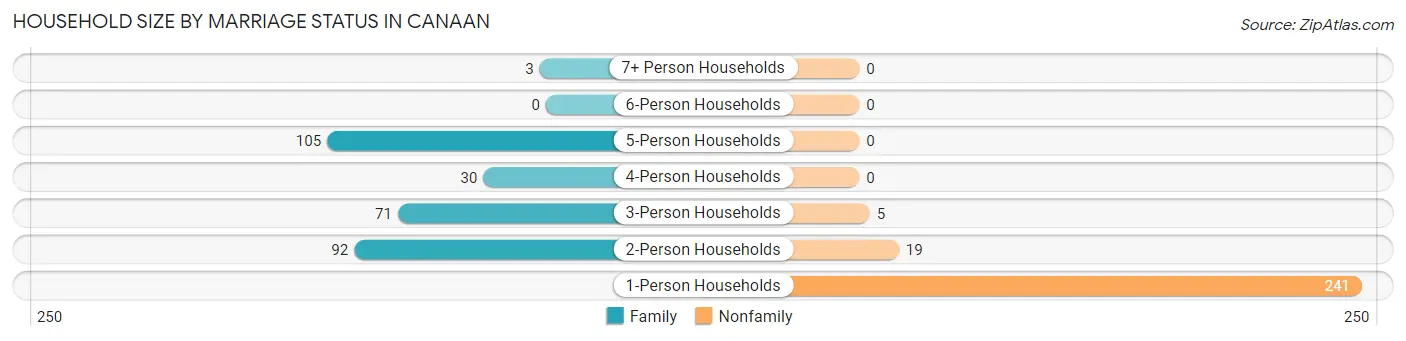
| Household Size | Family Households | Nonfamily Households |
| 1-Person Households | - | 241 (42.6%) |
| 2-Person Households | 92 (16.3%) | 19 (3.4%) |
| 3-Person Households | 71 (12.5%) | 5 (0.9%) |
| 4-Person Households | 30 (5.3%) | 0 (0.0%) |
| 5-Person Households | 105 (18.5%) | 0 (0.0%) |
| 6-Person Households | 0 (0.0%) | 0 (0.0%) |
| 7+ Person Households | 3 (0.5%) | 0 (0.0%) |
| Total | 301 (53.2%) | 265 (46.8%) |
Female Fertility in Canaan
Fertility by Age in Canaan
| Age Bracket | Women with Births | Births / 1,000 Women |
| 15 to 19 years | 0 (0.0%) | 0.0 |
| 20 to 34 years | 0 (0.0%) | 0.0 |
| 35 to 50 years | 0 (0.0%) | 0.0 |
| Total | 0 (0.0%) | 0.0 |
Fertility by Age by Marriage Status in Canaan
| Age Bracket | Married | Unmarried |
| 15 to 19 years | 0 (0.0%) | 0 (0.0%) |
| 20 to 34 years | 0 (0.0%) | 0 (0.0%) |
| 35 to 50 years | 0 (0.0%) | 0 (0.0%) |
| Total | 0 (0.0%) | 0 (0.0%) |
Fertility by Education in Canaan
| Educational Attainment | Women with Births | Births / 1,000 Women |
| Less than High School | 0 (0.0%) | 0.0 |
| High School Diploma | 0 (0.0%) | 0.0 |
| College or Associate's Degree | 0 (0.0%) | 0.0 |
| Bachelor's Degree | 0 (0.0%) | 0.0 |
| Graduate Degree | 0 (0.0%) | 0.0 |
| Total | 0 (0.0%) | 0.0 |
Fertility by Education by Marriage Status in Canaan
| Educational Attainment | Married | Unmarried |
| Less than High School | 0 (0.0%) | 0 (0.0%) |
| High School Diploma | 0 (0.0%) | 0 (0.0%) |
| College or Associate's Degree | 0 (0.0%) | 0 (0.0%) |
| Bachelor's Degree | 0 (0.0%) | 0 (0.0%) |
| Graduate Degree | 0 (0.0%) | 0 (0.0%) |
| Total | 0 (0.0%) | 0 (0.0%) |
Employment Characteristics in Canaan
Employment by Class of Employer in Canaan
Among the 519 employed individuals in Canaan, private company employees (260 | 50.1%), not-for-profit organizations (122 | 23.5%), and self-employed (incorporated) (79 | 15.2%) make up the most common classes of employment.
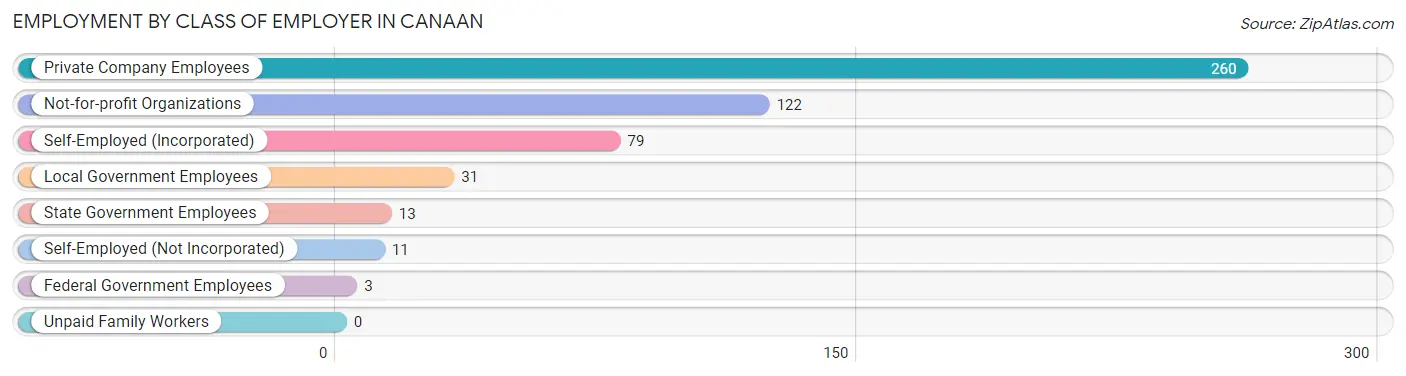
| Employer Class | # Employees | % Employees |
| Private Company Employees | 260 | 50.1% |
| Self-Employed (Incorporated) | 79 | 15.2% |
| Self-Employed (Not Incorporated) | 11 | 2.1% |
| Not-for-profit Organizations | 122 | 23.5% |
| Local Government Employees | 31 | 6.0% |
| State Government Employees | 13 | 2.5% |
| Federal Government Employees | 3 | 0.6% |
| Unpaid Family Workers | 0 | 0.0% |
| Total | 519 | 100.0% |
Employment Status by Age in Canaan
According to the labor force statistics for Canaan, out of the total population over 16 years of age (1,029), 57.7% or 594 individuals are in the labor force, with 12.7% or 75 of them unemployed. The age group with the highest labor force participation rate is 20 to 24 years, with 100.0% or 67 individuals in the labor force. Within the labor force, the 45 to 54 years age range has the highest percentage of unemployed individuals, with 26.2% or 32 of them being unemployed.
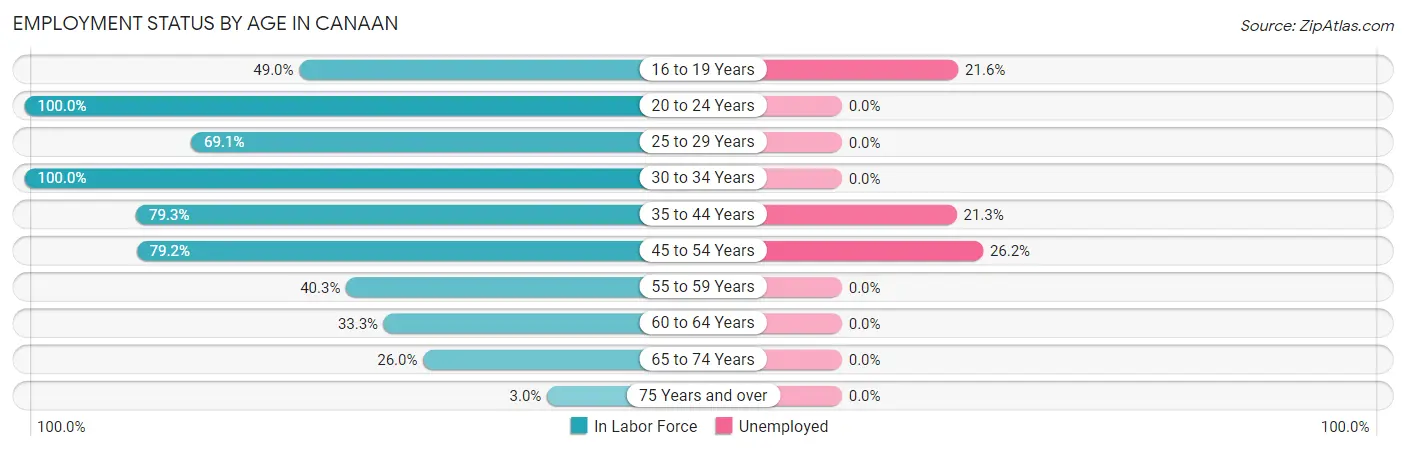
| Age Bracket | In Labor Force | Unemployed |
| 16 to 19 Years | 51 (49.0%) | 11 (21.6%) |
| 20 to 24 Years | 67 (100.0%) | 0 (0.0%) |
| 25 to 29 Years | 114 (69.1%) | 0 (0.0%) |
| 30 to 34 Years | 10 (100.0%) | 0 (0.0%) |
| 35 to 44 Years | 153 (79.3%) | 33 (21.3%) |
| 45 to 54 Years | 122 (79.2%) | 32 (26.2%) |
| 55 to 59 Years | 25 (40.3%) | 0 (0.0%) |
| 60 to 64 Years | 17 (33.3%) | 0 (0.0%) |
| 65 to 74 Years | 32 (26.0%) | 0 (0.0%) |
| 75 Years and over | 3 (3.0%) | 0 (0.0%) |
| Total | 594 (57.7%) | 75 (12.7%) |
Employment Status by Educational Attainment in Canaan
According to labor force statistics for Canaan, 69.4% of individuals (441) out of the total population between 25 and 64 years of age (635) are in the labor force, with 14.6% or 64 of them being unemployed. The group with the highest labor force participation rate are those with the educational attainment of college / associate degree, with 77.6% or 121 individuals in the labor force. Within the labor force, individuals with college / associate degree education have the highest percentage of unemployment, with 52.9% or 64 of them being unemployed.
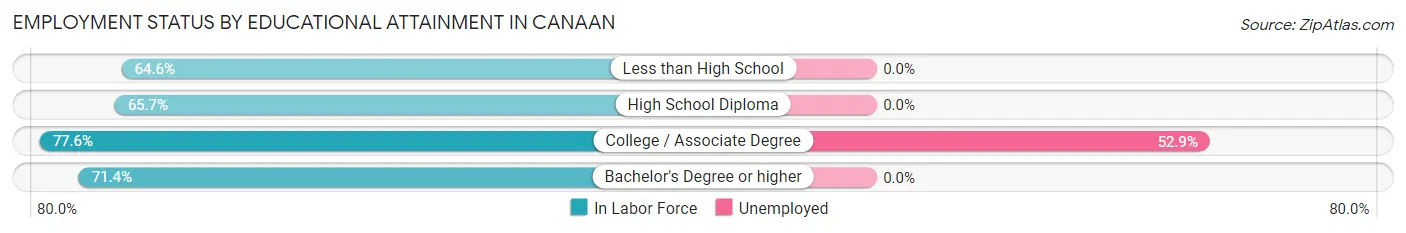
| Educational Attainment | In Labor Force | Unemployed |
| Less than High School | 73 (64.6%) | 0 (0.0%) |
| High School Diploma | 167 (65.7%) | 0 (0.0%) |
| College / Associate Degree | 121 (77.6%) | 83 (52.9%) |
| Bachelor's Degree or higher | 80 (71.4%) | 0 (0.0%) |
| Total | 441 (69.4%) | 93 (14.6%) |
Employment Occupations by Sex in Canaan
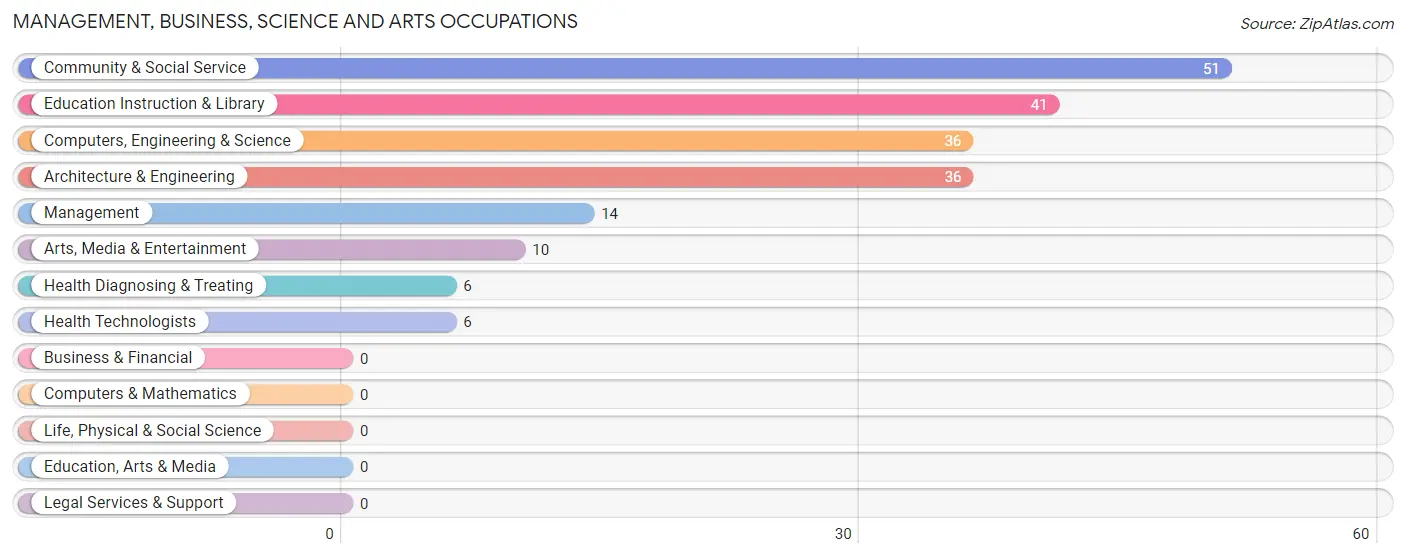
Management, Business, Science and Arts Occupations
The most common Management, Business, Science and Arts occupations in Canaan are Community & Social Service (51 | 9.9%), Education Instruction & Library (41 | 8.0%), Computers, Engineering & Science (36 | 7.0%), Architecture & Engineering (36 | 7.0%), and Management (14 | 2.7%).
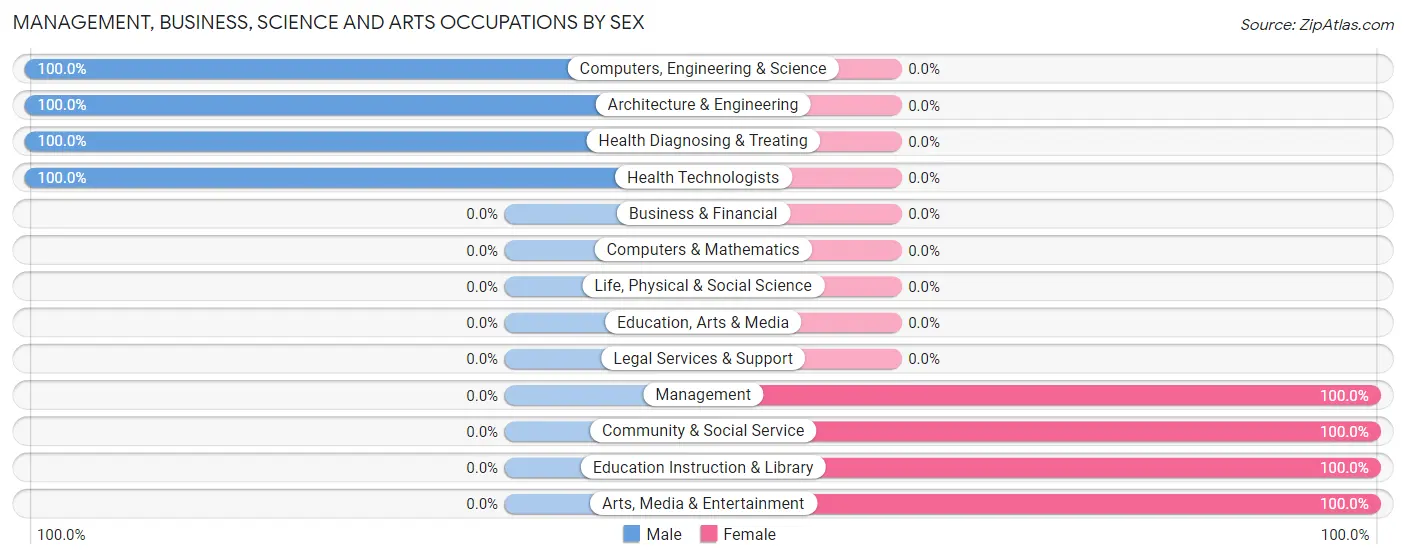
Management, Business, Science and Arts Occupations by Sex
Within the Management, Business, Science and Arts occupations in Canaan, the most male-oriented occupations are Computers, Engineering & Science (100.0%), Architecture & Engineering (100.0%), and Health Diagnosing & Treating (100.0%), while the most female-oriented occupations are Management (100.0%), Community & Social Service (100.0%), and Education Instruction & Library (100.0%).
| Occupation | Male | Female |
| Management | 0 (0.0%) | 14 (100.0%) |
| Business & Financial | 0 (0.0%) | 0 (0.0%) |
| Computers, Engineering & Science | 36 (100.0%) | 0 (0.0%) |
| Computers & Mathematics | 0 (0.0%) | 0 (0.0%) |
| Architecture & Engineering | 36 (100.0%) | 0 (0.0%) |
| Life, Physical & Social Science | 0 (0.0%) | 0 (0.0%) |
| Community & Social Service | 0 (0.0%) | 51 (100.0%) |
| Education, Arts & Media | 0 (0.0%) | 0 (0.0%) |
| Legal Services & Support | 0 (0.0%) | 0 (0.0%) |
| Education Instruction & Library | 0 (0.0%) | 41 (100.0%) |
| Arts, Media & Entertainment | 0 (0.0%) | 10 (100.0%) |
| Health Diagnosing & Treating | 6 (100.0%) | 0 (0.0%) |
| Health Technologists | 6 (100.0%) | 0 (0.0%) |
| Total (Category) | 42 (39.3%) | 65 (60.8%) |
| Total (Overall) | 334 (64.7%) | 182 (35.3%) |
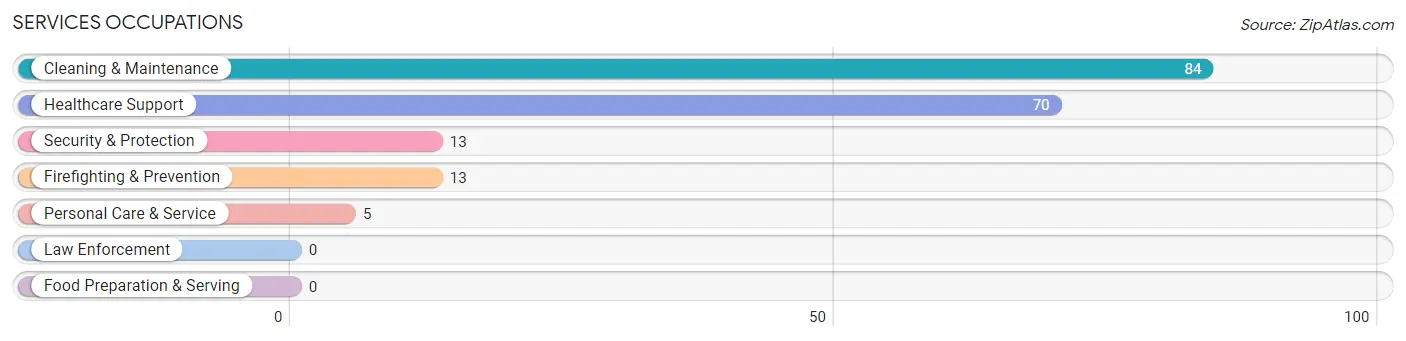
Services Occupations
The most common Services occupations in Canaan are Cleaning & Maintenance (84 | 16.3%), Healthcare Support (70 | 13.6%), Security & Protection (13 | 2.5%), Firefighting & Prevention (13 | 2.5%), and Personal Care & Service (5 | 1.0%).
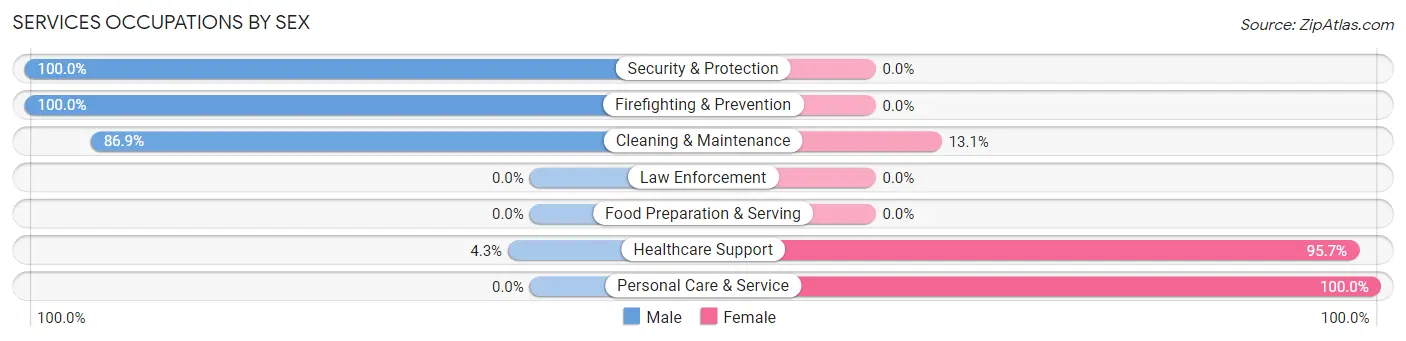
Services Occupations by Sex
Within the Services occupations in Canaan, the most male-oriented occupations are Security & Protection (100.0%), Firefighting & Prevention (100.0%), and Cleaning & Maintenance (86.9%), while the most female-oriented occupations are Personal Care & Service (100.0%), Healthcare Support (95.7%), and Cleaning & Maintenance (13.1%).
| Occupation | Male | Female |
| Healthcare Support | 3 (4.3%) | 67 (95.7%) |
| Security & Protection | 13 (100.0%) | 0 (0.0%) |
| Firefighting & Prevention | 13 (100.0%) | 0 (0.0%) |
| Law Enforcement | 0 (0.0%) | 0 (0.0%) |
| Food Preparation & Serving | 0 (0.0%) | 0 (0.0%) |
| Cleaning & Maintenance | 73 (86.9%) | 11 (13.1%) |
| Personal Care & Service | 0 (0.0%) | 5 (100.0%) |
| Total (Category) | 89 (51.7%) | 83 (48.3%) |
| Total (Overall) | 334 (64.7%) | 182 (35.3%) |
Sales and Office Occupations
The most common Sales and Office occupations in Canaan are Sales & Related (43 | 8.3%), and Office & Administration (25 | 4.8%).
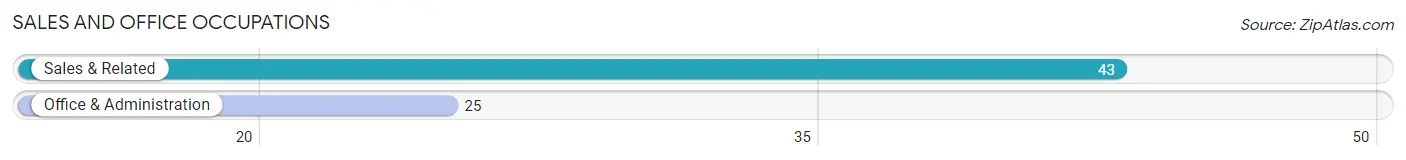
Sales and Office Occupations by Sex
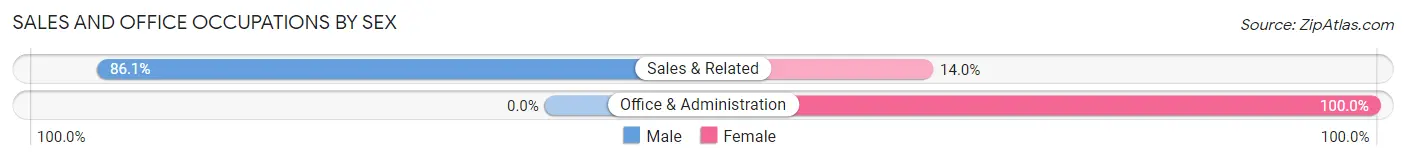
| Occupation | Male | Female |
| Sales & Related | 37 (86.1%) | 6 (14.0%) |
| Office & Administration | 0 (0.0%) | 25 (100.0%) |
| Total (Category) | 37 (54.4%) | 31 (45.6%) |
| Total (Overall) | 334 (64.7%) | 182 (35.3%) |
Natural Resources, Construction and Maintenance Occupations
The most common Natural Resources, Construction and Maintenance occupations in Canaan are Installation, Maintenance & Repair (67 | 13.0%), and Construction & Extraction (29 | 5.6%).
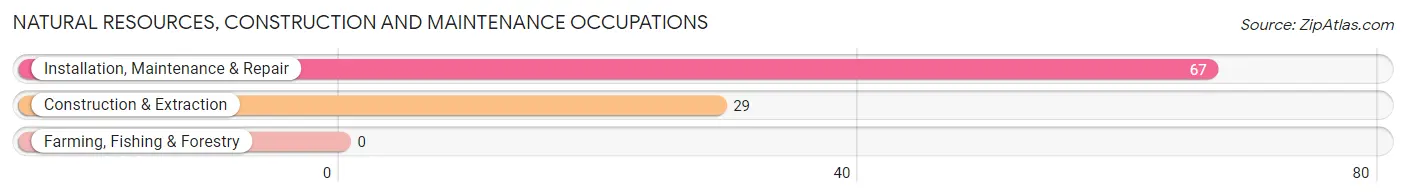
Natural Resources, Construction and Maintenance Occupations by Sex
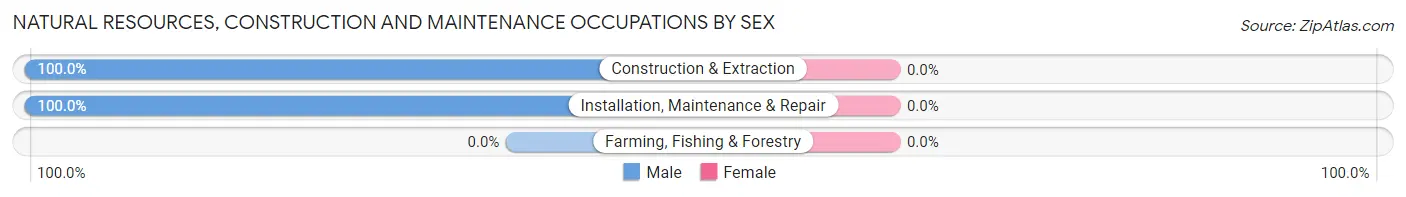
| Occupation | Male | Female |
| Farming, Fishing & Forestry | 0 (0.0%) | 0 (0.0%) |
| Construction & Extraction | 29 (100.0%) | 0 (0.0%) |
| Installation, Maintenance & Repair | 67 (100.0%) | 0 (0.0%) |
| Total (Category) | 96 (100.0%) | 0 (0.0%) |
| Total (Overall) | 334 (64.7%) | 182 (35.3%) |
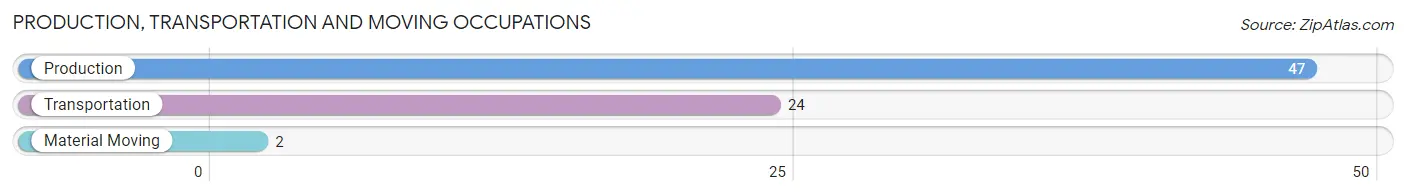
Production, Transportation and Moving Occupations
The most common Production, Transportation and Moving occupations in Canaan are Production (47 | 9.1%), Transportation (24 | 4.6%), and Material Moving (2 | 0.4%).
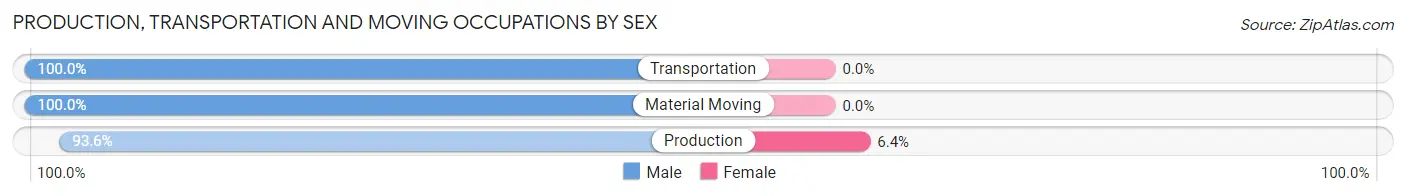
Production, Transportation and Moving Occupations by Sex
| Occupation | Male | Female |
| Production | 44 (93.6%) | 3 (6.4%) |
| Transportation | 24 (100.0%) | 0 (0.0%) |
| Material Moving | 2 (100.0%) | 0 (0.0%) |
| Total (Category) | 70 (95.9%) | 3 (4.1%) |
| Total (Overall) | 334 (64.7%) | 182 (35.3%) |
Employment Industries by Sex in Canaan
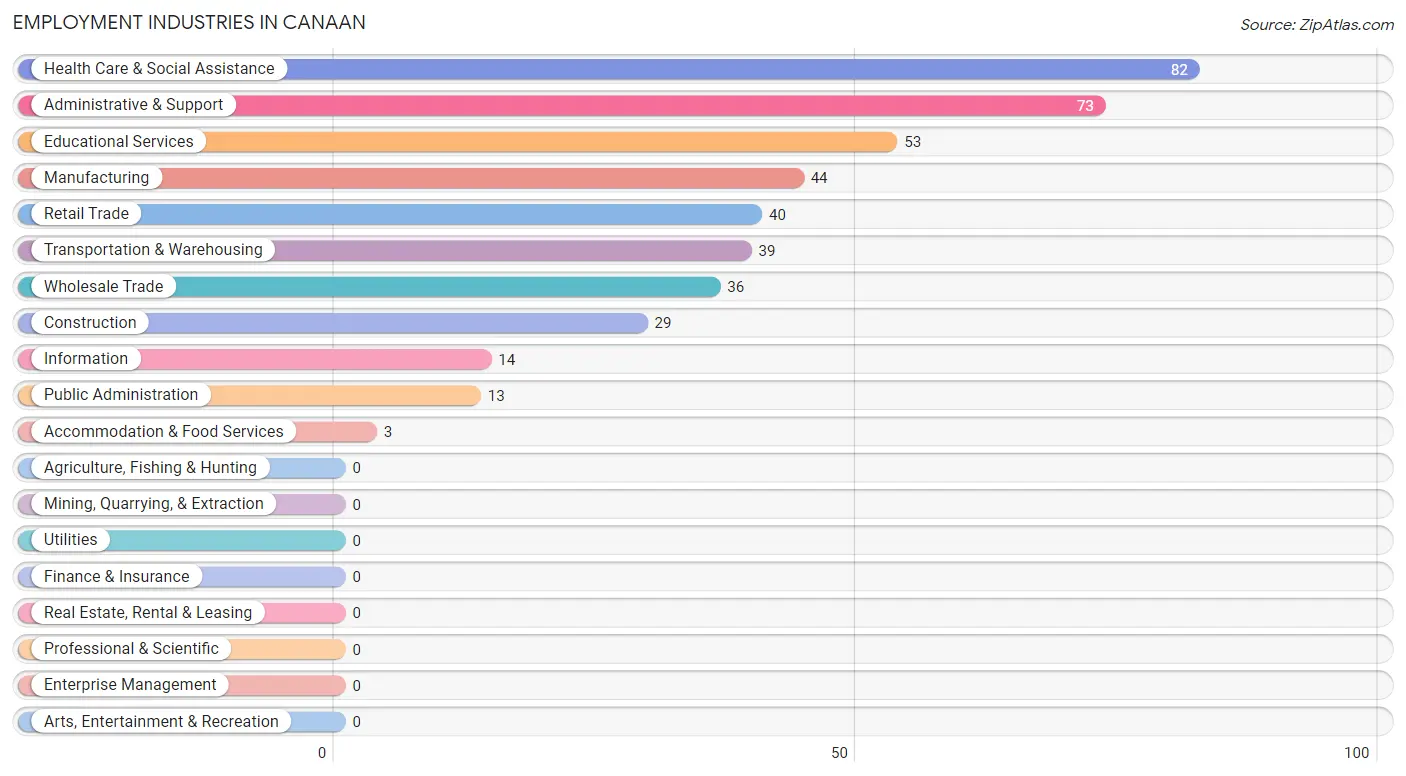
Employment Industries in Canaan
The major employment industries in Canaan include Health Care & Social Assistance (82 | 15.9%), Administrative & Support (73 | 14.1%), Educational Services (53 | 10.3%), Manufacturing (44 | 8.5%), and Retail Trade (40 | 7.7%).
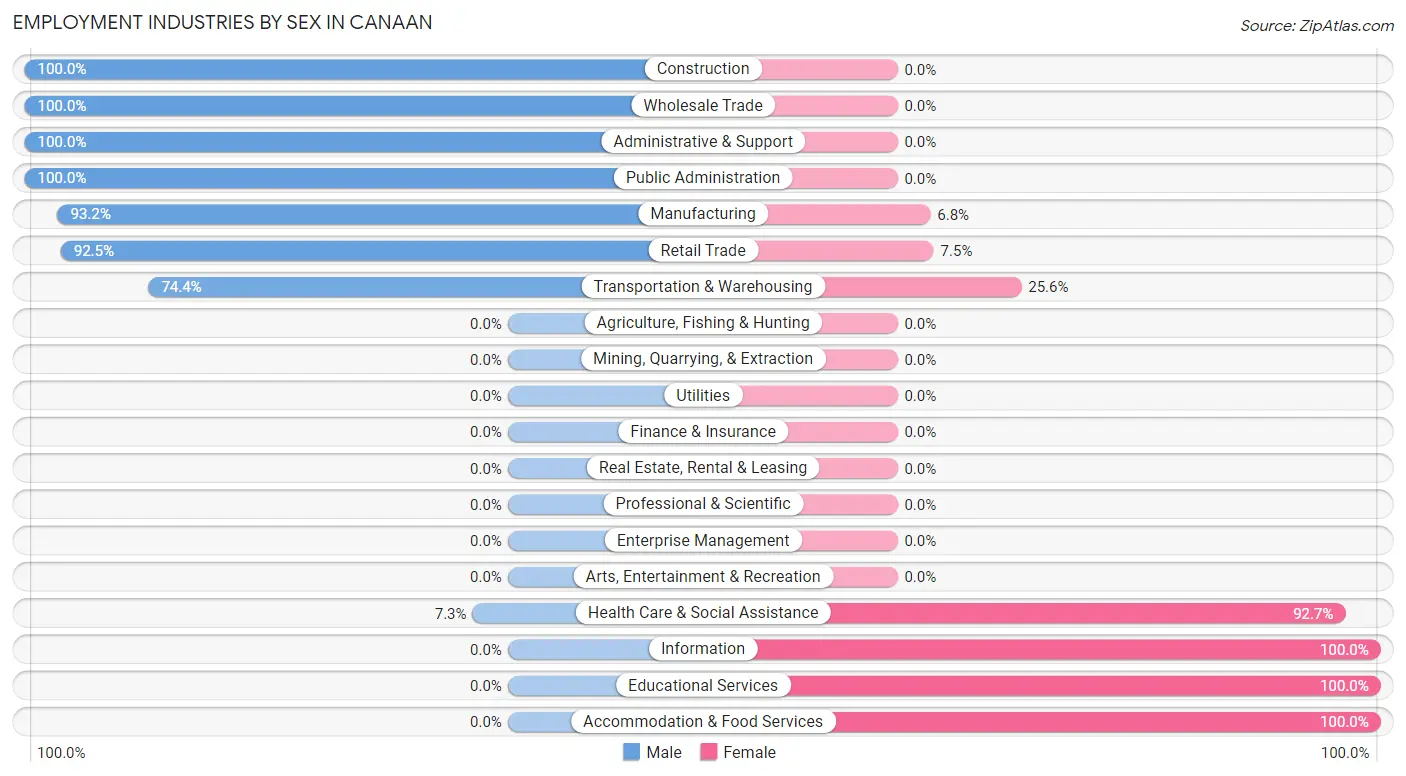
Employment Industries by Sex in Canaan
The Canaan industries that see more men than women are Construction (100.0%), Wholesale Trade (100.0%), and Administrative & Support (100.0%), whereas the industries that tend to have a higher number of women are Information (100.0%), Educational Services (100.0%), and Accommodation & Food Services (100.0%).
| Industry | Male | Female |
| Agriculture, Fishing & Hunting | 0 (0.0%) | 0 (0.0%) |
| Mining, Quarrying, & Extraction | 0 (0.0%) | 0 (0.0%) |
| Construction | 29 (100.0%) | 0 (0.0%) |
| Manufacturing | 41 (93.2%) | 3 (6.8%) |
| Wholesale Trade | 36 (100.0%) | 0 (0.0%) |
| Retail Trade | 37 (92.5%) | 3 (7.5%) |
| Transportation & Warehousing | 29 (74.4%) | 10 (25.6%) |
| Utilities | 0 (0.0%) | 0 (0.0%) |
| Information | 0 (0.0%) | 14 (100.0%) |
| Finance & Insurance | 0 (0.0%) | 0 (0.0%) |
| Real Estate, Rental & Leasing | 0 (0.0%) | 0 (0.0%) |
| Professional & Scientific | 0 (0.0%) | 0 (0.0%) |
| Enterprise Management | 0 (0.0%) | 0 (0.0%) |
| Administrative & Support | 73 (100.0%) | 0 (0.0%) |
| Educational Services | 0 (0.0%) | 53 (100.0%) |
| Health Care & Social Assistance | 6 (7.3%) | 76 (92.7%) |
| Arts, Entertainment & Recreation | 0 (0.0%) | 0 (0.0%) |
| Accommodation & Food Services | 0 (0.0%) | 3 (100.0%) |
| Public Administration | 13 (100.0%) | 0 (0.0%) |
| Total | 334 (64.7%) | 182 (35.3%) |
Education in Canaan
School Enrollment in Canaan
The most common levels of schooling among the 431 students in Canaan are middle school (140 | 32.5%), college / undergraduate (135 | 31.3%), and high school (133 | 30.9%).
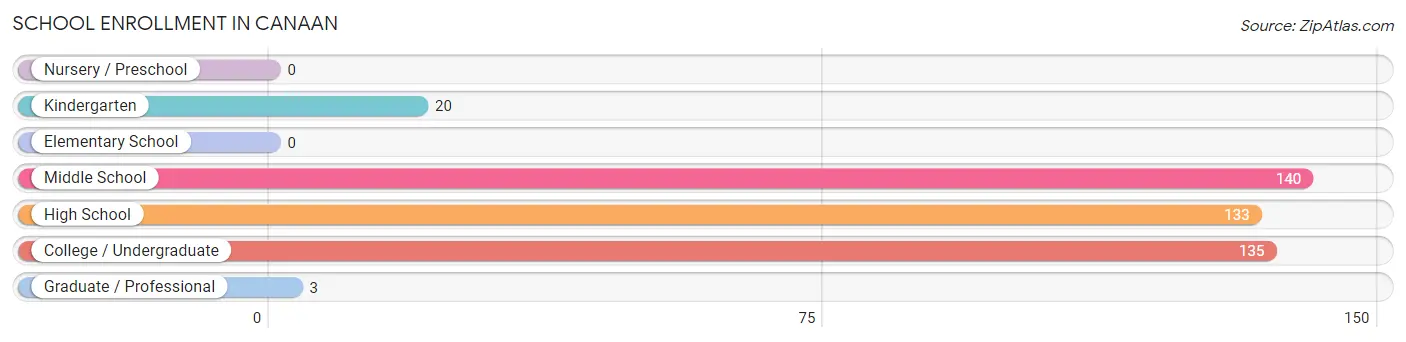
| School Level | # Students | % Students |
| Nursery / Preschool | 0 | 0.0% |
| Kindergarten | 20 | 4.6% |
| Elementary School | 0 | 0.0% |
| Middle School | 140 | 32.5% |
| High School | 133 | 30.9% |
| College / Undergraduate | 135 | 31.3% |
| Graduate / Professional | 3 | 0.7% |
| Total | 431 | 100.0% |
School Enrollment by Age by Funding Source in Canaan
Out of a total of 431 students who are enrolled in schools in Canaan, 130 (30.2%) attend a private institution, while the remaining 301 (69.8%) are enrolled in public schools. The age group of 20 to 24 year olds has the highest likelihood of being enrolled in private schools, with 67 (100.0% in the age bracket) enrolled. Conversely, the age group of 5 to 9 year old has the lowest likelihood of being enrolled in a private school, with 20 (100.0% in the age bracket) attending a public institution.
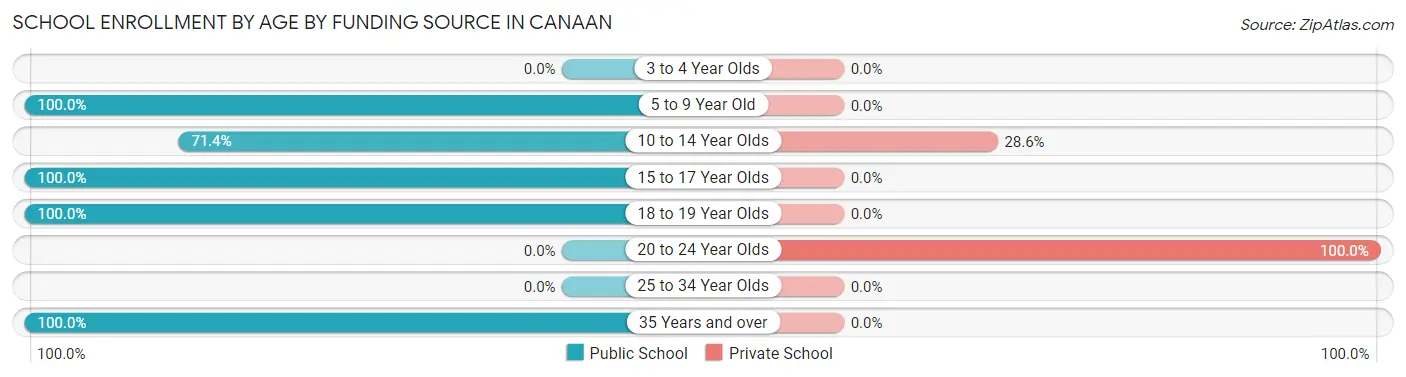
| Age Bracket | Public School | Private School |
| 3 to 4 Year Olds | 0 (0.0%) | 0 (0.0%) |
| 5 to 9 Year Old | 20 (100.0%) | 0 (0.0%) |
| 10 to 14 Year Olds | 157 (71.4%) | 63 (28.6%) |
| 15 to 17 Year Olds | 86 (100.0%) | 0 (0.0%) |
| 18 to 19 Year Olds | 3 (100.0%) | 0 (0.0%) |
| 20 to 24 Year Olds | 0 (0.0%) | 67 (100.0%) |
| 25 to 34 Year Olds | 0 (0.0%) | 0 (0.0%) |
| 35 Years and over | 35 (100.0%) | 0 (0.0%) |
| Total | 301 (69.8%) | 130 (30.2%) |
Educational Attainment by Field of Study in Canaan
Engineering (36 | 19.0%), social sciences (35 | 18.4%), liberal arts & history (32 | 16.8%), business (26 | 13.7%), and literature & languages (26 | 13.7%) are the most common fields of study among 190 individuals in Canaan who have obtained a bachelor's degree or higher.
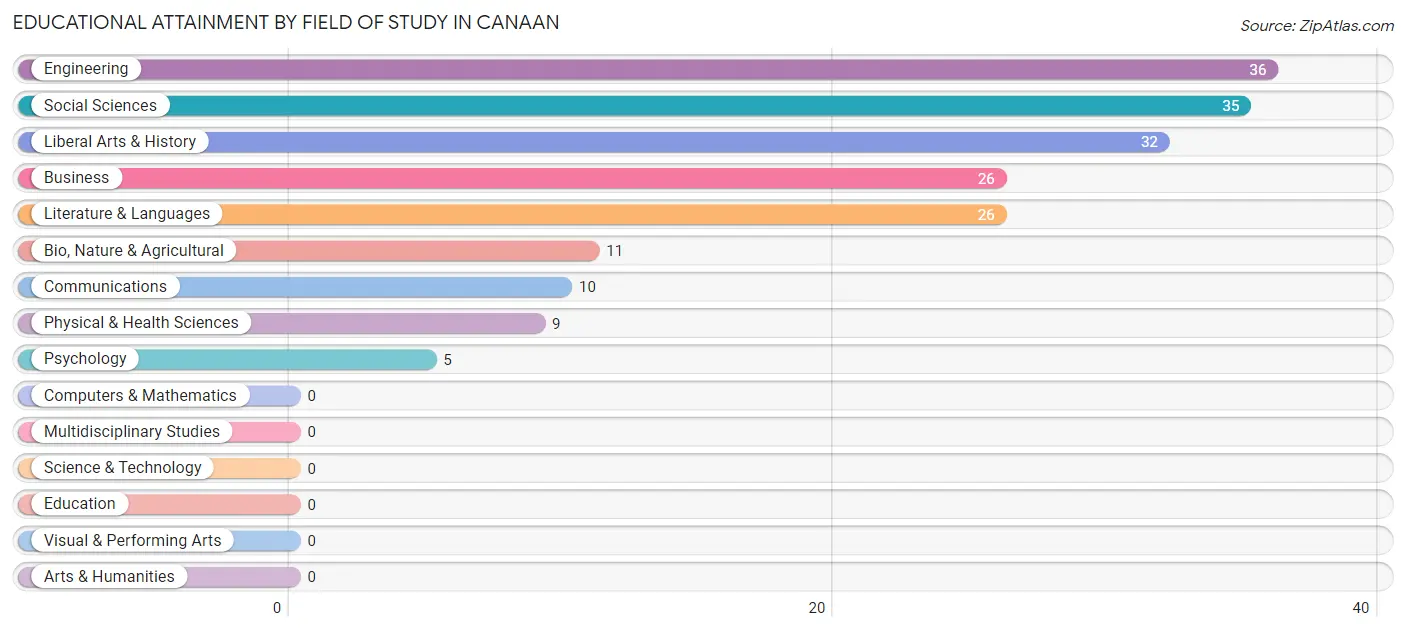
| Field of Study | # Graduates | % Graduates |
| Computers & Mathematics | 0 | 0.0% |
| Bio, Nature & Agricultural | 11 | 5.8% |
| Physical & Health Sciences | 9 | 4.7% |
| Psychology | 5 | 2.6% |
| Social Sciences | 35 | 18.4% |
| Engineering | 36 | 19.0% |
| Multidisciplinary Studies | 0 | 0.0% |
| Science & Technology | 0 | 0.0% |
| Business | 26 | 13.7% |
| Education | 0 | 0.0% |
| Literature & Languages | 26 | 13.7% |
| Liberal Arts & History | 32 | 16.8% |
| Visual & Performing Arts | 0 | 0.0% |
| Communications | 10 | 5.3% |
| Arts & Humanities | 0 | 0.0% |
| Total | 190 | 100.0% |
Transportation & Commute in Canaan
Vehicle Availability by Sex in Canaan
The most prevalent vehicle ownership categories in Canaan are males with 2 vehicles (160, accounting for 47.5%) and females with 2 vehicles (24, making up 87.9%).
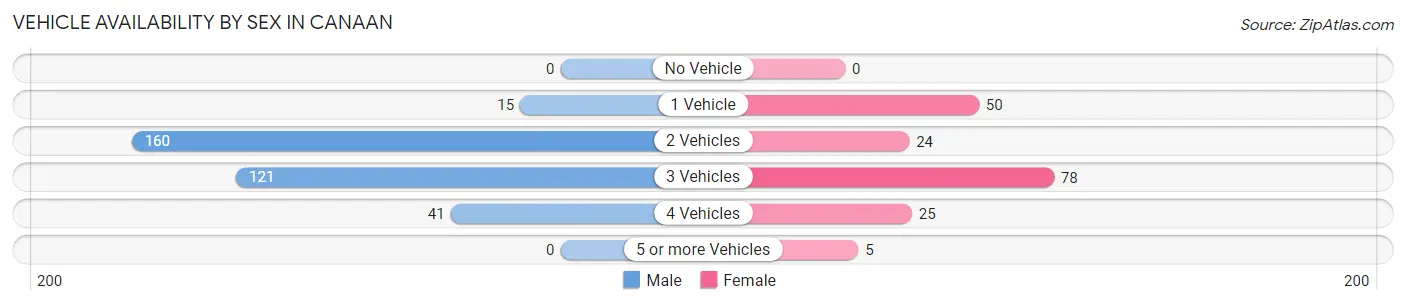
| Vehicles Available | Male | Female |
| No Vehicle | 0 (0.0%) | 0 (0.0%) |
| 1 Vehicle | 15 (4.4%) | 50 (27.5%) |
| 2 Vehicles | 160 (47.5%) | 24 (13.2%) |
| 3 Vehicles | 121 (35.9%) | 78 (42.9%) |
| 4 Vehicles | 41 (12.2%) | 25 (13.7%) |
| 5 or more Vehicles | 0 (0.0%) | 5 (2.8%) |
| Total | 337 (100.0%) | 182 (100.0%) |
Commute Time in Canaan
The most frequently occuring commute durations in Canaan are less than 5 minutes (163 commuters, 34.5%), 20 to 24 minutes (124 commuters, 26.2%), and 10 to 14 minutes (48 commuters, 10.2%).
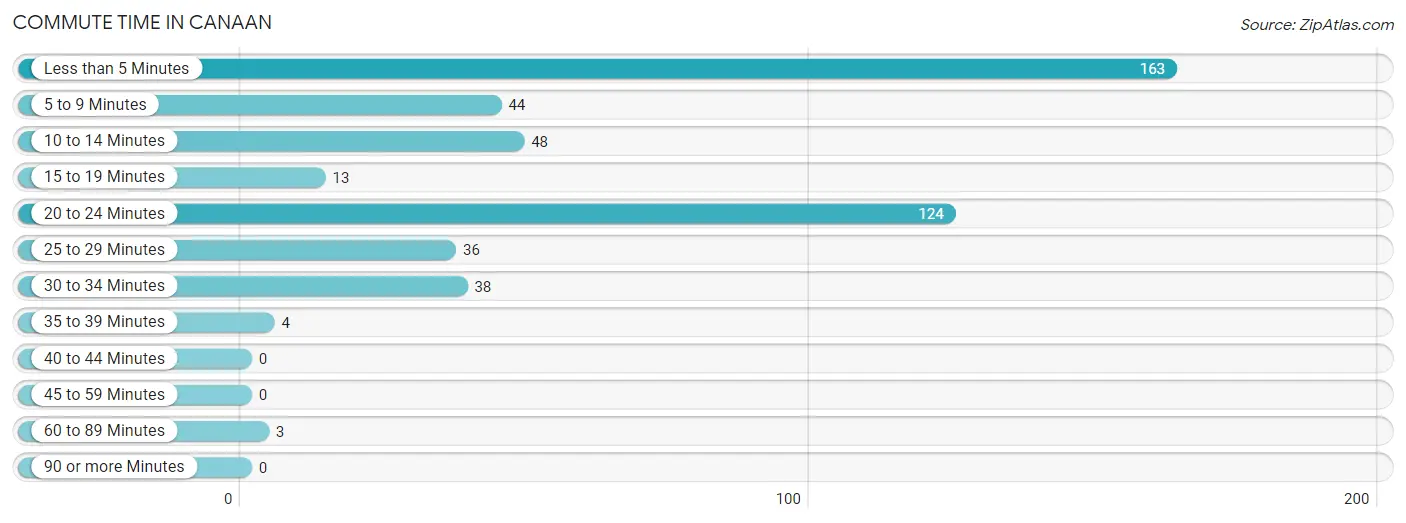
| Commute Time | # Commuters | % Commuters |
| Less than 5 Minutes | 163 | 34.5% |
| 5 to 9 Minutes | 44 | 9.3% |
| 10 to 14 Minutes | 48 | 10.2% |
| 15 to 19 Minutes | 13 | 2.8% |
| 20 to 24 Minutes | 124 | 26.2% |
| 25 to 29 Minutes | 36 | 7.6% |
| 30 to 34 Minutes | 38 | 8.0% |
| 35 to 39 Minutes | 4 | 0.9% |
| 40 to 44 Minutes | 0 | 0.0% |
| 45 to 59 Minutes | 0 | 0.0% |
| 60 to 89 Minutes | 3 | 0.6% |
| 90 or more Minutes | 0 | 0.0% |
Commute Time by Sex in Canaan
The most common commute times in Canaan are 20 to 24 minutes (110 commuters, 36.5%) for males and less than 5 minutes (67 commuters, 39.0%) for females.
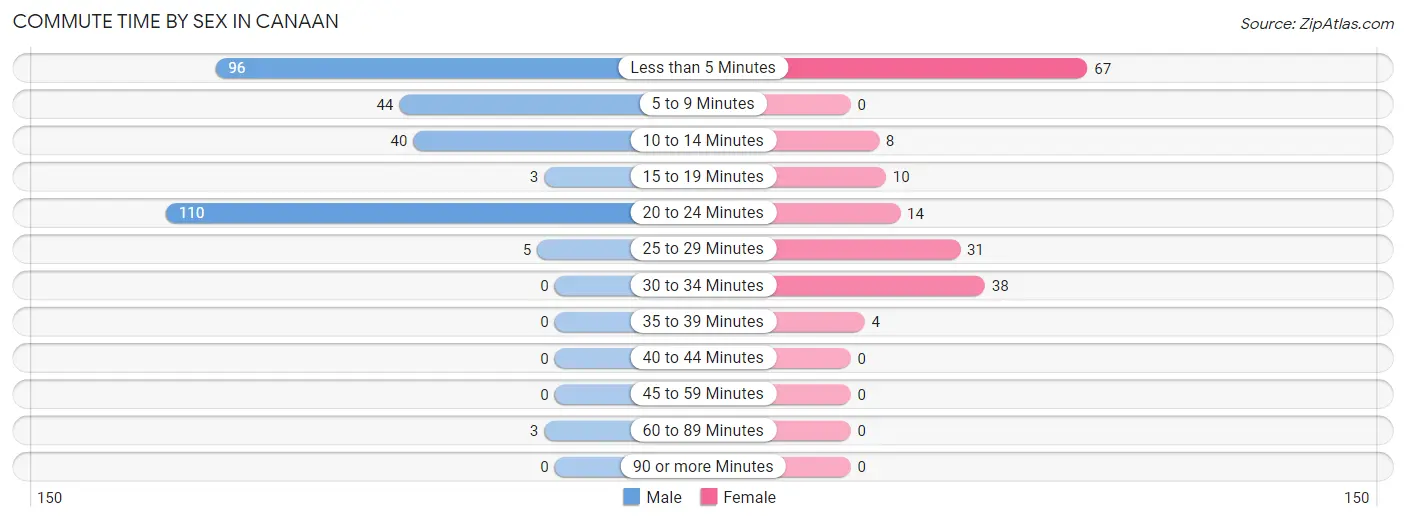
| Commute Time | Male | Female |
| Less than 5 Minutes | 96 (31.9%) | 67 (39.0%) |
| 5 to 9 Minutes | 44 (14.6%) | 0 (0.0%) |
| 10 to 14 Minutes | 40 (13.3%) | 8 (4.6%) |
| 15 to 19 Minutes | 3 (1.0%) | 10 (5.8%) |
| 20 to 24 Minutes | 110 (36.5%) | 14 (8.1%) |
| 25 to 29 Minutes | 5 (1.7%) | 31 (18.0%) |
| 30 to 34 Minutes | 0 (0.0%) | 38 (22.1%) |
| 35 to 39 Minutes | 0 (0.0%) | 4 (2.3%) |
| 40 to 44 Minutes | 0 (0.0%) | 0 (0.0%) |
| 45 to 59 Minutes | 0 (0.0%) | 0 (0.0%) |
| 60 to 89 Minutes | 3 (1.0%) | 0 (0.0%) |
| 90 or more Minutes | 0 (0.0%) | 0 (0.0%) |
Time of Departure to Work by Sex in Canaan
The most frequent times of departure to work in Canaan are 8:30 AM to 8:59 AM (85, 28.2%) for males and 6:30 AM to 6:59 AM (78, 45.4%) for females.
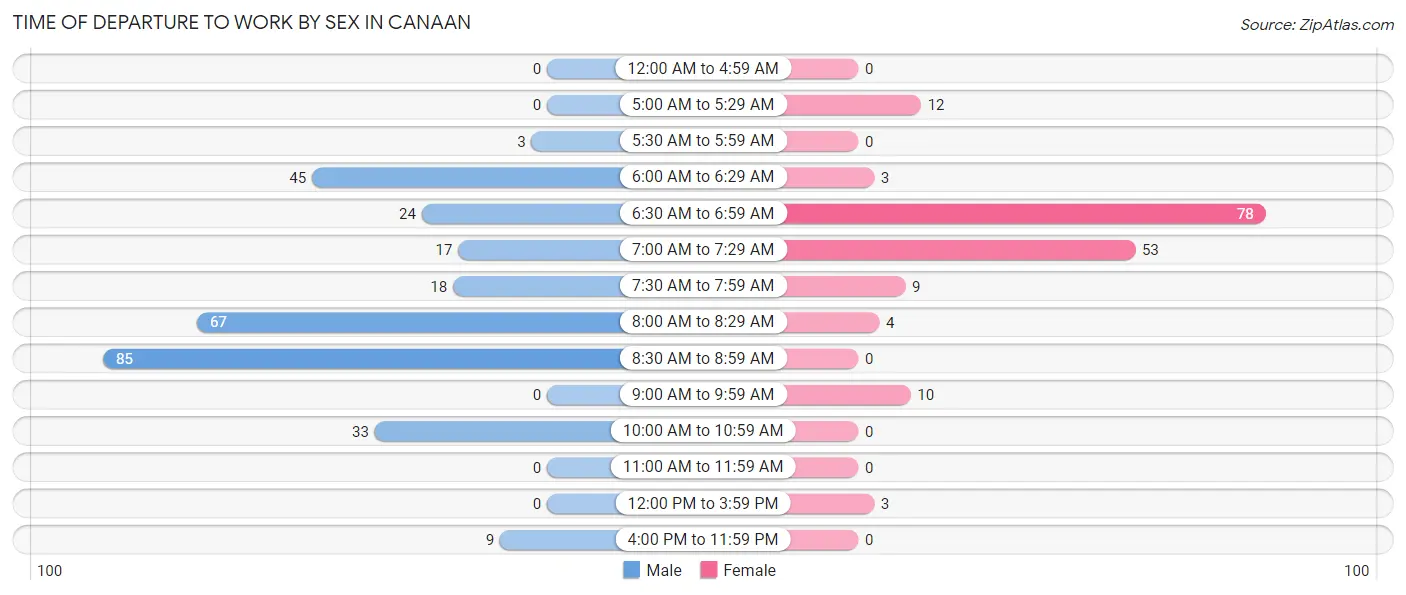
| Time of Departure | Male | Female |
| 12:00 AM to 4:59 AM | 0 (0.0%) | 0 (0.0%) |
| 5:00 AM to 5:29 AM | 0 (0.0%) | 12 (7.0%) |
| 5:30 AM to 5:59 AM | 3 (1.0%) | 0 (0.0%) |
| 6:00 AM to 6:29 AM | 45 (14.9%) | 3 (1.7%) |
| 6:30 AM to 6:59 AM | 24 (8.0%) | 78 (45.4%) |
| 7:00 AM to 7:29 AM | 17 (5.7%) | 53 (30.8%) |
| 7:30 AM to 7:59 AM | 18 (6.0%) | 9 (5.2%) |
| 8:00 AM to 8:29 AM | 67 (22.3%) | 4 (2.3%) |
| 8:30 AM to 8:59 AM | 85 (28.2%) | 0 (0.0%) |
| 9:00 AM to 9:59 AM | 0 (0.0%) | 10 (5.8%) |
| 10:00 AM to 10:59 AM | 33 (11.0%) | 0 (0.0%) |
| 11:00 AM to 11:59 AM | 0 (0.0%) | 0 (0.0%) |
| 12:00 PM to 3:59 PM | 0 (0.0%) | 3 (1.7%) |
| 4:00 PM to 11:59 PM | 9 (3.0%) | 0 (0.0%) |
| Total | 301 (100.0%) | 172 (100.0%) |
Housing Occupancy in Canaan
Occupancy by Ownership in Canaan
Of the total 566 dwellings in Canaan, owner-occupied units account for 275 (48.6%), while renter-occupied units make up 291 (51.4%).
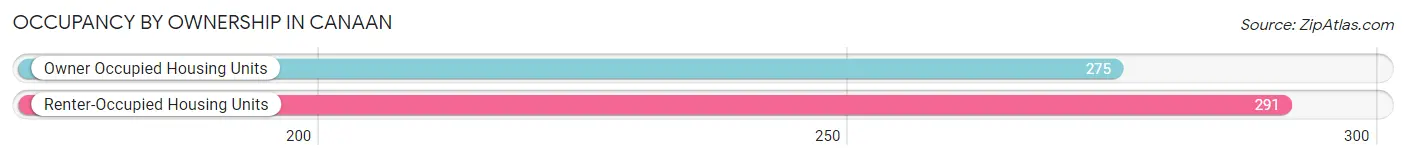
| Occupancy | # Housing Units | % Housing Units |
| Owner Occupied Housing Units | 275 | 48.6% |
| Renter-Occupied Housing Units | 291 | 51.4% |
| Total Occupied Housing Units | 566 | 100.0% |
Occupancy by Household Size in Canaan
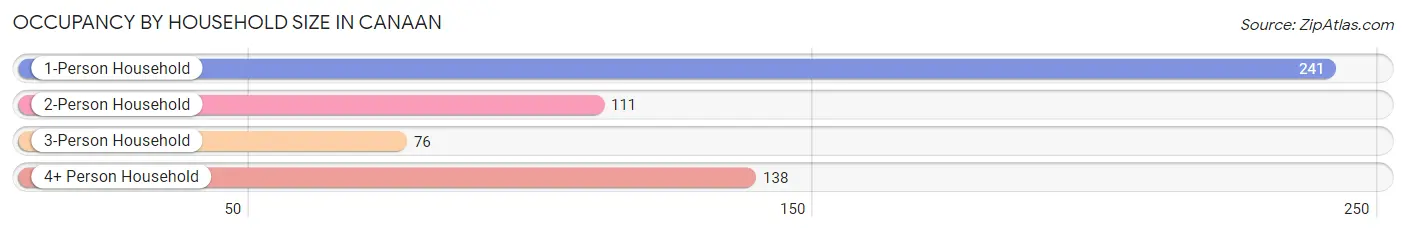
| Household Size | # Housing Units | % Housing Units |
| 1-Person Household | 241 | 42.6% |
| 2-Person Household | 111 | 19.6% |
| 3-Person Household | 76 | 13.4% |
| 4+ Person Household | 138 | 24.4% |
| Total Housing Units | 566 | 100.0% |
Occupancy by Ownership by Household Size in Canaan
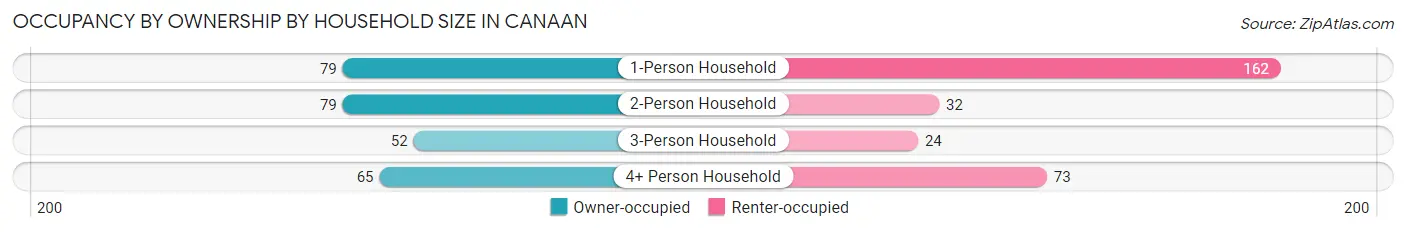
| Household Size | Owner-occupied | Renter-occupied |
| 1-Person Household | 79 (32.8%) | 162 (67.2%) |
| 2-Person Household | 79 (71.2%) | 32 (28.8%) |
| 3-Person Household | 52 (68.4%) | 24 (31.6%) |
| 4+ Person Household | 65 (47.1%) | 73 (52.9%) |
| Total Housing Units | 275 (48.6%) | 291 (51.4%) |
Occupancy by Educational Attainment in Canaan
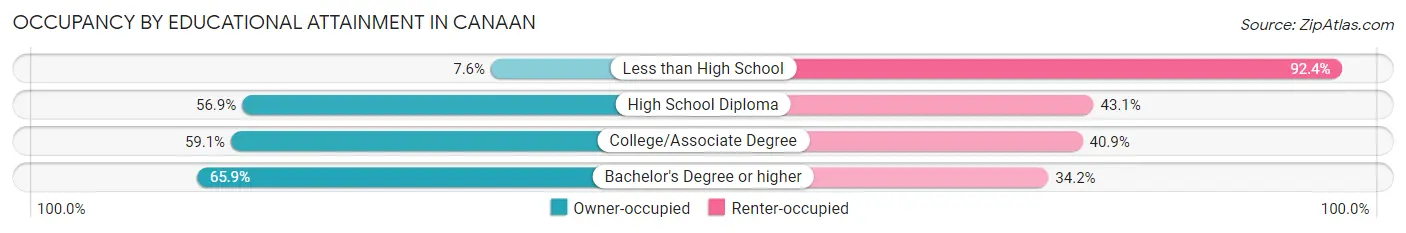
| Household Size | Owner-occupied | Renter-occupied |
| Less than High School | 9 (7.6%) | 110 (92.4%) |
| High School Diploma | 95 (56.9%) | 72 (43.1%) |
| College/Associate Degree | 117 (59.1%) | 81 (40.9%) |
| Bachelor's Degree or higher | 54 (65.8%) | 28 (34.2%) |
Occupancy by Age of Householder in Canaan
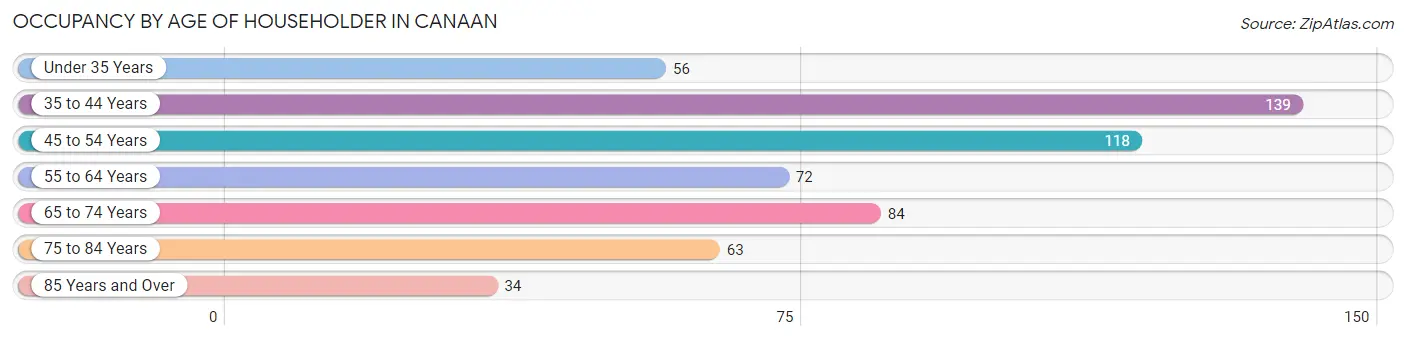
| Age Bracket | # Households | % Households |
| Under 35 Years | 56 | 9.9% |
| 35 to 44 Years | 139 | 24.6% |
| 45 to 54 Years | 118 | 20.8% |
| 55 to 64 Years | 72 | 12.7% |
| 65 to 74 Years | 84 | 14.8% |
| 75 to 84 Years | 63 | 11.1% |
| 85 Years and Over | 34 | 6.0% |
| Total | 566 | 100.0% |
Housing Finances in Canaan
Median Income by Occupancy in Canaan
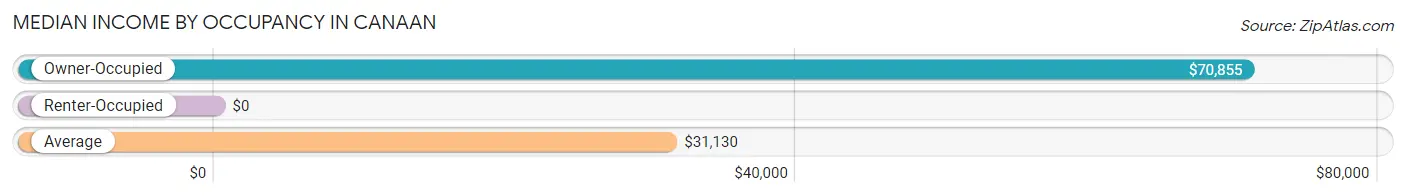
| Occupancy Type | # Households | Median Income |
| Owner-Occupied | 275 (48.6%) | $70,855 |
| Renter-Occupied | 291 (51.4%) | $0 |
| Average | 566 (100.0%) | $31,130 |
Occupancy by Householder Income Bracket in Canaan
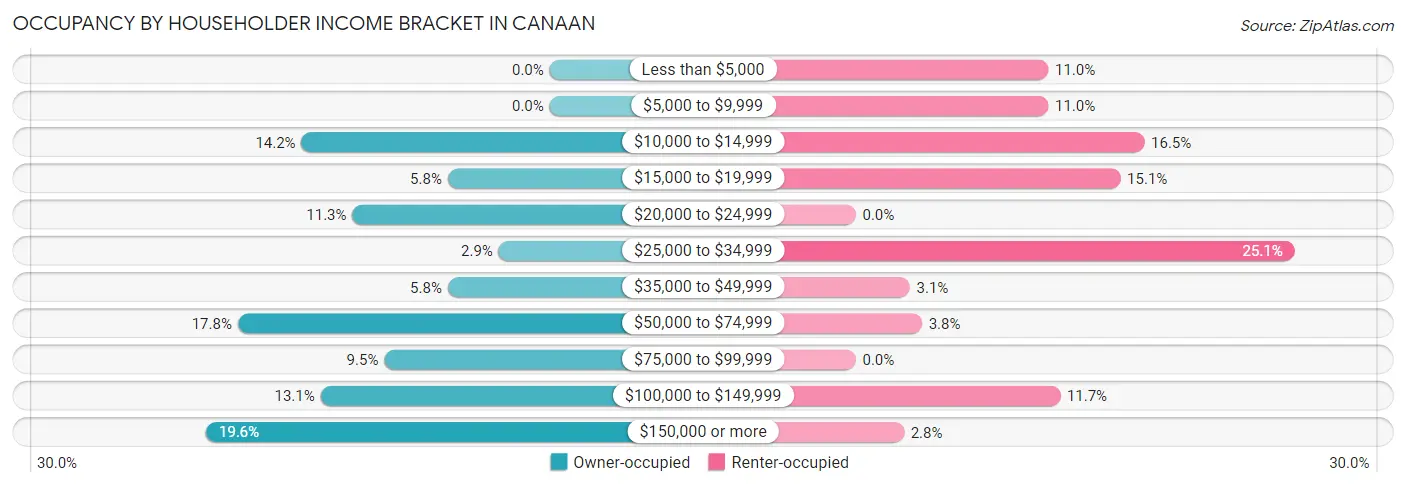
| Income Bracket | Owner-occupied | Renter-occupied |
| Less than $5,000 | 0 (0.0%) | 32 (11.0%) |
| $5,000 to $9,999 | 0 (0.0%) | 32 (11.0%) |
| $10,000 to $14,999 | 39 (14.2%) | 48 (16.5%) |
| $15,000 to $19,999 | 16 (5.8%) | 44 (15.1%) |
| $20,000 to $24,999 | 31 (11.3%) | 0 (0.0%) |
| $25,000 to $34,999 | 8 (2.9%) | 73 (25.1%) |
| $35,000 to $49,999 | 16 (5.8%) | 9 (3.1%) |
| $50,000 to $74,999 | 49 (17.8%) | 11 (3.8%) |
| $75,000 to $99,999 | 26 (9.5%) | 0 (0.0%) |
| $100,000 to $149,999 | 36 (13.1%) | 34 (11.7%) |
| $150,000 or more | 54 (19.6%) | 8 (2.8%) |
| Total | 275 (100.0%) | 291 (100.0%) |
Monthly Housing Cost Tiers in Canaan
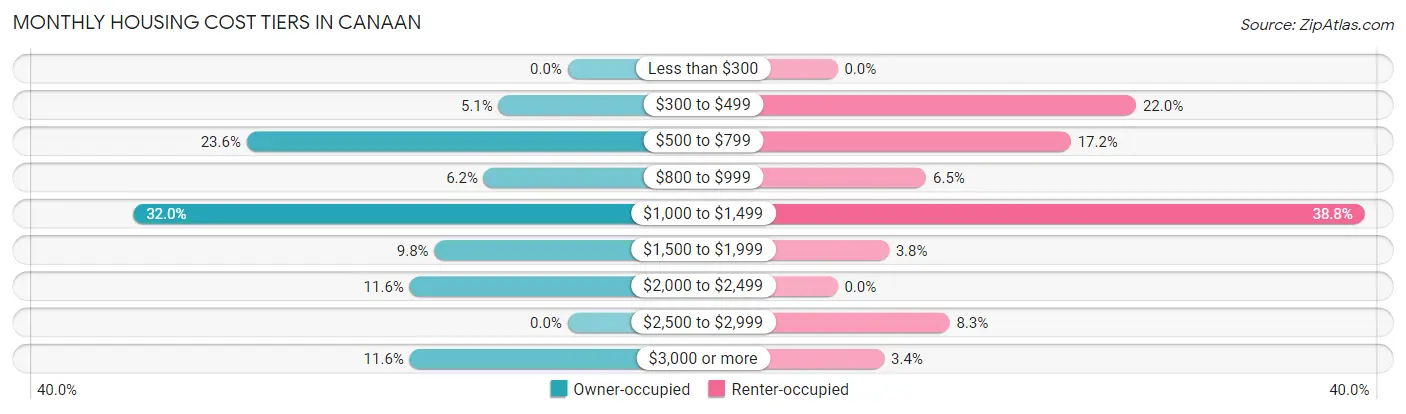
| Monthly Cost | Owner-occupied | Renter-occupied |
| Less than $300 | 0 (0.0%) | 0 (0.0%) |
| $300 to $499 | 14 (5.1%) | 64 (22.0%) |
| $500 to $799 | 65 (23.6%) | 50 (17.2%) |
| $800 to $999 | 17 (6.2%) | 19 (6.5%) |
| $1,000 to $1,499 | 88 (32.0%) | 113 (38.8%) |
| $1,500 to $1,999 | 27 (9.8%) | 11 (3.8%) |
| $2,000 to $2,499 | 32 (11.6%) | 0 (0.0%) |
| $2,500 to $2,999 | 0 (0.0%) | 24 (8.3%) |
| $3,000 or more | 32 (11.6%) | 10 (3.4%) |
| Total | 275 (100.0%) | 291 (100.0%) |
Physical Housing Characteristics in Canaan
Housing Structures in Canaan
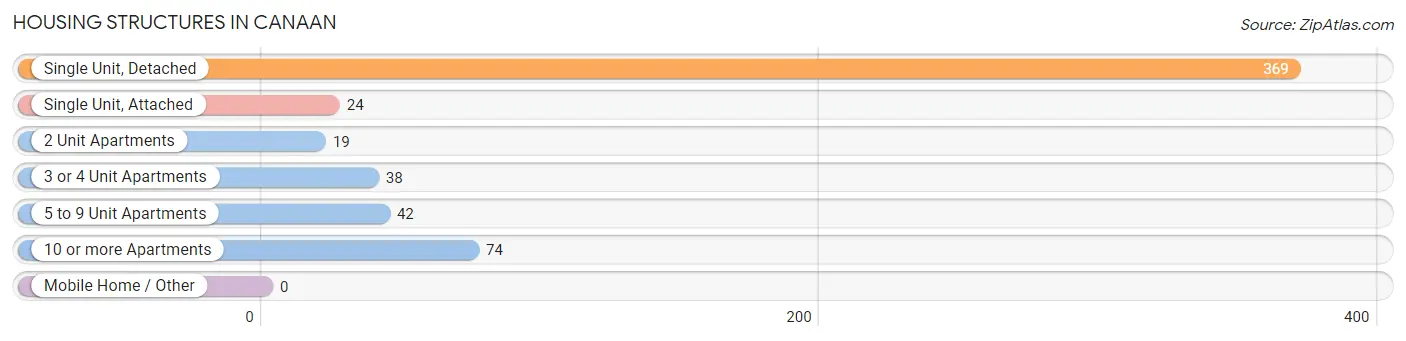
| Structure Type | # Housing Units | % Housing Units |
| Single Unit, Detached | 369 | 65.2% |
| Single Unit, Attached | 24 | 4.2% |
| 2 Unit Apartments | 19 | 3.4% |
| 3 or 4 Unit Apartments | 38 | 6.7% |
| 5 to 9 Unit Apartments | 42 | 7.4% |
| 10 or more Apartments | 74 | 13.1% |
| Mobile Home / Other | 0 | 0.0% |
| Total | 566 | 100.0% |
Housing Structures by Occupancy in Canaan
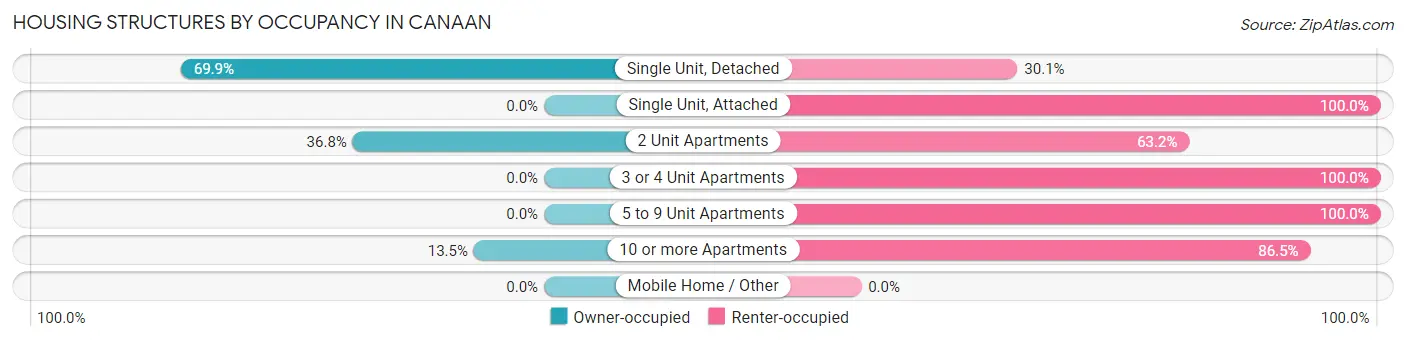
| Structure Type | Owner-occupied | Renter-occupied |
| Single Unit, Detached | 258 (69.9%) | 111 (30.1%) |
| Single Unit, Attached | 0 (0.0%) | 24 (100.0%) |
| 2 Unit Apartments | 7 (36.8%) | 12 (63.2%) |
| 3 or 4 Unit Apartments | 0 (0.0%) | 38 (100.0%) |
| 5 to 9 Unit Apartments | 0 (0.0%) | 42 (100.0%) |
| 10 or more Apartments | 10 (13.5%) | 64 (86.5%) |
| Mobile Home / Other | 0 (0.0%) | 0 (0.0%) |
| Total | 275 (48.6%) | 291 (51.4%) |
Housing Structures by Number of Rooms in Canaan
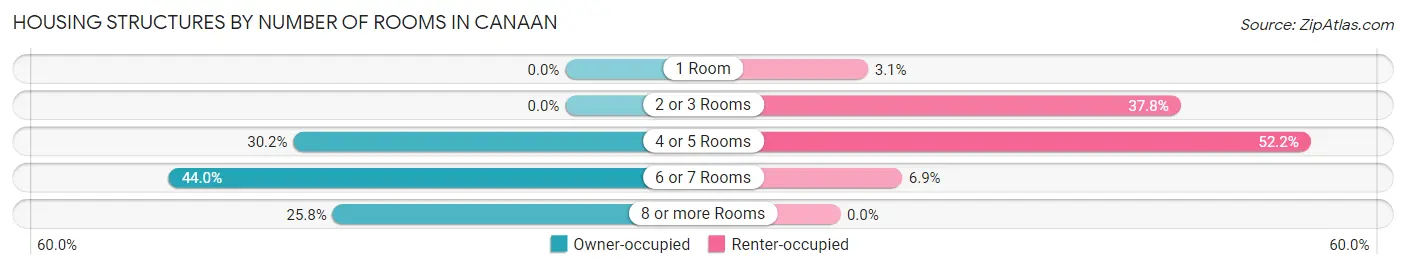
| Number of Rooms | Owner-occupied | Renter-occupied |
| 1 Room | 0 (0.0%) | 9 (3.1%) |
| 2 or 3 Rooms | 0 (0.0%) | 110 (37.8%) |
| 4 or 5 Rooms | 83 (30.2%) | 152 (52.2%) |
| 6 or 7 Rooms | 121 (44.0%) | 20 (6.9%) |
| 8 or more Rooms | 71 (25.8%) | 0 (0.0%) |
| Total | 275 (100.0%) | 291 (100.0%) |
Housing Structure by Heating Type in Canaan
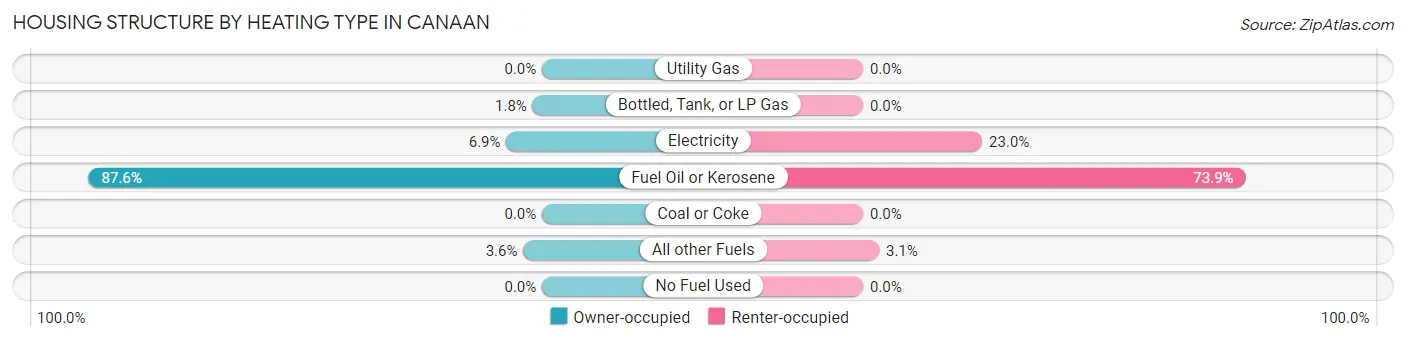
| Heating Type | Owner-occupied | Renter-occupied |
| Utility Gas | 0 (0.0%) | 0 (0.0%) |
| Bottled, Tank, or LP Gas | 5 (1.8%) | 0 (0.0%) |
| Electricity | 19 (6.9%) | 67 (23.0%) |
| Fuel Oil or Kerosene | 241 (87.6%) | 215 (73.9%) |
| Coal or Coke | 0 (0.0%) | 0 (0.0%) |
| All other Fuels | 10 (3.6%) | 9 (3.1%) |
| No Fuel Used | 0 (0.0%) | 0 (0.0%) |
| Total | 275 (100.0%) | 291 (100.0%) |
Household Vehicle Usage in Canaan
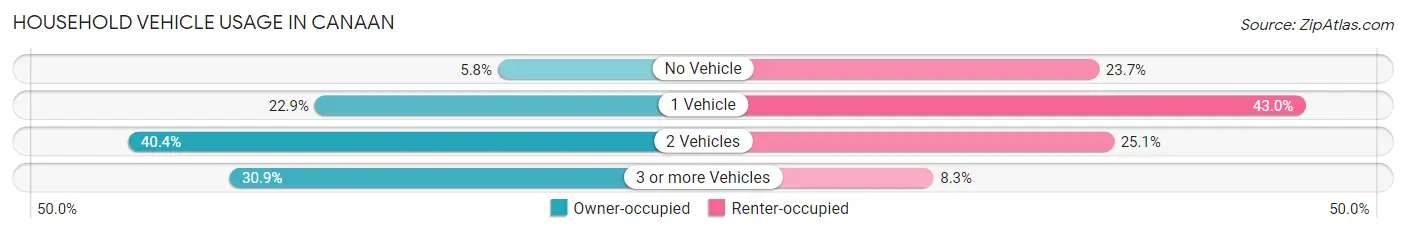
| Vehicles per Household | Owner-occupied | Renter-occupied |
| No Vehicle | 16 (5.8%) | 69 (23.7%) |
| 1 Vehicle | 63 (22.9%) | 125 (43.0%) |
| 2 Vehicles | 111 (40.4%) | 73 (25.1%) |
| 3 or more Vehicles | 85 (30.9%) | 24 (8.3%) |
| Total | 275 (100.0%) | 291 (100.0%) |
Real Estate & Mortgages in Canaan
Real Estate and Mortgage Overview in Canaan
| Characteristic | Without Mortgage | With Mortgage |
| Housing Units | 98 | 177 |
| Median Property Value | $146,300 | $200,900 |
| Median Household Income | - | - |
| Monthly Housing Costs | $654 | $32 |
| Real Estate Taxes | $2,938 | $22 |
Property Value by Mortgage Status in Canaan
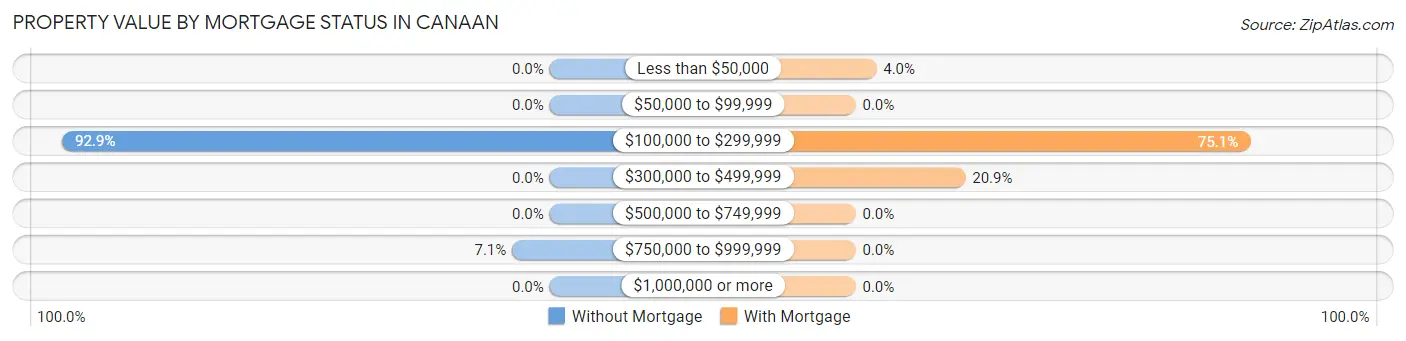
| Property Value | Without Mortgage | With Mortgage |
| Less than $50,000 | 0 (0.0%) | 7 (4.0%) |
| $50,000 to $99,999 | 0 (0.0%) | 0 (0.0%) |
| $100,000 to $299,999 | 91 (92.9%) | 133 (75.1%) |
| $300,000 to $499,999 | 0 (0.0%) | 37 (20.9%) |
| $500,000 to $749,999 | 0 (0.0%) | 0 (0.0%) |
| $750,000 to $999,999 | 7 (7.1%) | 0 (0.0%) |
| $1,000,000 or more | 0 (0.0%) | 0 (0.0%) |
| Total | 98 (100.0%) | 177 (100.0%) |
Household Income by Mortgage Status in Canaan
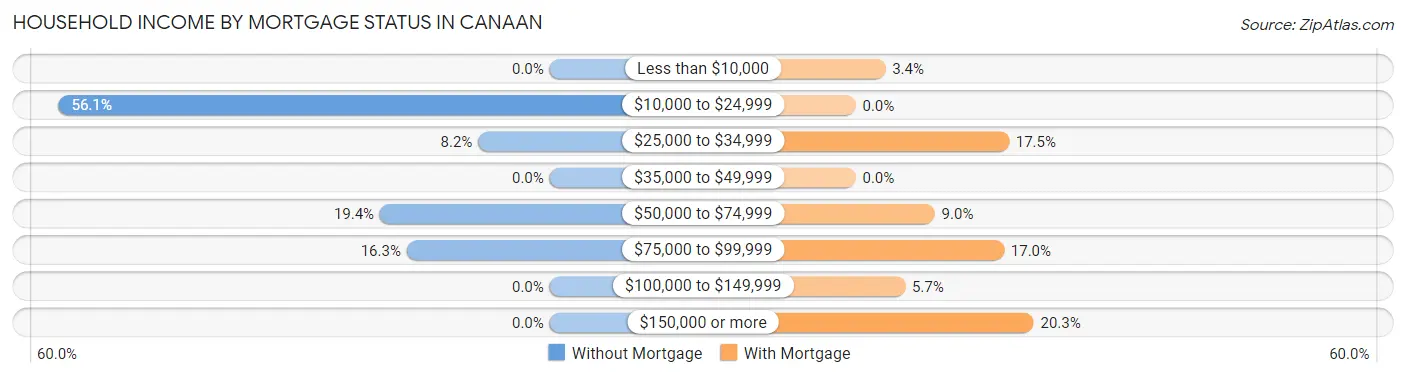
| Household Income | Without Mortgage | With Mortgage |
| Less than $10,000 | 0 (0.0%) | 6 (3.4%) |
| $10,000 to $24,999 | 55 (56.1%) | 0 (0.0%) |
| $25,000 to $34,999 | 8 (8.2%) | 31 (17.5%) |
| $35,000 to $49,999 | 0 (0.0%) | 0 (0.0%) |
| $50,000 to $74,999 | 19 (19.4%) | 16 (9.0%) |
| $75,000 to $99,999 | 16 (16.3%) | 30 (17.0%) |
| $100,000 to $149,999 | 0 (0.0%) | 10 (5.7%) |
| $150,000 or more | 0 (0.0%) | 36 (20.3%) |
| Total | 98 (100.0%) | 177 (100.0%) |
Property Value to Household Income Ratio in Canaan
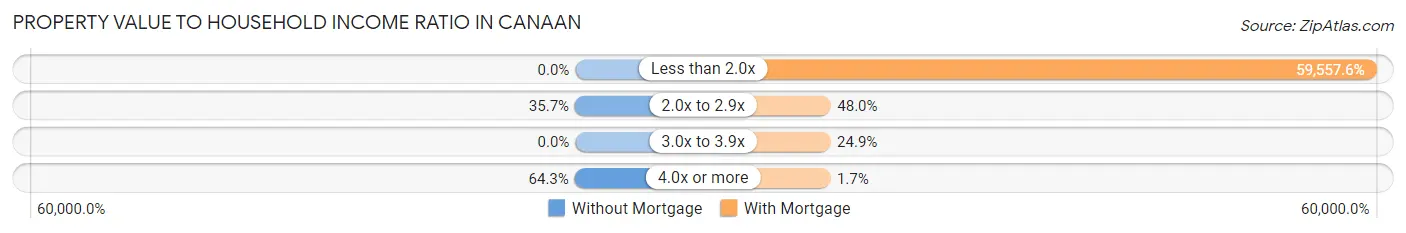
| Value-to-Income Ratio | Without Mortgage | With Mortgage |
| Less than 2.0x | 0 (0.0%) | 105,417 (59,557.6%) |
| 2.0x to 2.9x | 35 (35.7%) | 85 (48.0%) |
| 3.0x to 3.9x | 0 (0.0%) | 44 (24.9%) |
| 4.0x or more | 63 (64.3%) | 3 (1.7%) |
| Total | 98 (100.0%) | 177 (100.0%) |
Real Estate Taxes by Mortgage Status in Canaan
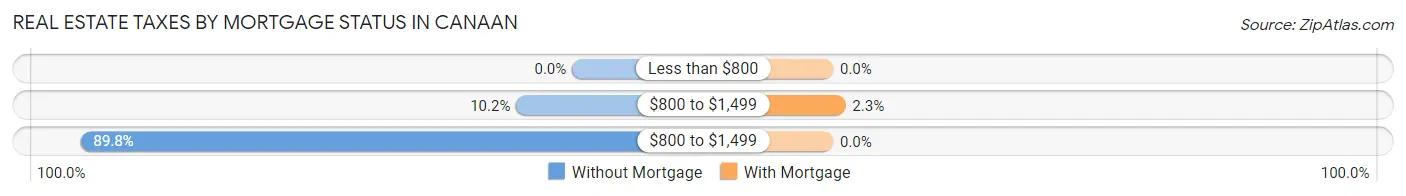
| Property Taxes | Without Mortgage | With Mortgage |
| Less than $800 | 0 (0.0%) | 0 (0.0%) |
| $800 to $1,499 | 10 (10.2%) | 4 (2.3%) |
| $800 to $1,499 | 88 (89.8%) | 0 (0.0%) |
| Total | 98 (100.0%) | 177 (100.0%) |
Health & Disability in Canaan
Health Insurance Coverage by Age in Canaan
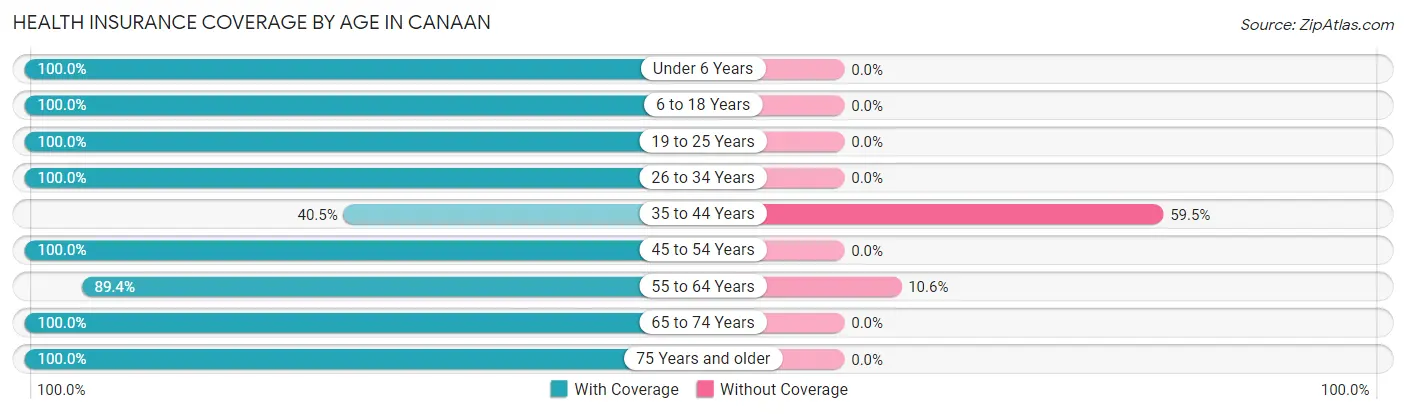
| Age Bracket | With Coverage | Without Coverage |
| Under 6 Years | 101 (100.0%) | 0 (0.0%) |
| 6 to 18 Years | 324 (100.0%) | 0 (0.0%) |
| 19 to 25 Years | 83 (100.0%) | 0 (0.0%) |
| 26 to 34 Years | 162 (100.0%) | 0 (0.0%) |
| 35 to 44 Years | 77 (40.5%) | 113 (59.5%) |
| 45 to 54 Years | 154 (100.0%) | 0 (0.0%) |
| 55 to 64 Years | 101 (89.4%) | 12 (10.6%) |
| 65 to 74 Years | 123 (100.0%) | 0 (0.0%) |
| 75 Years and older | 100 (100.0%) | 0 (0.0%) |
| Total | 1,225 (90.7%) | 125 (9.3%) |
Health Insurance Coverage by Citizenship Status in Canaan
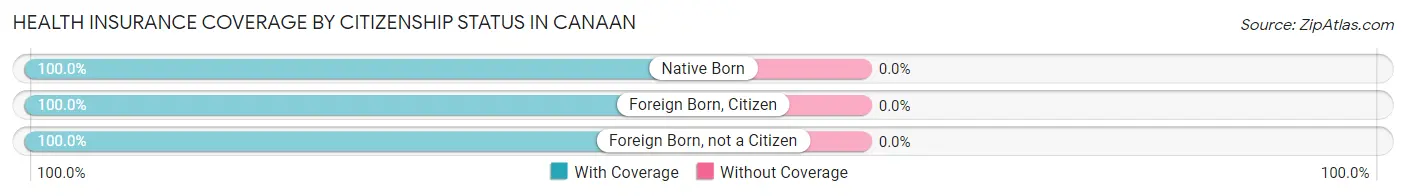
| Citizenship Status | With Coverage | Without Coverage |
| Native Born | 101 (100.0%) | 0 (0.0%) |
| Foreign Born, Citizen | 324 (100.0%) | 0 (0.0%) |
| Foreign Born, not a Citizen | 83 (100.0%) | 0 (0.0%) |
Health Insurance Coverage by Household Income in Canaan
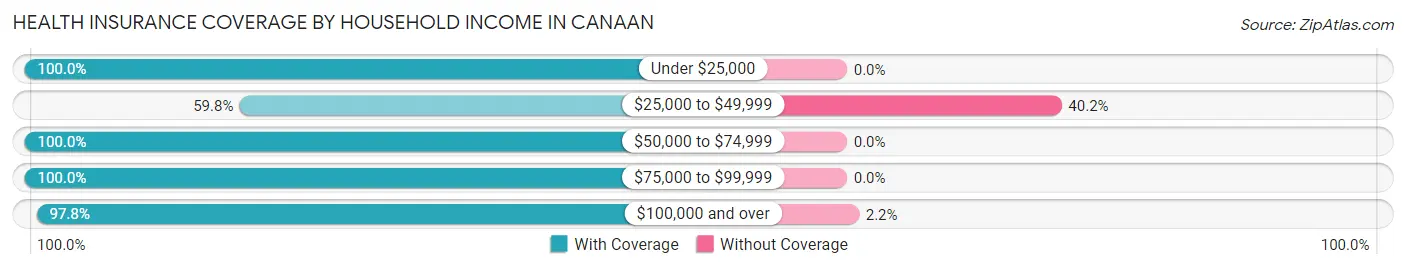
| Household Income | With Coverage | Without Coverage |
| Under $25,000 | 318 (100.0%) | 0 (0.0%) |
| $25,000 to $49,999 | 168 (59.8%) | 113 (40.2%) |
| $50,000 to $74,999 | 162 (100.0%) | 0 (0.0%) |
| $75,000 to $99,999 | 53 (100.0%) | 0 (0.0%) |
| $100,000 and over | 524 (97.8%) | 12 (2.2%) |
Public vs Private Health Insurance Coverage by Age in Canaan
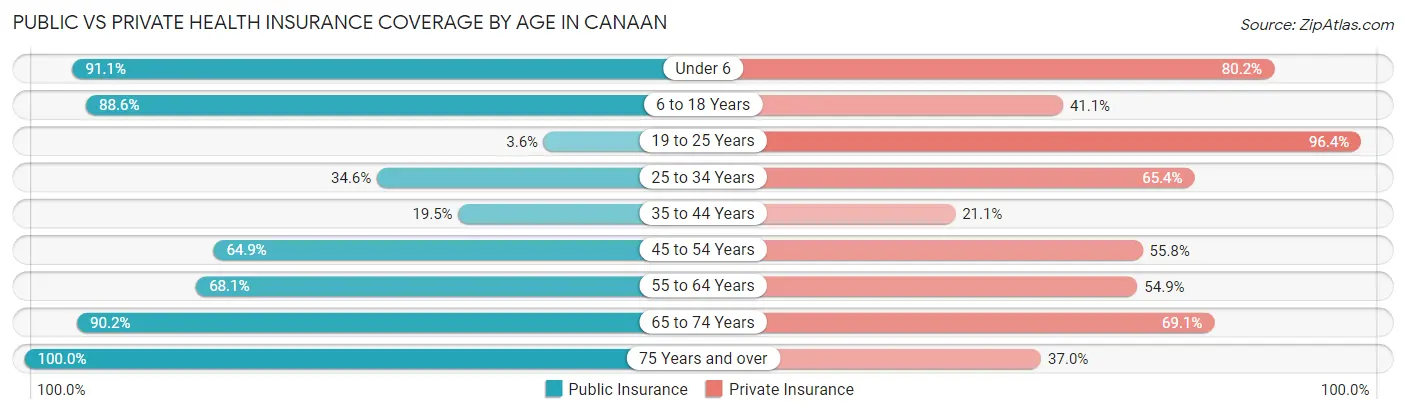
| Age Bracket | Public Insurance | Private Insurance |
| Under 6 | 92 (91.1%) | 81 (80.2%) |
| 6 to 18 Years | 287 (88.6%) | 133 (41.0%) |
| 19 to 25 Years | 3 (3.6%) | 80 (96.4%) |
| 25 to 34 Years | 56 (34.6%) | 106 (65.4%) |
| 35 to 44 Years | 37 (19.5%) | 40 (21.0%) |
| 45 to 54 Years | 100 (64.9%) | 86 (55.8%) |
| 55 to 64 Years | 77 (68.1%) | 62 (54.9%) |
| 65 to 74 Years | 111 (90.2%) | 85 (69.1%) |
| 75 Years and over | 100 (100.0%) | 37 (37.0%) |
| Total | 863 (63.9%) | 710 (52.6%) |
Disability Status by Sex by Age in Canaan
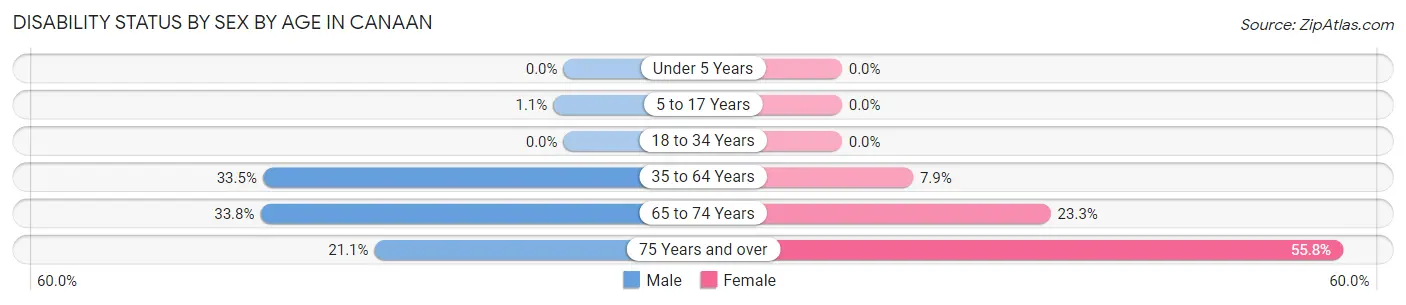
| Age Bracket | Male | Female |
| Under 5 Years | 0 (0.0%) | 0 (0.0%) |
| 5 to 17 Years | 3 (1.1%) | 0 (0.0%) |
| 18 to 34 Years | 0 (0.0%) | 0 (0.0%) |
| 35 to 64 Years | 77 (33.5%) | 18 (7.9%) |
| 65 to 74 Years | 27 (33.8%) | 10 (23.3%) |
| 75 Years and over | 12 (21.0%) | 24 (55.8%) |
Disability Class by Sex by Age in Canaan
Disability Class: Hearing Difficulty
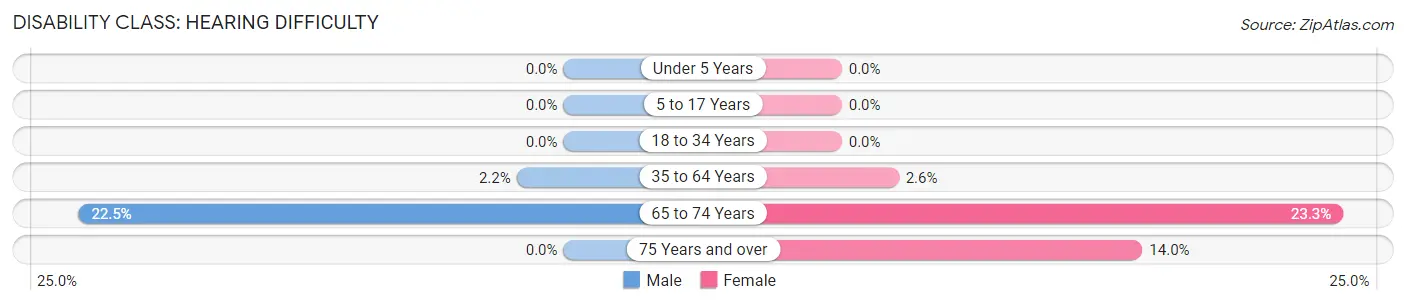
| Age Bracket | Male | Female |
| Under 5 Years | 0 (0.0%) | 0 (0.0%) |
| 5 to 17 Years | 0 (0.0%) | 0 (0.0%) |
| 18 to 34 Years | 0 (0.0%) | 0 (0.0%) |
| 35 to 64 Years | 5 (2.2%) | 6 (2.6%) |
| 65 to 74 Years | 18 (22.5%) | 10 (23.3%) |
| 75 Years and over | 0 (0.0%) | 6 (14.0%) |
Disability Class: Vision Difficulty
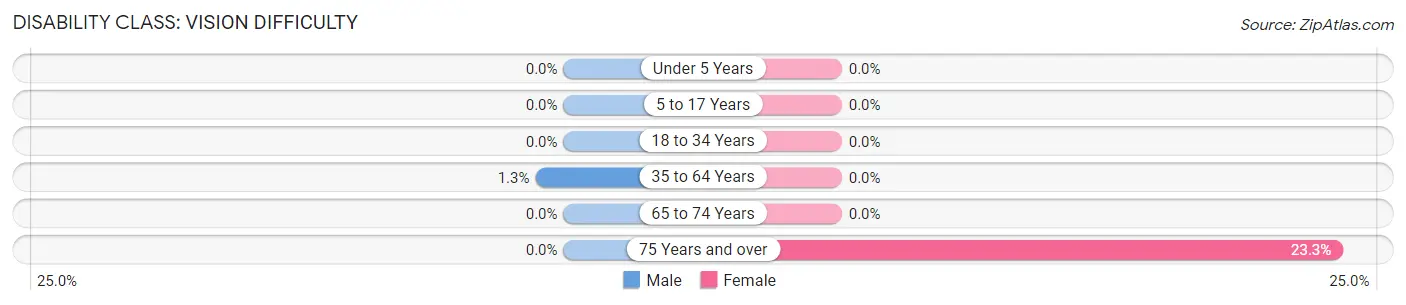
| Age Bracket | Male | Female |
| Under 5 Years | 0 (0.0%) | 0 (0.0%) |
| 5 to 17 Years | 0 (0.0%) | 0 (0.0%) |
| 18 to 34 Years | 0 (0.0%) | 0 (0.0%) |
| 35 to 64 Years | 3 (1.3%) | 0 (0.0%) |
| 65 to 74 Years | 0 (0.0%) | 0 (0.0%) |
| 75 Years and over | 0 (0.0%) | 10 (23.3%) |
Disability Class: Cognitive Difficulty
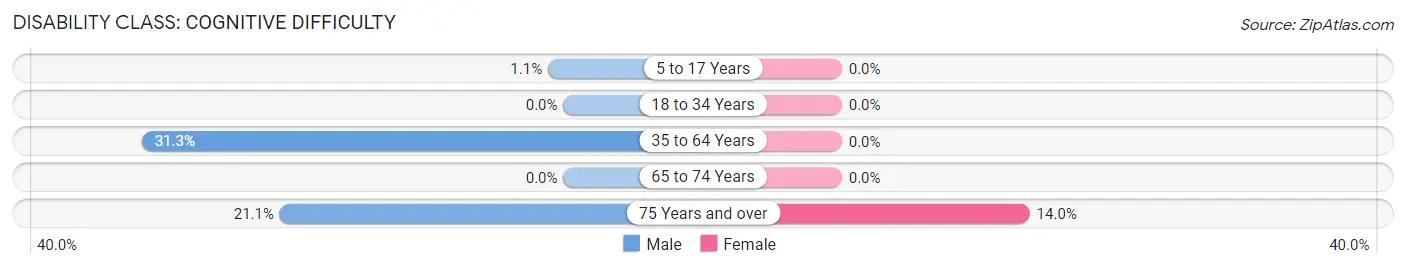
| Age Bracket | Male | Female |
| 5 to 17 Years | 3 (1.1%) | 0 (0.0%) |
| 18 to 34 Years | 0 (0.0%) | 0 (0.0%) |
| 35 to 64 Years | 72 (31.3%) | 0 (0.0%) |
| 65 to 74 Years | 0 (0.0%) | 0 (0.0%) |
| 75 Years and over | 12 (21.0%) | 6 (14.0%) |
Disability Class: Ambulatory Difficulty
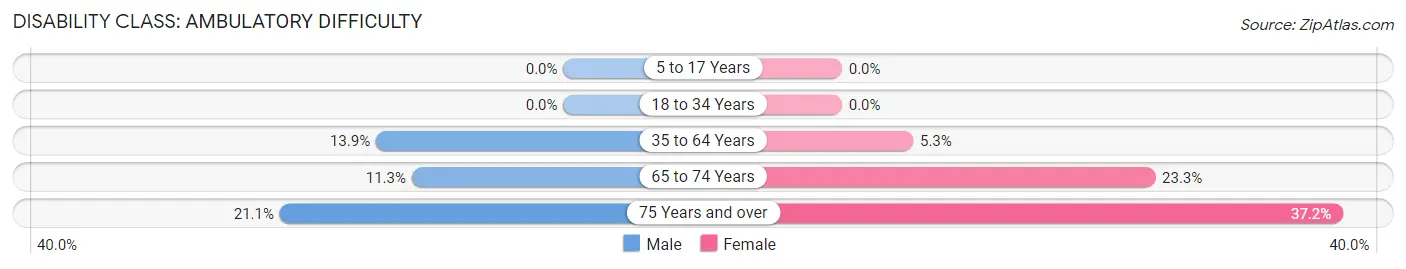
| Age Bracket | Male | Female |
| 5 to 17 Years | 0 (0.0%) | 0 (0.0%) |
| 18 to 34 Years | 0 (0.0%) | 0 (0.0%) |
| 35 to 64 Years | 32 (13.9%) | 12 (5.3%) |
| 65 to 74 Years | 9 (11.3%) | 10 (23.3%) |
| 75 Years and over | 12 (21.0%) | 16 (37.2%) |
Disability Class: Self-Care Difficulty
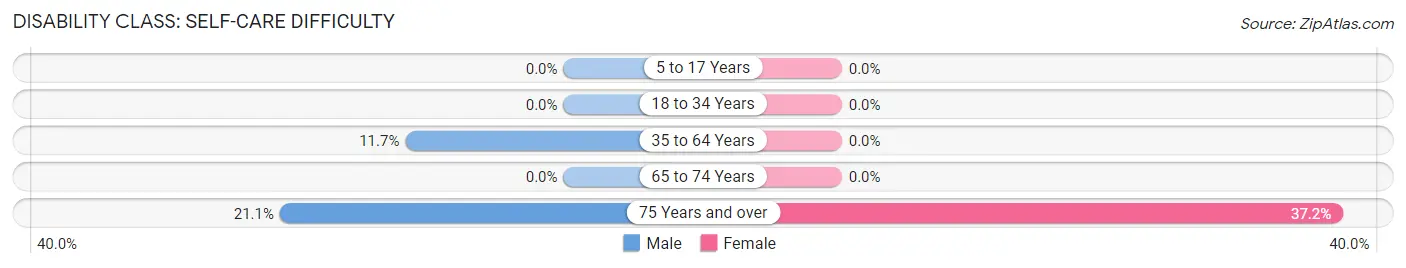
| Age Bracket | Male | Female |
| 5 to 17 Years | 0 (0.0%) | 0 (0.0%) |
| 18 to 34 Years | 0 (0.0%) | 0 (0.0%) |
| 35 to 64 Years | 27 (11.7%) | 0 (0.0%) |
| 65 to 74 Years | 0 (0.0%) | 0 (0.0%) |
| 75 Years and over | 12 (21.0%) | 16 (37.2%) |
Technology Access in Canaan
Computing Device Access in Canaan
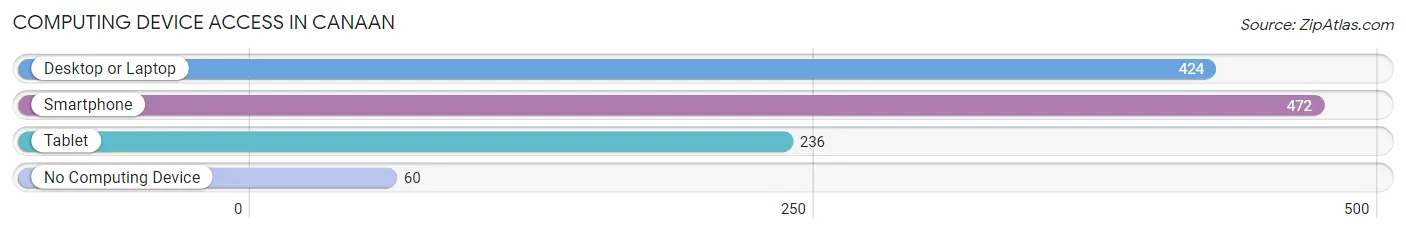
| Device Type | # Households | % Households |
| Desktop or Laptop | 424 | 74.9% |
| Smartphone | 472 | 83.4% |
| Tablet | 236 | 41.7% |
| No Computing Device | 60 | 10.6% |
| Total | 566 | 100.0% |
Internet Access in Canaan
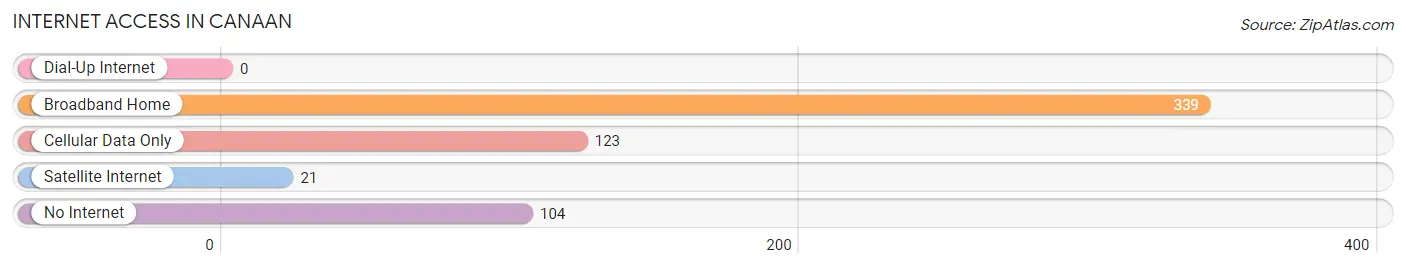
| Internet Type | # Households | % Households |
| Dial-Up Internet | 0 | 0.0% |
| Broadband Home | 339 | 59.9% |
| Cellular Data Only | 123 | 21.7% |
| Satellite Internet | 21 | 3.7% |
| No Internet | 104 | 18.4% |
| Total | 566 | 100.0% |
Canaan Summary
Canaan is a town located in the northwest corner of Connecticut, in Litchfield County. It is bordered by the towns of North Canaan, Salisbury, Norfolk, and Cornwall. The town has a population of 1,081 as of the 2010 census.
History
The area that is now Canaan was originally inhabited by the Mahican Native American tribe. The first European settlers arrived in the area in 1731, and the town was officially incorporated in 1739. The town was named after the Biblical land of Canaan.
In the 19th century, Canaan was a center of the iron industry, with several iron forges located in the town. The town was also home to several mills, including a paper mill, a grist mill, and a saw mill.
Geography
Canaan is located in the northwest corner of Connecticut, in Litchfield County. It is bordered by the towns of North Canaan, Salisbury, Norfolk, and Cornwall. The town has a total area of 24.2 square miles, of which 24.1 square miles is land and 0.1 square miles is water.
The town is located in the Housatonic River Valley, and is home to several small streams, including the Blackberry River, the East Branch of the Housatonic River, and the West Branch of the Housatonic River. The town is also home to several small lakes, including Lake Waramaug, Lake Wononskopomuc, and Lake Washinee.
Economy
Canaan is a rural town, and the economy is largely based on agriculture and tourism. The town is home to several small farms, which produce a variety of crops, including corn, hay, and apples. The town is also home to several small businesses, including a general store, a hardware store, and a restaurant.
The town is also home to several tourist attractions, including the Canaan Historical Society Museum, the Canaan Railroad Museum, and the Canaan Farmers’ Market.
Demographics
As of the 2010 census, the town had a population of 1,081. The racial makeup of the town was 97.2% White, 0.7% African American, 0.2% Native American, 0.2% Asian, 0.1% from other races, and 1.7% from two or more races. Hispanic or Latino of any race were 1.3% of the population.
The median income for a household in the town was $50,000, and the median income for a family was $58,750. The per capita income for the town was $25,945. About 8.2% of families and 10.2% of the population were below the poverty line, including 14.3% of those under age 18 and 5.3% of those age 65 or over.
Common Questions
What is Per Capita Income in Canaan?
Per Capita income in Canaan is $30,944.
What is the Median Household income in Canaan?
Median Household Income in Canaan is $31,130.
What is Income or Wage Gap in Canaan?
Income or Wage Gap in Canaan is 59.4%.
Women in Canaan earn 40.6 cents for every dollar earned by a man.
What is Inequality or Gini Index in Canaan?
Inequality or Gini Index in Canaan is 0.55.
What is the Total Population of Canaan?
Total Population of Canaan is 1,353.
What is the Total Male Population of Canaan?
Total Male Population of Canaan is 767.
What is the Total Female Population of Canaan?
Total Female Population of Canaan is 586.
What is the Ratio of Males per 100 Females in Canaan?
There are 130.89 Males per 100 Females in Canaan.
What is the Ratio of Females per 100 Males in Canaan?
There are 76.40 Females per 100 Males in Canaan.
What is the Median Population Age in Canaan?
Median Population Age in Canaan is 36.6 Years.
What is the Average Family Size in Canaan
Average Family Size in Canaan is 2.9 People.
What is the Average Household Size in Canaan
Average Household Size in Canaan is 2.4 People.
How Large is the Labor Force in Canaan?
There are 594 People in the Labor Forcein in Canaan.
What is the Percentage of People in the Labor Force in Canaan?
57.7% of People are in the Labor Force in Canaan.
What is the Unemployment Rate in Canaan?
Unemployment Rate in Canaan is 12.7%.