Zip Codes with the Highest Percentage of Population Employed in Security & Protection in Danbury, CT
RELATED REPORTS & OPTIONS
Security & Protection
Danbury
Compare Zip Codes
Map of Zip Codes with the Highest Percentage of Population Employed in Security & Protection in Danbury
0.48%
1.2%
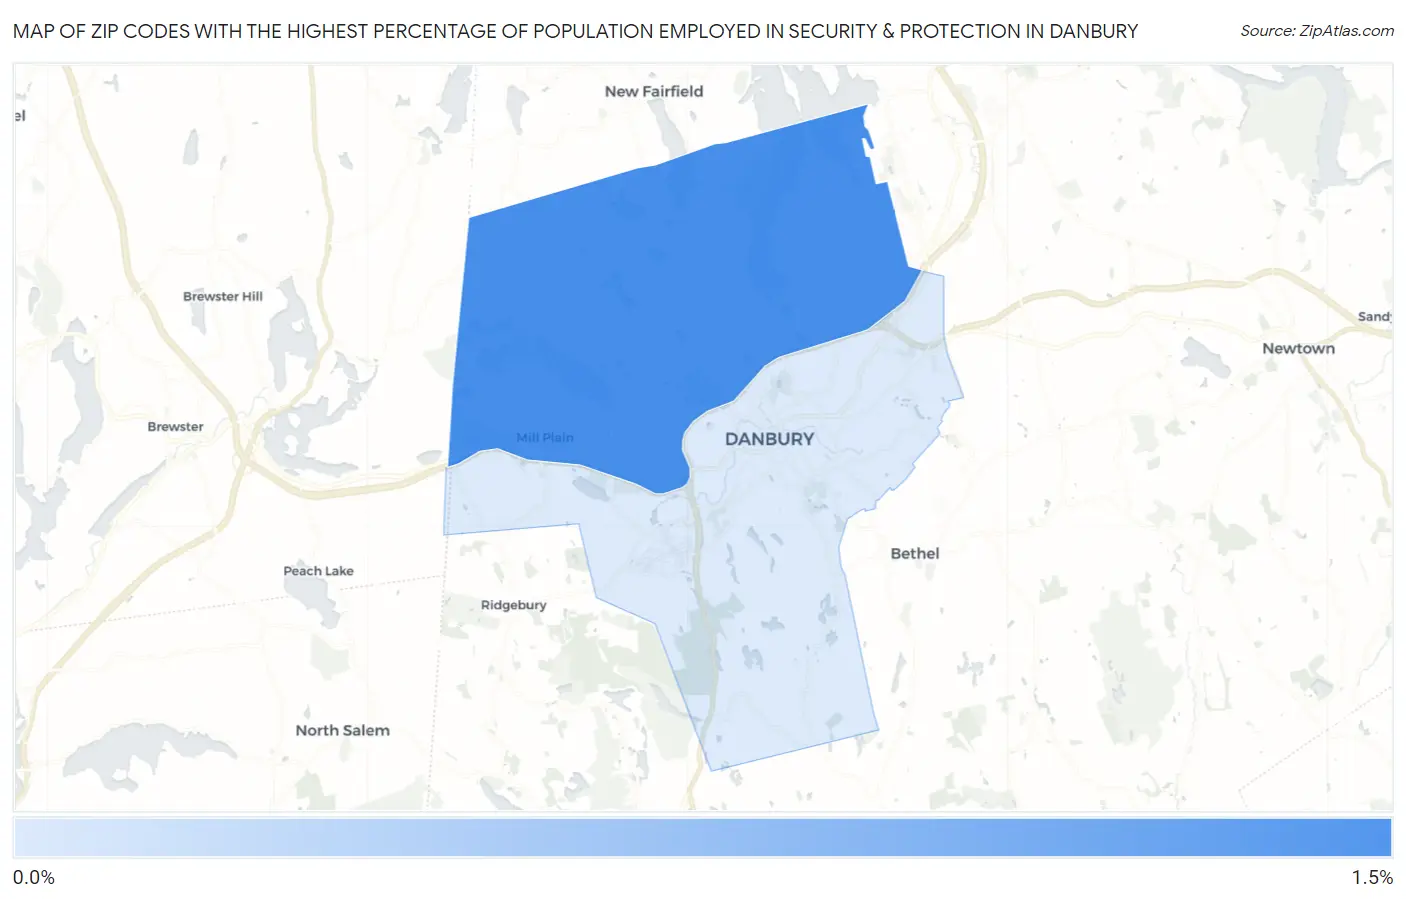
Zip Codes with the Highest Percentage of Population Employed in Security & Protection in Danbury, CT
| Zip Code | % Employed | vs State | vs National | |
| 1. | 06811 | 1.2% | 1.8%(-0.619)#163 | 2.1%(-0.955)#18,558 |
| 2. | 06810 | 0.48% | 1.8%(-1.33)#217 | 2.1%(-1.67)#23,353 |
1
Common Questions
What are the Top Zip Codes with the Highest Percentage of Population Employed in Security & Protection in Danbury, CT?
Top Zip Codes with the Highest Percentage of Population Employed in Security & Protection in Danbury, CT are:
What zip code has the Highest Percentage of Population Employed in Security & Protection in Danbury, CT?
06811 has the Highest Percentage of Population Employed in Security & Protection in Danbury, CT with 1.2%.
What is the Percentage of Population Employed in Security & Protection in Danbury, CT?
Percentage of Population Employed in Security & Protection in Danbury is 0.73%.
What is the Percentage of Population Employed in Security & Protection in Connecticut?
Percentage of Population Employed in Security & Protection in Connecticut is 1.8%.
What is the Percentage of Population Employed in Security & Protection in the United States?
Percentage of Population Employed in Security & Protection in the United States is 2.1%.