Wauregan, CT Map & Demographics
Wauregan Map
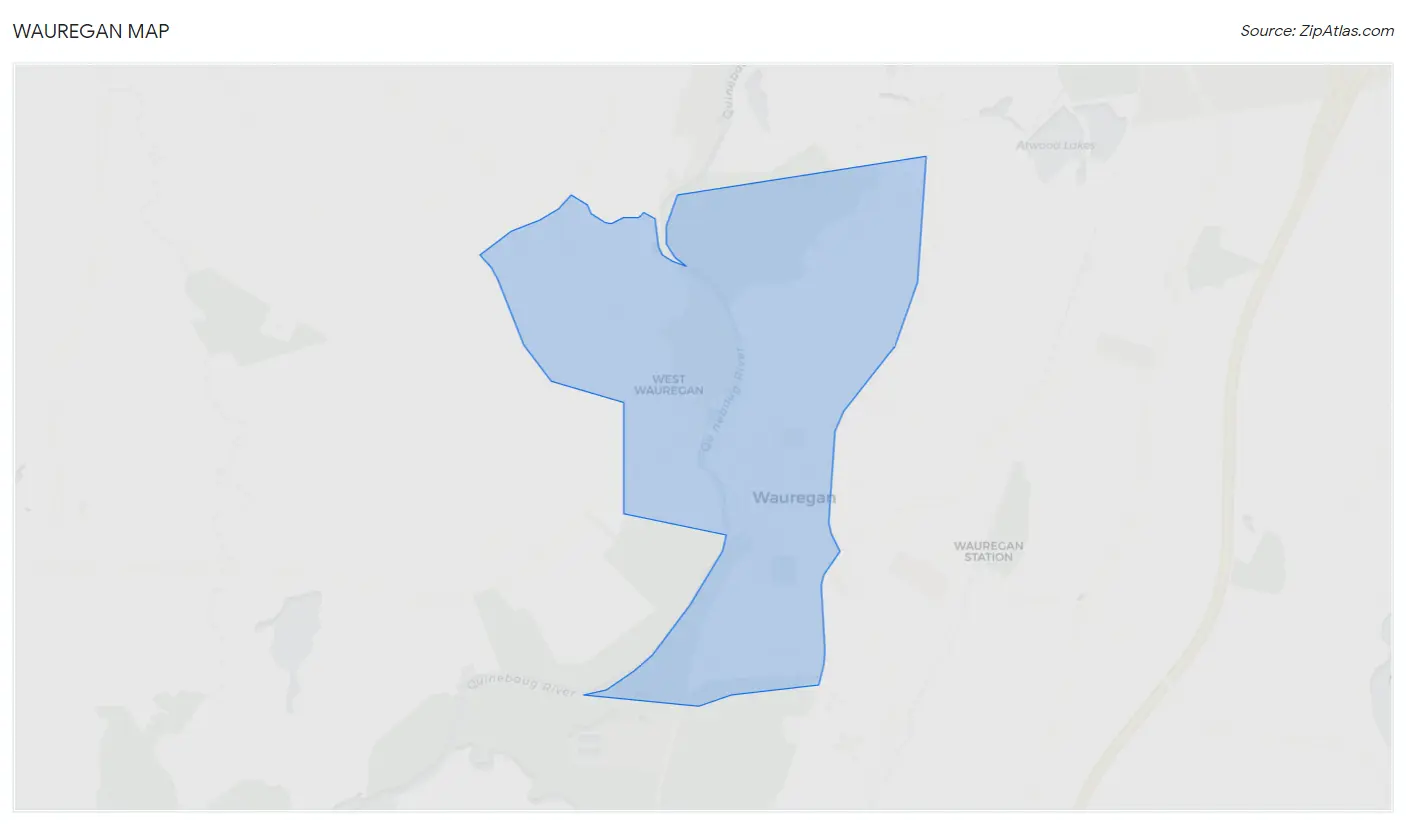
Wauregan Overview
$30,063
PER CAPITA INCOME
$77,500
AVG FAMILY INCOME
$81,964
AVG HOUSEHOLD INCOME
31.9%
WAGE / INCOME GAP [ % ]
68.1¢/ $1
WAGE / INCOME GAP [ $ ]
0.35
INEQUALITY / GINI INDEX
1,396
TOTAL POPULATION
632
MALE POPULATION
764
FEMALE POPULATION
82.72
MALES / 100 FEMALES
120.89
FEMALES / 100 MALES
33.4
MEDIAN AGE
3.0
AVG FAMILY SIZE
2.9
AVG HOUSEHOLD SIZE
776
LABOR FORCE [ PEOPLE ]
78.6%
PERCENT IN LABOR FORCE
2.2%
UNEMPLOYMENT RATE
Wauregan Zip Codes
Wauregan Area Codes
Income in Wauregan
Income Overview in Wauregan
Per Capita Income in Wauregan is $30,063, while median incomes of families and households are $77,500 and $81,964 respectively.
| Characteristic | Number | Measure |
| Per Capita Income | 1,396 | $30,063 |
| Median Family Income | 374 | $77,500 |
| Mean Family Income | 374 | $84,495 |
| Median Household Income | 479 | $81,964 |
| Mean Household Income | 479 | $84,968 |
| Income Deficit | 374 | $0 |
| Wage / Income Gap (%) | 1,396 | 31.89% |
| Wage / Income Gap ($) | 1,396 | 68.11¢ per $1 |
| Gini / Inequality Index | 1,396 | 0.35 |
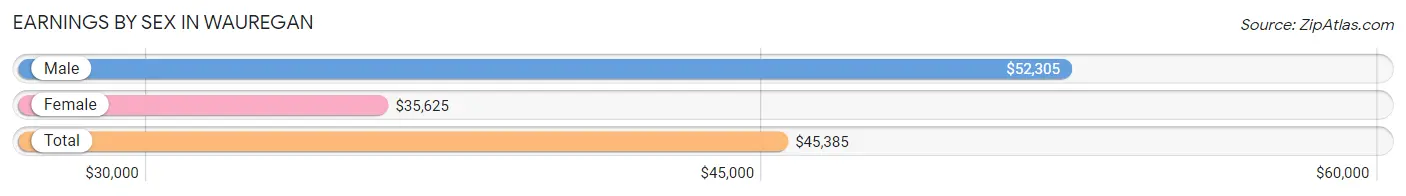
Earnings by Sex in Wauregan
Average Earnings in Wauregan are $45,385, $52,305 for men and $35,625 for women, a difference of 31.9%.
| Sex | Number | Average Earnings |
| Male | 376 (47.7%) | $52,305 |
| Female | 412 (52.3%) | $35,625 |
| Total | 788 (100.0%) | $45,385 |
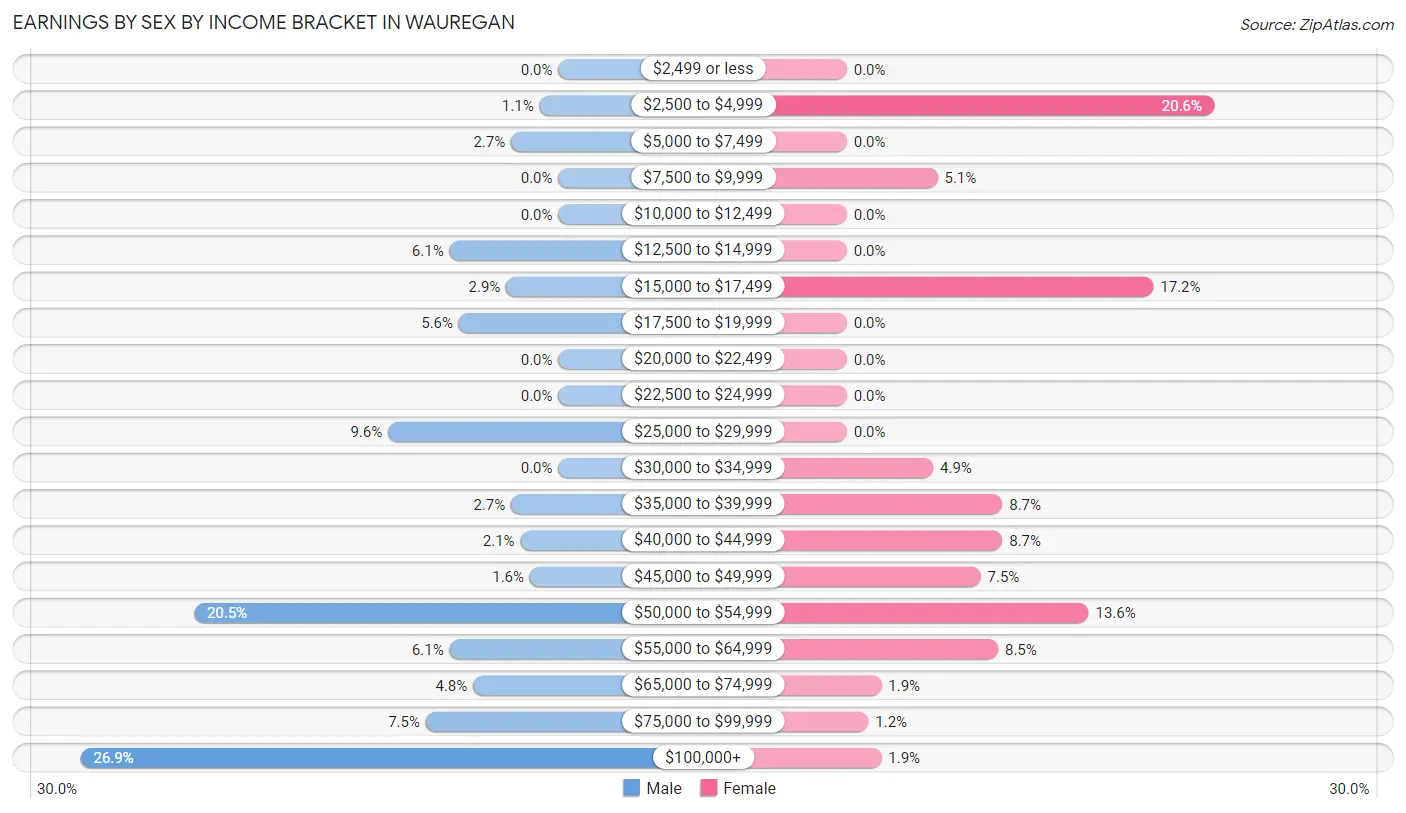
Earnings by Sex by Income Bracket in Wauregan
The most common earnings brackets in Wauregan are $100,000+ for men (101 | 26.9%) and $2,500 to $4,999 for women (85 | 20.6%).
| Income | Male | Female |
| $2,499 or less | 0 (0.0%) | 0 (0.0%) |
| $2,500 to $4,999 | 4 (1.1%) | 85 (20.6%) |
| $5,000 to $7,499 | 10 (2.7%) | 0 (0.0%) |
| $7,500 to $9,999 | 0 (0.0%) | 21 (5.1%) |
| $10,000 to $12,499 | 0 (0.0%) | 0 (0.0%) |
| $12,500 to $14,999 | 23 (6.1%) | 0 (0.0%) |
| $15,000 to $17,499 | 11 (2.9%) | 71 (17.2%) |
| $17,500 to $19,999 | 21 (5.6%) | 0 (0.0%) |
| $20,000 to $22,499 | 0 (0.0%) | 0 (0.0%) |
| $22,500 to $24,999 | 0 (0.0%) | 0 (0.0%) |
| $25,000 to $29,999 | 36 (9.6%) | 0 (0.0%) |
| $30,000 to $34,999 | 0 (0.0%) | 20 (4.9%) |
| $35,000 to $39,999 | 10 (2.7%) | 36 (8.7%) |
| $40,000 to $44,999 | 8 (2.1%) | 36 (8.7%) |
| $45,000 to $49,999 | 6 (1.6%) | 31 (7.5%) |
| $50,000 to $54,999 | 77 (20.5%) | 56 (13.6%) |
| $55,000 to $64,999 | 23 (6.1%) | 35 (8.5%) |
| $65,000 to $74,999 | 18 (4.8%) | 8 (1.9%) |
| $75,000 to $99,999 | 28 (7.4%) | 5 (1.2%) |
| $100,000+ | 101 (26.9%) | 8 (1.9%) |
| Total | 376 (100.0%) | 412 (100.0%) |
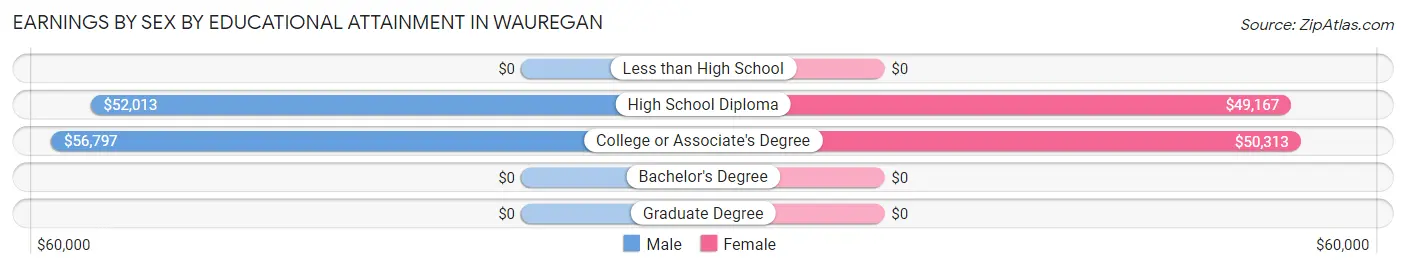
Earnings by Sex by Educational Attainment in Wauregan
Average earnings in Wauregan are $53,558 for men and $34,625 for women, a difference of 35.3%. Men with an educational attainment of college or associate's degree enjoy the highest average annual earnings of $56,797, while those with high school diploma education earn the least with $52,013. Women with an educational attainment of college or associate's degree earn the most with the average annual earnings of $50,313, while those with high school diploma education have the smallest earnings of $49,167.
| Educational Attainment | Male Income | Female Income |
| Less than High School | - | - |
| High School Diploma | $52,013 | $49,167 |
| College or Associate's Degree | $56,797 | $50,313 |
| Bachelor's Degree | - | - |
| Graduate Degree | - | - |
| Total | $53,558 | $34,625 |
Family Income in Wauregan
Family Income Brackets in Wauregan
According to the Wauregan family income data, there are 80 families falling into the $150,000 to $199,999 income range, which is the most common income bracket and makes up 21.4% of all families.
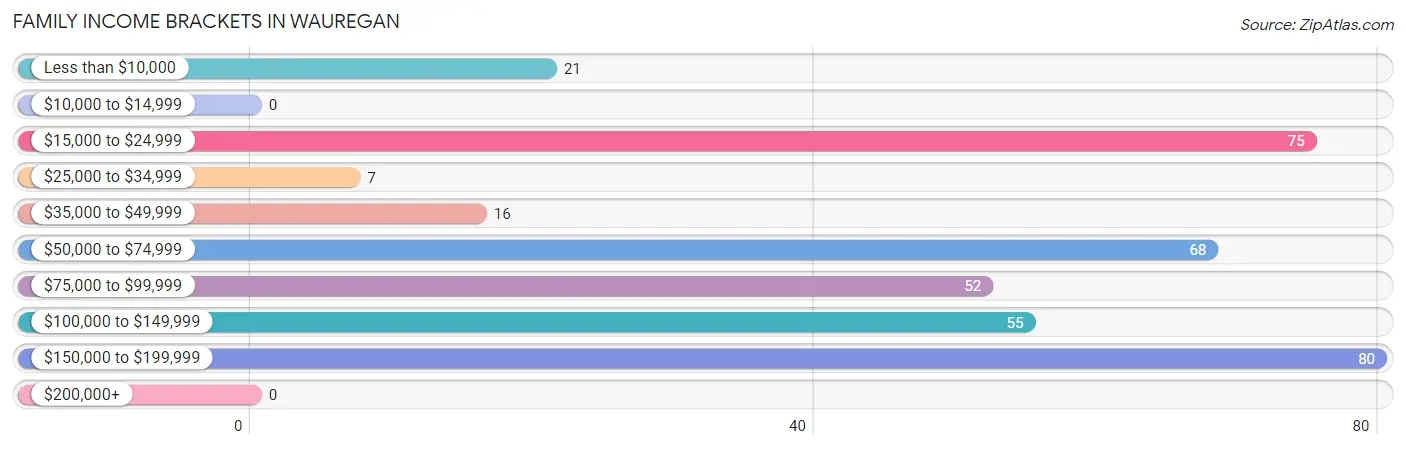
| Income Bracket | # Families | % Families |
| Less than $10,000 | 21 | 5.6% |
| $10,000 to $14,999 | 0 | 0.0% |
| $15,000 to $24,999 | 75 | 20.1% |
| $25,000 to $34,999 | 7 | 1.9% |
| $35,000 to $49,999 | 16 | 4.3% |
| $50,000 to $74,999 | 68 | 18.2% |
| $75,000 to $99,999 | 52 | 13.9% |
| $100,000 to $149,999 | 55 | 14.7% |
| $150,000 to $199,999 | 80 | 21.4% |
| $200,000+ | 0 | 0.0% |
Family Income by Famaliy Size in Wauregan
2-person families (123 | 32.9%) account for the highest median family income in Wauregan with $150,350 per family, while 2-person families (123 | 32.9%) have the highest median income of $75,175 per family member.
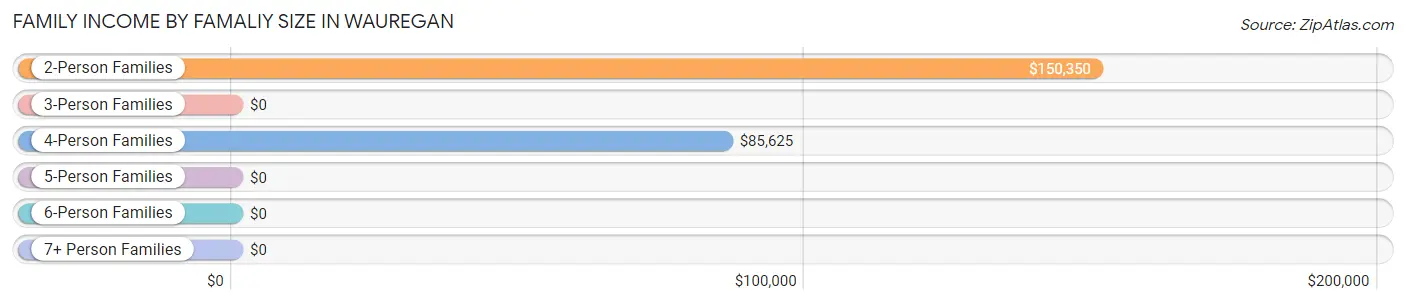
| Income Bracket | # Families | Median Income |
| 2-Person Families | 123 (32.9%) | $150,350 |
| 3-Person Families | 170 (45.5%) | $0 |
| 4-Person Families | 42 (11.2%) | $85,625 |
| 5-Person Families | 39 (10.4%) | $0 |
| 6-Person Families | 0 (0.0%) | $0 |
| 7+ Person Families | 0 (0.0%) | $0 |
| Total | 374 (100.0%) | $77,500 |
Family Income by Number of Earners in Wauregan
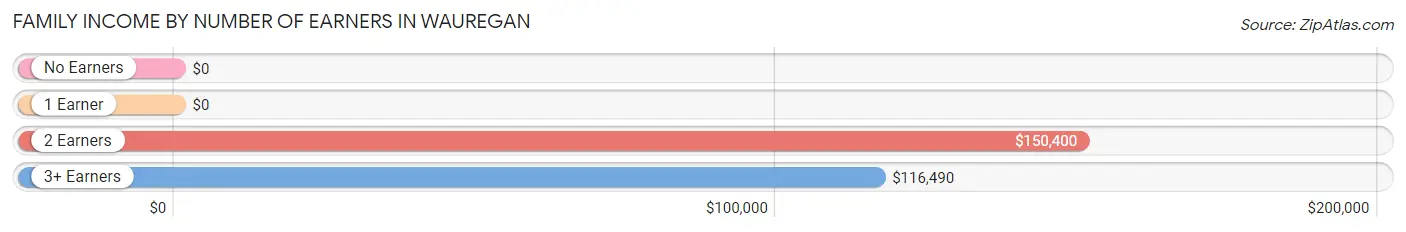
| Number of Earners | # Families | Median Income |
| No Earners | 33 (8.8%) | $0 |
| 1 Earner | 162 (43.3%) | $0 |
| 2 Earners | 136 (36.4%) | $150,400 |
| 3+ Earners | 43 (11.5%) | $116,490 |
| Total | 374 (100.0%) | $77,500 |
Household Income in Wauregan
Household Income Brackets in Wauregan
With 123 households falling in the category, the $100,000 to $149,999 income range is the most frequent in Wauregan, accounting for 25.7% of all households.
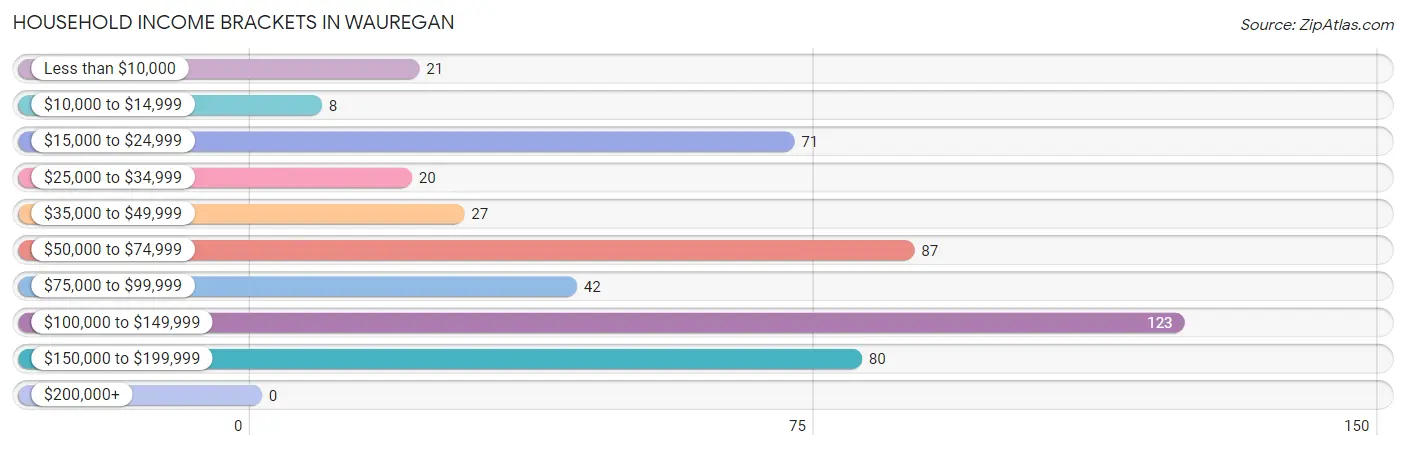
| Income Bracket | # Households | % Households |
| Less than $10,000 | 21 | 4.4% |
| $10,000 to $14,999 | 8 | 1.7% |
| $15,000 to $24,999 | 71 | 14.8% |
| $25,000 to $34,999 | 20 | 4.2% |
| $35,000 to $49,999 | 27 | 5.6% |
| $50,000 to $74,999 | 87 | 18.2% |
| $75,000 to $99,999 | 42 | 8.8% |
| $100,000 to $149,999 | 123 | 25.7% |
| $150,000 to $199,999 | 80 | 16.7% |
| $200,000+ | 0 | 0.0% |
Household Income by Householder Age in Wauregan
The median household income in Wauregan is $81,964, with the highest median household income of $104,023 found in the 45 to 64 years age bracket for the primary householder. A total of 221 households (46.1%) fall into this category. Meanwhile, the 15 to 24 years age bracket for the primary householder has the lowest median household income of $0, with 11 households (2.3%) in this group.
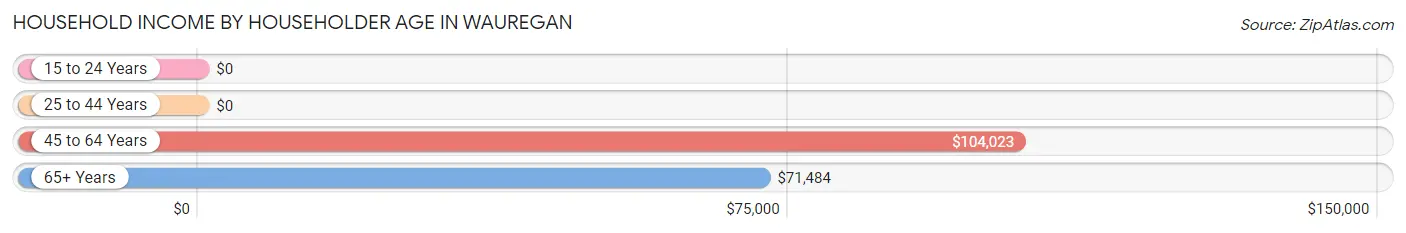
| Income Bracket | # Households | Median Income |
| 15 to 24 Years | 11 (2.3%) | $0 |
| 25 to 44 Years | 196 (40.9%) | $0 |
| 45 to 64 Years | 221 (46.1%) | $104,023 |
| 65+ Years | 51 (10.6%) | $71,484 |
| Total | 479 (100.0%) | $81,964 |
Poverty in Wauregan
Income Below Poverty by Sex and Age in Wauregan
With 10.3% poverty level for males and 33.9% for females among the residents of Wauregan, 6 to 11 year old males and 6 to 11 year old females are the most vulnerable to poverty, with 29 males (60.4%) and 143 females (93.5%) in their respective age groups living below the poverty level.
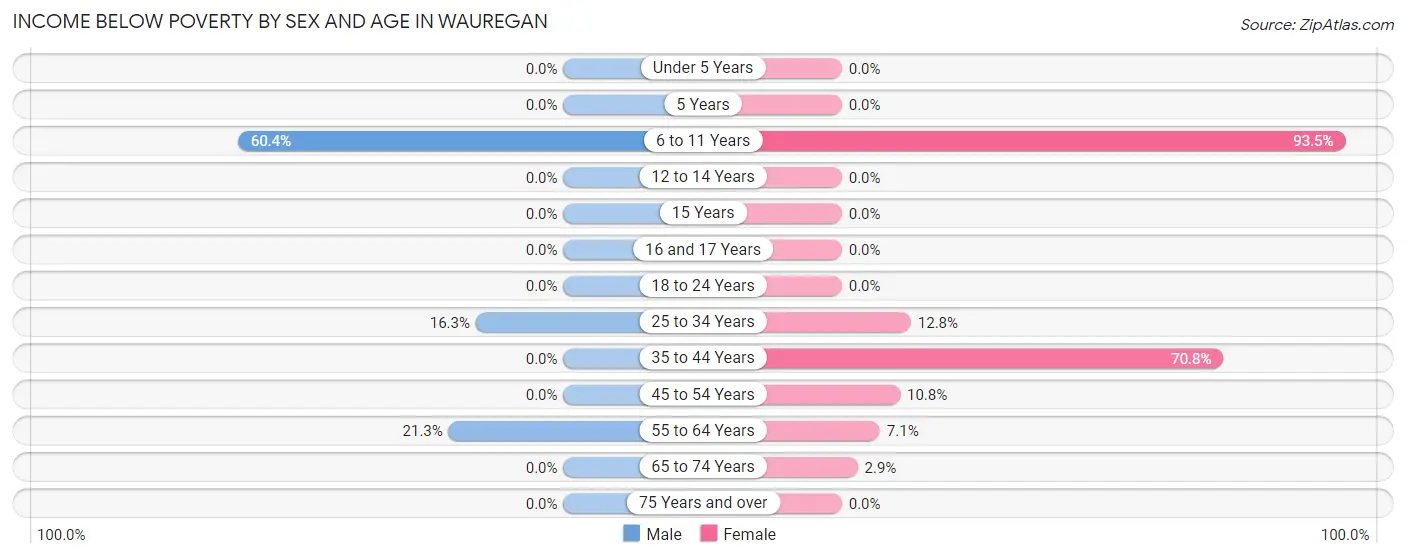
| Age Bracket | Male | Female |
| Under 5 Years | 0 (0.0%) | 0 (0.0%) |
| 5 Years | 0 (0.0%) | 0 (0.0%) |
| 6 to 11 Years | 29 (60.4%) | 143 (93.5%) |
| 12 to 14 Years | 0 (0.0%) | 0 (0.0%) |
| 15 Years | 0 (0.0%) | 0 (0.0%) |
| 16 and 17 Years | 0 (0.0%) | 0 (0.0%) |
| 18 to 24 Years | 0 (0.0%) | 0 (0.0%) |
| 25 to 34 Years | 13 (16.3%) | 20 (12.8%) |
| 35 to 44 Years | 0 (0.0%) | 80 (70.8%) |
| 45 to 54 Years | 0 (0.0%) | 8 (10.8%) |
| 55 to 64 Years | 23 (21.3%) | 7 (7.1%) |
| 65 to 74 Years | 0 (0.0%) | 1 (2.9%) |
| 75 Years and over | 0 (0.0%) | 0 (0.0%) |
| Total | 65 (10.3%) | 259 (33.9%) |
Income Above Poverty by Sex and Age in Wauregan
According to the poverty statistics in Wauregan, males aged under 5 years and females aged under 5 years are the age groups that are most secure financially, with 100.0% of males and 100.0% of females in these age groups living above the poverty line.
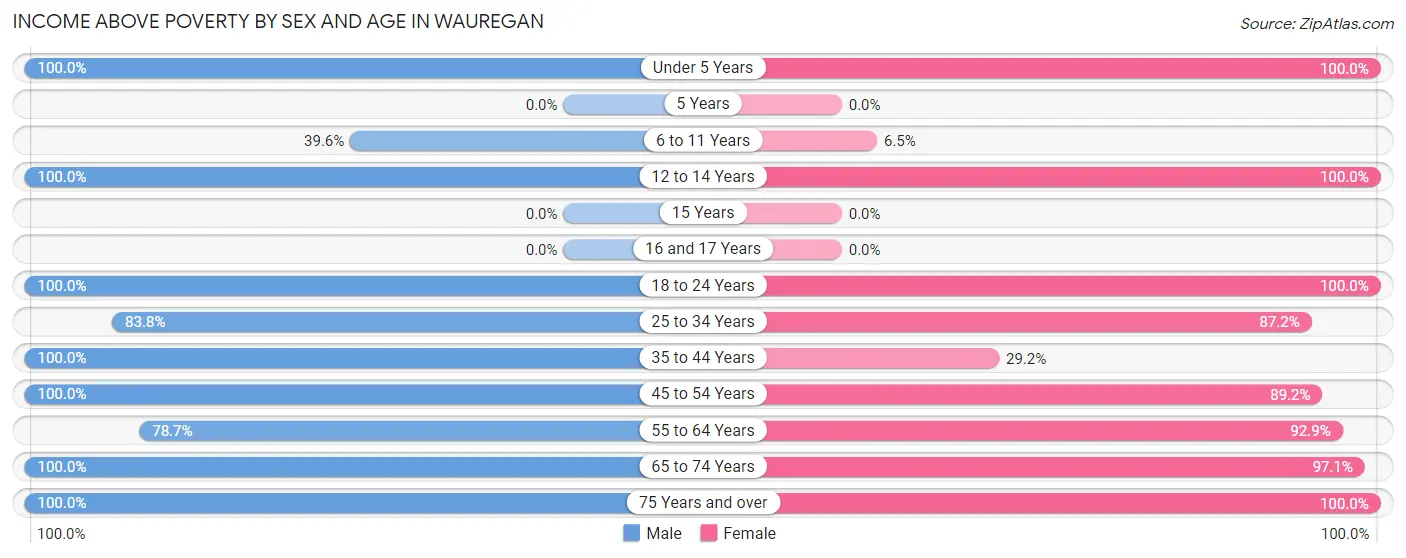
| Age Bracket | Male | Female |
| Under 5 Years | 112 (100.0%) | 26 (100.0%) |
| 5 Years | 0 (0.0%) | 0 (0.0%) |
| 6 to 11 Years | 19 (39.6%) | 10 (6.5%) |
| 12 to 14 Years | 17 (100.0%) | 53 (100.0%) |
| 15 Years | 0 (0.0%) | 0 (0.0%) |
| 16 and 17 Years | 0 (0.0%) | 0 (0.0%) |
| 18 to 24 Years | 21 (100.0%) | 40 (100.0%) |
| 25 to 34 Years | 67 (83.8%) | 136 (87.2%) |
| 35 to 44 Years | 51 (100.0%) | 33 (29.2%) |
| 45 to 54 Years | 157 (100.0%) | 66 (89.2%) |
| 55 to 64 Years | 85 (78.7%) | 92 (92.9%) |
| 65 to 74 Years | 29 (100.0%) | 33 (97.1%) |
| 75 Years and over | 9 (100.0%) | 16 (100.0%) |
| Total | 567 (89.7%) | 505 (66.1%) |
Income Below Poverty Among Married-Couple Families in Wauregan
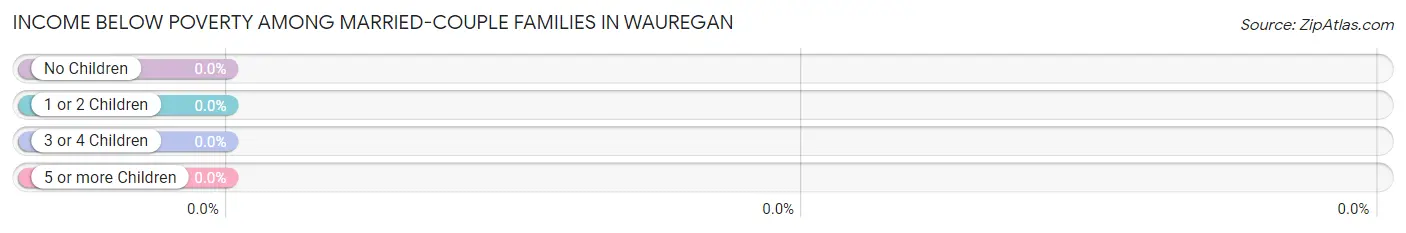
| Children | Above Poverty | Below Poverty |
| No Children | 107 (100.0%) | 0 (0.0%) |
| 1 or 2 Children | 68 (100.0%) | 0 (0.0%) |
| 3 or 4 Children | 0 (0.0%) | 0 (0.0%) |
| 5 or more Children | 0 (0.0%) | 0 (0.0%) |
| Total | 175 (100.0%) | 0 (0.0%) |
Income Below Poverty Among Single-Parent Households in Wauregan
According to the poverty data in Wauregan, 44.7% or 34 single-father households and 50.4% or 62 single-mother households are living below the poverty line. Among single-father households, those with 3 or 4 children have the highest poverty rate, with 13 households (100.0%) experiencing poverty. Likewise, among single-mother households, those with 1 or 2 children have the highest poverty rate, with 62 households (60.8%) falling below the poverty line.
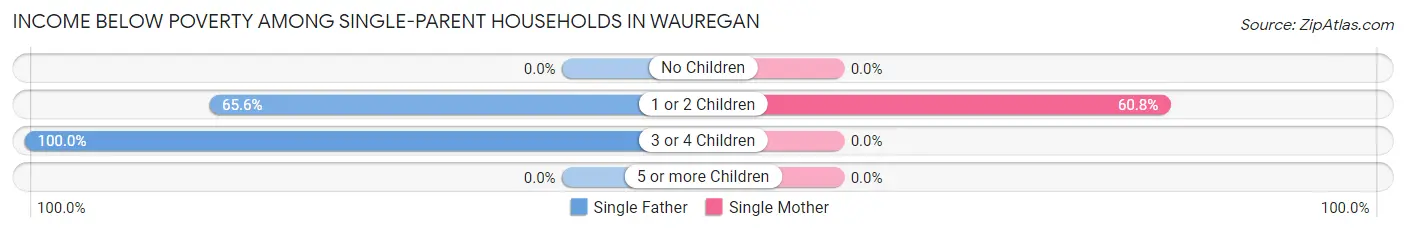
| Children | Single Father | Single Mother |
| No Children | 0 (0.0%) | 0 (0.0%) |
| 1 or 2 Children | 21 (65.6%) | 62 (60.8%) |
| 3 or 4 Children | 13 (100.0%) | 0 (0.0%) |
| 5 or more Children | 0 (0.0%) | 0 (0.0%) |
| Total | 34 (44.7%) | 62 (50.4%) |
Income Below Poverty Among Married-Couple vs Single-Parent Households in Wauregan
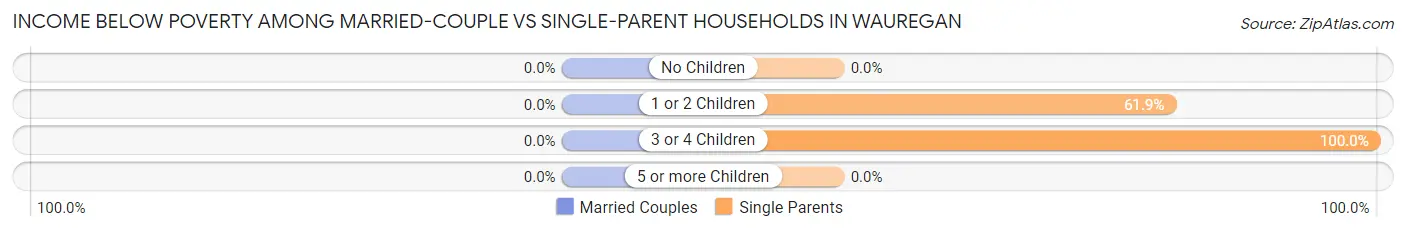
| Children | Married-Couple Families | Single-Parent Households |
| No Children | 0 (0.0%) | 0 (0.0%) |
| 1 or 2 Children | 0 (0.0%) | 83 (61.9%) |
| 3 or 4 Children | 0 (0.0%) | 13 (100.0%) |
| 5 or more Children | 0 (0.0%) | 0 (0.0%) |
| Total | 0 (0.0%) | 96 (48.2%) |
Race in Wauregan
The most populous races in Wauregan are White / Caucasian (737 | 52.8%), Two or more Races (509 | 36.5%), and Hispanic or Latino (391 | 28.0%).
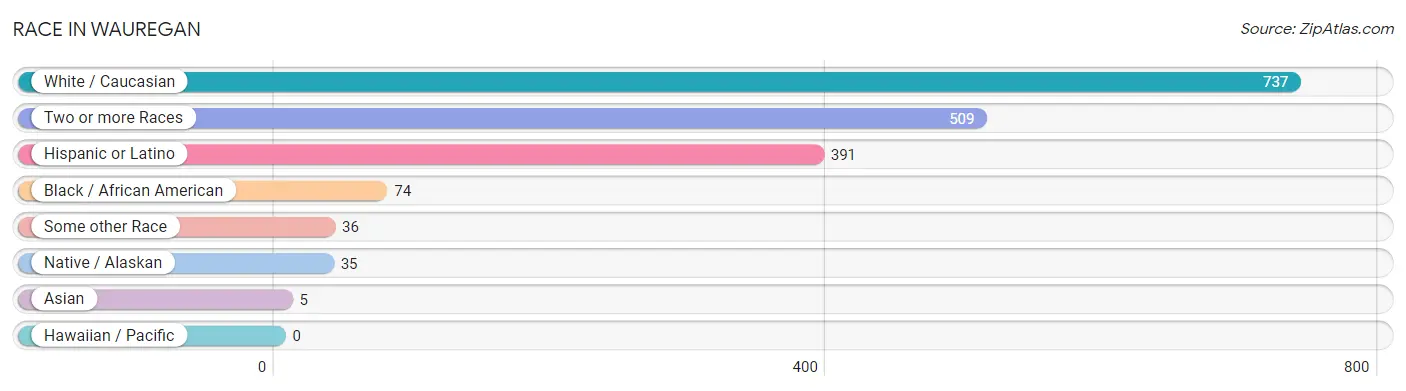
| Race | # Population | % Population |
| Asian | 5 | 0.4% |
| Black / African American | 74 | 5.3% |
| Hawaiian / Pacific | 0 | 0.0% |
| Hispanic or Latino | 391 | 28.0% |
| Native / Alaskan | 35 | 2.5% |
| White / Caucasian | 737 | 52.8% |
| Two or more Races | 509 | 36.5% |
| Some other Race | 36 | 2.6% |
| Total | 1,396 | 100.0% |
Ancestry in Wauregan
The most populous ancestries reported in Wauregan are French (283 | 20.3%), Puerto Rican (217 | 15.5%), German (197 | 14.1%), Central American Indian (192 | 13.8%), and Irish (157 | 11.3%), together accounting for 74.9% of all Wauregan residents.
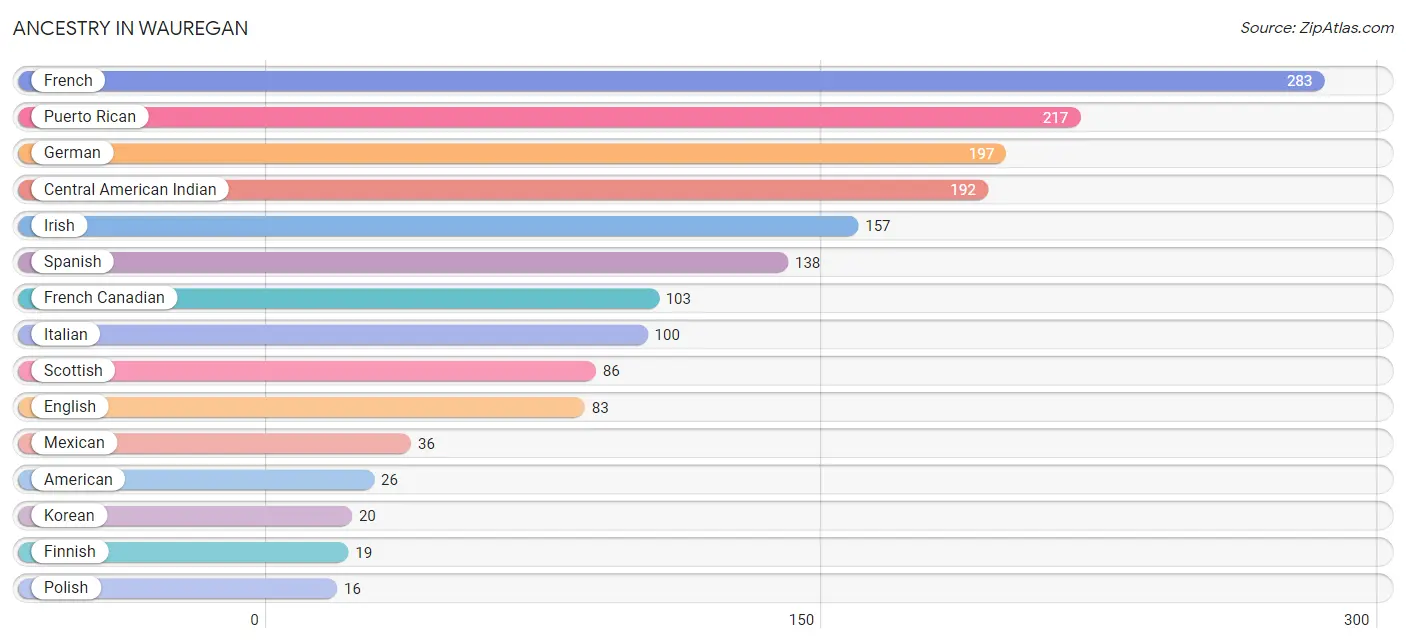
| Ancestry | # Population | % Population |
| American | 26 | 1.9% |
| Belgian | 12 | 0.9% |
| Burmese | 13 | 0.9% |
| Central American Indian | 192 | 13.8% |
| Dutch | 8 | 0.6% |
| English | 83 | 5.9% |
| Finnish | 19 | 1.4% |
| French | 283 | 20.3% |
| French Canadian | 103 | 7.4% |
| German | 197 | 14.1% |
| Hungarian | 4 | 0.3% |
| Irish | 157 | 11.3% |
| Italian | 100 | 7.2% |
| Korean | 20 | 1.4% |
| Mexican | 36 | 2.6% |
| Polish | 16 | 1.1% |
| Puerto Rican | 217 | 15.5% |
| Scottish | 86 | 6.2% |
| Spanish | 138 | 9.9% |
| Swedish | 11 | 0.8% |
| Welsh | 11 | 0.8% | View All 21 Rows |
Immigrants in Wauregan
The most numerous immigrant groups reported in Wauregan came from , and Canada (5 | 0.4%), together accounting for 0.4% of all Wauregan residents.

| Immigration Origin | # Population | % Population |
| Canada | 5 | 0.4% | View All 1 Rows |
Sex and Age in Wauregan
Sex and Age in Wauregan
The most populous age groups in Wauregan are Under 5 Years (112 | 17.7%) for men and 5 to 9 Years (153 | 20.0%) for women.
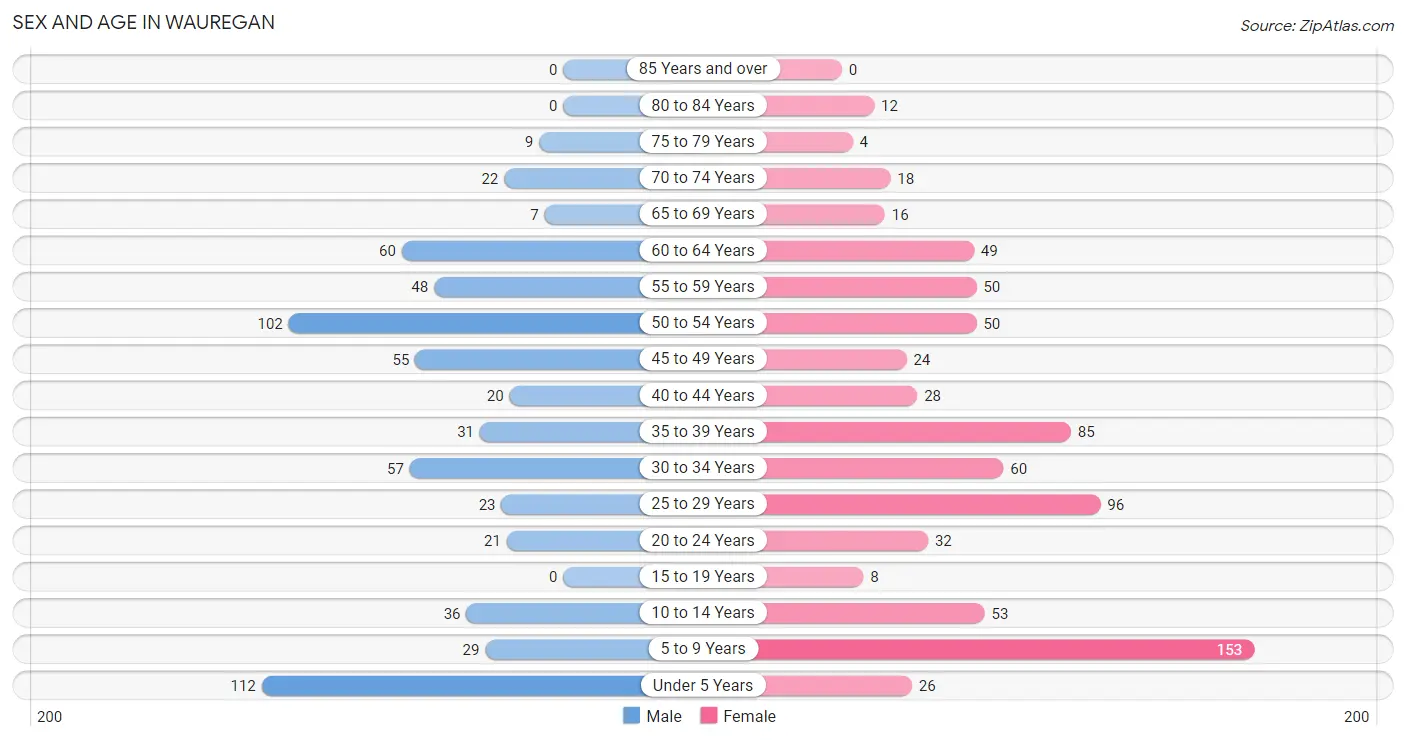
| Age Bracket | Male | Female |
| Under 5 Years | 112 (17.7%) | 26 (3.4%) |
| 5 to 9 Years | 29 (4.6%) | 153 (20.0%) |
| 10 to 14 Years | 36 (5.7%) | 53 (6.9%) |
| 15 to 19 Years | 0 (0.0%) | 8 (1.1%) |
| 20 to 24 Years | 21 (3.3%) | 32 (4.2%) |
| 25 to 29 Years | 23 (3.6%) | 96 (12.6%) |
| 30 to 34 Years | 57 (9.0%) | 60 (7.9%) |
| 35 to 39 Years | 31 (4.9%) | 85 (11.1%) |
| 40 to 44 Years | 20 (3.2%) | 28 (3.7%) |
| 45 to 49 Years | 55 (8.7%) | 24 (3.1%) |
| 50 to 54 Years | 102 (16.1%) | 50 (6.5%) |
| 55 to 59 Years | 48 (7.6%) | 50 (6.5%) |
| 60 to 64 Years | 60 (9.5%) | 49 (6.4%) |
| 65 to 69 Years | 7 (1.1%) | 16 (2.1%) |
| 70 to 74 Years | 22 (3.5%) | 18 (2.4%) |
| 75 to 79 Years | 9 (1.4%) | 4 (0.5%) |
| 80 to 84 Years | 0 (0.0%) | 12 (1.6%) |
| 85 Years and over | 0 (0.0%) | 0 (0.0%) |
| Total | 632 (100.0%) | 764 (100.0%) |
Families and Households in Wauregan
Median Family Size in Wauregan
The median family size in Wauregan is 3.02 persons per family, with married-couple families (175 | 46.8%) accounting for the largest median family size of 3.37 persons per family. On the other hand, single male/father families (76 | 20.3%) represent the smallest median family size with 2.07 persons per family.
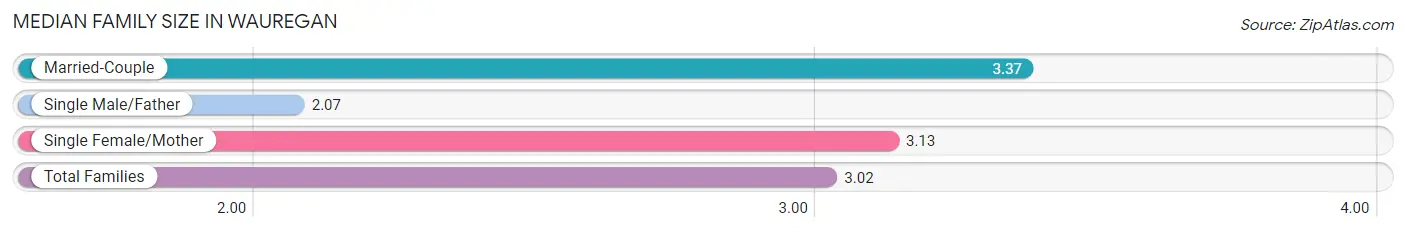
| Family Type | # Families | Family Size |
| Married-Couple | 175 (46.8%) | 3.37 |
| Single Male/Father | 76 (20.3%) | 2.07 |
| Single Female/Mother | 123 (32.9%) | 3.13 |
| Total Families | 374 (100.0%) | 3.02 |
Median Household Size in Wauregan
The median household size in Wauregan is 2.88 persons per household, with single female/mother households (123 | 25.7%) accounting for the largest median household size of 3.72 persons per household. non-family households (105 | 21.9%) represent the smallest median household size with 1.50 persons per household.
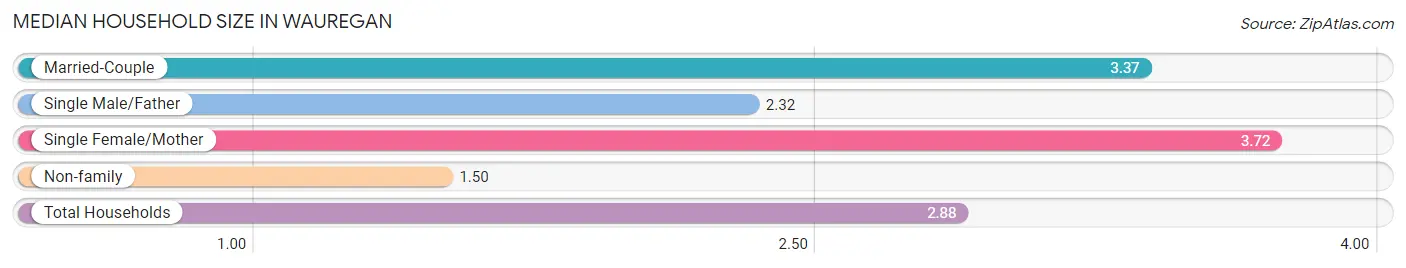
| Household Type | # Households | Household Size |
| Married-Couple | 175 (36.5%) | 3.37 |
| Single Male/Father | 76 (15.9%) | 2.32 |
| Single Female/Mother | 123 (25.7%) | 3.72 |
| Non-family | 105 (21.9%) | 1.50 |
| Total Households | 479 (100.0%) | 2.88 |
Household Size by Marriage Status in Wauregan
Out of a total of 479 households in Wauregan, 374 (78.1%) are family households, while 105 (21.9%) are nonfamily households. The most numerous type of family households are 2-person households, comprising 123, and the most common type of nonfamily households are 1-person households, comprising 68.
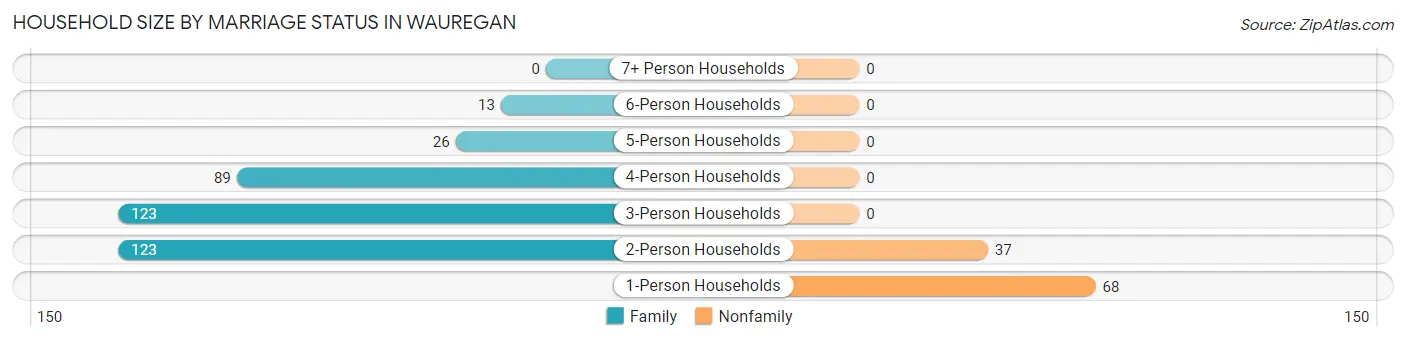
| Household Size | Family Households | Nonfamily Households |
| 1-Person Households | - | 68 (14.2%) |
| 2-Person Households | 123 (25.7%) | 37 (7.7%) |
| 3-Person Households | 123 (25.7%) | 0 (0.0%) |
| 4-Person Households | 89 (18.6%) | 0 (0.0%) |
| 5-Person Households | 26 (5.4%) | 0 (0.0%) |
| 6-Person Households | 13 (2.7%) | 0 (0.0%) |
| 7+ Person Households | 0 (0.0%) | 0 (0.0%) |
| Total | 374 (78.1%) | 105 (21.9%) |
Female Fertility in Wauregan
Fertility by Age in Wauregan
Average fertility rate in Wauregan is 228.0 births per 1,000 women. Women in the age bracket of 20 to 34 years have the highest fertility rate with 404.0 births per 1,000 women. Women in the age bracket of 20 to 34 years acount for 100.0% of all women with births.
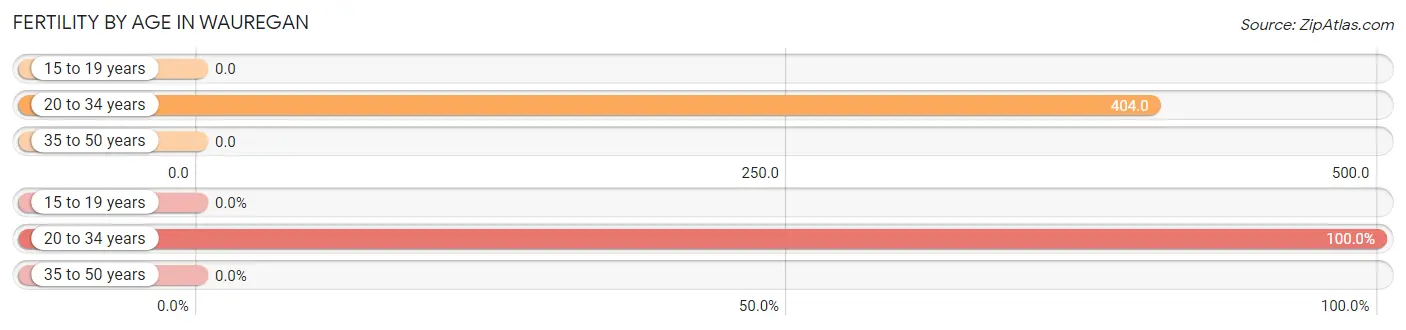
| Age Bracket | Women with Births | Births / 1,000 Women |
| 15 to 19 years | 0 (0.0%) | 0.0 |
| 20 to 34 years | 76 (100.0%) | 404.0 |
| 35 to 50 years | 0 (0.0%) | 0.0 |
| Total | 76 (100.0%) | 228.0 |
Fertility by Age by Marriage Status in Wauregan
86.8% of women with births (76) in Wauregan are married. The highest percentage of unmarried women with births falls into 20 to 34 years age bracket with 13.2% of them unmarried at the time of birth, while the lowest percentage of unmarried women with births belong to 20 to 34 years age bracket with 13.2% of them unmarried.
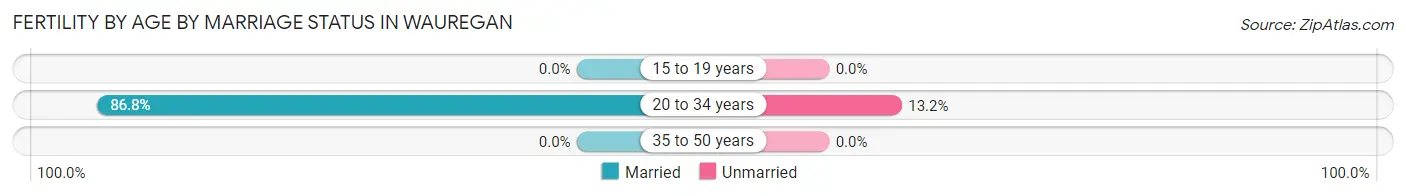
| Age Bracket | Married | Unmarried |
| 15 to 19 years | 0 (0.0%) | 0 (0.0%) |
| 20 to 34 years | 66 (86.8%) | 10 (13.2%) |
| 35 to 50 years | 0 (0.0%) | 0 (0.0%) |
| Total | 66 (86.8%) | 10 (13.2%) |
Fertility by Education in Wauregan
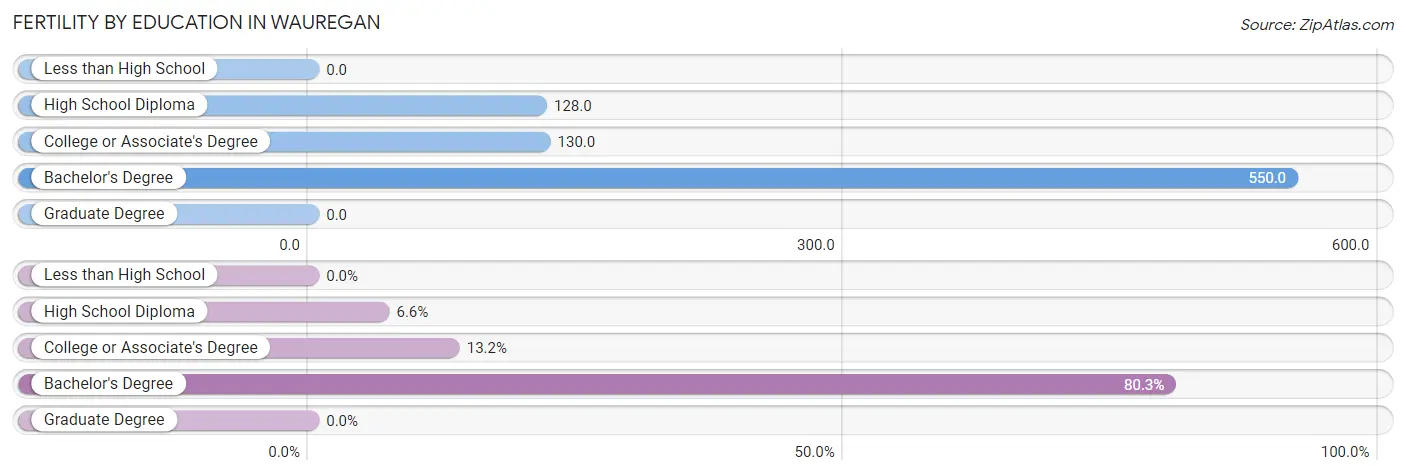
| Educational Attainment | Women with Births | Births / 1,000 Women |
| Less than High School | 0 (0.0%) | 0.0 |
| High School Diploma | 5 (6.6%) | 128.0 |
| College or Associate's Degree | 10 (13.2%) | 130.0 |
| Bachelor's Degree | 61 (80.3%) | 550.0 |
| Graduate Degree | 0 (0.0%) | 0.0 |
| Total | 76 (100.0%) | 228.0 |
Fertility by Education by Marriage Status in Wauregan
13.2% of women with births in Wauregan are unmarried. Women with the educational attainment of high school diploma are most likely to be married with 100.0% of them married at childbirth, while women with the educational attainment of college or associate's degree are least likely to be married with 100.0% of them unmarried at childbirth.
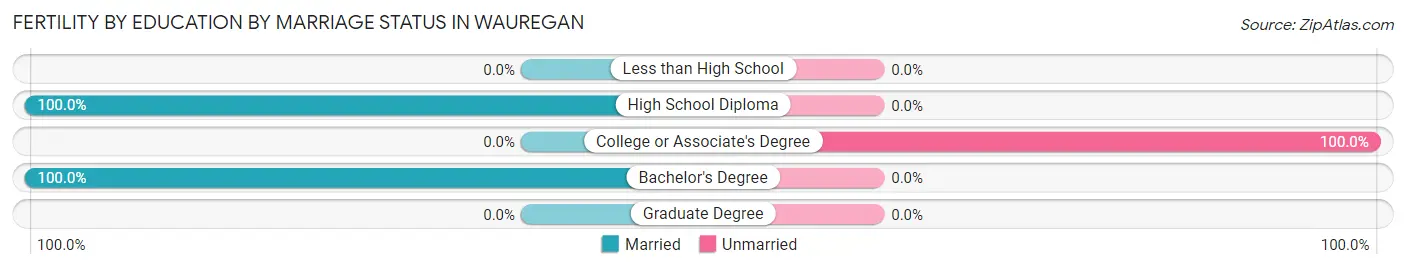
| Educational Attainment | Married | Unmarried |
| Less than High School | 0 (0.0%) | 0 (0.0%) |
| High School Diploma | 5 (100.0%) | 0 (0.0%) |
| College or Associate's Degree | 0 (0.0%) | 10 (100.0%) |
| Bachelor's Degree | 61 (100.0%) | 0 (0.0%) |
| Graduate Degree | 0 (0.0%) | 0 (0.0%) |
| Total | 66 (86.8%) | 10 (13.2%) |
Employment Characteristics in Wauregan
Employment by Class of Employer in Wauregan
Among the 749 employed individuals in Wauregan, private company employees (610 | 81.4%), self-employed (not incorporated) (51 | 6.8%), and not-for-profit organizations (30 | 4.0%) make up the most common classes of employment.
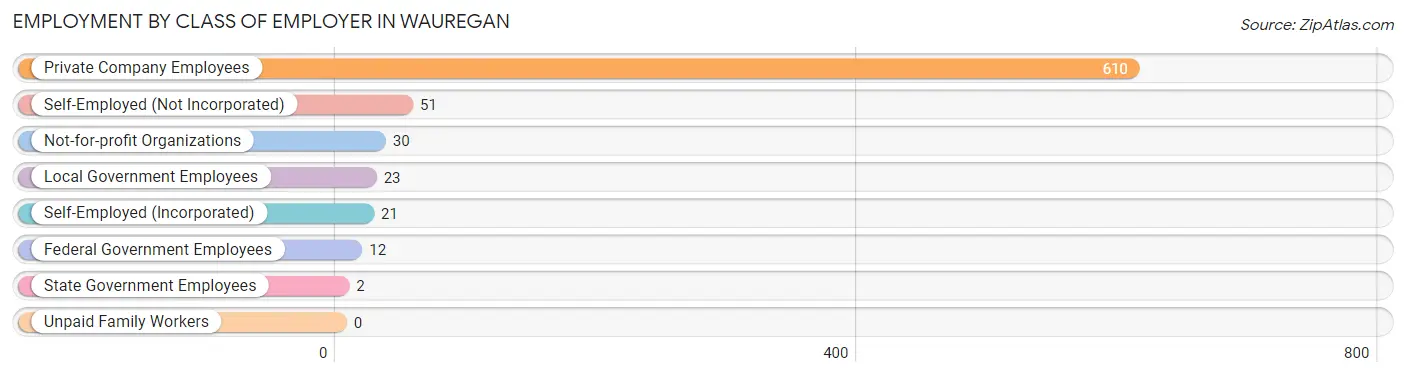
| Employer Class | # Employees | % Employees |
| Private Company Employees | 610 | 81.4% |
| Self-Employed (Incorporated) | 21 | 2.8% |
| Self-Employed (Not Incorporated) | 51 | 6.8% |
| Not-for-profit Organizations | 30 | 4.0% |
| Local Government Employees | 23 | 3.1% |
| State Government Employees | 2 | 0.3% |
| Federal Government Employees | 12 | 1.6% |
| Unpaid Family Workers | 0 | 0.0% |
| Total | 749 | 100.0% |
Employment Status by Age in Wauregan
According to the labor force statistics for Wauregan, out of the total population over 16 years of age (987), 78.6% or 776 individuals are in the labor force, with 2.2% or 17 of them unemployed. The age group with the highest labor force participation rate is 16 to 19 years, with 100.0% or 8 individuals in the labor force. Within the labor force, the 16 to 19 years age range has the highest percentage of unemployed individuals, with 100.0% or 8 of them being unemployed.
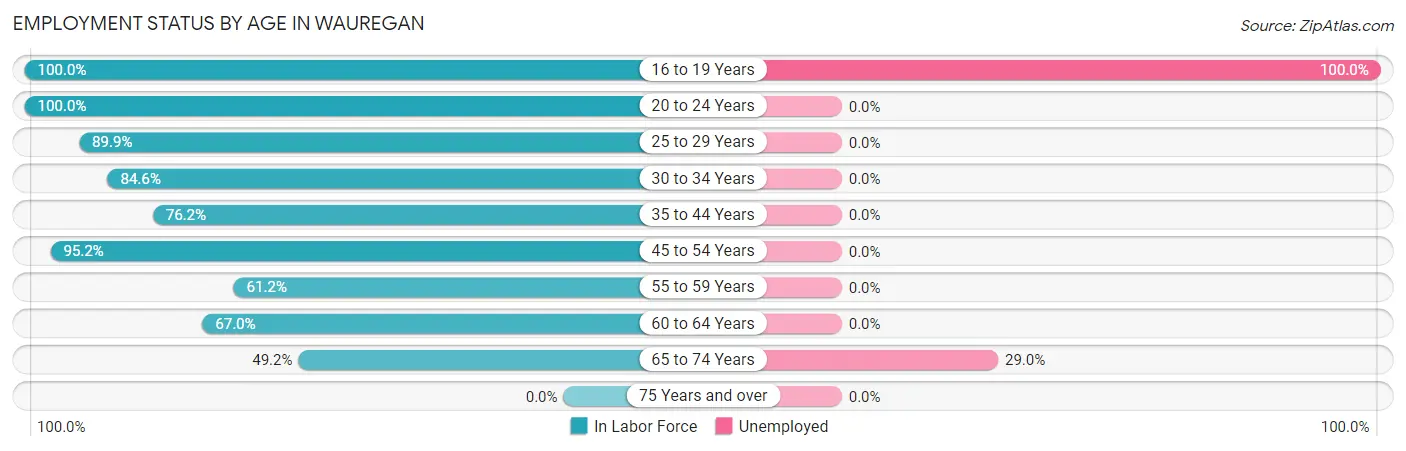
| Age Bracket | In Labor Force | Unemployed |
| 16 to 19 Years | 8 (100.0%) | 8 (100.0%) |
| 20 to 24 Years | 53 (100.0%) | 0 (0.0%) |
| 25 to 29 Years | 107 (89.9%) | 0 (0.0%) |
| 30 to 34 Years | 99 (84.6%) | 0 (0.0%) |
| 35 to 44 Years | 125 (76.2%) | 0 (0.0%) |
| 45 to 54 Years | 220 (95.2%) | 0 (0.0%) |
| 55 to 59 Years | 60 (61.2%) | 0 (0.0%) |
| 60 to 64 Years | 73 (67.0%) | 0 (0.0%) |
| 65 to 74 Years | 31 (49.2%) | 9 (29.0%) |
| 75 Years and over | 0 (0.0%) | 0 (0.0%) |
| Total | 776 (78.6%) | 17 (2.2%) |
Employment Status by Educational Attainment in Wauregan
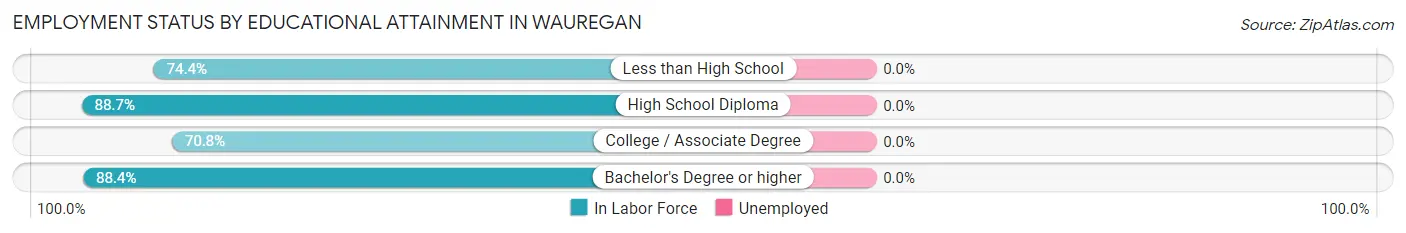
| Educational Attainment | In Labor Force | Unemployed |
| Less than High School | 96 (74.4%) | 0 (0.0%) |
| High School Diploma | 252 (88.7%) | 0 (0.0%) |
| College / Associate Degree | 160 (70.8%) | 0 (0.0%) |
| Bachelor's Degree or higher | 176 (88.4%) | 0 (0.0%) |
| Total | 684 (81.6%) | 0 (0.0%) |
Employment Occupations by Sex in Wauregan
Management, Business, Science and Arts Occupations
The most common Management, Business, Science and Arts occupations in Wauregan are Management (59 | 7.8%), Business & Financial (18 | 2.4%), and Health Diagnosing & Treating (7 | 0.9%).
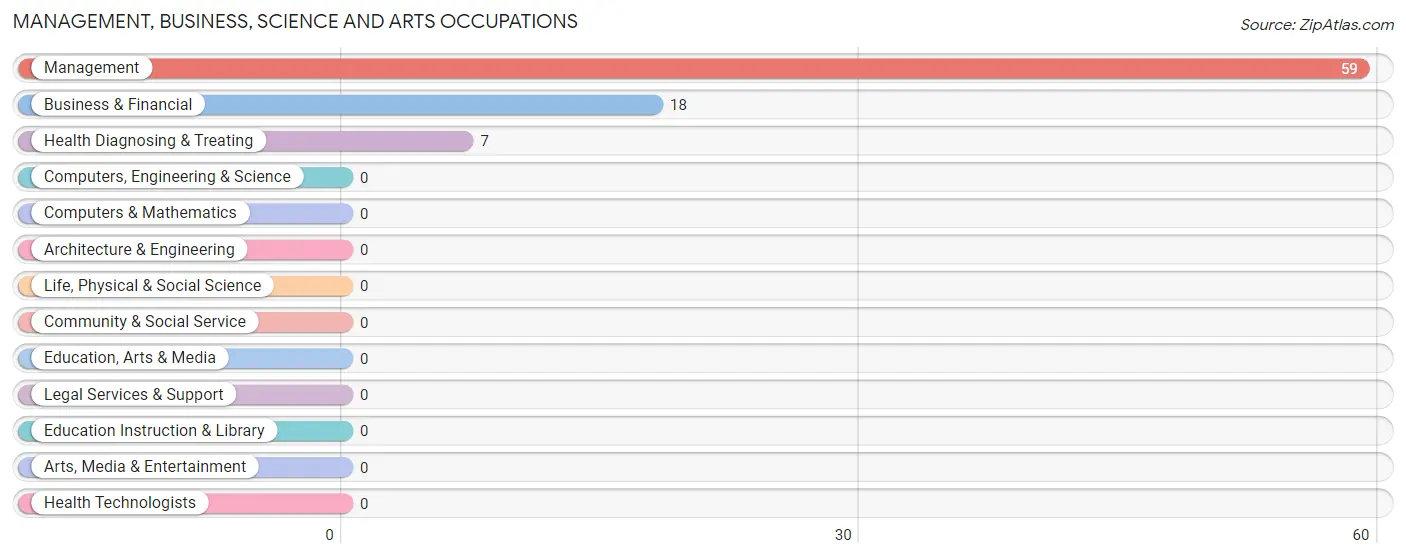
Management, Business, Science and Arts Occupations by Sex
Within the Management, Business, Science and Arts occupations in Wauregan, the most male-oriented occupations are Business & Financial (100.0%), and Management (59.3%), while the most female-oriented occupations are Health Diagnosing & Treating (100.0%), and Management (40.7%).
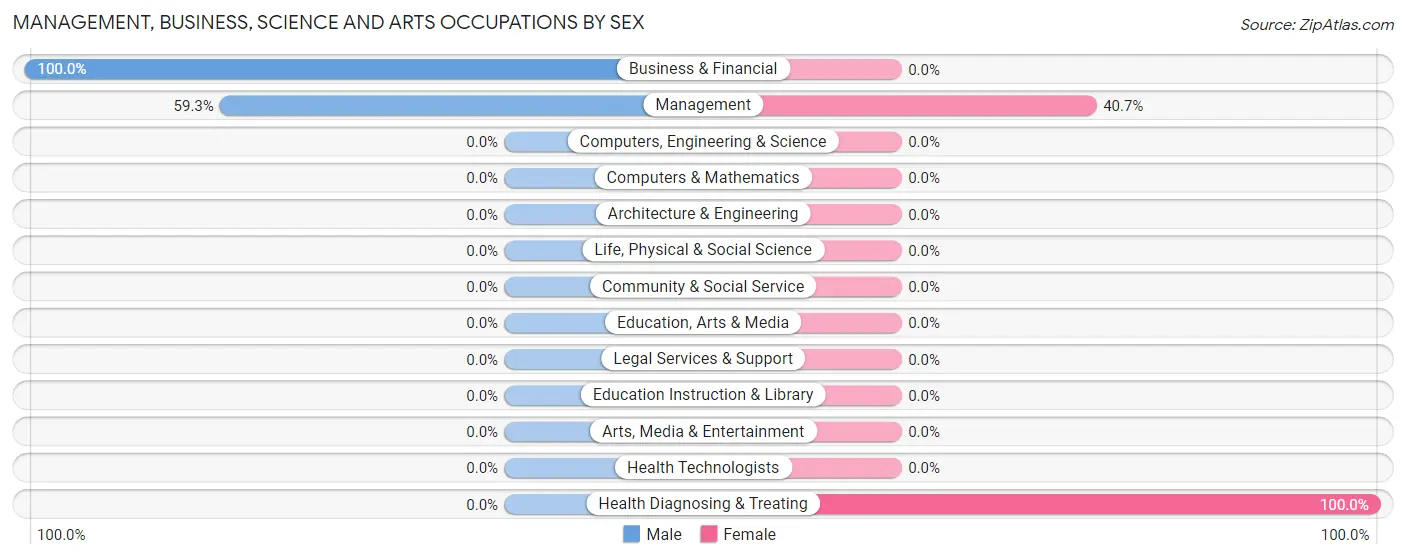
| Occupation | Male | Female |
| Management | 35 (59.3%) | 24 (40.7%) |
| Business & Financial | 18 (100.0%) | 0 (0.0%) |
| Computers, Engineering & Science | 0 (0.0%) | 0 (0.0%) |
| Computers & Mathematics | 0 (0.0%) | 0 (0.0%) |
| Architecture & Engineering | 0 (0.0%) | 0 (0.0%) |
| Life, Physical & Social Science | 0 (0.0%) | 0 (0.0%) |
| Community & Social Service | 0 (0.0%) | 0 (0.0%) |
| Education, Arts & Media | 0 (0.0%) | 0 (0.0%) |
| Legal Services & Support | 0 (0.0%) | 0 (0.0%) |
| Education Instruction & Library | 0 (0.0%) | 0 (0.0%) |
| Arts, Media & Entertainment | 0 (0.0%) | 0 (0.0%) |
| Health Diagnosing & Treating | 0 (0.0%) | 7 (100.0%) |
| Health Technologists | 0 (0.0%) | 0 (0.0%) |
| Total (Category) | 53 (63.1%) | 31 (36.9%) |
| Total (Overall) | 376 (49.5%) | 383 (50.5%) |
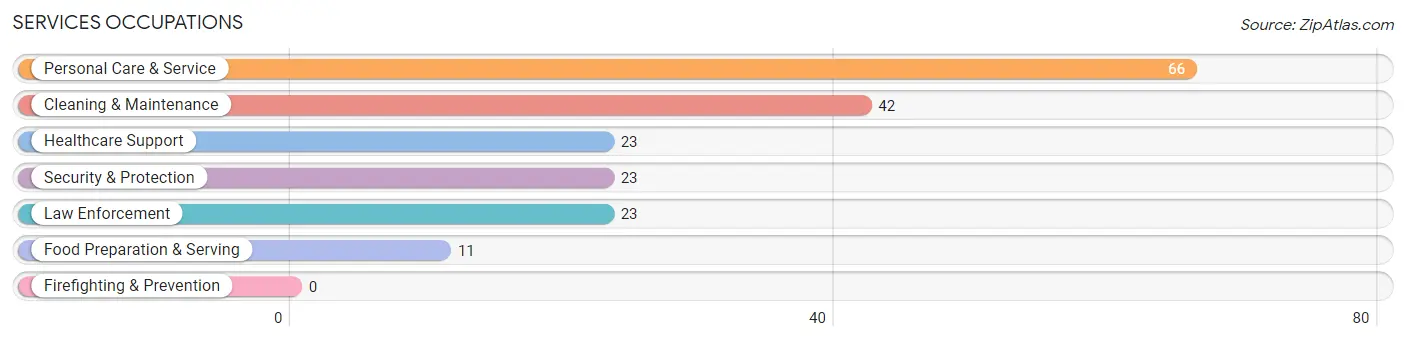
Services Occupations
The most common Services occupations in Wauregan are Personal Care & Service (66 | 8.7%), Cleaning & Maintenance (42 | 5.5%), Healthcare Support (23 | 3.0%), Security & Protection (23 | 3.0%), and Law Enforcement (23 | 3.0%).
Services Occupations by Sex
Within the Services occupations in Wauregan, the most male-oriented occupations are Security & Protection (100.0%), Law Enforcement (100.0%), and Healthcare Support (43.5%), while the most female-oriented occupations are Food Preparation & Serving (100.0%), Personal Care & Service (93.9%), and Cleaning & Maintenance (90.5%).
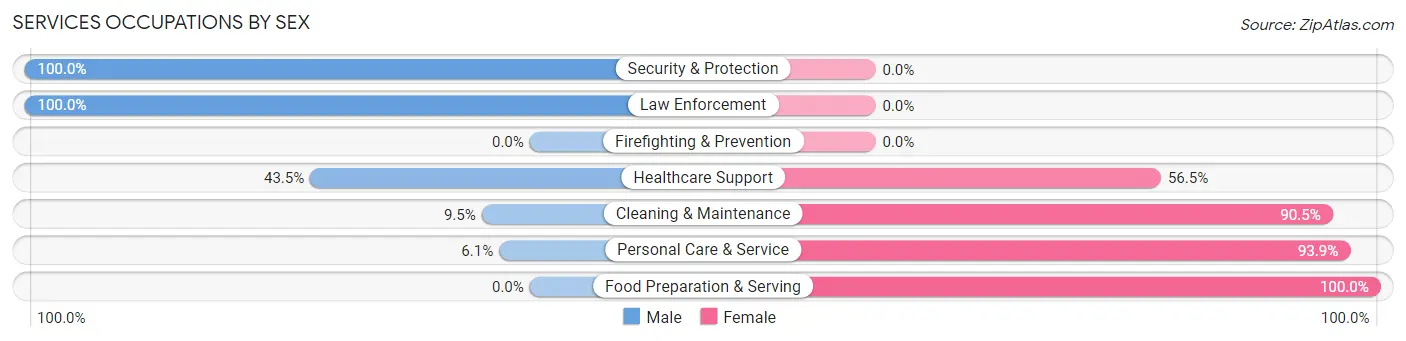
| Occupation | Male | Female |
| Healthcare Support | 10 (43.5%) | 13 (56.5%) |
| Security & Protection | 23 (100.0%) | 0 (0.0%) |
| Firefighting & Prevention | 0 (0.0%) | 0 (0.0%) |
| Law Enforcement | 23 (100.0%) | 0 (0.0%) |
| Food Preparation & Serving | 0 (0.0%) | 11 (100.0%) |
| Cleaning & Maintenance | 4 (9.5%) | 38 (90.5%) |
| Personal Care & Service | 4 (6.1%) | 62 (93.9%) |
| Total (Category) | 41 (24.8%) | 124 (75.1%) |
| Total (Overall) | 376 (49.5%) | 383 (50.5%) |
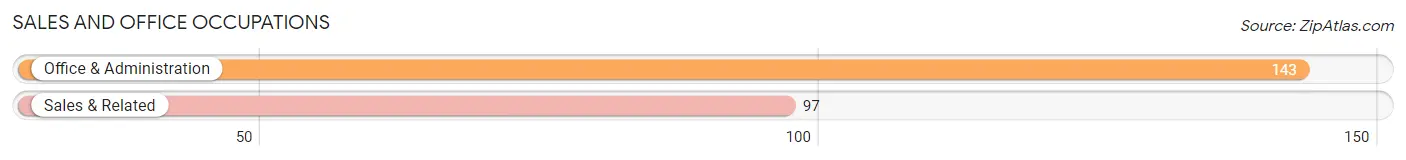
Sales and Office Occupations
The most common Sales and Office occupations in Wauregan are Office & Administration (143 | 18.8%), and Sales & Related (97 | 12.8%).
Sales and Office Occupations by Sex
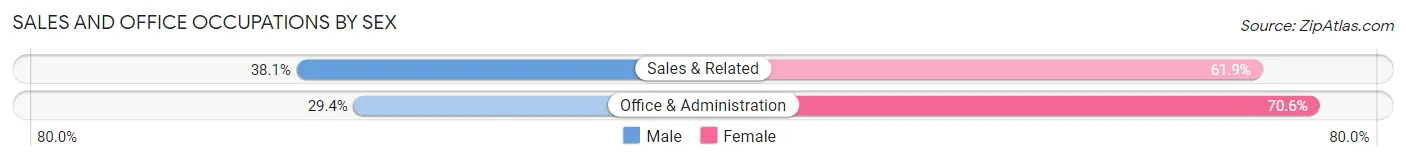
| Occupation | Male | Female |
| Sales & Related | 37 (38.1%) | 60 (61.9%) |
| Office & Administration | 42 (29.4%) | 101 (70.6%) |
| Total (Category) | 79 (32.9%) | 161 (67.1%) |
| Total (Overall) | 376 (49.5%) | 383 (50.5%) |
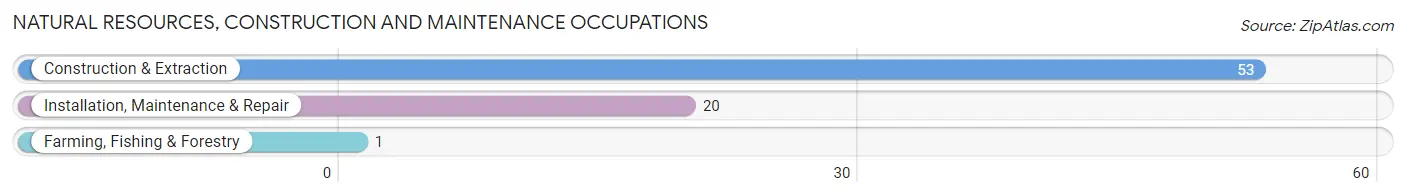
Natural Resources, Construction and Maintenance Occupations
The most common Natural Resources, Construction and Maintenance occupations in Wauregan are Construction & Extraction (53 | 7.0%), Installation, Maintenance & Repair (20 | 2.6%), and Farming, Fishing & Forestry (1 | 0.1%).
Natural Resources, Construction and Maintenance Occupations by Sex
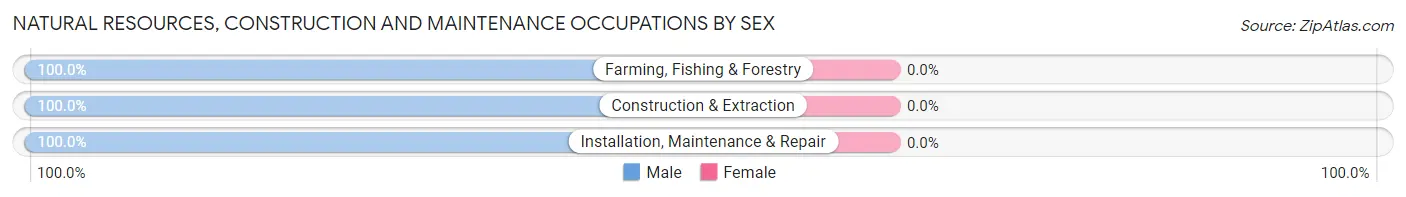
| Occupation | Male | Female |
| Farming, Fishing & Forestry | 1 (100.0%) | 0 (0.0%) |
| Construction & Extraction | 53 (100.0%) | 0 (0.0%) |
| Installation, Maintenance & Repair | 20 (100.0%) | 0 (0.0%) |
| Total (Category) | 74 (100.0%) | 0 (0.0%) |
| Total (Overall) | 376 (49.5%) | 383 (50.5%) |
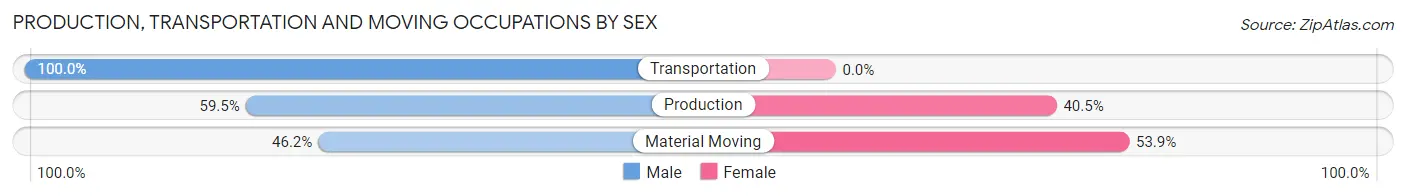
Production, Transportation and Moving Occupations
The most common Production, Transportation and Moving occupations in Wauregan are Production (148 | 19.5%), Transportation (35 | 4.6%), and Material Moving (13 | 1.7%).
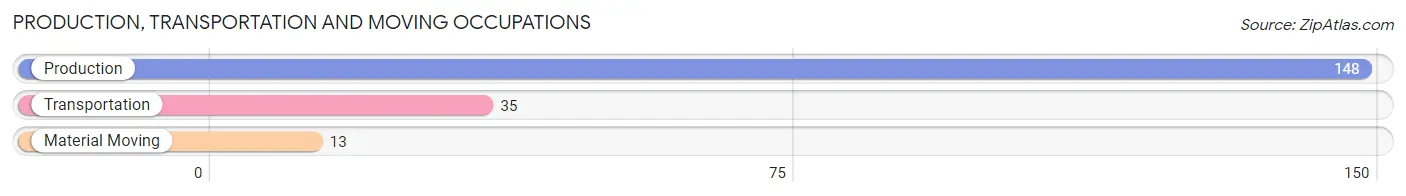
Production, Transportation and Moving Occupations by Sex
| Occupation | Male | Female |
| Production | 88 (59.5%) | 60 (40.5%) |
| Transportation | 35 (100.0%) | 0 (0.0%) |
| Material Moving | 6 (46.2%) | 7 (53.8%) |
| Total (Category) | 129 (65.8%) | 67 (34.2%) |
| Total (Overall) | 376 (49.5%) | 383 (50.5%) |
Employment Industries by Sex in Wauregan
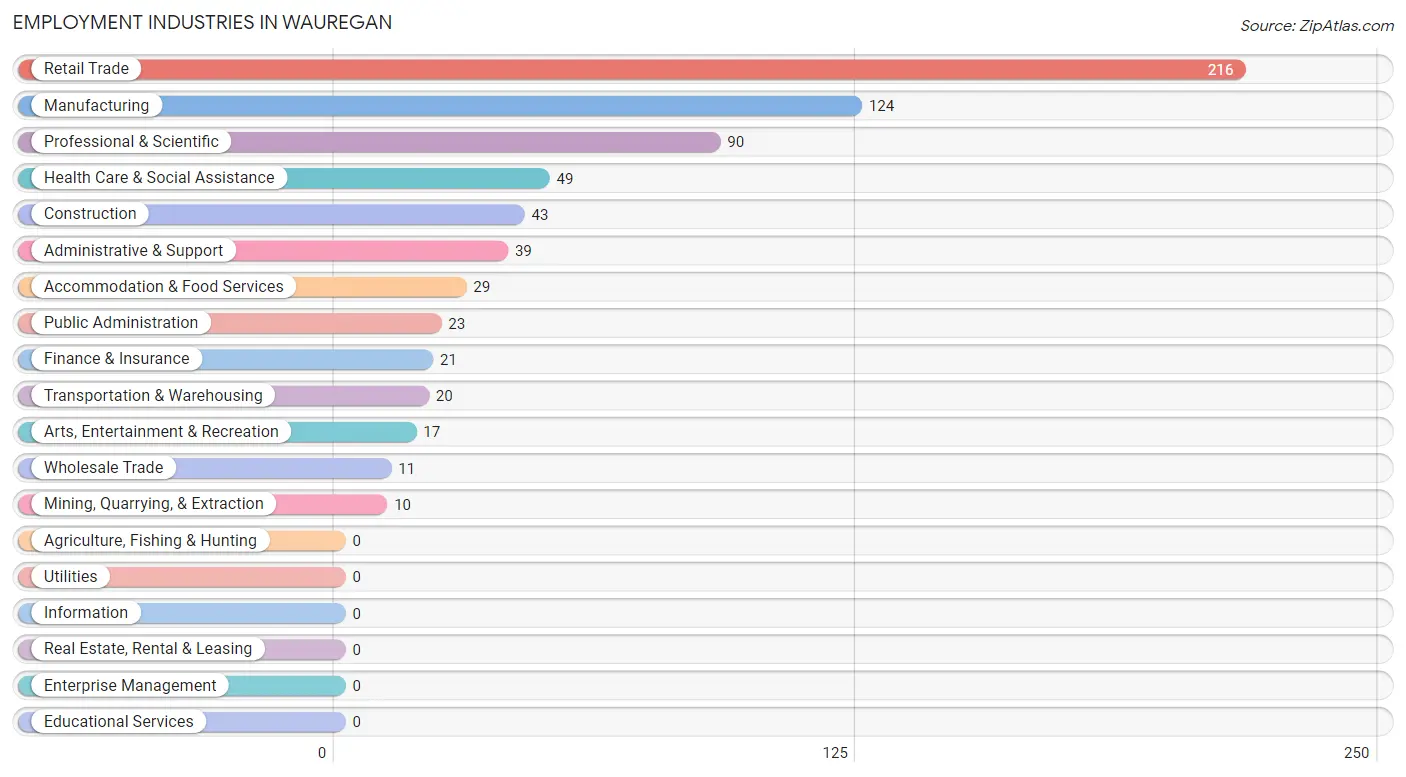
Employment Industries in Wauregan
The major employment industries in Wauregan include Retail Trade (216 | 28.5%), Manufacturing (124 | 16.3%), Professional & Scientific (90 | 11.9%), Health Care & Social Assistance (49 | 6.5%), and Construction (43 | 5.7%).
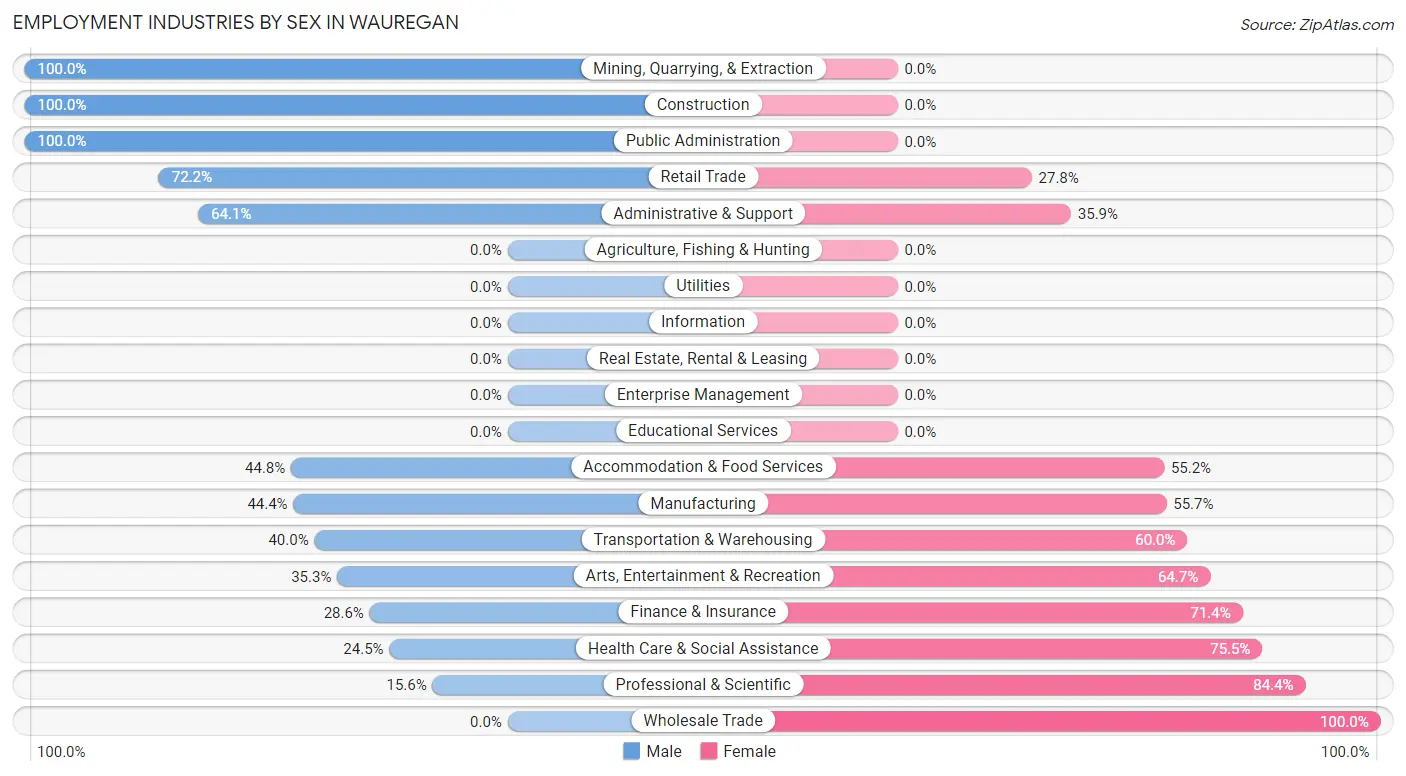
Employment Industries by Sex in Wauregan
The Wauregan industries that see more men than women are Mining, Quarrying, & Extraction (100.0%), Construction (100.0%), and Public Administration (100.0%), whereas the industries that tend to have a higher number of women are Wholesale Trade (100.0%), Professional & Scientific (84.4%), and Health Care & Social Assistance (75.5%).
| Industry | Male | Female |
| Agriculture, Fishing & Hunting | 0 (0.0%) | 0 (0.0%) |
| Mining, Quarrying, & Extraction | 10 (100.0%) | 0 (0.0%) |
| Construction | 43 (100.0%) | 0 (0.0%) |
| Manufacturing | 55 (44.4%) | 69 (55.6%) |
| Wholesale Trade | 0 (0.0%) | 11 (100.0%) |
| Retail Trade | 156 (72.2%) | 60 (27.8%) |
| Transportation & Warehousing | 8 (40.0%) | 12 (60.0%) |
| Utilities | 0 (0.0%) | 0 (0.0%) |
| Information | 0 (0.0%) | 0 (0.0%) |
| Finance & Insurance | 6 (28.6%) | 15 (71.4%) |
| Real Estate, Rental & Leasing | 0 (0.0%) | 0 (0.0%) |
| Professional & Scientific | 14 (15.6%) | 76 (84.4%) |
| Enterprise Management | 0 (0.0%) | 0 (0.0%) |
| Administrative & Support | 25 (64.1%) | 14 (35.9%) |
| Educational Services | 0 (0.0%) | 0 (0.0%) |
| Health Care & Social Assistance | 12 (24.5%) | 37 (75.5%) |
| Arts, Entertainment & Recreation | 6 (35.3%) | 11 (64.7%) |
| Accommodation & Food Services | 13 (44.8%) | 16 (55.2%) |
| Public Administration | 23 (100.0%) | 0 (0.0%) |
| Total | 376 (49.5%) | 383 (50.5%) |
Education in Wauregan
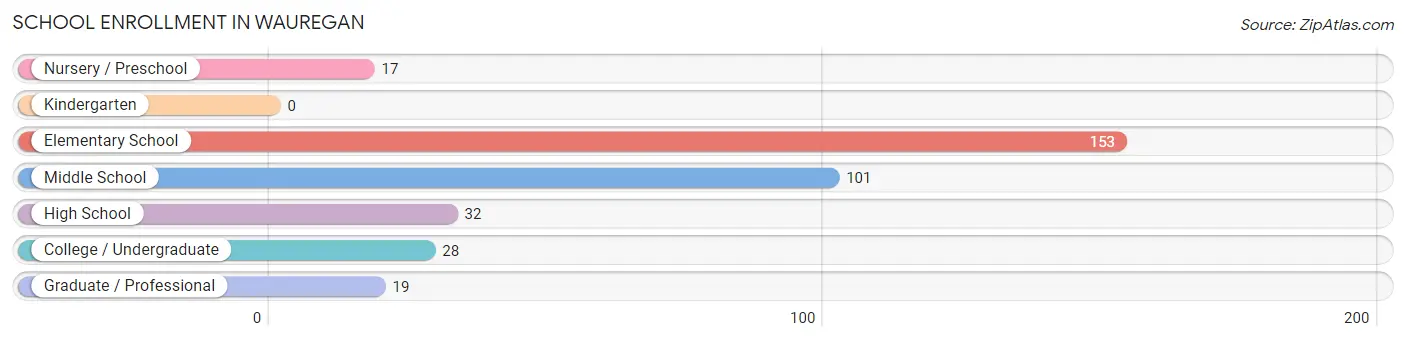
School Enrollment in Wauregan
The most common levels of schooling among the 350 students in Wauregan are elementary school (153 | 43.7%), middle school (101 | 28.9%), and high school (32 | 9.1%).
| School Level | # Students | % Students |
| Nursery / Preschool | 17 | 4.9% |
| Kindergarten | 0 | 0.0% |
| Elementary School | 153 | 43.7% |
| Middle School | 101 | 28.9% |
| High School | 32 | 9.1% |
| College / Undergraduate | 28 | 8.0% |
| Graduate / Professional | 19 | 5.4% |
| Total | 350 | 100.0% |
School Enrollment by Age by Funding Source in Wauregan
Out of a total of 350 students who are enrolled in schools in Wauregan, 20 (5.7%) attend a private institution, while the remaining 330 (94.3%) are enrolled in public schools. The age group of 25 to 34 year olds has the highest likelihood of being enrolled in private schools, with 20 (54.0% in the age bracket) enrolled. Conversely, the age group of 3 to 4 year olds has the lowest likelihood of being enrolled in a private school, with 17 (100.0% in the age bracket) attending a public institution.
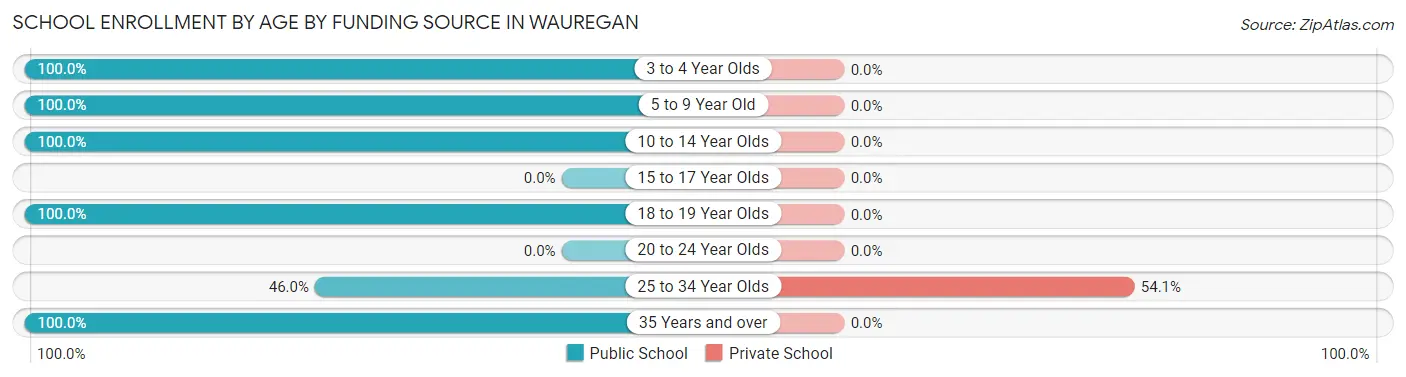
| Age Bracket | Public School | Private School |
| 3 to 4 Year Olds | 17 (100.0%) | 0 (0.0%) |
| 5 to 9 Year Old | 182 (100.0%) | 0 (0.0%) |
| 10 to 14 Year Olds | 89 (100.0%) | 0 (0.0%) |
| 15 to 17 Year Olds | 0 (0.0%) | 0 (0.0%) |
| 18 to 19 Year Olds | 8 (100.0%) | 0 (0.0%) |
| 20 to 24 Year Olds | 0 (0.0%) | 0 (0.0%) |
| 25 to 34 Year Olds | 17 (46.0%) | 20 (54.0%) |
| 35 Years and over | 17 (100.0%) | 0 (0.0%) |
| Total | 330 (94.3%) | 20 (5.7%) |
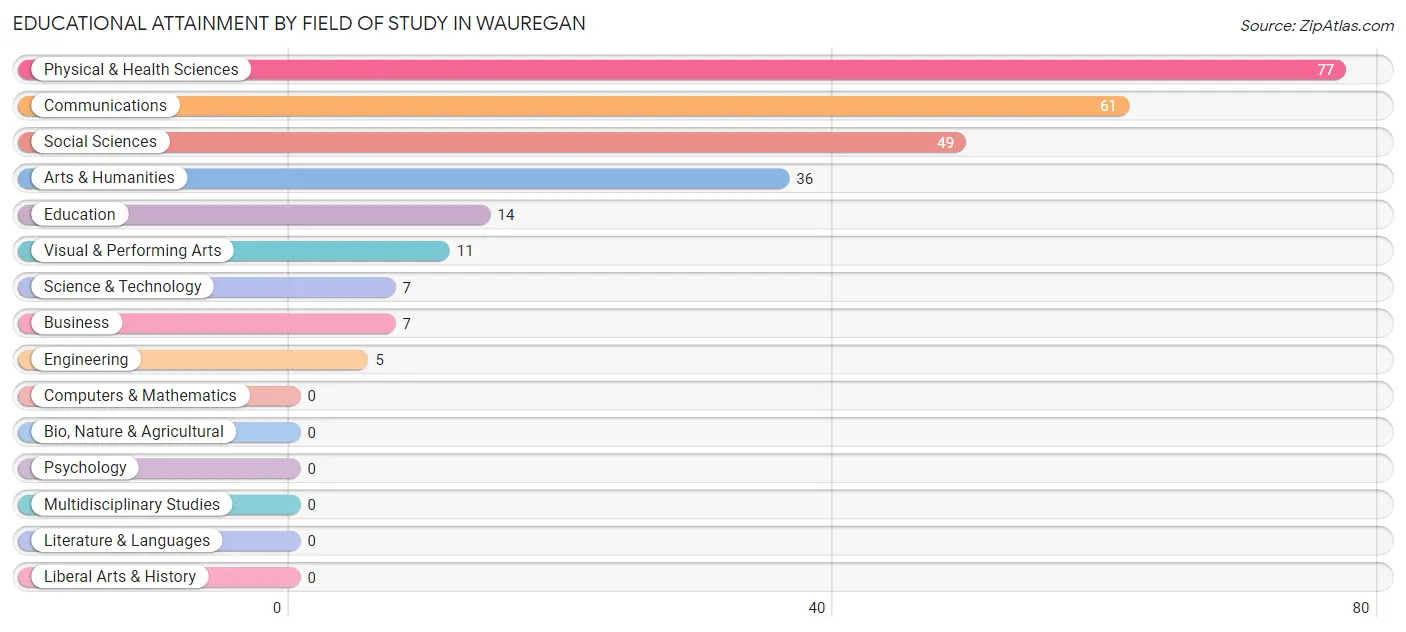
Educational Attainment by Field of Study in Wauregan
Physical & health sciences (77 | 28.8%), communications (61 | 22.9%), social sciences (49 | 18.3%), arts & humanities (36 | 13.5%), and education (14 | 5.2%) are the most common fields of study among 267 individuals in Wauregan who have obtained a bachelor's degree or higher.
| Field of Study | # Graduates | % Graduates |
| Computers & Mathematics | 0 | 0.0% |
| Bio, Nature & Agricultural | 0 | 0.0% |
| Physical & Health Sciences | 77 | 28.8% |
| Psychology | 0 | 0.0% |
| Social Sciences | 49 | 18.3% |
| Engineering | 5 | 1.9% |
| Multidisciplinary Studies | 0 | 0.0% |
| Science & Technology | 7 | 2.6% |
| Business | 7 | 2.6% |
| Education | 14 | 5.2% |
| Literature & Languages | 0 | 0.0% |
| Liberal Arts & History | 0 | 0.0% |
| Visual & Performing Arts | 11 | 4.1% |
| Communications | 61 | 22.9% |
| Arts & Humanities | 36 | 13.5% |
| Total | 267 | 100.0% |
Transportation & Commute in Wauregan
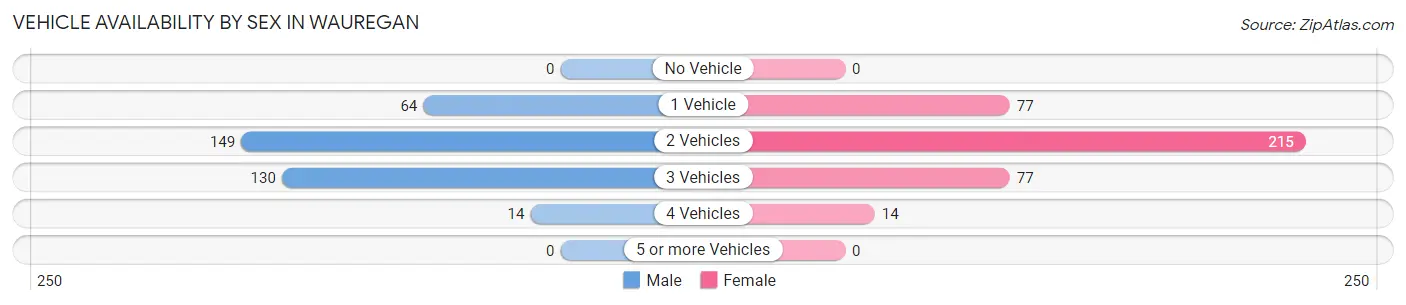
Vehicle Availability by Sex in Wauregan
The most prevalent vehicle ownership categories in Wauregan are males with 2 vehicles (149, accounting for 41.7%) and females with 2 vehicles (215, making up 38.9%).
| Vehicles Available | Male | Female |
| No Vehicle | 0 (0.0%) | 0 (0.0%) |
| 1 Vehicle | 64 (17.9%) | 77 (20.1%) |
| 2 Vehicles | 149 (41.7%) | 215 (56.1%) |
| 3 Vehicles | 130 (36.4%) | 77 (20.1%) |
| 4 Vehicles | 14 (3.9%) | 14 (3.7%) |
| 5 or more Vehicles | 0 (0.0%) | 0 (0.0%) |
| Total | 357 (100.0%) | 383 (100.0%) |
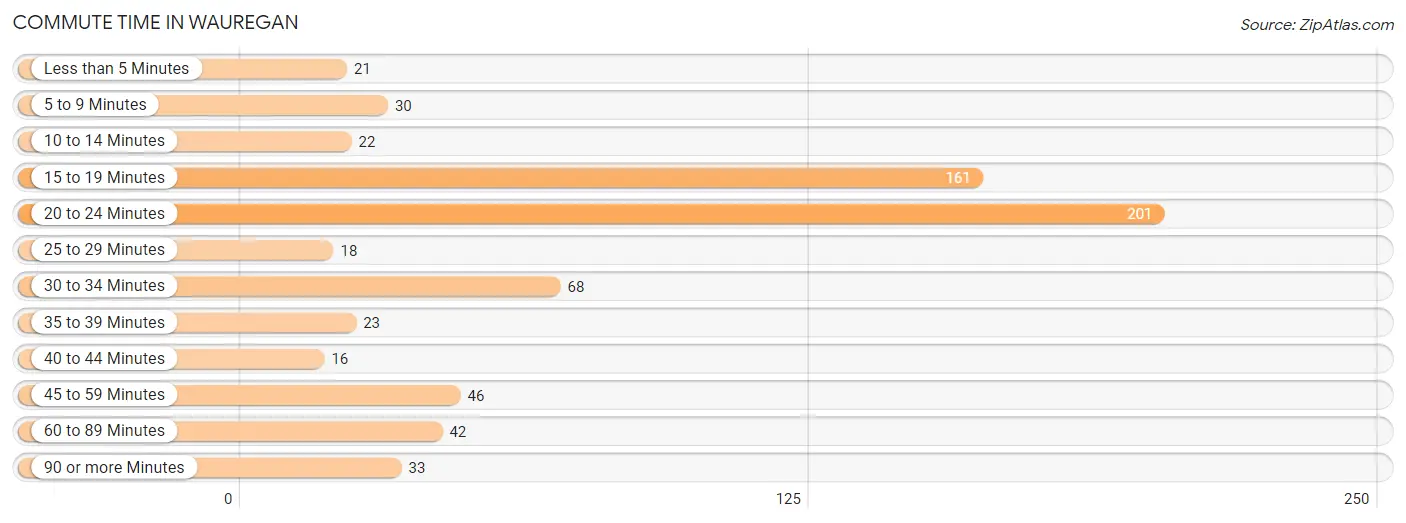
Commute Time in Wauregan
The most frequently occuring commute durations in Wauregan are 20 to 24 minutes (201 commuters, 29.5%), 15 to 19 minutes (161 commuters, 23.6%), and 30 to 34 minutes (68 commuters, 10.0%).
| Commute Time | # Commuters | % Commuters |
| Less than 5 Minutes | 21 | 3.1% |
| 5 to 9 Minutes | 30 | 4.4% |
| 10 to 14 Minutes | 22 | 3.2% |
| 15 to 19 Minutes | 161 | 23.6% |
| 20 to 24 Minutes | 201 | 29.5% |
| 25 to 29 Minutes | 18 | 2.6% |
| 30 to 34 Minutes | 68 | 10.0% |
| 35 to 39 Minutes | 23 | 3.4% |
| 40 to 44 Minutes | 16 | 2.4% |
| 45 to 59 Minutes | 46 | 6.8% |
| 60 to 89 Minutes | 42 | 6.2% |
| 90 or more Minutes | 33 | 4.9% |
Commute Time by Sex in Wauregan
The most common commute times in Wauregan are 20 to 24 minutes (114 commuters, 31.1%) for males and 15 to 19 minutes (95 commuters, 30.2%) for females.
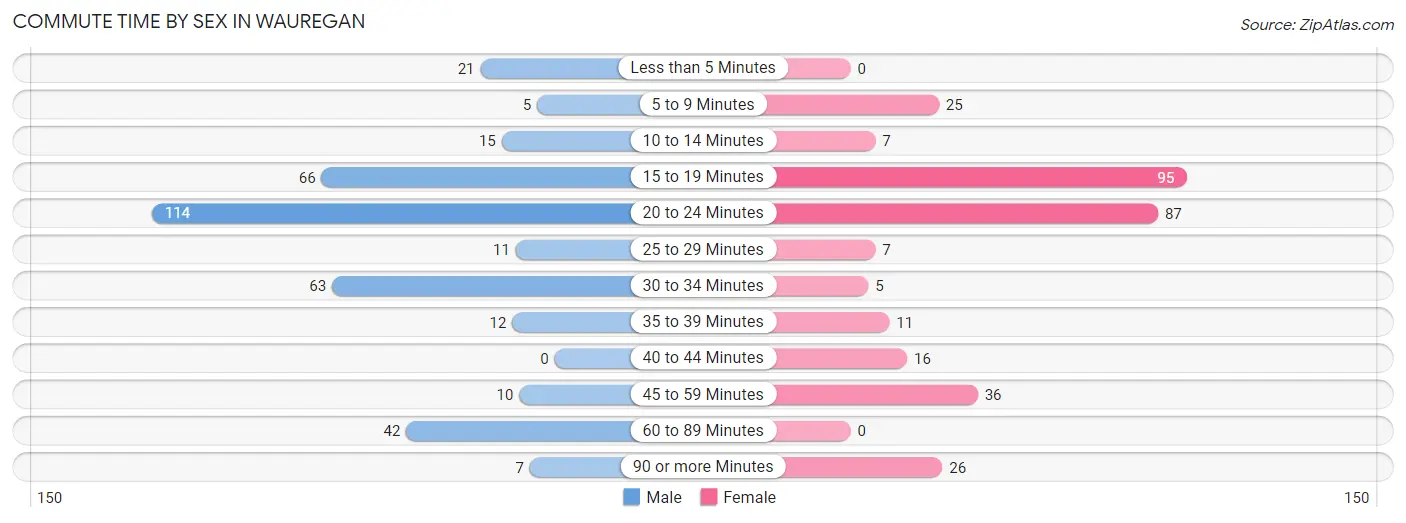
| Commute Time | Male | Female |
| Less than 5 Minutes | 21 (5.7%) | 0 (0.0%) |
| 5 to 9 Minutes | 5 (1.4%) | 25 (7.9%) |
| 10 to 14 Minutes | 15 (4.1%) | 7 (2.2%) |
| 15 to 19 Minutes | 66 (18.0%) | 95 (30.2%) |
| 20 to 24 Minutes | 114 (31.1%) | 87 (27.6%) |
| 25 to 29 Minutes | 11 (3.0%) | 7 (2.2%) |
| 30 to 34 Minutes | 63 (17.2%) | 5 (1.6%) |
| 35 to 39 Minutes | 12 (3.3%) | 11 (3.5%) |
| 40 to 44 Minutes | 0 (0.0%) | 16 (5.1%) |
| 45 to 59 Minutes | 10 (2.7%) | 36 (11.4%) |
| 60 to 89 Minutes | 42 (11.5%) | 0 (0.0%) |
| 90 or more Minutes | 7 (1.9%) | 26 (8.3%) |
Time of Departure to Work by Sex in Wauregan
The most frequent times of departure to work in Wauregan are 5:30 AM to 5:59 AM (75, 20.5%) for males and 7:30 AM to 7:59 AM (63, 20.0%) for females.
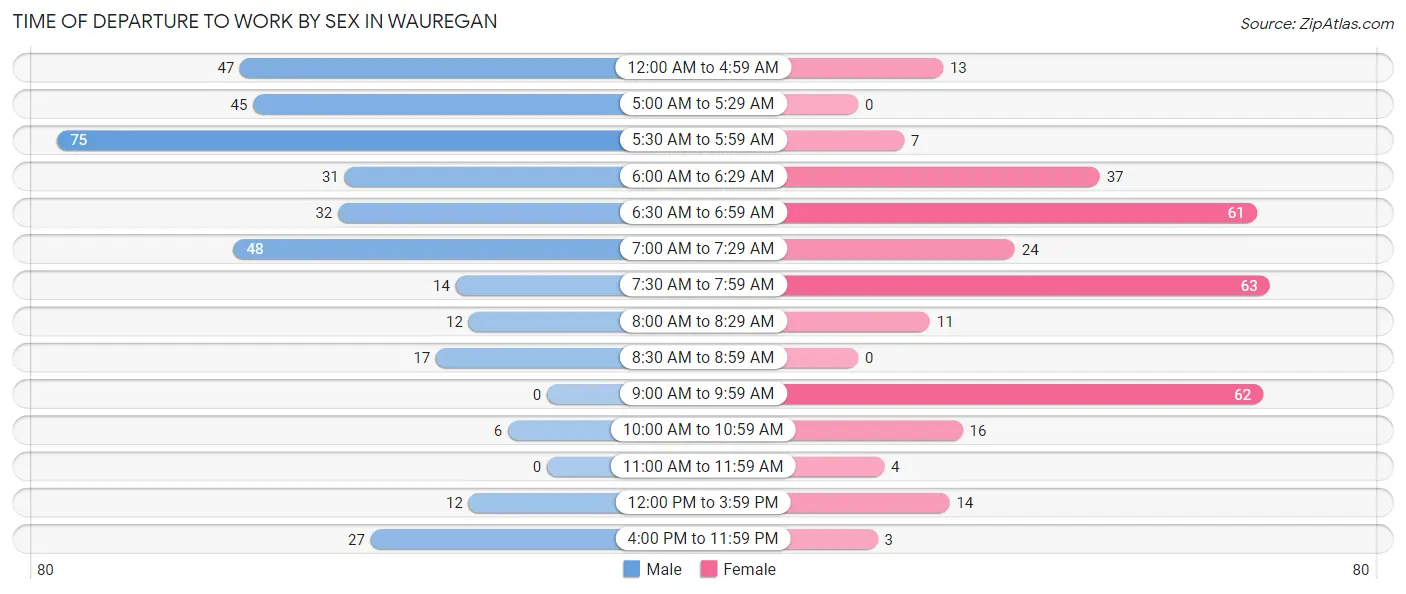
| Time of Departure | Male | Female |
| 12:00 AM to 4:59 AM | 47 (12.8%) | 13 (4.1%) |
| 5:00 AM to 5:29 AM | 45 (12.3%) | 0 (0.0%) |
| 5:30 AM to 5:59 AM | 75 (20.5%) | 7 (2.2%) |
| 6:00 AM to 6:29 AM | 31 (8.5%) | 37 (11.7%) |
| 6:30 AM to 6:59 AM | 32 (8.7%) | 61 (19.4%) |
| 7:00 AM to 7:29 AM | 48 (13.1%) | 24 (7.6%) |
| 7:30 AM to 7:59 AM | 14 (3.8%) | 63 (20.0%) |
| 8:00 AM to 8:29 AM | 12 (3.3%) | 11 (3.5%) |
| 8:30 AM to 8:59 AM | 17 (4.6%) | 0 (0.0%) |
| 9:00 AM to 9:59 AM | 0 (0.0%) | 62 (19.7%) |
| 10:00 AM to 10:59 AM | 6 (1.6%) | 16 (5.1%) |
| 11:00 AM to 11:59 AM | 0 (0.0%) | 4 (1.3%) |
| 12:00 PM to 3:59 PM | 12 (3.3%) | 14 (4.4%) |
| 4:00 PM to 11:59 PM | 27 (7.4%) | 3 (0.9%) |
| Total | 366 (100.0%) | 315 (100.0%) |
Housing Occupancy in Wauregan
Occupancy by Ownership in Wauregan
Of the total 479 dwellings in Wauregan, owner-occupied units account for 272 (56.8%), while renter-occupied units make up 207 (43.2%).
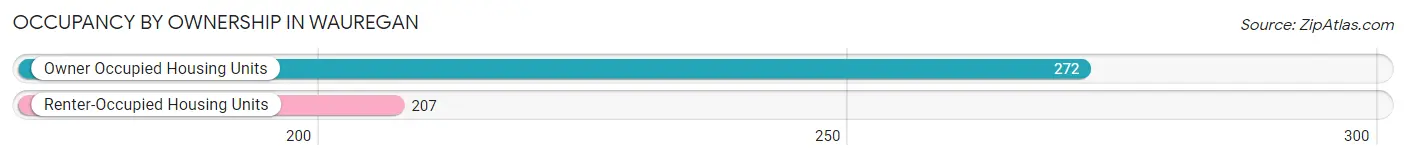
| Occupancy | # Housing Units | % Housing Units |
| Owner Occupied Housing Units | 272 | 56.8% |
| Renter-Occupied Housing Units | 207 | 43.2% |
| Total Occupied Housing Units | 479 | 100.0% |
Occupancy by Household Size in Wauregan
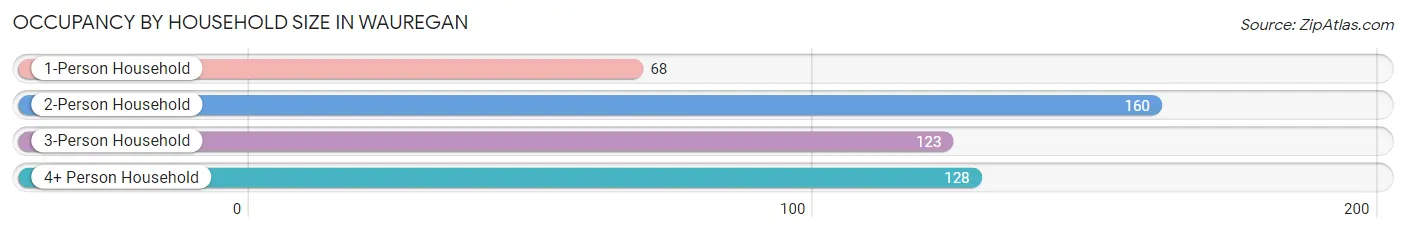
| Household Size | # Housing Units | % Housing Units |
| 1-Person Household | 68 | 14.2% |
| 2-Person Household | 160 | 33.4% |
| 3-Person Household | 123 | 25.7% |
| 4+ Person Household | 128 | 26.7% |
| Total Housing Units | 479 | 100.0% |
Occupancy by Ownership by Household Size in Wauregan
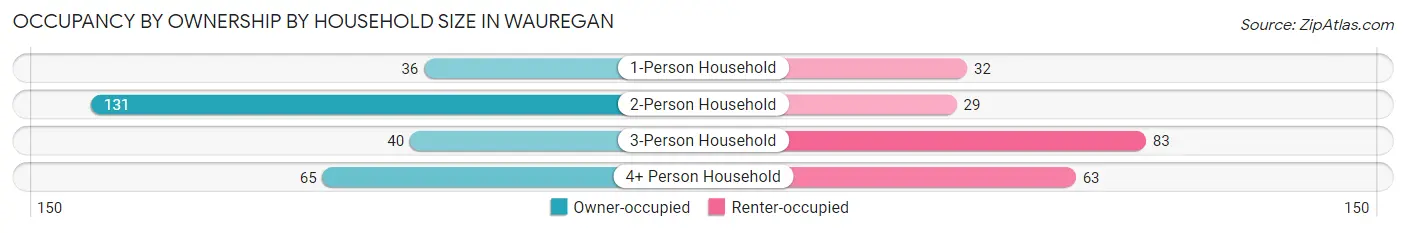
| Household Size | Owner-occupied | Renter-occupied |
| 1-Person Household | 36 (52.9%) | 32 (47.1%) |
| 2-Person Household | 131 (81.9%) | 29 (18.1%) |
| 3-Person Household | 40 (32.5%) | 83 (67.5%) |
| 4+ Person Household | 65 (50.8%) | 63 (49.2%) |
| Total Housing Units | 272 (56.8%) | 207 (43.2%) |
Occupancy by Educational Attainment in Wauregan
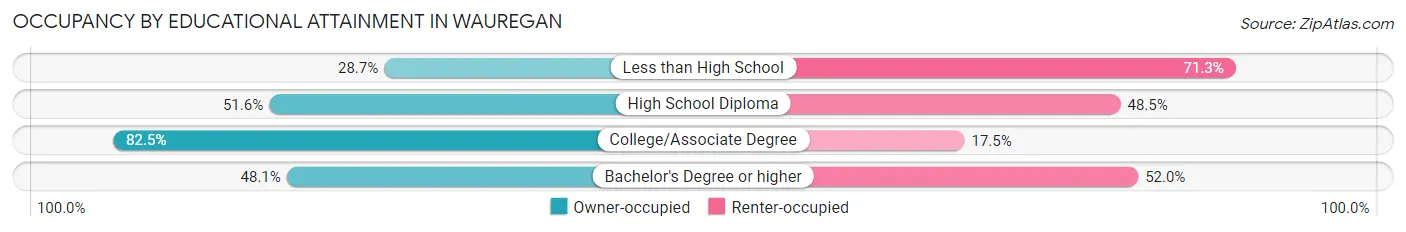
| Household Size | Owner-occupied | Renter-occupied |
| Less than High School | 25 (28.7%) | 62 (71.3%) |
| High School Diploma | 83 (51.5%) | 78 (48.4%) |
| College/Associate Degree | 127 (82.5%) | 27 (17.5%) |
| Bachelor's Degree or higher | 37 (48.0%) | 40 (51.9%) |
Occupancy by Age of Householder in Wauregan
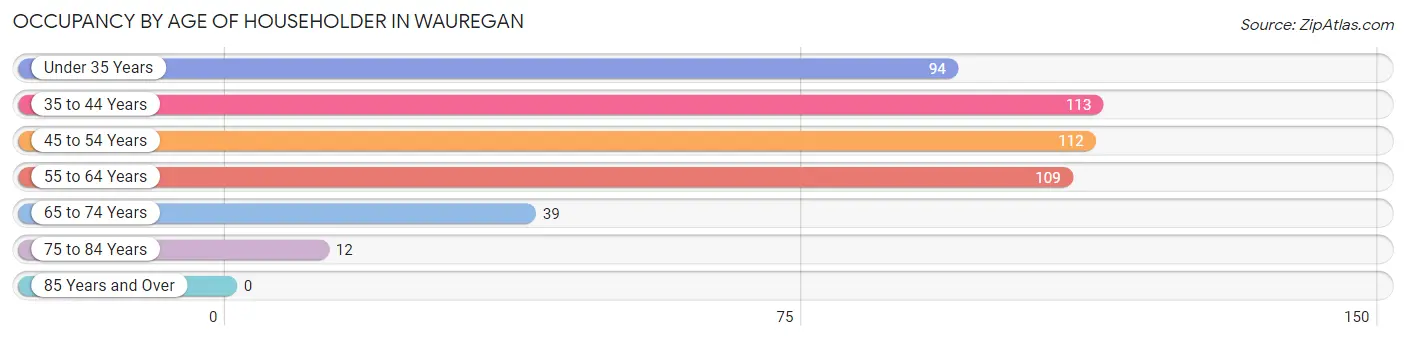
| Age Bracket | # Households | % Households |
| Under 35 Years | 94 | 19.6% |
| 35 to 44 Years | 113 | 23.6% |
| 45 to 54 Years | 112 | 23.4% |
| 55 to 64 Years | 109 | 22.8% |
| 65 to 74 Years | 39 | 8.1% |
| 75 to 84 Years | 12 | 2.5% |
| 85 Years and Over | 0 | 0.0% |
| Total | 479 | 100.0% |
Housing Finances in Wauregan
Median Income by Occupancy in Wauregan
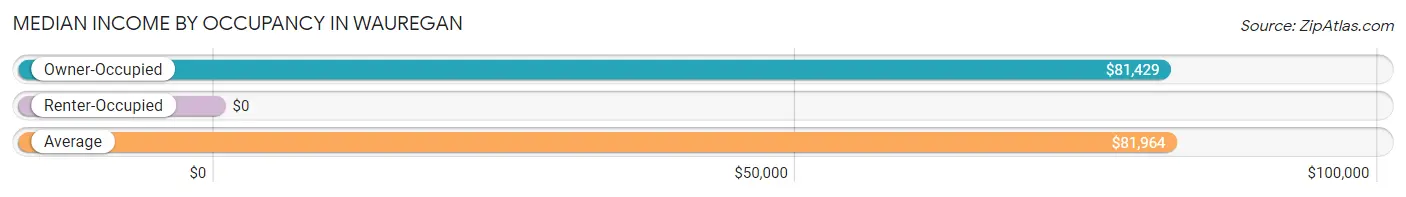
| Occupancy Type | # Households | Median Income |
| Owner-Occupied | 272 (56.8%) | $81,429 |
| Renter-Occupied | 207 (43.2%) | $0 |
| Average | 479 (100.0%) | $81,964 |
Occupancy by Householder Income Bracket in Wauregan
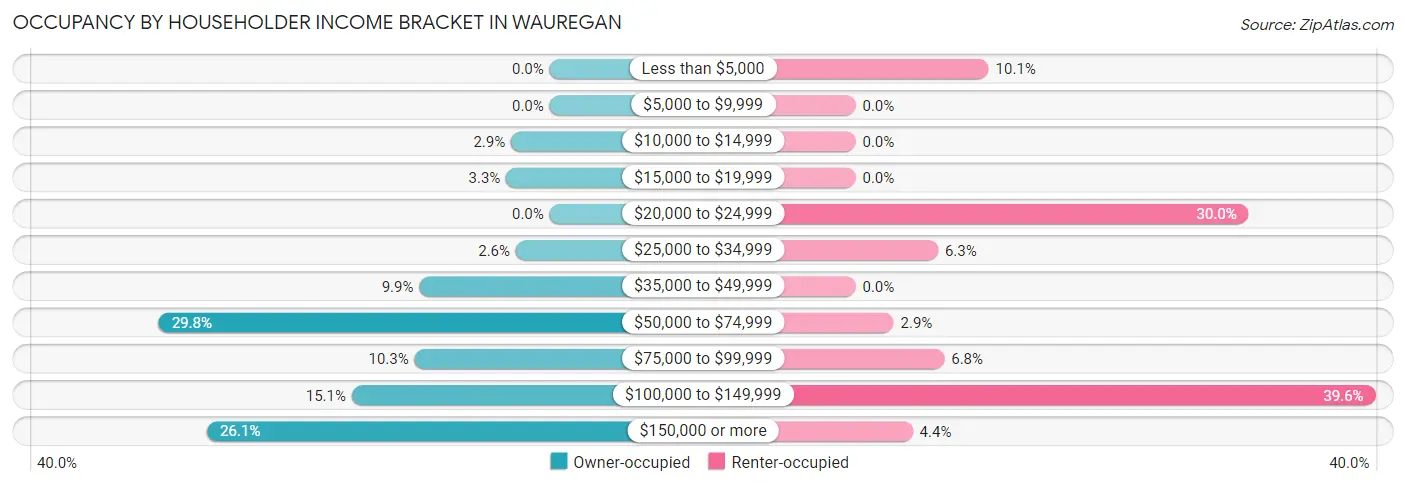
| Income Bracket | Owner-occupied | Renter-occupied |
| Less than $5,000 | 0 (0.0%) | 21 (10.1%) |
| $5,000 to $9,999 | 0 (0.0%) | 0 (0.0%) |
| $10,000 to $14,999 | 8 (2.9%) | 0 (0.0%) |
| $15,000 to $19,999 | 9 (3.3%) | 0 (0.0%) |
| $20,000 to $24,999 | 0 (0.0%) | 62 (29.9%) |
| $25,000 to $34,999 | 7 (2.6%) | 13 (6.3%) |
| $35,000 to $49,999 | 27 (9.9%) | 0 (0.0%) |
| $50,000 to $74,999 | 81 (29.8%) | 6 (2.9%) |
| $75,000 to $99,999 | 28 (10.3%) | 14 (6.8%) |
| $100,000 to $149,999 | 41 (15.1%) | 82 (39.6%) |
| $150,000 or more | 71 (26.1%) | 9 (4.3%) |
| Total | 272 (100.0%) | 207 (100.0%) |
Monthly Housing Cost Tiers in Wauregan
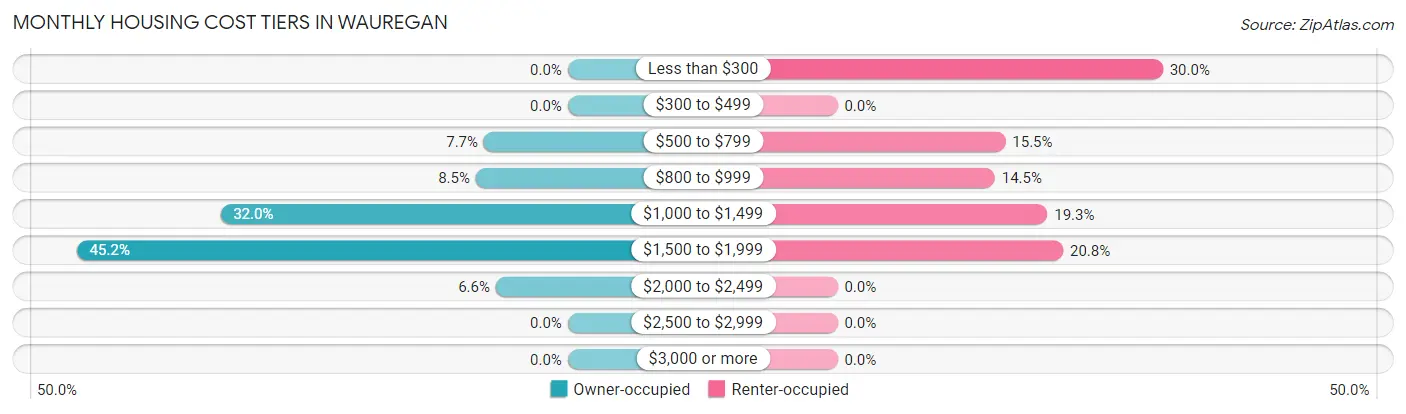
| Monthly Cost | Owner-occupied | Renter-occupied |
| Less than $300 | 0 (0.0%) | 62 (29.9%) |
| $300 to $499 | 0 (0.0%) | 0 (0.0%) |
| $500 to $799 | 21 (7.7%) | 32 (15.5%) |
| $800 to $999 | 23 (8.5%) | 30 (14.5%) |
| $1,000 to $1,499 | 87 (32.0%) | 40 (19.3%) |
| $1,500 to $1,999 | 123 (45.2%) | 43 (20.8%) |
| $2,000 to $2,499 | 18 (6.6%) | 0 (0.0%) |
| $2,500 to $2,999 | 0 (0.0%) | 0 (0.0%) |
| $3,000 or more | 0 (0.0%) | 0 (0.0%) |
| Total | 272 (100.0%) | 207 (100.0%) |
Physical Housing Characteristics in Wauregan
Housing Structures in Wauregan
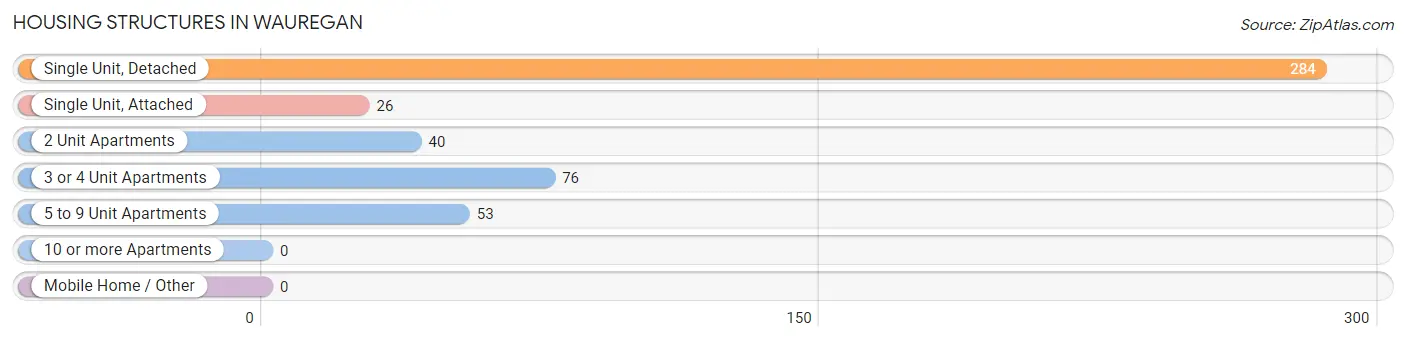
| Structure Type | # Housing Units | % Housing Units |
| Single Unit, Detached | 284 | 59.3% |
| Single Unit, Attached | 26 | 5.4% |
| 2 Unit Apartments | 40 | 8.4% |
| 3 or 4 Unit Apartments | 76 | 15.9% |
| 5 to 9 Unit Apartments | 53 | 11.1% |
| 10 or more Apartments | 0 | 0.0% |
| Mobile Home / Other | 0 | 0.0% |
| Total | 479 | 100.0% |
Housing Structures by Occupancy in Wauregan
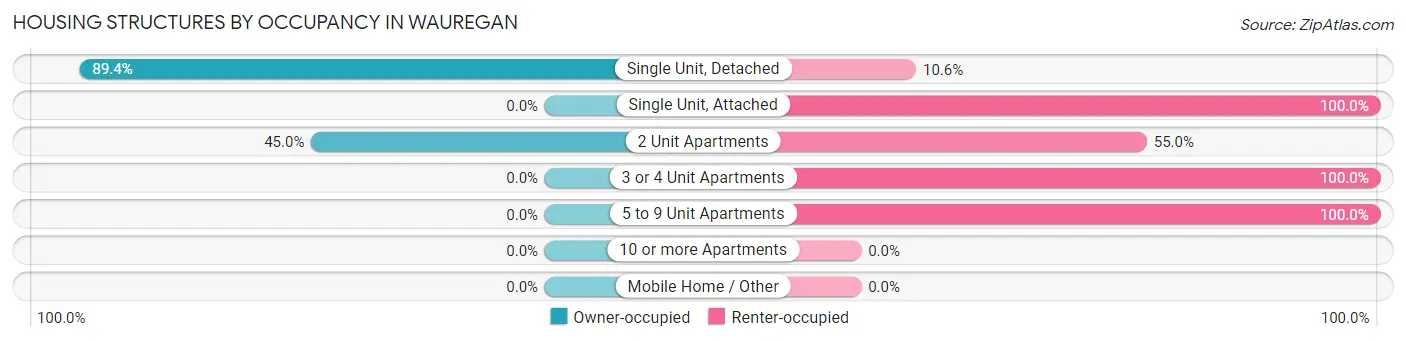
| Structure Type | Owner-occupied | Renter-occupied |
| Single Unit, Detached | 254 (89.4%) | 30 (10.6%) |
| Single Unit, Attached | 0 (0.0%) | 26 (100.0%) |
| 2 Unit Apartments | 18 (45.0%) | 22 (55.0%) |
| 3 or 4 Unit Apartments | 0 (0.0%) | 76 (100.0%) |
| 5 to 9 Unit Apartments | 0 (0.0%) | 53 (100.0%) |
| 10 or more Apartments | 0 (0.0%) | 0 (0.0%) |
| Mobile Home / Other | 0 (0.0%) | 0 (0.0%) |
| Total | 272 (56.8%) | 207 (43.2%) |
Housing Structures by Number of Rooms in Wauregan
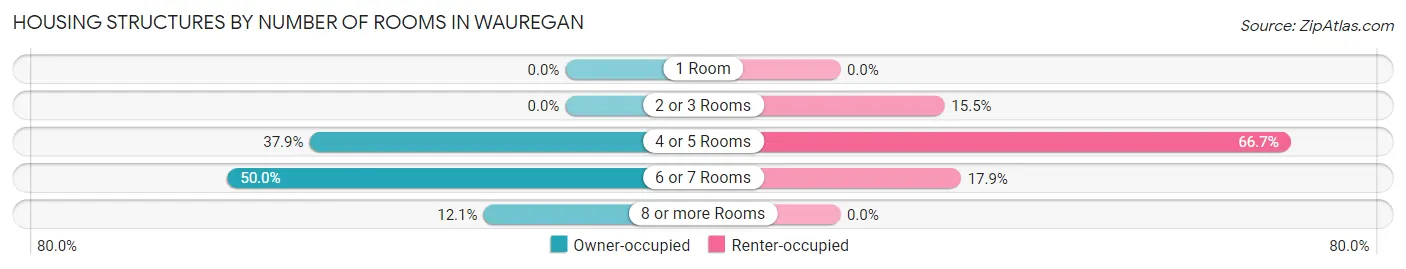
| Number of Rooms | Owner-occupied | Renter-occupied |
| 1 Room | 0 (0.0%) | 0 (0.0%) |
| 2 or 3 Rooms | 0 (0.0%) | 32 (15.5%) |
| 4 or 5 Rooms | 103 (37.9%) | 138 (66.7%) |
| 6 or 7 Rooms | 136 (50.0%) | 37 (17.9%) |
| 8 or more Rooms | 33 (12.1%) | 0 (0.0%) |
| Total | 272 (100.0%) | 207 (100.0%) |
Housing Structure by Heating Type in Wauregan
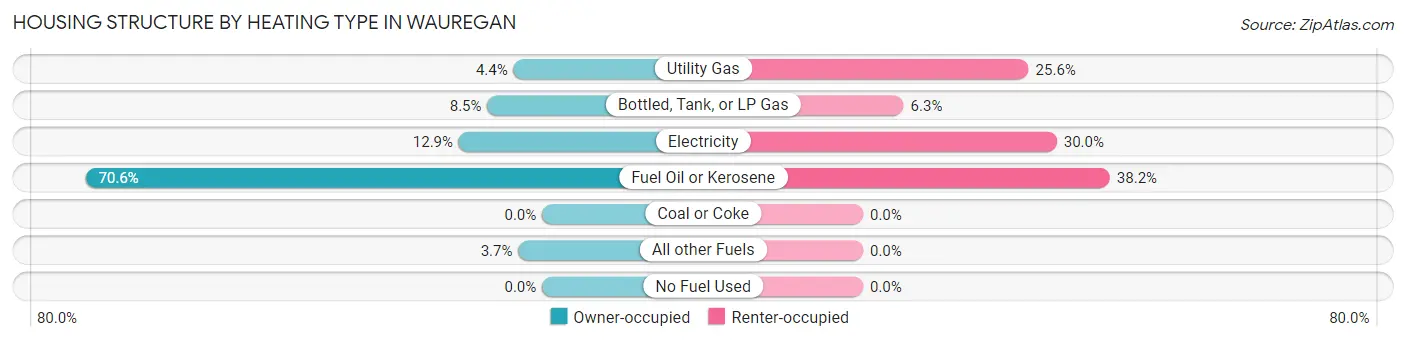
| Heating Type | Owner-occupied | Renter-occupied |
| Utility Gas | 12 (4.4%) | 53 (25.6%) |
| Bottled, Tank, or LP Gas | 23 (8.5%) | 13 (6.3%) |
| Electricity | 35 (12.9%) | 62 (29.9%) |
| Fuel Oil or Kerosene | 192 (70.6%) | 79 (38.2%) |
| Coal or Coke | 0 (0.0%) | 0 (0.0%) |
| All other Fuels | 10 (3.7%) | 0 (0.0%) |
| No Fuel Used | 0 (0.0%) | 0 (0.0%) |
| Total | 272 (100.0%) | 207 (100.0%) |
Household Vehicle Usage in Wauregan
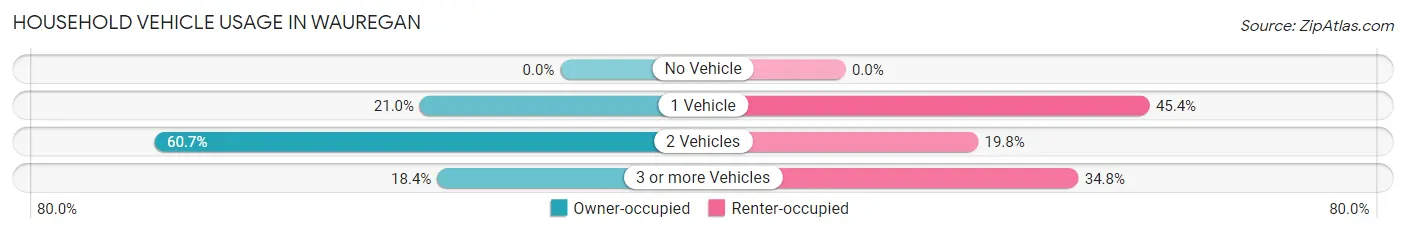
| Vehicles per Household | Owner-occupied | Renter-occupied |
| No Vehicle | 0 (0.0%) | 0 (0.0%) |
| 1 Vehicle | 57 (21.0%) | 94 (45.4%) |
| 2 Vehicles | 165 (60.7%) | 41 (19.8%) |
| 3 or more Vehicles | 50 (18.4%) | 72 (34.8%) |
| Total | 272 (100.0%) | 207 (100.0%) |
Real Estate & Mortgages in Wauregan
Real Estate and Mortgage Overview in Wauregan
| Characteristic | Without Mortgage | With Mortgage |
| Housing Units | 40 | 232 |
| Median Property Value | $252,400 | $216,500 |
| Median Household Income | - | - |
| Monthly Housing Costs | $795 | $0 |
| Real Estate Taxes | $3,870 | $0 |
Property Value by Mortgage Status in Wauregan
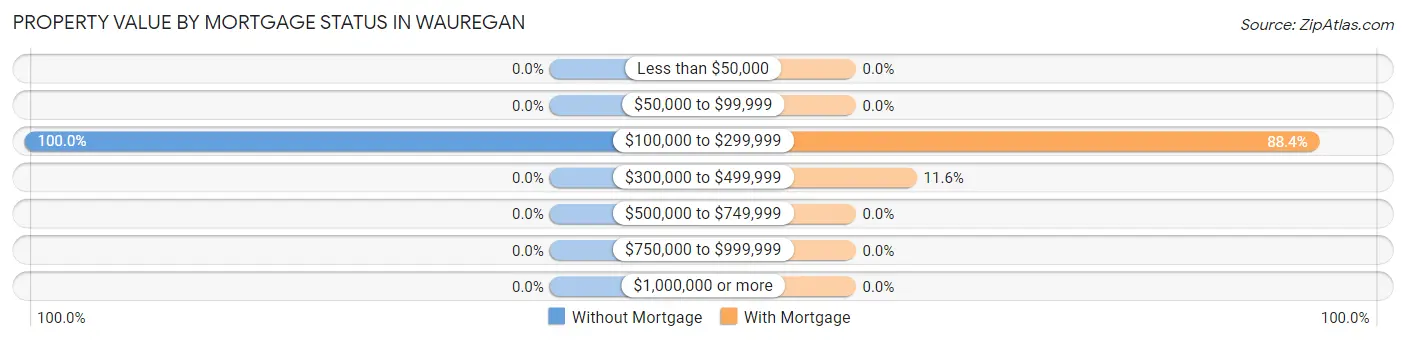
| Property Value | Without Mortgage | With Mortgage |
| Less than $50,000 | 0 (0.0%) | 0 (0.0%) |
| $50,000 to $99,999 | 0 (0.0%) | 0 (0.0%) |
| $100,000 to $299,999 | 40 (100.0%) | 205 (88.4%) |
| $300,000 to $499,999 | 0 (0.0%) | 27 (11.6%) |
| $500,000 to $749,999 | 0 (0.0%) | 0 (0.0%) |
| $750,000 to $999,999 | 0 (0.0%) | 0 (0.0%) |
| $1,000,000 or more | 0 (0.0%) | 0 (0.0%) |
| Total | 40 (100.0%) | 232 (100.0%) |
Household Income by Mortgage Status in Wauregan
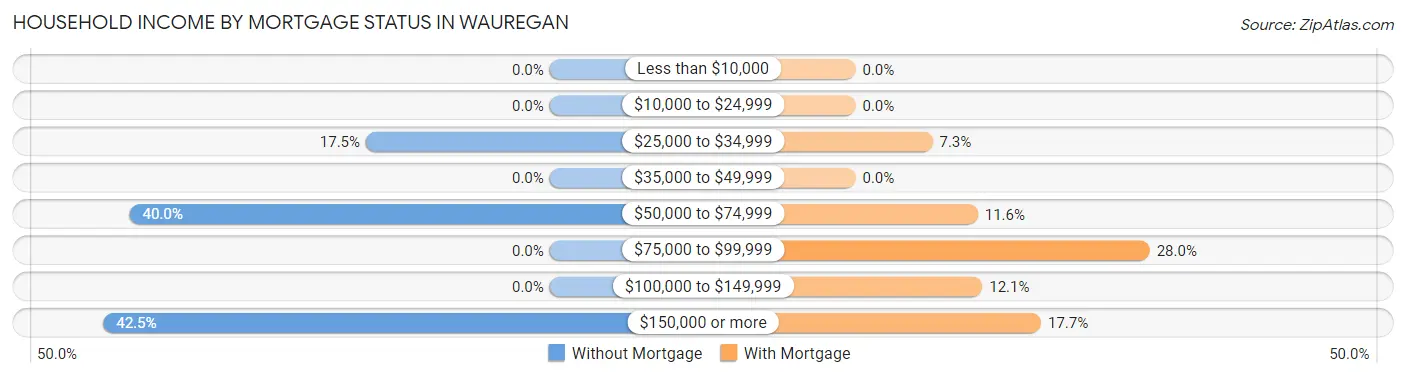
| Household Income | Without Mortgage | With Mortgage |
| Less than $10,000 | 0 (0.0%) | 0 (0.0%) |
| $10,000 to $24,999 | 0 (0.0%) | 0 (0.0%) |
| $25,000 to $34,999 | 7 (17.5%) | 17 (7.3%) |
| $35,000 to $49,999 | 0 (0.0%) | 0 (0.0%) |
| $50,000 to $74,999 | 16 (40.0%) | 27 (11.6%) |
| $75,000 to $99,999 | 0 (0.0%) | 65 (28.0%) |
| $100,000 to $149,999 | 0 (0.0%) | 28 (12.1%) |
| $150,000 or more | 17 (42.5%) | 41 (17.7%) |
| Total | 40 (100.0%) | 232 (100.0%) |
Property Value to Household Income Ratio in Wauregan
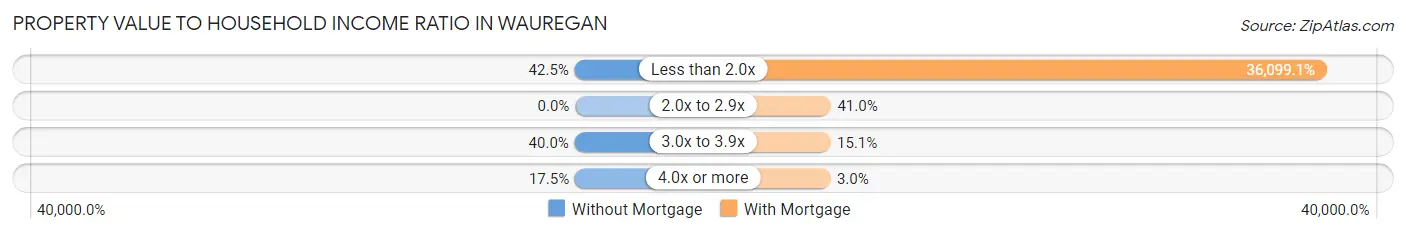
| Value-to-Income Ratio | Without Mortgage | With Mortgage |
| Less than 2.0x | 17 (42.5%) | 83,750 (36,099.1%) |
| 2.0x to 2.9x | 0 (0.0%) | 95 (40.9%) |
| 3.0x to 3.9x | 16 (40.0%) | 35 (15.1%) |
| 4.0x or more | 7 (17.5%) | 7 (3.0%) |
| Total | 40 (100.0%) | 232 (100.0%) |
Real Estate Taxes by Mortgage Status in Wauregan
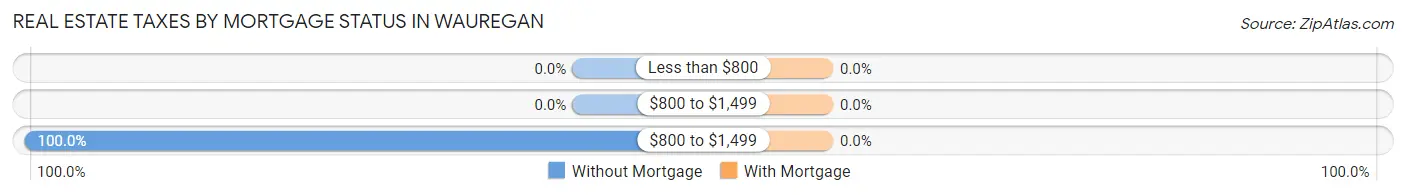
| Property Taxes | Without Mortgage | With Mortgage |
| Less than $800 | 0 (0.0%) | 0 (0.0%) |
| $800 to $1,499 | 0 (0.0%) | 0 (0.0%) |
| $800 to $1,499 | 40 (100.0%) | 0 (0.0%) |
| Total | 40 (100.0%) | 232 (100.0%) |
Health & Disability in Wauregan
Health Insurance Coverage by Age in Wauregan
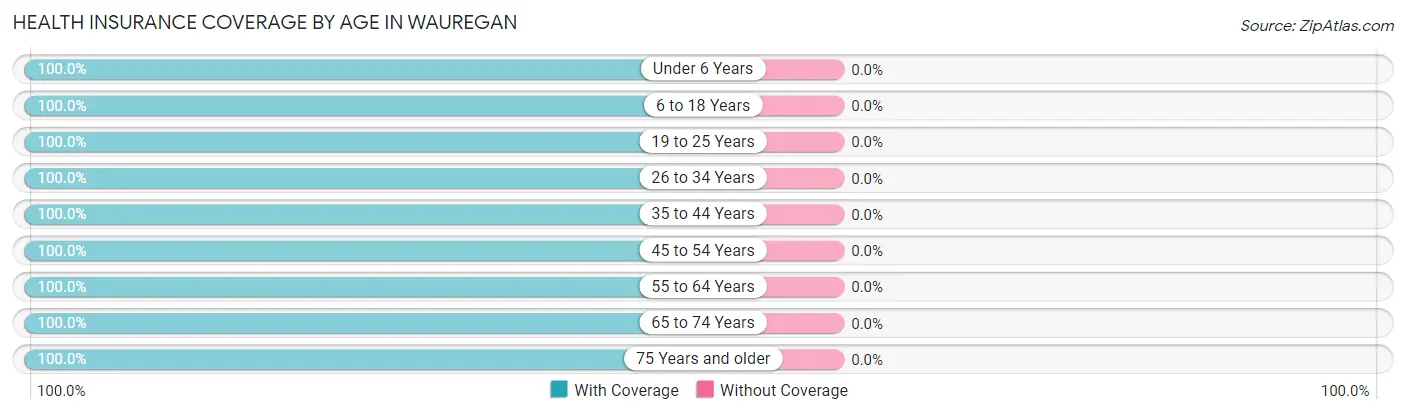
| Age Bracket | With Coverage | Without Coverage |
| Under 6 Years | 138 (100.0%) | 0 (0.0%) |
| 6 to 18 Years | 279 (100.0%) | 0 (0.0%) |
| 19 to 25 Years | 58 (100.0%) | 0 (0.0%) |
| 26 to 34 Years | 231 (100.0%) | 0 (0.0%) |
| 35 to 44 Years | 164 (100.0%) | 0 (0.0%) |
| 45 to 54 Years | 231 (100.0%) | 0 (0.0%) |
| 55 to 64 Years | 207 (100.0%) | 0 (0.0%) |
| 65 to 74 Years | 63 (100.0%) | 0 (0.0%) |
| 75 Years and older | 25 (100.0%) | 0 (0.0%) |
| Total | 1,396 (100.0%) | 0 (0.0%) |
Health Insurance Coverage by Citizenship Status in Wauregan
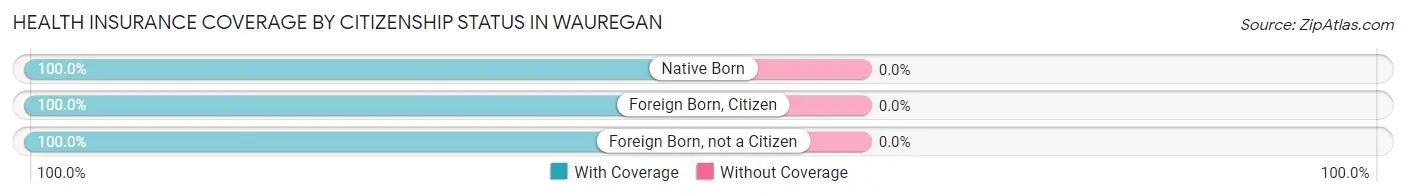
| Citizenship Status | With Coverage | Without Coverage |
| Native Born | 138 (100.0%) | 0 (0.0%) |
| Foreign Born, Citizen | 279 (100.0%) | 0 (0.0%) |
| Foreign Born, not a Citizen | 58 (100.0%) | 0 (0.0%) |
Health Insurance Coverage by Household Income in Wauregan
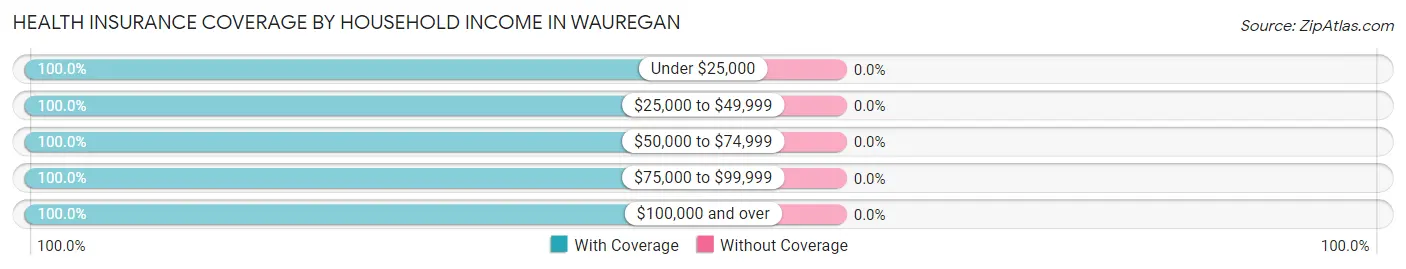
| Household Income | With Coverage | Without Coverage |
| Under $25,000 | 244 (100.0%) | 0 (0.0%) |
| $25,000 to $49,999 | 152 (100.0%) | 0 (0.0%) |
| $50,000 to $74,999 | 192 (100.0%) | 0 (0.0%) |
| $75,000 to $99,999 | 255 (100.0%) | 0 (0.0%) |
| $100,000 and over | 538 (100.0%) | 0 (0.0%) |
Public vs Private Health Insurance Coverage by Age in Wauregan
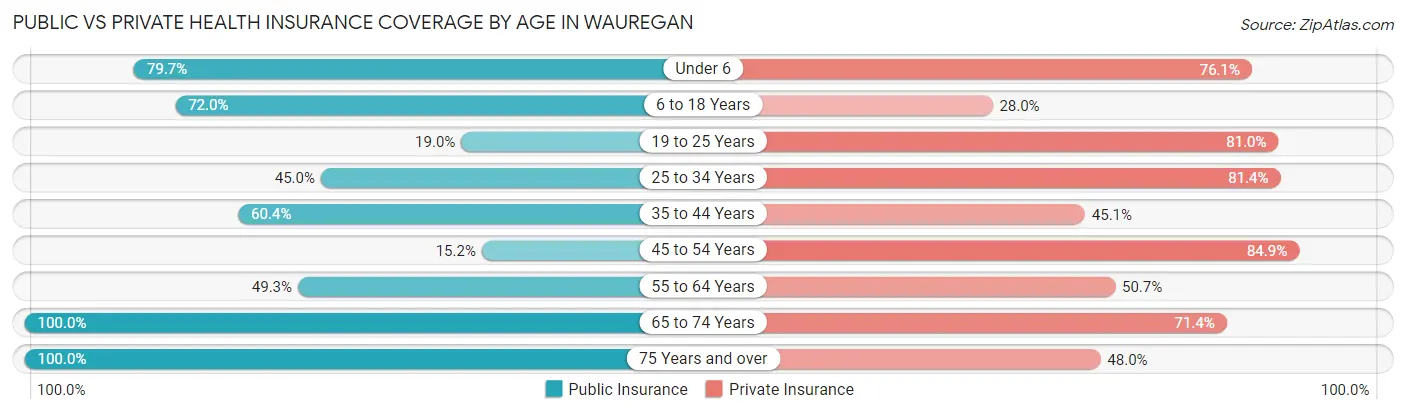
| Age Bracket | Public Insurance | Private Insurance |
| Under 6 | 110 (79.7%) | 105 (76.1%) |
| 6 to 18 Years | 201 (72.0%) | 78 (28.0%) |
| 19 to 25 Years | 11 (19.0%) | 47 (81.0%) |
| 25 to 34 Years | 104 (45.0%) | 188 (81.4%) |
| 35 to 44 Years | 99 (60.4%) | 74 (45.1%) |
| 45 to 54 Years | 35 (15.1%) | 196 (84.9%) |
| 55 to 64 Years | 102 (49.3%) | 105 (50.7%) |
| 65 to 74 Years | 63 (100.0%) | 45 (71.4%) |
| 75 Years and over | 25 (100.0%) | 12 (48.0%) |
| Total | 750 (53.7%) | 850 (60.9%) |
Disability Status by Sex by Age in Wauregan
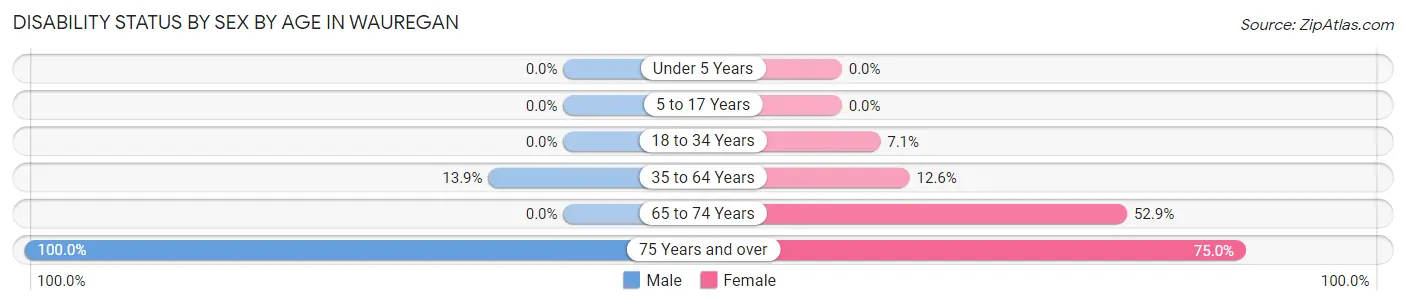
| Age Bracket | Male | Female |
| Under 5 Years | 0 (0.0%) | 0 (0.0%) |
| 5 to 17 Years | 0 (0.0%) | 0 (0.0%) |
| 18 to 34 Years | 0 (0.0%) | 14 (7.1%) |
| 35 to 64 Years | 44 (13.9%) | 36 (12.6%) |
| 65 to 74 Years | 0 (0.0%) | 18 (52.9%) |
| 75 Years and over | 9 (100.0%) | 12 (75.0%) |
Disability Class by Sex by Age in Wauregan
Disability Class: Hearing Difficulty
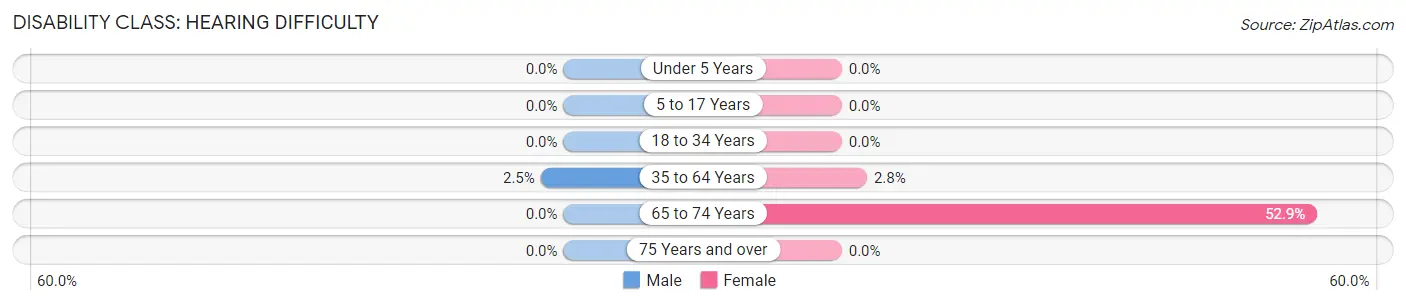
| Age Bracket | Male | Female |
| Under 5 Years | 0 (0.0%) | 0 (0.0%) |
| 5 to 17 Years | 0 (0.0%) | 0 (0.0%) |
| 18 to 34 Years | 0 (0.0%) | 0 (0.0%) |
| 35 to 64 Years | 8 (2.5%) | 8 (2.8%) |
| 65 to 74 Years | 0 (0.0%) | 18 (52.9%) |
| 75 Years and over | 0 (0.0%) | 0 (0.0%) |
Disability Class: Vision Difficulty
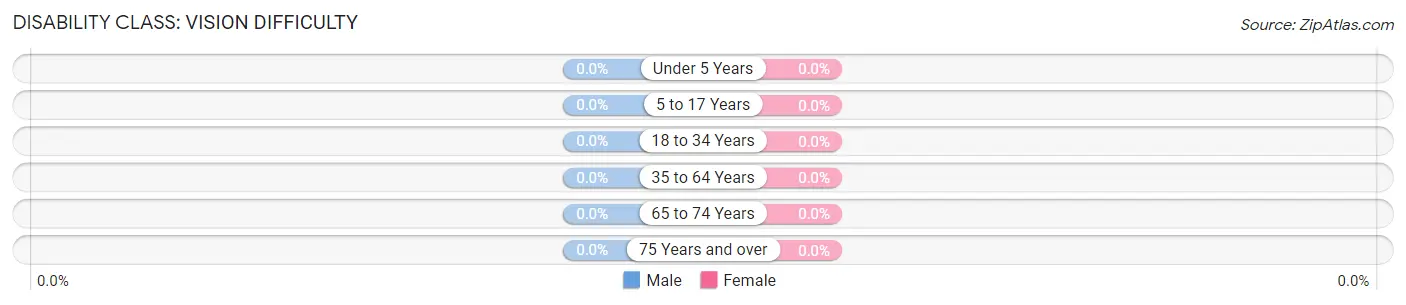
| Age Bracket | Male | Female |
| Under 5 Years | 0 (0.0%) | 0 (0.0%) |
| 5 to 17 Years | 0 (0.0%) | 0 (0.0%) |
| 18 to 34 Years | 0 (0.0%) | 0 (0.0%) |
| 35 to 64 Years | 0 (0.0%) | 0 (0.0%) |
| 65 to 74 Years | 0 (0.0%) | 0 (0.0%) |
| 75 Years and over | 0 (0.0%) | 0 (0.0%) |
Disability Class: Cognitive Difficulty
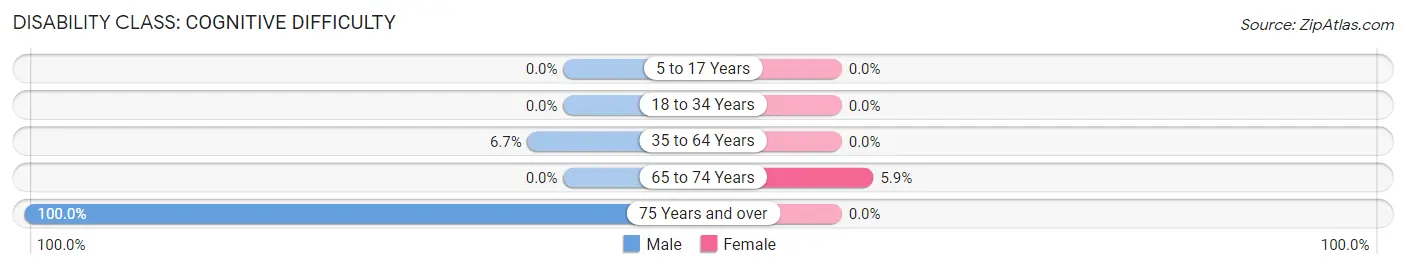
| Age Bracket | Male | Female |
| 5 to 17 Years | 0 (0.0%) | 0 (0.0%) |
| 18 to 34 Years | 0 (0.0%) | 0 (0.0%) |
| 35 to 64 Years | 21 (6.7%) | 0 (0.0%) |
| 65 to 74 Years | 0 (0.0%) | 2 (5.9%) |
| 75 Years and over | 9 (100.0%) | 0 (0.0%) |
Disability Class: Ambulatory Difficulty
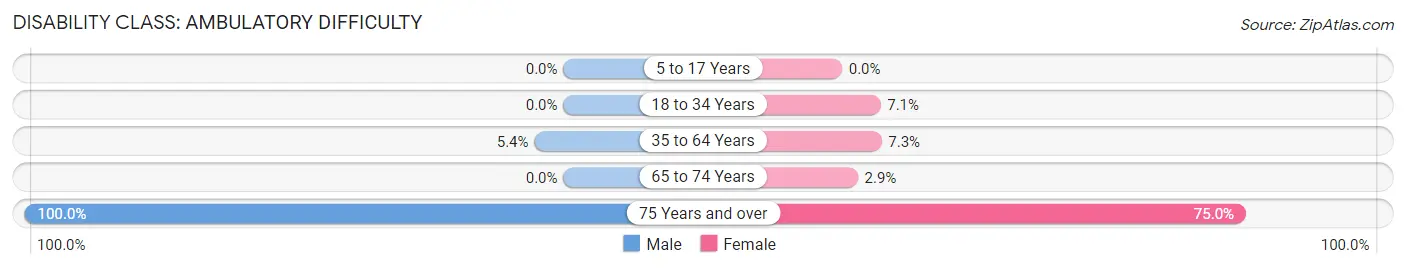
| Age Bracket | Male | Female |
| 5 to 17 Years | 0 (0.0%) | 0 (0.0%) |
| 18 to 34 Years | 0 (0.0%) | 14 (7.1%) |
| 35 to 64 Years | 17 (5.4%) | 21 (7.3%) |
| 65 to 74 Years | 0 (0.0%) | 1 (2.9%) |
| 75 Years and over | 9 (100.0%) | 12 (75.0%) |
Disability Class: Self-Care Difficulty
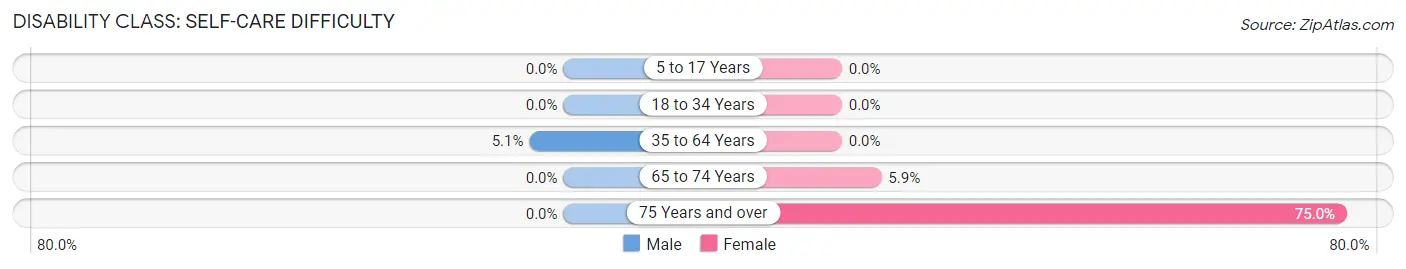
| Age Bracket | Male | Female |
| 5 to 17 Years | 0 (0.0%) | 0 (0.0%) |
| 18 to 34 Years | 0 (0.0%) | 0 (0.0%) |
| 35 to 64 Years | 16 (5.1%) | 0 (0.0%) |
| 65 to 74 Years | 0 (0.0%) | 2 (5.9%) |
| 75 Years and over | 0 (0.0%) | 12 (75.0%) |
Technology Access in Wauregan
Computing Device Access in Wauregan
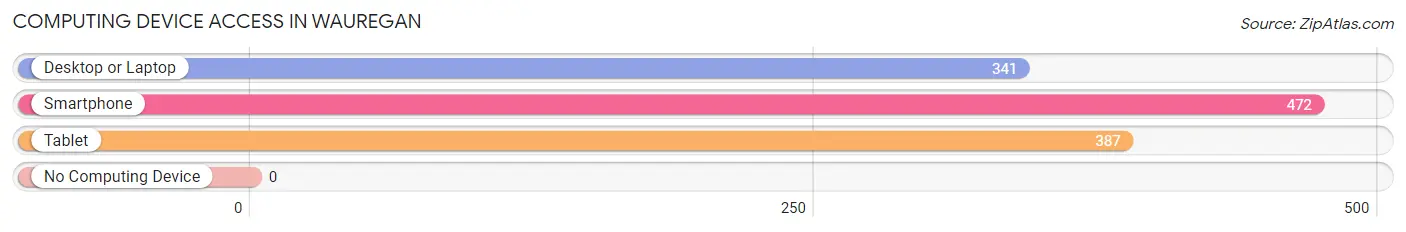
| Device Type | # Households | % Households |
| Desktop or Laptop | 341 | 71.2% |
| Smartphone | 472 | 98.5% |
| Tablet | 387 | 80.8% |
| No Computing Device | 0 | 0.0% |
| Total | 479 | 100.0% |
Internet Access in Wauregan
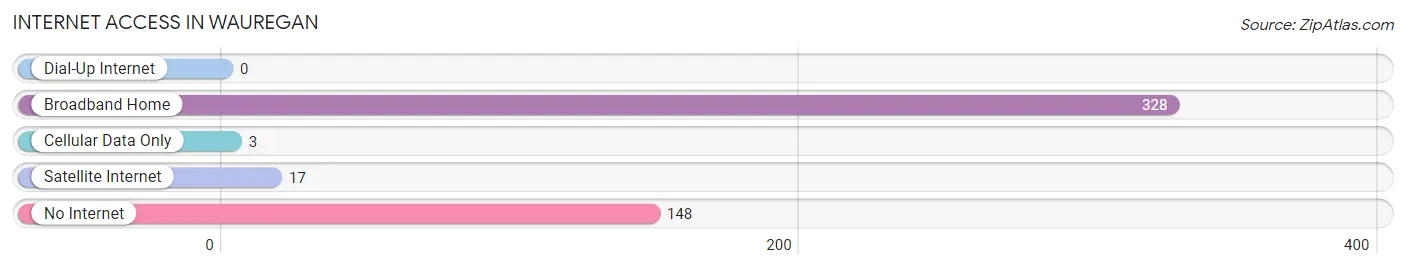
| Internet Type | # Households | % Households |
| Dial-Up Internet | 0 | 0.0% |
| Broadband Home | 328 | 68.5% |
| Cellular Data Only | 3 | 0.6% |
| Satellite Internet | 17 | 3.5% |
| No Internet | 148 | 30.9% |
| Total | 479 | 100.0% |
Wauregan Summary
Wauregan is a small town located in the northeastern corner of Connecticut, in the Windham County. It is bordered by the towns of Brooklyn, Canterbury, Plainfield, and Sterling. The town was incorporated in 1855 and has a population of 1,845 as of the 2010 census.
History
Wauregan was originally part of the town of Canterbury, which was incorporated in 1703. The area was first settled in the early 1700s by settlers from Massachusetts and Rhode Island. The town was named after the Wauregan Indians, who were a branch of the Nipmuc tribe. The Wauregan Indians lived in the area until the mid-1800s, when they were forced to move to the Mashantucket Pequot Reservation in Ledyard.
In 1855, the town of Wauregan was incorporated from a portion of Canterbury. The town was named after the Wauregan Indians, who had lived in the area for centuries. The town was primarily an agricultural community, with dairy farming being the main industry.
Geography
Wauregan is located in the northeastern corner of Connecticut, in the Windham County. It is bordered by the towns of Brooklyn, Canterbury, Plainfield, and Sterling. The town has a total area of 8.3 square miles, of which 8.2 square miles is land and 0.1 square miles is water. The terrain is mostly flat, with some rolling hills. The Quinebaug River runs through the town, and there are several small ponds and streams.
Economy
Wauregan’s economy is primarily based on agriculture. Dairy farming is the main industry, with several farms located in the town. There are also several small businesses in the town, including a few restaurants, a gas station, and a few retail stores.
Demographics
As of the 2010 census, there were 1,845 people, 717 households, and 517 families residing in the town. The population density was 224.3 people per square mile. The racial makeup of the town was 96.2% White, 0.7% African American, 0.3% Native American, 0.7% Asian, 0.1% Pacific Islander, 0.7% from other races, and 1.2% from two or more races. Hispanic or Latino of any race were 2.2% of the population.
The median income for a household in the town was $60,938, and the median income for a family was $68,750. The per capita income for the town was $25,945. About 4.2% of families and 5.3% of the population were below the poverty line, including 6.2% of those under age 18 and 4.2% of those age 65 or over.
Common Questions
What is Per Capita Income in Wauregan?
Per Capita income in Wauregan is $30,063.
What is the Median Family Income in Wauregan?
Median Family Income in Wauregan is $77,500.
What is the Median Household income in Wauregan?
Median Household Income in Wauregan is $81,964.
What is Income or Wage Gap in Wauregan?
Income or Wage Gap in Wauregan is 31.9%.
Women in Wauregan earn 68.1 cents for every dollar earned by a man.
What is Inequality or Gini Index in Wauregan?
Inequality or Gini Index in Wauregan is 0.35.
What is the Total Population of Wauregan?
Total Population of Wauregan is 1,396.
What is the Total Male Population of Wauregan?
Total Male Population of Wauregan is 632.
What is the Total Female Population of Wauregan?
Total Female Population of Wauregan is 764.
What is the Ratio of Males per 100 Females in Wauregan?
There are 82.72 Males per 100 Females in Wauregan.
What is the Ratio of Females per 100 Males in Wauregan?
There are 120.89 Females per 100 Males in Wauregan.
What is the Median Population Age in Wauregan?
Median Population Age in Wauregan is 33.4 Years.
What is the Average Family Size in Wauregan
Average Family Size in Wauregan is 3.0 People.
What is the Average Household Size in Wauregan
Average Household Size in Wauregan is 2.9 People.
How Large is the Labor Force in Wauregan?
There are 776 People in the Labor Forcein in Wauregan.
What is the Percentage of People in the Labor Force in Wauregan?
78.6% of People are in the Labor Force in Wauregan.
What is the Unemployment Rate in Wauregan?
Unemployment Rate in Wauregan is 2.2%.