South Windham, CT Map & Demographics
South Windham Map
South Windham Overview
$34,225
PER CAPITA INCOME
$81,094
AVG FAMILY INCOME
$69,327
AVG HOUSEHOLD INCOME
39.4%
WAGE / INCOME GAP [ % ]
60.6¢/ $1
WAGE / INCOME GAP [ $ ]
0.37
INEQUALITY / GINI INDEX
1,412
TOTAL POPULATION
723
MALE POPULATION
689
FEMALE POPULATION
104.93
MALES / 100 FEMALES
95.30
FEMALES / 100 MALES
40.1
MEDIAN AGE
3.6
AVG FAMILY SIZE
2.7
AVG HOUSEHOLD SIZE
655
LABOR FORCE [ PEOPLE ]
62.6%
PERCENT IN LABOR FORCE
1.2%
UNEMPLOYMENT RATE
South Windham Zip Codes
South Windham Area Codes
Income in South Windham
Income Overview in South Windham
Per Capita Income in South Windham is $34,225, while median incomes of families and households are $81,094 and $69,327 respectively.
| Characteristic | Number | Measure |
| Per Capita Income | 1,412 | $34,225 |
| Median Family Income | 319 | $81,094 |
| Mean Family Income | 319 | $110,961 |
| Median Household Income | 518 | $69,327 |
| Mean Household Income | 518 | $90,732 |
| Income Deficit | 319 | $0 |
| Wage / Income Gap (%) | 1,412 | 39.37% |
| Wage / Income Gap ($) | 1,412 | 60.63¢ per $1 |
| Gini / Inequality Index | 1,412 | 0.37 |
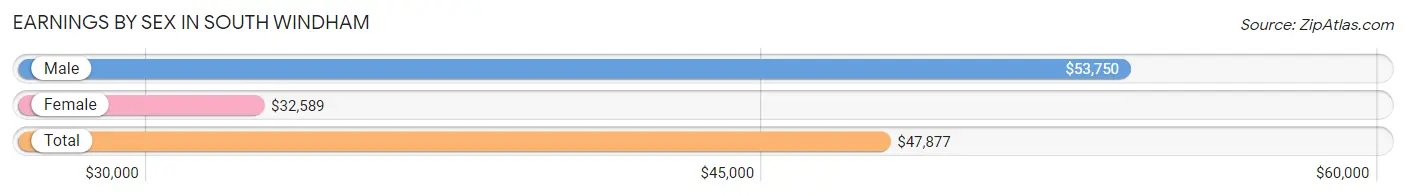
Earnings by Sex in South Windham
Average Earnings in South Windham are $47,877, $53,750 for men and $32,589 for women, a difference of 39.4%.
| Sex | Number | Average Earnings |
| Male | 320 (46.1%) | $53,750 |
| Female | 374 (53.9%) | $32,589 |
| Total | 694 (100.0%) | $47,877 |
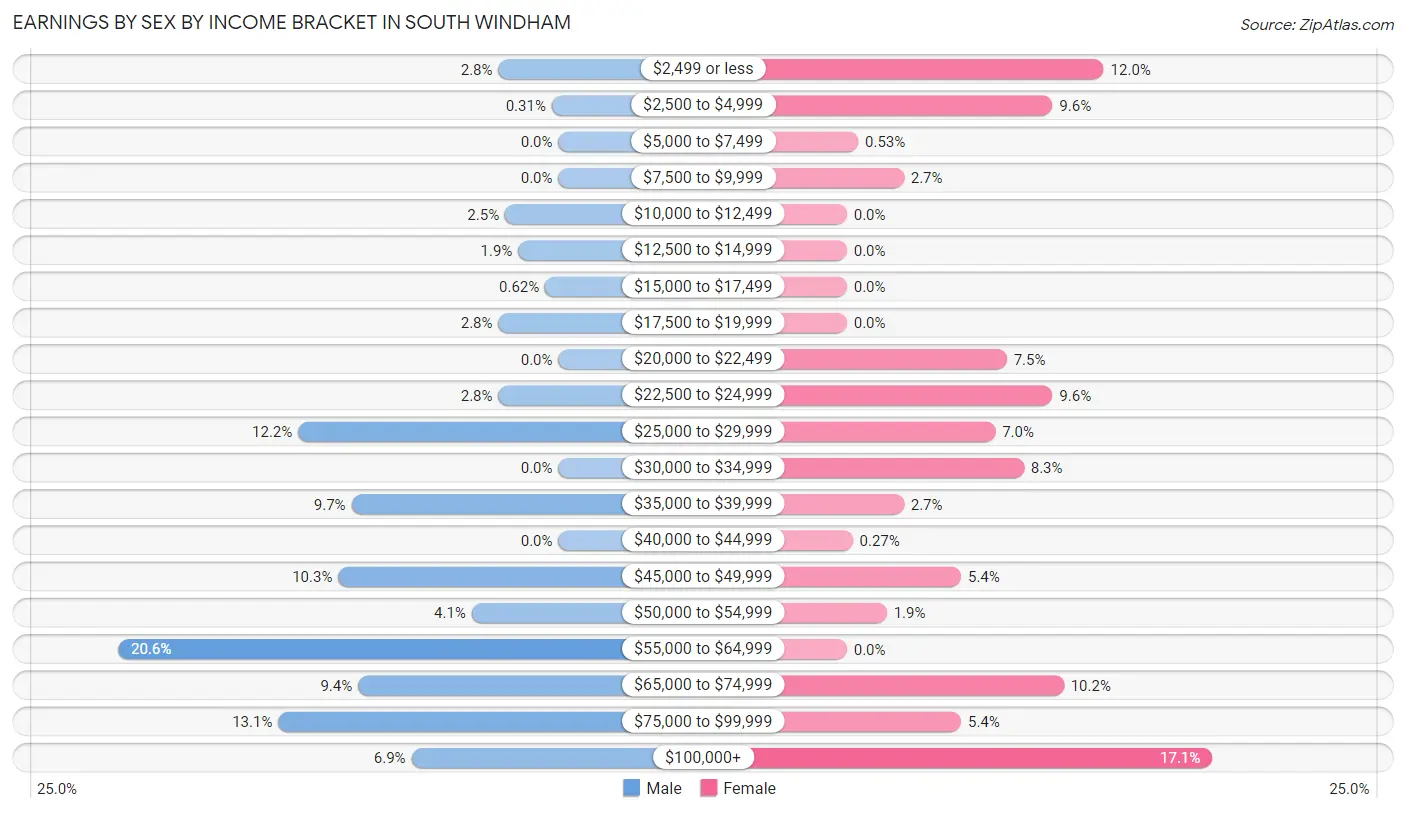
Earnings by Sex by Income Bracket in South Windham
The most common earnings brackets in South Windham are $55,000 to $64,999 for men (66 | 20.6%) and $100,000+ for women (64 | 17.1%).
| Income | Male | Female |
| $2,499 or less | 9 (2.8%) | 45 (12.0%) |
| $2,500 to $4,999 | 1 (0.3%) | 36 (9.6%) |
| $5,000 to $7,499 | 0 (0.0%) | 2 (0.5%) |
| $7,500 to $9,999 | 0 (0.0%) | 10 (2.7%) |
| $10,000 to $12,499 | 8 (2.5%) | 0 (0.0%) |
| $12,500 to $14,999 | 6 (1.9%) | 0 (0.0%) |
| $15,000 to $17,499 | 2 (0.6%) | 0 (0.0%) |
| $17,500 to $19,999 | 9 (2.8%) | 0 (0.0%) |
| $20,000 to $22,499 | 0 (0.0%) | 28 (7.5%) |
| $22,500 to $24,999 | 9 (2.8%) | 36 (9.6%) |
| $25,000 to $29,999 | 39 (12.2%) | 26 (7.0%) |
| $30,000 to $34,999 | 0 (0.0%) | 31 (8.3%) |
| $35,000 to $39,999 | 31 (9.7%) | 10 (2.7%) |
| $40,000 to $44,999 | 0 (0.0%) | 1 (0.3%) |
| $45,000 to $49,999 | 33 (10.3%) | 20 (5.3%) |
| $50,000 to $54,999 | 13 (4.1%) | 7 (1.9%) |
| $55,000 to $64,999 | 66 (20.6%) | 0 (0.0%) |
| $65,000 to $74,999 | 30 (9.4%) | 38 (10.2%) |
| $75,000 to $99,999 | 42 (13.1%) | 20 (5.3%) |
| $100,000+ | 22 (6.9%) | 64 (17.1%) |
| Total | 320 (100.0%) | 374 (100.0%) |
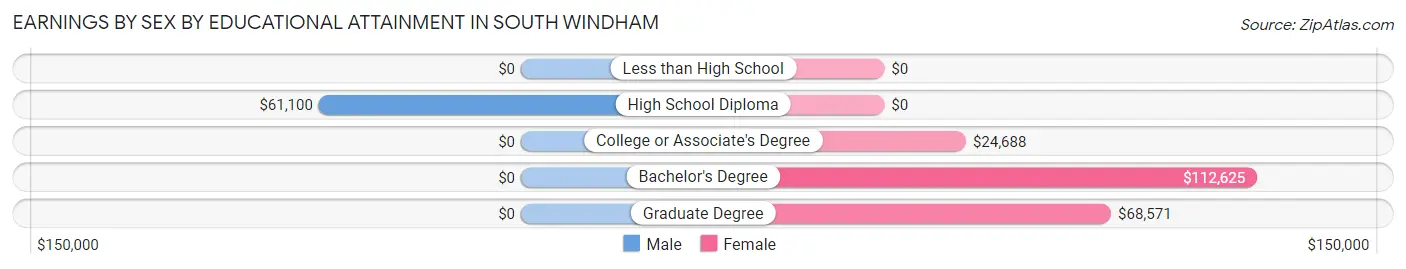
Earnings by Sex by Educational Attainment in South Windham
Average earnings in South Windham are $55,335 for men and $36,875 for women, a difference of 33.4%. Men with an educational attainment of high school diploma enjoy the highest average annual earnings of $61,100, while those with high school diploma education earn the least with $61,100. Women with an educational attainment of bachelor's degree earn the most with the average annual earnings of $112,625, while those with college or associate's degree education have the smallest earnings of $24,688.
| Educational Attainment | Male Income | Female Income |
| Less than High School | - | - |
| High School Diploma | $61,100 | $0 |
| College or Associate's Degree | - | - |
| Bachelor's Degree | - | - |
| Graduate Degree | - | - |
| Total | $55,335 | $36,875 |
Family Income in South Windham
Family Income Brackets in South Windham
According to the South Windham family income data, there are 64 families falling into the $100,000 to $149,999 income range, which is the most common income bracket and makes up 20.1% of all families.
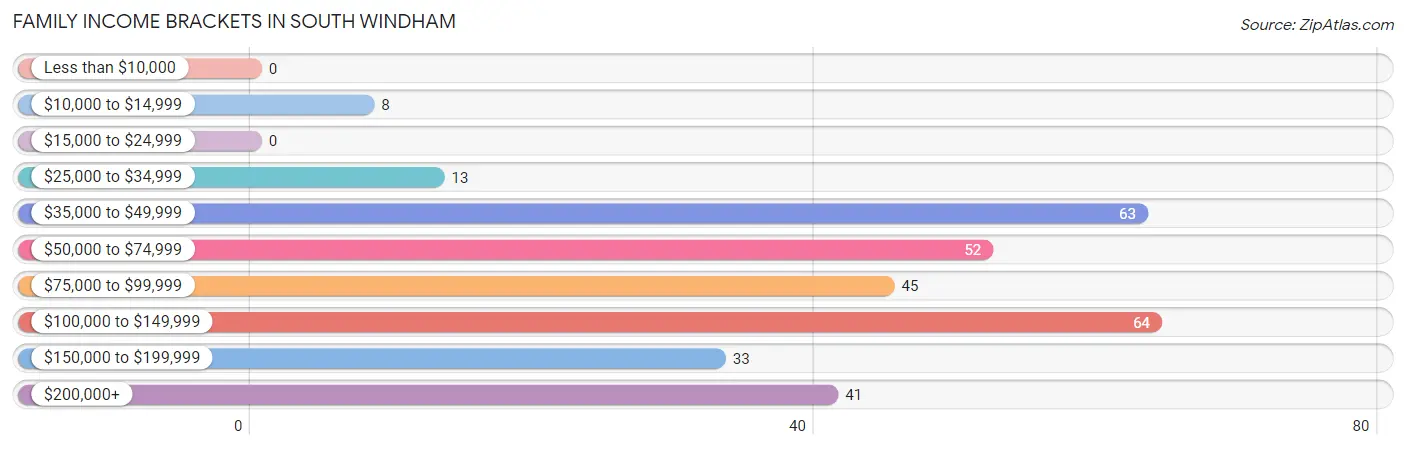
| Income Bracket | # Families | % Families |
| Less than $10,000 | 0 | 0.0% |
| $10,000 to $14,999 | 8 | 2.5% |
| $15,000 to $24,999 | 0 | 0.0% |
| $25,000 to $34,999 | 13 | 4.1% |
| $35,000 to $49,999 | 63 | 19.7% |
| $50,000 to $74,999 | 52 | 16.3% |
| $75,000 to $99,999 | 45 | 14.1% |
| $100,000 to $149,999 | 64 | 20.1% |
| $150,000 to $199,999 | 33 | 10.3% |
| $200,000+ | 41 | 12.9% |
Family Income by Famaliy Size in South Windham
6-person families (30 | 9.4%) account for the highest median family income in South Windham with $250,001 per family, while 6-person families (30 | 9.4%) have the highest median income of $41,667 per family member.
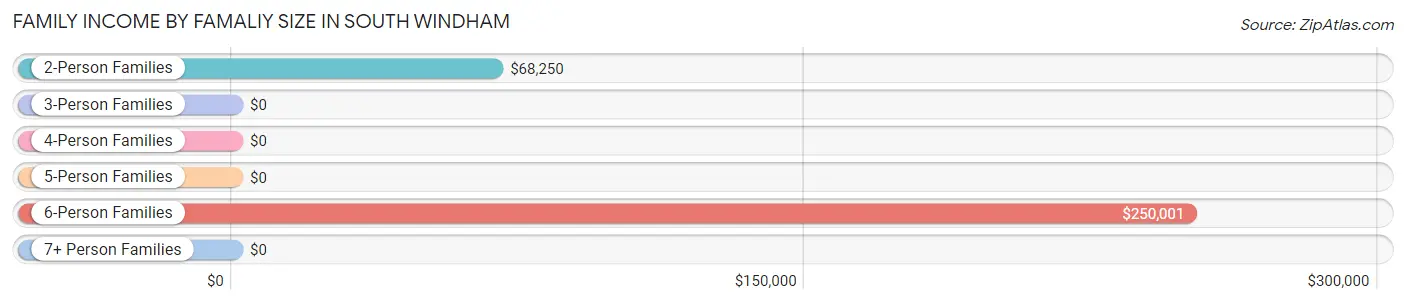
| Income Bracket | # Families | Median Income |
| 2-Person Families | 171 (53.6%) | $68,250 |
| 3-Person Families | 74 (23.2%) | $0 |
| 4-Person Families | 18 (5.6%) | $0 |
| 5-Person Families | 0 (0.0%) | $0 |
| 6-Person Families | 30 (9.4%) | $250,001 |
| 7+ Person Families | 26 (8.2%) | $0 |
| Total | 319 (100.0%) | $81,094 |
Family Income by Number of Earners in South Windham
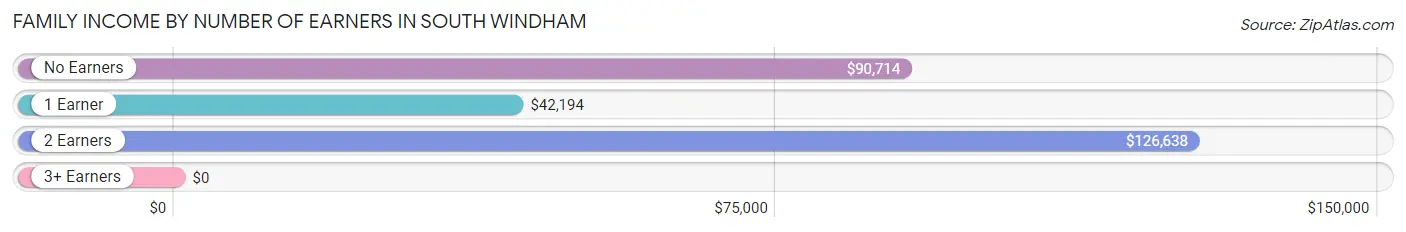
| Number of Earners | # Families | Median Income |
| No Earners | 54 (16.9%) | $90,714 |
| 1 Earner | 112 (35.1%) | $42,194 |
| 2 Earners | 104 (32.6%) | $126,638 |
| 3+ Earners | 49 (15.4%) | $0 |
| Total | 319 (100.0%) | $81,094 |
Household Income in South Windham
Household Income Brackets in South Windham
With 162 households falling in the category, the $50,000 to $74,999 income range is the most frequent in South Windham, accounting for 31.3% of all households. In contrast, only 6 households (1.2%) fall into the less than $10,000 income bracket, making it the least populous group.
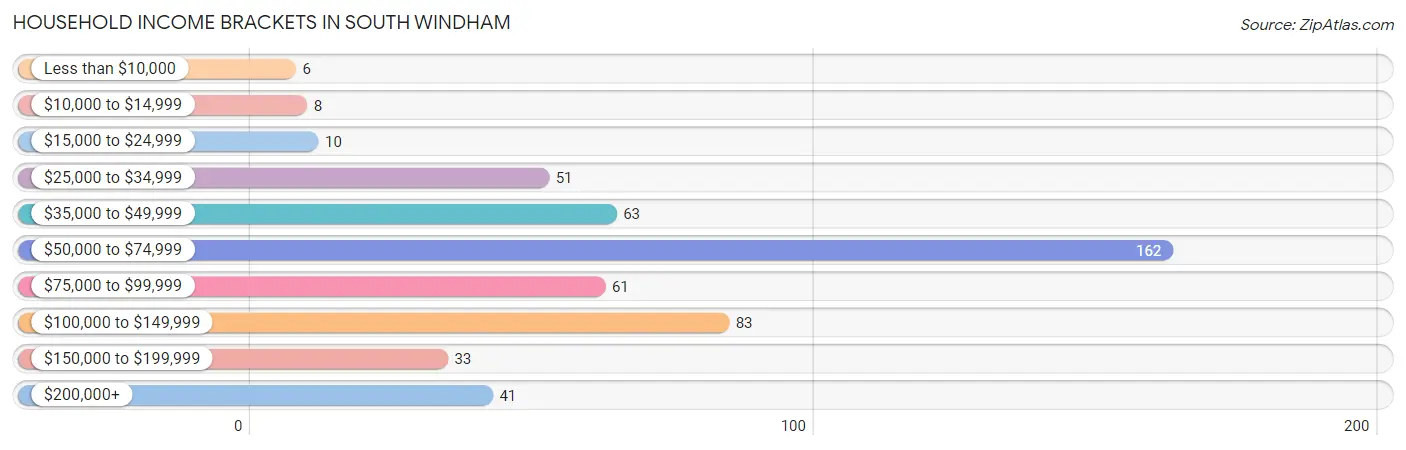
| Income Bracket | # Households | % Households |
| Less than $10,000 | 6 | 1.2% |
| $10,000 to $14,999 | 8 | 1.5% |
| $15,000 to $24,999 | 10 | 1.9% |
| $25,000 to $34,999 | 51 | 9.8% |
| $35,000 to $49,999 | 63 | 12.2% |
| $50,000 to $74,999 | 162 | 31.3% |
| $75,000 to $99,999 | 61 | 11.8% |
| $100,000 to $149,999 | 83 | 16.0% |
| $150,000 to $199,999 | 33 | 6.4% |
| $200,000+ | 41 | 7.9% |
Household Income by Householder Age in South Windham
The median household income in South Windham is $69,327, with the highest median household income of $73,558 found in the 45 to 64 years age bracket for the primary householder. A total of 167 households (32.2%) fall into this category. Meanwhile, the 15 to 24 years age bracket for the primary householder has the lowest median household income of $0, with 10 households (1.9%) in this group.
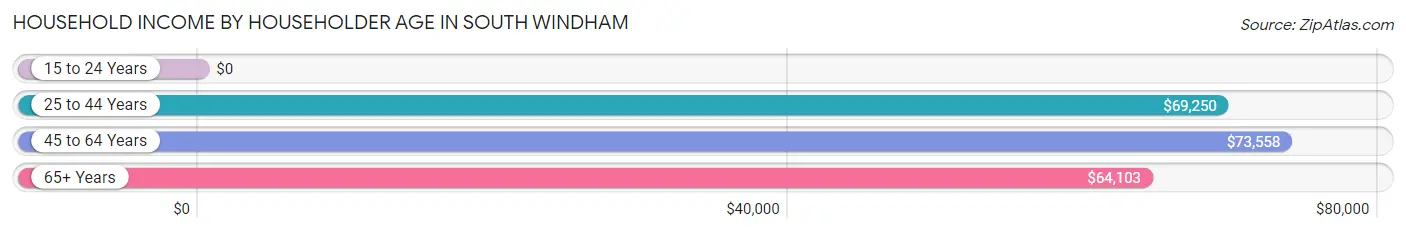
| Income Bracket | # Households | Median Income |
| 15 to 24 Years | 10 (1.9%) | $0 |
| 25 to 44 Years | 145 (28.0%) | $69,250 |
| 45 to 64 Years | 167 (32.2%) | $73,558 |
| 65+ Years | 196 (37.8%) | $64,103 |
| Total | 518 (100.0%) | $69,327 |
Poverty in South Windham
Income Below Poverty by Sex and Age in South Windham
With 14.5% poverty level for males and 21.9% for females among the residents of South Windham, 15 year old males and 12 to 14 year old females are the most vulnerable to poverty, with 32 males (100.0%) and 24 females (100.0%) in their respective age groups living below the poverty level.
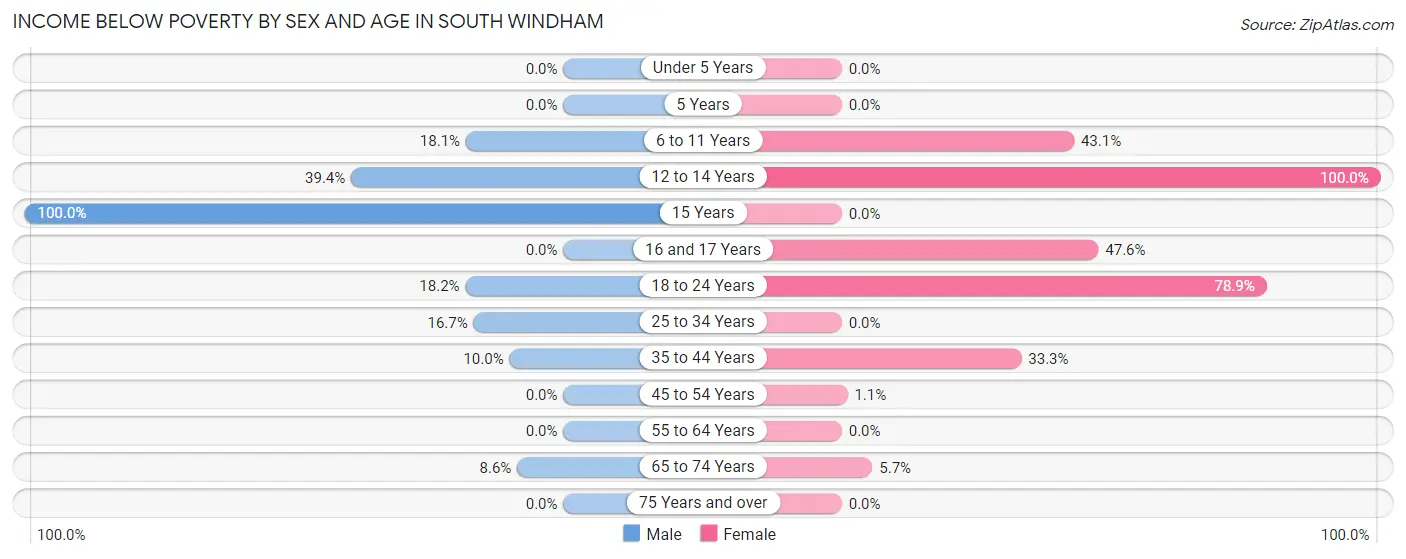
| Age Bracket | Male | Female |
| Under 5 Years | 0 (0.0%) | 0 (0.0%) |
| 5 Years | 0 (0.0%) | 0 (0.0%) |
| 6 to 11 Years | 17 (18.1%) | 25 (43.1%) |
| 12 to 14 Years | 26 (39.4%) | 24 (100.0%) |
| 15 Years | 32 (100.0%) | 0 (0.0%) |
| 16 and 17 Years | 0 (0.0%) | 30 (47.6%) |
| 18 to 24 Years | 2 (18.2%) | 41 (78.8%) |
| 25 to 34 Years | 6 (16.7%) | 0 (0.0%) |
| 35 to 44 Years | 13 (10.0%) | 22 (33.3%) |
| 45 to 54 Years | 0 (0.0%) | 1 (1.1%) |
| 55 to 64 Years | 0 (0.0%) | 0 (0.0%) |
| 65 to 74 Years | 9 (8.6%) | 8 (5.7%) |
| 75 Years and over | 0 (0.0%) | 0 (0.0%) |
| Total | 105 (14.5%) | 151 (21.9%) |
Income Above Poverty by Sex and Age in South Windham
According to the poverty statistics in South Windham, males aged under 5 years and females aged under 5 years are the age groups that are most secure financially, with 100.0% of males and 100.0% of females in these age groups living above the poverty line.
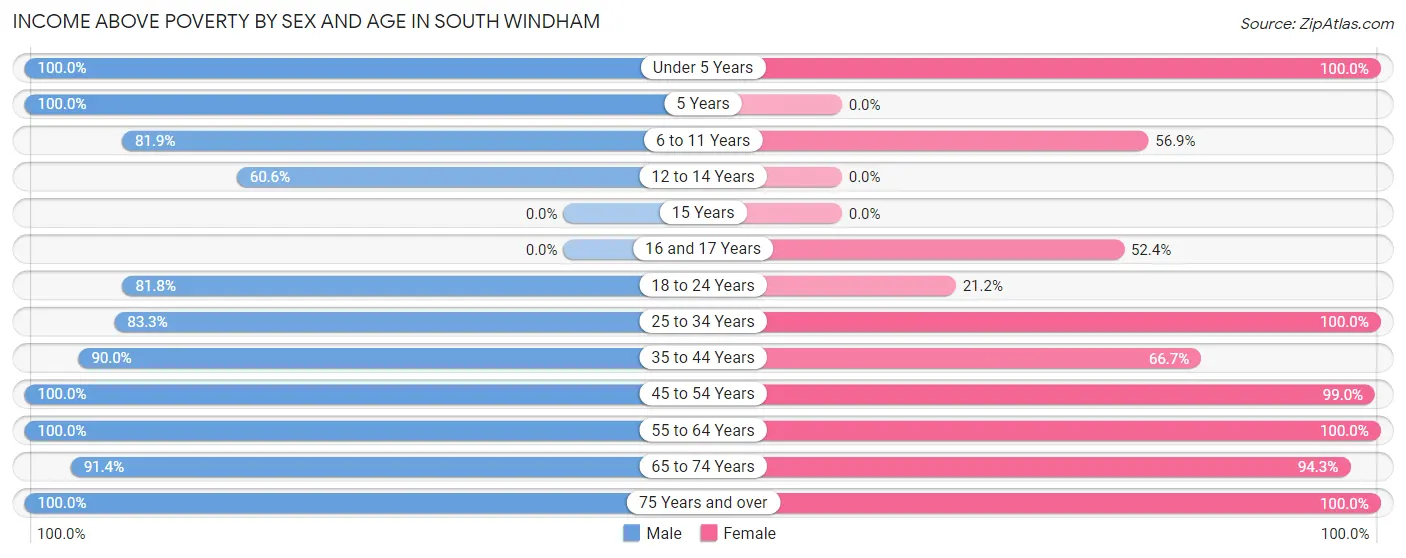
| Age Bracket | Male | Female |
| Under 5 Years | 46 (100.0%) | 33 (100.0%) |
| 5 Years | 13 (100.0%) | 0 (0.0%) |
| 6 to 11 Years | 77 (81.9%) | 33 (56.9%) |
| 12 to 14 Years | 40 (60.6%) | 0 (0.0%) |
| 15 Years | 0 (0.0%) | 0 (0.0%) |
| 16 and 17 Years | 0 (0.0%) | 33 (52.4%) |
| 18 to 24 Years | 9 (81.8%) | 11 (21.1%) |
| 25 to 34 Years | 30 (83.3%) | 62 (100.0%) |
| 35 to 44 Years | 117 (90.0%) | 44 (66.7%) |
| 45 to 54 Years | 26 (100.0%) | 94 (99.0%) |
| 55 to 64 Years | 120 (100.0%) | 55 (100.0%) |
| 65 to 74 Years | 96 (91.4%) | 133 (94.3%) |
| 75 Years and over | 43 (100.0%) | 40 (100.0%) |
| Total | 617 (85.5%) | 538 (78.1%) |
Income Below Poverty Among Married-Couple Families in South Windham
The poverty statistics for married-couple families in South Windham show that 7.3% or 21 of the total 286 families live below the poverty line. Families with 5 or more children have the highest poverty rate of 50.0%, comprising of 13 families. On the other hand, families with 1 or 2 children have the lowest poverty rate of 0.0%, which includes 0 families.
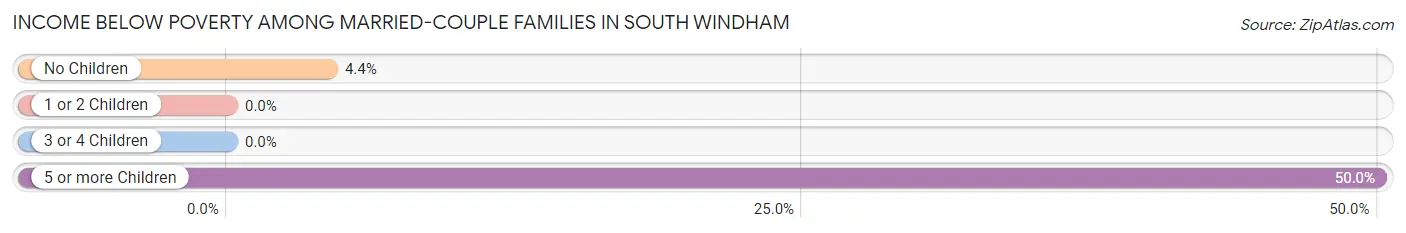
| Children | Above Poverty | Below Poverty |
| No Children | 176 (95.7%) | 8 (4.3%) |
| 1 or 2 Children | 57 (100.0%) | 0 (0.0%) |
| 3 or 4 Children | 19 (100.0%) | 0 (0.0%) |
| 5 or more Children | 13 (50.0%) | 13 (50.0%) |
| Total | 265 (92.7%) | 21 (7.3%) |
Income Below Poverty Among Single-Parent Households in South Windham
| Children | Single Father | Single Mother |
| No Children | 0 (0.0%) | 0 (0.0%) |
| 1 or 2 Children | 0 (0.0%) | 0 (0.0%) |
| 3 or 4 Children | 0 (0.0%) | 0 (0.0%) |
| 5 or more Children | 0 (0.0%) | 0 (0.0%) |
| Total | 0 (0.0%) | 0 (0.0%) |
Income Below Poverty Among Married-Couple vs Single-Parent Households in South Windham
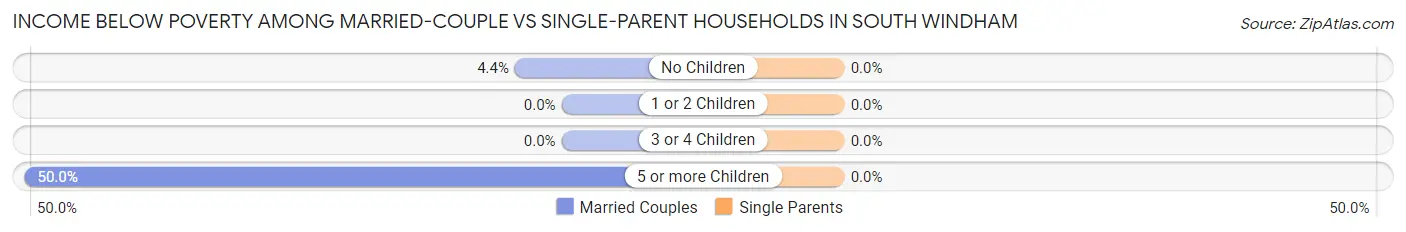
| Children | Married-Couple Families | Single-Parent Households |
| No Children | 8 (4.3%) | 0 (0.0%) |
| 1 or 2 Children | 0 (0.0%) | 0 (0.0%) |
| 3 or 4 Children | 0 (0.0%) | 0 (0.0%) |
| 5 or more Children | 13 (50.0%) | 0 (0.0%) |
| Total | 21 (7.3%) | 0 (0.0%) |
Race in South Windham
The most populous races in South Windham are White / Caucasian (1,235 | 87.5%), Hispanic or Latino (185 | 13.1%), and Two or more Races (143 | 10.1%).
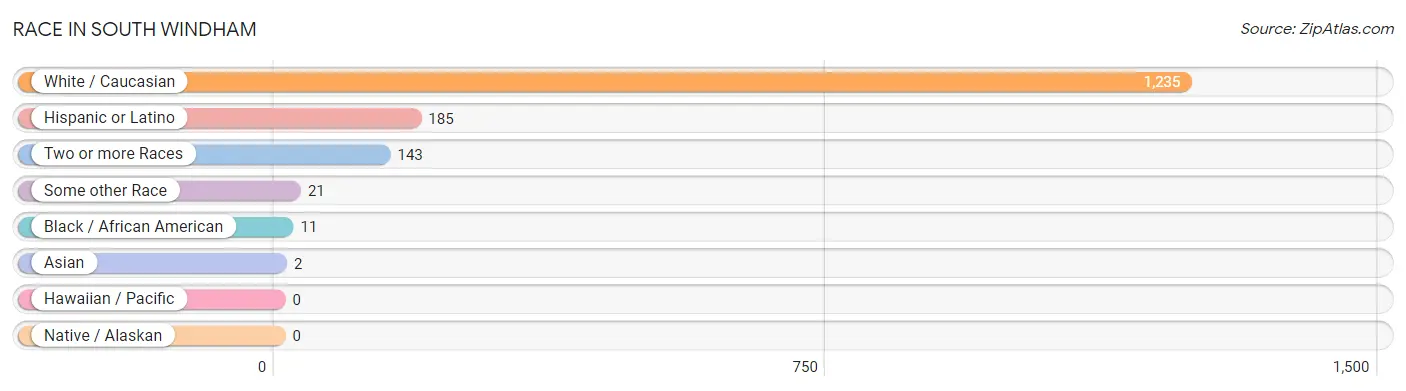
| Race | # Population | % Population |
| Asian | 2 | 0.1% |
| Black / African American | 11 | 0.8% |
| Hawaiian / Pacific | 0 | 0.0% |
| Hispanic or Latino | 185 | 13.1% |
| Native / Alaskan | 0 | 0.0% |
| White / Caucasian | 1,235 | 87.5% |
| Two or more Races | 143 | 10.1% |
| Some other Race | 21 | 1.5% |
| Total | 1,412 | 100.0% |
Ancestry in South Windham
The most populous ancestries reported in South Windham are Italian (350 | 24.8%), Polish (276 | 19.6%), French (215 | 15.2%), English (202 | 14.3%), and Irish (175 | 12.4%), together accounting for 86.3% of all South Windham residents.
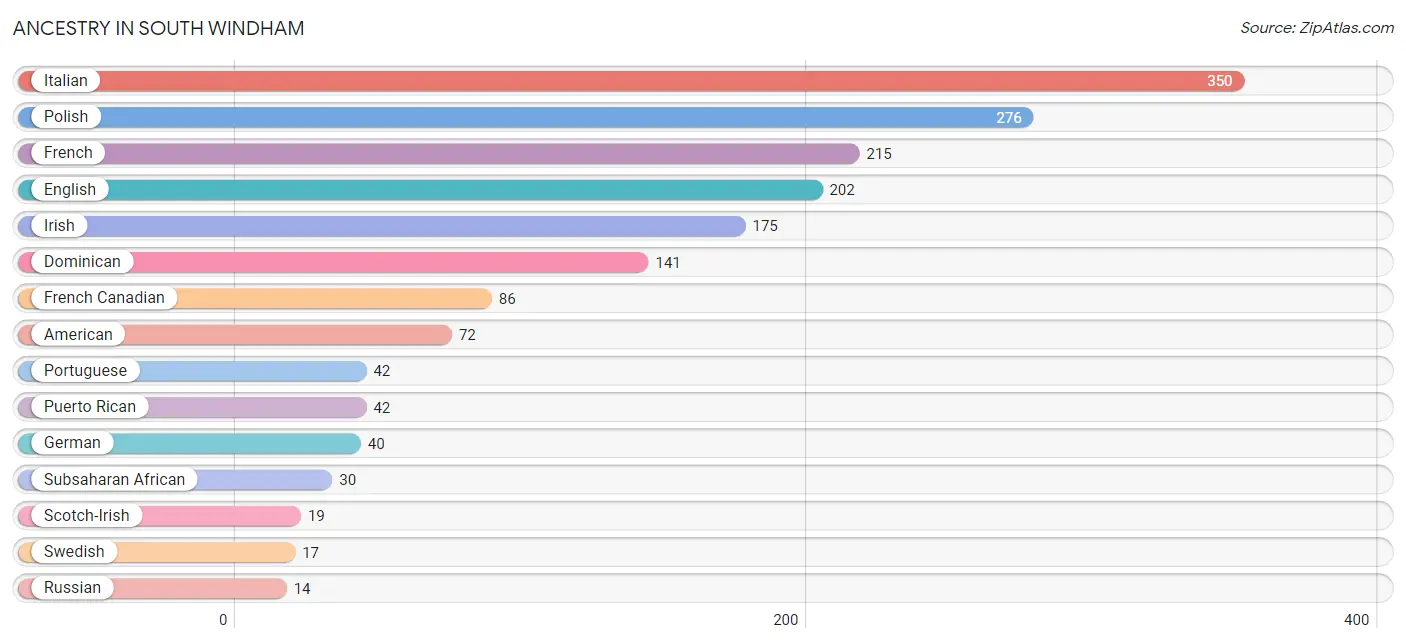
| Ancestry | # Population | % Population |
| American | 72 | 5.1% |
| Bhutanese | 6 | 0.4% |
| British | 12 | 0.9% |
| Canadian | 7 | 0.5% |
| Cuban | 1 | 0.1% |
| Czechoslovakian | 11 | 0.8% |
| Dominican | 141 | 10.0% |
| Dutch | 10 | 0.7% |
| English | 202 | 14.3% |
| French | 215 | 15.2% |
| French Canadian | 86 | 6.1% |
| German | 40 | 2.8% |
| Indian (Asian) | 2 | 0.1% |
| Irish | 175 | 12.4% |
| Italian | 350 | 24.8% |
| Kenyan | 9 | 0.6% |
| Korean | 1 | 0.1% |
| Lithuanian | 8 | 0.6% |
| Polish | 276 | 19.6% |
| Portuguese | 42 | 3.0% |
| Puerto Rican | 42 | 3.0% |
| Russian | 14 | 1.0% |
| Scandinavian | 11 | 0.8% |
| Scotch-Irish | 19 | 1.3% |
| Slovene | 4 | 0.3% |
| Subsaharan African | 30 | 2.1% |
| Swedish | 17 | 1.2% |
| Thai | 1 | 0.1% | View All 28 Rows |
Immigrants in South Windham
The most numerous immigrant groups reported in South Windham came from Caribbean (18 | 1.3%), Dominica (18 | 1.3%), Latin America (18 | 1.3%), Africa (9 | 0.6%), and Eastern Africa (9 | 0.6%), together accounting for 5.1% of all South Windham residents.
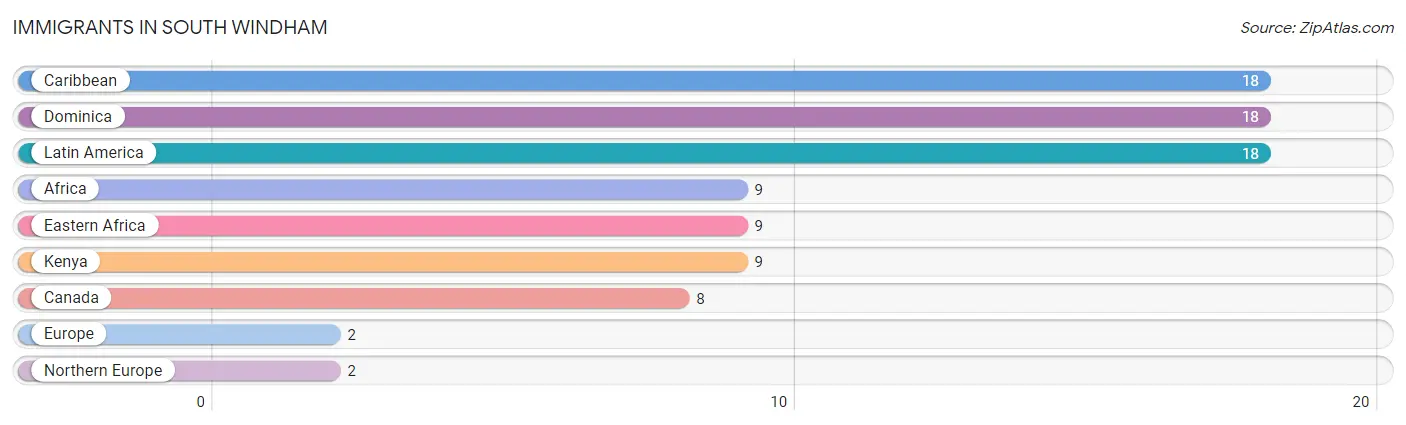
| Immigration Origin | # Population | % Population |
| Africa | 9 | 0.6% |
| Canada | 8 | 0.6% |
| Caribbean | 18 | 1.3% |
| Dominica | 18 | 1.3% |
| Eastern Africa | 9 | 0.6% |
| Europe | 2 | 0.1% |
| Kenya | 9 | 0.6% |
| Latin America | 18 | 1.3% |
| Northern Europe | 2 | 0.1% | View All 9 Rows |
Sex and Age in South Windham
Sex and Age in South Windham
The most populous age groups in South Windham are 60 to 64 Years (92 | 12.7%) for men and 65 to 69 Years (97 | 14.1%) for women.
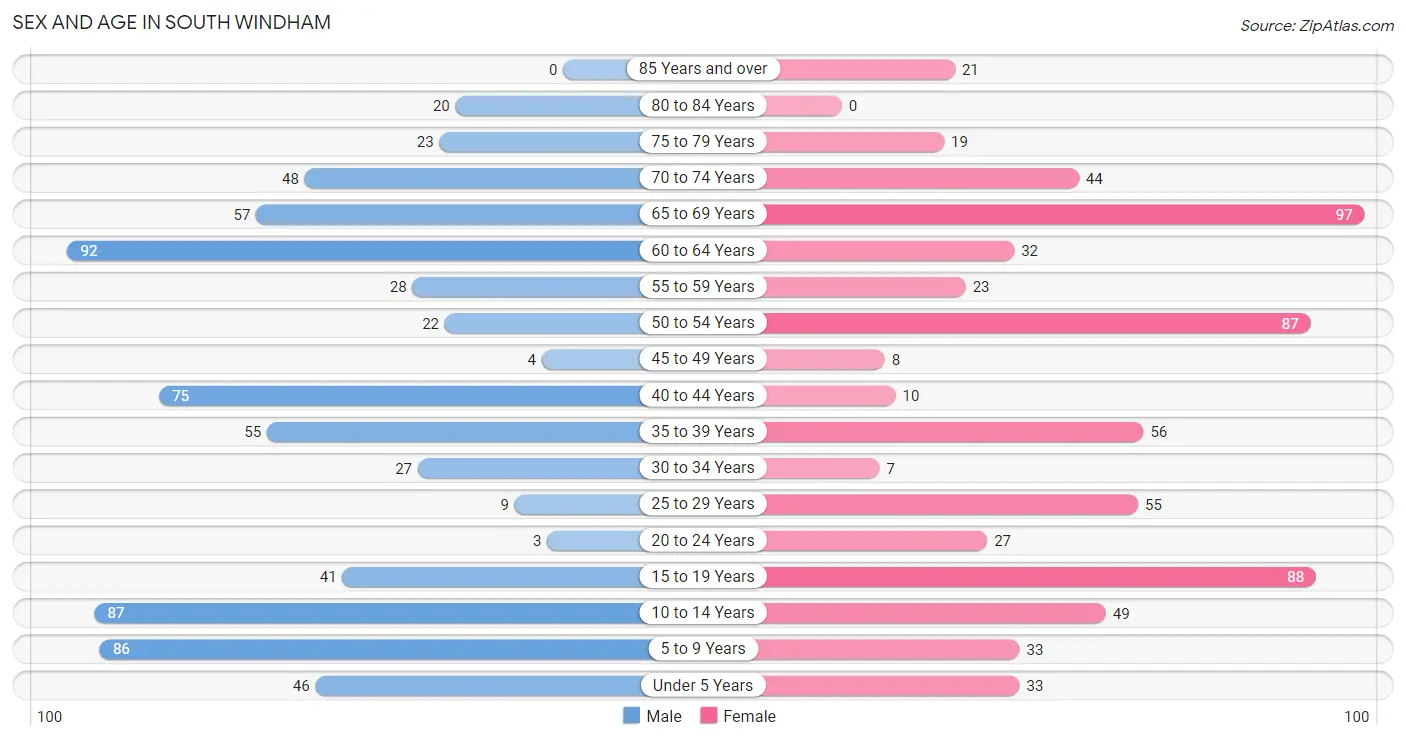
| Age Bracket | Male | Female |
| Under 5 Years | 46 (6.4%) | 33 (4.8%) |
| 5 to 9 Years | 86 (11.9%) | 33 (4.8%) |
| 10 to 14 Years | 87 (12.0%) | 49 (7.1%) |
| 15 to 19 Years | 41 (5.7%) | 88 (12.8%) |
| 20 to 24 Years | 3 (0.4%) | 27 (3.9%) |
| 25 to 29 Years | 9 (1.2%) | 55 (8.0%) |
| 30 to 34 Years | 27 (3.7%) | 7 (1.0%) |
| 35 to 39 Years | 55 (7.6%) | 56 (8.1%) |
| 40 to 44 Years | 75 (10.4%) | 10 (1.5%) |
| 45 to 49 Years | 4 (0.5%) | 8 (1.2%) |
| 50 to 54 Years | 22 (3.0%) | 87 (12.6%) |
| 55 to 59 Years | 28 (3.9%) | 23 (3.3%) |
| 60 to 64 Years | 92 (12.7%) | 32 (4.6%) |
| 65 to 69 Years | 57 (7.9%) | 97 (14.1%) |
| 70 to 74 Years | 48 (6.6%) | 44 (6.4%) |
| 75 to 79 Years | 23 (3.2%) | 19 (2.8%) |
| 80 to 84 Years | 20 (2.8%) | 0 (0.0%) |
| 85 Years and over | 0 (0.0%) | 21 (3.0%) |
| Total | 723 (100.0%) | 689 (100.0%) |
Families and Households in South Windham
Median Family Size in South Windham
The median family size in South Windham is 3.65 persons per family, with single female/mother families (20 | 6.3%) accounting for the largest median family size of 3.75 persons per family. On the other hand, single male/father families (13 | 4.1%) represent the smallest median family size with 2.31 persons per family.
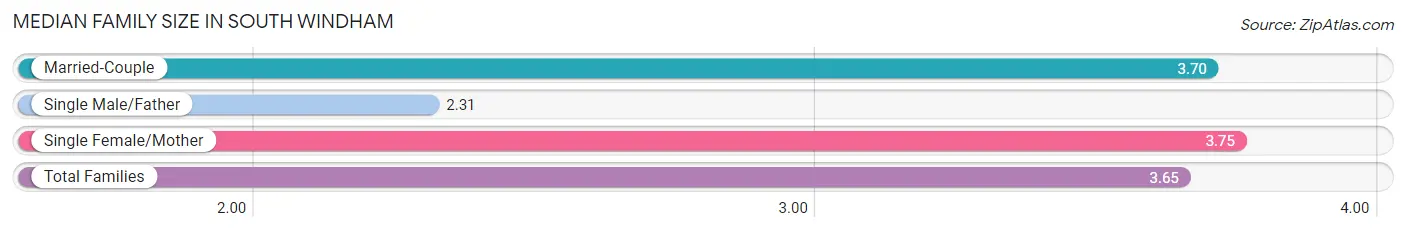
| Family Type | # Families | Family Size |
| Married-Couple | 286 (89.7%) | 3.70 |
| Single Male/Father | 13 (4.1%) | 2.31 |
| Single Female/Mother | 20 (6.3%) | 3.75 |
| Total Families | 319 (100.0%) | 3.65 |
Median Household Size in South Windham
The median household size in South Windham is 2.68 persons per household, with single female/mother households (20 | 3.9%) accounting for the largest median household size of 3.75 persons per household. non-family households (199 | 38.4%) represent the smallest median household size with 1.14 persons per household.
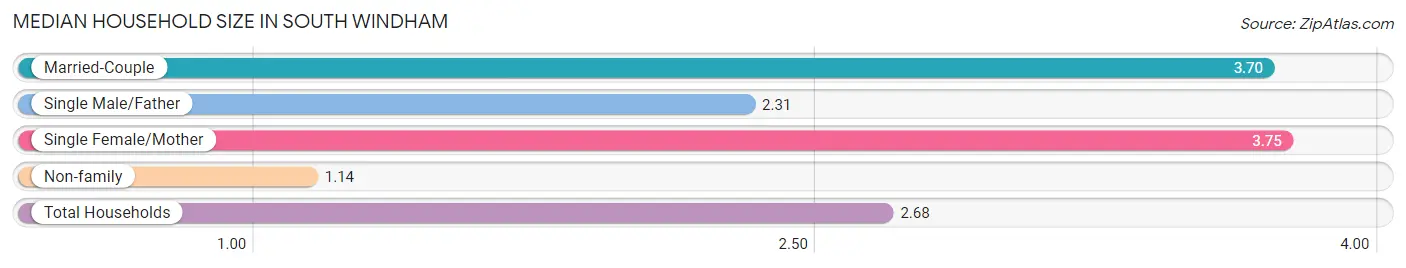
| Household Type | # Households | Household Size |
| Married-Couple | 286 (55.2%) | 3.70 |
| Single Male/Father | 13 (2.5%) | 2.31 |
| Single Female/Mother | 20 (3.9%) | 3.75 |
| Non-family | 199 (38.4%) | 1.14 |
| Total Households | 518 (100.0%) | 2.68 |
Household Size by Marriage Status in South Windham
Out of a total of 518 households in South Windham, 319 (61.6%) are family households, while 199 (38.4%) are nonfamily households. The most numerous type of family households are 2-person households, comprising 171, and the most common type of nonfamily households are 1-person households, comprising 169.
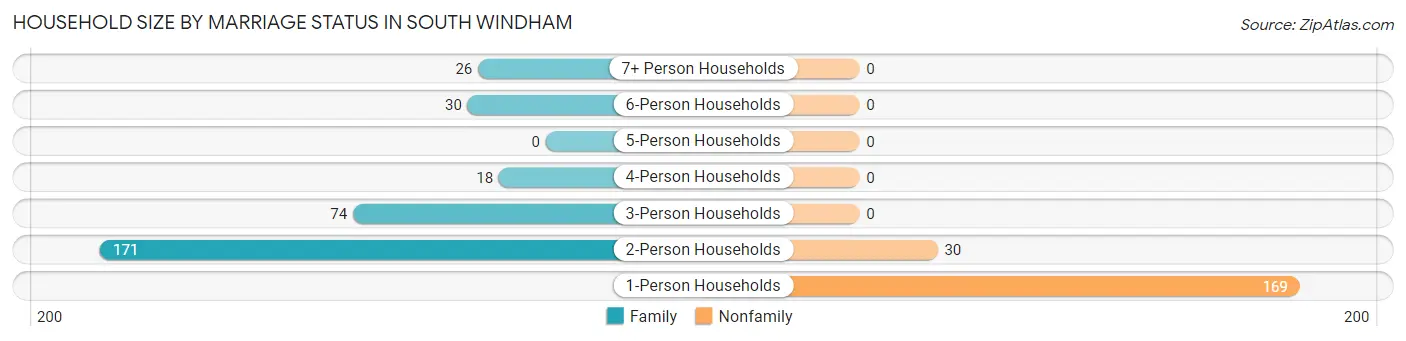
| Household Size | Family Households | Nonfamily Households |
| 1-Person Households | - | 169 (32.6%) |
| 2-Person Households | 171 (33.0%) | 30 (5.8%) |
| 3-Person Households | 74 (14.3%) | 0 (0.0%) |
| 4-Person Households | 18 (3.5%) | 0 (0.0%) |
| 5-Person Households | 0 (0.0%) | 0 (0.0%) |
| 6-Person Households | 30 (5.8%) | 0 (0.0%) |
| 7+ Person Households | 26 (5.0%) | 0 (0.0%) |
| Total | 319 (61.6%) | 199 (38.4%) |
Female Fertility in South Windham
Fertility by Age in South Windham
Average fertility rate in South Windham is 41.0 births per 1,000 women. Women in the age bracket of 20 to 34 years have the highest fertility rate with 146.0 births per 1,000 women. Women in the age bracket of 20 to 34 years acount for 100.0% of all women with births.
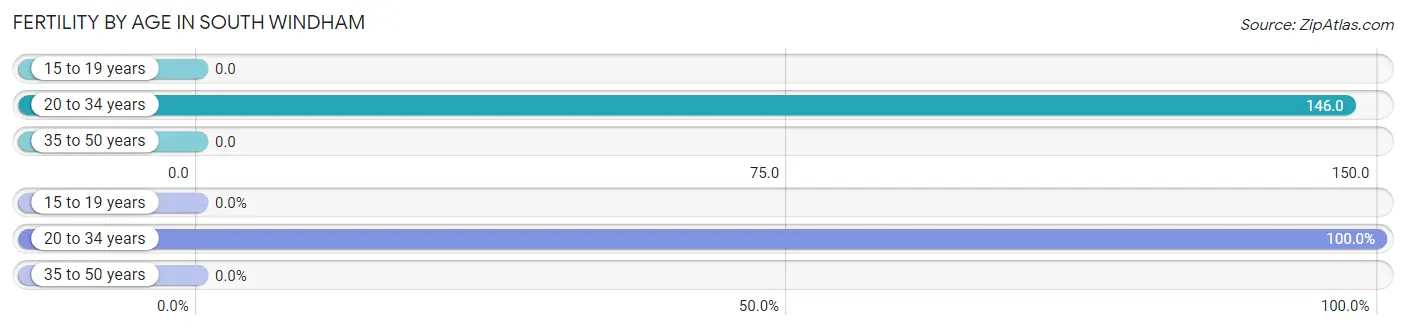
| Age Bracket | Women with Births | Births / 1,000 Women |
| 15 to 19 years | 0 (0.0%) | 0.0 |
| 20 to 34 years | 13 (100.0%) | 146.0 |
| 35 to 50 years | 0 (0.0%) | 0.0 |
| Total | 13 (100.0%) | 41.0 |
Fertility by Age by Marriage Status in South Windham
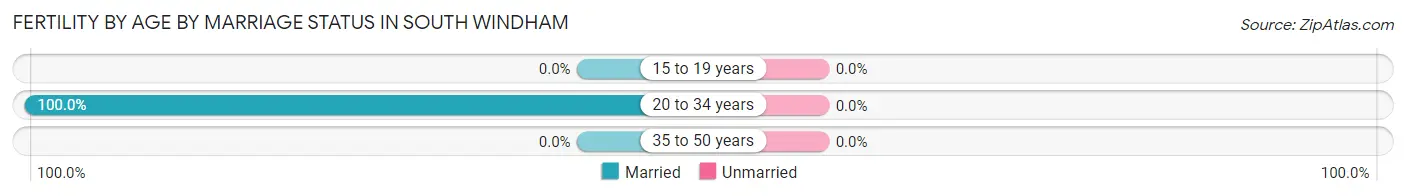
| Age Bracket | Married | Unmarried |
| 15 to 19 years | 0 (0.0%) | 0 (0.0%) |
| 20 to 34 years | 13 (100.0%) | 0 (0.0%) |
| 35 to 50 years | 0 (0.0%) | 0 (0.0%) |
| Total | 13 (100.0%) | 0 (0.0%) |
Fertility by Education in South Windham
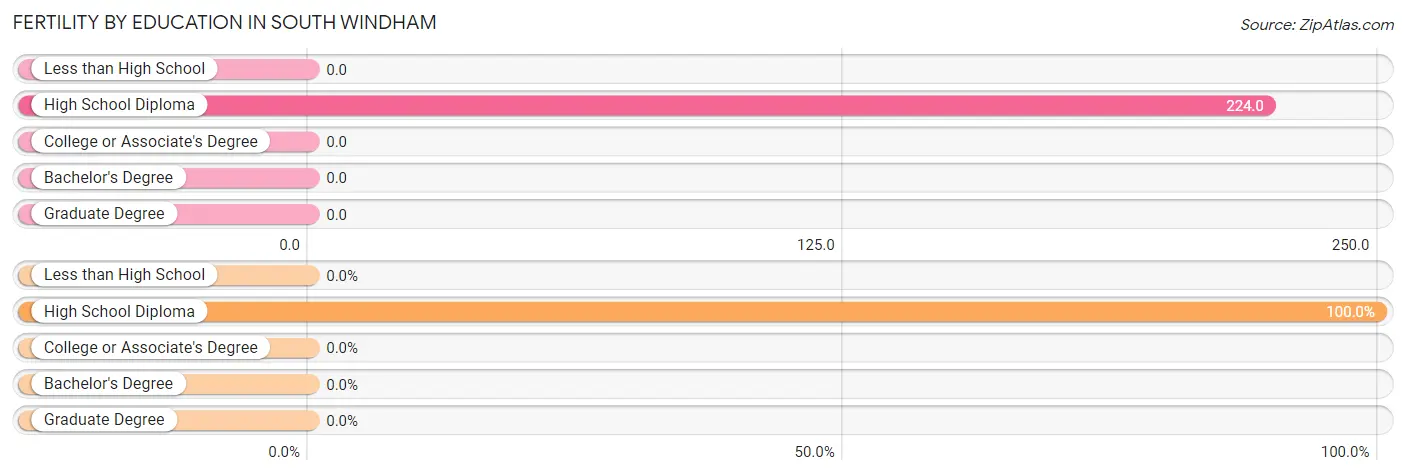
| Educational Attainment | Women with Births | Births / 1,000 Women |
| Less than High School | 0 (0.0%) | 0.0 |
| High School Diploma | 13 (100.0%) | 224.0 |
| College or Associate's Degree | 0 (0.0%) | 0.0 |
| Bachelor's Degree | 0 (0.0%) | 0.0 |
| Graduate Degree | 0 (0.0%) | 0.0 |
| Total | 13 (100.0%) | 41.0 |
Fertility by Education by Marriage Status in South Windham
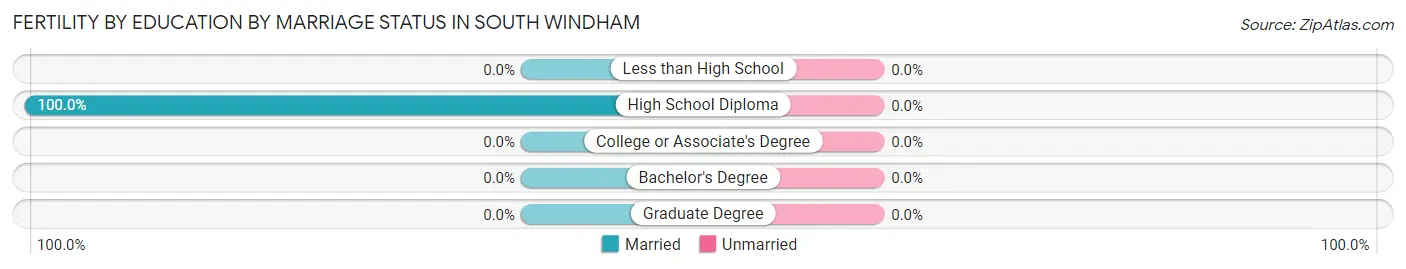
| Educational Attainment | Married | Unmarried |
| Less than High School | 0 (0.0%) | 0 (0.0%) |
| High School Diploma | 13 (100.0%) | 0 (0.0%) |
| College or Associate's Degree | 0 (0.0%) | 0 (0.0%) |
| Bachelor's Degree | 0 (0.0%) | 0 (0.0%) |
| Graduate Degree | 0 (0.0%) | 0 (0.0%) |
| Total | 13 (100.0%) | 0 (0.0%) |
Employment Characteristics in South Windham
Employment by Class of Employer in South Windham
Among the 639 employed individuals in South Windham, private company employees (347 | 54.3%), not-for-profit organizations (137 | 21.4%), and self-employed (not incorporated) (58 | 9.1%) make up the most common classes of employment.
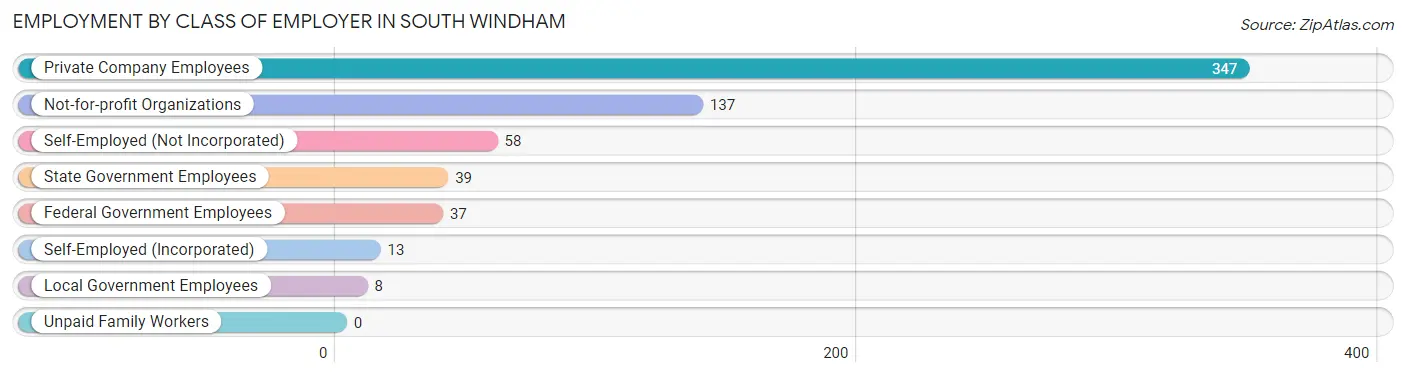
| Employer Class | # Employees | % Employees |
| Private Company Employees | 347 | 54.3% |
| Self-Employed (Incorporated) | 13 | 2.0% |
| Self-Employed (Not Incorporated) | 58 | 9.1% |
| Not-for-profit Organizations | 137 | 21.4% |
| Local Government Employees | 8 | 1.3% |
| State Government Employees | 39 | 6.1% |
| Federal Government Employees | 37 | 5.8% |
| Unpaid Family Workers | 0 | 0.0% |
| Total | 639 | 100.0% |
Employment Status by Age in South Windham
According to the labor force statistics for South Windham, out of the total population over 16 years of age (1,046), 62.6% or 655 individuals are in the labor force, with 1.2% or 8 of them unemployed. The age group with the highest labor force participation rate is 25 to 29 years, with 100.0% or 64 individuals in the labor force. Within the labor force, the 30 to 34 years age range has the highest percentage of unemployed individuals, with 23.5% or 8 of them being unemployed.
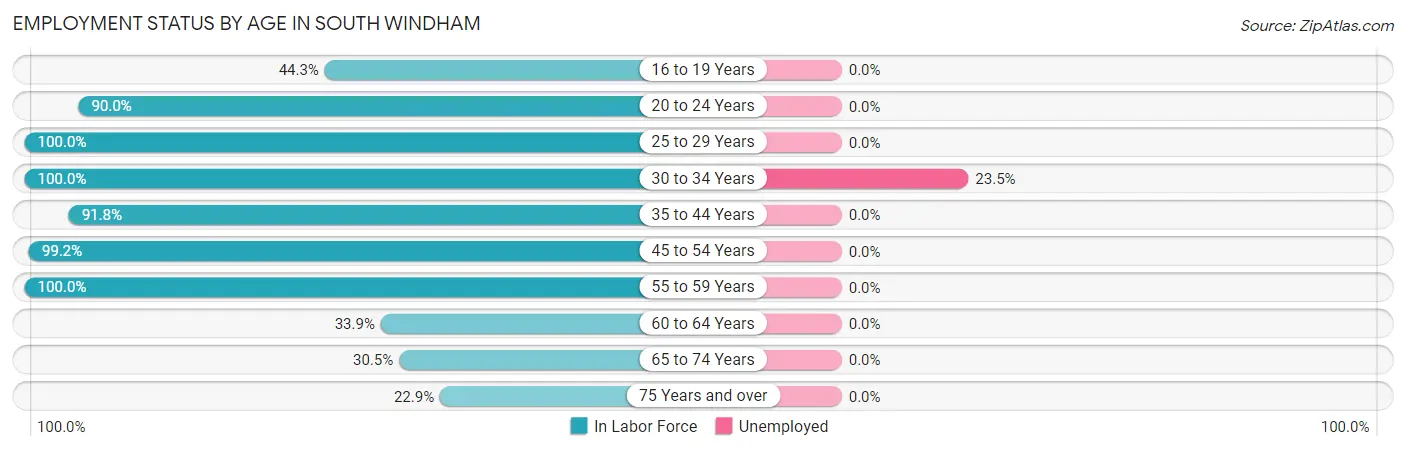
| Age Bracket | In Labor Force | Unemployed |
| 16 to 19 Years | 43 (44.3%) | 0 (0.0%) |
| 20 to 24 Years | 27 (90.0%) | 0 (0.0%) |
| 25 to 29 Years | 64 (100.0%) | 0 (0.0%) |
| 30 to 34 Years | 34 (100.0%) | 8 (23.5%) |
| 35 to 44 Years | 180 (91.8%) | 0 (0.0%) |
| 45 to 54 Years | 120 (99.2%) | 0 (0.0%) |
| 55 to 59 Years | 51 (100.0%) | 0 (0.0%) |
| 60 to 64 Years | 42 (33.9%) | 0 (0.0%) |
| 65 to 74 Years | 75 (30.5%) | 0 (0.0%) |
| 75 Years and over | 19 (22.9%) | 0 (0.0%) |
| Total | 655 (62.6%) | 8 (1.2%) |
Employment Status by Educational Attainment in South Windham
According to labor force statistics for South Windham, 83.2% of individuals (491) out of the total population between 25 and 64 years of age (590) are in the labor force, with 1.6% or 8 of them being unemployed. The group with the highest labor force participation rate are those with the educational attainment of bachelor's degree or higher, with 100.0% or 126 individuals in the labor force. Within the labor force, individuals with bachelor's degree or higher education have the highest percentage of unemployment, with 6.3% or 8 of them being unemployed.
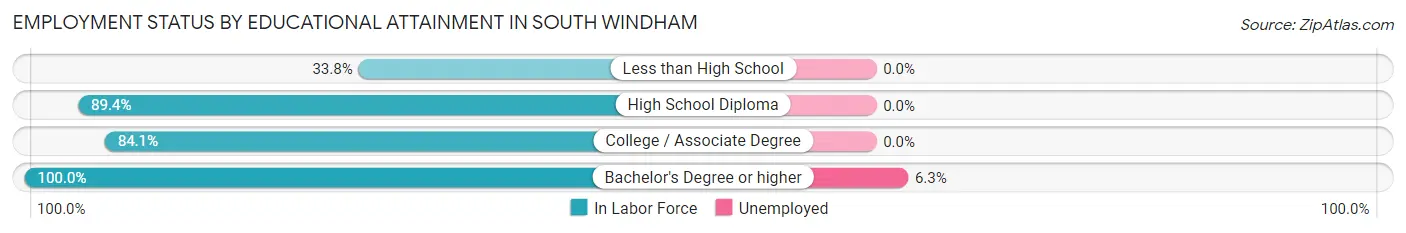
| Educational Attainment | In Labor Force | Unemployed |
| Less than High School | 25 (33.8%) | 0 (0.0%) |
| High School Diploma | 202 (89.4%) | 0 (0.0%) |
| College / Associate Degree | 138 (84.1%) | 0 (0.0%) |
| Bachelor's Degree or higher | 126 (100.0%) | 8 (6.3%) |
| Total | 491 (83.2%) | 9 (1.6%) |
Employment Occupations by Sex in South Windham
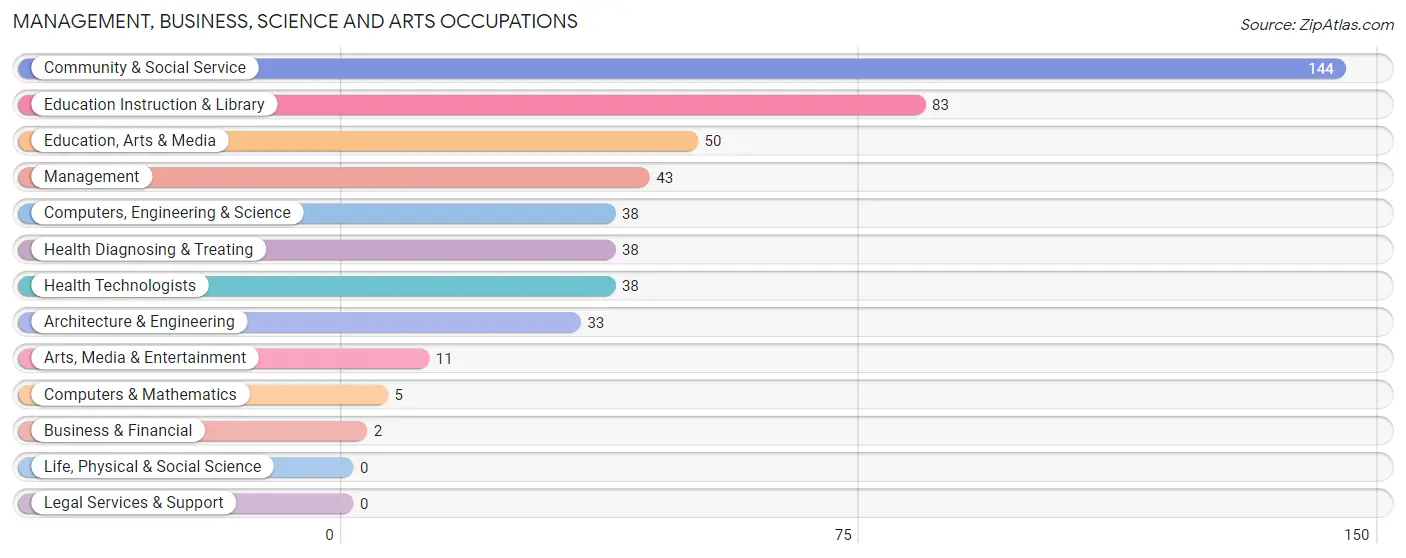
Management, Business, Science and Arts Occupations
The most common Management, Business, Science and Arts occupations in South Windham are Community & Social Service (144 | 22.3%), Education Instruction & Library (83 | 12.8%), Education, Arts & Media (50 | 7.7%), Management (43 | 6.7%), and Computers, Engineering & Science (38 | 5.9%).
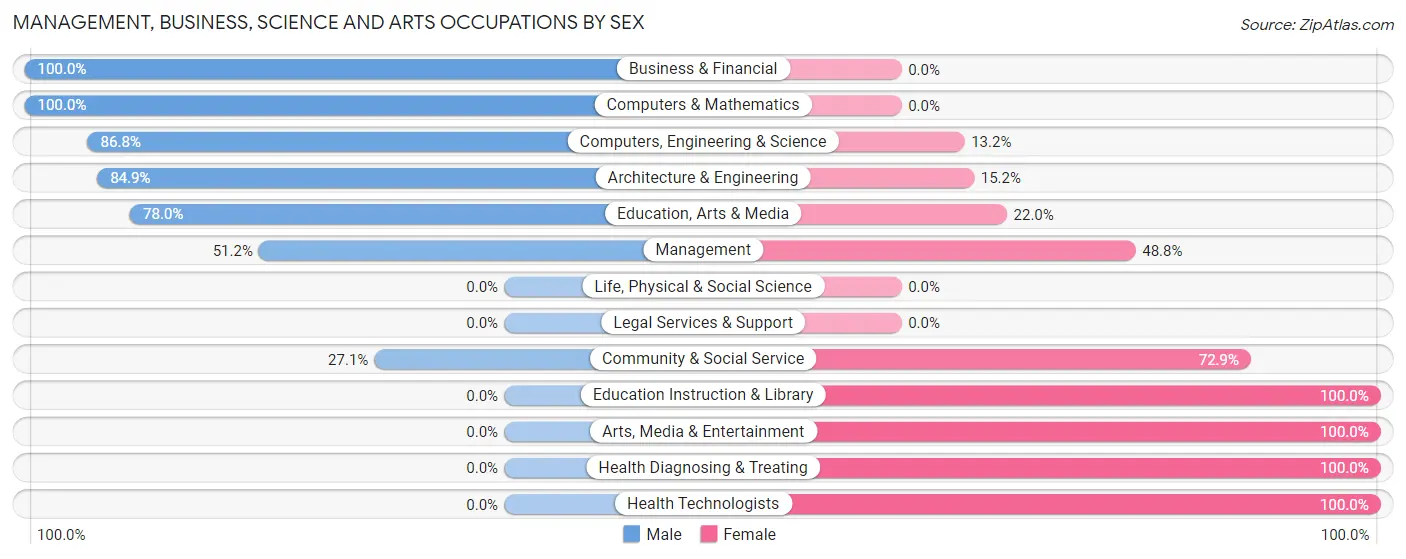
Management, Business, Science and Arts Occupations by Sex
Within the Management, Business, Science and Arts occupations in South Windham, the most male-oriented occupations are Business & Financial (100.0%), Computers & Mathematics (100.0%), and Computers, Engineering & Science (86.8%), while the most female-oriented occupations are Education Instruction & Library (100.0%), Arts, Media & Entertainment (100.0%), and Health Diagnosing & Treating (100.0%).
| Occupation | Male | Female |
| Management | 22 (51.2%) | 21 (48.8%) |
| Business & Financial | 2 (100.0%) | 0 (0.0%) |
| Computers, Engineering & Science | 33 (86.8%) | 5 (13.2%) |
| Computers & Mathematics | 5 (100.0%) | 0 (0.0%) |
| Architecture & Engineering | 28 (84.9%) | 5 (15.1%) |
| Life, Physical & Social Science | 0 (0.0%) | 0 (0.0%) |
| Community & Social Service | 39 (27.1%) | 105 (72.9%) |
| Education, Arts & Media | 39 (78.0%) | 11 (22.0%) |
| Legal Services & Support | 0 (0.0%) | 0 (0.0%) |
| Education Instruction & Library | 0 (0.0%) | 83 (100.0%) |
| Arts, Media & Entertainment | 0 (0.0%) | 11 (100.0%) |
| Health Diagnosing & Treating | 0 (0.0%) | 38 (100.0%) |
| Health Technologists | 0 (0.0%) | 38 (100.0%) |
| Total (Category) | 96 (36.2%) | 169 (63.8%) |
| Total (Overall) | 303 (46.8%) | 344 (53.2%) |
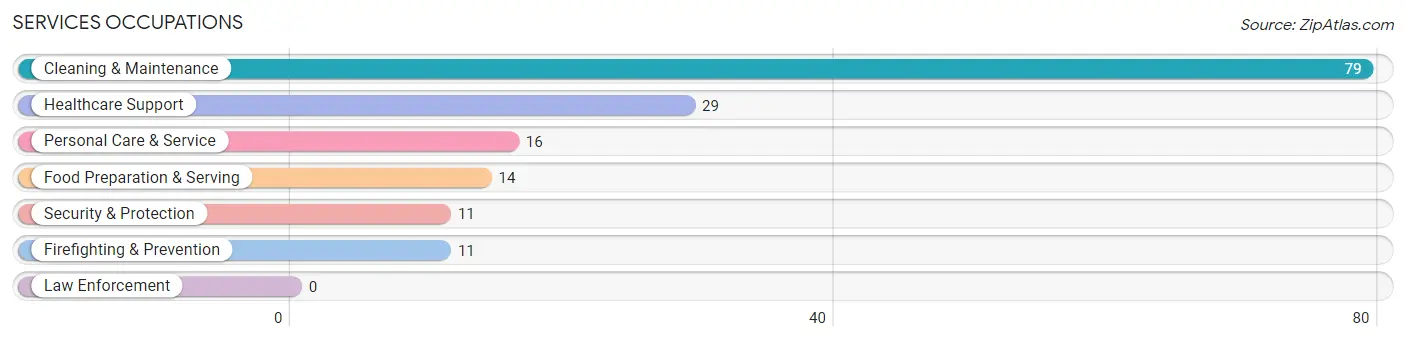
Services Occupations
The most common Services occupations in South Windham are Cleaning & Maintenance (79 | 12.2%), Healthcare Support (29 | 4.5%), Personal Care & Service (16 | 2.5%), Food Preparation & Serving (14 | 2.2%), and Security & Protection (11 | 1.7%).
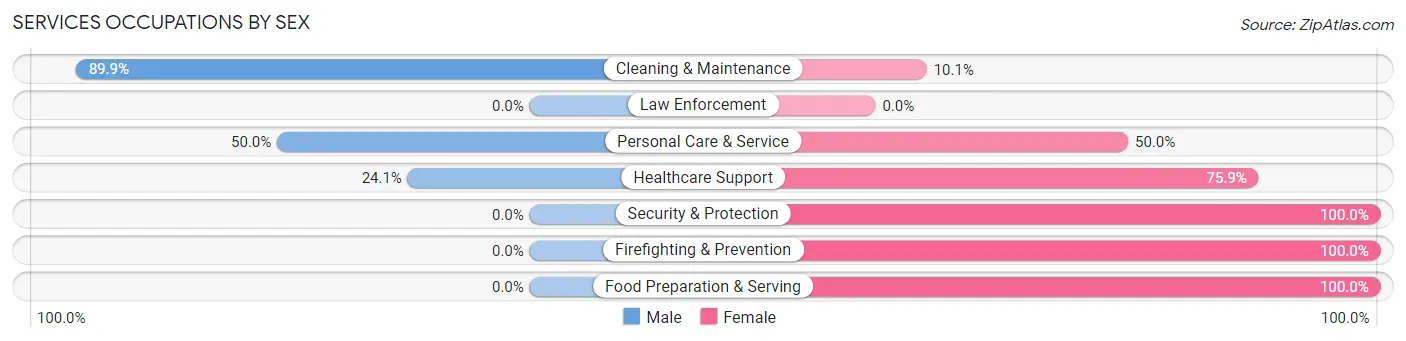
Services Occupations by Sex
Within the Services occupations in South Windham, the most male-oriented occupations are Cleaning & Maintenance (89.9%), Personal Care & Service (50.0%), and Healthcare Support (24.1%), while the most female-oriented occupations are Security & Protection (100.0%), Firefighting & Prevention (100.0%), and Food Preparation & Serving (100.0%).
| Occupation | Male | Female |
| Healthcare Support | 7 (24.1%) | 22 (75.9%) |
| Security & Protection | 0 (0.0%) | 11 (100.0%) |
| Firefighting & Prevention | 0 (0.0%) | 11 (100.0%) |
| Law Enforcement | 0 (0.0%) | 0 (0.0%) |
| Food Preparation & Serving | 0 (0.0%) | 14 (100.0%) |
| Cleaning & Maintenance | 71 (89.9%) | 8 (10.1%) |
| Personal Care & Service | 8 (50.0%) | 8 (50.0%) |
| Total (Category) | 86 (57.7%) | 63 (42.3%) |
| Total (Overall) | 303 (46.8%) | 344 (53.2%) |
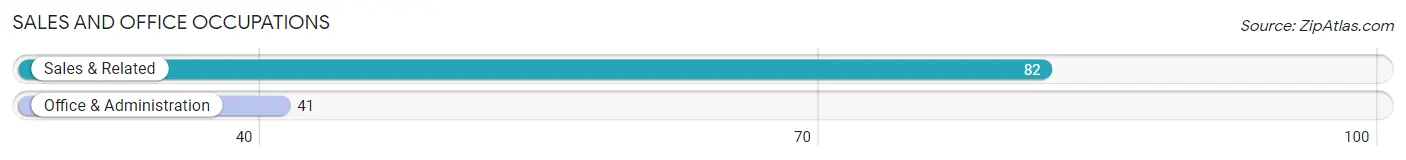
Sales and Office Occupations
The most common Sales and Office occupations in South Windham are Sales & Related (82 | 12.7%), and Office & Administration (41 | 6.3%).
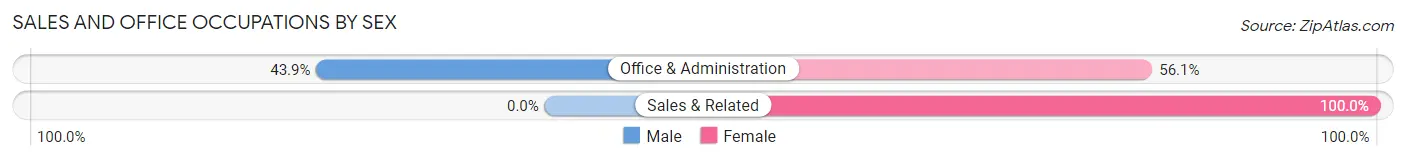
Sales and Office Occupations by Sex
| Occupation | Male | Female |
| Sales & Related | 0 (0.0%) | 82 (100.0%) |
| Office & Administration | 18 (43.9%) | 23 (56.1%) |
| Total (Category) | 18 (14.6%) | 105 (85.4%) |
| Total (Overall) | 303 (46.8%) | 344 (53.2%) |
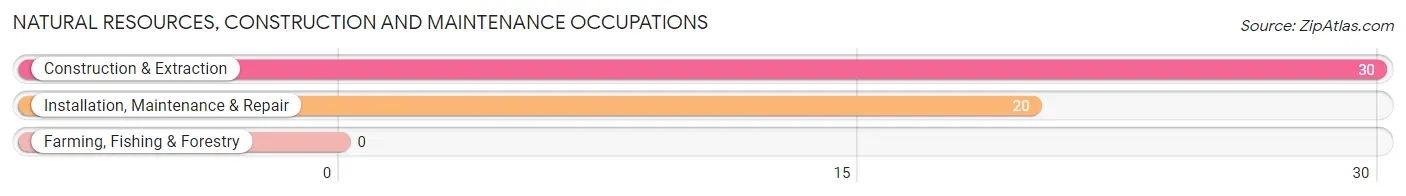
Natural Resources, Construction and Maintenance Occupations
The most common Natural Resources, Construction and Maintenance occupations in South Windham are Construction & Extraction (30 | 4.6%), and Installation, Maintenance & Repair (20 | 3.1%).
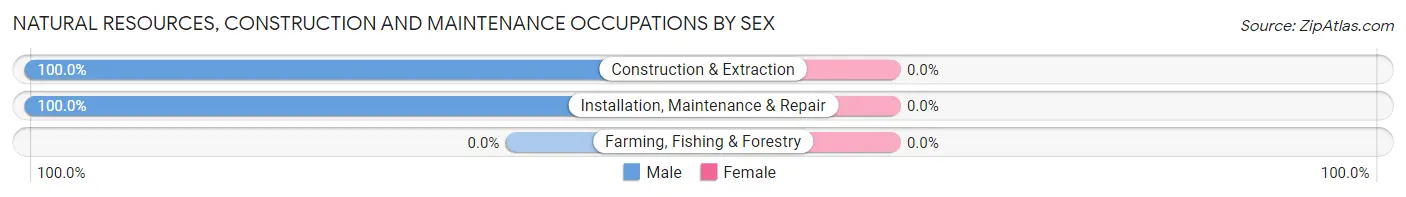
Natural Resources, Construction and Maintenance Occupations by Sex
| Occupation | Male | Female |
| Farming, Fishing & Forestry | 0 (0.0%) | 0 (0.0%) |
| Construction & Extraction | 30 (100.0%) | 0 (0.0%) |
| Installation, Maintenance & Repair | 20 (100.0%) | 0 (0.0%) |
| Total (Category) | 50 (100.0%) | 0 (0.0%) |
| Total (Overall) | 303 (46.8%) | 344 (53.2%) |
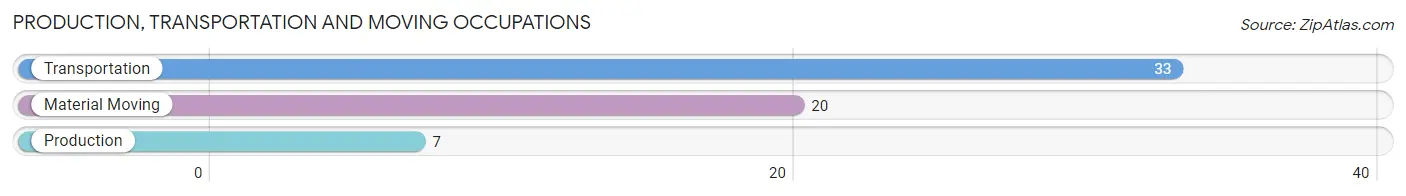
Production, Transportation and Moving Occupations
The most common Production, Transportation and Moving occupations in South Windham are Transportation (33 | 5.1%), Material Moving (20 | 3.1%), and Production (7 | 1.1%).
Production, Transportation and Moving Occupations by Sex
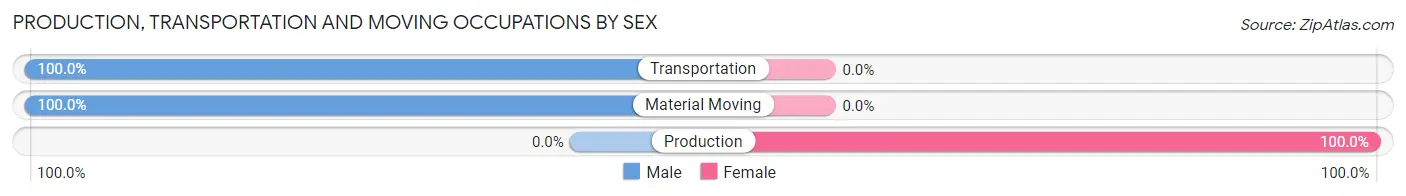
| Occupation | Male | Female |
| Production | 0 (0.0%) | 7 (100.0%) |
| Transportation | 33 (100.0%) | 0 (0.0%) |
| Material Moving | 20 (100.0%) | 0 (0.0%) |
| Total (Category) | 53 (88.3%) | 7 (11.7%) |
| Total (Overall) | 303 (46.8%) | 344 (53.2%) |
Employment Industries by Sex in South Windham
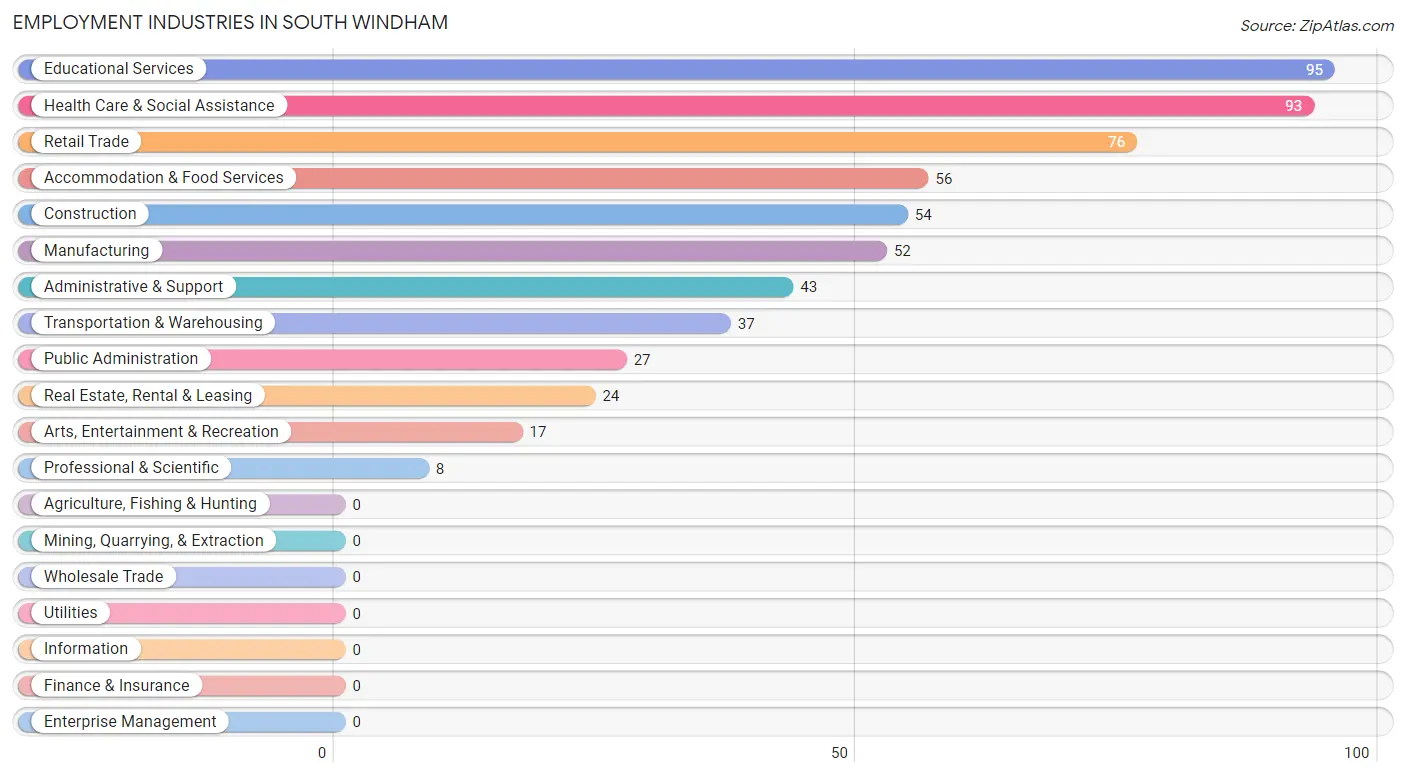
Employment Industries in South Windham
The major employment industries in South Windham include Educational Services (95 | 14.7%), Health Care & Social Assistance (93 | 14.4%), Retail Trade (76 | 11.7%), Accommodation & Food Services (56 | 8.7%), and Construction (54 | 8.4%).
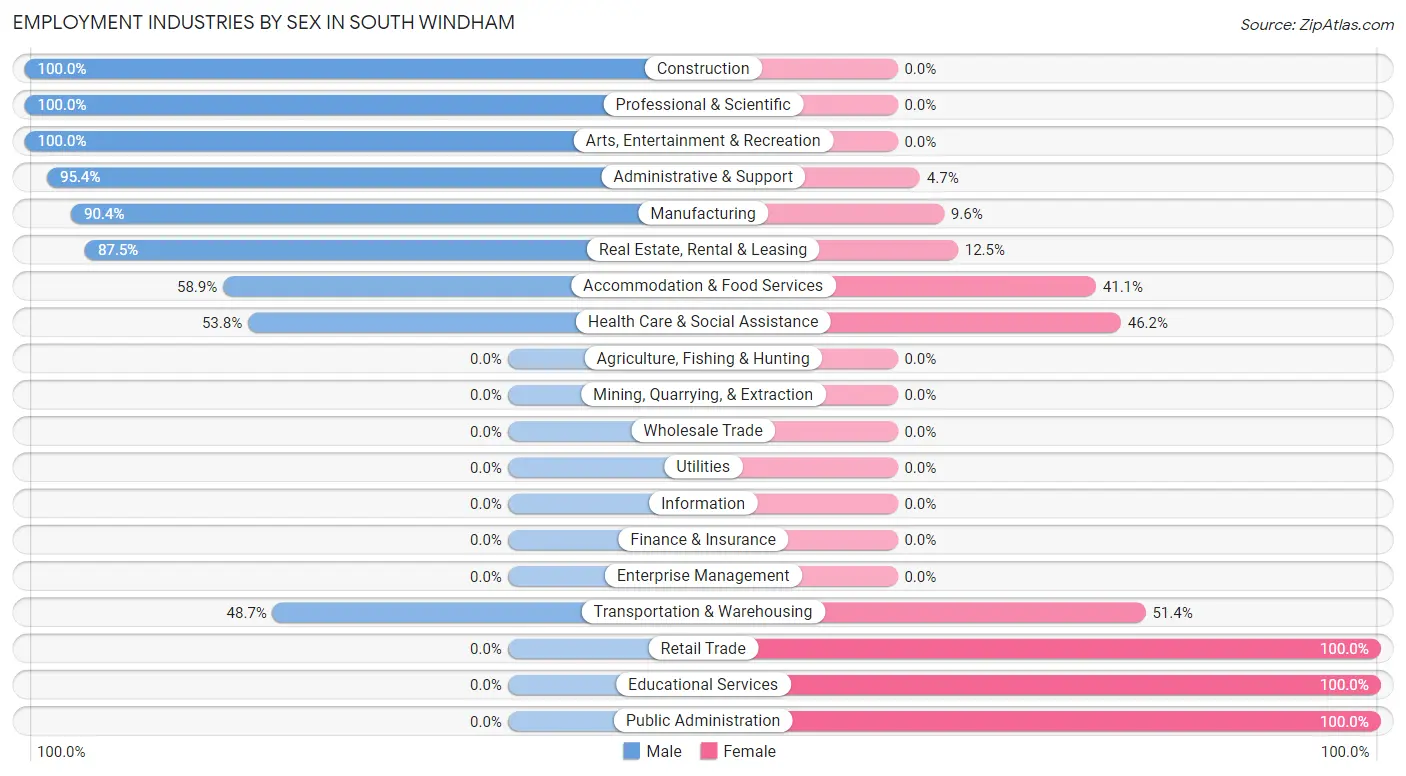
Employment Industries by Sex in South Windham
The South Windham industries that see more men than women are Construction (100.0%), Professional & Scientific (100.0%), and Arts, Entertainment & Recreation (100.0%), whereas the industries that tend to have a higher number of women are Retail Trade (100.0%), Educational Services (100.0%), and Public Administration (100.0%).
| Industry | Male | Female |
| Agriculture, Fishing & Hunting | 0 (0.0%) | 0 (0.0%) |
| Mining, Quarrying, & Extraction | 0 (0.0%) | 0 (0.0%) |
| Construction | 54 (100.0%) | 0 (0.0%) |
| Manufacturing | 47 (90.4%) | 5 (9.6%) |
| Wholesale Trade | 0 (0.0%) | 0 (0.0%) |
| Retail Trade | 0 (0.0%) | 76 (100.0%) |
| Transportation & Warehousing | 18 (48.6%) | 19 (51.3%) |
| Utilities | 0 (0.0%) | 0 (0.0%) |
| Information | 0 (0.0%) | 0 (0.0%) |
| Finance & Insurance | 0 (0.0%) | 0 (0.0%) |
| Real Estate, Rental & Leasing | 21 (87.5%) | 3 (12.5%) |
| Professional & Scientific | 8 (100.0%) | 0 (0.0%) |
| Enterprise Management | 0 (0.0%) | 0 (0.0%) |
| Administrative & Support | 41 (95.4%) | 2 (4.6%) |
| Educational Services | 0 (0.0%) | 95 (100.0%) |
| Health Care & Social Assistance | 50 (53.8%) | 43 (46.2%) |
| Arts, Entertainment & Recreation | 17 (100.0%) | 0 (0.0%) |
| Accommodation & Food Services | 33 (58.9%) | 23 (41.1%) |
| Public Administration | 0 (0.0%) | 27 (100.0%) |
| Total | 303 (46.8%) | 344 (53.2%) |
Education in South Windham
School Enrollment in South Windham
The most common levels of schooling among the 454 students in South Windham are high school (126 | 27.8%), elementary school (103 | 22.7%), and middle school (85 | 18.7%).
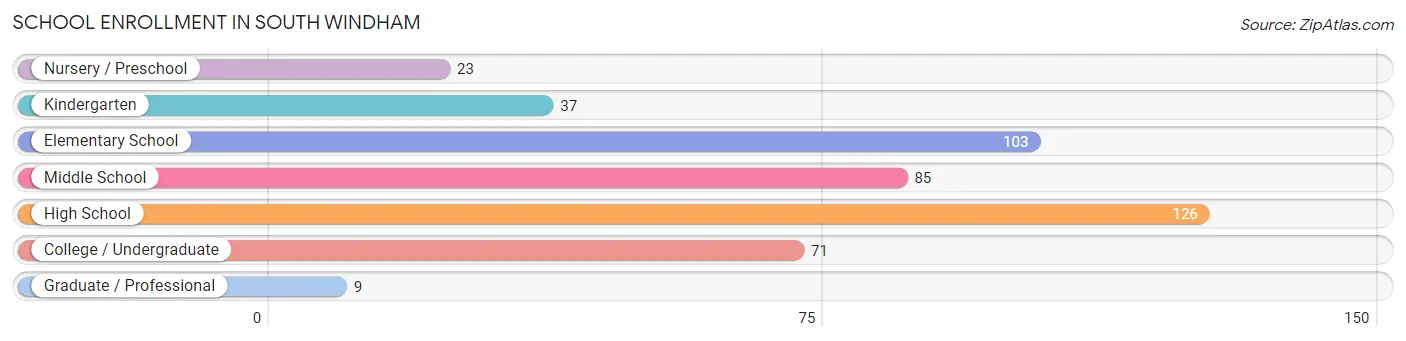
| School Level | # Students | % Students |
| Nursery / Preschool | 23 | 5.1% |
| Kindergarten | 37 | 8.2% |
| Elementary School | 103 | 22.7% |
| Middle School | 85 | 18.7% |
| High School | 126 | 27.8% |
| College / Undergraduate | 71 | 15.6% |
| Graduate / Professional | 9 | 2.0% |
| Total | 454 | 100.0% |
School Enrollment by Age by Funding Source in South Windham
Out of a total of 454 students who are enrolled in schools in South Windham, 193 (42.5%) attend a private institution, while the remaining 261 (57.5%) are enrolled in public schools. The age group of 10 to 14 year olds has the highest likelihood of being enrolled in private schools, with 85 (62.5% in the age bracket) enrolled. Conversely, the age group of 3 to 4 year olds has the lowest likelihood of being enrolled in a private school, with 23 (100.0% in the age bracket) attending a public institution.
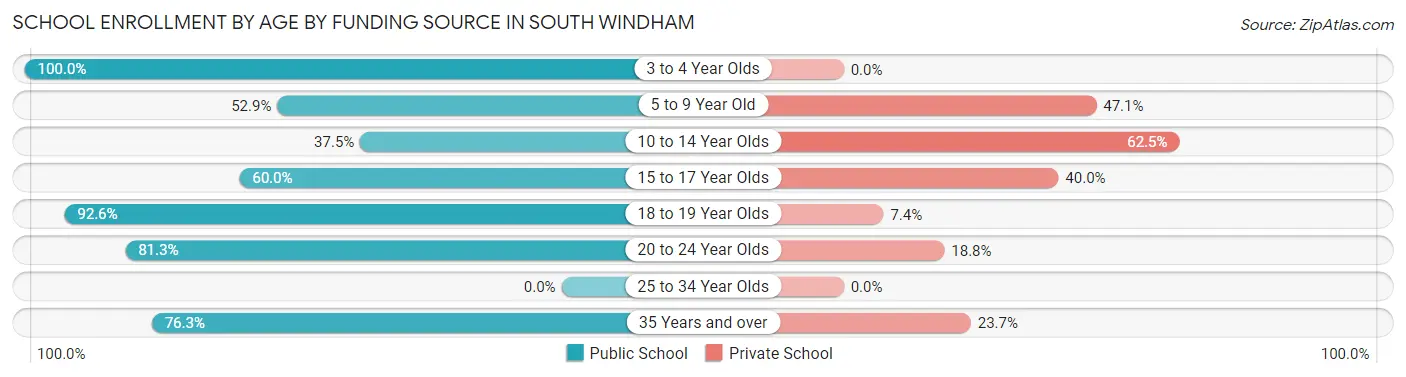
| Age Bracket | Public School | Private School |
| 3 to 4 Year Olds | 23 (100.0%) | 0 (0.0%) |
| 5 to 9 Year Old | 63 (52.9%) | 56 (47.1%) |
| 10 to 14 Year Olds | 51 (37.5%) | 85 (62.5%) |
| 15 to 17 Year Olds | 57 (60.0%) | 38 (40.0%) |
| 18 to 19 Year Olds | 25 (92.6%) | 2 (7.4%) |
| 20 to 24 Year Olds | 13 (81.2%) | 3 (18.8%) |
| 25 to 34 Year Olds | 0 (0.0%) | 0 (0.0%) |
| 35 Years and over | 29 (76.3%) | 9 (23.7%) |
| Total | 261 (57.5%) | 193 (42.5%) |
Educational Attainment by Field of Study in South Windham
Science & technology (40 | 23.9%), education (29 | 17.4%), business (22 | 13.2%), arts & humanities (19 | 11.4%), and liberal arts & history (15 | 9.0%) are the most common fields of study among 167 individuals in South Windham who have obtained a bachelor's degree or higher.
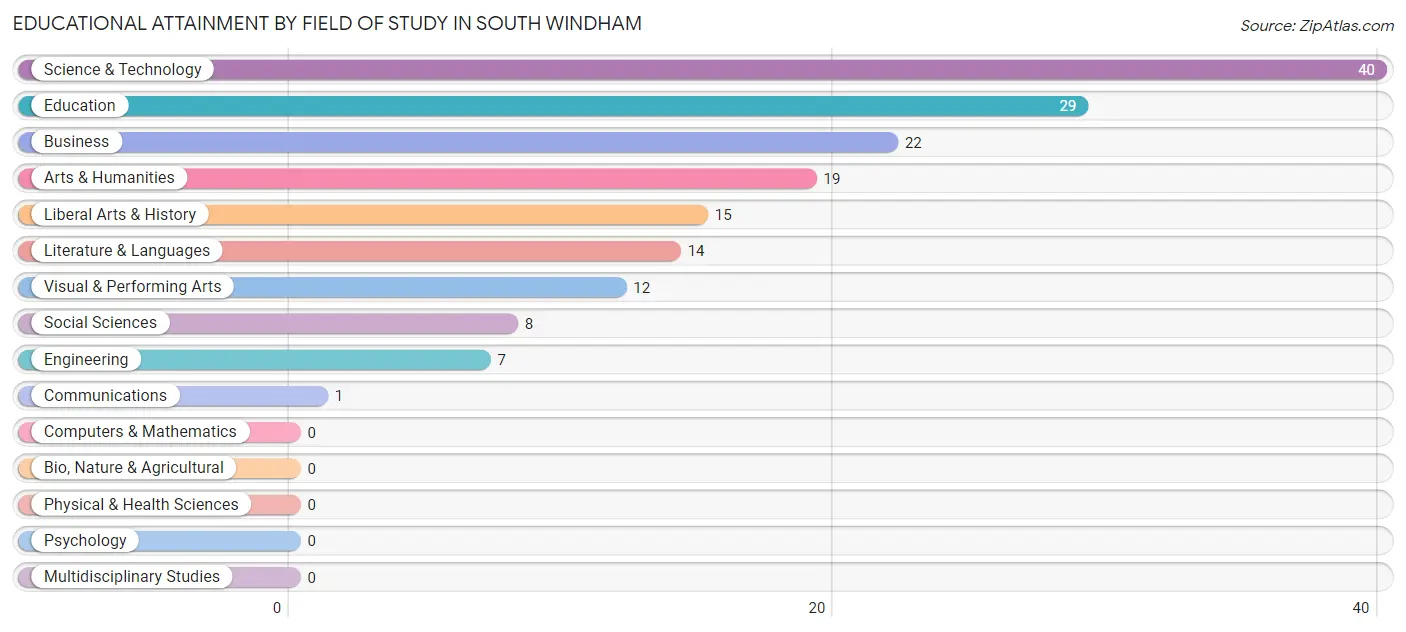
| Field of Study | # Graduates | % Graduates |
| Computers & Mathematics | 0 | 0.0% |
| Bio, Nature & Agricultural | 0 | 0.0% |
| Physical & Health Sciences | 0 | 0.0% |
| Psychology | 0 | 0.0% |
| Social Sciences | 8 | 4.8% |
| Engineering | 7 | 4.2% |
| Multidisciplinary Studies | 0 | 0.0% |
| Science & Technology | 40 | 23.9% |
| Business | 22 | 13.2% |
| Education | 29 | 17.4% |
| Literature & Languages | 14 | 8.4% |
| Liberal Arts & History | 15 | 9.0% |
| Visual & Performing Arts | 12 | 7.2% |
| Communications | 1 | 0.6% |
| Arts & Humanities | 19 | 11.4% |
| Total | 167 | 100.0% |
Transportation & Commute in South Windham
Vehicle Availability by Sex in South Windham
The most prevalent vehicle ownership categories in South Windham are males with 2 vehicles (110, accounting for 36.5%) and females with 2 vehicles (91, making up 34.3%).
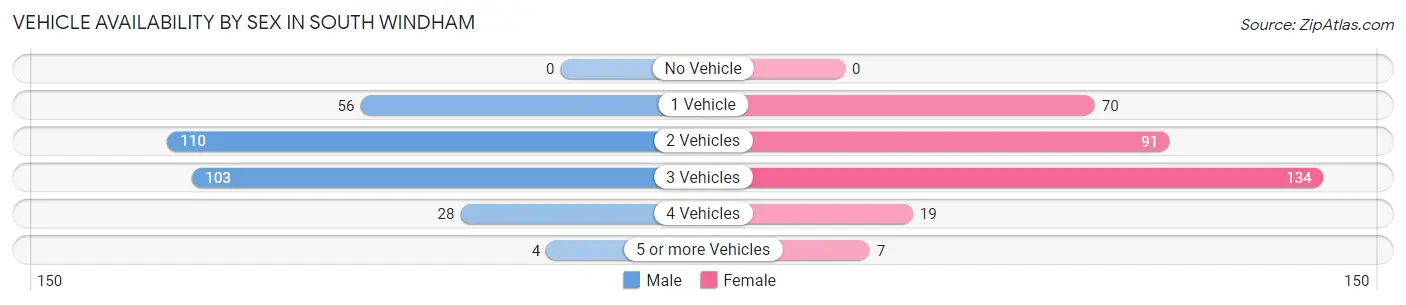
| Vehicles Available | Male | Female |
| No Vehicle | 0 (0.0%) | 0 (0.0%) |
| 1 Vehicle | 56 (18.6%) | 70 (21.8%) |
| 2 Vehicles | 110 (36.5%) | 91 (28.3%) |
| 3 Vehicles | 103 (34.2%) | 134 (41.7%) |
| 4 Vehicles | 28 (9.3%) | 19 (5.9%) |
| 5 or more Vehicles | 4 (1.3%) | 7 (2.2%) |
| Total | 301 (100.0%) | 321 (100.0%) |
Commute Time in South Windham
The most frequently occuring commute durations in South Windham are 5 to 9 minutes (149 commuters, 24.8%), 45 to 59 minutes (109 commuters, 18.2%), and 25 to 29 minutes (76 commuters, 12.7%).
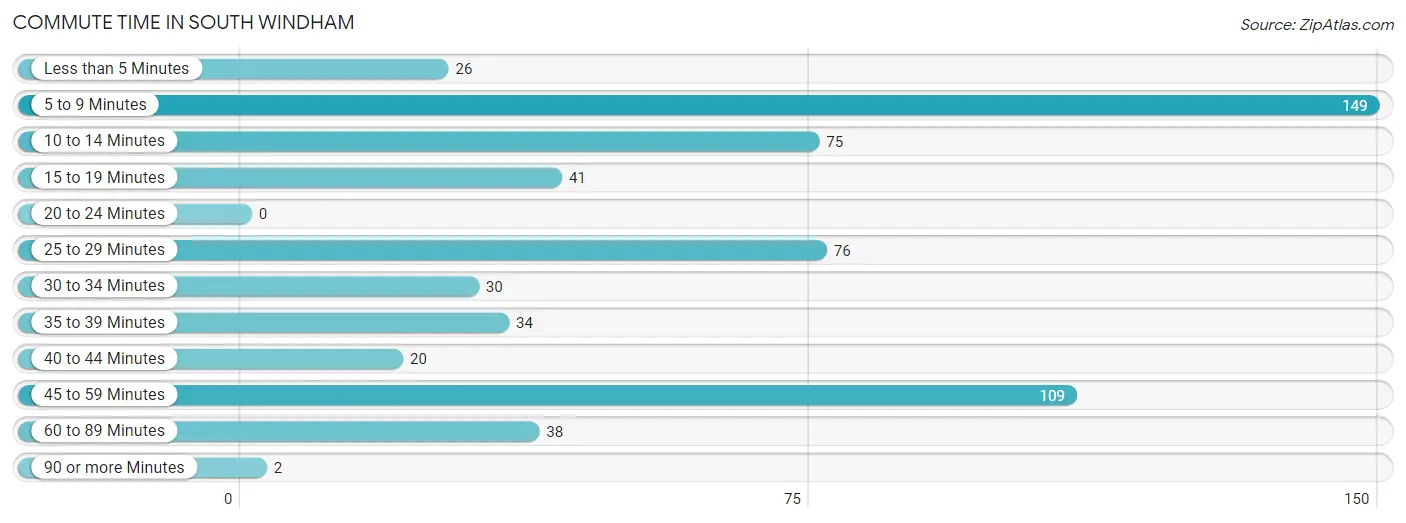
| Commute Time | # Commuters | % Commuters |
| Less than 5 Minutes | 26 | 4.3% |
| 5 to 9 Minutes | 149 | 24.8% |
| 10 to 14 Minutes | 75 | 12.5% |
| 15 to 19 Minutes | 41 | 6.8% |
| 20 to 24 Minutes | 0 | 0.0% |
| 25 to 29 Minutes | 76 | 12.7% |
| 30 to 34 Minutes | 30 | 5.0% |
| 35 to 39 Minutes | 34 | 5.7% |
| 40 to 44 Minutes | 20 | 3.3% |
| 45 to 59 Minutes | 109 | 18.2% |
| 60 to 89 Minutes | 38 | 6.3% |
| 90 or more Minutes | 2 | 0.3% |
Commute Time by Sex in South Windham
The most common commute times in South Windham are 45 to 59 minutes (109 commuters, 39.4%) for males and 5 to 9 minutes (110 commuters, 34.1%) for females.
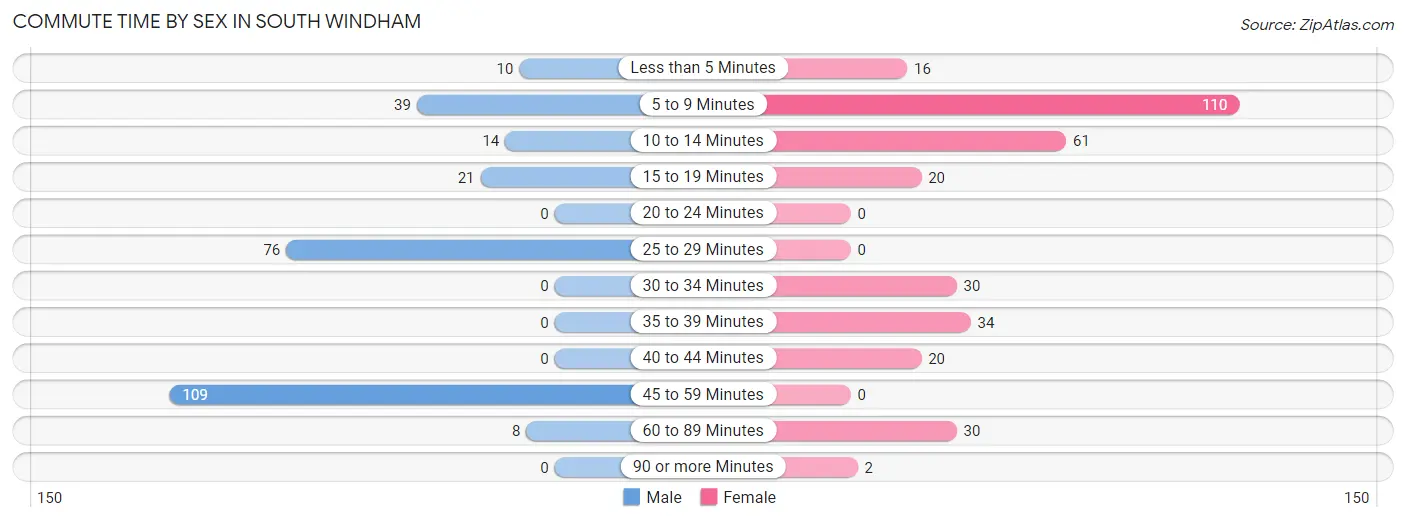
| Commute Time | Male | Female |
| Less than 5 Minutes | 10 (3.6%) | 16 (5.0%) |
| 5 to 9 Minutes | 39 (14.1%) | 110 (34.1%) |
| 10 to 14 Minutes | 14 (5.1%) | 61 (18.9%) |
| 15 to 19 Minutes | 21 (7.6%) | 20 (6.2%) |
| 20 to 24 Minutes | 0 (0.0%) | 0 (0.0%) |
| 25 to 29 Minutes | 76 (27.4%) | 0 (0.0%) |
| 30 to 34 Minutes | 0 (0.0%) | 30 (9.3%) |
| 35 to 39 Minutes | 0 (0.0%) | 34 (10.5%) |
| 40 to 44 Minutes | 0 (0.0%) | 20 (6.2%) |
| 45 to 59 Minutes | 109 (39.4%) | 0 (0.0%) |
| 60 to 89 Minutes | 8 (2.9%) | 30 (9.3%) |
| 90 or more Minutes | 0 (0.0%) | 2 (0.6%) |
Time of Departure to Work by Sex in South Windham
The most frequent times of departure to work in South Windham are 7:00 AM to 7:29 AM (106, 38.3%) for males and 6:00 AM to 6:29 AM (45, 13.9%) for females.
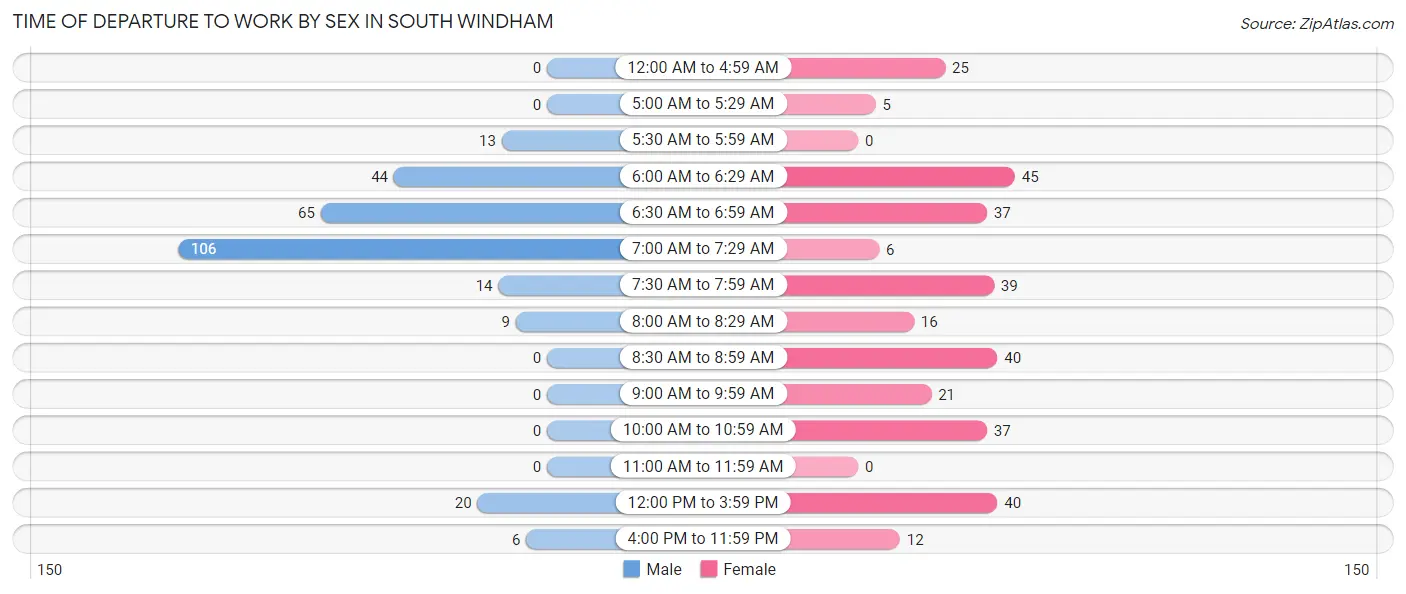
| Time of Departure | Male | Female |
| 12:00 AM to 4:59 AM | 0 (0.0%) | 25 (7.7%) |
| 5:00 AM to 5:29 AM | 0 (0.0%) | 5 (1.5%) |
| 5:30 AM to 5:59 AM | 13 (4.7%) | 0 (0.0%) |
| 6:00 AM to 6:29 AM | 44 (15.9%) | 45 (13.9%) |
| 6:30 AM to 6:59 AM | 65 (23.5%) | 37 (11.5%) |
| 7:00 AM to 7:29 AM | 106 (38.3%) | 6 (1.9%) |
| 7:30 AM to 7:59 AM | 14 (5.1%) | 39 (12.1%) |
| 8:00 AM to 8:29 AM | 9 (3.3%) | 16 (5.0%) |
| 8:30 AM to 8:59 AM | 0 (0.0%) | 40 (12.4%) |
| 9:00 AM to 9:59 AM | 0 (0.0%) | 21 (6.5%) |
| 10:00 AM to 10:59 AM | 0 (0.0%) | 37 (11.5%) |
| 11:00 AM to 11:59 AM | 0 (0.0%) | 0 (0.0%) |
| 12:00 PM to 3:59 PM | 20 (7.2%) | 40 (12.4%) |
| 4:00 PM to 11:59 PM | 6 (2.2%) | 12 (3.7%) |
| Total | 277 (100.0%) | 323 (100.0%) |
Housing Occupancy in South Windham
Occupancy by Ownership in South Windham
Of the total 518 dwellings in South Windham, owner-occupied units account for 349 (67.4%), while renter-occupied units make up 169 (32.6%).
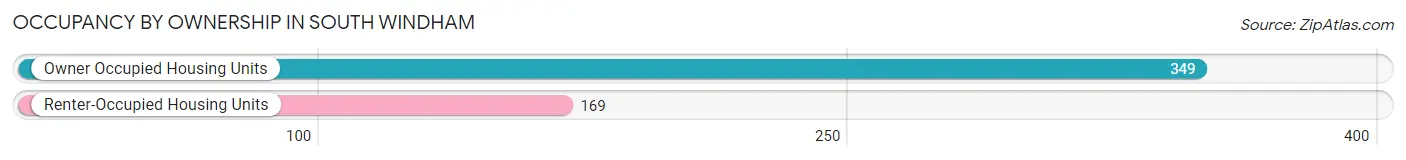
| Occupancy | # Housing Units | % Housing Units |
| Owner Occupied Housing Units | 349 | 67.4% |
| Renter-Occupied Housing Units | 169 | 32.6% |
| Total Occupied Housing Units | 518 | 100.0% |
Occupancy by Household Size in South Windham
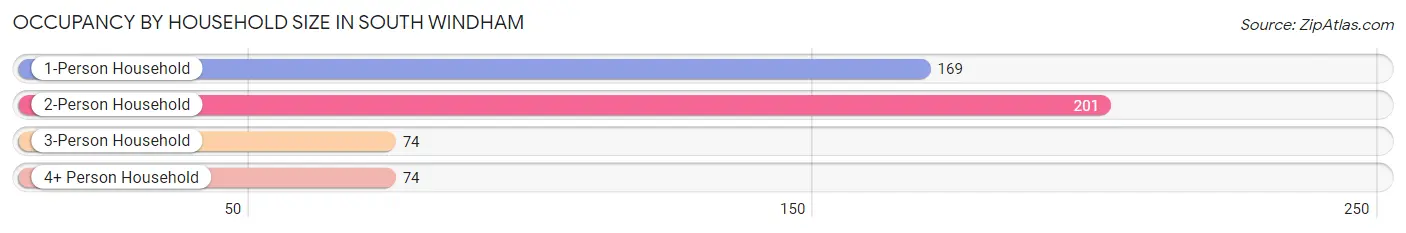
| Household Size | # Housing Units | % Housing Units |
| 1-Person Household | 169 | 32.6% |
| 2-Person Household | 201 | 38.8% |
| 3-Person Household | 74 | 14.3% |
| 4+ Person Household | 74 | 14.3% |
| Total Housing Units | 518 | 100.0% |
Occupancy by Ownership by Household Size in South Windham
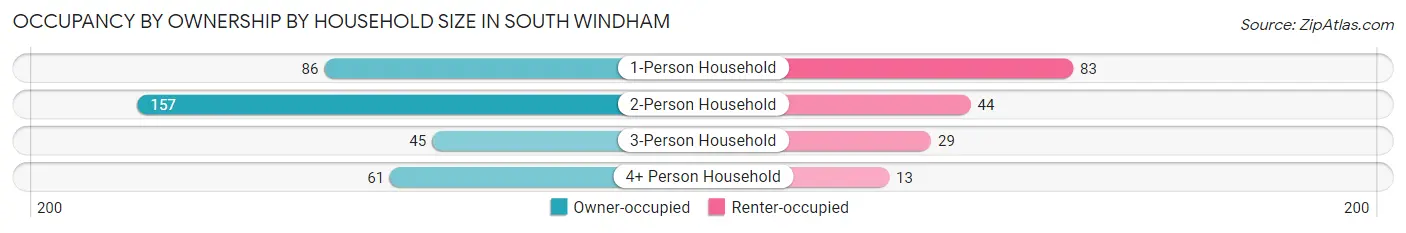
| Household Size | Owner-occupied | Renter-occupied |
| 1-Person Household | 86 (50.9%) | 83 (49.1%) |
| 2-Person Household | 157 (78.1%) | 44 (21.9%) |
| 3-Person Household | 45 (60.8%) | 29 (39.2%) |
| 4+ Person Household | 61 (82.4%) | 13 (17.6%) |
| Total Housing Units | 349 (67.4%) | 169 (32.6%) |
Occupancy by Educational Attainment in South Windham
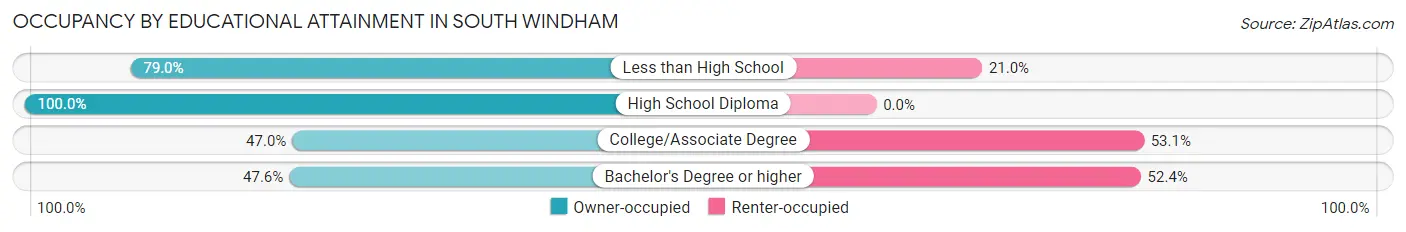
| Household Size | Owner-occupied | Renter-occupied |
| Less than High School | 49 (79.0%) | 13 (21.0%) |
| High School Diploma | 161 (100.0%) | 0 (0.0%) |
| College/Associate Degree | 100 (46.9%) | 113 (53.0%) |
| Bachelor's Degree or higher | 39 (47.6%) | 43 (52.4%) |
Occupancy by Age of Householder in South Windham
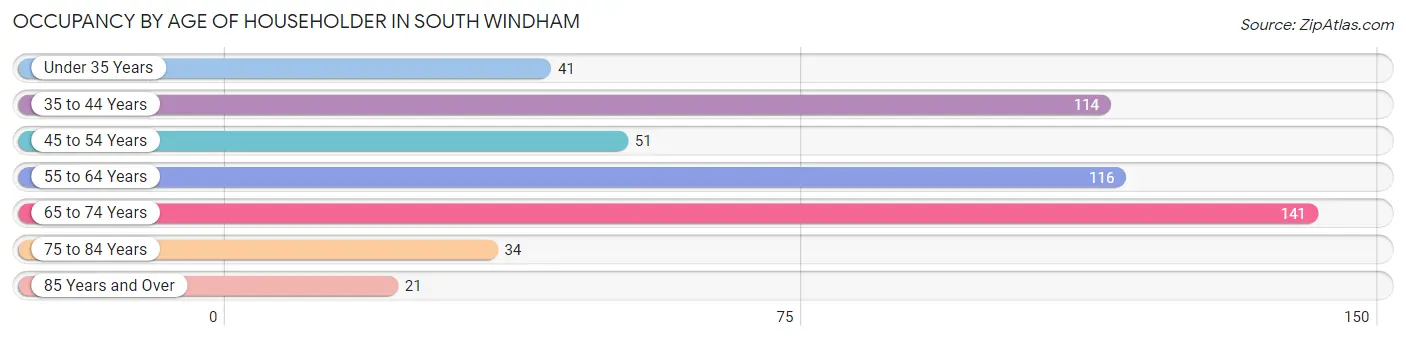
| Age Bracket | # Households | % Households |
| Under 35 Years | 41 | 7.9% |
| 35 to 44 Years | 114 | 22.0% |
| 45 to 54 Years | 51 | 9.9% |
| 55 to 64 Years | 116 | 22.4% |
| 65 to 74 Years | 141 | 27.2% |
| 75 to 84 Years | 34 | 6.6% |
| 85 Years and Over | 21 | 4.1% |
| Total | 518 | 100.0% |
Housing Finances in South Windham
Median Income by Occupancy in South Windham
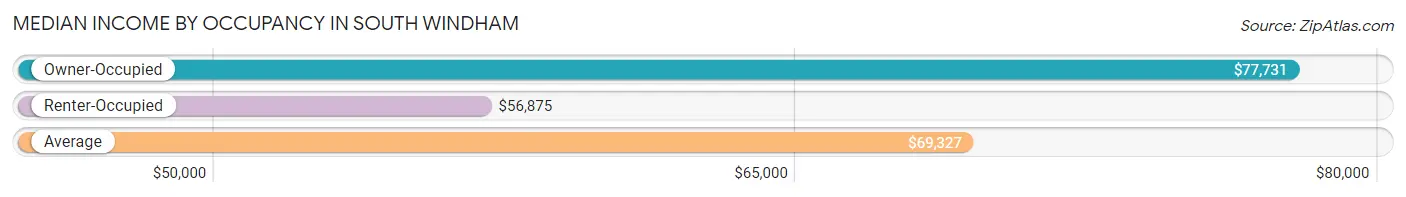
| Occupancy Type | # Households | Median Income |
| Owner-Occupied | 349 (67.4%) | $77,731 |
| Renter-Occupied | 169 (32.6%) | $56,875 |
| Average | 518 (100.0%) | $69,327 |
Occupancy by Householder Income Bracket in South Windham
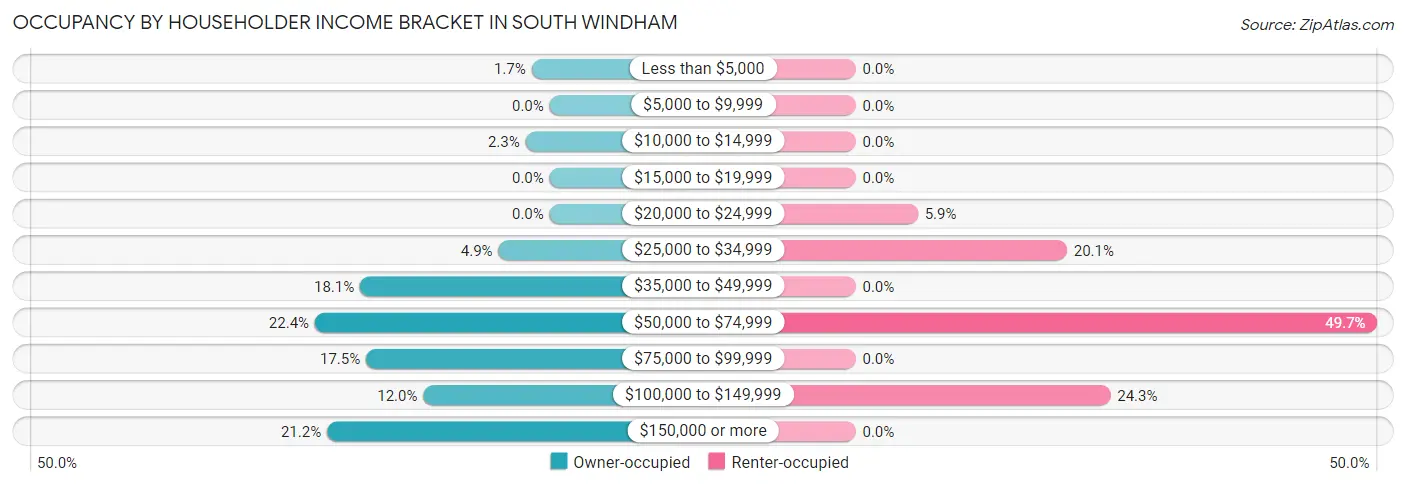
| Income Bracket | Owner-occupied | Renter-occupied |
| Less than $5,000 | 6 (1.7%) | 0 (0.0%) |
| $5,000 to $9,999 | 0 (0.0%) | 0 (0.0%) |
| $10,000 to $14,999 | 8 (2.3%) | 0 (0.0%) |
| $15,000 to $19,999 | 0 (0.0%) | 0 (0.0%) |
| $20,000 to $24,999 | 0 (0.0%) | 10 (5.9%) |
| $25,000 to $34,999 | 17 (4.9%) | 34 (20.1%) |
| $35,000 to $49,999 | 63 (18.0%) | 0 (0.0%) |
| $50,000 to $74,999 | 78 (22.4%) | 84 (49.7%) |
| $75,000 to $99,999 | 61 (17.5%) | 0 (0.0%) |
| $100,000 to $149,999 | 42 (12.0%) | 41 (24.3%) |
| $150,000 or more | 74 (21.2%) | 0 (0.0%) |
| Total | 349 (100.0%) | 169 (100.0%) |
Monthly Housing Cost Tiers in South Windham
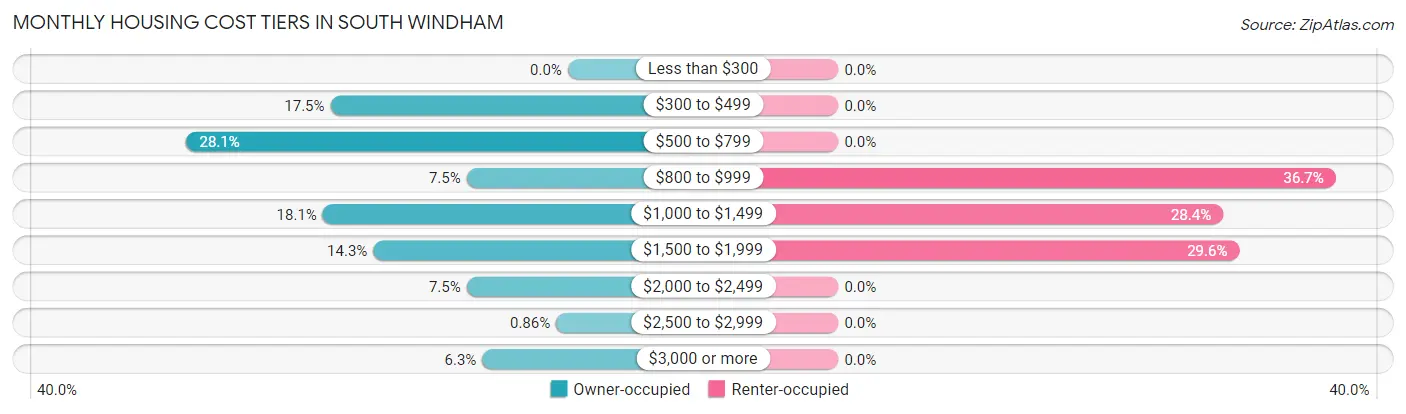
| Monthly Cost | Owner-occupied | Renter-occupied |
| Less than $300 | 0 (0.0%) | 0 (0.0%) |
| $300 to $499 | 61 (17.5%) | 0 (0.0%) |
| $500 to $799 | 98 (28.1%) | 0 (0.0%) |
| $800 to $999 | 26 (7.4%) | 62 (36.7%) |
| $1,000 to $1,499 | 63 (18.0%) | 48 (28.4%) |
| $1,500 to $1,999 | 50 (14.3%) | 50 (29.6%) |
| $2,000 to $2,499 | 26 (7.4%) | 0 (0.0%) |
| $2,500 to $2,999 | 3 (0.9%) | 0 (0.0%) |
| $3,000 or more | 22 (6.3%) | 0 (0.0%) |
| Total | 349 (100.0%) | 169 (100.0%) |
Physical Housing Characteristics in South Windham
Housing Structures in South Windham
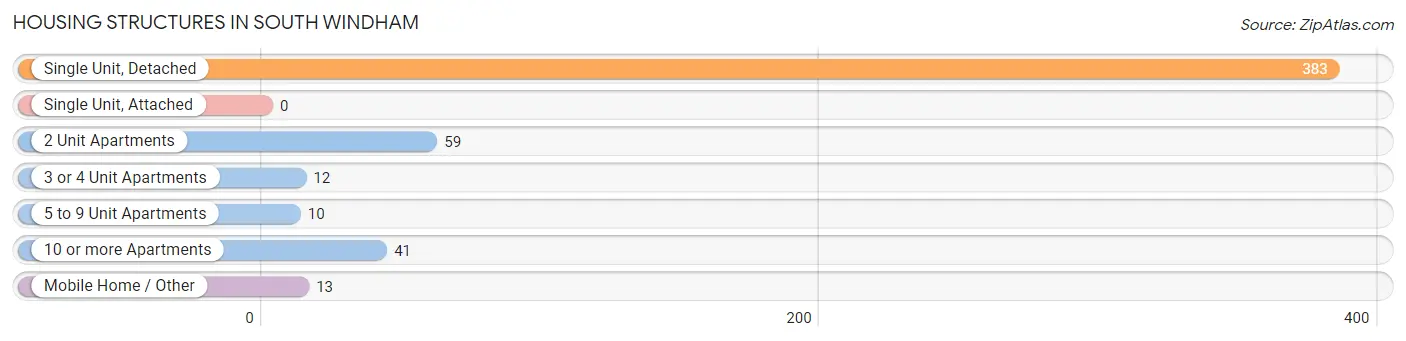
| Structure Type | # Housing Units | % Housing Units |
| Single Unit, Detached | 383 | 73.9% |
| Single Unit, Attached | 0 | 0.0% |
| 2 Unit Apartments | 59 | 11.4% |
| 3 or 4 Unit Apartments | 12 | 2.3% |
| 5 to 9 Unit Apartments | 10 | 1.9% |
| 10 or more Apartments | 41 | 7.9% |
| Mobile Home / Other | 13 | 2.5% |
| Total | 518 | 100.0% |
Housing Structures by Occupancy in South Windham
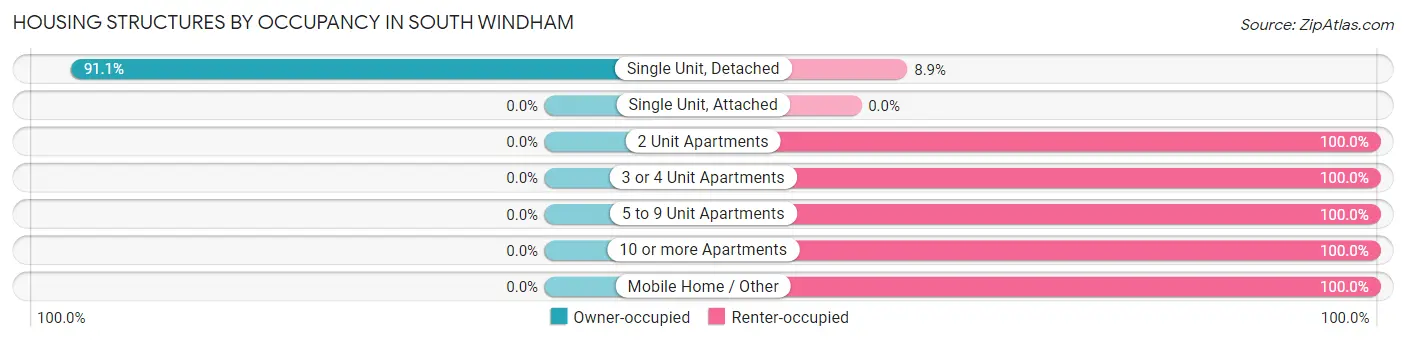
| Structure Type | Owner-occupied | Renter-occupied |
| Single Unit, Detached | 349 (91.1%) | 34 (8.9%) |
| Single Unit, Attached | 0 (0.0%) | 0 (0.0%) |
| 2 Unit Apartments | 0 (0.0%) | 59 (100.0%) |
| 3 or 4 Unit Apartments | 0 (0.0%) | 12 (100.0%) |
| 5 to 9 Unit Apartments | 0 (0.0%) | 10 (100.0%) |
| 10 or more Apartments | 0 (0.0%) | 41 (100.0%) |
| Mobile Home / Other | 0 (0.0%) | 13 (100.0%) |
| Total | 349 (67.4%) | 169 (32.6%) |
Housing Structures by Number of Rooms in South Windham
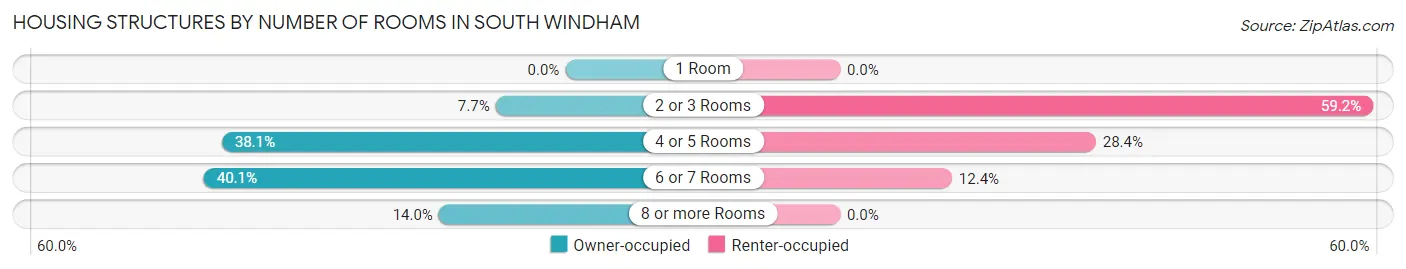
| Number of Rooms | Owner-occupied | Renter-occupied |
| 1 Room | 0 (0.0%) | 0 (0.0%) |
| 2 or 3 Rooms | 27 (7.7%) | 100 (59.2%) |
| 4 or 5 Rooms | 133 (38.1%) | 48 (28.4%) |
| 6 or 7 Rooms | 140 (40.1%) | 21 (12.4%) |
| 8 or more Rooms | 49 (14.0%) | 0 (0.0%) |
| Total | 349 (100.0%) | 169 (100.0%) |
Housing Structure by Heating Type in South Windham
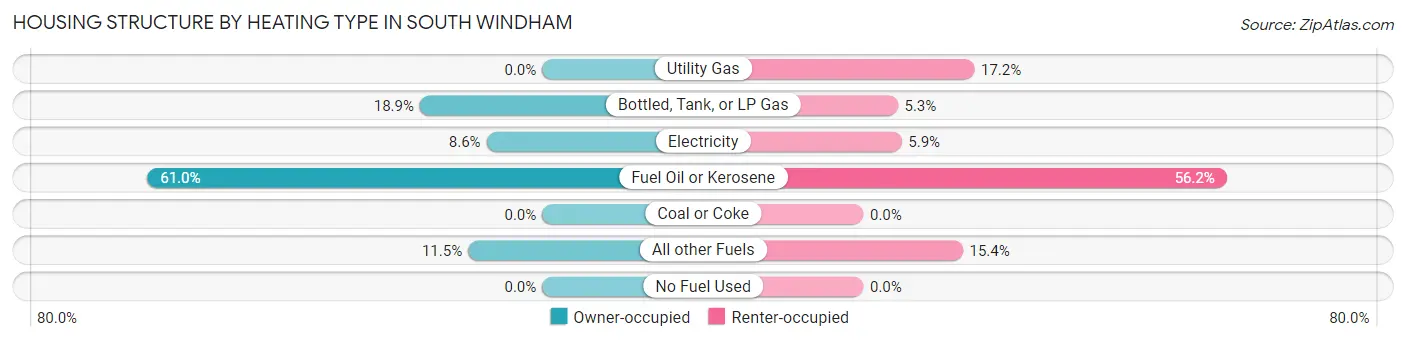
| Heating Type | Owner-occupied | Renter-occupied |
| Utility Gas | 0 (0.0%) | 29 (17.2%) |
| Bottled, Tank, or LP Gas | 66 (18.9%) | 9 (5.3%) |
| Electricity | 30 (8.6%) | 10 (5.9%) |
| Fuel Oil or Kerosene | 213 (61.0%) | 95 (56.2%) |
| Coal or Coke | 0 (0.0%) | 0 (0.0%) |
| All other Fuels | 40 (11.5%) | 26 (15.4%) |
| No Fuel Used | 0 (0.0%) | 0 (0.0%) |
| Total | 349 (100.0%) | 169 (100.0%) |
Household Vehicle Usage in South Windham
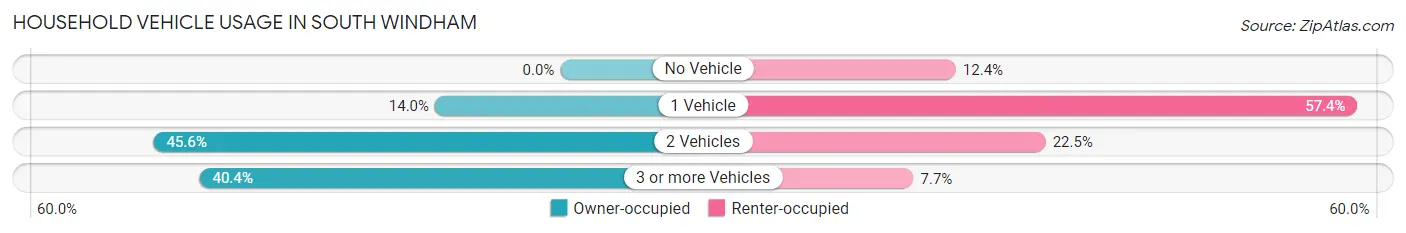
| Vehicles per Household | Owner-occupied | Renter-occupied |
| No Vehicle | 0 (0.0%) | 21 (12.4%) |
| 1 Vehicle | 49 (14.0%) | 97 (57.4%) |
| 2 Vehicles | 159 (45.6%) | 38 (22.5%) |
| 3 or more Vehicles | 141 (40.4%) | 13 (7.7%) |
| Total | 349 (100.0%) | 169 (100.0%) |
Real Estate & Mortgages in South Windham
Real Estate and Mortgage Overview in South Windham
| Characteristic | Without Mortgage | With Mortgage |
| Housing Units | 198 | 151 |
| Median Property Value | $124,400 | $223,200 |
| Median Household Income | $62,821 | $62 |
| Monthly Housing Costs | $621 | $22 |
| Real Estate Taxes | $4,031 | $0 |
Property Value by Mortgage Status in South Windham
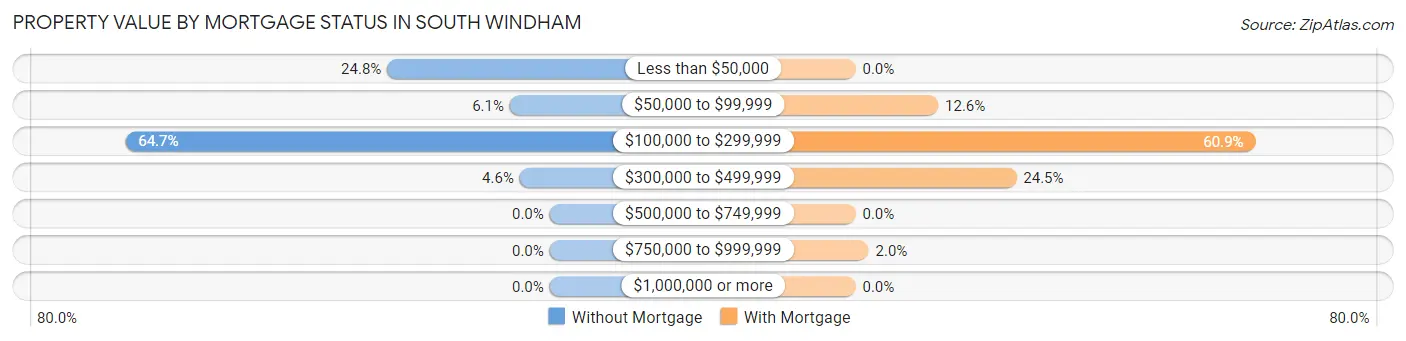
| Property Value | Without Mortgage | With Mortgage |
| Less than $50,000 | 49 (24.7%) | 0 (0.0%) |
| $50,000 to $99,999 | 12 (6.1%) | 19 (12.6%) |
| $100,000 to $299,999 | 128 (64.6%) | 92 (60.9%) |
| $300,000 to $499,999 | 9 (4.5%) | 37 (24.5%) |
| $500,000 to $749,999 | 0 (0.0%) | 0 (0.0%) |
| $750,000 to $999,999 | 0 (0.0%) | 3 (2.0%) |
| $1,000,000 or more | 0 (0.0%) | 0 (0.0%) |
| Total | 198 (100.0%) | 151 (100.0%) |
Household Income by Mortgage Status in South Windham
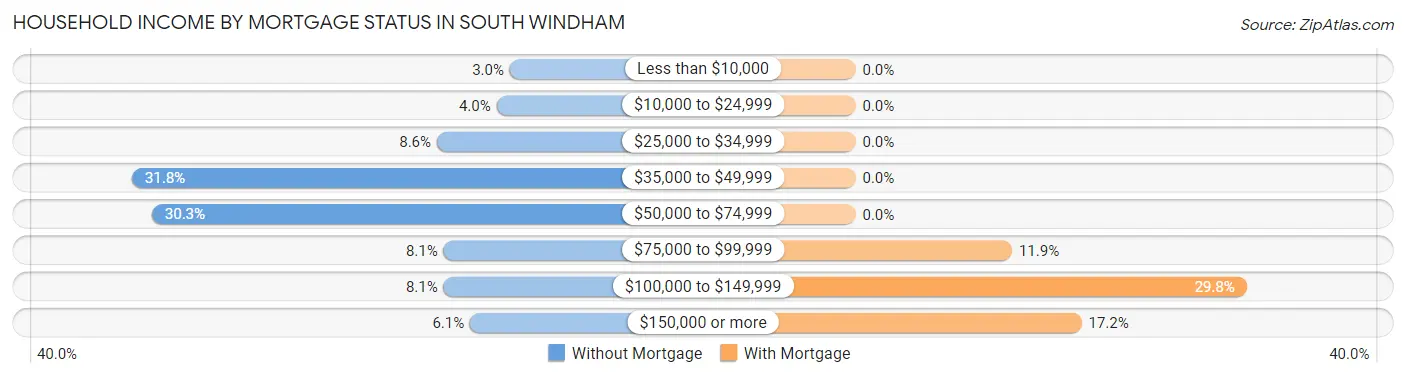
| Household Income | Without Mortgage | With Mortgage |
| Less than $10,000 | 6 (3.0%) | 0 (0.0%) |
| $10,000 to $24,999 | 8 (4.0%) | 0 (0.0%) |
| $25,000 to $34,999 | 17 (8.6%) | 0 (0.0%) |
| $35,000 to $49,999 | 63 (31.8%) | 0 (0.0%) |
| $50,000 to $74,999 | 60 (30.3%) | 0 (0.0%) |
| $75,000 to $99,999 | 16 (8.1%) | 18 (11.9%) |
| $100,000 to $149,999 | 16 (8.1%) | 45 (29.8%) |
| $150,000 or more | 12 (6.1%) | 26 (17.2%) |
| Total | 198 (100.0%) | 151 (100.0%) |
Property Value to Household Income Ratio in South Windham
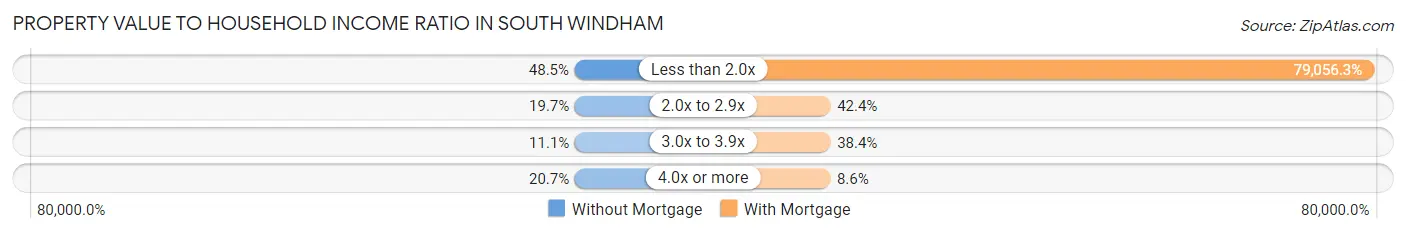
| Value-to-Income Ratio | Without Mortgage | With Mortgage |
| Less than 2.0x | 96 (48.5%) | 119,375 (79,056.3%) |
| 2.0x to 2.9x | 39 (19.7%) | 64 (42.4%) |
| 3.0x to 3.9x | 22 (11.1%) | 58 (38.4%) |
| 4.0x or more | 41 (20.7%) | 13 (8.6%) |
| Total | 198 (100.0%) | 151 (100.0%) |
Real Estate Taxes by Mortgage Status in South Windham
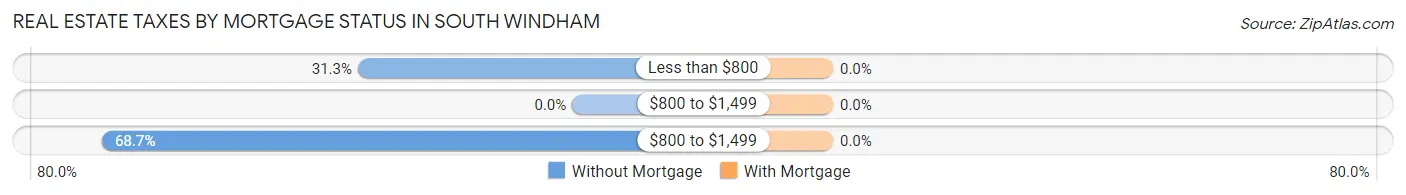
| Property Taxes | Without Mortgage | With Mortgage |
| Less than $800 | 62 (31.3%) | 0 (0.0%) |
| $800 to $1,499 | 0 (0.0%) | 0 (0.0%) |
| $800 to $1,499 | 136 (68.7%) | 0 (0.0%) |
| Total | 198 (100.0%) | 151 (100.0%) |
Health & Disability in South Windham
Health Insurance Coverage by Age in South Windham
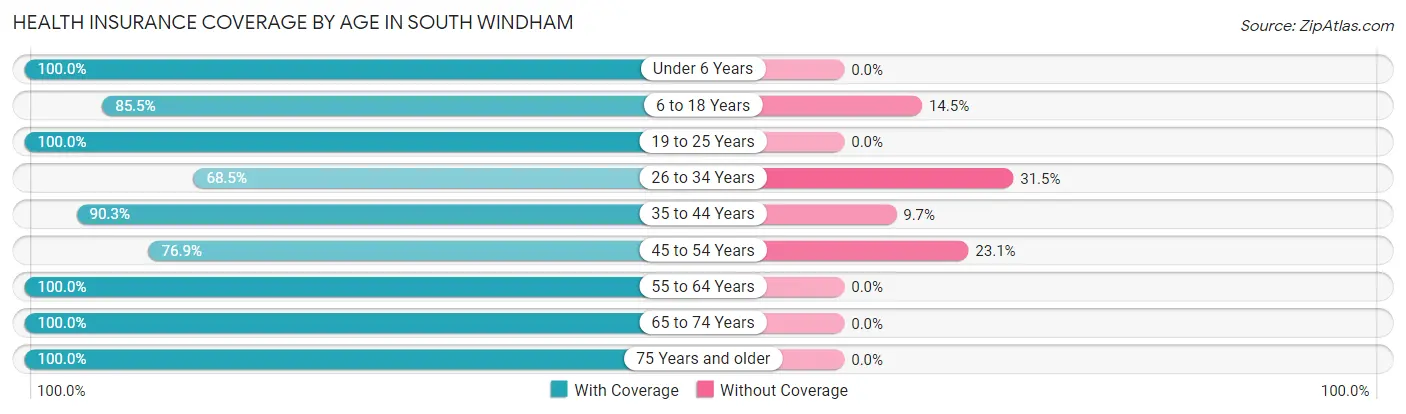
| Age Bracket | With Coverage | Without Coverage |
| Under 6 Years | 92 (100.0%) | 0 (0.0%) |
| 6 to 18 Years | 295 (85.5%) | 50 (14.5%) |
| 19 to 25 Years | 80 (100.0%) | 0 (0.0%) |
| 26 to 34 Years | 50 (68.5%) | 23 (31.5%) |
| 35 to 44 Years | 177 (90.3%) | 19 (9.7%) |
| 45 to 54 Years | 93 (76.9%) | 28 (23.1%) |
| 55 to 64 Years | 175 (100.0%) | 0 (0.0%) |
| 65 to 74 Years | 246 (100.0%) | 0 (0.0%) |
| 75 Years and older | 83 (100.0%) | 0 (0.0%) |
| Total | 1,291 (91.5%) | 120 (8.5%) |
Health Insurance Coverage by Citizenship Status in South Windham
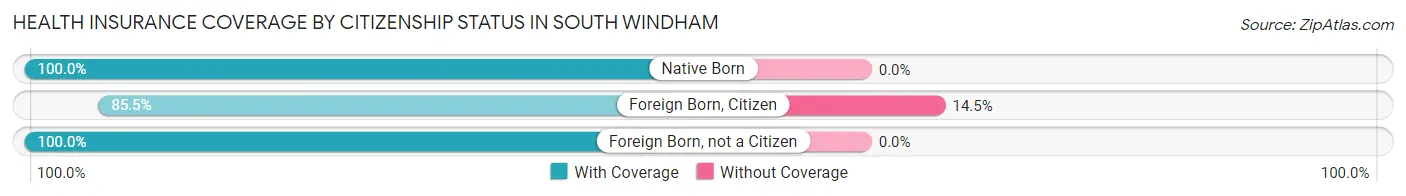
| Citizenship Status | With Coverage | Without Coverage |
| Native Born | 92 (100.0%) | 0 (0.0%) |
| Foreign Born, Citizen | 295 (85.5%) | 50 (14.5%) |
| Foreign Born, not a Citizen | 80 (100.0%) | 0 (0.0%) |
Health Insurance Coverage by Household Income in South Windham
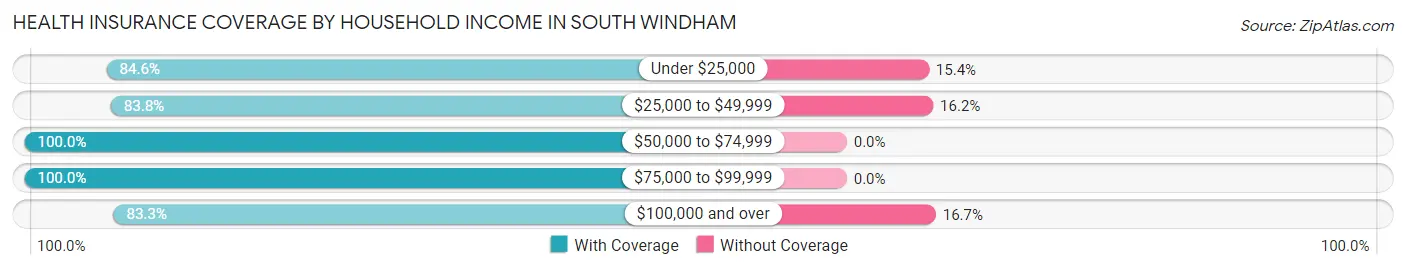
| Household Income | With Coverage | Without Coverage |
| Under $25,000 | 33 (84.6%) | 6 (15.4%) |
| $25,000 to $49,999 | 145 (83.8%) | 28 (16.2%) |
| $50,000 to $74,999 | 554 (100.0%) | 0 (0.0%) |
| $75,000 to $99,999 | 108 (100.0%) | 0 (0.0%) |
| $100,000 and over | 430 (83.3%) | 86 (16.7%) |
Public vs Private Health Insurance Coverage by Age in South Windham
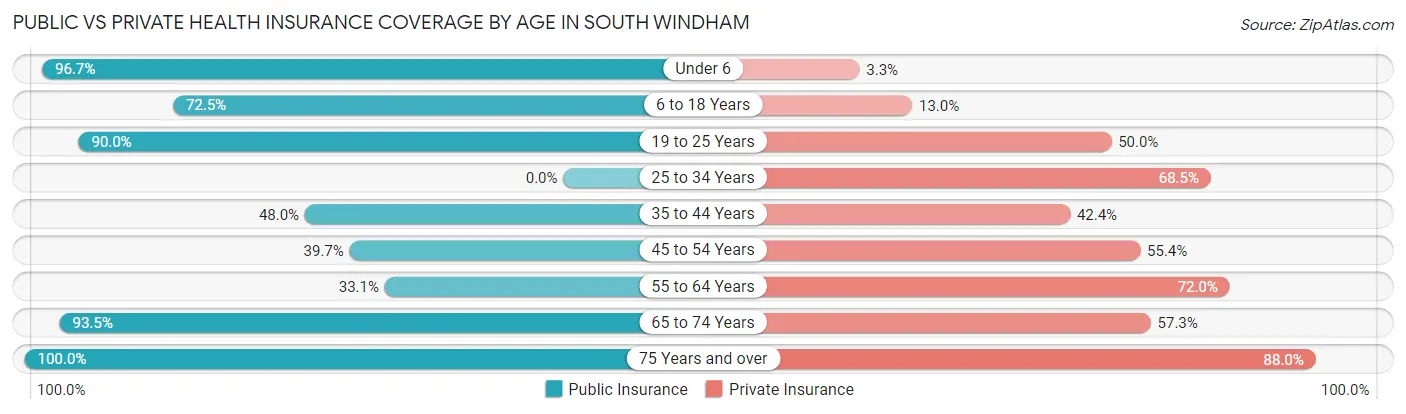
| Age Bracket | Public Insurance | Private Insurance |
| Under 6 | 89 (96.7%) | 3 (3.3%) |
| 6 to 18 Years | 250 (72.5%) | 45 (13.0%) |
| 19 to 25 Years | 72 (90.0%) | 40 (50.0%) |
| 25 to 34 Years | 0 (0.0%) | 50 (68.5%) |
| 35 to 44 Years | 94 (48.0%) | 83 (42.3%) |
| 45 to 54 Years | 48 (39.7%) | 67 (55.4%) |
| 55 to 64 Years | 58 (33.1%) | 126 (72.0%) |
| 65 to 74 Years | 230 (93.5%) | 141 (57.3%) |
| 75 Years and over | 83 (100.0%) | 73 (87.9%) |
| Total | 924 (65.5%) | 628 (44.5%) |
Disability Status by Sex by Age in South Windham
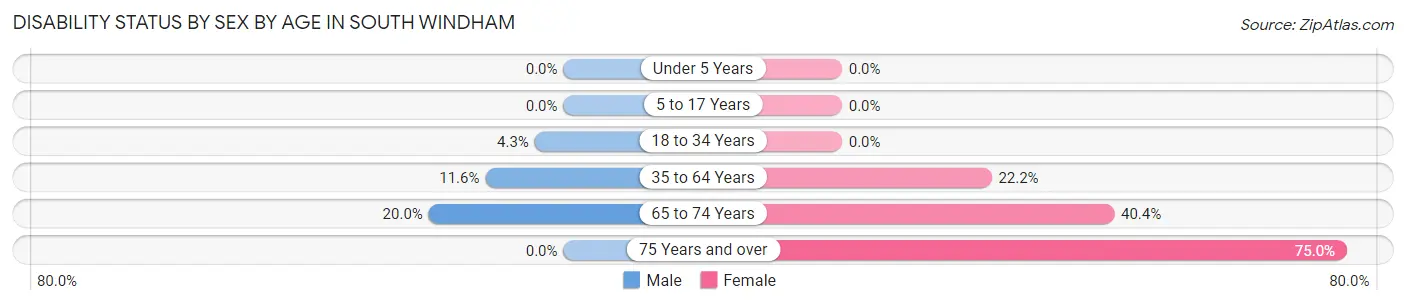
| Age Bracket | Male | Female |
| Under 5 Years | 0 (0.0%) | 0 (0.0%) |
| 5 to 17 Years | 0 (0.0%) | 0 (0.0%) |
| 18 to 34 Years | 2 (4.3%) | 0 (0.0%) |
| 35 to 64 Years | 32 (11.6%) | 48 (22.2%) |
| 65 to 74 Years | 21 (20.0%) | 57 (40.4%) |
| 75 Years and over | 0 (0.0%) | 30 (75.0%) |
Disability Class by Sex by Age in South Windham
Disability Class: Hearing Difficulty
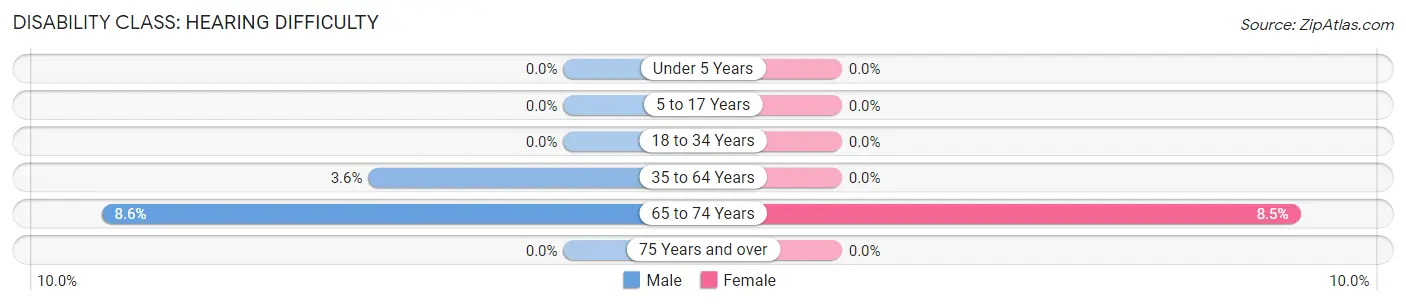
| Age Bracket | Male | Female |
| Under 5 Years | 0 (0.0%) | 0 (0.0%) |
| 5 to 17 Years | 0 (0.0%) | 0 (0.0%) |
| 18 to 34 Years | 0 (0.0%) | 0 (0.0%) |
| 35 to 64 Years | 10 (3.6%) | 0 (0.0%) |
| 65 to 74 Years | 9 (8.6%) | 12 (8.5%) |
| 75 Years and over | 0 (0.0%) | 0 (0.0%) |
Disability Class: Vision Difficulty
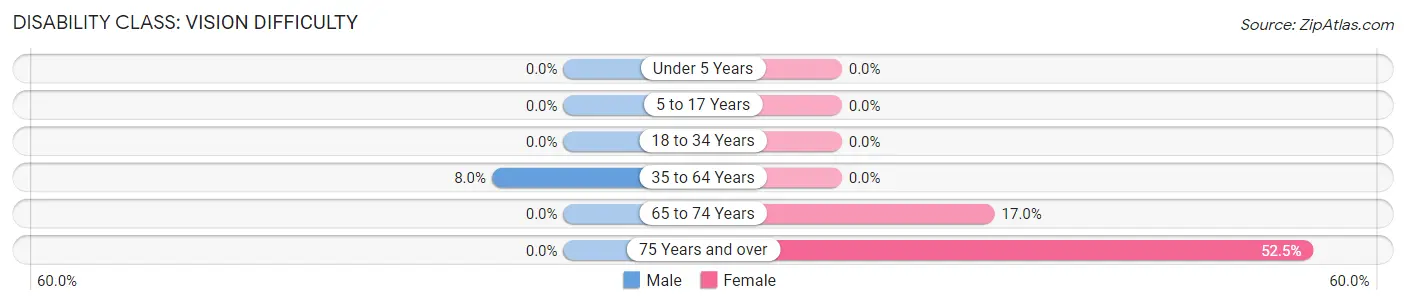
| Age Bracket | Male | Female |
| Under 5 Years | 0 (0.0%) | 0 (0.0%) |
| 5 to 17 Years | 0 (0.0%) | 0 (0.0%) |
| 18 to 34 Years | 0 (0.0%) | 0 (0.0%) |
| 35 to 64 Years | 22 (8.0%) | 0 (0.0%) |
| 65 to 74 Years | 0 (0.0%) | 24 (17.0%) |
| 75 Years and over | 0 (0.0%) | 21 (52.5%) |
Disability Class: Cognitive Difficulty
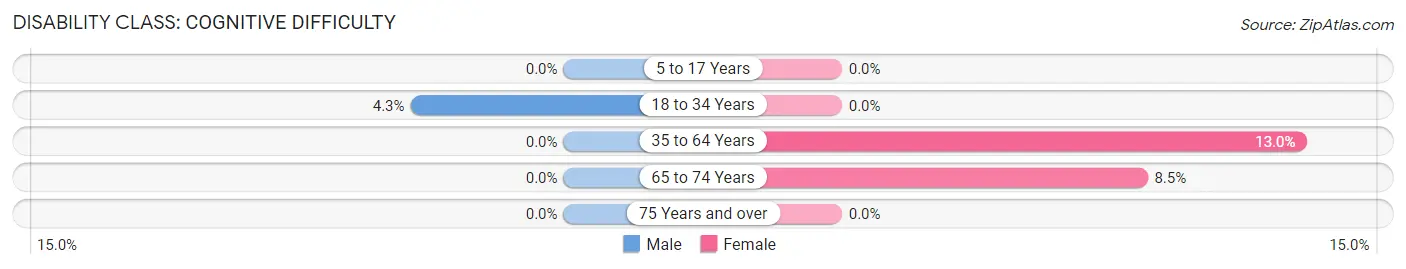
| Age Bracket | Male | Female |
| 5 to 17 Years | 0 (0.0%) | 0 (0.0%) |
| 18 to 34 Years | 2 (4.3%) | 0 (0.0%) |
| 35 to 64 Years | 0 (0.0%) | 28 (13.0%) |
| 65 to 74 Years | 0 (0.0%) | 12 (8.5%) |
| 75 Years and over | 0 (0.0%) | 0 (0.0%) |
Disability Class: Ambulatory Difficulty
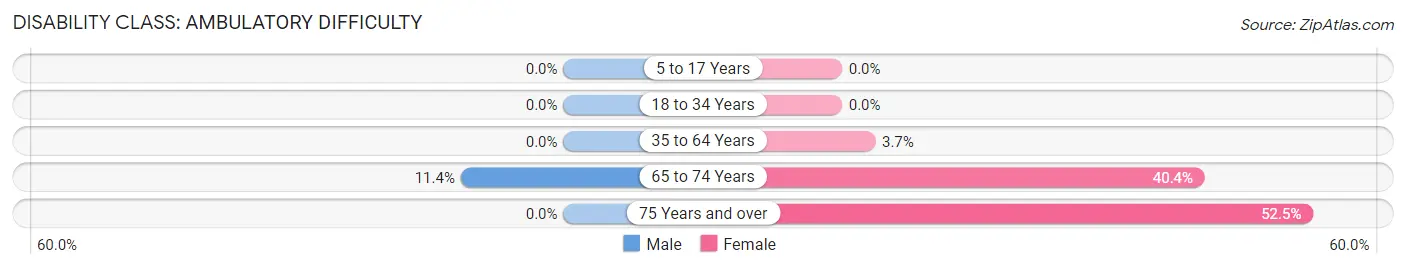
| Age Bracket | Male | Female |
| 5 to 17 Years | 0 (0.0%) | 0 (0.0%) |
| 18 to 34 Years | 0 (0.0%) | 0 (0.0%) |
| 35 to 64 Years | 0 (0.0%) | 8 (3.7%) |
| 65 to 74 Years | 12 (11.4%) | 57 (40.4%) |
| 75 Years and over | 0 (0.0%) | 21 (52.5%) |
Disability Class: Self-Care Difficulty
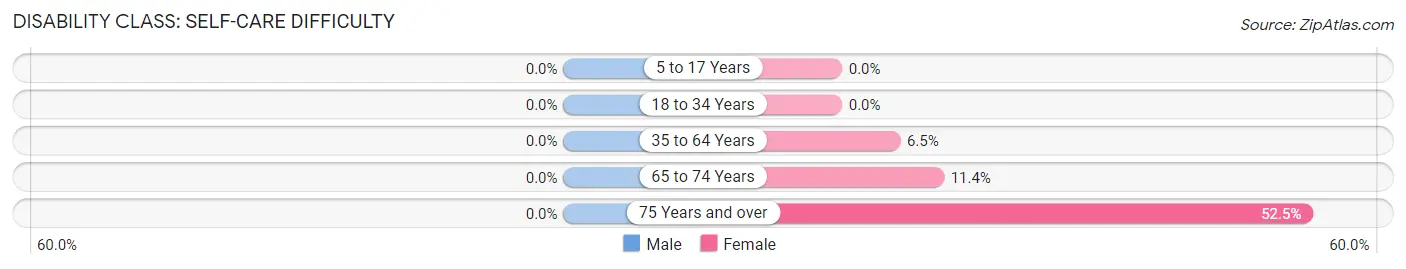
| Age Bracket | Male | Female |
| 5 to 17 Years | 0 (0.0%) | 0 (0.0%) |
| 18 to 34 Years | 0 (0.0%) | 0 (0.0%) |
| 35 to 64 Years | 0 (0.0%) | 14 (6.5%) |
| 65 to 74 Years | 0 (0.0%) | 16 (11.4%) |
| 75 Years and over | 0 (0.0%) | 21 (52.5%) |
Technology Access in South Windham
Computing Device Access in South Windham
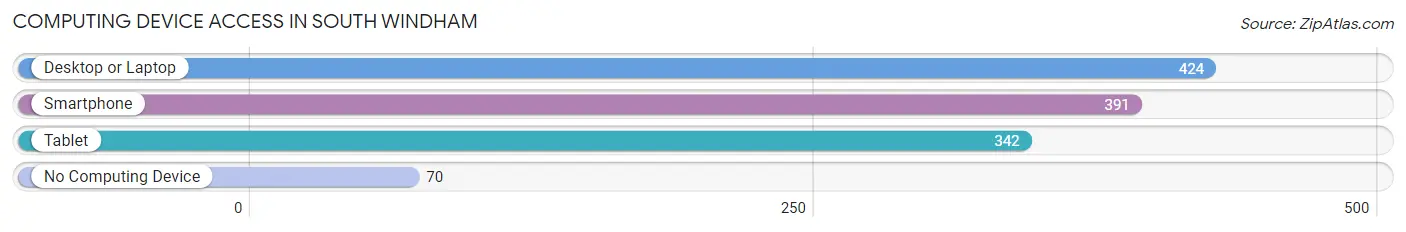
| Device Type | # Households | % Households |
| Desktop or Laptop | 424 | 81.9% |
| Smartphone | 391 | 75.5% |
| Tablet | 342 | 66.0% |
| No Computing Device | 70 | 13.5% |
| Total | 518 | 100.0% |
Internet Access in South Windham
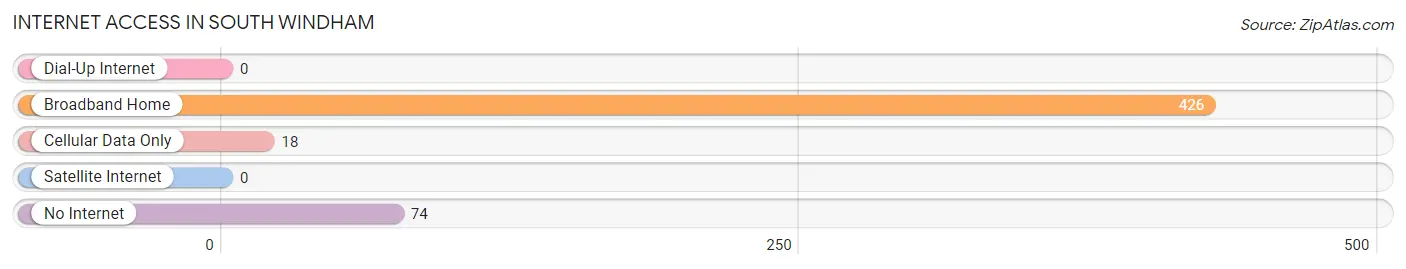
| Internet Type | # Households | % Households |
| Dial-Up Internet | 0 | 0.0% |
| Broadband Home | 426 | 82.2% |
| Cellular Data Only | 18 | 3.5% |
| Satellite Internet | 0 | 0.0% |
| No Internet | 74 | 14.3% |
| Total | 518 | 100.0% |
South Windham Summary
History
South Windham is a small town located in Windham County, Connecticut. It is situated in the northeastern corner of the state, just south of the Massachusetts border. The town was originally part of the town of Windham, which was established in 1726. In 1807, the town of South Windham was incorporated as a separate town.
The town was originally a farming community, with many of the residents working in the local mills. The town was also home to a number of small businesses, including a blacksmith, a tannery, and a sawmill. The town was also home to a number of churches, including the Congregational Church, the Methodist Church, and the Baptist Church.
In the late 19th century, the town began to experience a period of growth and development. The town was home to a number of factories, including a cotton mill, a paper mill, and a woolen mill. The town also had a number of stores, including a general store, a drug store, and a hardware store.
The town experienced a period of decline in the early 20th century, as many of the factories closed and the population began to decline. The town was also affected by the Great Depression, as many of the businesses closed and the population continued to decline.
In the late 20th century, the town began to experience a period of revitalization. The town was home to a number of new businesses, including a grocery store, a hardware store, and a restaurant. The town also had a number of new housing developments, which helped to attract new residents to the area.
Geography
South Windham is located in the northeastern corner of Connecticut, just south of the Massachusetts border. The town is situated in the foothills of the Berkshires, and is bordered by the towns of Windham, Scotland, and Hampton. The town is located in the Quinebaug River Valley, and is home to a number of small streams and ponds.
The town has a total area of 8.3 square miles, of which 8.2 square miles is land and 0.1 square miles is water. The town is located in a hilly region, with elevations ranging from 200 to 500 feet above sea level. The town is home to a number of small parks and recreational areas, including the South Windham Recreation Area and the South Windham Nature Preserve.
Economy
The economy of South Windham is largely based on agriculture and tourism. The town is home to a number of small farms, which produce a variety of crops, including corn, hay, and vegetables. The town is also home to a number of small businesses, including restaurants, stores, and service providers.
The town is also home to a number of tourist attractions, including the South Windham Recreation Area and the South Windham Nature Preserve. The town is also home to a number of historic sites, including the South Windham Congregational Church and the South Windham Methodist Church.
Demographics
As of the 2010 census, the town had a population of 2,845. The racial makeup of the town was 94.3% White, 1.2% African American, 0.3% Native American, 0.7% Asian, 0.1% Pacific Islander, 1.2% from other races, and 2.3% from two or more races. Hispanic or Latino of any race were 3.2% of the population.
The median income for a household in the town was $50,938, and the median income for a family was $60,938. The per capita income for the town was $25,938. About 5.3% of families and 7.2% of the population were below the poverty line, including 8.3% of those under age 18 and 5.2% of those age 65 or over.
Common Questions
What is Per Capita Income in South Windham?
Per Capita income in South Windham is $34,225.
What is the Median Family Income in South Windham?
Median Family Income in South Windham is $81,094.
What is the Median Household income in South Windham?
Median Household Income in South Windham is $69,327.
What is Income or Wage Gap in South Windham?
Income or Wage Gap in South Windham is 39.4%.
Women in South Windham earn 60.6 cents for every dollar earned by a man.
What is Inequality or Gini Index in South Windham?
Inequality or Gini Index in South Windham is 0.37.
What is the Total Population of South Windham?
Total Population of South Windham is 1,412.
What is the Total Male Population of South Windham?
Total Male Population of South Windham is 723.
What is the Total Female Population of South Windham?
Total Female Population of South Windham is 689.
What is the Ratio of Males per 100 Females in South Windham?
There are 104.93 Males per 100 Females in South Windham.
What is the Ratio of Females per 100 Males in South Windham?
There are 95.30 Females per 100 Males in South Windham.
What is the Median Population Age in South Windham?
Median Population Age in South Windham is 40.1 Years.
What is the Average Family Size in South Windham
Average Family Size in South Windham is 3.6 People.
What is the Average Household Size in South Windham
Average Household Size in South Windham is 2.7 People.
How Large is the Labor Force in South Windham?
There are 655 People in the Labor Forcein in South Windham.
What is the Percentage of People in the Labor Force in South Windham?
62.6% of People are in the Labor Force in South Windham.
What is the Unemployment Rate in South Windham?
Unemployment Rate in South Windham is 1.2%.