Cos Cob, CT Map & Demographics
Cos Cob Map
Cos Cob Overview
$93,314
PER CAPITA INCOME
$209,913
AVG FAMILY INCOME
$185,125
AVG HOUSEHOLD INCOME
31.8%
WAGE / INCOME GAP [ % ]
68.2¢/ $1
WAGE / INCOME GAP [ $ ]
0.49
INEQUALITY / GINI INDEX
7,243
TOTAL POPULATION
3,462
MALE POPULATION
3,781
FEMALE POPULATION
91.56
MALES / 100 FEMALES
109.21
FEMALES / 100 MALES
39.7
MEDIAN AGE
3.2
AVG FAMILY SIZE
2.8
AVG HOUSEHOLD SIZE
3,963
LABOR FORCE [ PEOPLE ]
70.7%
PERCENT IN LABOR FORCE
6.3%
UNEMPLOYMENT RATE
Cos Cob Zip Codes
Cos Cob Area Codes
Income in Cos Cob
Income Overview in Cos Cob
Per Capita Income in Cos Cob is $93,314, while median incomes of families and households are $209,913 and $185,125 respectively.
| Characteristic | Number | Measure |
| Per Capita Income | 7,243 | $93,314 |
| Median Family Income | 2,013 | $209,913 |
| Mean Family Income | 2,013 | $294,217 |
| Median Household Income | 2,553 | $185,125 |
| Mean Household Income | 2,553 | $261,845 |
| Income Deficit | 2,013 | $0 |
| Wage / Income Gap (%) | 7,243 | 31.85% |
| Wage / Income Gap ($) | 7,243 | 68.15¢ per $1 |
| Gini / Inequality Index | 7,243 | 0.49 |
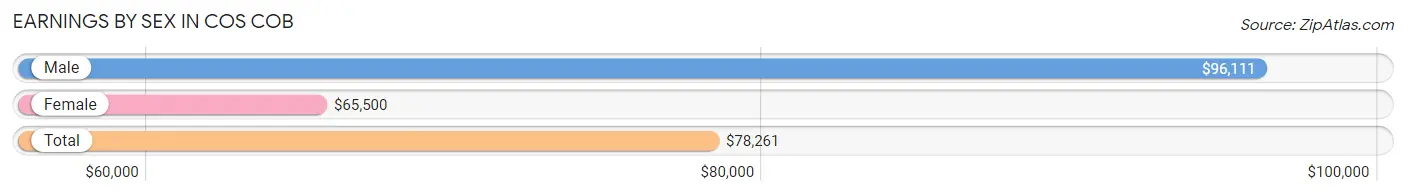
Earnings by Sex in Cos Cob
Average Earnings in Cos Cob are $78,261, $96,111 for men and $65,500 for women, a difference of 31.9%.
| Sex | Number | Average Earnings |
| Male | 2,196 (54.0%) | $96,111 |
| Female | 1,872 (46.0%) | $65,500 |
| Total | 4,068 (100.0%) | $78,261 |
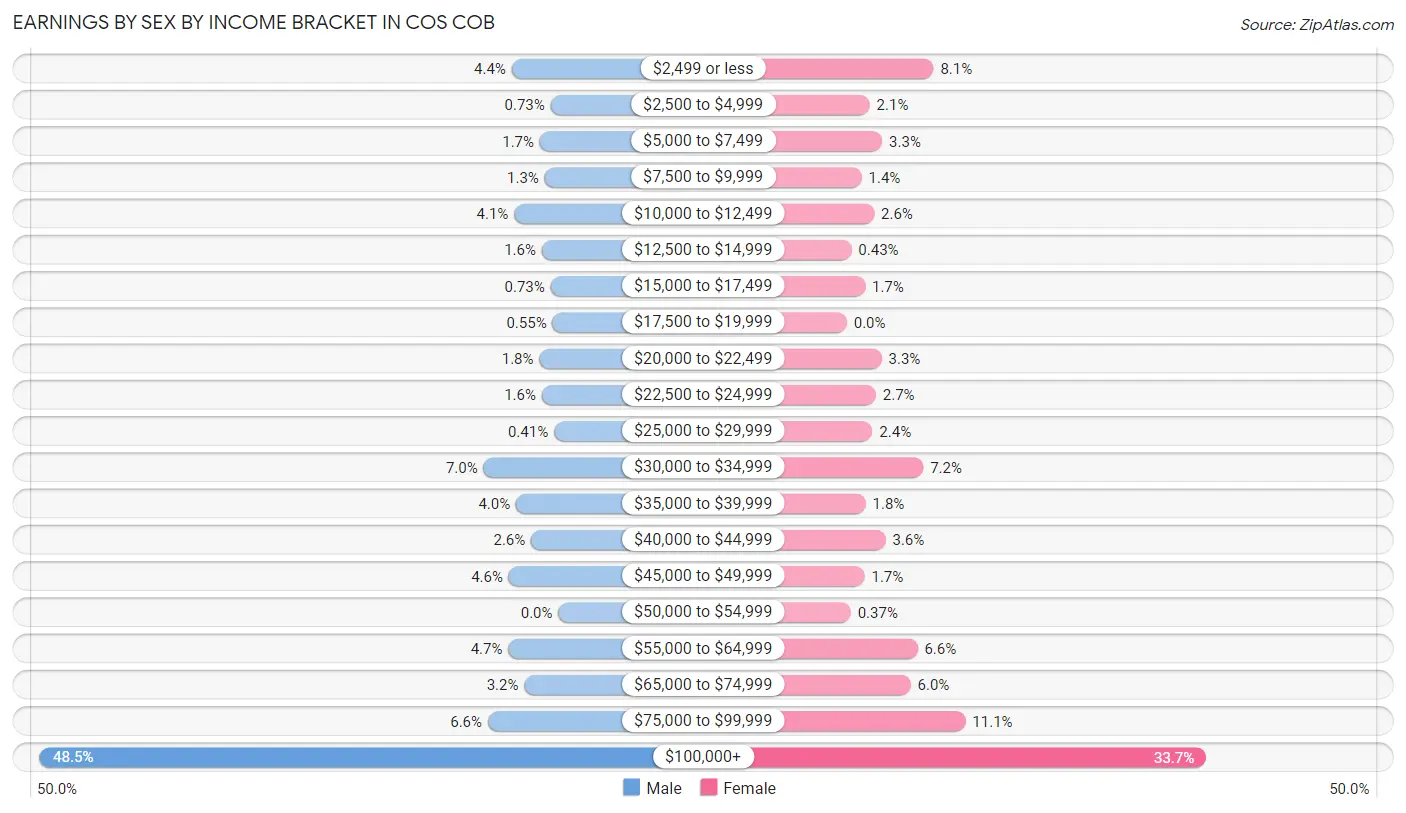
Earnings by Sex by Income Bracket in Cos Cob
The most common earnings brackets in Cos Cob are $100,000+ for men (1,066 | 48.5%) and $100,000+ for women (630 | 33.7%).
| Income | Male | Female |
| $2,499 or less | 96 (4.4%) | 152 (8.1%) |
| $2,500 to $4,999 | 16 (0.7%) | 40 (2.1%) |
| $5,000 to $7,499 | 38 (1.7%) | 62 (3.3%) |
| $7,500 to $9,999 | 28 (1.3%) | 26 (1.4%) |
| $10,000 to $12,499 | 91 (4.1%) | 48 (2.6%) |
| $12,500 to $14,999 | 34 (1.5%) | 8 (0.4%) |
| $15,000 to $17,499 | 16 (0.7%) | 32 (1.7%) |
| $17,500 to $19,999 | 12 (0.5%) | 0 (0.0%) |
| $20,000 to $22,499 | 39 (1.8%) | 61 (3.3%) |
| $22,500 to $24,999 | 34 (1.5%) | 51 (2.7%) |
| $25,000 to $29,999 | 9 (0.4%) | 45 (2.4%) |
| $30,000 to $34,999 | 154 (7.0%) | 134 (7.2%) |
| $35,000 to $39,999 | 87 (4.0%) | 33 (1.8%) |
| $40,000 to $44,999 | 56 (2.5%) | 68 (3.6%) |
| $45,000 to $49,999 | 102 (4.6%) | 31 (1.7%) |
| $50,000 to $54,999 | 0 (0.0%) | 7 (0.4%) |
| $55,000 to $64,999 | 103 (4.7%) | 124 (6.6%) |
| $65,000 to $74,999 | 70 (3.2%) | 112 (6.0%) |
| $75,000 to $99,999 | 145 (6.6%) | 208 (11.1%) |
| $100,000+ | 1,066 (48.5%) | 630 (33.7%) |
| Total | 2,196 (100.0%) | 1,872 (100.0%) |
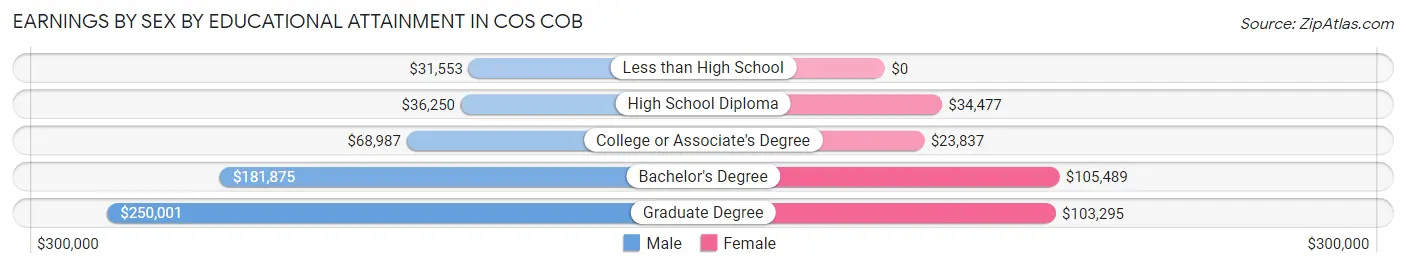
Earnings by Sex by Educational Attainment in Cos Cob
Average earnings in Cos Cob are $122,857 for men and $80,185 for women, a difference of 34.7%. Men with an educational attainment of graduate degree enjoy the highest average annual earnings of $250,001, while those with less than high school education earn the least with $31,553. Women with an educational attainment of bachelor's degree earn the most with the average annual earnings of $105,489, while those with college or associate's degree education have the smallest earnings of $23,837.
| Educational Attainment | Male Income | Female Income |
| Less than High School | $31,553 | $0 |
| High School Diploma | $36,250 | $34,477 |
| College or Associate's Degree | $68,987 | $23,837 |
| Bachelor's Degree | $181,875 | $105,489 |
| Graduate Degree | $250,001 | $103,295 |
| Total | $122,857 | $80,185 |
Family Income in Cos Cob
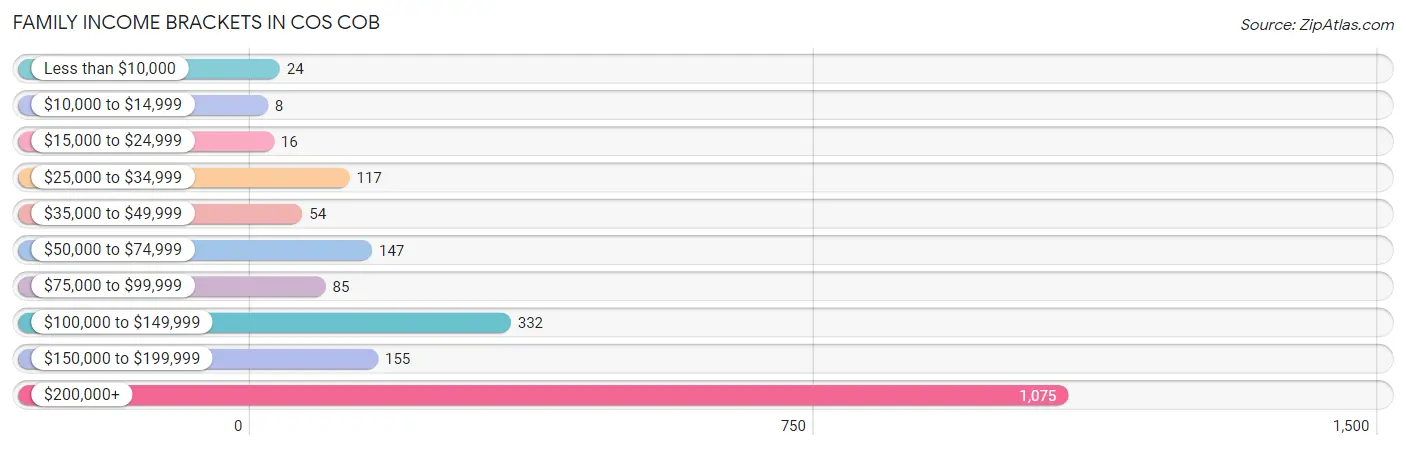
Family Income Brackets in Cos Cob
According to the Cos Cob family income data, there are 1,075 families falling into the $200,000+ income range, which is the most common income bracket and makes up 53.4% of all families. Conversely, the $10,000 to $14,999 income bracket is the least frequent group with only 8 families (0.4%) belonging to this category.
| Income Bracket | # Families | % Families |
| Less than $10,000 | 24 | 1.2% |
| $10,000 to $14,999 | 8 | 0.4% |
| $15,000 to $24,999 | 16 | 0.8% |
| $25,000 to $34,999 | 117 | 5.8% |
| $35,000 to $49,999 | 54 | 2.7% |
| $50,000 to $74,999 | 147 | 7.3% |
| $75,000 to $99,999 | 85 | 4.2% |
| $100,000 to $149,999 | 332 | 16.5% |
| $150,000 to $199,999 | 155 | 7.7% |
| $200,000+ | 1,075 | 53.4% |
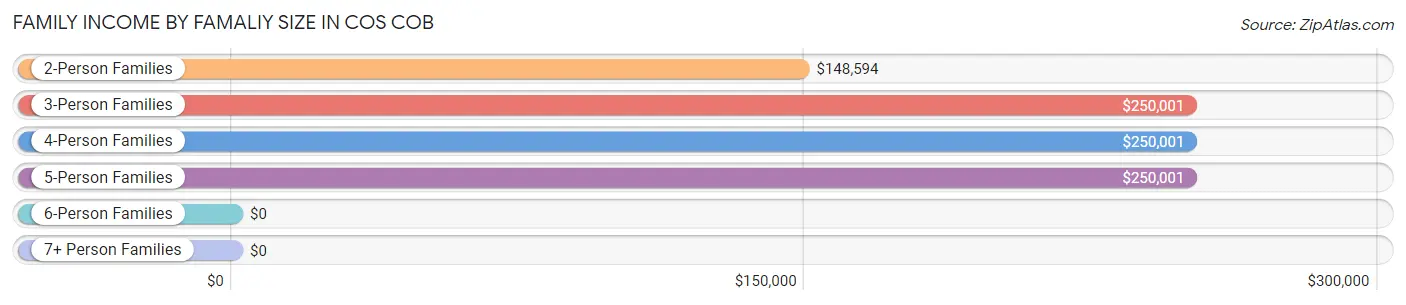
Family Income by Famaliy Size in Cos Cob
3-person families (542 | 26.9%) account for the highest median family income in Cos Cob with $250,001 per family, while 3-person families (542 | 26.9%) have the highest median income of $83,334 per family member.
| Income Bracket | # Families | Median Income |
| 2-Person Families | 659 (32.7%) | $148,594 |
| 3-Person Families | 542 (26.9%) | $250,001 |
| 4-Person Families | 620 (30.8%) | $250,001 |
| 5-Person Families | 192 (9.5%) | $250,001 |
| 6-Person Families | 0 (0.0%) | $0 |
| 7+ Person Families | 0 (0.0%) | $0 |
| Total | 2,013 (100.0%) | $209,913 |
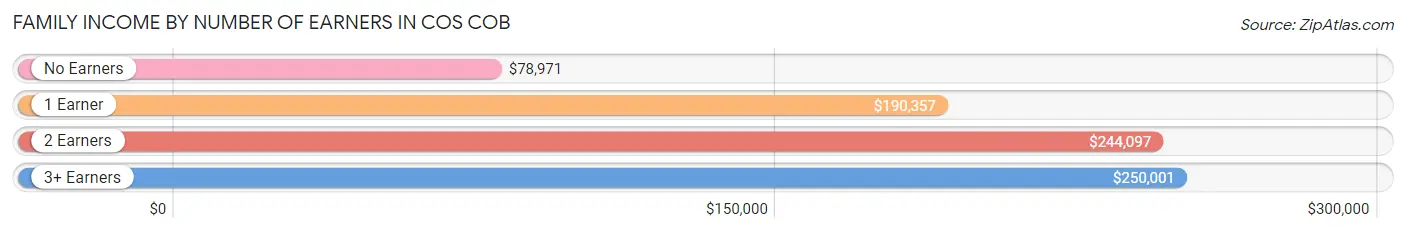
Family Income by Number of Earners in Cos Cob
The median family income in Cos Cob is $209,913, with families comprising 3+ earners (232) having the highest median family income of $250,001, while families with no earners (144) have the lowest median family income of $78,971, accounting for 11.5% and 7.1% of families, respectively.
| Number of Earners | # Families | Median Income |
| No Earners | 144 (7.1%) | $78,971 |
| 1 Earner | 566 (28.1%) | $190,357 |
| 2 Earners | 1,071 (53.2%) | $244,097 |
| 3+ Earners | 232 (11.5%) | $250,001 |
| Total | 2,013 (100.0%) | $209,913 |
Household Income in Cos Cob
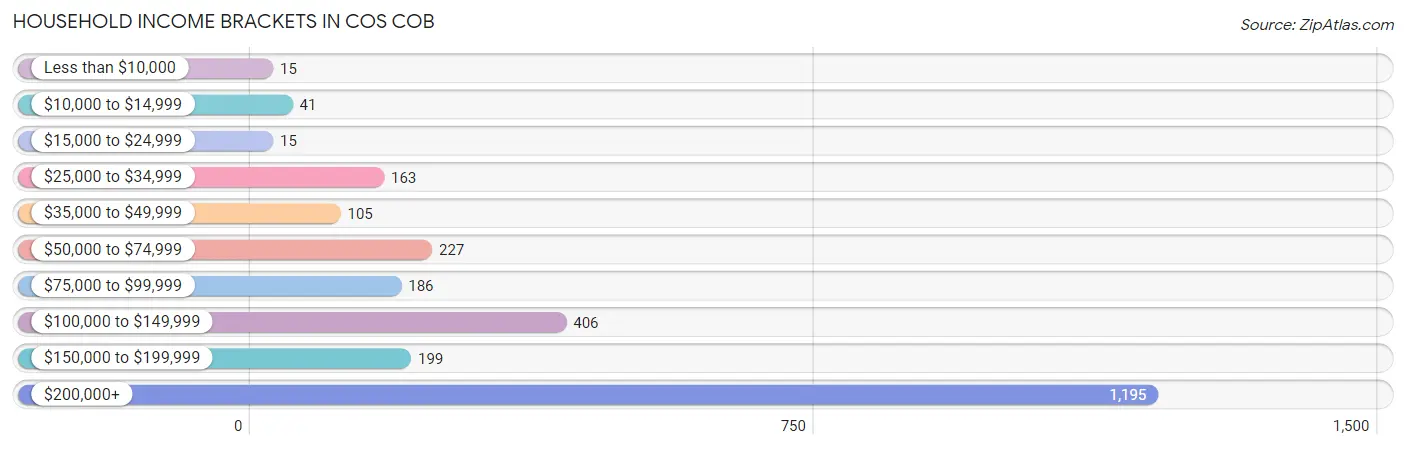
Household Income Brackets in Cos Cob
With 1,195 households falling in the category, the $200,000+ income range is the most frequent in Cos Cob, accounting for 46.8% of all households. In contrast, only 15 households (0.6%) fall into the less than $10,000 income bracket, making it the least populous group.
| Income Bracket | # Households | % Households |
| Less than $10,000 | 15 | 0.6% |
| $10,000 to $14,999 | 41 | 1.6% |
| $15,000 to $24,999 | 15 | 0.6% |
| $25,000 to $34,999 | 163 | 6.4% |
| $35,000 to $49,999 | 105 | 4.1% |
| $50,000 to $74,999 | 227 | 8.9% |
| $75,000 to $99,999 | 186 | 7.3% |
| $100,000 to $149,999 | 406 | 15.9% |
| $150,000 to $199,999 | 199 | 7.8% |
| $200,000+ | 1,195 | 46.8% |
Household Income by Householder Age in Cos Cob
The median household income in Cos Cob is $185,125, with the highest median household income of $223,580 found in the 45 to 64 years age bracket for the primary householder. A total of 1,215 households (47.6%) fall into this category.
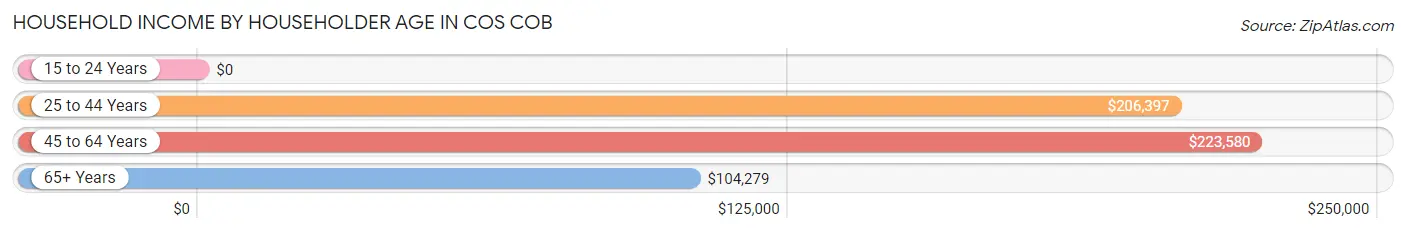
| Income Bracket | # Households | Median Income |
| 15 to 24 Years | 0 (0.0%) | $0 |
| 25 to 44 Years | 711 (27.9%) | $206,397 |
| 45 to 64 Years | 1,215 (47.6%) | $223,580 |
| 65+ Years | 627 (24.6%) | $104,279 |
| Total | 2,553 (100.0%) | $185,125 |
Poverty in Cos Cob
Income Below Poverty by Sex and Age in Cos Cob
With 6.0% poverty level for males and 5.4% for females among the residents of Cos Cob, 12 to 14 year old males and 5 year old females are the most vulnerable to poverty, with 35 males (29.4%) and 9 females (23.1%) in their respective age groups living below the poverty level.
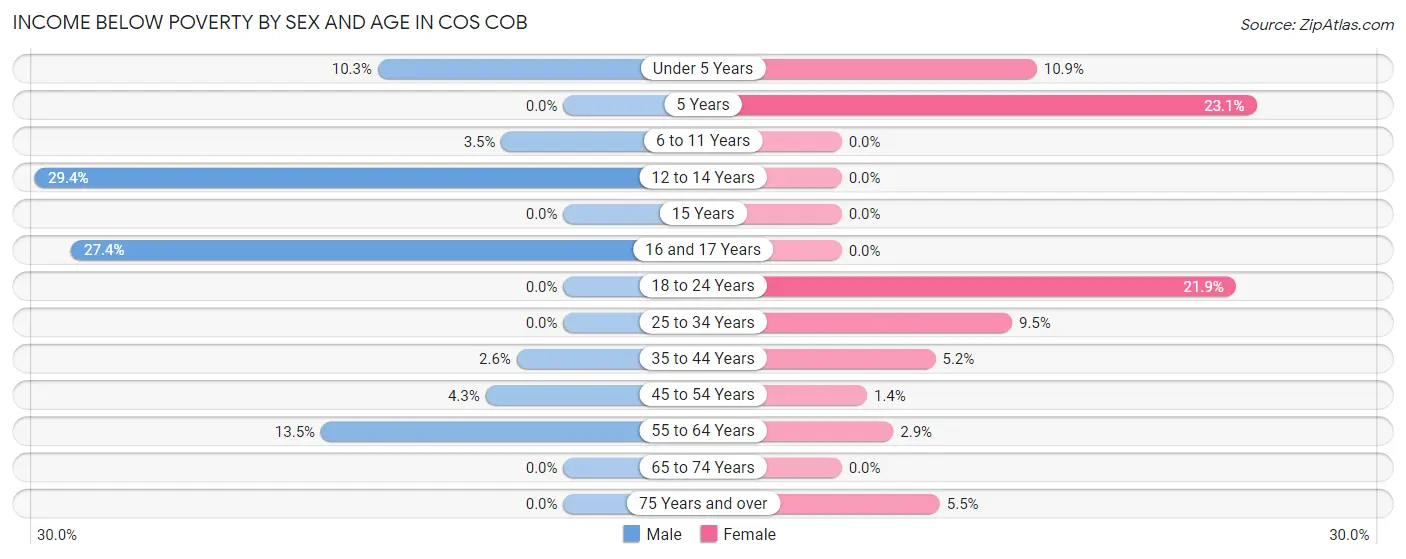
| Age Bracket | Male | Female |
| Under 5 Years | 28 (10.3%) | 33 (10.9%) |
| 5 Years | 0 (0.0%) | 9 (23.1%) |
| 6 to 11 Years | 9 (3.5%) | 0 (0.0%) |
| 12 to 14 Years | 35 (29.4%) | 0 (0.0%) |
| 15 Years | 0 (0.0%) | 0 (0.0%) |
| 16 and 17 Years | 37 (27.4%) | 0 (0.0%) |
| 18 to 24 Years | 0 (0.0%) | 66 (21.9%) |
| 25 to 34 Years | 0 (0.0%) | 29 (9.5%) |
| 35 to 44 Years | 11 (2.6%) | 31 (5.2%) |
| 45 to 54 Years | 25 (4.3%) | 7 (1.4%) |
| 55 to 64 Years | 64 (13.5%) | 15 (2.9%) |
| 65 to 74 Years | 0 (0.0%) | 0 (0.0%) |
| 75 Years and over | 0 (0.0%) | 13 (5.5%) |
| Total | 209 (6.0%) | 203 (5.4%) |
Income Above Poverty by Sex and Age in Cos Cob
According to the poverty statistics in Cos Cob, males aged 5 years and females aged 6 to 11 years are the age groups that are most secure financially, with 100.0% of males and 100.0% of females in these age groups living above the poverty line.
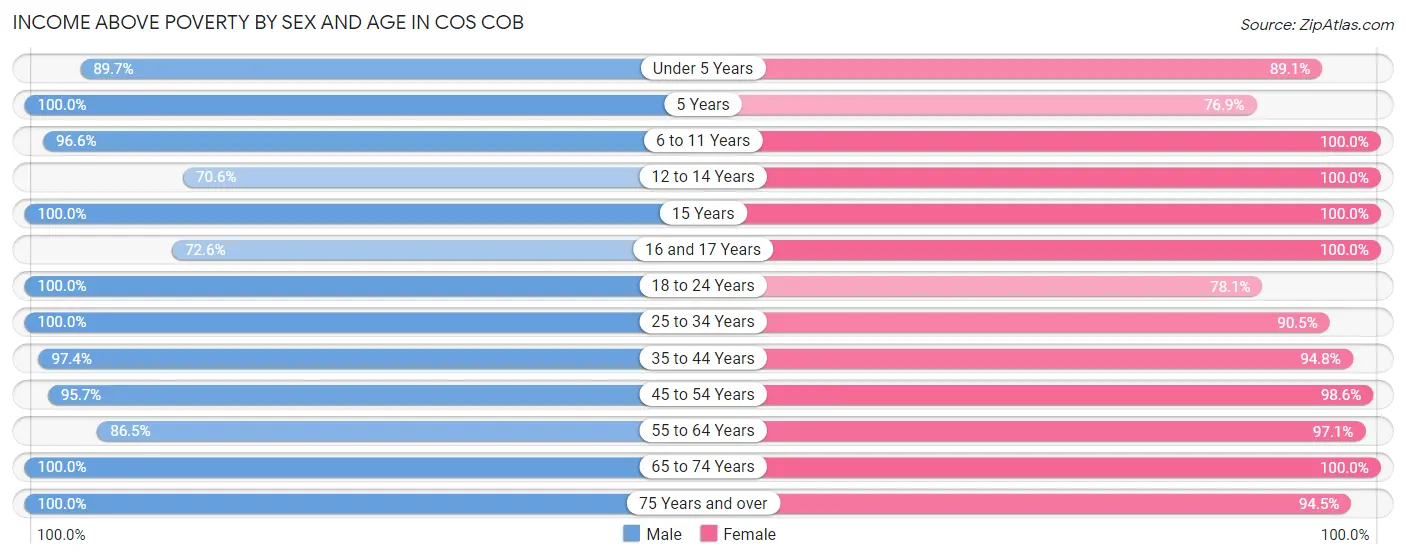
| Age Bracket | Male | Female |
| Under 5 Years | 243 (89.7%) | 271 (89.1%) |
| 5 Years | 112 (100.0%) | 30 (76.9%) |
| 6 to 11 Years | 252 (96.6%) | 282 (100.0%) |
| 12 to 14 Years | 84 (70.6%) | 113 (100.0%) |
| 15 Years | 69 (100.0%) | 67 (100.0%) |
| 16 and 17 Years | 98 (72.6%) | 267 (100.0%) |
| 18 to 24 Years | 199 (100.0%) | 235 (78.1%) |
| 25 to 34 Years | 250 (100.0%) | 277 (90.5%) |
| 35 to 44 Years | 412 (97.4%) | 563 (94.8%) |
| 45 to 54 Years | 553 (95.7%) | 492 (98.6%) |
| 55 to 64 Years | 410 (86.5%) | 507 (97.1%) |
| 65 to 74 Years | 377 (100.0%) | 248 (100.0%) |
| 75 Years and over | 188 (100.0%) | 225 (94.5%) |
| Total | 3,247 (94.0%) | 3,577 (94.6%) |
Income Below Poverty Among Married-Couple Families in Cos Cob
The poverty statistics for married-couple families in Cos Cob show that 1.4% or 25 of the total 1,751 families live below the poverty line. Families with 1 or 2 children have the highest poverty rate of 3.0%, comprising of 25 families. On the other hand, families with no children have the lowest poverty rate of 0.0%, which includes 0 families.
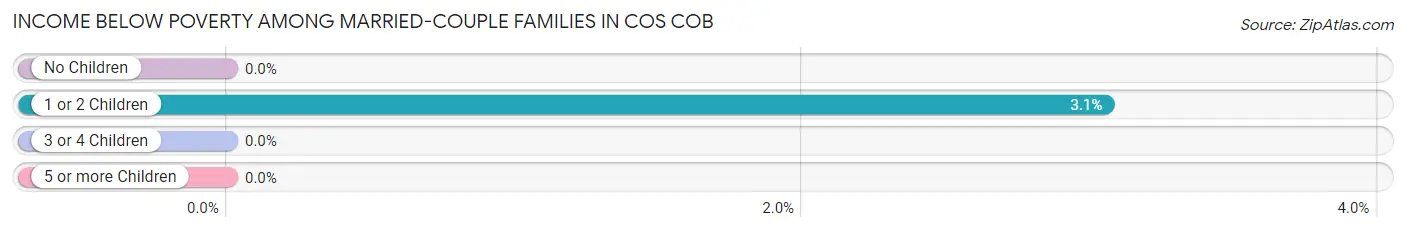
| Children | Above Poverty | Below Poverty |
| No Children | 805 (100.0%) | 0 (0.0%) |
| 1 or 2 Children | 796 (97.0%) | 25 (3.0%) |
| 3 or 4 Children | 125 (100.0%) | 0 (0.0%) |
| 5 or more Children | 0 (0.0%) | 0 (0.0%) |
| Total | 1,726 (98.6%) | 25 (1.4%) |
Income Below Poverty Among Single-Parent Households in Cos Cob
According to the poverty data in Cos Cob, 20.4% or 9 single-father households and 11.5% or 25 single-mother households are living below the poverty line. Among single-father households, those with 1 or 2 children have the highest poverty rate, with 9 households (39.1%) experiencing poverty. Likewise, among single-mother households, those with 3 or 4 children have the highest poverty rate, with 25 households (45.5%) falling below the poverty line.
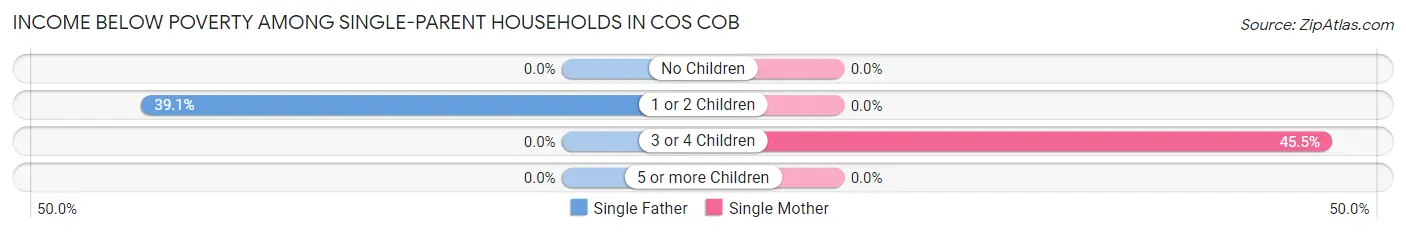
| Children | Single Father | Single Mother |
| No Children | 0 (0.0%) | 0 (0.0%) |
| 1 or 2 Children | 9 (39.1%) | 0 (0.0%) |
| 3 or 4 Children | 0 (0.0%) | 25 (45.5%) |
| 5 or more Children | 0 (0.0%) | 0 (0.0%) |
| Total | 9 (20.4%) | 25 (11.5%) |
Income Below Poverty Among Married-Couple vs Single-Parent Households in Cos Cob
The poverty data for Cos Cob shows that 25 of the married-couple family households (1.4%) and 34 of the single-parent households (13.0%) are living below the poverty level. Within the married-couple family households, those with 1 or 2 children have the highest poverty rate, with 25 households (3.0%) falling below the poverty line. Among the single-parent households, those with 3 or 4 children have the highest poverty rate, with 25 household (36.2%) living below poverty.
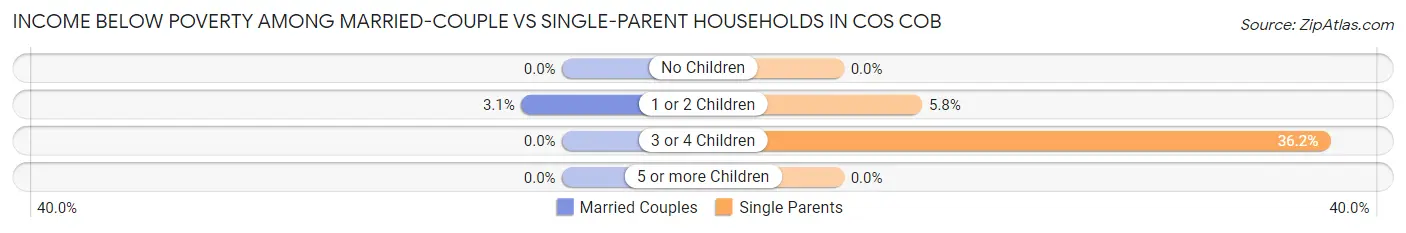
| Children | Married-Couple Families | Single-Parent Households |
| No Children | 0 (0.0%) | 0 (0.0%) |
| 1 or 2 Children | 25 (3.0%) | 9 (5.8%) |
| 3 or 4 Children | 0 (0.0%) | 25 (36.2%) |
| 5 or more Children | 0 (0.0%) | 0 (0.0%) |
| Total | 25 (1.4%) | 34 (13.0%) |
Race in Cos Cob
The most populous races in Cos Cob are White / Caucasian (5,302 | 73.2%), Hispanic or Latino (1,038 | 14.3%), and Two or more Races (811 | 11.2%).
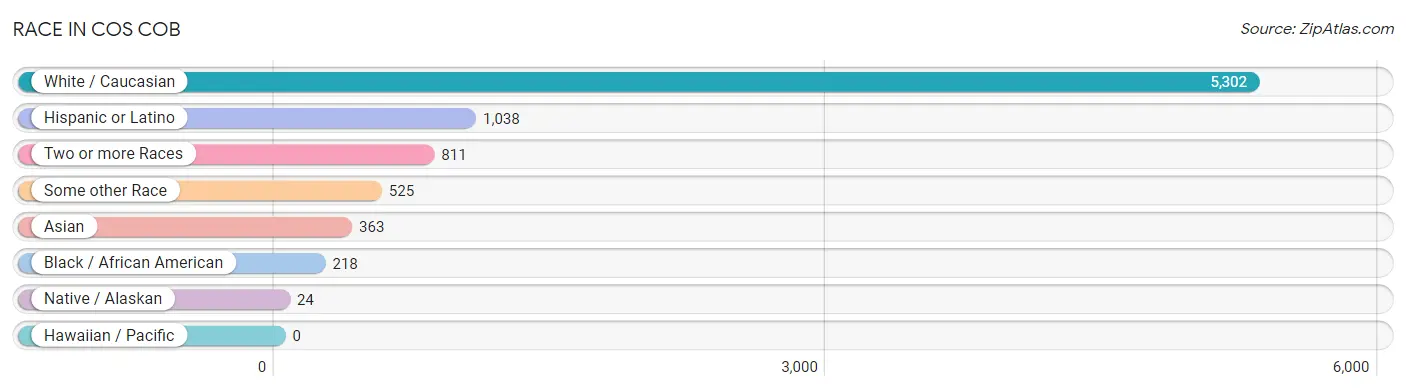
| Race | # Population | % Population |
| Asian | 363 | 5.0% |
| Black / African American | 218 | 3.0% |
| Hawaiian / Pacific | 0 | 0.0% |
| Hispanic or Latino | 1,038 | 14.3% |
| Native / Alaskan | 24 | 0.3% |
| White / Caucasian | 5,302 | 73.2% |
| Two or more Races | 811 | 11.2% |
| Some other Race | 525 | 7.2% |
| Total | 7,243 | 100.0% |
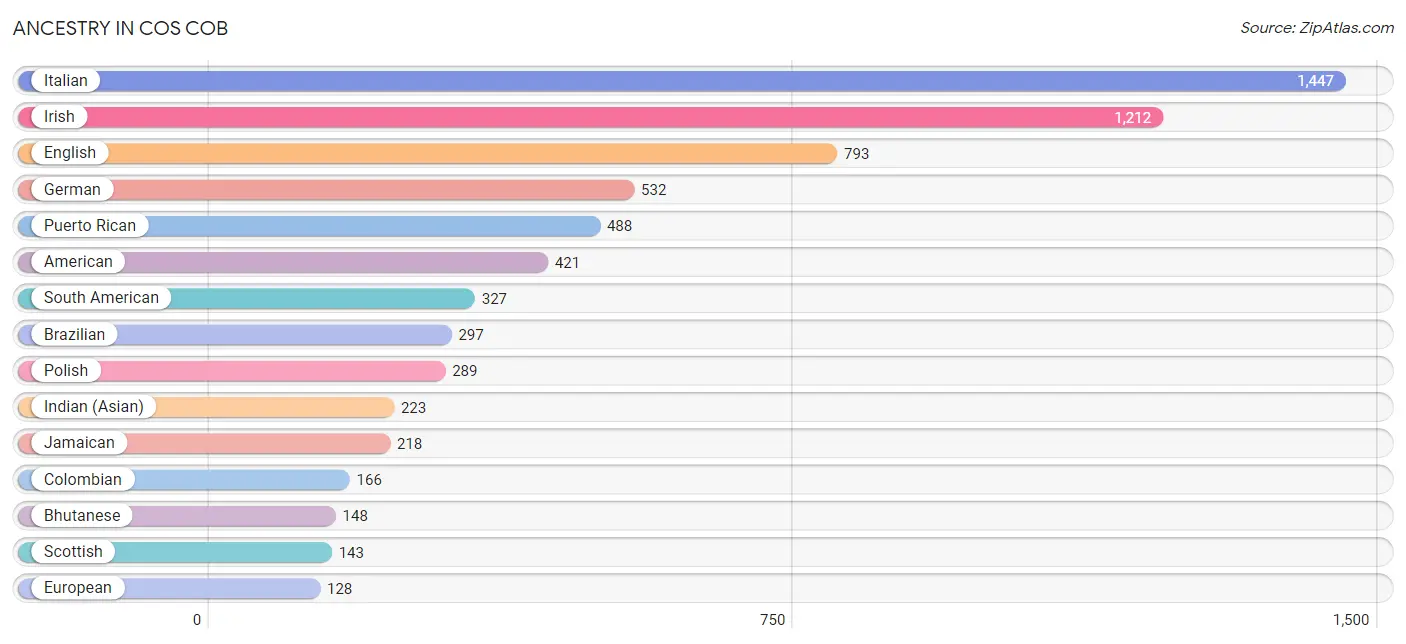
Ancestry in Cos Cob
The most populous ancestries reported in Cos Cob are Italian (1,447 | 20.0%), Irish (1,212 | 16.7%), English (793 | 11.0%), German (532 | 7.3%), and Puerto Rican (488 | 6.7%), together accounting for 61.7% of all Cos Cob residents.
| Ancestry | # Population | % Population |
| African | 12 | 0.2% |
| Albanian | 12 | 0.2% |
| American | 421 | 5.8% |
| Argentinean | 13 | 0.2% |
| Austrian | 30 | 0.4% |
| Belgian | 5 | 0.1% |
| Bhutanese | 148 | 2.0% |
| Brazilian | 297 | 4.1% |
| British | 61 | 0.8% |
| Burmese | 10 | 0.1% |
| Cambodian | 29 | 0.4% |
| Canadian | 36 | 0.5% |
| Celtic | 12 | 0.2% |
| Central American | 15 | 0.2% |
| Chilean | 88 | 1.2% |
| Colombian | 166 | 2.3% |
| Croatian | 74 | 1.0% |
| Czech | 44 | 0.6% |
| Danish | 10 | 0.1% |
| Dominican | 69 | 0.9% |
| Dutch | 43 | 0.6% |
| Eastern European | 41 | 0.6% |
| English | 793 | 11.0% |
| European | 128 | 1.8% |
| French | 119 | 1.6% |
| French Canadian | 14 | 0.2% |
| German | 532 | 7.3% |
| Greek | 85 | 1.2% |
| Guatemalan | 15 | 0.2% |
| Hungarian | 21 | 0.3% |
| Indian (Asian) | 223 | 3.1% |
| Irish | 1,212 | 16.7% |
| Italian | 1,447 | 20.0% |
| Jamaican | 218 | 3.0% |
| Korean | 8 | 0.1% |
| Lithuanian | 41 | 0.6% |
| Macedonian | 1 | 0.0% |
| Mexican | 63 | 0.9% |
| Norwegian | 57 | 0.8% |
| Pakistani | 39 | 0.5% |
| Peruvian | 60 | 0.8% |
| Polish | 289 | 4.0% |
| Portuguese | 53 | 0.7% |
| Puerto Rican | 488 | 6.7% |
| Romanian | 31 | 0.4% |
| Russian | 92 | 1.3% |
| Scotch-Irish | 22 | 0.3% |
| Scottish | 143 | 2.0% |
| Serbian | 53 | 0.7% |
| Slovak | 39 | 0.5% |
| South American | 327 | 4.5% |
| Spaniard | 47 | 0.6% |
| Subsaharan African | 12 | 0.2% |
| Swedish | 97 | 1.3% |
| Swiss | 22 | 0.3% |
| Thai | 77 | 1.1% |
| Turkish | 95 | 1.3% |
| Welsh | 47 | 0.6% | View All 58 Rows |
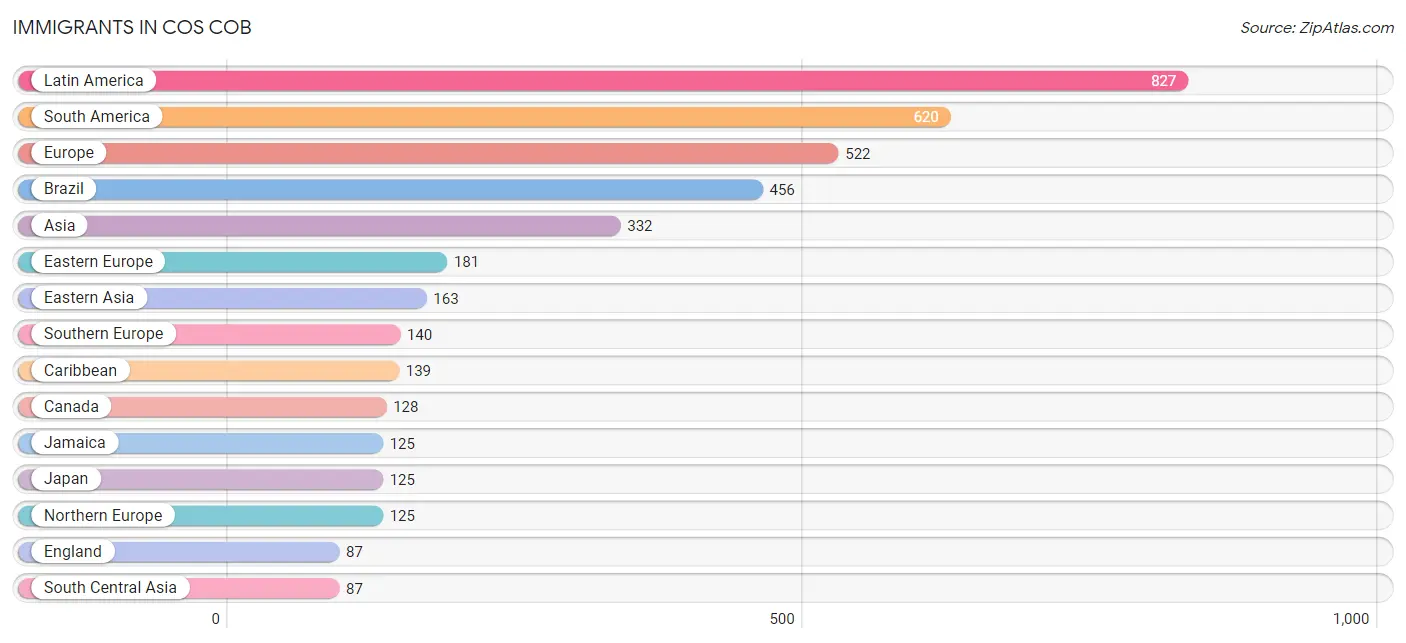
Immigrants in Cos Cob
The most numerous immigrant groups reported in Cos Cob came from Latin America (827 | 11.4%), South America (620 | 8.6%), Europe (522 | 7.2%), Brazil (456 | 6.3%), and Asia (332 | 4.6%), together accounting for 38.1% of all Cos Cob residents.
| Immigration Origin | # Population | % Population |
| Africa | 37 | 0.5% |
| Albania | 6 | 0.1% |
| Asia | 332 | 4.6% |
| Brazil | 456 | 6.3% |
| Canada | 128 | 1.8% |
| Caribbean | 139 | 1.9% |
| Central America | 68 | 0.9% |
| Chile | 71 | 1.0% |
| China | 28 | 0.4% |
| Colombia | 55 | 0.8% |
| Croatia | 37 | 0.5% |
| Dominican Republic | 14 | 0.2% |
| Eastern Asia | 163 | 2.2% |
| Eastern Europe | 181 | 2.5% |
| England | 87 | 1.2% |
| Europe | 522 | 7.2% |
| France | 34 | 0.5% |
| Germany | 16 | 0.2% |
| Guatemala | 42 | 0.6% |
| India | 57 | 0.8% |
| Ireland | 10 | 0.1% |
| Italy | 72 | 1.0% |
| Jamaica | 125 | 1.7% |
| Japan | 125 | 1.7% |
| Latin America | 827 | 11.4% |
| Mexico | 26 | 0.4% |
| Northern Europe | 125 | 1.7% |
| Pakistan | 30 | 0.4% |
| Peru | 38 | 0.5% |
| Philippines | 8 | 0.1% |
| Poland | 57 | 0.8% |
| Portugal | 21 | 0.3% |
| Russia | 51 | 0.7% |
| Serbia | 30 | 0.4% |
| South Africa | 37 | 0.5% |
| South America | 620 | 8.6% |
| South Central Asia | 87 | 1.2% |
| South Eastern Asia | 47 | 0.6% |
| Southern Europe | 140 | 1.9% |
| Spain | 47 | 0.6% |
| Switzerland | 26 | 0.4% |
| Thailand | 39 | 0.5% |
| Turkey | 35 | 0.5% |
| Western Asia | 35 | 0.5% |
| Western Europe | 76 | 1.1% | View All 45 Rows |
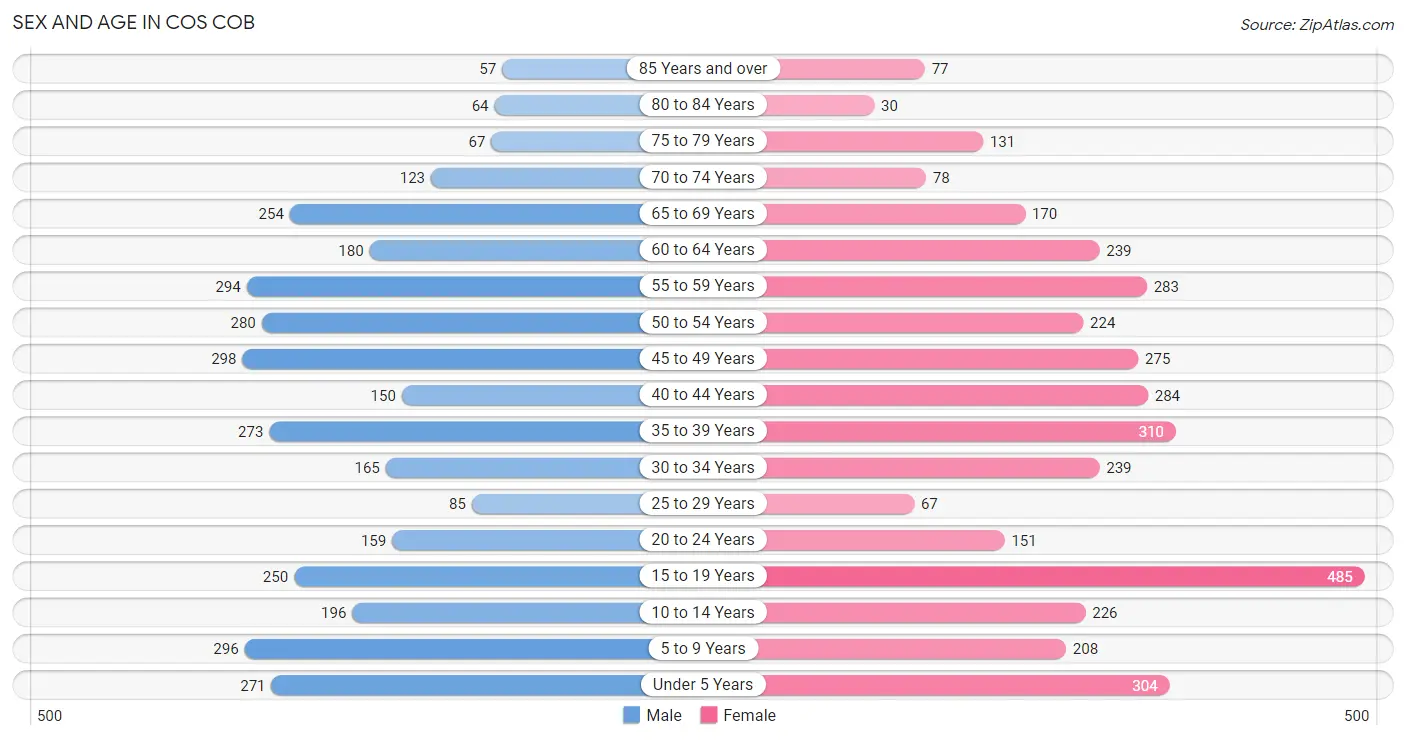
Sex and Age in Cos Cob
Sex and Age in Cos Cob
The most populous age groups in Cos Cob are 45 to 49 Years (298 | 8.6%) for men and 15 to 19 Years (485 | 12.8%) for women.
| Age Bracket | Male | Female |
| Under 5 Years | 271 (7.8%) | 304 (8.0%) |
| 5 to 9 Years | 296 (8.6%) | 208 (5.5%) |
| 10 to 14 Years | 196 (5.7%) | 226 (6.0%) |
| 15 to 19 Years | 250 (7.2%) | 485 (12.8%) |
| 20 to 24 Years | 159 (4.6%) | 151 (4.0%) |
| 25 to 29 Years | 85 (2.5%) | 67 (1.8%) |
| 30 to 34 Years | 165 (4.8%) | 239 (6.3%) |
| 35 to 39 Years | 273 (7.9%) | 310 (8.2%) |
| 40 to 44 Years | 150 (4.3%) | 284 (7.5%) |
| 45 to 49 Years | 298 (8.6%) | 275 (7.3%) |
| 50 to 54 Years | 280 (8.1%) | 224 (5.9%) |
| 55 to 59 Years | 294 (8.5%) | 283 (7.5%) |
| 60 to 64 Years | 180 (5.2%) | 239 (6.3%) |
| 65 to 69 Years | 254 (7.3%) | 170 (4.5%) |
| 70 to 74 Years | 123 (3.5%) | 78 (2.1%) |
| 75 to 79 Years | 67 (1.9%) | 131 (3.5%) |
| 80 to 84 Years | 64 (1.8%) | 30 (0.8%) |
| 85 Years and over | 57 (1.7%) | 77 (2.0%) |
| Total | 3,462 (100.0%) | 3,781 (100.0%) |
Families and Households in Cos Cob
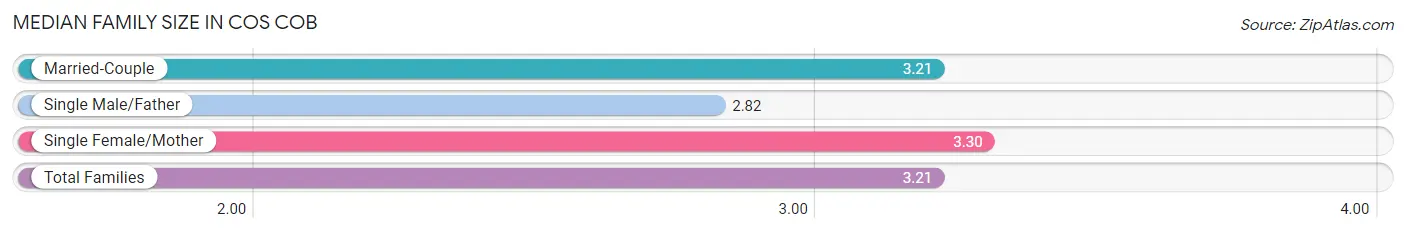
Median Family Size in Cos Cob
The median family size in Cos Cob is 3.21 persons per family, with single female/mother families (218 | 10.8%) accounting for the largest median family size of 3.3 persons per family. On the other hand, single male/father families (44 | 2.2%) represent the smallest median family size with 2.82 persons per family.
| Family Type | # Families | Family Size |
| Married-Couple | 1,751 (87.0%) | 3.21 |
| Single Male/Father | 44 (2.2%) | 2.82 |
| Single Female/Mother | 218 (10.8%) | 3.30 |
| Total Families | 2,013 (100.0%) | 3.21 |
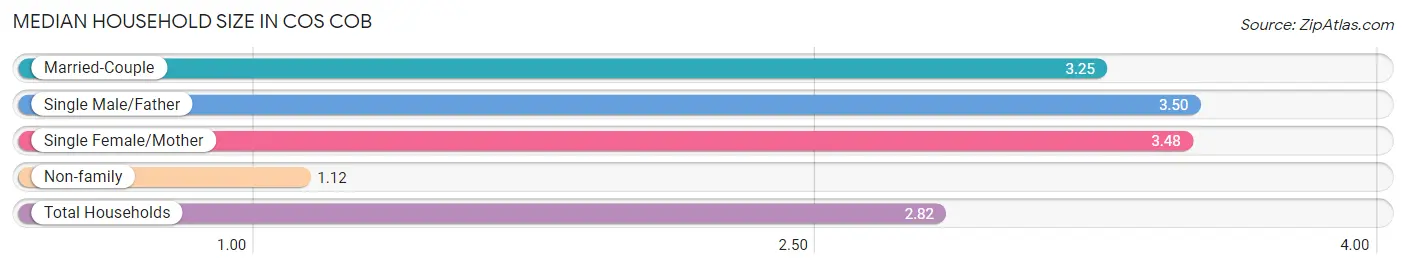
Median Household Size in Cos Cob
The median household size in Cos Cob is 2.82 persons per household, with single male/father households (44 | 1.7%) accounting for the largest median household size of 3.5 persons per household. non-family households (540 | 21.1%) represent the smallest median household size with 1.12 persons per household.
| Household Type | # Households | Household Size |
| Married-Couple | 1,751 (68.6%) | 3.25 |
| Single Male/Father | 44 (1.7%) | 3.50 |
| Single Female/Mother | 218 (8.5%) | 3.48 |
| Non-family | 540 (21.1%) | 1.12 |
| Total Households | 2,553 (100.0%) | 2.82 |
Household Size by Marriage Status in Cos Cob
Out of a total of 2,553 households in Cos Cob, 2,013 (78.8%) are family households, while 540 (21.1%) are nonfamily households. The most numerous type of family households are 2-person households, comprising 642, and the most common type of nonfamily households are 1-person households, comprising 481.
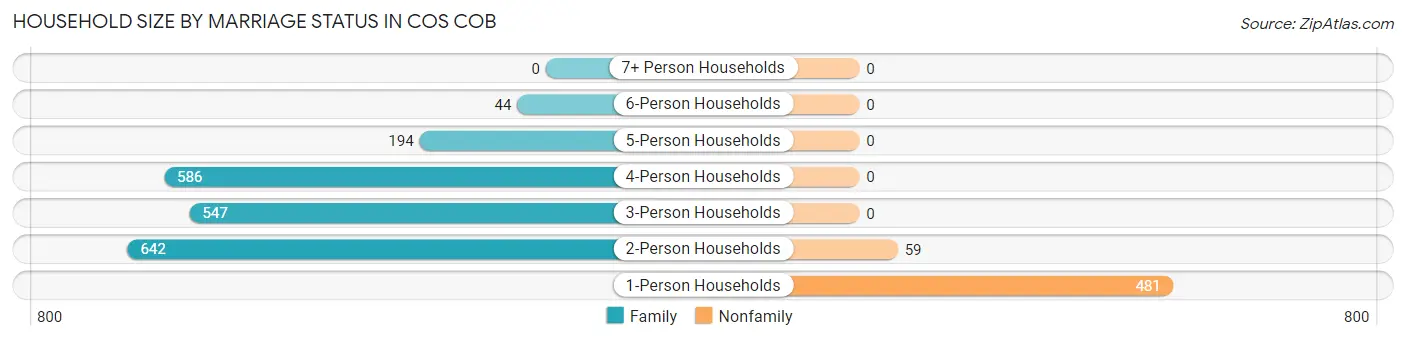
| Household Size | Family Households | Nonfamily Households |
| 1-Person Households | - | 481 (18.8%) |
| 2-Person Households | 642 (25.2%) | 59 (2.3%) |
| 3-Person Households | 547 (21.4%) | 0 (0.0%) |
| 4-Person Households | 586 (23.0%) | 0 (0.0%) |
| 5-Person Households | 194 (7.6%) | 0 (0.0%) |
| 6-Person Households | 44 (1.7%) | 0 (0.0%) |
| 7+ Person Households | 0 (0.0%) | 0 (0.0%) |
| Total | 2,013 (78.8%) | 540 (21.1%) |
Female Fertility in Cos Cob
Fertility by Age in Cos Cob
Average fertility rate in Cos Cob is 131.0 births per 1,000 women. Women in the age bracket of 35 to 50 years have the highest fertility rate with 190.0 births per 1,000 women. Women in the age bracket of 35 to 50 years acount for 70.7% of all women with births.
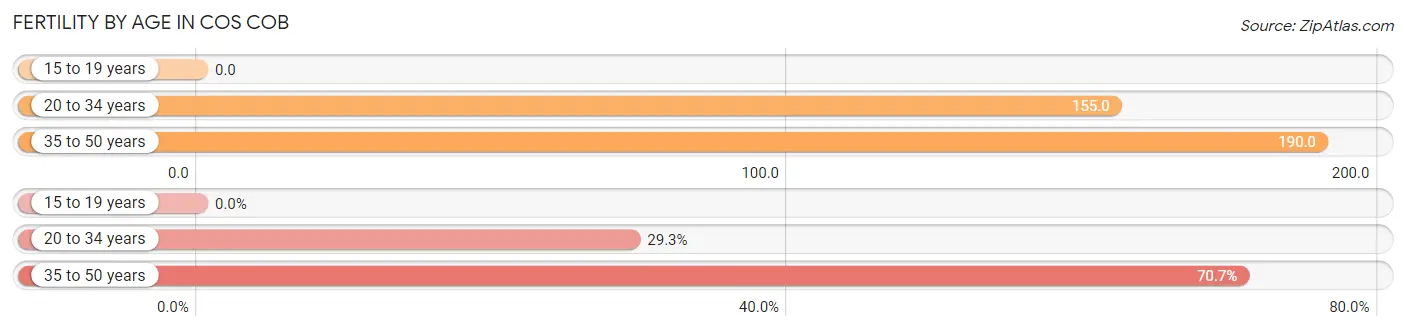
| Age Bracket | Women with Births | Births / 1,000 Women |
| 15 to 19 years | 0 (0.0%) | 0.0 |
| 20 to 34 years | 71 (29.3%) | 155.0 |
| 35 to 50 years | 171 (70.7%) | 190.0 |
| Total | 242 (100.0%) | 131.0 |
Fertility by Age by Marriage Status in Cos Cob
87.2% of women with births (242) in Cos Cob are married. The highest percentage of unmarried women with births falls into 20 to 34 years age bracket with 35.2% of them unmarried at the time of birth, while the lowest percentage of unmarried women with births belong to 35 to 50 years age bracket with 3.5% of them unmarried.
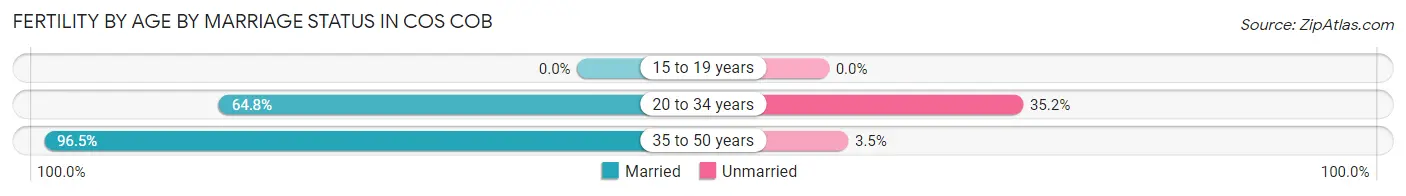
| Age Bracket | Married | Unmarried |
| 15 to 19 years | 0 (0.0%) | 0 (0.0%) |
| 20 to 34 years | 46 (64.8%) | 25 (35.2%) |
| 35 to 50 years | 165 (96.5%) | 6 (3.5%) |
| Total | 211 (87.2%) | 31 (12.8%) |
Fertility by Education in Cos Cob
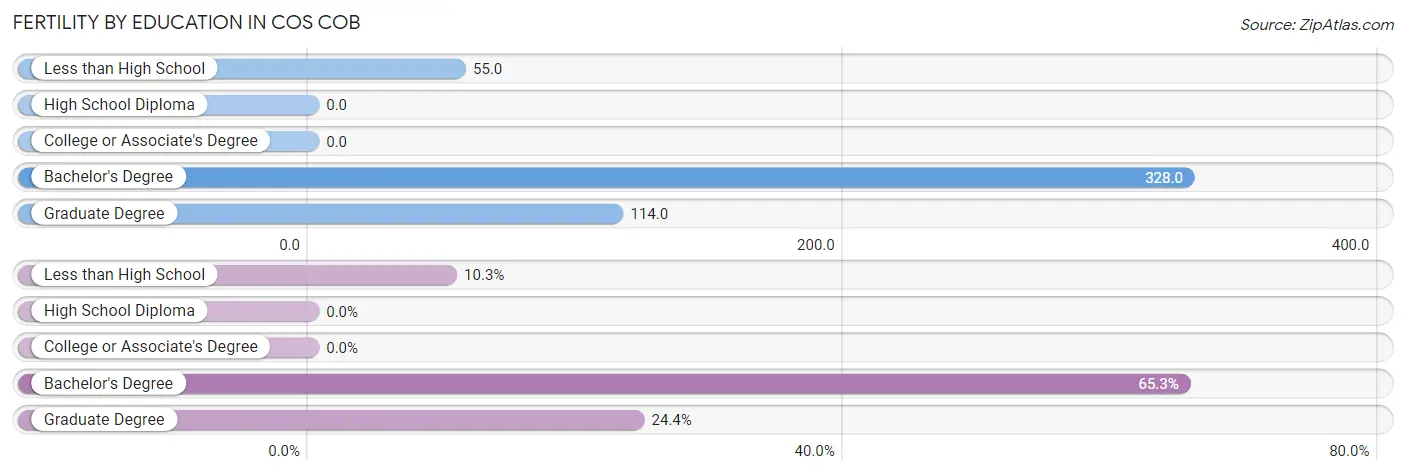
| Educational Attainment | Women with Births | Births / 1,000 Women |
| Less than High School | 25 (10.3%) | 55.0 |
| High School Diploma | 0 (0.0%) | 0.0 |
| College or Associate's Degree | 0 (0.0%) | 0.0 |
| Bachelor's Degree | 158 (65.3%) | 328.0 |
| Graduate Degree | 59 (24.4%) | 114.0 |
| Total | 242 (100.0%) | 131.0 |
Fertility by Education by Marriage Status in Cos Cob
12.8% of women with births in Cos Cob are unmarried. Women with the educational attainment of bachelor's degree are most likely to be married with 100.0% of them married at childbirth, while women with the educational attainment of less than high school are least likely to be married with 100.0% of them unmarried at childbirth.
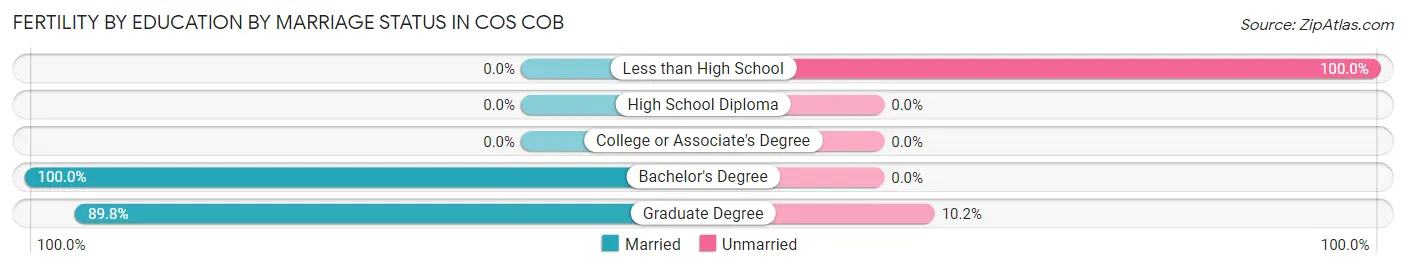
| Educational Attainment | Married | Unmarried |
| Less than High School | 0 (0.0%) | 25 (100.0%) |
| High School Diploma | 0 (0.0%) | 0 (0.0%) |
| College or Associate's Degree | 0 (0.0%) | 0 (0.0%) |
| Bachelor's Degree | 158 (100.0%) | 0 (0.0%) |
| Graduate Degree | 53 (89.8%) | 6 (10.2%) |
| Total | 211 (87.2%) | 31 (12.8%) |
Employment Characteristics in Cos Cob
Employment by Class of Employer in Cos Cob
Among the 3,649 employed individuals in Cos Cob, private company employees (2,511 | 68.8%), self-employed (not incorporated) (333 | 9.1%), and self-employed (incorporated) (283 | 7.8%) make up the most common classes of employment.
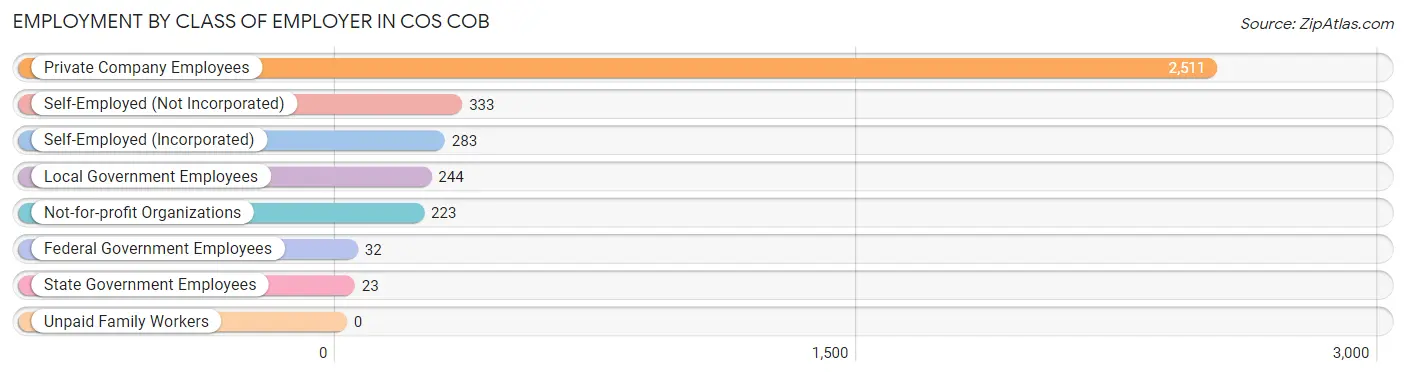
| Employer Class | # Employees | % Employees |
| Private Company Employees | 2,511 | 68.8% |
| Self-Employed (Incorporated) | 283 | 7.8% |
| Self-Employed (Not Incorporated) | 333 | 9.1% |
| Not-for-profit Organizations | 223 | 6.1% |
| Local Government Employees | 244 | 6.7% |
| State Government Employees | 23 | 0.6% |
| Federal Government Employees | 32 | 0.9% |
| Unpaid Family Workers | 0 | 0.0% |
| Total | 3,649 | 100.0% |
Employment Status by Age in Cos Cob
According to the labor force statistics for Cos Cob, out of the total population over 16 years of age (5,605), 70.7% or 3,963 individuals are in the labor force, with 6.3% or 250 of them unemployed. The age group with the highest labor force participation rate is 45 to 54 years, with 89.6% or 965 individuals in the labor force. Within the labor force, the 30 to 34 years age range has the highest percentage of unemployed individuals, with 21.9% or 75 of them being unemployed.
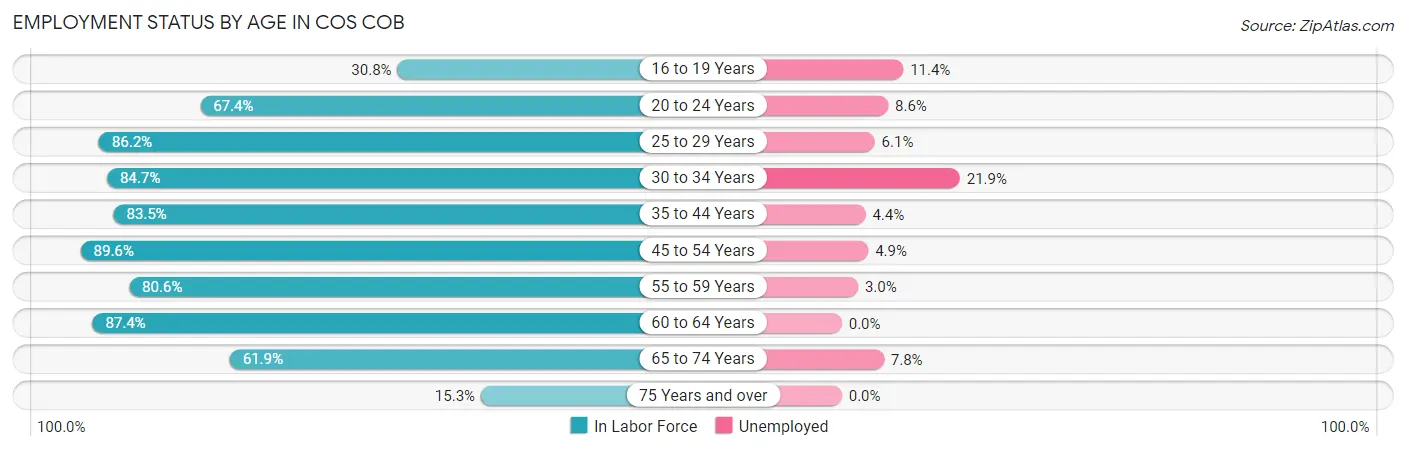
| Age Bracket | In Labor Force | Unemployed |
| 16 to 19 Years | 184 (30.8%) | 21 (11.4%) |
| 20 to 24 Years | 209 (67.4%) | 18 (8.6%) |
| 25 to 29 Years | 131 (86.2%) | 8 (6.1%) |
| 30 to 34 Years | 342 (84.7%) | 75 (21.9%) |
| 35 to 44 Years | 849 (83.5%) | 37 (4.4%) |
| 45 to 54 Years | 965 (89.6%) | 47 (4.9%) |
| 55 to 59 Years | 465 (80.6%) | 14 (3.0%) |
| 60 to 64 Years | 366 (87.4%) | 0 (0.0%) |
| 65 to 74 Years | 387 (61.9%) | 30 (7.8%) |
| 75 Years and over | 65 (15.3%) | 0 (0.0%) |
| Total | 3,963 (70.7%) | 250 (6.3%) |
Employment Status by Educational Attainment in Cos Cob
According to labor force statistics for Cos Cob, 85.5% of individuals (3,117) out of the total population between 25 and 64 years of age (3,646) are in the labor force, with 5.8% or 181 of them being unemployed. The group with the highest labor force participation rate are those with the educational attainment of bachelor's degree or higher, with 87.7% or 2,298 individuals in the labor force. Within the labor force, individuals with high school diploma education have the highest percentage of unemployment, with 17.2% or 74 of them being unemployed.
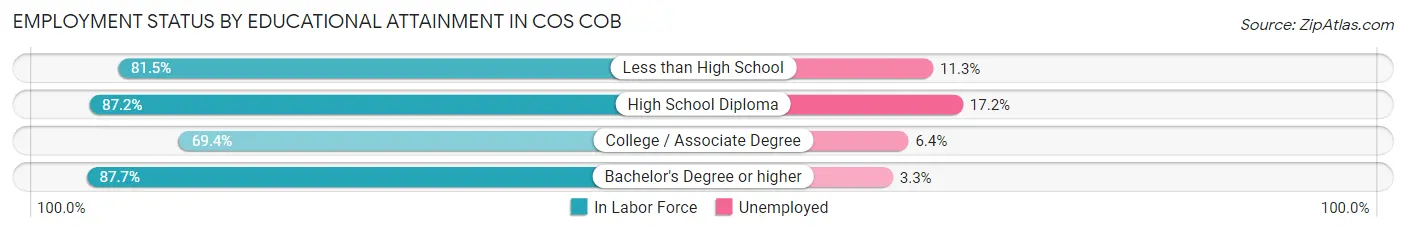
| Educational Attainment | In Labor Force | Unemployed |
| Less than High School | 141 (81.5%) | 20 (11.3%) |
| High School Diploma | 430 (87.2%) | 85 (17.2%) |
| College / Associate Degree | 250 (69.4%) | 23 (6.4%) |
| Bachelor's Degree or higher | 2,298 (87.7%) | 86 (3.3%) |
| Total | 3,117 (85.5%) | 211 (5.8%) |
Employment Occupations by Sex in Cos Cob
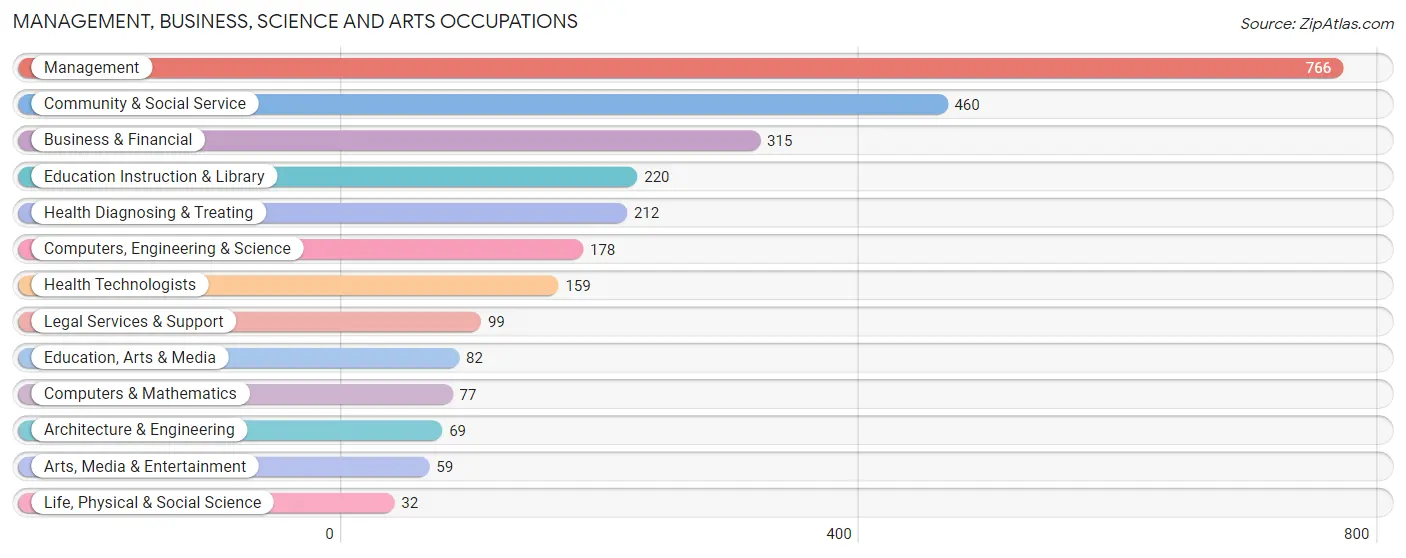
Management, Business, Science and Arts Occupations
The most common Management, Business, Science and Arts occupations in Cos Cob are Management (766 | 20.6%), Community & Social Service (460 | 12.4%), Business & Financial (315 | 8.5%), Education Instruction & Library (220 | 5.9%), and Health Diagnosing & Treating (212 | 5.7%).
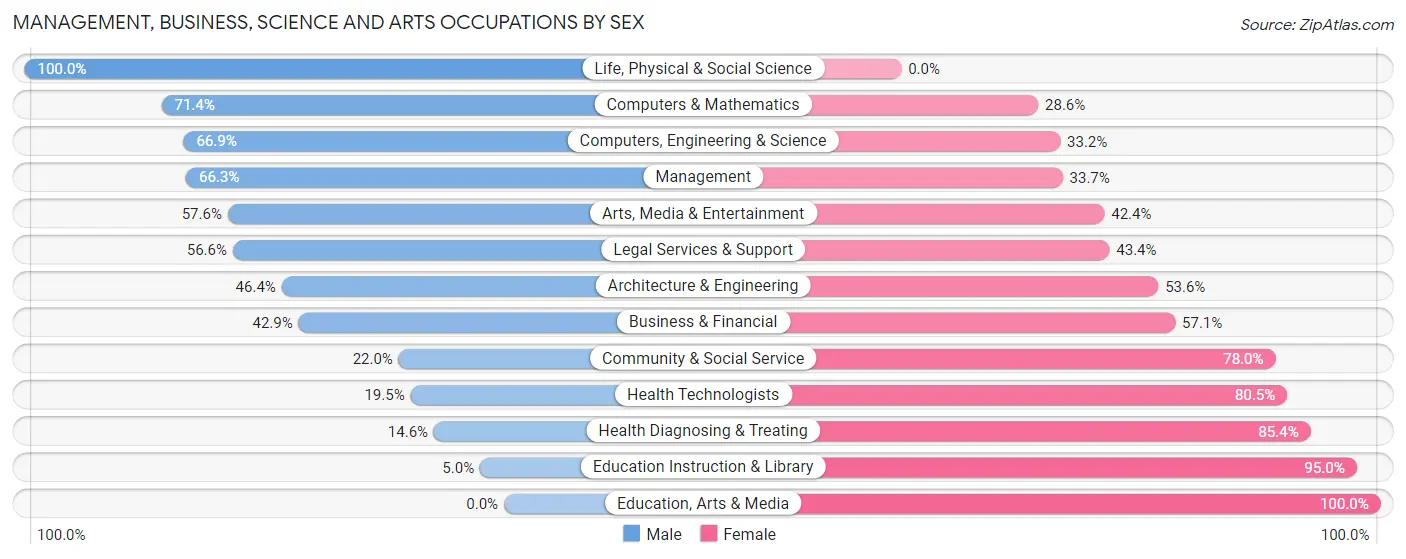
Management, Business, Science and Arts Occupations by Sex
Within the Management, Business, Science and Arts occupations in Cos Cob, the most male-oriented occupations are Life, Physical & Social Science (100.0%), Computers & Mathematics (71.4%), and Computers, Engineering & Science (66.8%), while the most female-oriented occupations are Education, Arts & Media (100.0%), Education Instruction & Library (95.0%), and Health Diagnosing & Treating (85.4%).
| Occupation | Male | Female |
| Management | 508 (66.3%) | 258 (33.7%) |
| Business & Financial | 135 (42.9%) | 180 (57.1%) |
| Computers, Engineering & Science | 119 (66.8%) | 59 (33.2%) |
| Computers & Mathematics | 55 (71.4%) | 22 (28.6%) |
| Architecture & Engineering | 32 (46.4%) | 37 (53.6%) |
| Life, Physical & Social Science | 32 (100.0%) | 0 (0.0%) |
| Community & Social Service | 101 (22.0%) | 359 (78.0%) |
| Education, Arts & Media | 0 (0.0%) | 82 (100.0%) |
| Legal Services & Support | 56 (56.6%) | 43 (43.4%) |
| Education Instruction & Library | 11 (5.0%) | 209 (95.0%) |
| Arts, Media & Entertainment | 34 (57.6%) | 25 (42.4%) |
| Health Diagnosing & Treating | 31 (14.6%) | 181 (85.4%) |
| Health Technologists | 31 (19.5%) | 128 (80.5%) |
| Total (Category) | 894 (46.3%) | 1,037 (53.7%) |
| Total (Overall) | 2,031 (54.7%) | 1,682 (45.3%) |
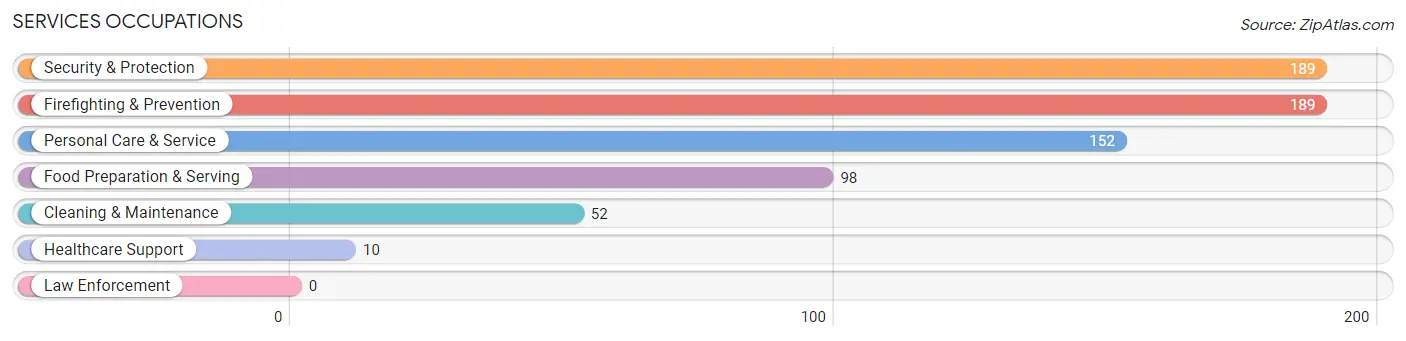
Services Occupations
The most common Services occupations in Cos Cob are Security & Protection (189 | 5.1%), Firefighting & Prevention (189 | 5.1%), Personal Care & Service (152 | 4.1%), Food Preparation & Serving (98 | 2.6%), and Cleaning & Maintenance (52 | 1.4%).
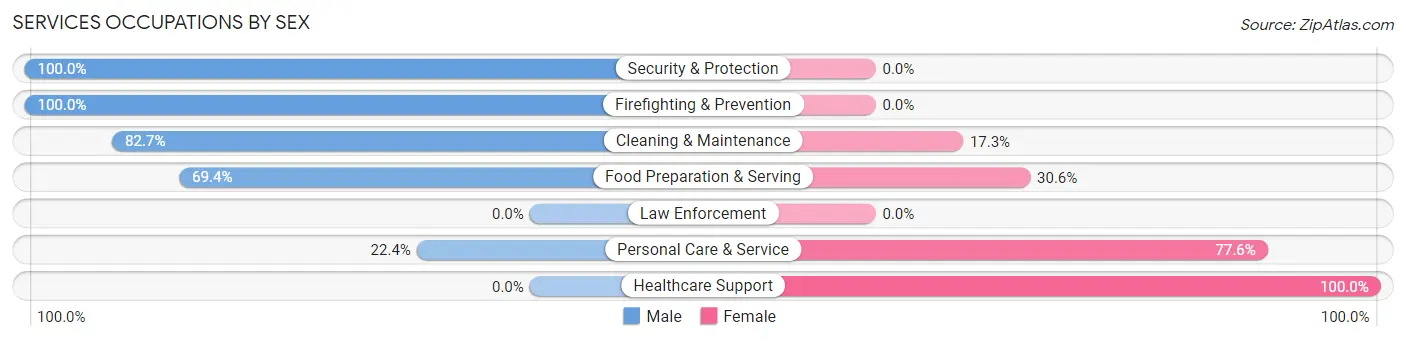
Services Occupations by Sex
Within the Services occupations in Cos Cob, the most male-oriented occupations are Security & Protection (100.0%), Firefighting & Prevention (100.0%), and Cleaning & Maintenance (82.7%), while the most female-oriented occupations are Healthcare Support (100.0%), Personal Care & Service (77.6%), and Food Preparation & Serving (30.6%).
| Occupation | Male | Female |
| Healthcare Support | 0 (0.0%) | 10 (100.0%) |
| Security & Protection | 189 (100.0%) | 0 (0.0%) |
| Firefighting & Prevention | 189 (100.0%) | 0 (0.0%) |
| Law Enforcement | 0 (0.0%) | 0 (0.0%) |
| Food Preparation & Serving | 68 (69.4%) | 30 (30.6%) |
| Cleaning & Maintenance | 43 (82.7%) | 9 (17.3%) |
| Personal Care & Service | 34 (22.4%) | 118 (77.6%) |
| Total (Category) | 334 (66.7%) | 167 (33.3%) |
| Total (Overall) | 2,031 (54.7%) | 1,682 (45.3%) |
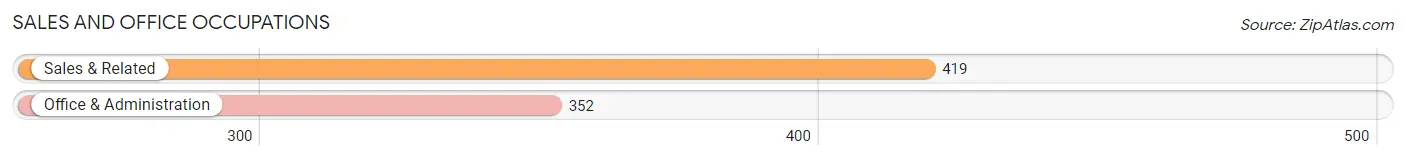
Sales and Office Occupations
The most common Sales and Office occupations in Cos Cob are Sales & Related (419 | 11.3%), and Office & Administration (352 | 9.5%).
Sales and Office Occupations by Sex
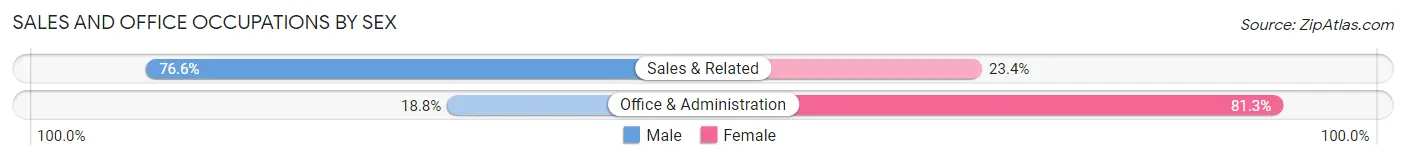
| Occupation | Male | Female |
| Sales & Related | 321 (76.6%) | 98 (23.4%) |
| Office & Administration | 66 (18.8%) | 286 (81.2%) |
| Total (Category) | 387 (50.2%) | 384 (49.8%) |
| Total (Overall) | 2,031 (54.7%) | 1,682 (45.3%) |
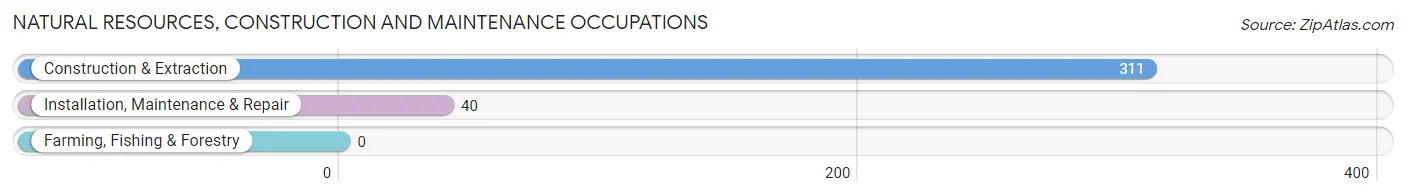
Natural Resources, Construction and Maintenance Occupations
The most common Natural Resources, Construction and Maintenance occupations in Cos Cob are Construction & Extraction (311 | 8.4%), and Installation, Maintenance & Repair (40 | 1.1%).
Natural Resources, Construction and Maintenance Occupations by Sex
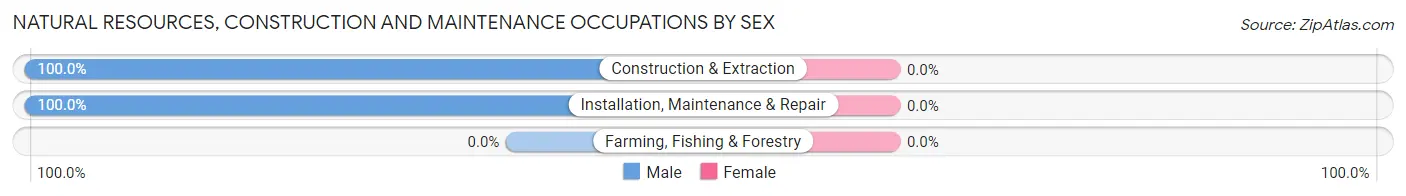
| Occupation | Male | Female |
| Farming, Fishing & Forestry | 0 (0.0%) | 0 (0.0%) |
| Construction & Extraction | 311 (100.0%) | 0 (0.0%) |
| Installation, Maintenance & Repair | 40 (100.0%) | 0 (0.0%) |
| Total (Category) | 351 (100.0%) | 0 (0.0%) |
| Total (Overall) | 2,031 (54.7%) | 1,682 (45.3%) |
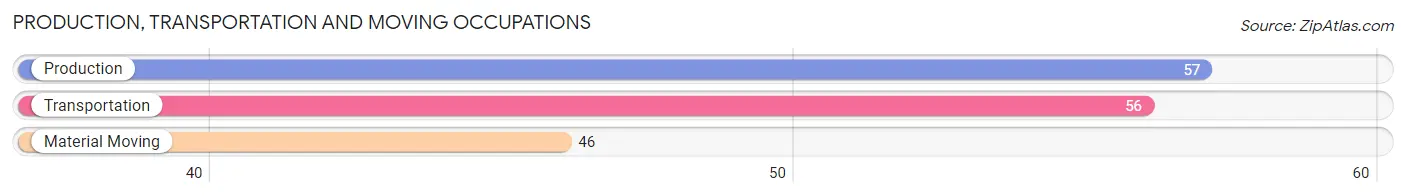
Production, Transportation and Moving Occupations
The most common Production, Transportation and Moving occupations in Cos Cob are Production (57 | 1.5%), Transportation (56 | 1.5%), and Material Moving (46 | 1.2%).
Production, Transportation and Moving Occupations by Sex
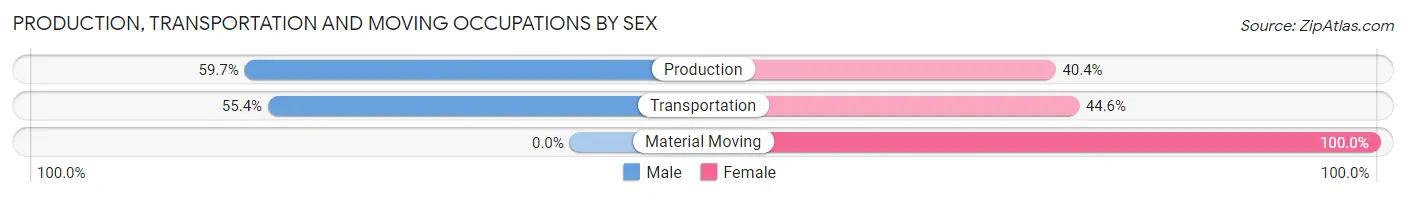
| Occupation | Male | Female |
| Production | 34 (59.7%) | 23 (40.4%) |
| Transportation | 31 (55.4%) | 25 (44.6%) |
| Material Moving | 0 (0.0%) | 46 (100.0%) |
| Total (Category) | 65 (40.9%) | 94 (59.1%) |
| Total (Overall) | 2,031 (54.7%) | 1,682 (45.3%) |
Employment Industries by Sex in Cos Cob
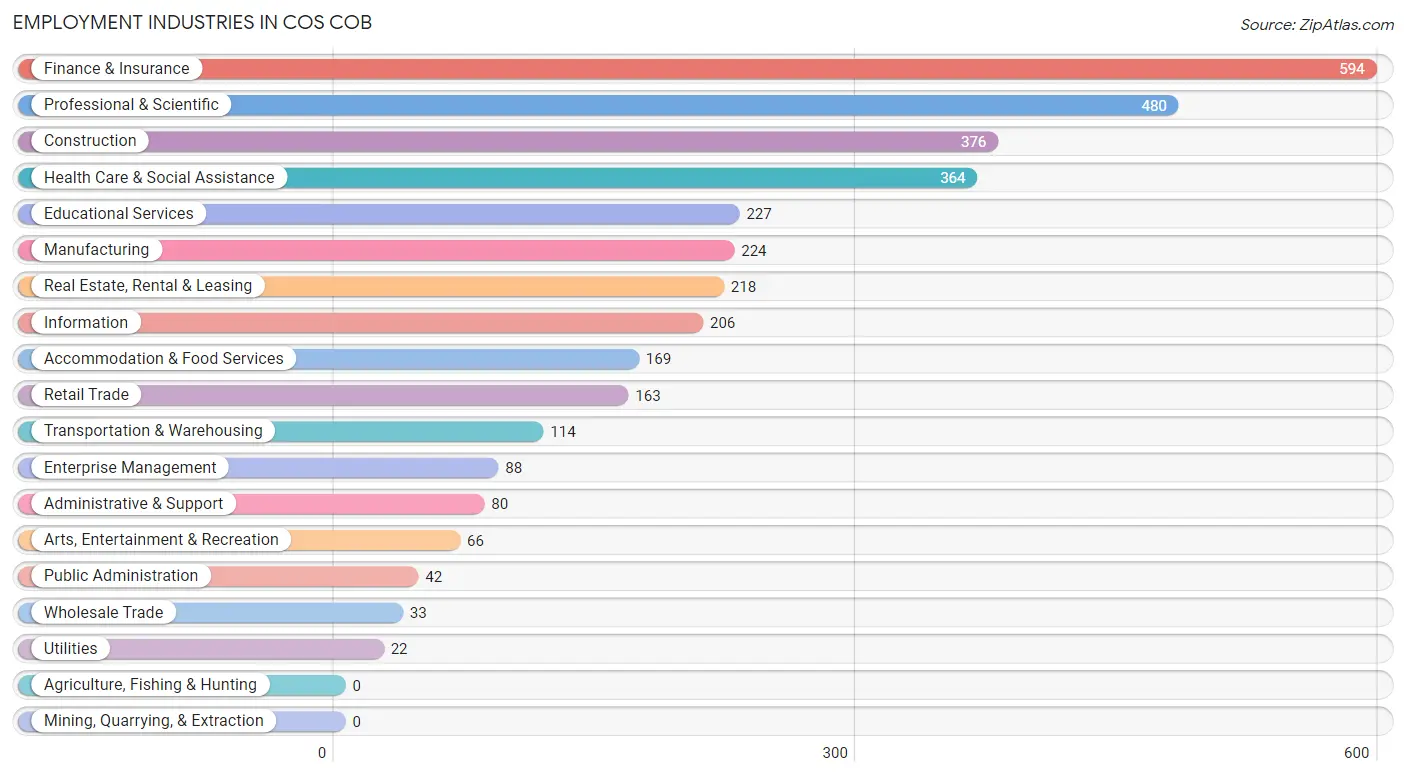
Employment Industries in Cos Cob
The major employment industries in Cos Cob include Finance & Insurance (594 | 16.0%), Professional & Scientific (480 | 12.9%), Construction (376 | 10.1%), Health Care & Social Assistance (364 | 9.8%), and Educational Services (227 | 6.1%).
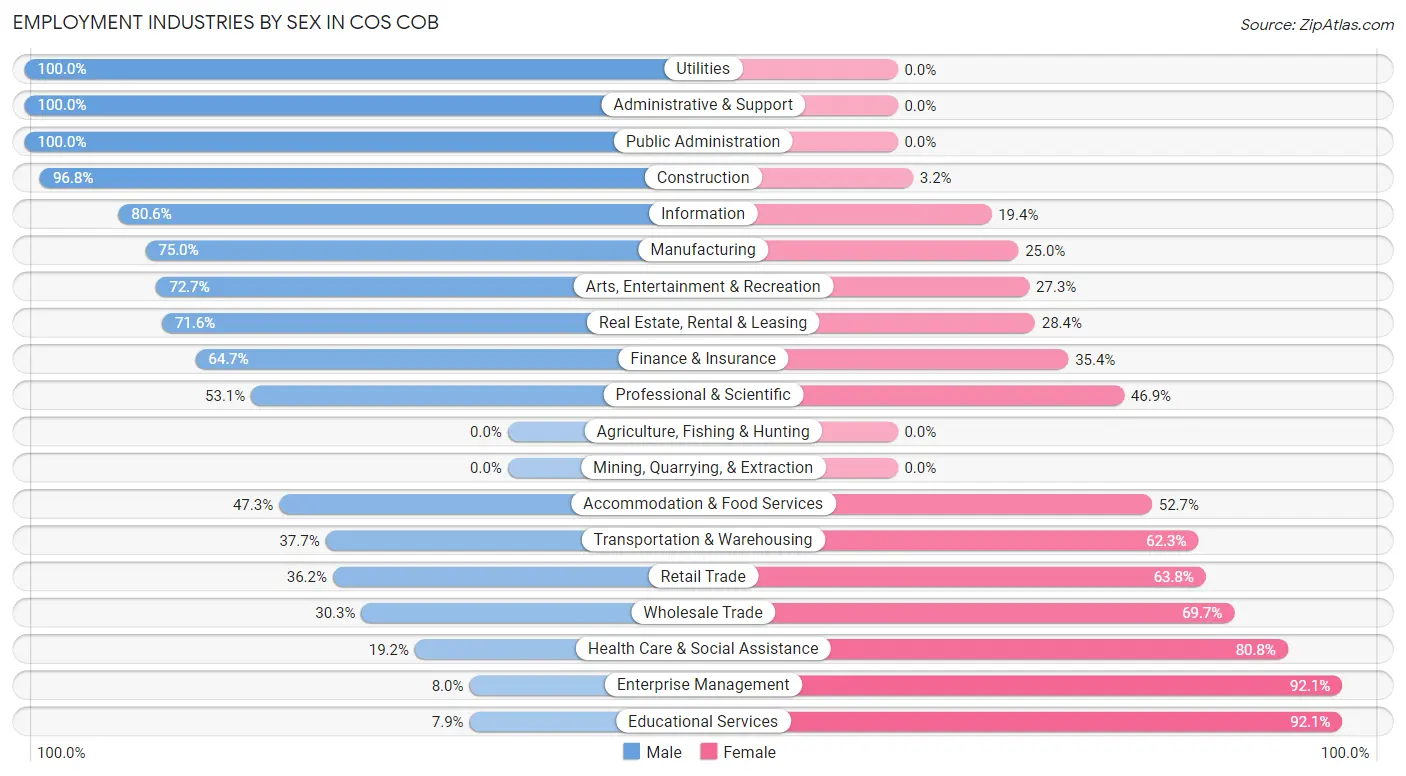
Employment Industries by Sex in Cos Cob
The Cos Cob industries that see more men than women are Utilities (100.0%), Administrative & Support (100.0%), and Public Administration (100.0%), whereas the industries that tend to have a higher number of women are Educational Services (92.1%), Enterprise Management (92.0%), and Health Care & Social Assistance (80.8%).
| Industry | Male | Female |
| Agriculture, Fishing & Hunting | 0 (0.0%) | 0 (0.0%) |
| Mining, Quarrying, & Extraction | 0 (0.0%) | 0 (0.0%) |
| Construction | 364 (96.8%) | 12 (3.2%) |
| Manufacturing | 168 (75.0%) | 56 (25.0%) |
| Wholesale Trade | 10 (30.3%) | 23 (69.7%) |
| Retail Trade | 59 (36.2%) | 104 (63.8%) |
| Transportation & Warehousing | 43 (37.7%) | 71 (62.3%) |
| Utilities | 22 (100.0%) | 0 (0.0%) |
| Information | 166 (80.6%) | 40 (19.4%) |
| Finance & Insurance | 384 (64.6%) | 210 (35.3%) |
| Real Estate, Rental & Leasing | 156 (71.6%) | 62 (28.4%) |
| Professional & Scientific | 255 (53.1%) | 225 (46.9%) |
| Enterprise Management | 7 (8.0%) | 81 (92.0%) |
| Administrative & Support | 80 (100.0%) | 0 (0.0%) |
| Educational Services | 18 (7.9%) | 209 (92.1%) |
| Health Care & Social Assistance | 70 (19.2%) | 294 (80.8%) |
| Arts, Entertainment & Recreation | 48 (72.7%) | 18 (27.3%) |
| Accommodation & Food Services | 80 (47.3%) | 89 (52.7%) |
| Public Administration | 42 (100.0%) | 0 (0.0%) |
| Total | 2,031 (54.7%) | 1,682 (45.3%) |
Education in Cos Cob
School Enrollment in Cos Cob
The most common levels of schooling among the 2,046 students in Cos Cob are high school (660 | 32.3%), elementary school (383 | 18.7%), and middle school (355 | 17.3%).
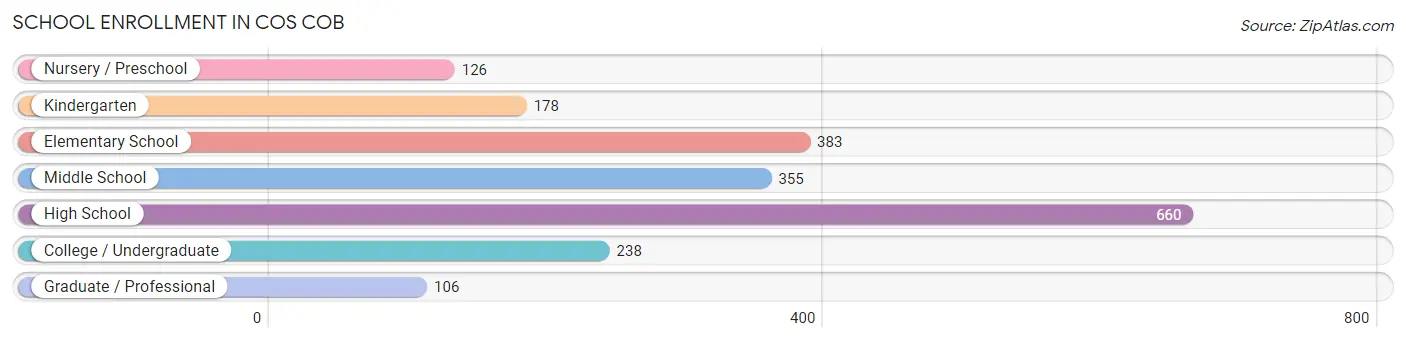
| School Level | # Students | % Students |
| Nursery / Preschool | 126 | 6.2% |
| Kindergarten | 178 | 8.7% |
| Elementary School | 383 | 18.7% |
| Middle School | 355 | 17.3% |
| High School | 660 | 32.3% |
| College / Undergraduate | 238 | 11.6% |
| Graduate / Professional | 106 | 5.2% |
| Total | 2,046 | 100.0% |
School Enrollment by Age by Funding Source in Cos Cob
Out of a total of 2,046 students who are enrolled in schools in Cos Cob, 540 (26.4%) attend a private institution, while the remaining 1,506 (73.6%) are enrolled in public schools. The age group of 20 to 24 year olds has the highest likelihood of being enrolled in private schools, with 124 (79.5% in the age bracket) enrolled. Conversely, the age group of 5 to 9 year old has the lowest likelihood of being enrolled in a private school, with 466 (93.8% in the age bracket) attending a public institution.
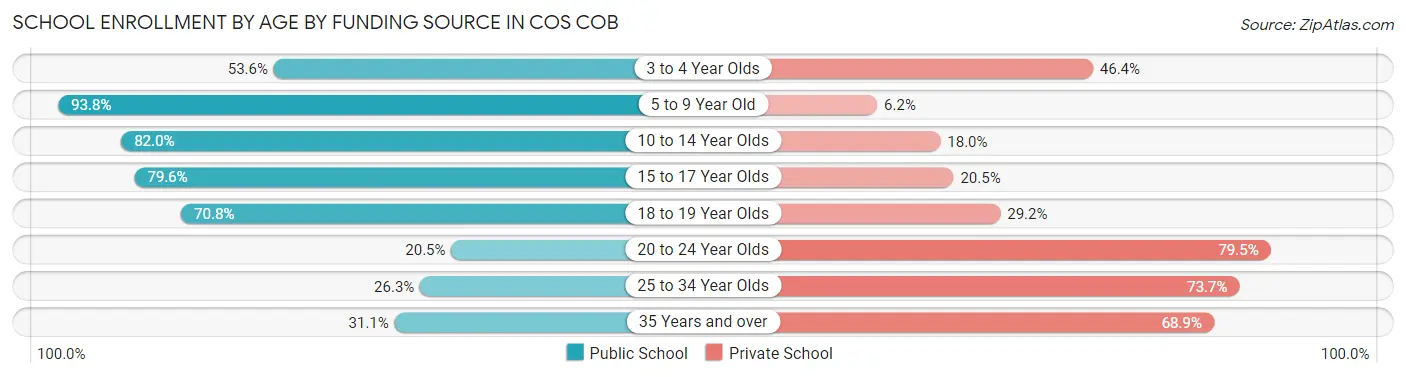
| Age Bracket | Public School | Private School |
| 3 to 4 Year Olds | 82 (53.6%) | 71 (46.4%) |
| 5 to 9 Year Old | 466 (93.8%) | 31 (6.2%) |
| 10 to 14 Year Olds | 346 (82.0%) | 76 (18.0%) |
| 15 to 17 Year Olds | 428 (79.5%) | 110 (20.4%) |
| 18 to 19 Year Olds | 119 (70.8%) | 49 (29.2%) |
| 20 to 24 Year Olds | 32 (20.5%) | 124 (79.5%) |
| 25 to 34 Year Olds | 10 (26.3%) | 28 (73.7%) |
| 35 Years and over | 23 (31.1%) | 51 (68.9%) |
| Total | 1,506 (73.6%) | 540 (26.4%) |
Educational Attainment by Field of Study in Cos Cob
Business (902 | 25.6%), social sciences (713 | 20.2%), liberal arts & history (250 | 7.1%), science & technology (205 | 5.8%), and literature & languages (195 | 5.5%) are the most common fields of study among 3,524 individuals in Cos Cob who have obtained a bachelor's degree or higher.
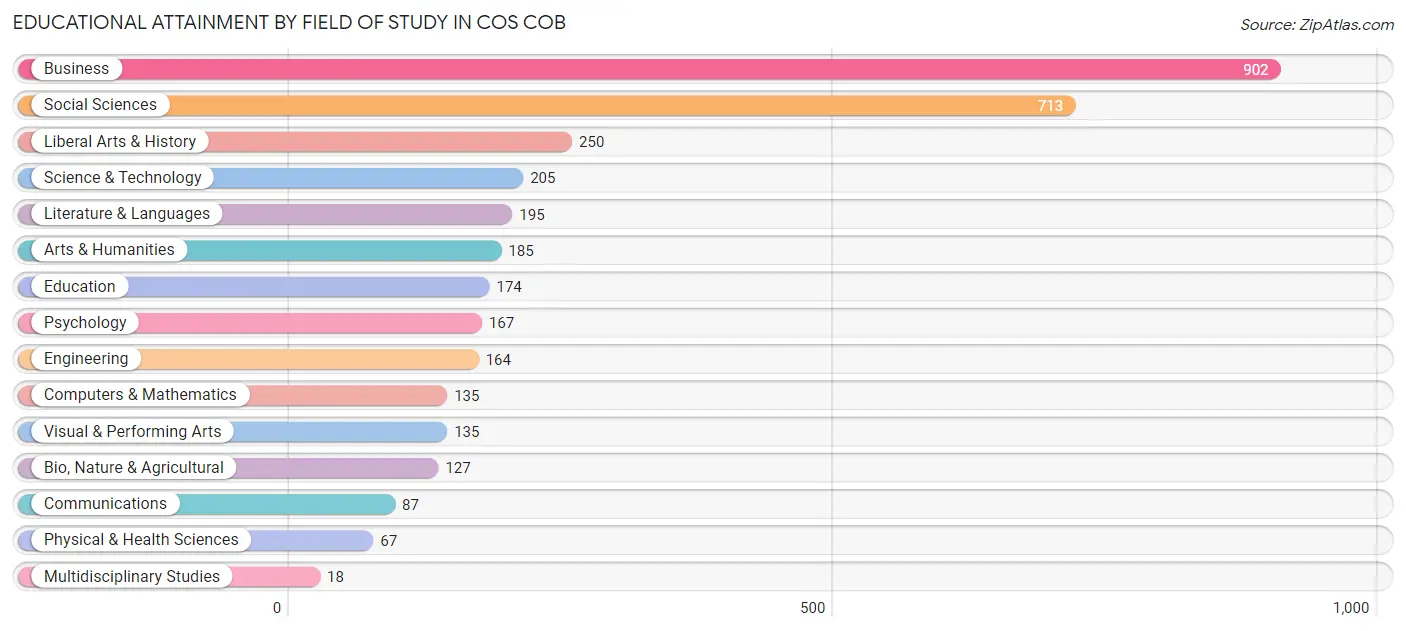
| Field of Study | # Graduates | % Graduates |
| Computers & Mathematics | 135 | 3.8% |
| Bio, Nature & Agricultural | 127 | 3.6% |
| Physical & Health Sciences | 67 | 1.9% |
| Psychology | 167 | 4.7% |
| Social Sciences | 713 | 20.2% |
| Engineering | 164 | 4.6% |
| Multidisciplinary Studies | 18 | 0.5% |
| Science & Technology | 205 | 5.8% |
| Business | 902 | 25.6% |
| Education | 174 | 4.9% |
| Literature & Languages | 195 | 5.5% |
| Liberal Arts & History | 250 | 7.1% |
| Visual & Performing Arts | 135 | 3.8% |
| Communications | 87 | 2.5% |
| Arts & Humanities | 185 | 5.2% |
| Total | 3,524 | 100.0% |
Transportation & Commute in Cos Cob
Vehicle Availability by Sex in Cos Cob
The most prevalent vehicle ownership categories in Cos Cob are males with 2 vehicles (1,101, accounting for 56.0%) and females with 2 vehicles (851, making up 65.6%).
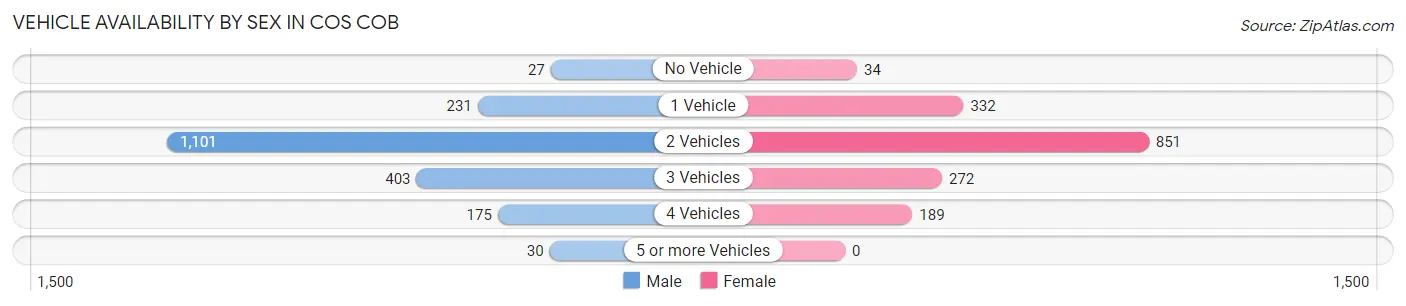
| Vehicles Available | Male | Female |
| No Vehicle | 27 (1.4%) | 34 (2.0%) |
| 1 Vehicle | 231 (11.7%) | 332 (19.8%) |
| 2 Vehicles | 1,101 (56.0%) | 851 (50.7%) |
| 3 Vehicles | 403 (20.5%) | 272 (16.2%) |
| 4 Vehicles | 175 (8.9%) | 189 (11.3%) |
| 5 or more Vehicles | 30 (1.5%) | 0 (0.0%) |
| Total | 1,967 (100.0%) | 1,678 (100.0%) |
Commute Time in Cos Cob
The most frequently occuring commute durations in Cos Cob are 10 to 14 minutes (485 commuters, 18.4%), 60 to 89 minutes (377 commuters, 14.3%), and 15 to 19 minutes (320 commuters, 12.1%).
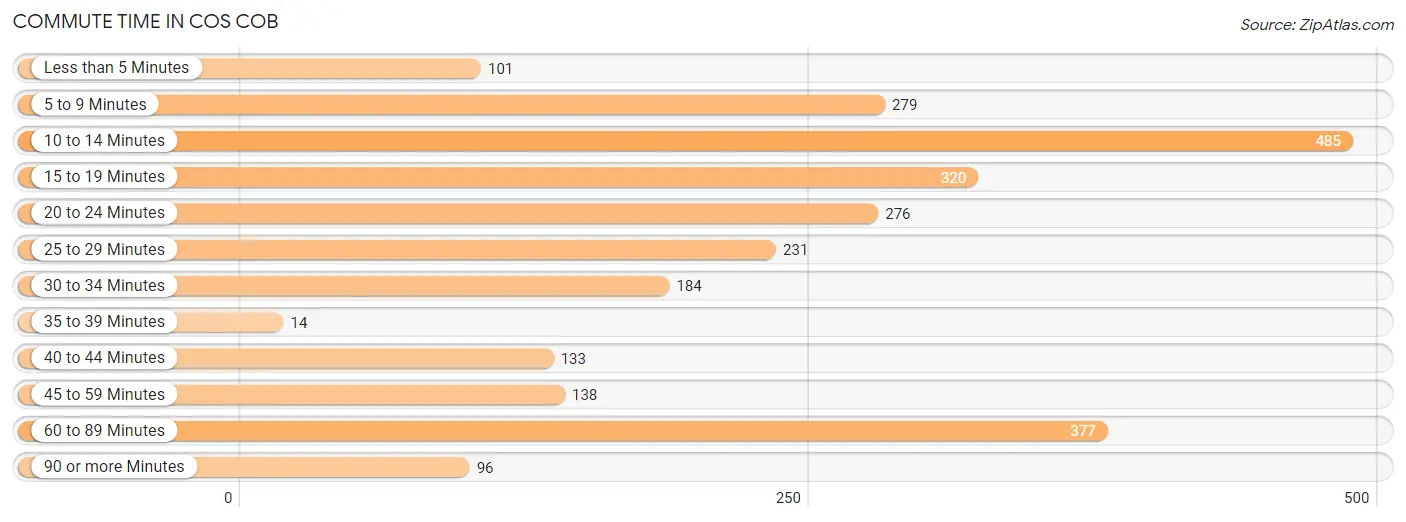
| Commute Time | # Commuters | % Commuters |
| Less than 5 Minutes | 101 | 3.8% |
| 5 to 9 Minutes | 279 | 10.6% |
| 10 to 14 Minutes | 485 | 18.4% |
| 15 to 19 Minutes | 320 | 12.1% |
| 20 to 24 Minutes | 276 | 10.5% |
| 25 to 29 Minutes | 231 | 8.8% |
| 30 to 34 Minutes | 184 | 7.0% |
| 35 to 39 Minutes | 14 | 0.5% |
| 40 to 44 Minutes | 133 | 5.1% |
| 45 to 59 Minutes | 138 | 5.2% |
| 60 to 89 Minutes | 377 | 14.3% |
| 90 or more Minutes | 96 | 3.6% |
Commute Time by Sex in Cos Cob
The most common commute times in Cos Cob are 10 to 14 minutes (336 commuters, 21.8%) for males and 15 to 19 minutes (214 commuters, 19.5%) for females.
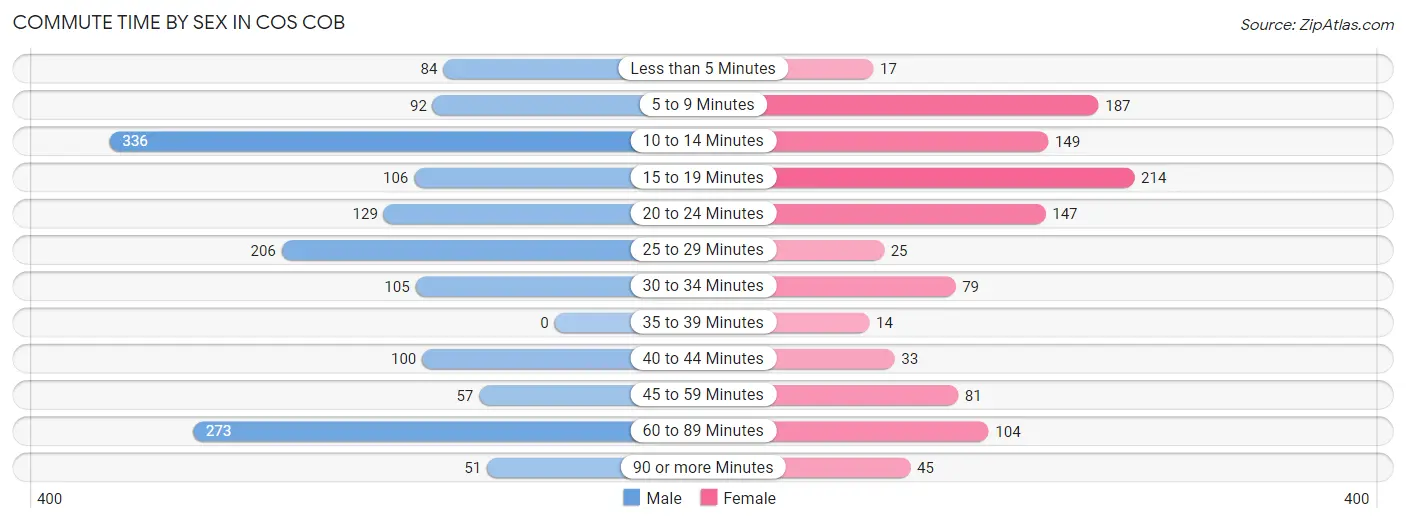
| Commute Time | Male | Female |
| Less than 5 Minutes | 84 (5.5%) | 17 (1.5%) |
| 5 to 9 Minutes | 92 (6.0%) | 187 (17.1%) |
| 10 to 14 Minutes | 336 (21.8%) | 149 (13.6%) |
| 15 to 19 Minutes | 106 (6.9%) | 214 (19.5%) |
| 20 to 24 Minutes | 129 (8.4%) | 147 (13.4%) |
| 25 to 29 Minutes | 206 (13.4%) | 25 (2.3%) |
| 30 to 34 Minutes | 105 (6.8%) | 79 (7.2%) |
| 35 to 39 Minutes | 0 (0.0%) | 14 (1.3%) |
| 40 to 44 Minutes | 100 (6.5%) | 33 (3.0%) |
| 45 to 59 Minutes | 57 (3.7%) | 81 (7.4%) |
| 60 to 89 Minutes | 273 (17.7%) | 104 (9.5%) |
| 90 or more Minutes | 51 (3.3%) | 45 (4.1%) |
Time of Departure to Work by Sex in Cos Cob
The most frequent times of departure to work in Cos Cob are 8:00 AM to 8:29 AM (299, 19.4%) for males and 8:00 AM to 8:29 AM (190, 17.3%) for females.
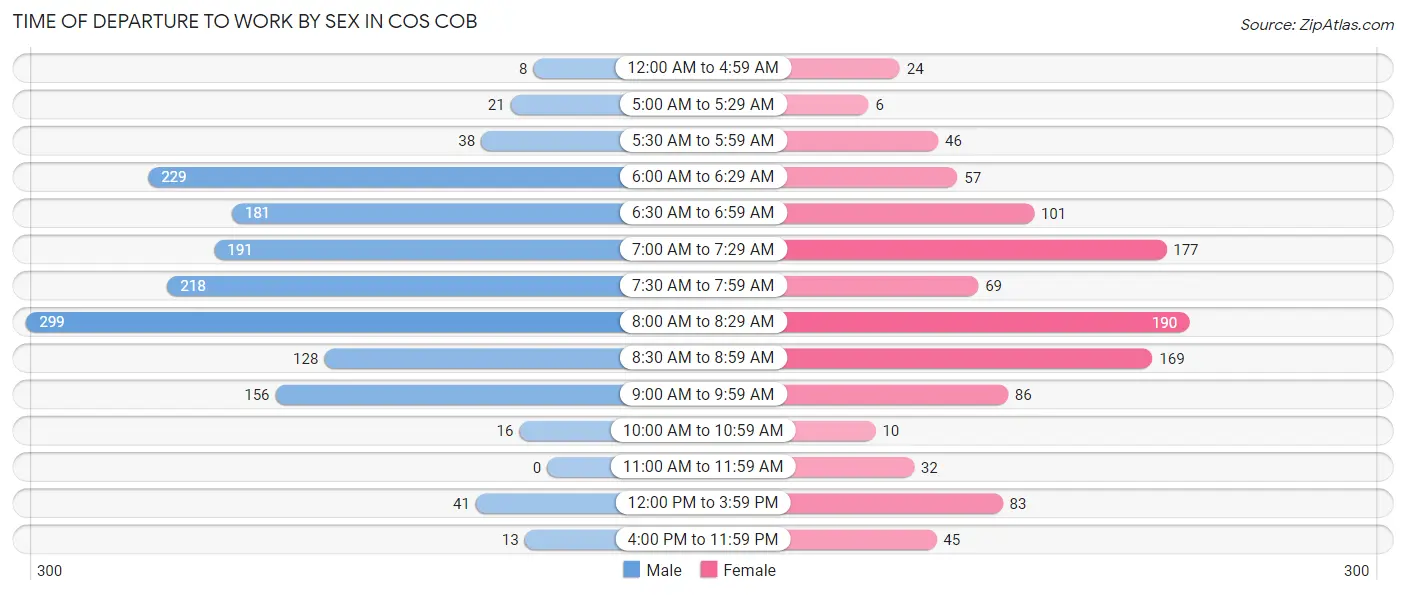
| Time of Departure | Male | Female |
| 12:00 AM to 4:59 AM | 8 (0.5%) | 24 (2.2%) |
| 5:00 AM to 5:29 AM | 21 (1.4%) | 6 (0.5%) |
| 5:30 AM to 5:59 AM | 38 (2.5%) | 46 (4.2%) |
| 6:00 AM to 6:29 AM | 229 (14.9%) | 57 (5.2%) |
| 6:30 AM to 6:59 AM | 181 (11.8%) | 101 (9.2%) |
| 7:00 AM to 7:29 AM | 191 (12.4%) | 177 (16.2%) |
| 7:30 AM to 7:59 AM | 218 (14.2%) | 69 (6.3%) |
| 8:00 AM to 8:29 AM | 299 (19.4%) | 190 (17.3%) |
| 8:30 AM to 8:59 AM | 128 (8.3%) | 169 (15.4%) |
| 9:00 AM to 9:59 AM | 156 (10.1%) | 86 (7.9%) |
| 10:00 AM to 10:59 AM | 16 (1.0%) | 10 (0.9%) |
| 11:00 AM to 11:59 AM | 0 (0.0%) | 32 (2.9%) |
| 12:00 PM to 3:59 PM | 41 (2.7%) | 83 (7.6%) |
| 4:00 PM to 11:59 PM | 13 (0.8%) | 45 (4.1%) |
| Total | 1,539 (100.0%) | 1,095 (100.0%) |
Housing Occupancy in Cos Cob
Occupancy by Ownership in Cos Cob
Of the total 2,553 dwellings in Cos Cob, owner-occupied units account for 1,686 (66.0%), while renter-occupied units make up 867 (34.0%).
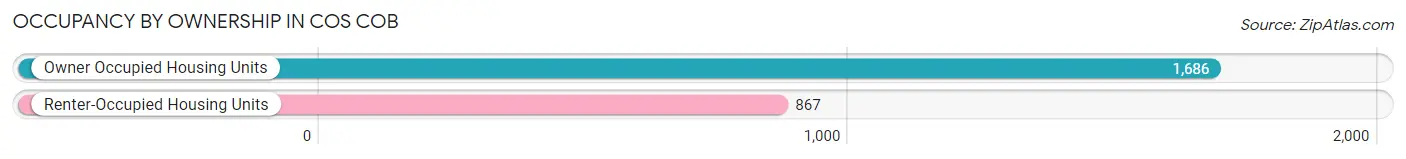
| Occupancy | # Housing Units | % Housing Units |
| Owner Occupied Housing Units | 1,686 | 66.0% |
| Renter-Occupied Housing Units | 867 | 34.0% |
| Total Occupied Housing Units | 2,553 | 100.0% |
Occupancy by Household Size in Cos Cob
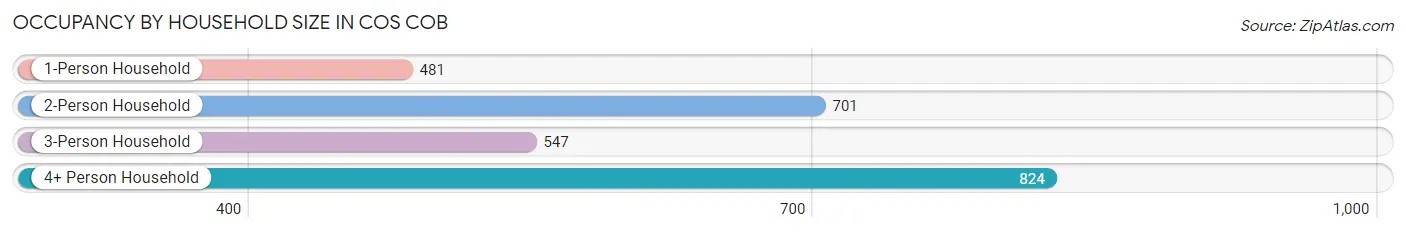
| Household Size | # Housing Units | % Housing Units |
| 1-Person Household | 481 | 18.8% |
| 2-Person Household | 701 | 27.5% |
| 3-Person Household | 547 | 21.4% |
| 4+ Person Household | 824 | 32.3% |
| Total Housing Units | 2,553 | 100.0% |
Occupancy by Ownership by Household Size in Cos Cob
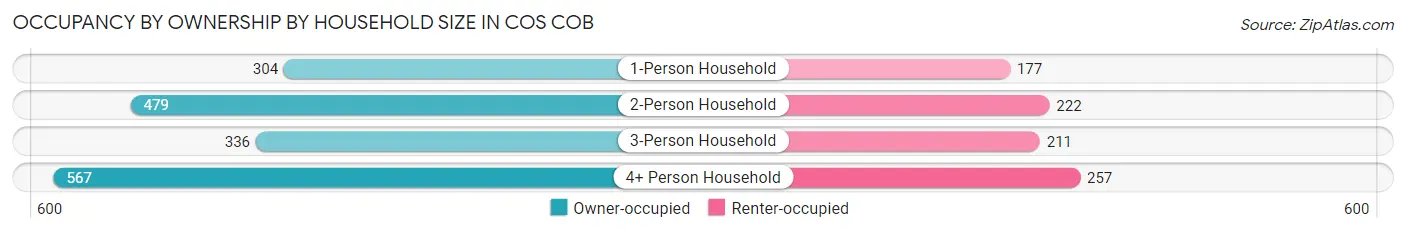
| Household Size | Owner-occupied | Renter-occupied |
| 1-Person Household | 304 (63.2%) | 177 (36.8%) |
| 2-Person Household | 479 (68.3%) | 222 (31.7%) |
| 3-Person Household | 336 (61.4%) | 211 (38.6%) |
| 4+ Person Household | 567 (68.8%) | 257 (31.2%) |
| Total Housing Units | 1,686 (66.0%) | 867 (34.0%) |
Occupancy by Educational Attainment in Cos Cob
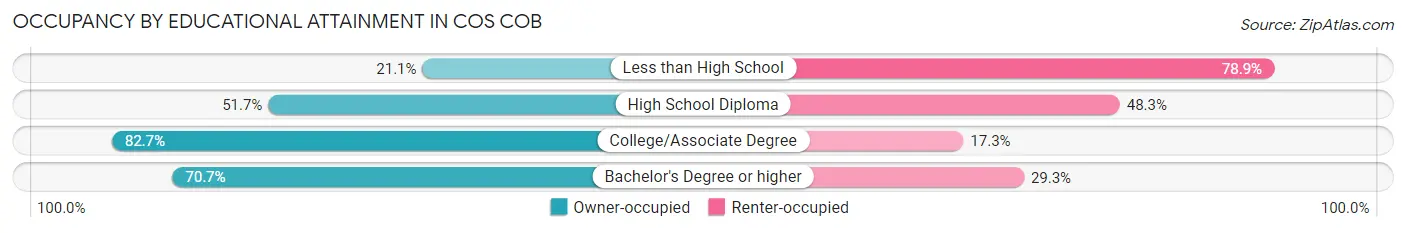
| Household Size | Owner-occupied | Renter-occupied |
| Less than High School | 37 (21.1%) | 138 (78.9%) |
| High School Diploma | 182 (51.7%) | 170 (48.3%) |
| College/Associate Degree | 239 (82.7%) | 50 (17.3%) |
| Bachelor's Degree or higher | 1,228 (70.7%) | 509 (29.3%) |
Occupancy by Age of Householder in Cos Cob
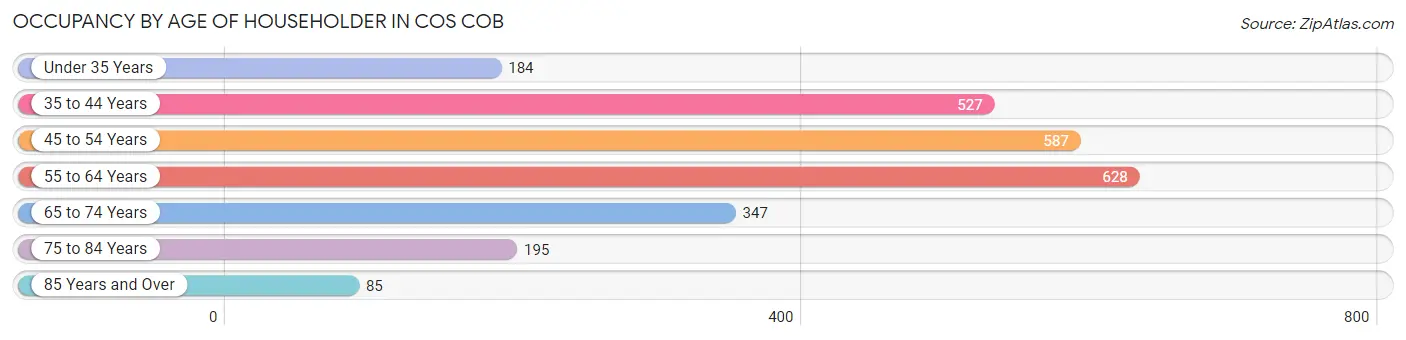
| Age Bracket | # Households | % Households |
| Under 35 Years | 184 | 7.2% |
| 35 to 44 Years | 527 | 20.6% |
| 45 to 54 Years | 587 | 23.0% |
| 55 to 64 Years | 628 | 24.6% |
| 65 to 74 Years | 347 | 13.6% |
| 75 to 84 Years | 195 | 7.6% |
| 85 Years and Over | 85 | 3.3% |
| Total | 2,553 | 100.0% |
Housing Finances in Cos Cob
Median Income by Occupancy in Cos Cob
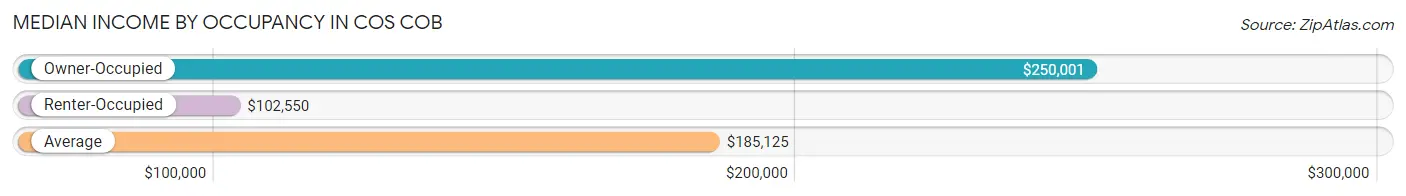
| Occupancy Type | # Households | Median Income |
| Owner-Occupied | 1,686 (66.0%) | $250,001 |
| Renter-Occupied | 867 (34.0%) | $102,550 |
| Average | 2,553 (100.0%) | $185,125 |
Occupancy by Householder Income Bracket in Cos Cob
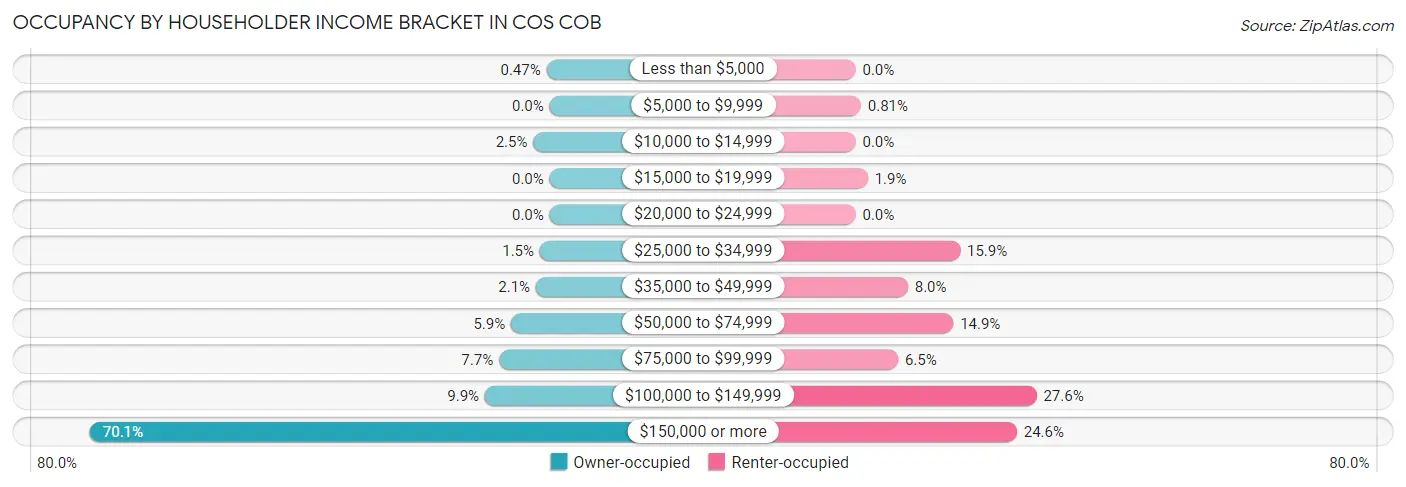
| Income Bracket | Owner-occupied | Renter-occupied |
| Less than $5,000 | 8 (0.5%) | 0 (0.0%) |
| $5,000 to $9,999 | 0 (0.0%) | 7 (0.8%) |
| $10,000 to $14,999 | 42 (2.5%) | 0 (0.0%) |
| $15,000 to $19,999 | 0 (0.0%) | 16 (1.8%) |
| $20,000 to $24,999 | 0 (0.0%) | 0 (0.0%) |
| $25,000 to $34,999 | 25 (1.5%) | 138 (15.9%) |
| $35,000 to $49,999 | 35 (2.1%) | 69 (8.0%) |
| $50,000 to $74,999 | 99 (5.9%) | 129 (14.9%) |
| $75,000 to $99,999 | 130 (7.7%) | 56 (6.5%) |
| $100,000 to $149,999 | 166 (9.9%) | 239 (27.6%) |
| $150,000 or more | 1,181 (70.1%) | 213 (24.6%) |
| Total | 1,686 (100.0%) | 867 (100.0%) |
Monthly Housing Cost Tiers in Cos Cob
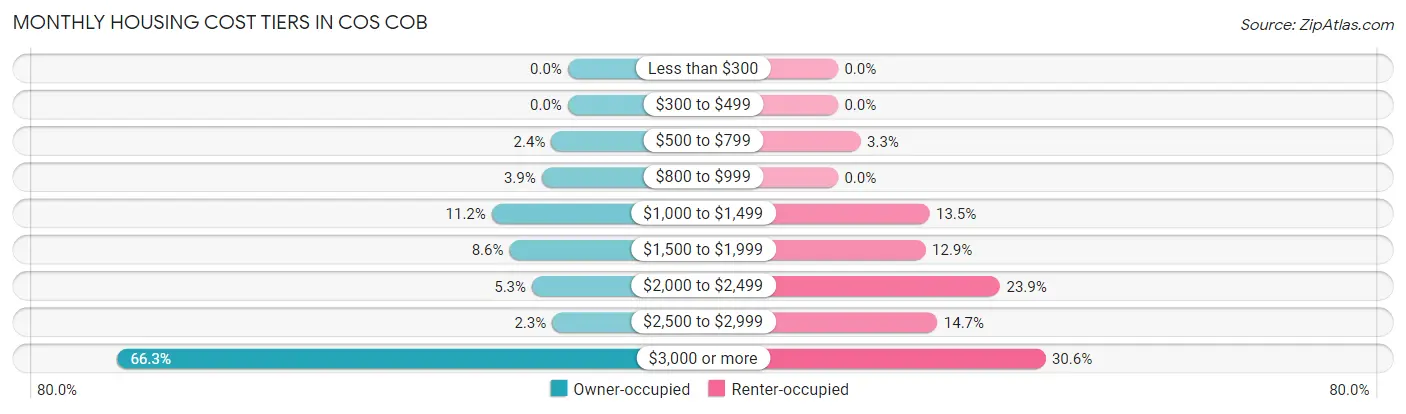
| Monthly Cost | Owner-occupied | Renter-occupied |
| Less than $300 | 0 (0.0%) | 0 (0.0%) |
| $300 to $499 | 0 (0.0%) | 0 (0.0%) |
| $500 to $799 | 41 (2.4%) | 29 (3.3%) |
| $800 to $999 | 65 (3.9%) | 0 (0.0%) |
| $1,000 to $1,499 | 189 (11.2%) | 117 (13.5%) |
| $1,500 to $1,999 | 145 (8.6%) | 112 (12.9%) |
| $2,000 to $2,499 | 89 (5.3%) | 207 (23.9%) |
| $2,500 to $2,999 | 39 (2.3%) | 127 (14.6%) |
| $3,000 or more | 1,118 (66.3%) | 265 (30.6%) |
| Total | 1,686 (100.0%) | 867 (100.0%) |
Physical Housing Characteristics in Cos Cob
Housing Structures in Cos Cob
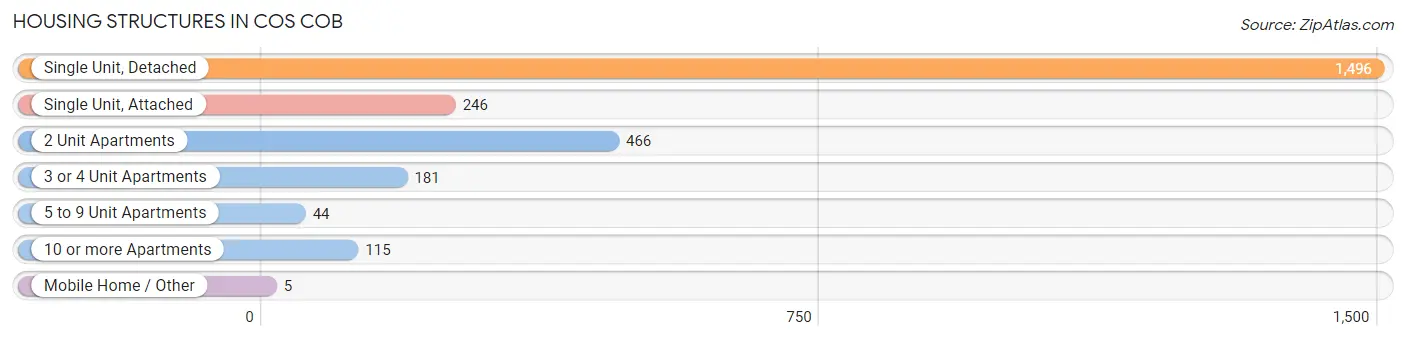
| Structure Type | # Housing Units | % Housing Units |
| Single Unit, Detached | 1,496 | 58.6% |
| Single Unit, Attached | 246 | 9.6% |
| 2 Unit Apartments | 466 | 18.2% |
| 3 or 4 Unit Apartments | 181 | 7.1% |
| 5 to 9 Unit Apartments | 44 | 1.7% |
| 10 or more Apartments | 115 | 4.5% |
| Mobile Home / Other | 5 | 0.2% |
| Total | 2,553 | 100.0% |
Housing Structures by Occupancy in Cos Cob
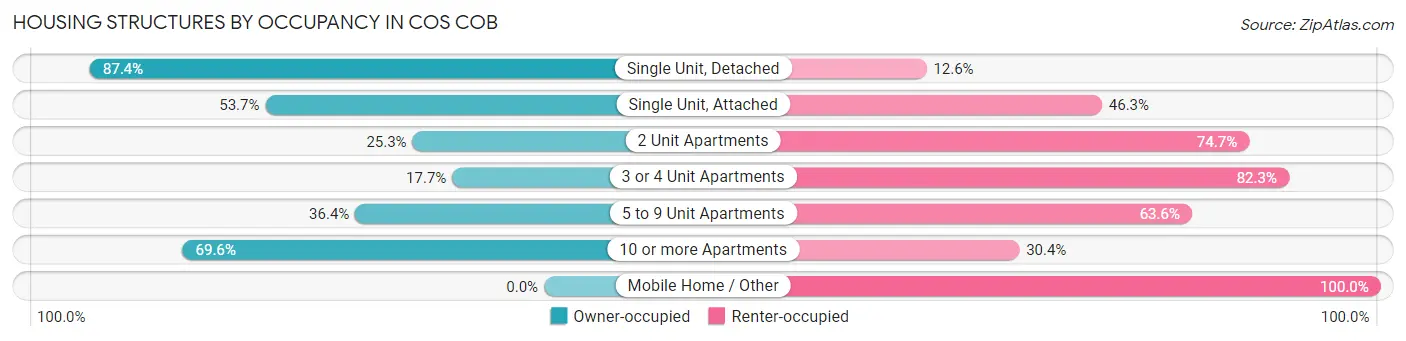
| Structure Type | Owner-occupied | Renter-occupied |
| Single Unit, Detached | 1,308 (87.4%) | 188 (12.6%) |
| Single Unit, Attached | 132 (53.7%) | 114 (46.3%) |
| 2 Unit Apartments | 118 (25.3%) | 348 (74.7%) |
| 3 or 4 Unit Apartments | 32 (17.7%) | 149 (82.3%) |
| 5 to 9 Unit Apartments | 16 (36.4%) | 28 (63.6%) |
| 10 or more Apartments | 80 (69.6%) | 35 (30.4%) |
| Mobile Home / Other | 0 (0.0%) | 5 (100.0%) |
| Total | 1,686 (66.0%) | 867 (34.0%) |
Housing Structures by Number of Rooms in Cos Cob
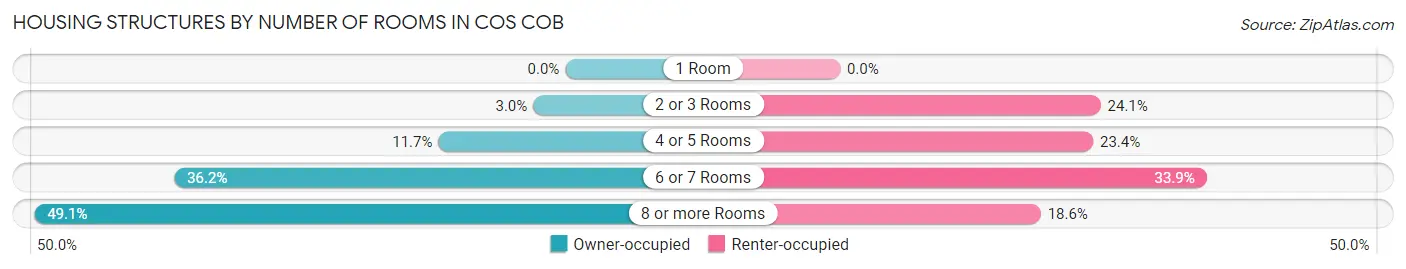
| Number of Rooms | Owner-occupied | Renter-occupied |
| 1 Room | 0 (0.0%) | 0 (0.0%) |
| 2 or 3 Rooms | 50 (3.0%) | 209 (24.1%) |
| 4 or 5 Rooms | 198 (11.7%) | 203 (23.4%) |
| 6 or 7 Rooms | 610 (36.2%) | 294 (33.9%) |
| 8 or more Rooms | 828 (49.1%) | 161 (18.6%) |
| Total | 1,686 (100.0%) | 867 (100.0%) |
Housing Structure by Heating Type in Cos Cob
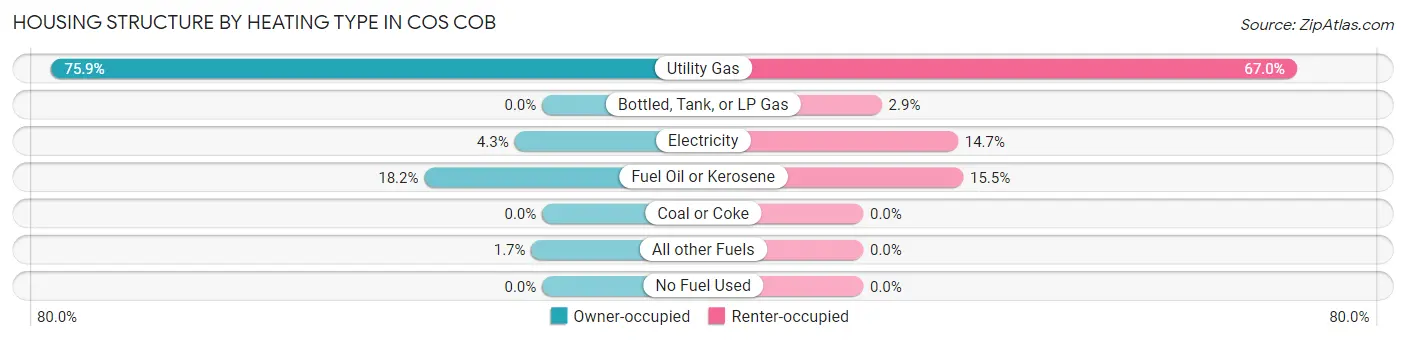
| Heating Type | Owner-occupied | Renter-occupied |
| Utility Gas | 1,279 (75.9%) | 581 (67.0%) |
| Bottled, Tank, or LP Gas | 0 (0.0%) | 25 (2.9%) |
| Electricity | 72 (4.3%) | 127 (14.6%) |
| Fuel Oil or Kerosene | 307 (18.2%) | 134 (15.5%) |
| Coal or Coke | 0 (0.0%) | 0 (0.0%) |
| All other Fuels | 28 (1.7%) | 0 (0.0%) |
| No Fuel Used | 0 (0.0%) | 0 (0.0%) |
| Total | 1,686 (100.0%) | 867 (100.0%) |
Household Vehicle Usage in Cos Cob
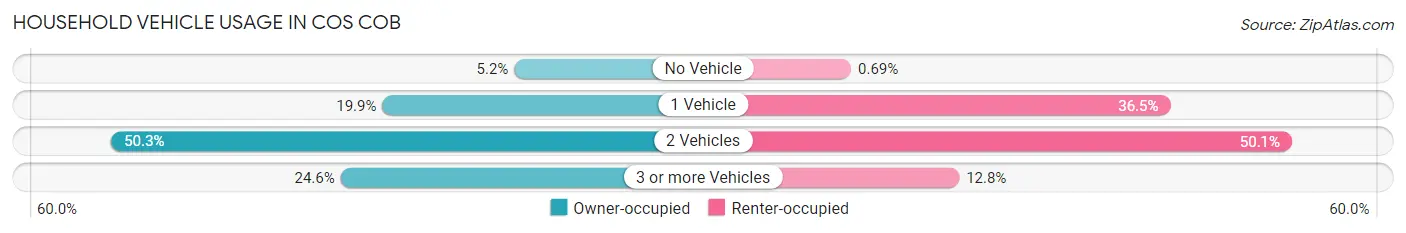
| Vehicles per Household | Owner-occupied | Renter-occupied |
| No Vehicle | 87 (5.2%) | 6 (0.7%) |
| 1 Vehicle | 336 (19.9%) | 316 (36.4%) |
| 2 Vehicles | 848 (50.3%) | 434 (50.1%) |
| 3 or more Vehicles | 415 (24.6%) | 111 (12.8%) |
| Total | 1,686 (100.0%) | 867 (100.0%) |
Real Estate & Mortgages in Cos Cob
Real Estate and Mortgage Overview in Cos Cob
| Characteristic | Without Mortgage | With Mortgage |
| Housing Units | 463 | 1,223 |
| Median Property Value | $1,230,100 | $1,121,300 |
| Median Household Income | $141,991 | $955 |
| Monthly Housing Costs | $1,450 | $1,019 |
| Real Estate Taxes | $8,523 | $0 |
Property Value by Mortgage Status in Cos Cob
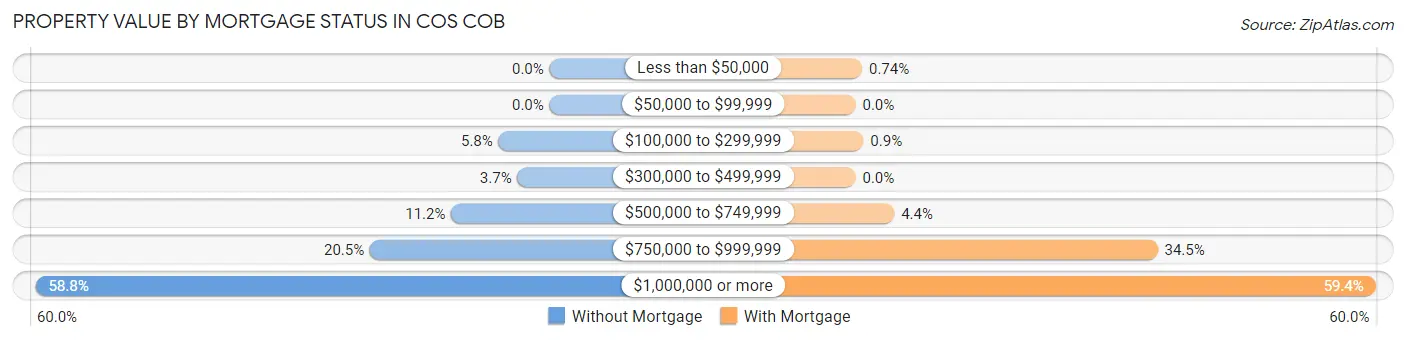
| Property Value | Without Mortgage | With Mortgage |
| Less than $50,000 | 0 (0.0%) | 9 (0.7%) |
| $50,000 to $99,999 | 0 (0.0%) | 0 (0.0%) |
| $100,000 to $299,999 | 27 (5.8%) | 11 (0.9%) |
| $300,000 to $499,999 | 17 (3.7%) | 0 (0.0%) |
| $500,000 to $749,999 | 52 (11.2%) | 54 (4.4%) |
| $750,000 to $999,999 | 95 (20.5%) | 422 (34.5%) |
| $1,000,000 or more | 272 (58.8%) | 727 (59.4%) |
| Total | 463 (100.0%) | 1,223 (100.0%) |
Household Income by Mortgage Status in Cos Cob
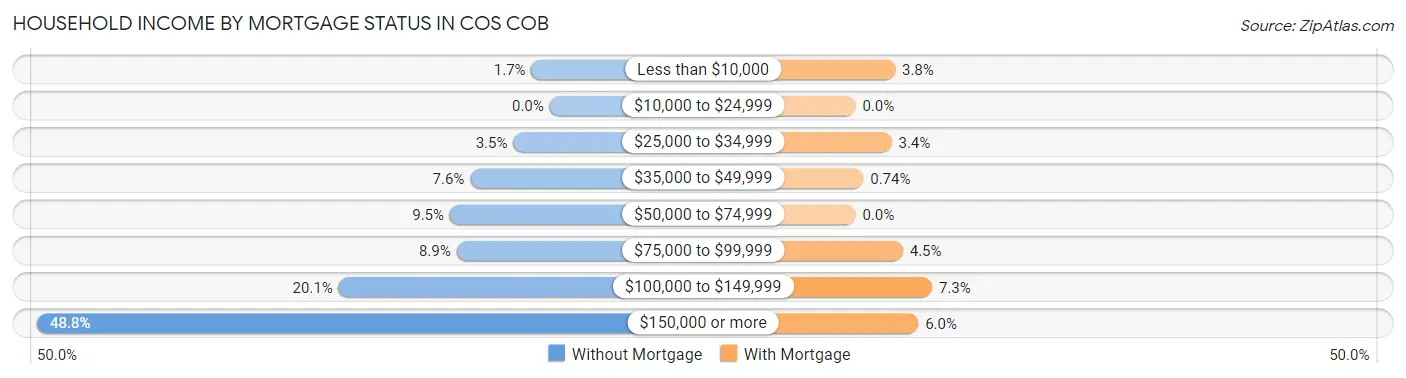
| Household Income | Without Mortgage | With Mortgage |
| Less than $10,000 | 8 (1.7%) | 46 (3.8%) |
| $10,000 to $24,999 | 0 (0.0%) | 0 (0.0%) |
| $25,000 to $34,999 | 16 (3.5%) | 42 (3.4%) |
| $35,000 to $49,999 | 35 (7.6%) | 9 (0.7%) |
| $50,000 to $74,999 | 44 (9.5%) | 0 (0.0%) |
| $75,000 to $99,999 | 41 (8.9%) | 55 (4.5%) |
| $100,000 to $149,999 | 93 (20.1%) | 89 (7.3%) |
| $150,000 or more | 226 (48.8%) | 73 (6.0%) |
| Total | 463 (100.0%) | 1,223 (100.0%) |
Property Value to Household Income Ratio in Cos Cob
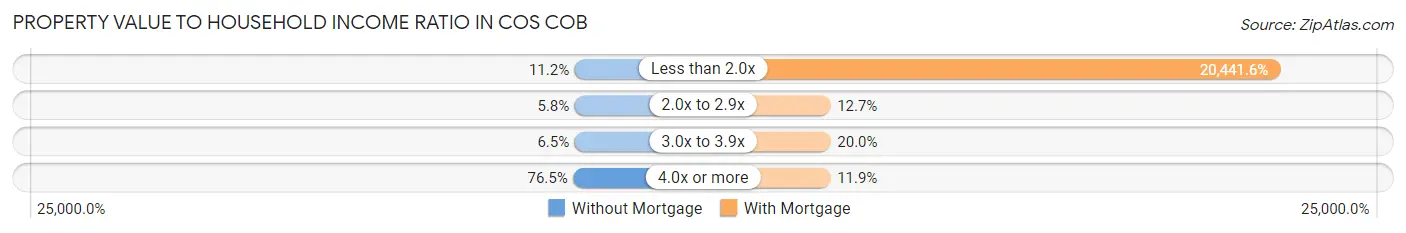
| Value-to-Income Ratio | Without Mortgage | With Mortgage |
| Less than 2.0x | 52 (11.2%) | 250,001 (20,441.6%) |
| 2.0x to 2.9x | 27 (5.8%) | 155 (12.7%) |
| 3.0x to 3.9x | 30 (6.5%) | 244 (20.0%) |
| 4.0x or more | 354 (76.5%) | 146 (11.9%) |
| Total | 463 (100.0%) | 1,223 (100.0%) |
Real Estate Taxes by Mortgage Status in Cos Cob
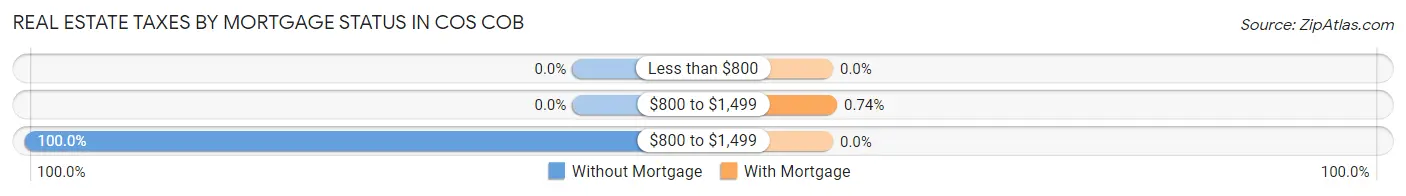
| Property Taxes | Without Mortgage | With Mortgage |
| Less than $800 | 0 (0.0%) | 0 (0.0%) |
| $800 to $1,499 | 0 (0.0%) | 9 (0.7%) |
| $800 to $1,499 | 463 (100.0%) | 0 (0.0%) |
| Total | 463 (100.0%) | 1,223 (100.0%) |
Health & Disability in Cos Cob
Health Insurance Coverage by Age in Cos Cob
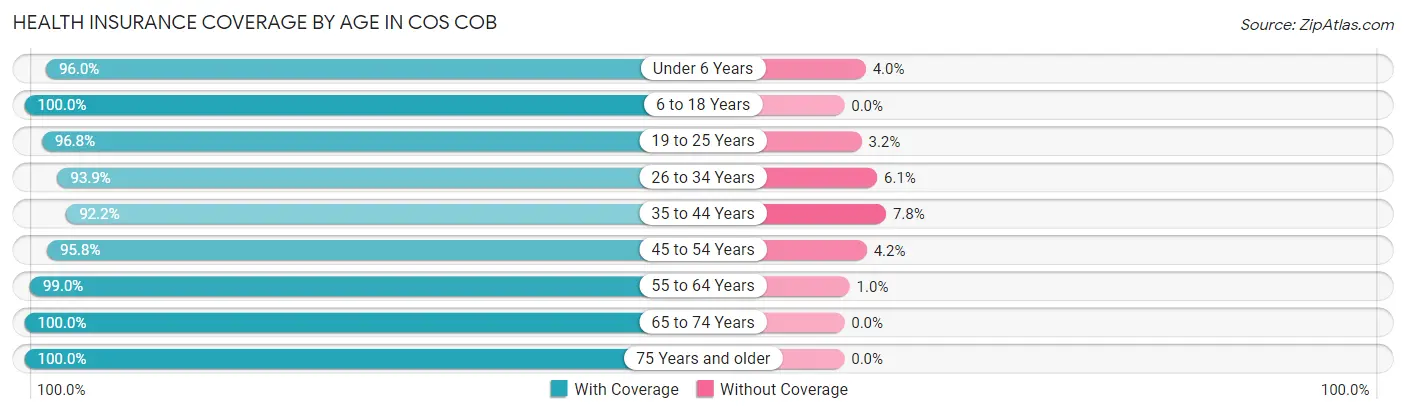
| Age Bracket | With Coverage | Without Coverage |
| Under 6 Years | 697 (96.0%) | 29 (4.0%) |
| 6 to 18 Years | 1,408 (100.0%) | 0 (0.0%) |
| 19 to 25 Years | 392 (96.8%) | 13 (3.2%) |
| 26 to 34 Years | 522 (93.9%) | 34 (6.1%) |
| 35 to 44 Years | 938 (92.2%) | 79 (7.8%) |
| 45 to 54 Years | 1,032 (95.8%) | 45 (4.2%) |
| 55 to 64 Years | 986 (99.0%) | 10 (1.0%) |
| 65 to 74 Years | 625 (100.0%) | 0 (0.0%) |
| 75 Years and older | 426 (100.0%) | 0 (0.0%) |
| Total | 7,026 (97.1%) | 210 (2.9%) |
Health Insurance Coverage by Citizenship Status in Cos Cob
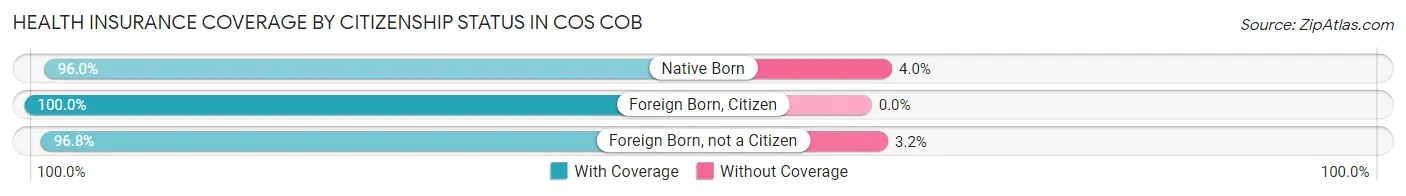
| Citizenship Status | With Coverage | Without Coverage |
| Native Born | 697 (96.0%) | 29 (4.0%) |
| Foreign Born, Citizen | 1,408 (100.0%) | 0 (0.0%) |
| Foreign Born, not a Citizen | 392 (96.8%) | 13 (3.2%) |
Health Insurance Coverage by Household Income in Cos Cob
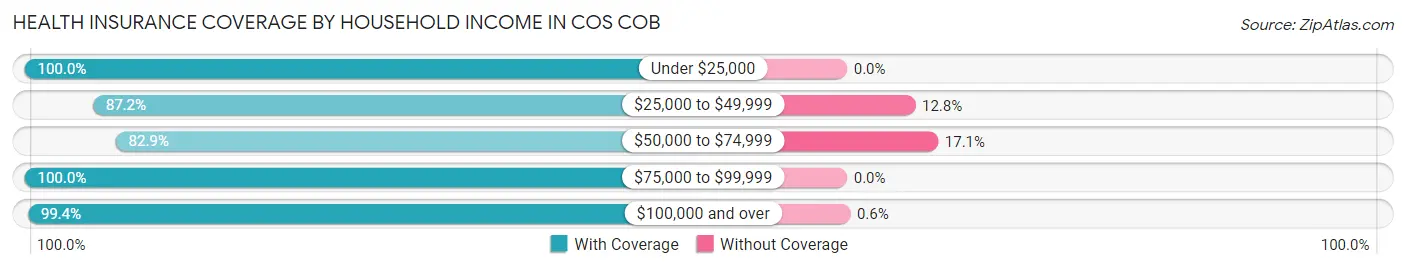
| Household Income | With Coverage | Without Coverage |
| Under $25,000 | 115 (100.0%) | 0 (0.0%) |
| $25,000 to $49,999 | 662 (87.2%) | 97 (12.8%) |
| $50,000 to $74,999 | 389 (82.9%) | 80 (17.1%) |
| $75,000 to $99,999 | 380 (100.0%) | 0 (0.0%) |
| $100,000 and over | 5,454 (99.4%) | 33 (0.6%) |
Public vs Private Health Insurance Coverage by Age in Cos Cob
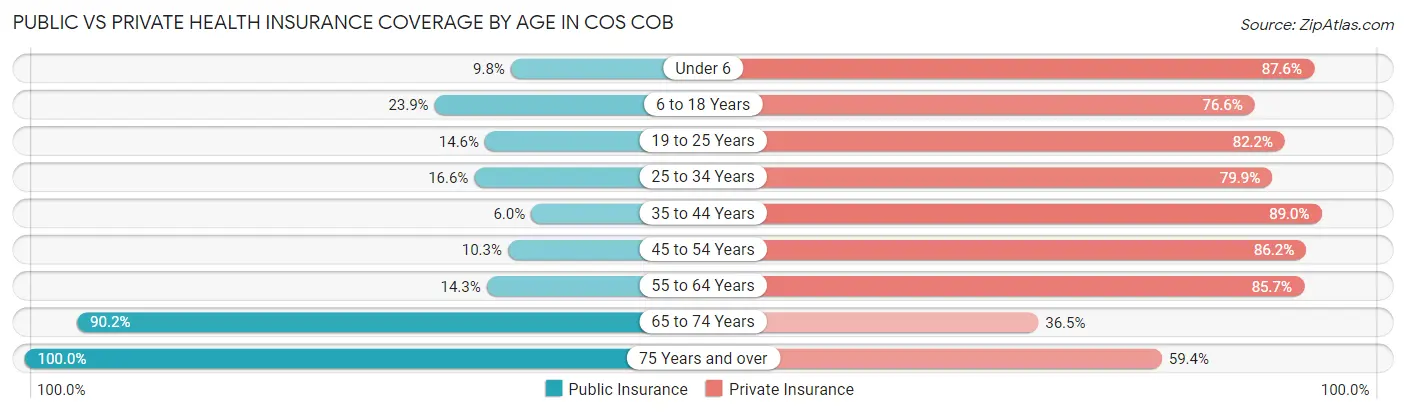
| Age Bracket | Public Insurance | Private Insurance |
| Under 6 | 71 (9.8%) | 636 (87.6%) |
| 6 to 18 Years | 337 (23.9%) | 1,079 (76.6%) |
| 19 to 25 Years | 59 (14.6%) | 333 (82.2%) |
| 25 to 34 Years | 92 (16.6%) | 444 (79.9%) |
| 35 to 44 Years | 61 (6.0%) | 905 (89.0%) |
| 45 to 54 Years | 111 (10.3%) | 928 (86.2%) |
| 55 to 64 Years | 142 (14.3%) | 854 (85.7%) |
| 65 to 74 Years | 564 (90.2%) | 228 (36.5%) |
| 75 Years and over | 426 (100.0%) | 253 (59.4%) |
| Total | 1,863 (25.8%) | 5,660 (78.2%) |
Disability Status by Sex by Age in Cos Cob
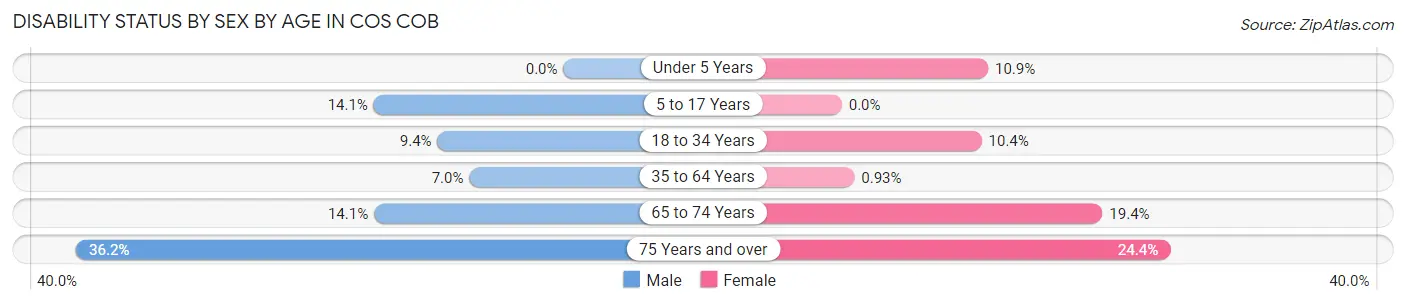
| Age Bracket | Male | Female |
| Under 5 Years | 0 (0.0%) | 33 (10.9%) |
| 5 to 17 Years | 98 (14.1%) | 0 (0.0%) |
| 18 to 34 Years | 42 (9.3%) | 63 (10.4%) |
| 35 to 64 Years | 103 (7.0%) | 15 (0.9%) |
| 65 to 74 Years | 53 (14.1%) | 48 (19.4%) |
| 75 Years and over | 68 (36.2%) | 58 (24.4%) |
Disability Class by Sex by Age in Cos Cob
Disability Class: Hearing Difficulty
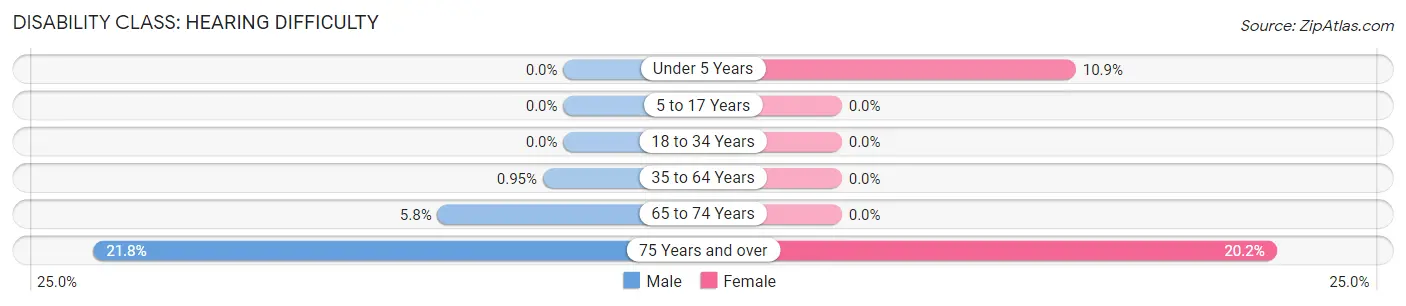
| Age Bracket | Male | Female |
| Under 5 Years | 0 (0.0%) | 33 (10.9%) |
| 5 to 17 Years | 0 (0.0%) | 0 (0.0%) |
| 18 to 34 Years | 0 (0.0%) | 0 (0.0%) |
| 35 to 64 Years | 14 (0.9%) | 0 (0.0%) |
| 65 to 74 Years | 22 (5.8%) | 0 (0.0%) |
| 75 Years and over | 41 (21.8%) | 48 (20.2%) |
Disability Class: Vision Difficulty
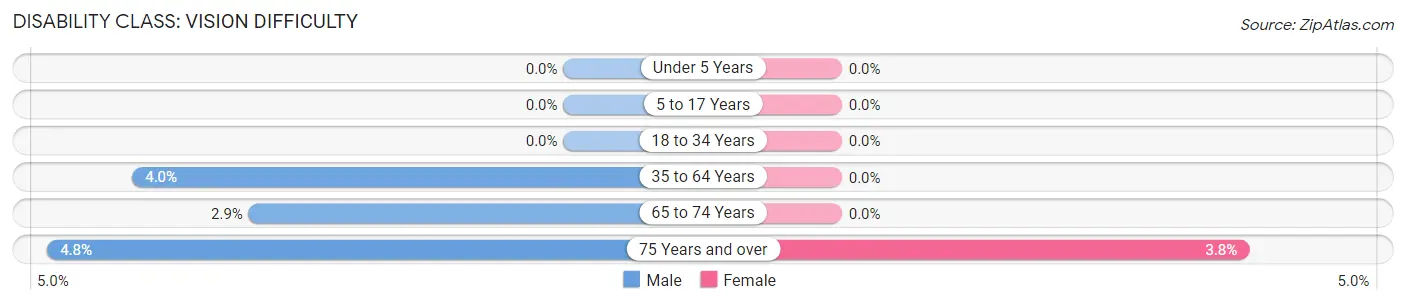
| Age Bracket | Male | Female |
| Under 5 Years | 0 (0.0%) | 0 (0.0%) |
| 5 to 17 Years | 0 (0.0%) | 0 (0.0%) |
| 18 to 34 Years | 0 (0.0%) | 0 (0.0%) |
| 35 to 64 Years | 59 (4.0%) | 0 (0.0%) |
| 65 to 74 Years | 11 (2.9%) | 0 (0.0%) |
| 75 Years and over | 9 (4.8%) | 9 (3.8%) |
Disability Class: Cognitive Difficulty
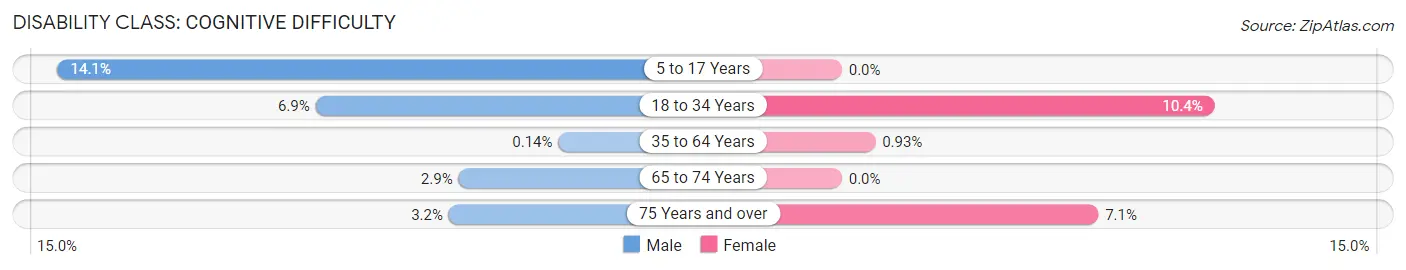
| Age Bracket | Male | Female |
| 5 to 17 Years | 98 (14.1%) | 0 (0.0%) |
| 18 to 34 Years | 31 (6.9%) | 63 (10.4%) |
| 35 to 64 Years | 2 (0.1%) | 15 (0.9%) |
| 65 to 74 Years | 11 (2.9%) | 0 (0.0%) |
| 75 Years and over | 6 (3.2%) | 17 (7.1%) |
Disability Class: Ambulatory Difficulty

| Age Bracket | Male | Female |
| 5 to 17 Years | 0 (0.0%) | 0 (0.0%) |
| 18 to 34 Years | 0 (0.0%) | 0 (0.0%) |
| 35 to 64 Years | 48 (3.3%) | 7 (0.4%) |
| 65 to 74 Years | 40 (10.6%) | 39 (15.7%) |
| 75 Years and over | 13 (6.9%) | 26 (10.9%) |
Disability Class: Self-Care Difficulty
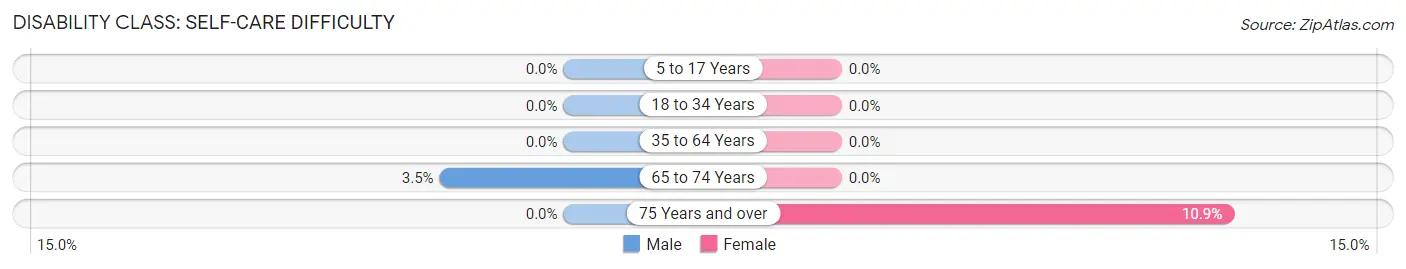
| Age Bracket | Male | Female |
| 5 to 17 Years | 0 (0.0%) | 0 (0.0%) |
| 18 to 34 Years | 0 (0.0%) | 0 (0.0%) |
| 35 to 64 Years | 0 (0.0%) | 0 (0.0%) |
| 65 to 74 Years | 13 (3.5%) | 0 (0.0%) |
| 75 Years and over | 0 (0.0%) | 26 (10.9%) |
Technology Access in Cos Cob
Computing Device Access in Cos Cob
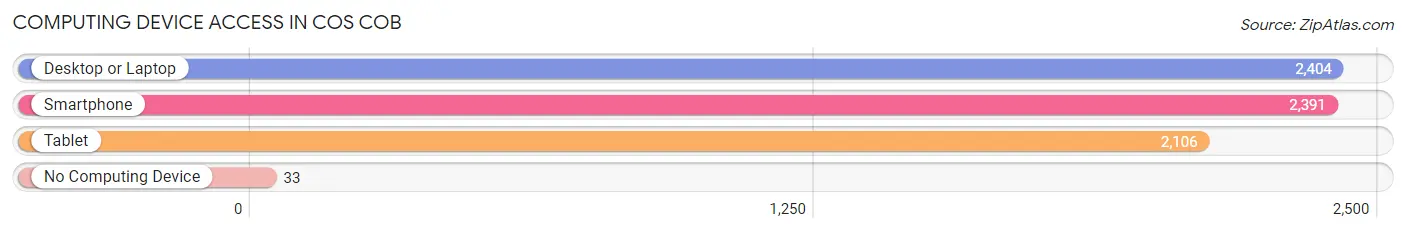
| Device Type | # Households | % Households |
| Desktop or Laptop | 2,404 | 94.2% |
| Smartphone | 2,391 | 93.6% |
| Tablet | 2,106 | 82.5% |
| No Computing Device | 33 | 1.3% |
| Total | 2,553 | 100.0% |
Internet Access in Cos Cob
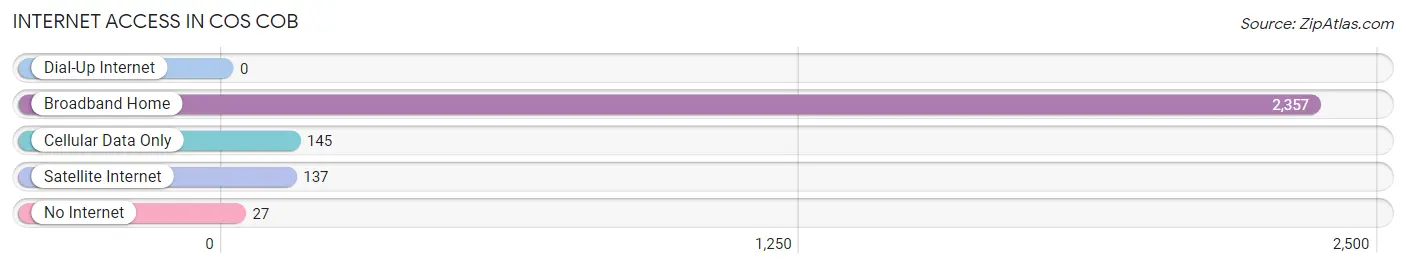
| Internet Type | # Households | % Households |
| Dial-Up Internet | 0 | 0.0% |
| Broadband Home | 2,357 | 92.3% |
| Cellular Data Only | 145 | 5.7% |
| Satellite Internet | 137 | 5.4% |
| No Internet | 27 | 1.1% |
| Total | 2,553 | 100.0% |
Cos Cob Summary
History
Cos Cob is a small neighborhood located in the town of Greenwich, Connecticut. It is situated on the Mianus River, which is a tributary of the Long Island Sound. The area was originally inhabited by the Siwanoy Native American tribe, who called it “Pauquioque”, meaning “place of the reeds”. The first European settlers arrived in the area in 1640, and the town was officially incorporated in 1845.
The area was originally known as “Cockenoe”, and was a farming community. In the late 19th century, the area began to develop as a summer resort destination, and many wealthy New Yorkers built large estates in the area. The area was renamed “Cos Cob” in 1892, after the local Indian chief, Chief Cob.
In the early 20th century, the area began to develop as a commuter suburb of New York City. The area was served by the New York, New Haven and Hartford Railroad, and the area began to grow rapidly. The area was also home to a large number of artists and writers, including Mark Twain, who lived in the area for a time.
Geography
Cos Cob is located in the town of Greenwich, Connecticut, in Fairfield County. It is situated on the Mianus River, which is a tributary of the Long Island Sound. The area is bordered by the towns of Stamford to the north, Port Chester to the east, and Rye to the south. The area is approximately 4.5 square miles in size, and is mostly residential.
The area is mostly flat, with some hills in the northern part of the neighborhood. The area is mostly wooded, with some open fields and wetlands. The area is home to several parks, including the Mianus River Park, which is a popular spot for fishing, hiking, and bird watching.
Economy
Cos Cob is primarily a residential area, and the economy is largely based on the service industry. The area is home to a number of small businesses, including restaurants, retail stores, and professional services. The area is also home to a number of corporate offices, including the headquarters of the global financial services firm, UBS.
The area is also home to a number of educational institutions, including the University of Connecticut’s Stamford campus, and the Greenwich Country Day School. The area is also home to a number of cultural institutions, including the Bruce Museum of Arts and Science, and the Greenwich Historical Society.
Demographics
As of the 2010 census, the population of Cos Cob was 6,770. The population is largely white (90.2%), with a small percentage of African Americans (3.2%), Asians (2.7%), and Hispanics (2.3%). The median household income is $117,945, and the median home value is $1,072,400. The area is largely affluent, and is home to a number of wealthy residents.
Conclusion
Cos Cob is a small neighborhood located in the town of Greenwich, Connecticut. It is situated on the Mianus River, and is a popular destination for summer vacationers and commuters to New York City. The area is largely residential, and the economy is largely based on the service industry. The population is largely white, and the area is largely affluent.
Common Questions
What is Per Capita Income in Cos Cob?
Per Capita income in Cos Cob is $93,314.
What is the Median Family Income in Cos Cob?
Median Family Income in Cos Cob is $209,913.
What is the Median Household income in Cos Cob?
Median Household Income in Cos Cob is $185,125.
What is Income or Wage Gap in Cos Cob?
Income or Wage Gap in Cos Cob is 31.8%.
Women in Cos Cob earn 68.2 cents for every dollar earned by a man.
What is Inequality or Gini Index in Cos Cob?
Inequality or Gini Index in Cos Cob is 0.49.
What is the Total Population of Cos Cob?
Total Population of Cos Cob is 7,243.
What is the Total Male Population of Cos Cob?
Total Male Population of Cos Cob is 3,462.
What is the Total Female Population of Cos Cob?
Total Female Population of Cos Cob is 3,781.
What is the Ratio of Males per 100 Females in Cos Cob?
There are 91.56 Males per 100 Females in Cos Cob.
What is the Ratio of Females per 100 Males in Cos Cob?
There are 109.21 Females per 100 Males in Cos Cob.
What is the Median Population Age in Cos Cob?
Median Population Age in Cos Cob is 39.7 Years.
What is the Average Family Size in Cos Cob
Average Family Size in Cos Cob is 3.2 People.
What is the Average Household Size in Cos Cob
Average Household Size in Cos Cob is 2.8 People.
How Large is the Labor Force in Cos Cob?
There are 3,963 People in the Labor Forcein in Cos Cob.
What is the Percentage of People in the Labor Force in Cos Cob?
70.7% of People are in the Labor Force in Cos Cob.
What is the Unemployment Rate in Cos Cob?
Unemployment Rate in Cos Cob is 6.3%.