Mansfield Center, CT Map & Demographics
Mansfield Center Map
Mansfield Center Overview
$46,815
PER CAPITA INCOME
$128,750
AVG FAMILY INCOME
$115,655
AVG HOUSEHOLD INCOME
43.2%
WAGE / INCOME GAP [ % ]
56.8¢/ $1
WAGE / INCOME GAP [ $ ]
0.37
INEQUALITY / GINI INDEX
1,281
TOTAL POPULATION
544
MALE POPULATION
737
FEMALE POPULATION
73.81
MALES / 100 FEMALES
135.48
FEMALES / 100 MALES
51.6
MEDIAN AGE
3.4
AVG FAMILY SIZE
2.5
AVG HOUSEHOLD SIZE
552
LABOR FORCE [ PEOPLE ]
47.9%
PERCENT IN LABOR FORCE
3.4%
UNEMPLOYMENT RATE
Mansfield Center Zip Codes
Mansfield Center Area Codes
Income in Mansfield Center
Income Overview in Mansfield Center
Per Capita Income in Mansfield Center is $46,815, while median incomes of families and households are $128,750 and $115,655 respectively.
| Characteristic | Number | Measure |
| Per Capita Income | 1,281 | $46,815 |
| Median Family Income | 298 | $128,750 |
| Mean Family Income | 298 | $131,536 |
| Median Household Income | 505 | $115,655 |
| Mean Household Income | 505 | $116,428 |
| Income Deficit | 298 | $0 |
| Wage / Income Gap (%) | 1,281 | 43.22% |
| Wage / Income Gap ($) | 1,281 | 56.78¢ per $1 |
| Gini / Inequality Index | 1,281 | 0.37 |
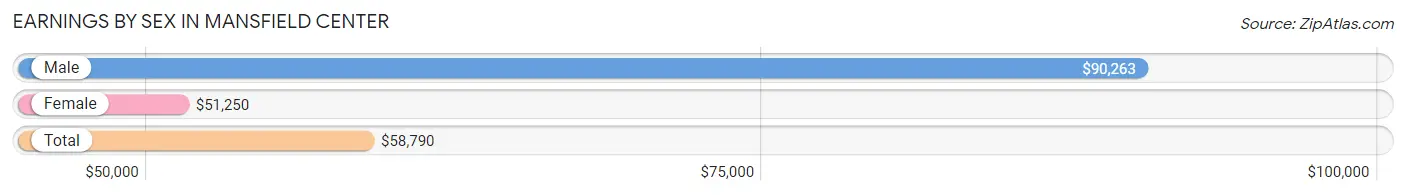
Earnings by Sex in Mansfield Center
Average Earnings in Mansfield Center are $58,790, $90,263 for men and $51,250 for women, a difference of 43.2%.
| Sex | Number | Average Earnings |
| Male | 376 (61.2%) | $90,263 |
| Female | 238 (38.8%) | $51,250 |
| Total | 614 (100.0%) | $58,790 |
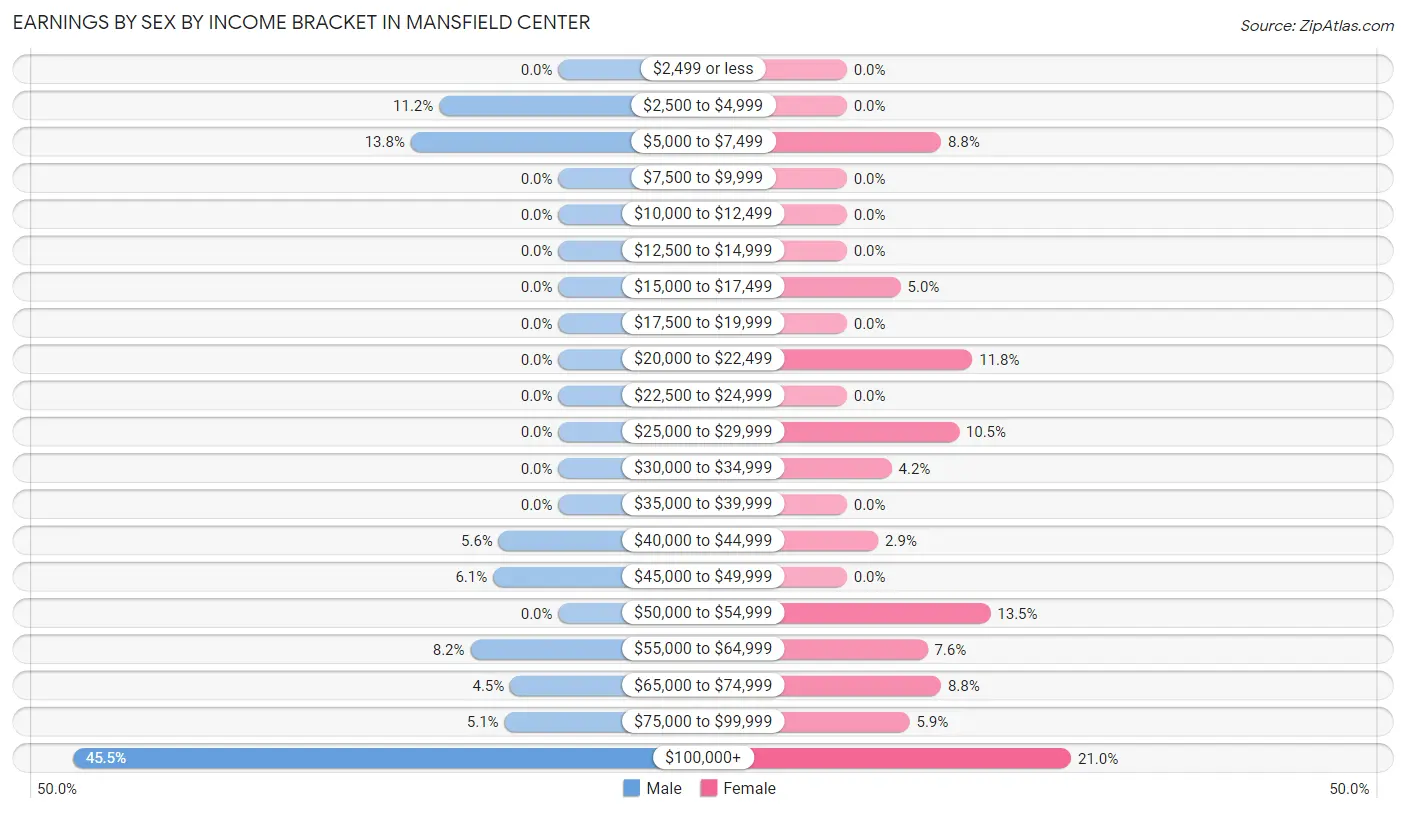
Earnings by Sex by Income Bracket in Mansfield Center
The most common earnings brackets in Mansfield Center are $100,000+ for men (171 | 45.5%) and $100,000+ for women (50 | 21.0%).
| Income | Male | Female |
| $2,499 or less | 0 (0.0%) | 0 (0.0%) |
| $2,500 to $4,999 | 42 (11.2%) | 0 (0.0%) |
| $5,000 to $7,499 | 52 (13.8%) | 21 (8.8%) |
| $7,500 to $9,999 | 0 (0.0%) | 0 (0.0%) |
| $10,000 to $12,499 | 0 (0.0%) | 0 (0.0%) |
| $12,500 to $14,999 | 0 (0.0%) | 0 (0.0%) |
| $15,000 to $17,499 | 0 (0.0%) | 12 (5.0%) |
| $17,500 to $19,999 | 0 (0.0%) | 0 (0.0%) |
| $20,000 to $22,499 | 0 (0.0%) | 28 (11.8%) |
| $22,500 to $24,999 | 0 (0.0%) | 0 (0.0%) |
| $25,000 to $29,999 | 0 (0.0%) | 25 (10.5%) |
| $30,000 to $34,999 | 0 (0.0%) | 10 (4.2%) |
| $35,000 to $39,999 | 0 (0.0%) | 0 (0.0%) |
| $40,000 to $44,999 | 21 (5.6%) | 7 (2.9%) |
| $45,000 to $49,999 | 23 (6.1%) | 0 (0.0%) |
| $50,000 to $54,999 | 0 (0.0%) | 32 (13.5%) |
| $55,000 to $64,999 | 31 (8.2%) | 18 (7.6%) |
| $65,000 to $74,999 | 17 (4.5%) | 21 (8.8%) |
| $75,000 to $99,999 | 19 (5.1%) | 14 (5.9%) |
| $100,000+ | 171 (45.5%) | 50 (21.0%) |
| Total | 376 (100.0%) | 238 (100.0%) |
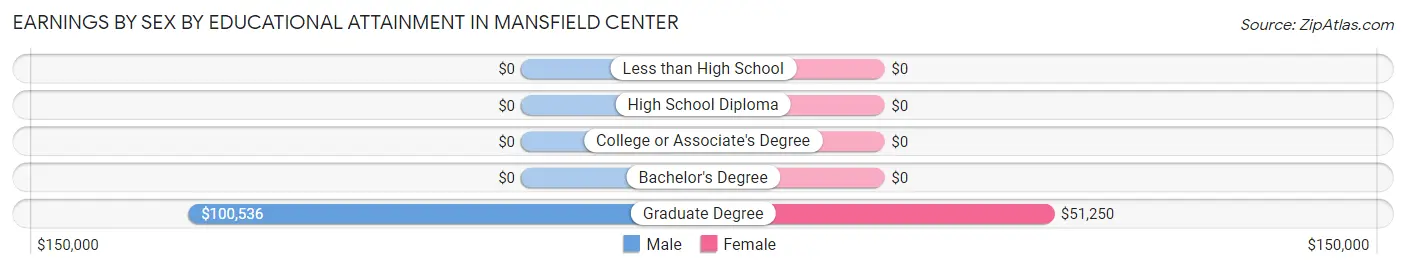
Earnings by Sex by Educational Attainment in Mansfield Center
Average earnings in Mansfield Center are $90,263 for men and $52,070 for women, a difference of 42.3%. Men with an educational attainment of graduate degree enjoy the highest average annual earnings of $100,536, while those with graduate degree education earn the least with $100,536. Women with an educational attainment of graduate degree earn the most with the average annual earnings of $51,250, while those with graduate degree education have the smallest earnings of $51,250.
| Educational Attainment | Male Income | Female Income |
| Less than High School | - | - |
| High School Diploma | - | - |
| College or Associate's Degree | - | - |
| Bachelor's Degree | - | - |
| Graduate Degree | $100,536 | $51,250 |
| Total | $90,263 | $52,070 |
Family Income in Mansfield Center
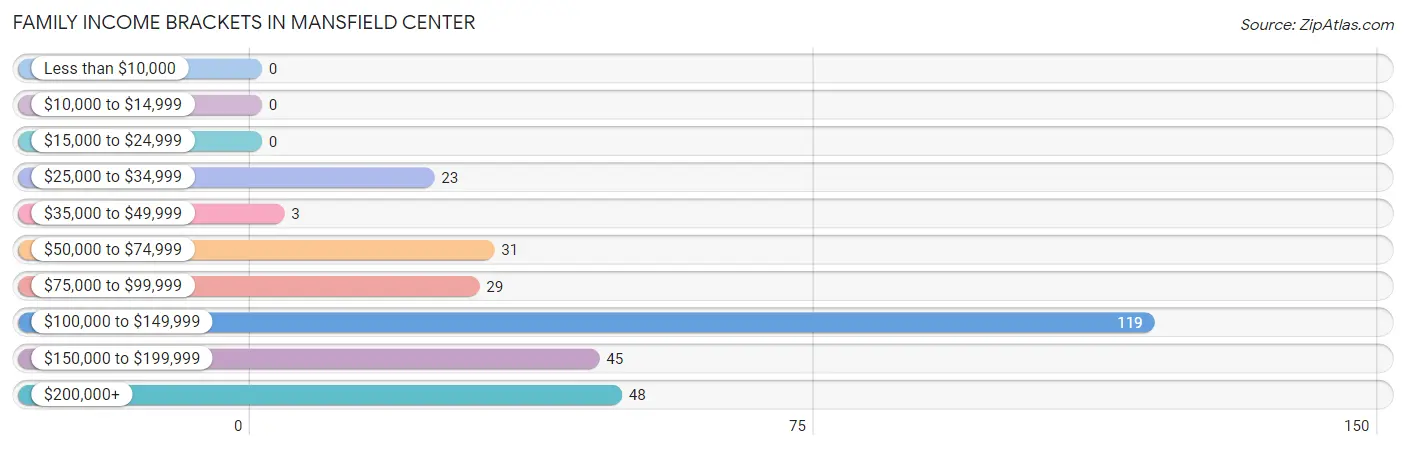
Family Income Brackets in Mansfield Center
According to the Mansfield Center family income data, there are 119 families falling into the $100,000 to $149,999 income range, which is the most common income bracket and makes up 39.9% of all families.
| Income Bracket | # Families | % Families |
| Less than $10,000 | 0 | 0.0% |
| $10,000 to $14,999 | 0 | 0.0% |
| $15,000 to $24,999 | 0 | 0.0% |
| $25,000 to $34,999 | 23 | 7.7% |
| $35,000 to $49,999 | 3 | 1.0% |
| $50,000 to $74,999 | 31 | 10.4% |
| $75,000 to $99,999 | 29 | 9.7% |
| $100,000 to $149,999 | 119 | 39.9% |
| $150,000 to $199,999 | 45 | 15.1% |
| $200,000+ | 48 | 16.1% |
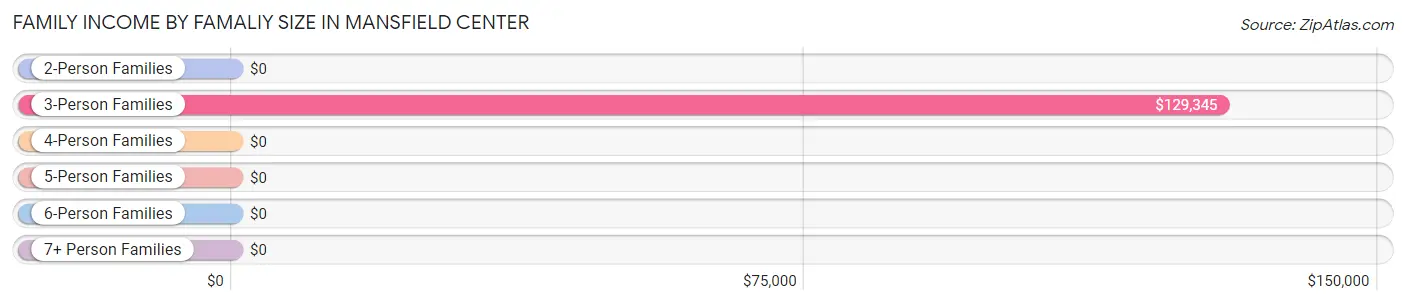
Family Income by Famaliy Size in Mansfield Center
3-person families (162 | 54.4%) account for the highest median family income in Mansfield Center with $129,345 per family, while 3-person families (162 | 54.4%) have the highest median income of $43,115 per family member.
| Income Bracket | # Families | Median Income |
| 2-Person Families | 65 (21.8%) | $0 |
| 3-Person Families | 162 (54.4%) | $129,345 |
| 4-Person Families | 71 (23.8%) | $0 |
| 5-Person Families | 0 (0.0%) | $0 |
| 6-Person Families | 0 (0.0%) | $0 |
| 7+ Person Families | 0 (0.0%) | $0 |
| Total | 298 (100.0%) | $128,750 |
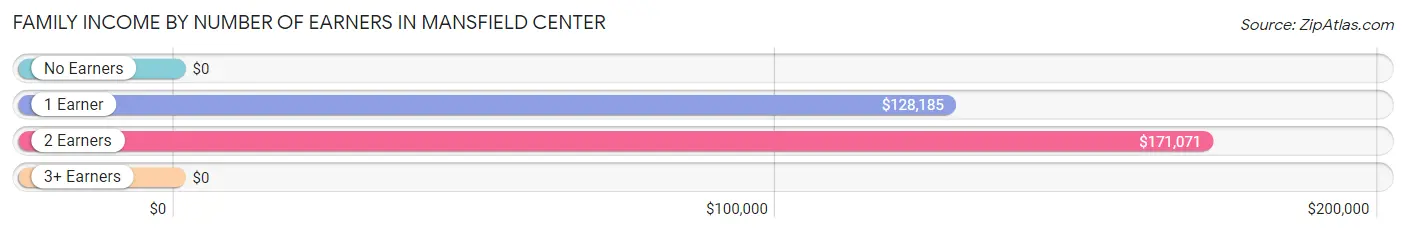
Family Income by Number of Earners in Mansfield Center
| Number of Earners | # Families | Median Income |
| No Earners | 18 (6.0%) | $0 |
| 1 Earner | 160 (53.7%) | $128,185 |
| 2 Earners | 120 (40.3%) | $171,071 |
| 3+ Earners | 0 (0.0%) | $0 |
| Total | 298 (100.0%) | $128,750 |
Household Income in Mansfield Center
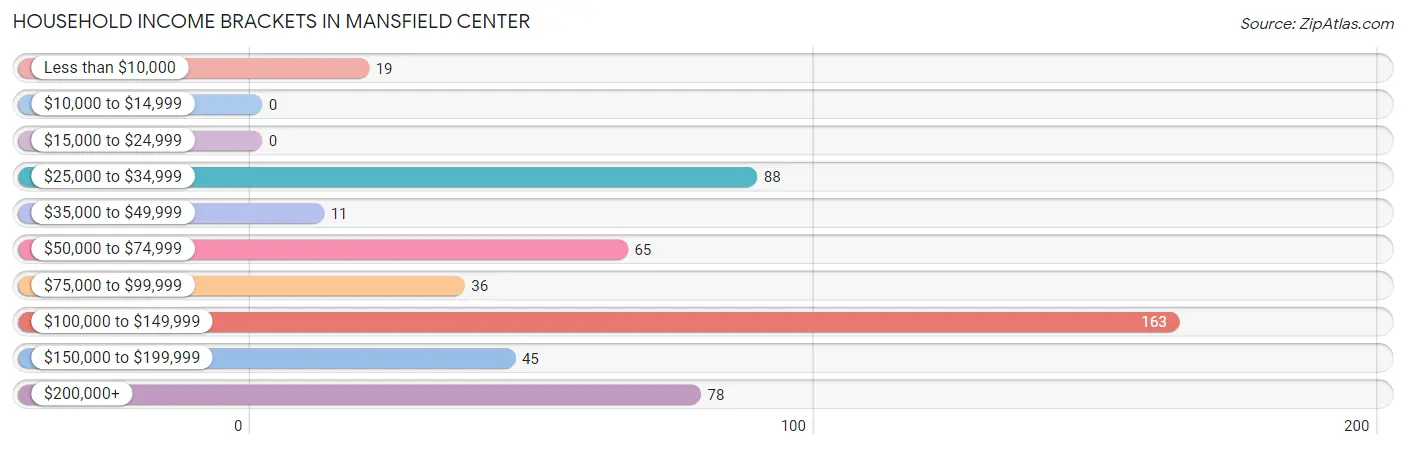
Household Income Brackets in Mansfield Center
With 163 households falling in the category, the $100,000 to $149,999 income range is the most frequent in Mansfield Center, accounting for 32.3% of all households.
| Income Bracket | # Households | % Households |
| Less than $10,000 | 19 | 3.8% |
| $10,000 to $14,999 | 0 | 0.0% |
| $15,000 to $24,999 | 0 | 0.0% |
| $25,000 to $34,999 | 88 | 17.4% |
| $35,000 to $49,999 | 11 | 2.2% |
| $50,000 to $74,999 | 65 | 12.9% |
| $75,000 to $99,999 | 36 | 7.1% |
| $100,000 to $149,999 | 163 | 32.3% |
| $150,000 to $199,999 | 45 | 8.9% |
| $200,000+ | 78 | 15.4% |
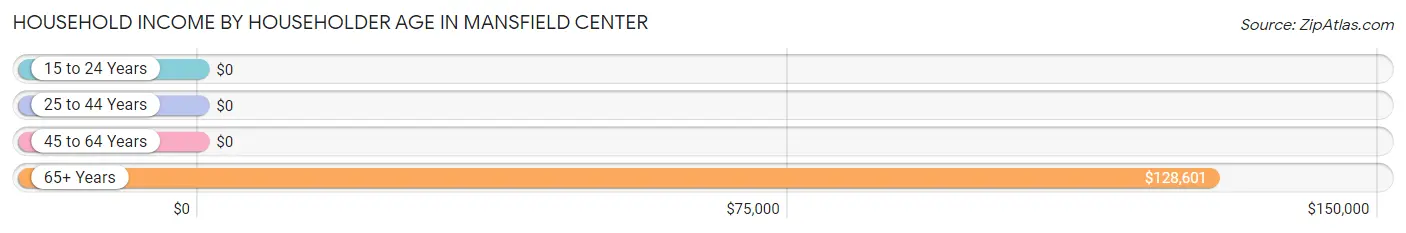
Household Income by Householder Age in Mansfield Center
The median household income in Mansfield Center is $115,655, with the highest median household income of $128,601 found in the 65+ years age bracket for the primary householder. A total of 240 households (47.5%) fall into this category.
| Income Bracket | # Households | Median Income |
| 15 to 24 Years | 0 (0.0%) | $0 |
| 25 to 44 Years | 78 (15.4%) | $0 |
| 45 to 64 Years | 187 (37.0%) | $0 |
| 65+ Years | 240 (47.5%) | $128,601 |
| Total | 505 (100.0%) | $115,655 |
Poverty in Mansfield Center
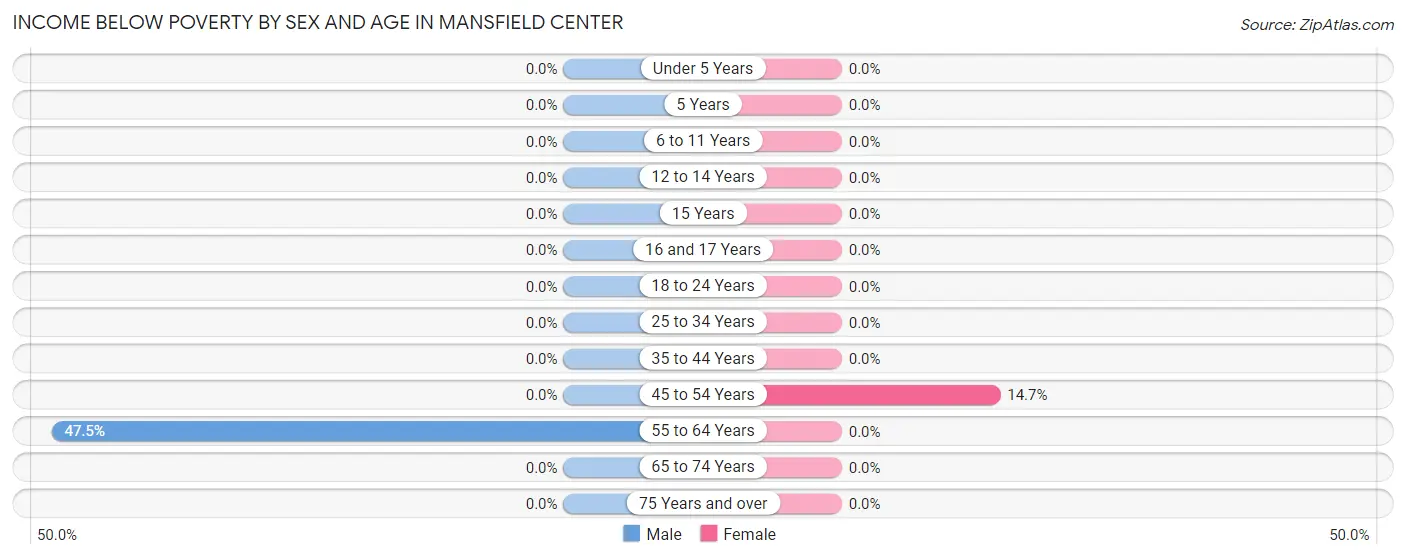
Income Below Poverty by Sex and Age in Mansfield Center
With 3.5% poverty level for males and 0.7% for females among the residents of Mansfield Center, 55 to 64 year old males and 45 to 54 year old females are the most vulnerable to poverty, with 19 males (47.5%) and 5 females (14.7%) in their respective age groups living below the poverty level.
| Age Bracket | Male | Female |
| Under 5 Years | 0 (0.0%) | 0 (0.0%) |
| 5 Years | 0 (0.0%) | 0 (0.0%) |
| 6 to 11 Years | 0 (0.0%) | 0 (0.0%) |
| 12 to 14 Years | 0 (0.0%) | 0 (0.0%) |
| 15 Years | 0 (0.0%) | 0 (0.0%) |
| 16 and 17 Years | 0 (0.0%) | 0 (0.0%) |
| 18 to 24 Years | 0 (0.0%) | 0 (0.0%) |
| 25 to 34 Years | 0 (0.0%) | 0 (0.0%) |
| 35 to 44 Years | 0 (0.0%) | 0 (0.0%) |
| 45 to 54 Years | 0 (0.0%) | 5 (14.7%) |
| 55 to 64 Years | 19 (47.5%) | 0 (0.0%) |
| 65 to 74 Years | 0 (0.0%) | 0 (0.0%) |
| 75 Years and over | 0 (0.0%) | 0 (0.0%) |
| Total | 19 (3.5%) | 5 (0.7%) |
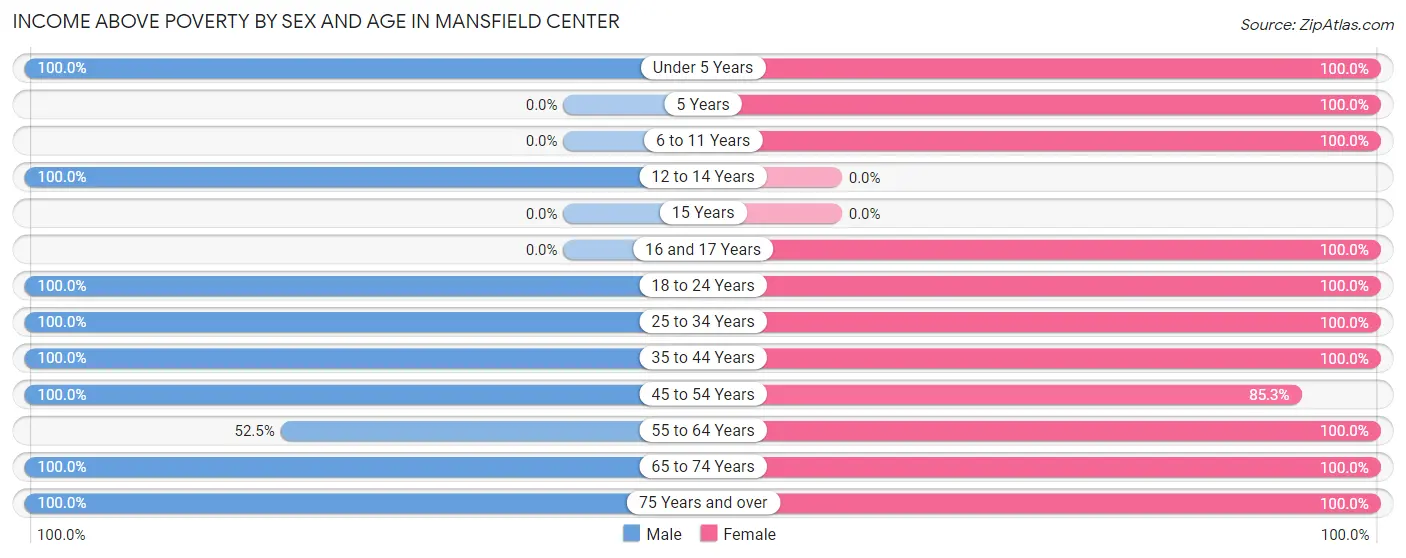
Income Above Poverty by Sex and Age in Mansfield Center
According to the poverty statistics in Mansfield Center, males aged under 5 years and females aged under 5 years are the age groups that are most secure financially, with 100.0% of males and 100.0% of females in these age groups living above the poverty line.
| Age Bracket | Male | Female |
| Under 5 Years | 32 (100.0%) | 14 (100.0%) |
| 5 Years | 0 (0.0%) | 30 (100.0%) |
| 6 to 11 Years | 0 (0.0%) | 40 (100.0%) |
| 12 to 14 Years | 13 (100.0%) | 0 (0.0%) |
| 15 Years | 0 (0.0%) | 0 (0.0%) |
| 16 and 17 Years | 0 (0.0%) | 17 (100.0%) |
| 18 to 24 Years | 21 (100.0%) | 154 (100.0%) |
| 25 to 34 Years | 92 (100.0%) | 44 (100.0%) |
| 35 to 44 Years | 48 (100.0%) | 57 (100.0%) |
| 45 to 54 Years | 106 (100.0%) | 29 (85.3%) |
| 55 to 64 Years | 21 (52.5%) | 218 (100.0%) |
| 65 to 74 Years | 144 (100.0%) | 57 (100.0%) |
| 75 Years and over | 48 (100.0%) | 72 (100.0%) |
| Total | 525 (96.5%) | 732 (99.3%) |
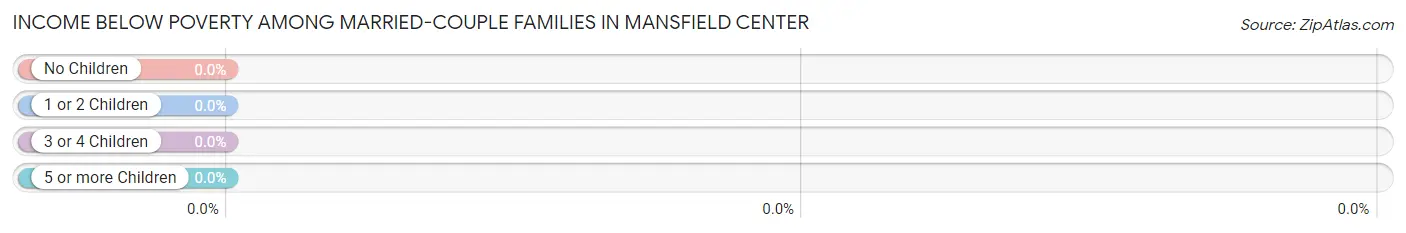
Income Below Poverty Among Married-Couple Families in Mansfield Center
| Children | Above Poverty | Below Poverty |
| No Children | 145 (100.0%) | 0 (0.0%) |
| 1 or 2 Children | 88 (100.0%) | 0 (0.0%) |
| 3 or 4 Children | 0 (0.0%) | 0 (0.0%) |
| 5 or more Children | 0 (0.0%) | 0 (0.0%) |
| Total | 233 (100.0%) | 0 (0.0%) |
Income Below Poverty Among Single-Parent Households in Mansfield Center
| Children | Single Father | Single Mother |
| No Children | 0 (0.0%) | 0 (0.0%) |
| 1 or 2 Children | 0 (0.0%) | 0 (0.0%) |
| 3 or 4 Children | 0 (0.0%) | 0 (0.0%) |
| 5 or more Children | 0 (0.0%) | 0 (0.0%) |
| Total | 0 (0.0%) | 0 (0.0%) |
Income Below Poverty Among Married-Couple vs Single-Parent Households in Mansfield Center
| Children | Married-Couple Families | Single-Parent Households |
| No Children | 0 (0.0%) | 0 (0.0%) |
| 1 or 2 Children | 0 (0.0%) | 0 (0.0%) |
| 3 or 4 Children | 0 (0.0%) | 0 (0.0%) |
| 5 or more Children | 0 (0.0%) | 0 (0.0%) |
| Total | 0 (0.0%) | 0 (0.0%) |
Race in Mansfield Center
The most populous races in Mansfield Center are White / Caucasian (1,264 | 98.7%), Hispanic or Latino (45 | 3.5%), and Black / African American (14 | 1.1%).
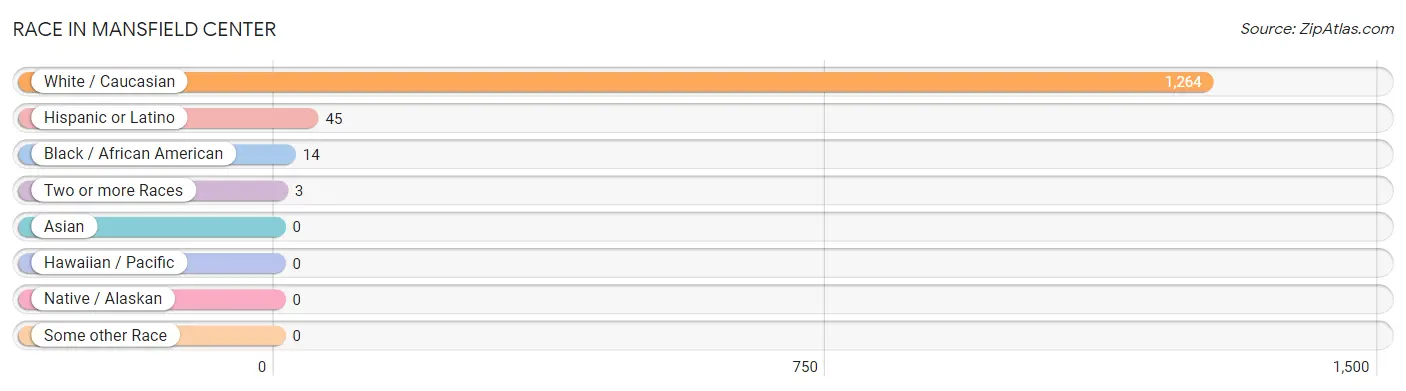
| Race | # Population | % Population |
| Asian | 0 | 0.0% |
| Black / African American | 14 | 1.1% |
| Hawaiian / Pacific | 0 | 0.0% |
| Hispanic or Latino | 45 | 3.5% |
| Native / Alaskan | 0 | 0.0% |
| White / Caucasian | 1,264 | 98.7% |
| Two or more Races | 3 | 0.2% |
| Some other Race | 0 | 0.0% |
| Total | 1,281 | 100.0% |
Ancestry in Mansfield Center
The most populous ancestries reported in Mansfield Center are European (344 | 26.9%), Irish (275 | 21.5%), German (215 | 16.8%), English (164 | 12.8%), and Polish (154 | 12.0%), together accounting for 89.9% of all Mansfield Center residents.
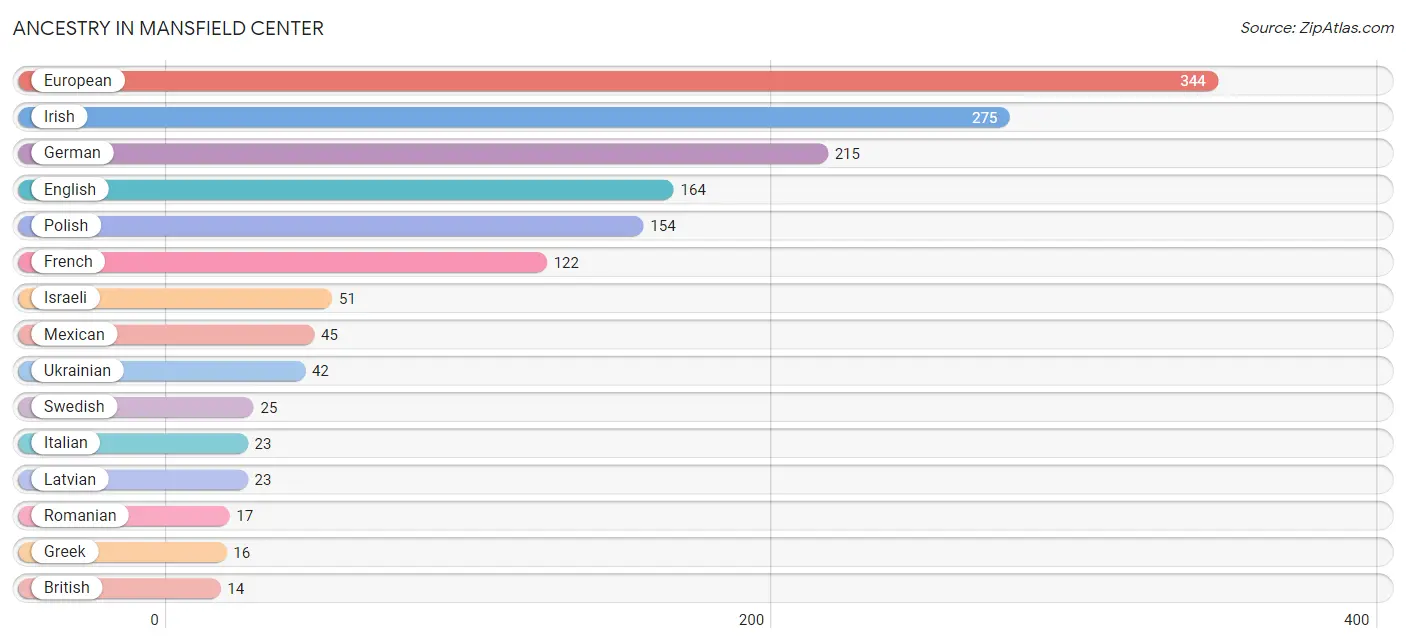
| Ancestry | # Population | % Population |
| American | 10 | 0.8% |
| British | 14 | 1.1% |
| English | 164 | 12.8% |
| European | 344 | 26.9% |
| French | 122 | 9.5% |
| French Canadian | 10 | 0.8% |
| German | 215 | 16.8% |
| Greek | 16 | 1.3% |
| Hungarian | 8 | 0.6% |
| Irish | 275 | 21.5% |
| Israeli | 51 | 4.0% |
| Italian | 23 | 1.8% |
| Latvian | 23 | 1.8% |
| Mexican | 45 | 3.5% |
| Polish | 154 | 12.0% |
| Romanian | 17 | 1.3% |
| Scotch-Irish | 7 | 0.5% |
| Swedish | 25 | 1.9% |
| Ukrainian | 42 | 3.3% | View All 19 Rows |
Immigrants in Mansfield Center
The most numerous immigrant groups reported in Mansfield Center came from Europe (46 | 3.6%), Eastern Europe (42 | 3.3%), Asia (34 | 2.6%), Israel (34 | 2.6%), and Western Asia (34 | 2.6%), together accounting for 14.8% of all Mansfield Center residents.
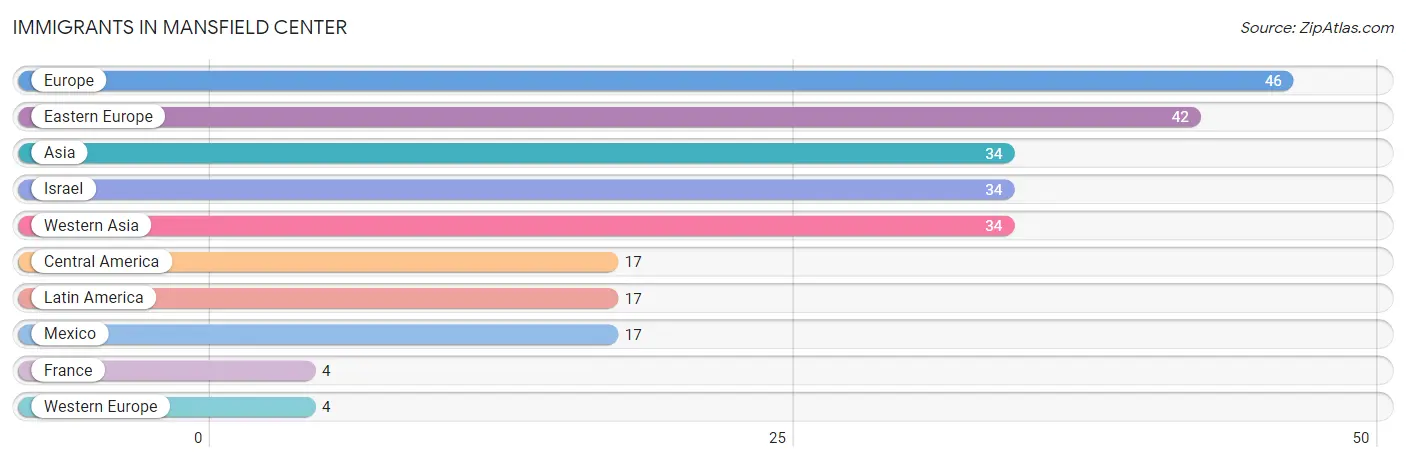
| Immigration Origin | # Population | % Population |
| Asia | 34 | 2.6% |
| Central America | 17 | 1.3% |
| Eastern Europe | 42 | 3.3% |
| Europe | 46 | 3.6% |
| France | 4 | 0.3% |
| Israel | 34 | 2.6% |
| Latin America | 17 | 1.3% |
| Mexico | 17 | 1.3% |
| Western Asia | 34 | 2.6% |
| Western Europe | 4 | 0.3% | View All 10 Rows |
Sex and Age in Mansfield Center
Sex and Age in Mansfield Center
The most populous age groups in Mansfield Center are 70 to 74 Years (107 | 19.7%) for men and 55 to 59 Years (176 | 23.9%) for women.
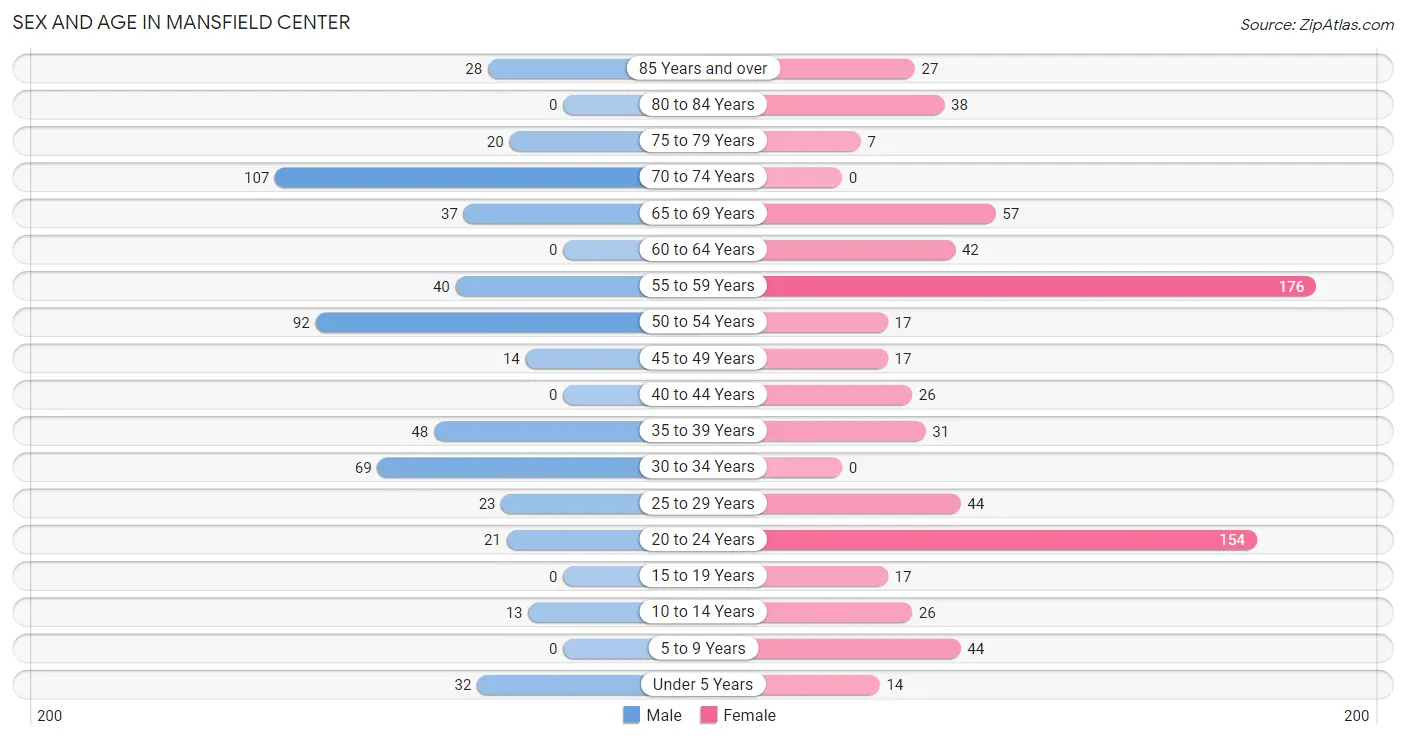
| Age Bracket | Male | Female |
| Under 5 Years | 32 (5.9%) | 14 (1.9%) |
| 5 to 9 Years | 0 (0.0%) | 44 (6.0%) |
| 10 to 14 Years | 13 (2.4%) | 26 (3.5%) |
| 15 to 19 Years | 0 (0.0%) | 17 (2.3%) |
| 20 to 24 Years | 21 (3.9%) | 154 (20.9%) |
| 25 to 29 Years | 23 (4.2%) | 44 (6.0%) |
| 30 to 34 Years | 69 (12.7%) | 0 (0.0%) |
| 35 to 39 Years | 48 (8.8%) | 31 (4.2%) |
| 40 to 44 Years | 0 (0.0%) | 26 (3.5%) |
| 45 to 49 Years | 14 (2.6%) | 17 (2.3%) |
| 50 to 54 Years | 92 (16.9%) | 17 (2.3%) |
| 55 to 59 Years | 40 (7.3%) | 176 (23.9%) |
| 60 to 64 Years | 0 (0.0%) | 42 (5.7%) |
| 65 to 69 Years | 37 (6.8%) | 57 (7.7%) |
| 70 to 74 Years | 107 (19.7%) | 0 (0.0%) |
| 75 to 79 Years | 20 (3.7%) | 7 (0.9%) |
| 80 to 84 Years | 0 (0.0%) | 38 (5.2%) |
| 85 Years and over | 28 (5.1%) | 27 (3.7%) |
| Total | 544 (100.0%) | 737 (100.0%) |
Families and Households in Mansfield Center
Median Family Size in Mansfield Center
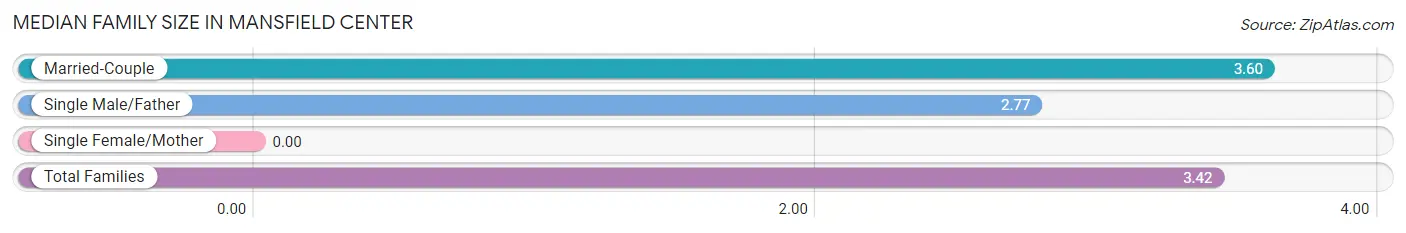
| Family Type | # Families | Family Size |
| Married-Couple | 233 (78.2%) | 3.60 |
| Single Male/Father | 65 (21.8%) | 2.77 |
| Single Female/Mother | 0 (0.0%) | - |
| Total Families | 298 (100.0%) | 3.42 |
Median Household Size in Mansfield Center
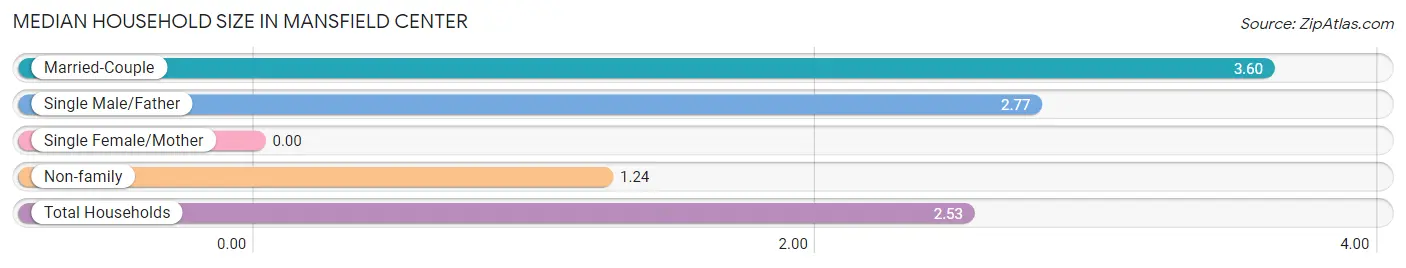
| Household Type | # Households | Household Size |
| Married-Couple | 233 (46.1%) | 3.60 |
| Single Male/Father | 65 (12.9%) | 2.77 |
| Single Female/Mother | 0 (0.0%) | - |
| Non-family | 207 (41.0%) | 1.24 |
| Total Households | 505 (100.0%) | 2.53 |
Household Size by Marriage Status in Mansfield Center
Out of a total of 505 households in Mansfield Center, 298 (59.0%) are family households, while 207 (41.0%) are nonfamily households. The most numerous type of family households are 3-person households, comprising 162, and the most common type of nonfamily households are 1-person households, comprising 159.
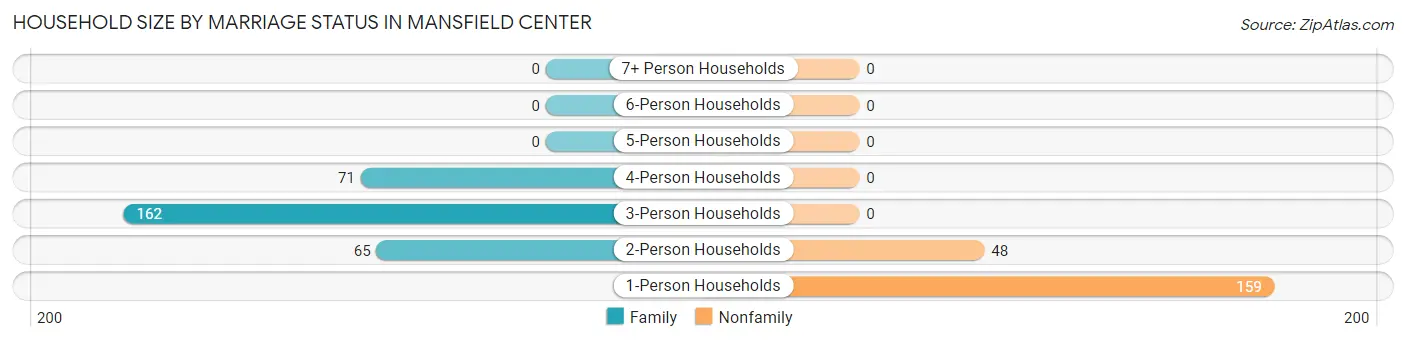
| Household Size | Family Households | Nonfamily Households |
| 1-Person Households | - | 159 (31.5%) |
| 2-Person Households | 65 (12.9%) | 48 (9.5%) |
| 3-Person Households | 162 (32.1%) | 0 (0.0%) |
| 4-Person Households | 71 (14.1%) | 0 (0.0%) |
| 5-Person Households | 0 (0.0%) | 0 (0.0%) |
| 6-Person Households | 0 (0.0%) | 0 (0.0%) |
| 7+ Person Households | 0 (0.0%) | 0 (0.0%) |
| Total | 298 (59.0%) | 207 (41.0%) |
Female Fertility in Mansfield Center
Fertility by Age in Mansfield Center
| Age Bracket | Women with Births | Births / 1,000 Women |
| 15 to 19 years | 0 (0.0%) | 0.0 |
| 20 to 34 years | 0 (0.0%) | 0.0 |
| 35 to 50 years | 0 (0.0%) | 0.0 |
| Total | 0 (0.0%) | 0.0 |
Fertility by Age by Marriage Status in Mansfield Center
| Age Bracket | Married | Unmarried |
| 15 to 19 years | 0 (0.0%) | 0 (0.0%) |
| 20 to 34 years | 0 (0.0%) | 0 (0.0%) |
| 35 to 50 years | 0 (0.0%) | 0 (0.0%) |
| Total | 0 (0.0%) | 0 (0.0%) |
Fertility by Education in Mansfield Center
| Educational Attainment | Women with Births | Births / 1,000 Women |
| Less than High School | 0 (0.0%) | 0.0 |
| High School Diploma | 0 (0.0%) | 0.0 |
| College or Associate's Degree | 0 (0.0%) | 0.0 |
| Bachelor's Degree | 0 (0.0%) | 0.0 |
| Graduate Degree | 0 (0.0%) | 0.0 |
| Total | 0 (0.0%) | 0.0 |
Fertility by Education by Marriage Status in Mansfield Center
| Educational Attainment | Married | Unmarried |
| Less than High School | 0 (0.0%) | 0 (0.0%) |
| High School Diploma | 0 (0.0%) | 0 (0.0%) |
| College or Associate's Degree | 0 (0.0%) | 0 (0.0%) |
| Bachelor's Degree | 0 (0.0%) | 0 (0.0%) |
| Graduate Degree | 0 (0.0%) | 0 (0.0%) |
| Total | 0 (0.0%) | 0 (0.0%) |
Employment Characteristics in Mansfield Center
Employment by Class of Employer in Mansfield Center
Among the 533 employed individuals in Mansfield Center, private company employees (188 | 35.3%), state government employees (151 | 28.3%), and not-for-profit organizations (138 | 25.9%) make up the most common classes of employment.
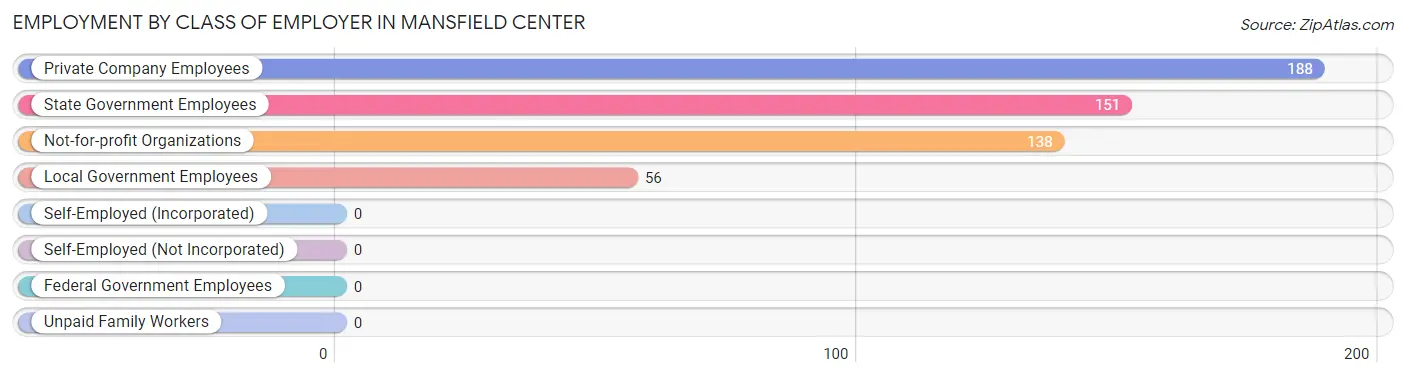
| Employer Class | # Employees | % Employees |
| Private Company Employees | 188 | 35.3% |
| Self-Employed (Incorporated) | 0 | 0.0% |
| Self-Employed (Not Incorporated) | 0 | 0.0% |
| Not-for-profit Organizations | 138 | 25.9% |
| Local Government Employees | 56 | 10.5% |
| State Government Employees | 151 | 28.3% |
| Federal Government Employees | 0 | 0.0% |
| Unpaid Family Workers | 0 | 0.0% |
| Total | 533 | 100.0% |
Employment Status by Age in Mansfield Center
According to the labor force statistics for Mansfield Center, out of the total population over 16 years of age (1,152), 47.9% or 552 individuals are in the labor force, with 3.4% or 19 of them unemployed. The age group with the highest labor force participation rate is 25 to 29 years, with 100.0% or 67 individuals in the labor force. Within the labor force, the 55 to 59 years age range has the highest percentage of unemployed individuals, with 21.3% or 19 of them being unemployed.
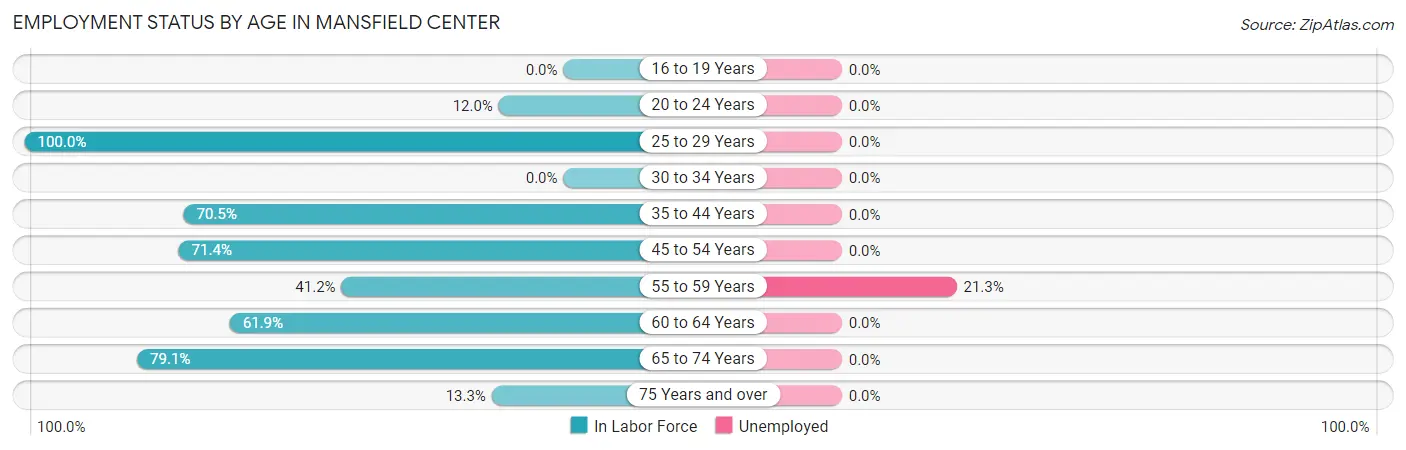
| Age Bracket | In Labor Force | Unemployed |
| 16 to 19 Years | 0 (0.0%) | 0 (0.0%) |
| 20 to 24 Years | 21 (12.0%) | 0 (0.0%) |
| 25 to 29 Years | 67 (100.0%) | 0 (0.0%) |
| 30 to 34 Years | 0 (0.0%) | 0 (0.0%) |
| 35 to 44 Years | 74 (70.5%) | 0 (0.0%) |
| 45 to 54 Years | 100 (71.4%) | 0 (0.0%) |
| 55 to 59 Years | 89 (41.2%) | 19 (21.3%) |
| 60 to 64 Years | 26 (61.9%) | 0 (0.0%) |
| 65 to 74 Years | 159 (79.1%) | 0 (0.0%) |
| 75 Years and over | 16 (13.3%) | 0 (0.0%) |
| Total | 552 (47.9%) | 19 (3.4%) |
Employment Status by Educational Attainment in Mansfield Center
According to labor force statistics for Mansfield Center, 55.7% of individuals (356) out of the total population between 25 and 64 years of age (639) are in the labor force, with 5.3% or 19 of them being unemployed. The group with the highest labor force participation rate are those with the educational attainment of high school diploma, with 68.8% or 11 individuals in the labor force. Within the labor force, individuals with college / associate degree education have the highest percentage of unemployment, with 10.6% or 19 of them being unemployed.
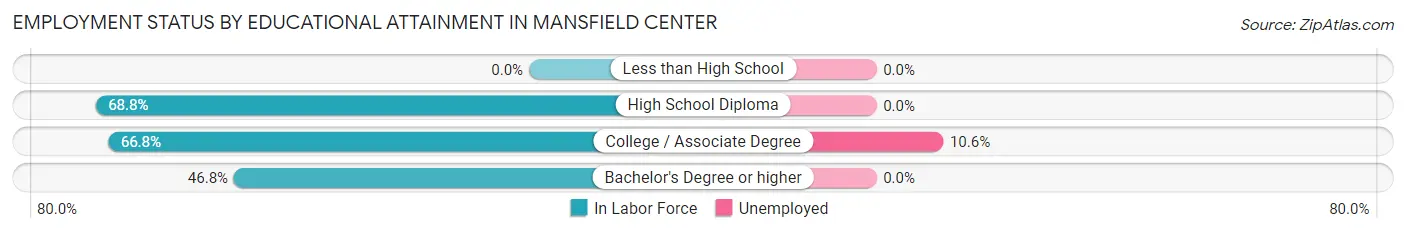
| Educational Attainment | In Labor Force | Unemployed |
| Less than High School | 0 (0.0%) | 0 (0.0%) |
| High School Diploma | 11 (68.8%) | 0 (0.0%) |
| College / Associate Degree | 179 (66.8%) | 28 (10.6%) |
| Bachelor's Degree or higher | 166 (46.8%) | 0 (0.0%) |
| Total | 356 (55.7%) | 34 (5.3%) |
Employment Occupations by Sex in Mansfield Center
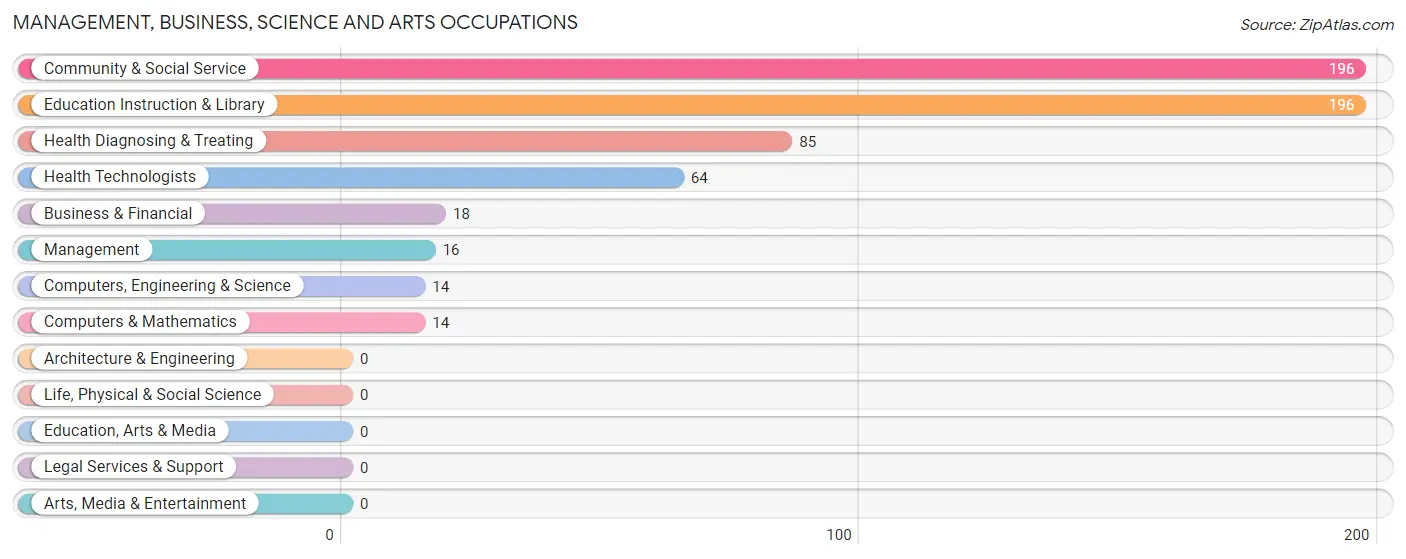
Management, Business, Science and Arts Occupations
The most common Management, Business, Science and Arts occupations in Mansfield Center are Community & Social Service (196 | 36.8%), Education Instruction & Library (196 | 36.8%), Health Diagnosing & Treating (85 | 16.0%), Health Technologists (64 | 12.0%), and Business & Financial (18 | 3.4%).
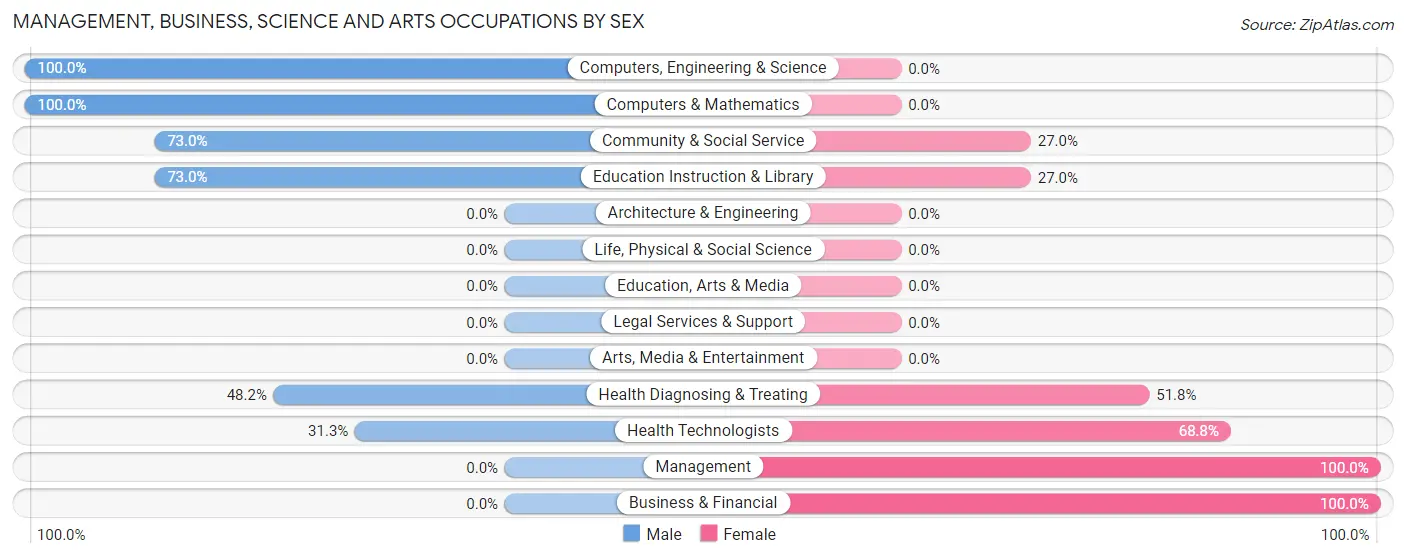
Management, Business, Science and Arts Occupations by Sex
Within the Management, Business, Science and Arts occupations in Mansfield Center, the most male-oriented occupations are Computers, Engineering & Science (100.0%), Computers & Mathematics (100.0%), and Community & Social Service (73.0%), while the most female-oriented occupations are Management (100.0%), Business & Financial (100.0%), and Health Technologists (68.8%).
| Occupation | Male | Female |
| Management | 0 (0.0%) | 16 (100.0%) |
| Business & Financial | 0 (0.0%) | 18 (100.0%) |
| Computers, Engineering & Science | 14 (100.0%) | 0 (0.0%) |
| Computers & Mathematics | 14 (100.0%) | 0 (0.0%) |
| Architecture & Engineering | 0 (0.0%) | 0 (0.0%) |
| Life, Physical & Social Science | 0 (0.0%) | 0 (0.0%) |
| Community & Social Service | 143 (73.0%) | 53 (27.0%) |
| Education, Arts & Media | 0 (0.0%) | 0 (0.0%) |
| Legal Services & Support | 0 (0.0%) | 0 (0.0%) |
| Education Instruction & Library | 143 (73.0%) | 53 (27.0%) |
| Arts, Media & Entertainment | 0 (0.0%) | 0 (0.0%) |
| Health Diagnosing & Treating | 41 (48.2%) | 44 (51.8%) |
| Health Technologists | 20 (31.2%) | 44 (68.8%) |
| Total (Category) | 198 (60.2%) | 131 (39.8%) |
| Total (Overall) | 302 (56.7%) | 231 (43.3%) |
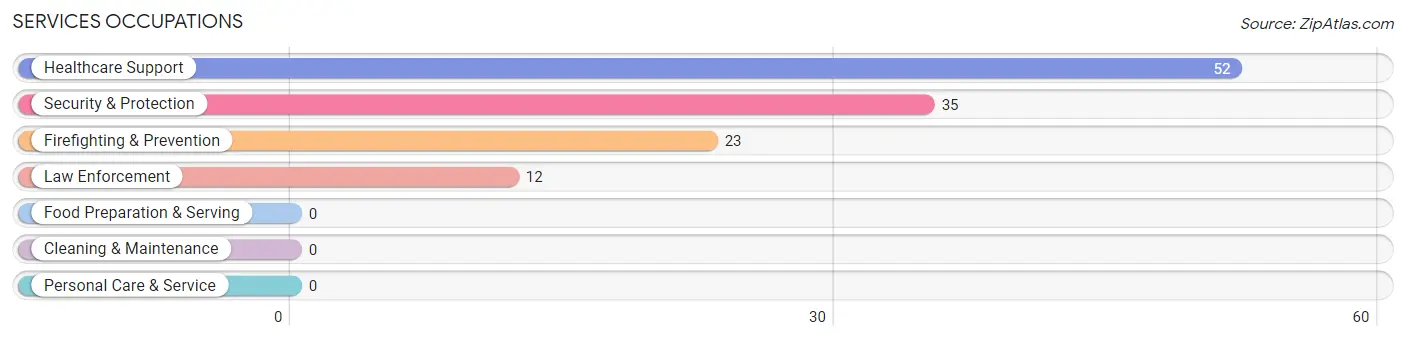
Services Occupations
The most common Services occupations in Mansfield Center are Healthcare Support (52 | 9.8%), Security & Protection (35 | 6.6%), Firefighting & Prevention (23 | 4.3%), and Law Enforcement (12 | 2.2%).
Services Occupations by Sex
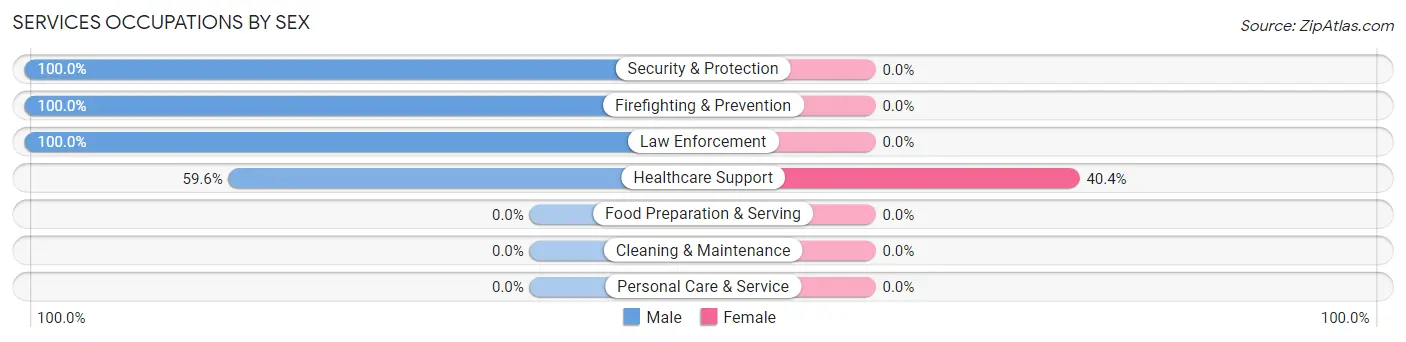
| Occupation | Male | Female |
| Healthcare Support | 31 (59.6%) | 21 (40.4%) |
| Security & Protection | 35 (100.0%) | 0 (0.0%) |
| Firefighting & Prevention | 23 (100.0%) | 0 (0.0%) |
| Law Enforcement | 12 (100.0%) | 0 (0.0%) |
| Food Preparation & Serving | 0 (0.0%) | 0 (0.0%) |
| Cleaning & Maintenance | 0 (0.0%) | 0 (0.0%) |
| Personal Care & Service | 0 (0.0%) | 0 (0.0%) |
| Total (Category) | 66 (75.9%) | 21 (24.1%) |
| Total (Overall) | 302 (56.7%) | 231 (43.3%) |
Sales and Office Occupations
The most common Sales and Office occupations in Mansfield Center are Office & Administration (49 | 9.2%), and Sales & Related (30 | 5.6%).
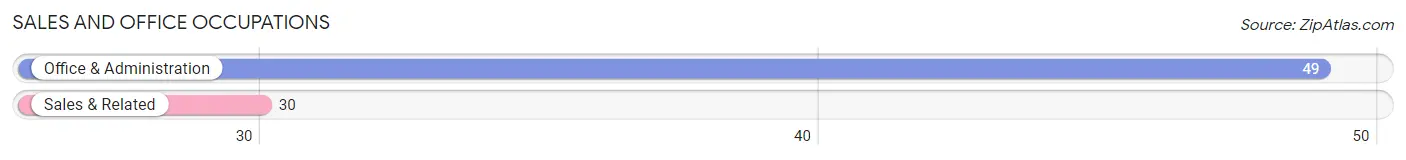
Sales and Office Occupations by Sex
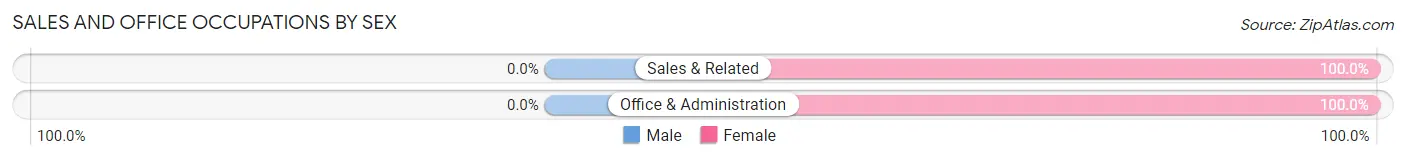
| Occupation | Male | Female |
| Sales & Related | 0 (0.0%) | 30 (100.0%) |
| Office & Administration | 0 (0.0%) | 49 (100.0%) |
| Total (Category) | 0 (0.0%) | 79 (100.0%) |
| Total (Overall) | 302 (56.7%) | 231 (43.3%) |
Natural Resources, Construction and Maintenance Occupations
The most common Natural Resources, Construction and Maintenance occupations in Mansfield Center are , and Installation, Maintenance & Repair (38 | 7.1%).
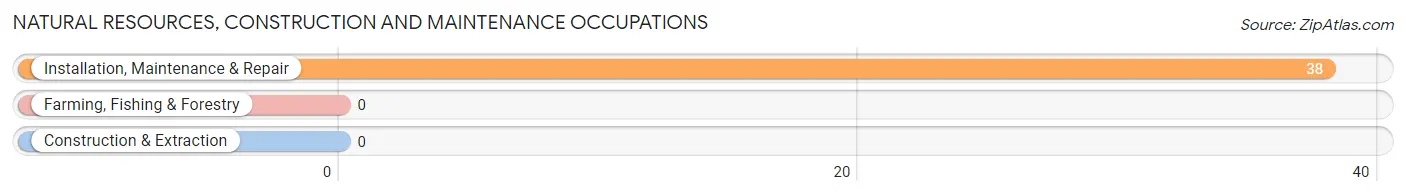
Natural Resources, Construction and Maintenance Occupations by Sex
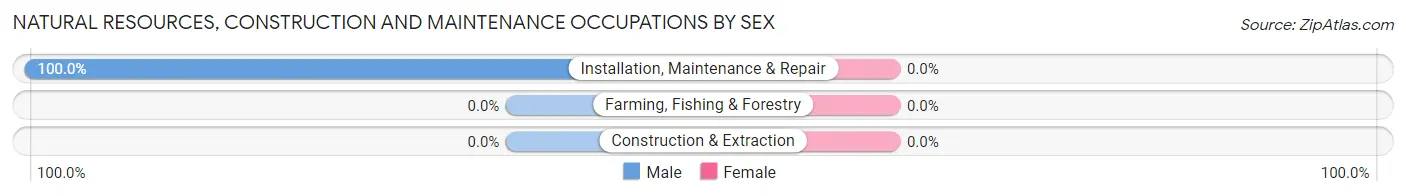
| Occupation | Male | Female |
| Farming, Fishing & Forestry | 0 (0.0%) | 0 (0.0%) |
| Construction & Extraction | 0 (0.0%) | 0 (0.0%) |
| Installation, Maintenance & Repair | 38 (100.0%) | 0 (0.0%) |
| Total (Category) | 38 (100.0%) | 0 (0.0%) |
| Total (Overall) | 302 (56.7%) | 231 (43.3%) |
Production, Transportation and Moving Occupations
Production, Transportation and Moving Occupations by Sex
| Occupation | Male | Female |
| Production | 0 (0.0%) | 0 (0.0%) |
| Transportation | 0 (0.0%) | 0 (0.0%) |
| Material Moving | 0 (0.0%) | 0 (0.0%) |
| Total (Category) | 0 (0.0%) | 0 (0.0%) |
| Total (Overall) | 302 (56.7%) | 231 (43.3%) |
Employment Industries by Sex in Mansfield Center
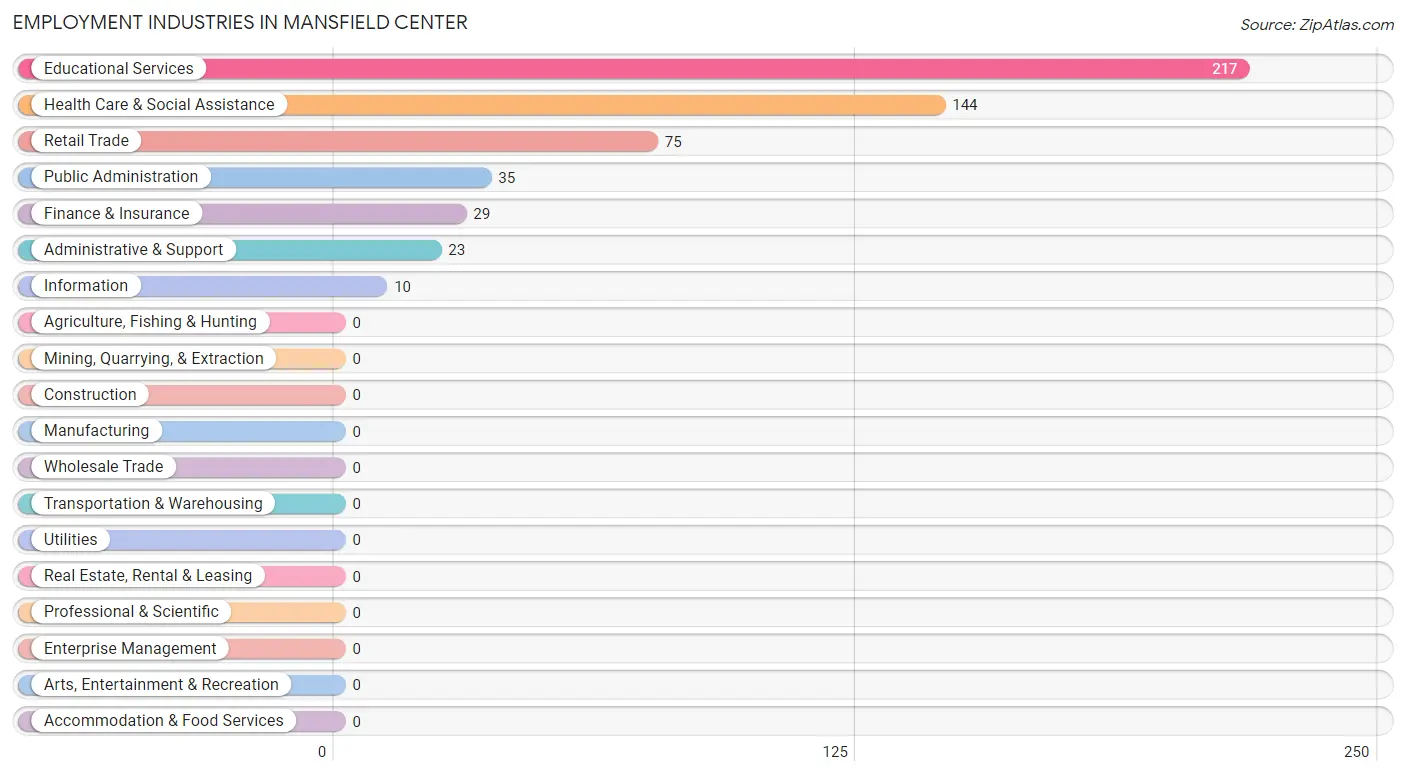
Employment Industries in Mansfield Center
The major employment industries in Mansfield Center include Educational Services (217 | 40.7%), Health Care & Social Assistance (144 | 27.0%), Retail Trade (75 | 14.1%), Public Administration (35 | 6.6%), and Finance & Insurance (29 | 5.4%).
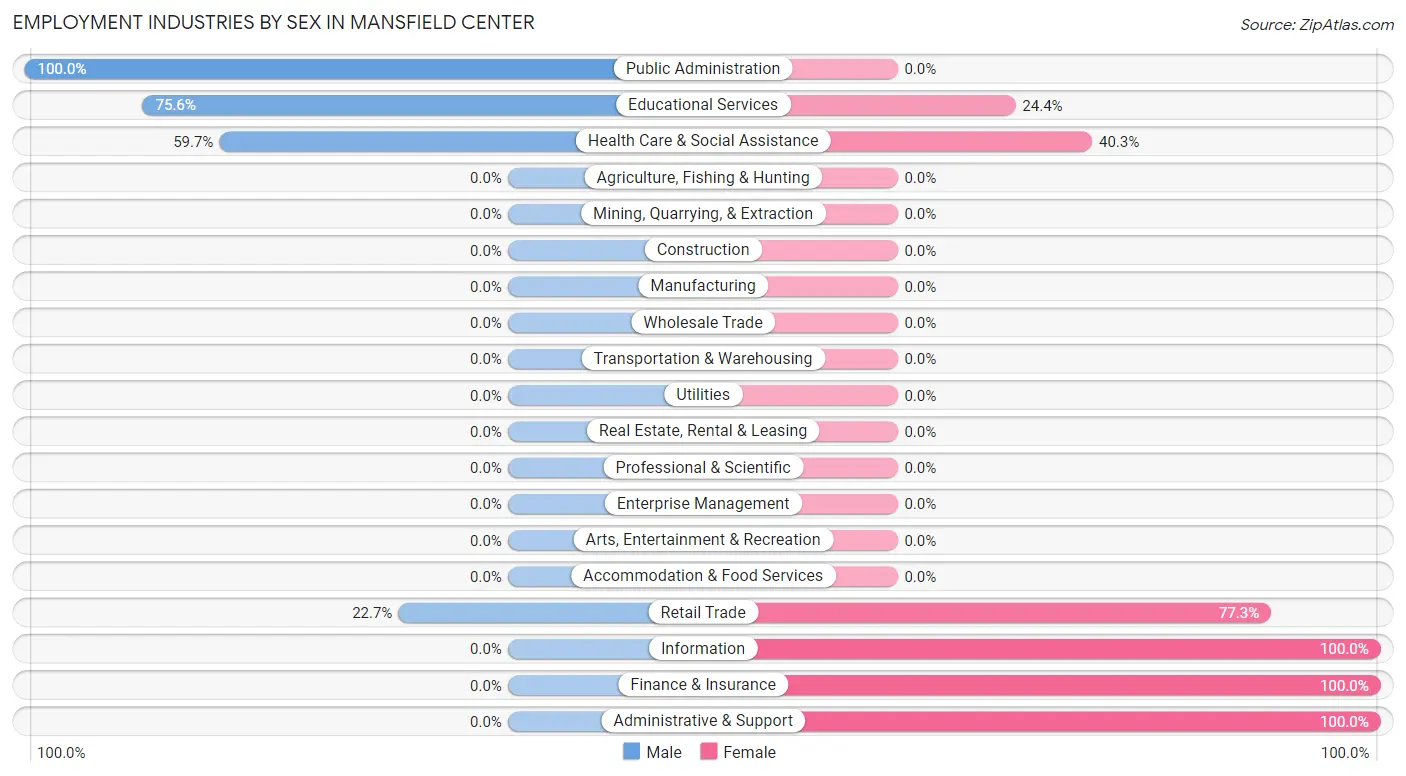
Employment Industries by Sex in Mansfield Center
The Mansfield Center industries that see more men than women are Public Administration (100.0%), Educational Services (75.6%), and Health Care & Social Assistance (59.7%), whereas the industries that tend to have a higher number of women are Information (100.0%), Finance & Insurance (100.0%), and Administrative & Support (100.0%).
| Industry | Male | Female |
| Agriculture, Fishing & Hunting | 0 (0.0%) | 0 (0.0%) |
| Mining, Quarrying, & Extraction | 0 (0.0%) | 0 (0.0%) |
| Construction | 0 (0.0%) | 0 (0.0%) |
| Manufacturing | 0 (0.0%) | 0 (0.0%) |
| Wholesale Trade | 0 (0.0%) | 0 (0.0%) |
| Retail Trade | 17 (22.7%) | 58 (77.3%) |
| Transportation & Warehousing | 0 (0.0%) | 0 (0.0%) |
| Utilities | 0 (0.0%) | 0 (0.0%) |
| Information | 0 (0.0%) | 10 (100.0%) |
| Finance & Insurance | 0 (0.0%) | 29 (100.0%) |
| Real Estate, Rental & Leasing | 0 (0.0%) | 0 (0.0%) |
| Professional & Scientific | 0 (0.0%) | 0 (0.0%) |
| Enterprise Management | 0 (0.0%) | 0 (0.0%) |
| Administrative & Support | 0 (0.0%) | 23 (100.0%) |
| Educational Services | 164 (75.6%) | 53 (24.4%) |
| Health Care & Social Assistance | 86 (59.7%) | 58 (40.3%) |
| Arts, Entertainment & Recreation | 0 (0.0%) | 0 (0.0%) |
| Accommodation & Food Services | 0 (0.0%) | 0 (0.0%) |
| Public Administration | 35 (100.0%) | 0 (0.0%) |
| Total | 302 (56.7%) | 231 (43.3%) |
Education in Mansfield Center
School Enrollment in Mansfield Center
The most common levels of schooling among the 282 students in Mansfield Center are college / undergraduate (154 | 54.6%), middle school (39 | 13.8%), and kindergarten (30 | 10.6%).
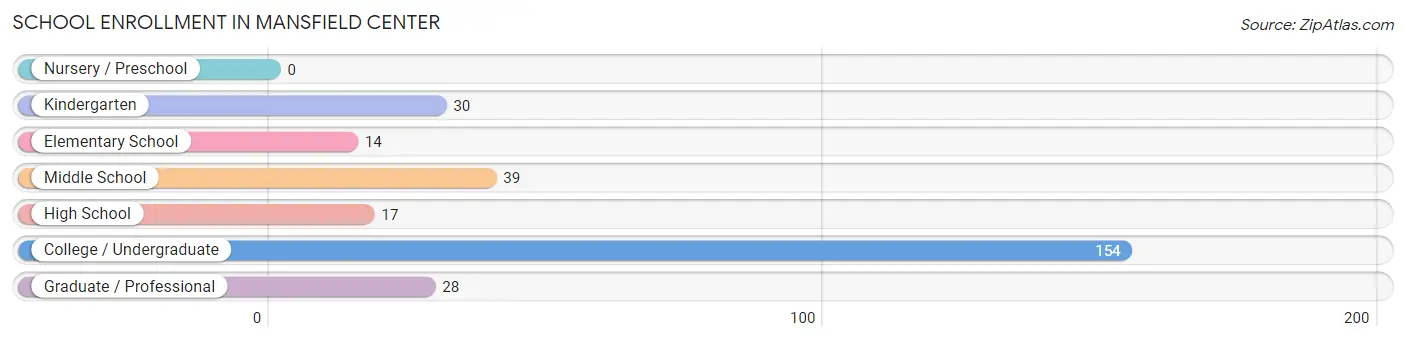
| School Level | # Students | % Students |
| Nursery / Preschool | 0 | 0.0% |
| Kindergarten | 30 | 10.6% |
| Elementary School | 14 | 5.0% |
| Middle School | 39 | 13.8% |
| High School | 17 | 6.0% |
| College / Undergraduate | 154 | 54.6% |
| Graduate / Professional | 28 | 9.9% |
| Total | 282 | 100.0% |
School Enrollment by Age by Funding Source in Mansfield Center
Out of a total of 282 students who are enrolled in schools in Mansfield Center, 154 (54.6%) attend a private institution, while the remaining 128 (45.4%) are enrolled in public schools. The age group of 20 to 24 year olds has the highest likelihood of being enrolled in private schools, with 154 (100.0% in the age bracket) enrolled. Conversely, the age group of 5 to 9 year old has the lowest likelihood of being enrolled in a private school, with 44 (100.0% in the age bracket) attending a public institution.
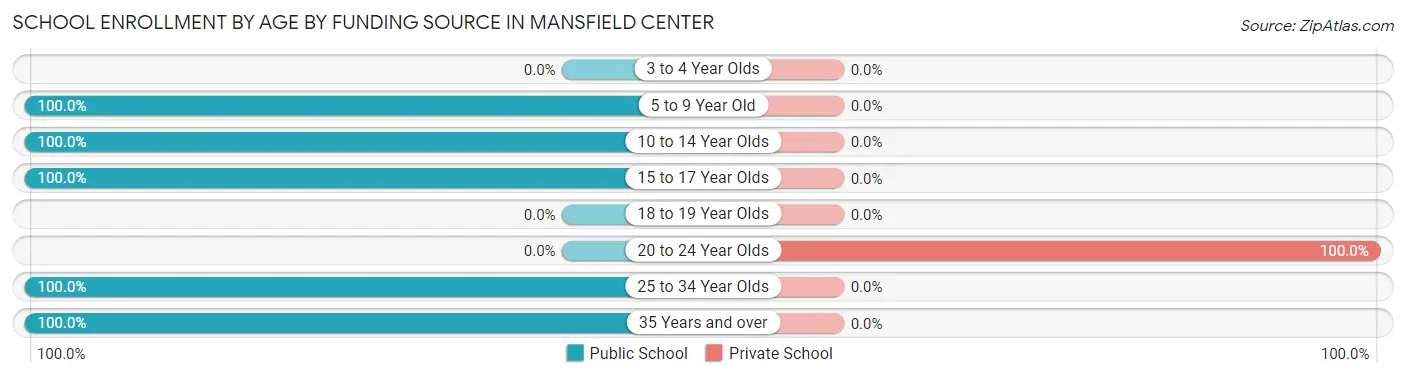
| Age Bracket | Public School | Private School |
| 3 to 4 Year Olds | 0 (0.0%) | 0 (0.0%) |
| 5 to 9 Year Old | 44 (100.0%) | 0 (0.0%) |
| 10 to 14 Year Olds | 39 (100.0%) | 0 (0.0%) |
| 15 to 17 Year Olds | 17 (100.0%) | 0 (0.0%) |
| 18 to 19 Year Olds | 0 (0.0%) | 0 (0.0%) |
| 20 to 24 Year Olds | 0 (0.0%) | 154 (100.0%) |
| 25 to 34 Year Olds | 10 (100.0%) | 0 (0.0%) |
| 35 Years and over | 18 (100.0%) | 0 (0.0%) |
| Total | 128 (45.4%) | 154 (54.6%) |
Educational Attainment by Field of Study in Mansfield Center
Visual & performing arts (184 | 29.8%), communications (107 | 17.3%), education (75 | 12.1%), bio, nature & agricultural (51 | 8.3%), and science & technology (44 | 7.1%) are the most common fields of study among 618 individuals in Mansfield Center who have obtained a bachelor's degree or higher.
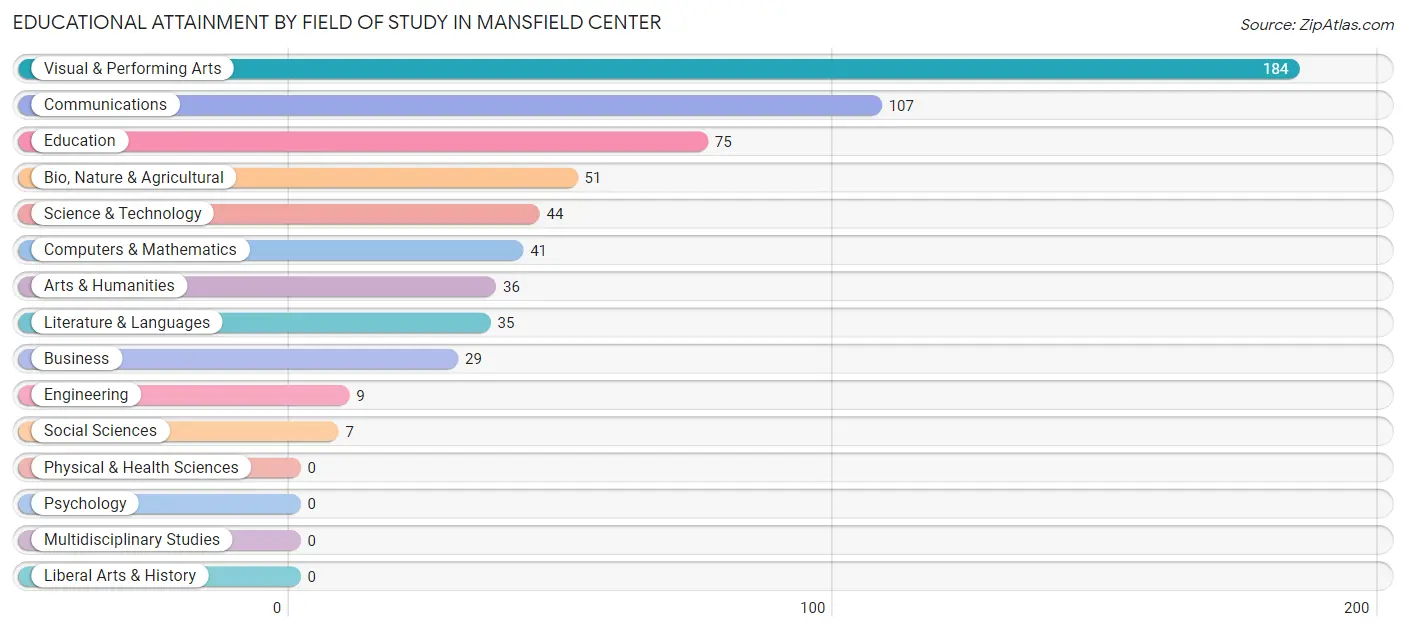
| Field of Study | # Graduates | % Graduates |
| Computers & Mathematics | 41 | 6.6% |
| Bio, Nature & Agricultural | 51 | 8.3% |
| Physical & Health Sciences | 0 | 0.0% |
| Psychology | 0 | 0.0% |
| Social Sciences | 7 | 1.1% |
| Engineering | 9 | 1.5% |
| Multidisciplinary Studies | 0 | 0.0% |
| Science & Technology | 44 | 7.1% |
| Business | 29 | 4.7% |
| Education | 75 | 12.1% |
| Literature & Languages | 35 | 5.7% |
| Liberal Arts & History | 0 | 0.0% |
| Visual & Performing Arts | 184 | 29.8% |
| Communications | 107 | 17.3% |
| Arts & Humanities | 36 | 5.8% |
| Total | 618 | 100.0% |
Transportation & Commute in Mansfield Center
Vehicle Availability by Sex in Mansfield Center
The most prevalent vehicle ownership categories in Mansfield Center are males with 2 vehicles (121, accounting for 40.1%) and females with 2 vehicles (88, making up 52.4%).
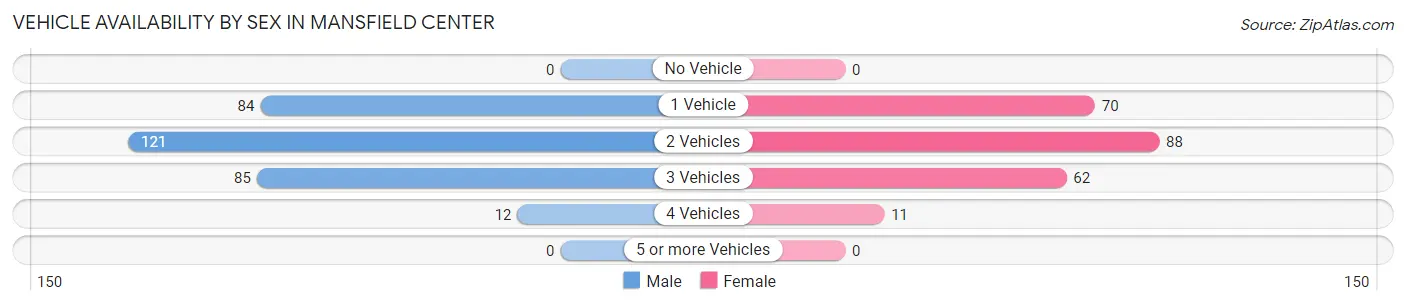
| Vehicles Available | Male | Female |
| No Vehicle | 0 (0.0%) | 0 (0.0%) |
| 1 Vehicle | 84 (27.8%) | 70 (30.3%) |
| 2 Vehicles | 121 (40.1%) | 88 (38.1%) |
| 3 Vehicles | 85 (28.1%) | 62 (26.8%) |
| 4 Vehicles | 12 (4.0%) | 11 (4.8%) |
| 5 or more Vehicles | 0 (0.0%) | 0 (0.0%) |
| Total | 302 (100.0%) | 231 (100.0%) |
Commute Time in Mansfield Center
The most frequently occuring commute durations in Mansfield Center are 5 to 9 minutes (108 commuters, 26.5%), 15 to 19 minutes (69 commuters, 16.9%), and 35 to 39 minutes (53 commuters, 13.0%).
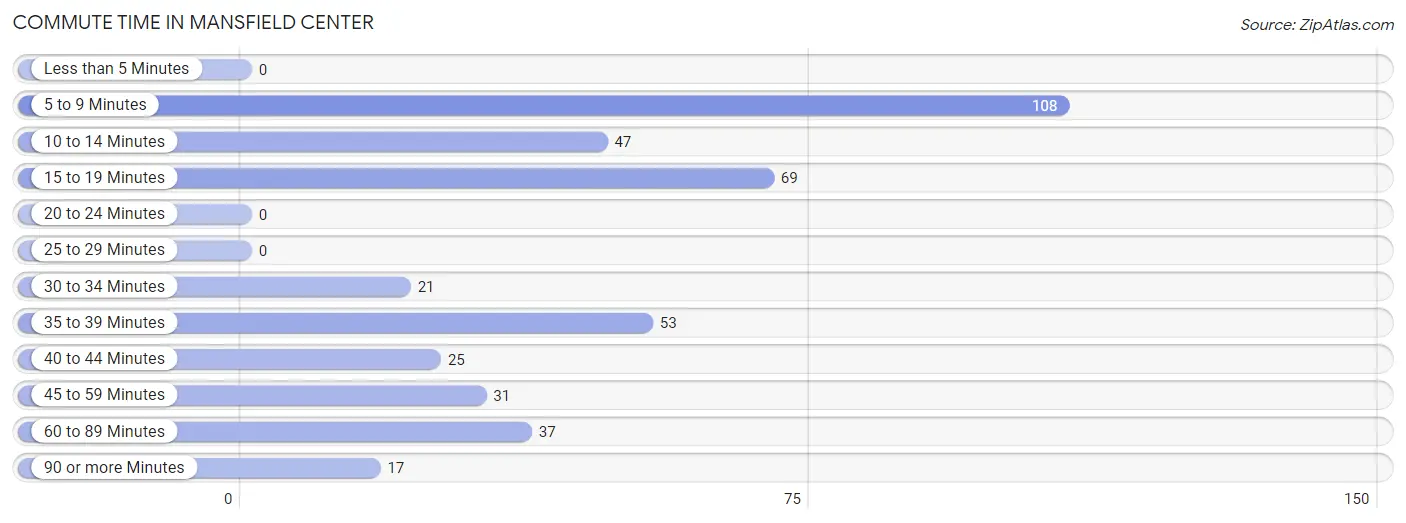
| Commute Time | # Commuters | % Commuters |
| Less than 5 Minutes | 0 | 0.0% |
| 5 to 9 Minutes | 108 | 26.5% |
| 10 to 14 Minutes | 47 | 11.5% |
| 15 to 19 Minutes | 69 | 16.9% |
| 20 to 24 Minutes | 0 | 0.0% |
| 25 to 29 Minutes | 0 | 0.0% |
| 30 to 34 Minutes | 21 | 5.1% |
| 35 to 39 Minutes | 53 | 13.0% |
| 40 to 44 Minutes | 25 | 6.1% |
| 45 to 59 Minutes | 31 | 7.6% |
| 60 to 89 Minutes | 37 | 9.1% |
| 90 or more Minutes | 17 | 4.2% |
Commute Time by Sex in Mansfield Center
The most common commute times in Mansfield Center are 5 to 9 minutes (42 commuters, 21.5%) for males and 5 to 9 minutes (66 commuters, 31.0%) for females.
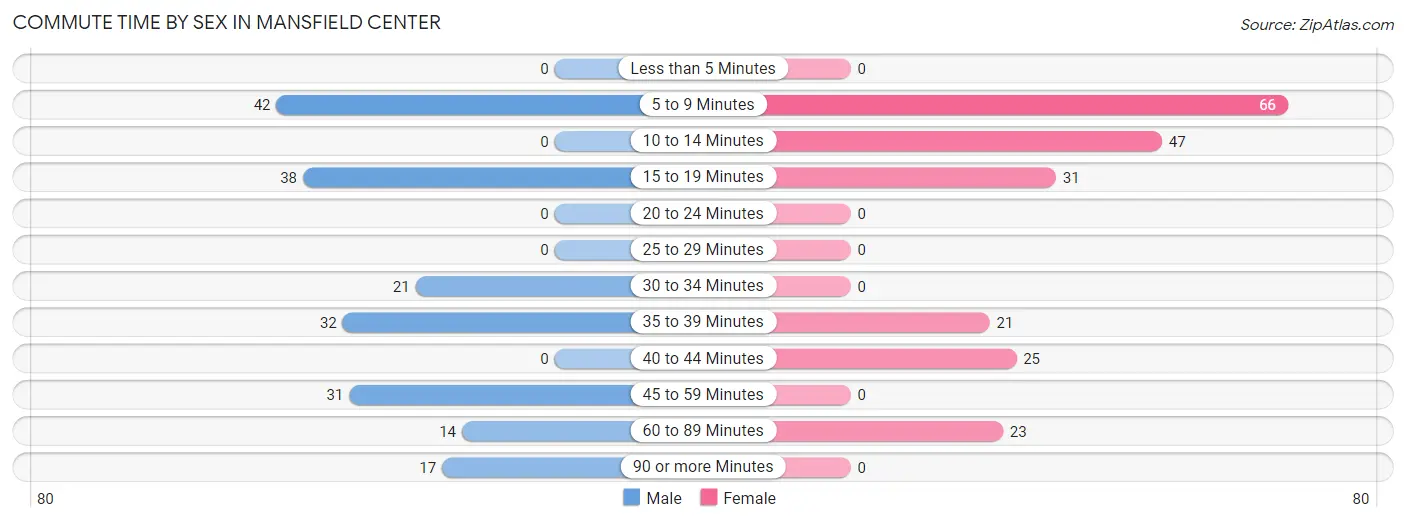
| Commute Time | Male | Female |
| Less than 5 Minutes | 0 (0.0%) | 0 (0.0%) |
| 5 to 9 Minutes | 42 (21.5%) | 66 (31.0%) |
| 10 to 14 Minutes | 0 (0.0%) | 47 (22.1%) |
| 15 to 19 Minutes | 38 (19.5%) | 31 (14.5%) |
| 20 to 24 Minutes | 0 (0.0%) | 0 (0.0%) |
| 25 to 29 Minutes | 0 (0.0%) | 0 (0.0%) |
| 30 to 34 Minutes | 21 (10.8%) | 0 (0.0%) |
| 35 to 39 Minutes | 32 (16.4%) | 21 (9.9%) |
| 40 to 44 Minutes | 0 (0.0%) | 25 (11.7%) |
| 45 to 59 Minutes | 31 (15.9%) | 0 (0.0%) |
| 60 to 89 Minutes | 14 (7.2%) | 23 (10.8%) |
| 90 or more Minutes | 17 (8.7%) | 0 (0.0%) |
Time of Departure to Work by Sex in Mansfield Center
The most frequent times of departure to work in Mansfield Center are 6:00 AM to 6:29 AM (51, 26.2%) for males and 7:30 AM to 7:59 AM (68, 31.9%) for females.
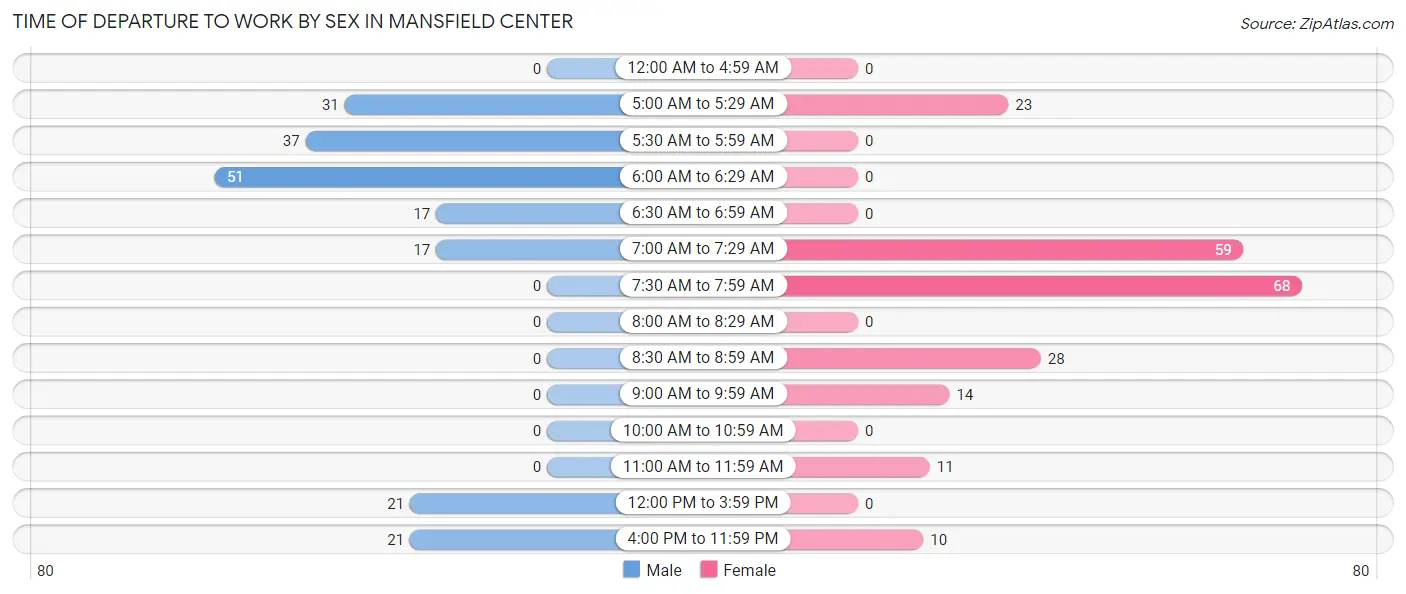
| Time of Departure | Male | Female |
| 12:00 AM to 4:59 AM | 0 (0.0%) | 0 (0.0%) |
| 5:00 AM to 5:29 AM | 31 (15.9%) | 23 (10.8%) |
| 5:30 AM to 5:59 AM | 37 (19.0%) | 0 (0.0%) |
| 6:00 AM to 6:29 AM | 51 (26.2%) | 0 (0.0%) |
| 6:30 AM to 6:59 AM | 17 (8.7%) | 0 (0.0%) |
| 7:00 AM to 7:29 AM | 17 (8.7%) | 59 (27.7%) |
| 7:30 AM to 7:59 AM | 0 (0.0%) | 68 (31.9%) |
| 8:00 AM to 8:29 AM | 0 (0.0%) | 0 (0.0%) |
| 8:30 AM to 8:59 AM | 0 (0.0%) | 28 (13.2%) |
| 9:00 AM to 9:59 AM | 0 (0.0%) | 14 (6.6%) |
| 10:00 AM to 10:59 AM | 0 (0.0%) | 0 (0.0%) |
| 11:00 AM to 11:59 AM | 0 (0.0%) | 11 (5.2%) |
| 12:00 PM to 3:59 PM | 21 (10.8%) | 0 (0.0%) |
| 4:00 PM to 11:59 PM | 21 (10.8%) | 10 (4.7%) |
| Total | 195 (100.0%) | 213 (100.0%) |
Housing Occupancy in Mansfield Center
Occupancy by Ownership in Mansfield Center
Of the total 505 dwellings in Mansfield Center, owner-occupied units account for 419 (83.0%), while renter-occupied units make up 86 (17.0%).
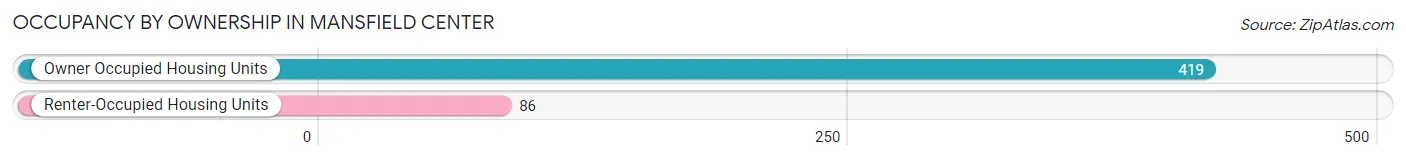
| Occupancy | # Housing Units | % Housing Units |
| Owner Occupied Housing Units | 419 | 83.0% |
| Renter-Occupied Housing Units | 86 | 17.0% |
| Total Occupied Housing Units | 505 | 100.0% |
Occupancy by Household Size in Mansfield Center
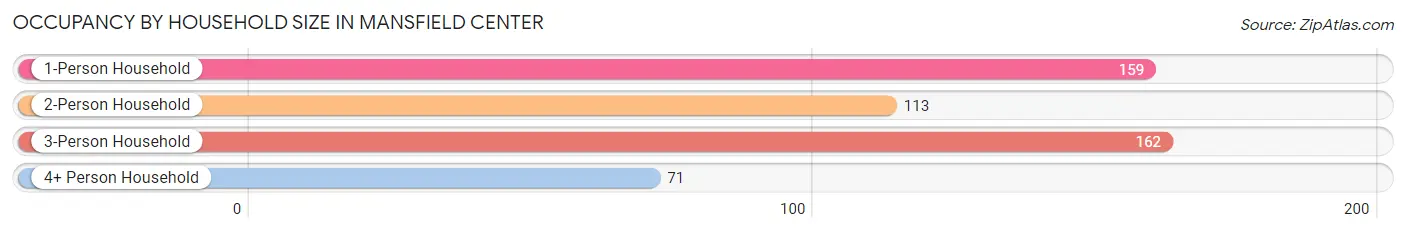
| Household Size | # Housing Units | % Housing Units |
| 1-Person Household | 159 | 31.5% |
| 2-Person Household | 113 | 22.4% |
| 3-Person Household | 162 | 32.1% |
| 4+ Person Household | 71 | 14.1% |
| Total Housing Units | 505 | 100.0% |
Occupancy by Ownership by Household Size in Mansfield Center
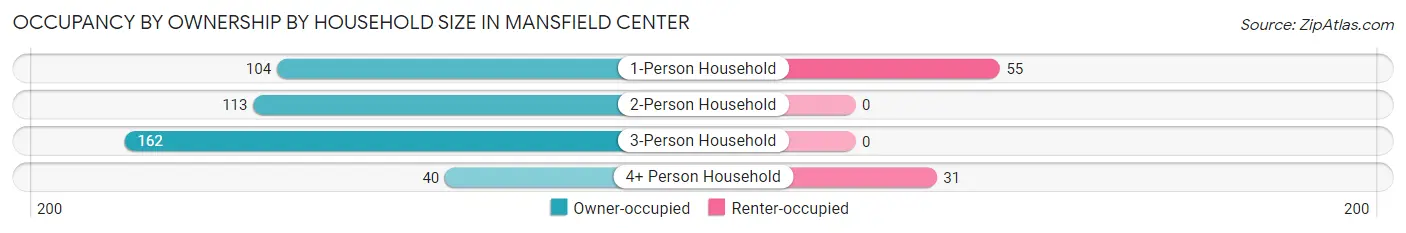
| Household Size | Owner-occupied | Renter-occupied |
| 1-Person Household | 104 (65.4%) | 55 (34.6%) |
| 2-Person Household | 113 (100.0%) | 0 (0.0%) |
| 3-Person Household | 162 (100.0%) | 0 (0.0%) |
| 4+ Person Household | 40 (56.3%) | 31 (43.7%) |
| Total Housing Units | 419 (83.0%) | 86 (17.0%) |
Occupancy by Educational Attainment in Mansfield Center
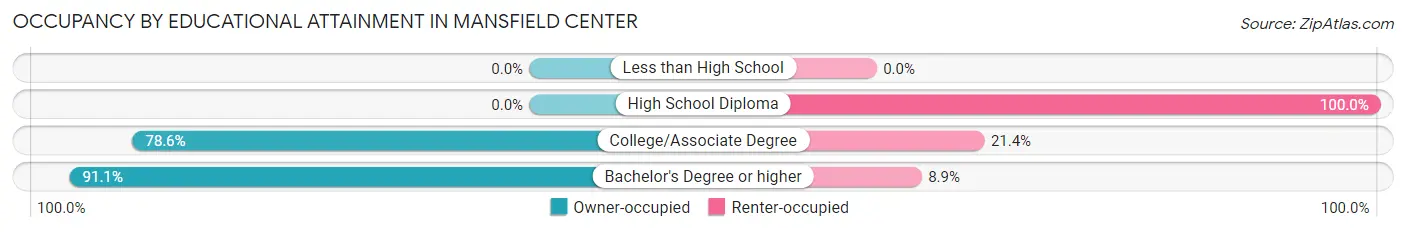
| Household Size | Owner-occupied | Renter-occupied |
| Less than High School | 0 (0.0%) | 0 (0.0%) |
| High School Diploma | 0 (0.0%) | 27 (100.0%) |
| College/Associate Degree | 103 (78.6%) | 28 (21.4%) |
| Bachelor's Degree or higher | 316 (91.1%) | 31 (8.9%) |
Occupancy by Age of Householder in Mansfield Center
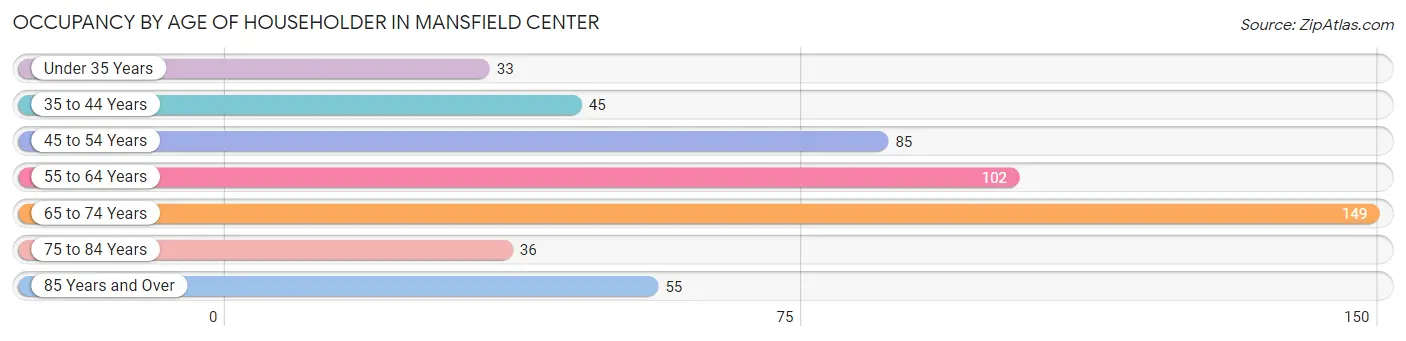
| Age Bracket | # Households | % Households |
| Under 35 Years | 33 | 6.5% |
| 35 to 44 Years | 45 | 8.9% |
| 45 to 54 Years | 85 | 16.8% |
| 55 to 64 Years | 102 | 20.2% |
| 65 to 74 Years | 149 | 29.5% |
| 75 to 84 Years | 36 | 7.1% |
| 85 Years and Over | 55 | 10.9% |
| Total | 505 | 100.0% |
Housing Finances in Mansfield Center
Median Income by Occupancy in Mansfield Center
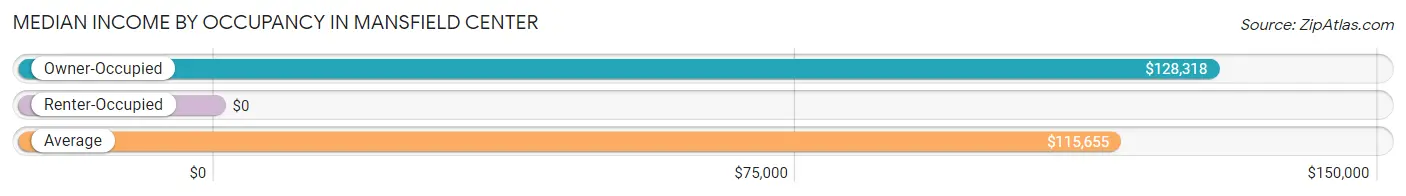
| Occupancy Type | # Households | Median Income |
| Owner-Occupied | 419 (83.0%) | $128,318 |
| Renter-Occupied | 86 (17.0%) | $0 |
| Average | 505 (100.0%) | $115,655 |
Occupancy by Householder Income Bracket in Mansfield Center
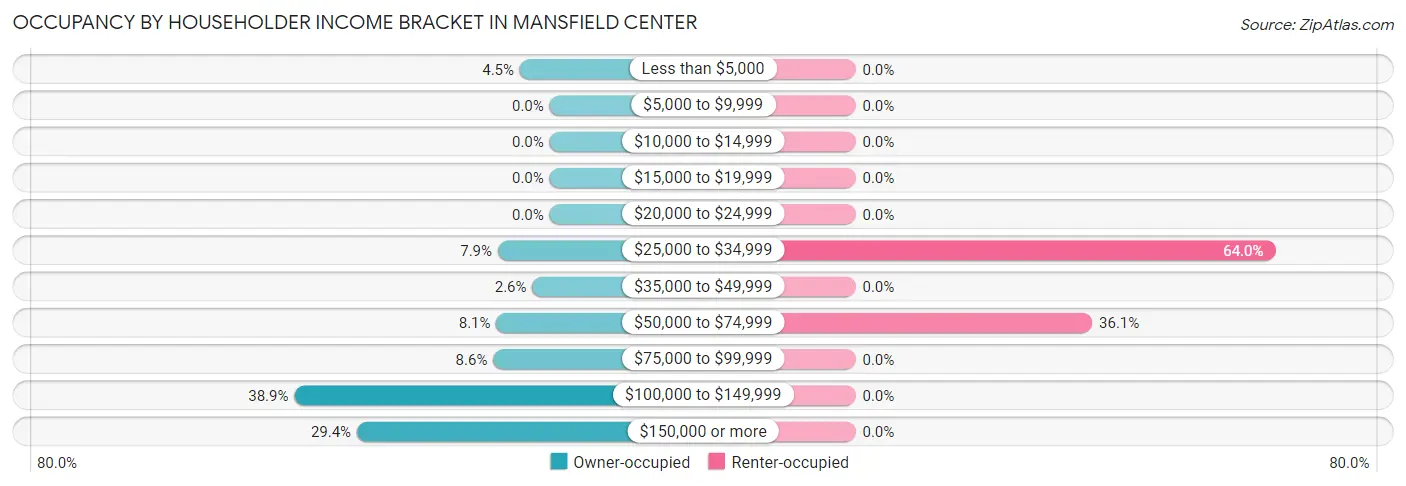
| Income Bracket | Owner-occupied | Renter-occupied |
| Less than $5,000 | 19 (4.5%) | 0 (0.0%) |
| $5,000 to $9,999 | 0 (0.0%) | 0 (0.0%) |
| $10,000 to $14,999 | 0 (0.0%) | 0 (0.0%) |
| $15,000 to $19,999 | 0 (0.0%) | 0 (0.0%) |
| $20,000 to $24,999 | 0 (0.0%) | 0 (0.0%) |
| $25,000 to $34,999 | 33 (7.9%) | 55 (63.9%) |
| $35,000 to $49,999 | 11 (2.6%) | 0 (0.0%) |
| $50,000 to $74,999 | 34 (8.1%) | 31 (36.0%) |
| $75,000 to $99,999 | 36 (8.6%) | 0 (0.0%) |
| $100,000 to $149,999 | 163 (38.9%) | 0 (0.0%) |
| $150,000 or more | 123 (29.4%) | 0 (0.0%) |
| Total | 419 (100.0%) | 86 (100.0%) |
Monthly Housing Cost Tiers in Mansfield Center
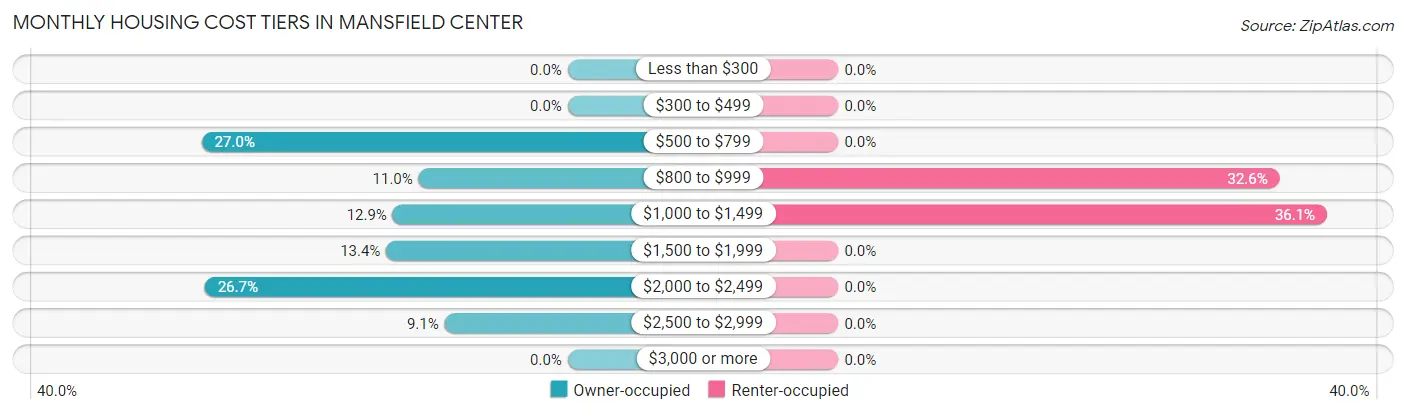
| Monthly Cost | Owner-occupied | Renter-occupied |
| Less than $300 | 0 (0.0%) | 0 (0.0%) |
| $300 to $499 | 0 (0.0%) | 0 (0.0%) |
| $500 to $799 | 113 (27.0%) | 0 (0.0%) |
| $800 to $999 | 46 (11.0%) | 28 (32.6%) |
| $1,000 to $1,499 | 54 (12.9%) | 31 (36.0%) |
| $1,500 to $1,999 | 56 (13.4%) | 0 (0.0%) |
| $2,000 to $2,499 | 112 (26.7%) | 0 (0.0%) |
| $2,500 to $2,999 | 38 (9.1%) | 0 (0.0%) |
| $3,000 or more | 0 (0.0%) | 0 (0.0%) |
| Total | 419 (100.0%) | 86 (100.0%) |
Physical Housing Characteristics in Mansfield Center
Housing Structures in Mansfield Center
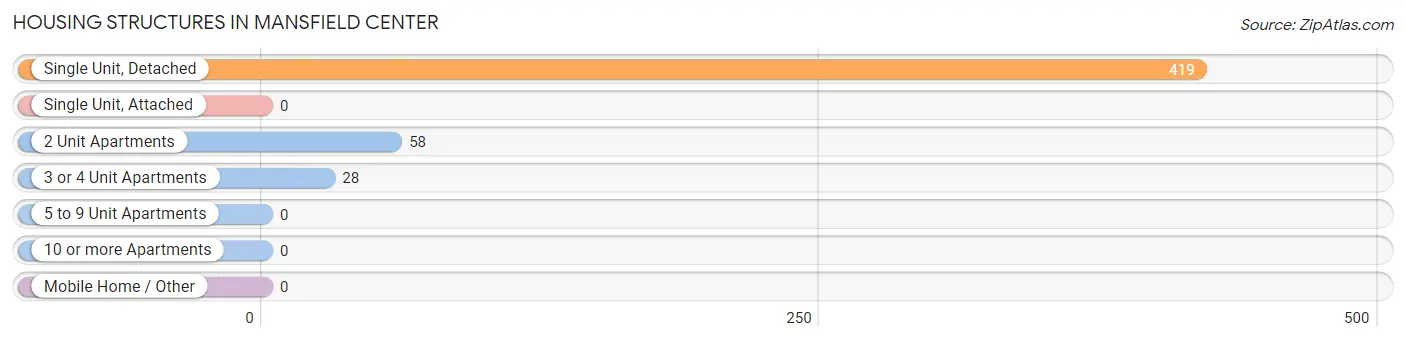
| Structure Type | # Housing Units | % Housing Units |
| Single Unit, Detached | 419 | 83.0% |
| Single Unit, Attached | 0 | 0.0% |
| 2 Unit Apartments | 58 | 11.5% |
| 3 or 4 Unit Apartments | 28 | 5.5% |
| 5 to 9 Unit Apartments | 0 | 0.0% |
| 10 or more Apartments | 0 | 0.0% |
| Mobile Home / Other | 0 | 0.0% |
| Total | 505 | 100.0% |
Housing Structures by Occupancy in Mansfield Center
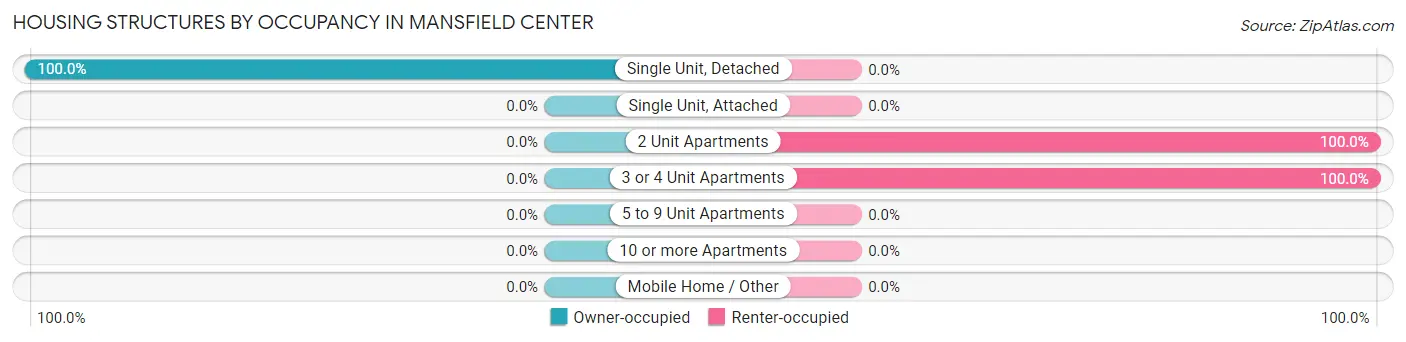
| Structure Type | Owner-occupied | Renter-occupied |
| Single Unit, Detached | 419 (100.0%) | 0 (0.0%) |
| Single Unit, Attached | 0 (0.0%) | 0 (0.0%) |
| 2 Unit Apartments | 0 (0.0%) | 58 (100.0%) |
| 3 or 4 Unit Apartments | 0 (0.0%) | 28 (100.0%) |
| 5 to 9 Unit Apartments | 0 (0.0%) | 0 (0.0%) |
| 10 or more Apartments | 0 (0.0%) | 0 (0.0%) |
| Mobile Home / Other | 0 (0.0%) | 0 (0.0%) |
| Total | 419 (83.0%) | 86 (17.0%) |
Housing Structures by Number of Rooms in Mansfield Center
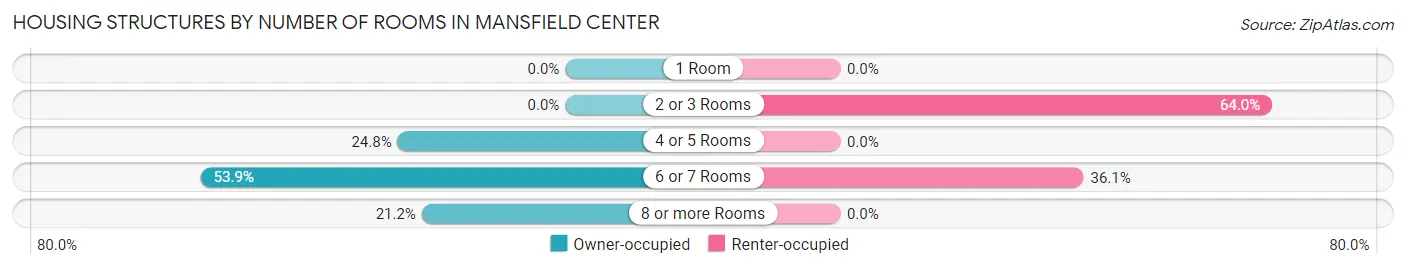
| Number of Rooms | Owner-occupied | Renter-occupied |
| 1 Room | 0 (0.0%) | 0 (0.0%) |
| 2 or 3 Rooms | 0 (0.0%) | 55 (63.9%) |
| 4 or 5 Rooms | 104 (24.8%) | 0 (0.0%) |
| 6 or 7 Rooms | 226 (53.9%) | 31 (36.0%) |
| 8 or more Rooms | 89 (21.2%) | 0 (0.0%) |
| Total | 419 (100.0%) | 86 (100.0%) |
Housing Structure by Heating Type in Mansfield Center
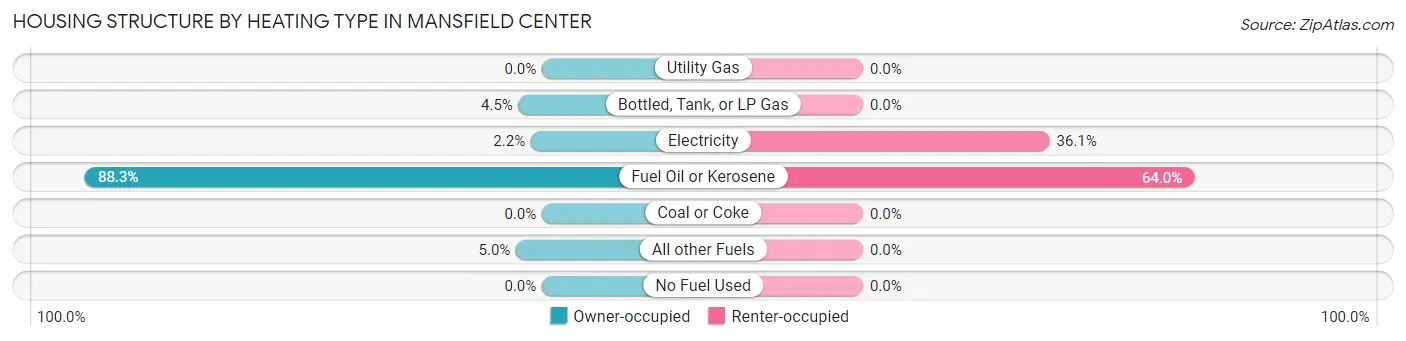
| Heating Type | Owner-occupied | Renter-occupied |
| Utility Gas | 0 (0.0%) | 0 (0.0%) |
| Bottled, Tank, or LP Gas | 19 (4.5%) | 0 (0.0%) |
| Electricity | 9 (2.1%) | 31 (36.0%) |
| Fuel Oil or Kerosene | 370 (88.3%) | 55 (63.9%) |
| Coal or Coke | 0 (0.0%) | 0 (0.0%) |
| All other Fuels | 21 (5.0%) | 0 (0.0%) |
| No Fuel Used | 0 (0.0%) | 0 (0.0%) |
| Total | 419 (100.0%) | 86 (100.0%) |
Household Vehicle Usage in Mansfield Center
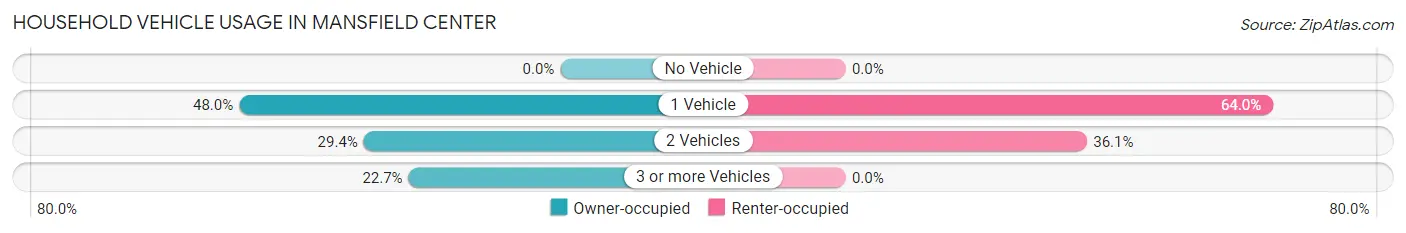
| Vehicles per Household | Owner-occupied | Renter-occupied |
| No Vehicle | 0 (0.0%) | 0 (0.0%) |
| 1 Vehicle | 201 (48.0%) | 55 (63.9%) |
| 2 Vehicles | 123 (29.4%) | 31 (36.0%) |
| 3 or more Vehicles | 95 (22.7%) | 0 (0.0%) |
| Total | 419 (100.0%) | 86 (100.0%) |
Real Estate & Mortgages in Mansfield Center
Real Estate and Mortgage Overview in Mansfield Center
| Characteristic | Without Mortgage | With Mortgage |
| Housing Units | 194 | 225 |
| Median Property Value | $299,100 | $219,300 |
| Median Household Income | $115,833 | $56 |
| Monthly Housing Costs | $782 | $0 |
| Real Estate Taxes | $5,792 | $0 |
Property Value by Mortgage Status in Mansfield Center
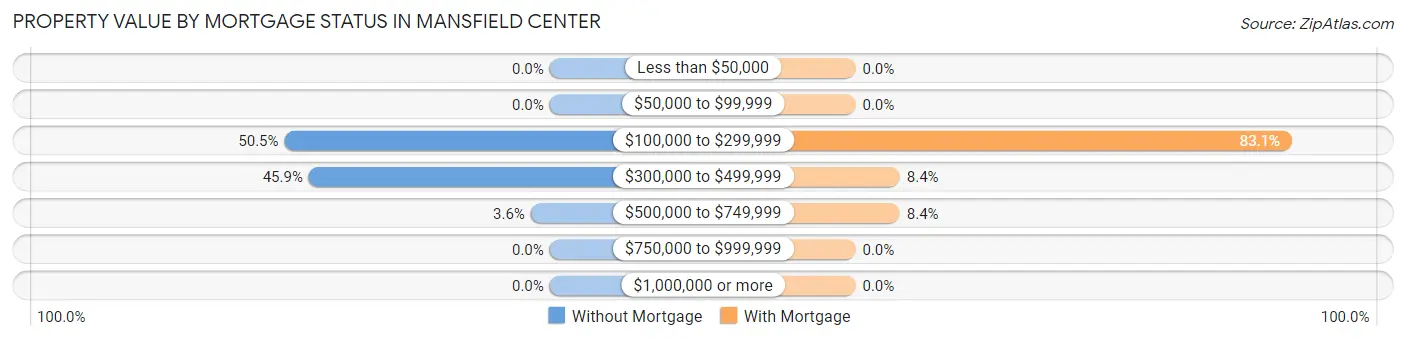
| Property Value | Without Mortgage | With Mortgage |
| Less than $50,000 | 0 (0.0%) | 0 (0.0%) |
| $50,000 to $99,999 | 0 (0.0%) | 0 (0.0%) |
| $100,000 to $299,999 | 98 (50.5%) | 187 (83.1%) |
| $300,000 to $499,999 | 89 (45.9%) | 19 (8.4%) |
| $500,000 to $749,999 | 7 (3.6%) | 19 (8.4%) |
| $750,000 to $999,999 | 0 (0.0%) | 0 (0.0%) |
| $1,000,000 or more | 0 (0.0%) | 0 (0.0%) |
| Total | 194 (100.0%) | 225 (100.0%) |
Household Income by Mortgage Status in Mansfield Center
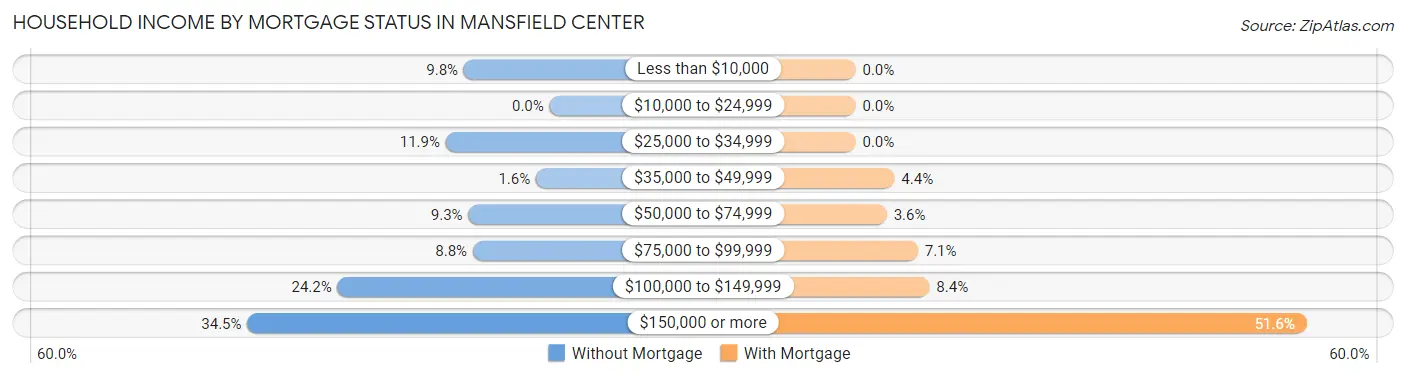
| Household Income | Without Mortgage | With Mortgage |
| Less than $10,000 | 19 (9.8%) | 0 (0.0%) |
| $10,000 to $24,999 | 0 (0.0%) | 0 (0.0%) |
| $25,000 to $34,999 | 23 (11.9%) | 0 (0.0%) |
| $35,000 to $49,999 | 3 (1.5%) | 10 (4.4%) |
| $50,000 to $74,999 | 18 (9.3%) | 8 (3.6%) |
| $75,000 to $99,999 | 17 (8.8%) | 16 (7.1%) |
| $100,000 to $149,999 | 47 (24.2%) | 19 (8.4%) |
| $150,000 or more | 67 (34.5%) | 116 (51.6%) |
| Total | 194 (100.0%) | 225 (100.0%) |
Property Value to Household Income Ratio in Mansfield Center
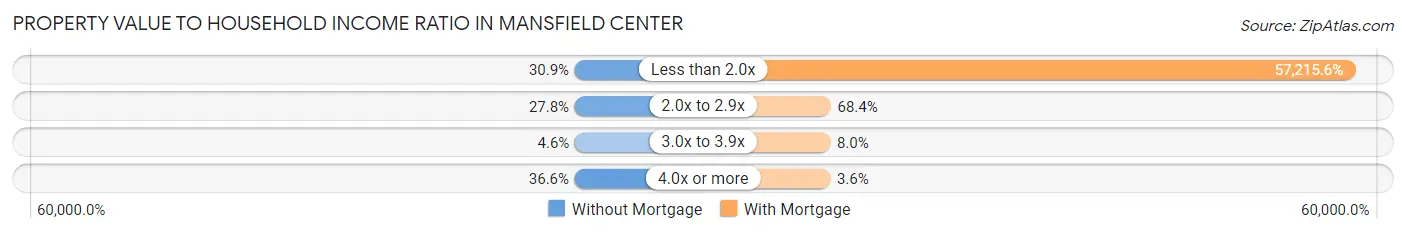
| Value-to-Income Ratio | Without Mortgage | With Mortgage |
| Less than 2.0x | 60 (30.9%) | 128,735 (57,215.6%) |
| 2.0x to 2.9x | 54 (27.8%) | 154 (68.4%) |
| 3.0x to 3.9x | 9 (4.6%) | 18 (8.0%) |
| 4.0x or more | 71 (36.6%) | 8 (3.6%) |
| Total | 194 (100.0%) | 225 (100.0%) |
Real Estate Taxes by Mortgage Status in Mansfield Center
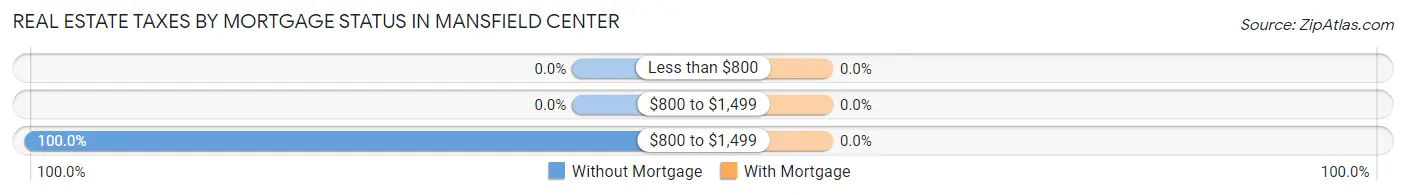
| Property Taxes | Without Mortgage | With Mortgage |
| Less than $800 | 0 (0.0%) | 0 (0.0%) |
| $800 to $1,499 | 0 (0.0%) | 0 (0.0%) |
| $800 to $1,499 | 194 (100.0%) | 0 (0.0%) |
| Total | 194 (100.0%) | 225 (100.0%) |
Health & Disability in Mansfield Center
Health Insurance Coverage by Age in Mansfield Center
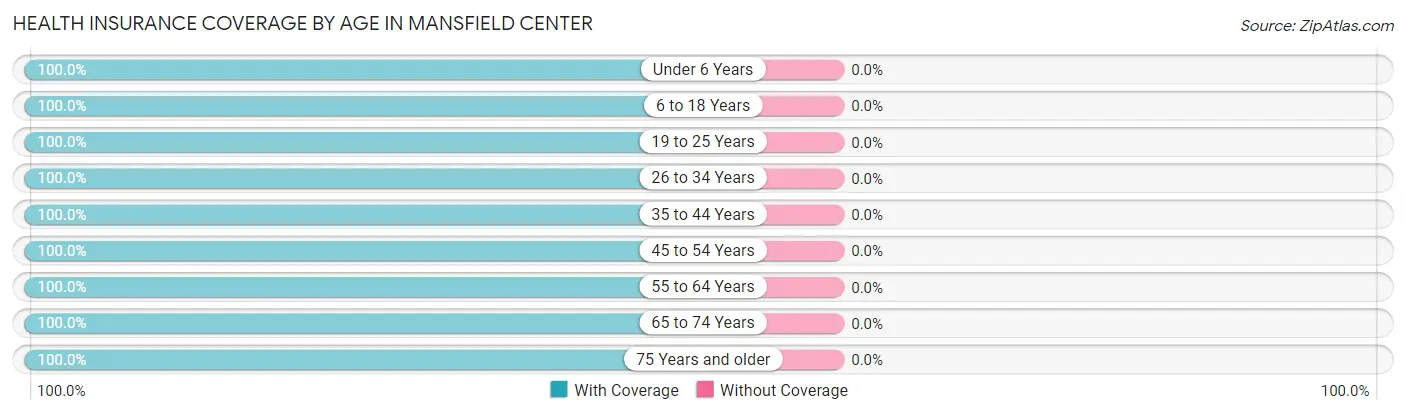
| Age Bracket | With Coverage | Without Coverage |
| Under 6 Years | 76 (100.0%) | 0 (0.0%) |
| 6 to 18 Years | 70 (100.0%) | 0 (0.0%) |
| 19 to 25 Years | 175 (100.0%) | 0 (0.0%) |
| 26 to 34 Years | 136 (100.0%) | 0 (0.0%) |
| 35 to 44 Years | 105 (100.0%) | 0 (0.0%) |
| 45 to 54 Years | 140 (100.0%) | 0 (0.0%) |
| 55 to 64 Years | 258 (100.0%) | 0 (0.0%) |
| 65 to 74 Years | 201 (100.0%) | 0 (0.0%) |
| 75 Years and older | 120 (100.0%) | 0 (0.0%) |
| Total | 1,281 (100.0%) | 0 (0.0%) |
Health Insurance Coverage by Citizenship Status in Mansfield Center
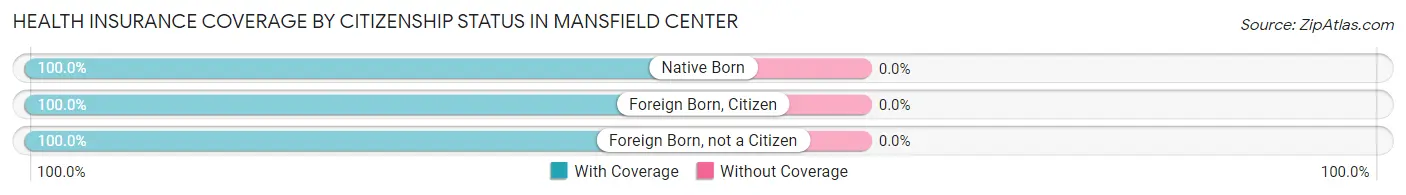
| Citizenship Status | With Coverage | Without Coverage |
| Native Born | 76 (100.0%) | 0 (0.0%) |
| Foreign Born, Citizen | 70 (100.0%) | 0 (0.0%) |
| Foreign Born, not a Citizen | 175 (100.0%) | 0 (0.0%) |
Health Insurance Coverage by Household Income in Mansfield Center
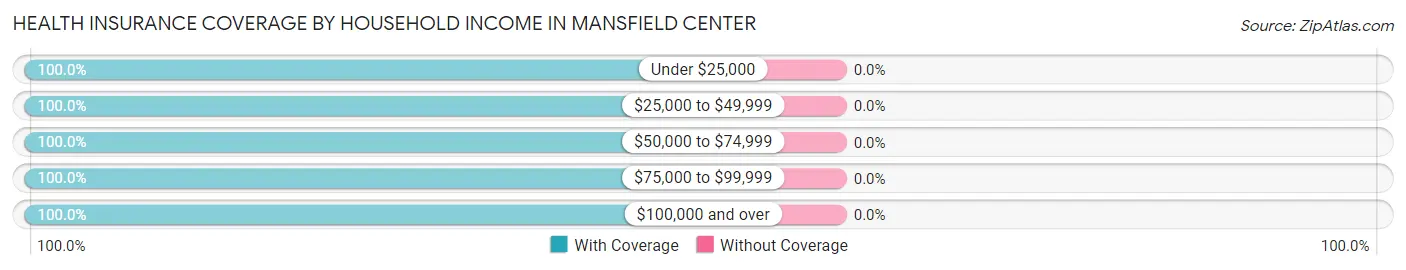
| Household Income | With Coverage | Without Coverage |
| Under $25,000 | 19 (100.0%) | 0 (0.0%) |
| $25,000 to $49,999 | 117 (100.0%) | 0 (0.0%) |
| $50,000 to $74,999 | 158 (100.0%) | 0 (0.0%) |
| $75,000 to $99,999 | 96 (100.0%) | 0 (0.0%) |
| $100,000 and over | 886 (100.0%) | 0 (0.0%) |
Public vs Private Health Insurance Coverage by Age in Mansfield Center
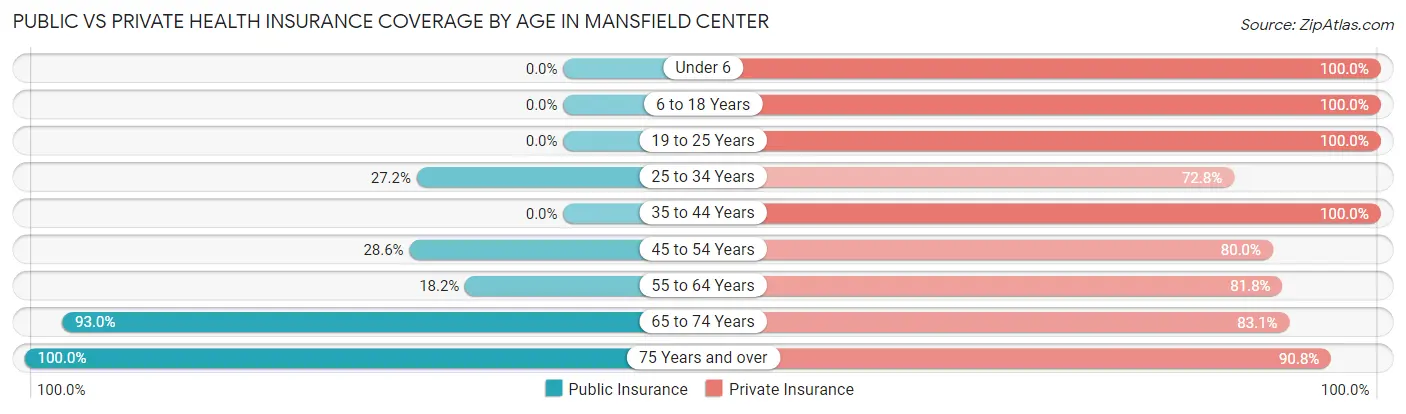
| Age Bracket | Public Insurance | Private Insurance |
| Under 6 | 0 (0.0%) | 76 (100.0%) |
| 6 to 18 Years | 0 (0.0%) | 70 (100.0%) |
| 19 to 25 Years | 0 (0.0%) | 175 (100.0%) |
| 25 to 34 Years | 37 (27.2%) | 99 (72.8%) |
| 35 to 44 Years | 0 (0.0%) | 105 (100.0%) |
| 45 to 54 Years | 40 (28.6%) | 112 (80.0%) |
| 55 to 64 Years | 47 (18.2%) | 211 (81.8%) |
| 65 to 74 Years | 187 (93.0%) | 167 (83.1%) |
| 75 Years and over | 120 (100.0%) | 109 (90.8%) |
| Total | 431 (33.7%) | 1,124 (87.7%) |
Disability Status by Sex by Age in Mansfield Center
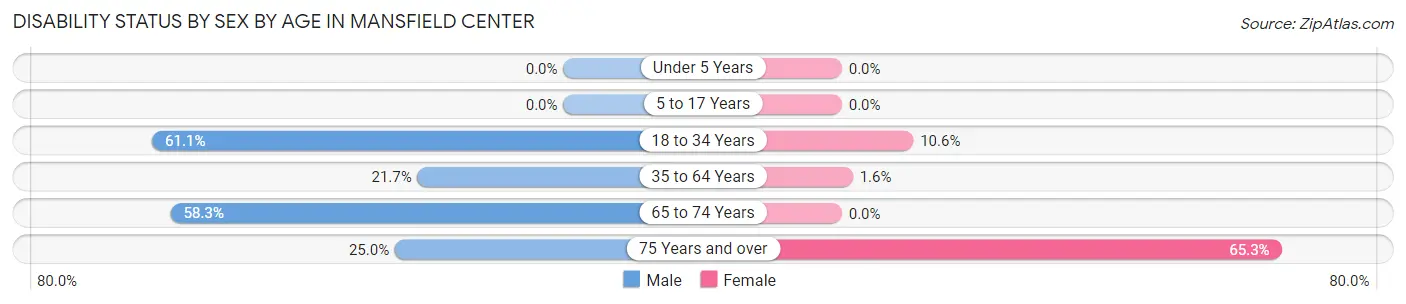
| Age Bracket | Male | Female |
| Under 5 Years | 0 (0.0%) | 0 (0.0%) |
| 5 to 17 Years | 0 (0.0%) | 0 (0.0%) |
| 18 to 34 Years | 69 (61.1%) | 21 (10.6%) |
| 35 to 64 Years | 42 (21.6%) | 5 (1.6%) |
| 65 to 74 Years | 84 (58.3%) | 0 (0.0%) |
| 75 Years and over | 12 (25.0%) | 47 (65.3%) |
Disability Class by Sex by Age in Mansfield Center
Disability Class: Hearing Difficulty
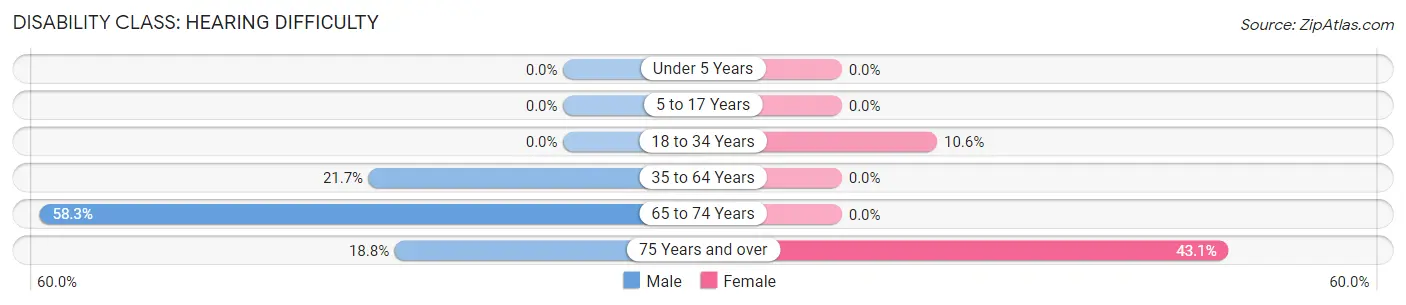
| Age Bracket | Male | Female |
| Under 5 Years | 0 (0.0%) | 0 (0.0%) |
| 5 to 17 Years | 0 (0.0%) | 0 (0.0%) |
| 18 to 34 Years | 0 (0.0%) | 21 (10.6%) |
| 35 to 64 Years | 42 (21.6%) | 0 (0.0%) |
| 65 to 74 Years | 84 (58.3%) | 0 (0.0%) |
| 75 Years and over | 9 (18.8%) | 31 (43.1%) |
Disability Class: Vision Difficulty
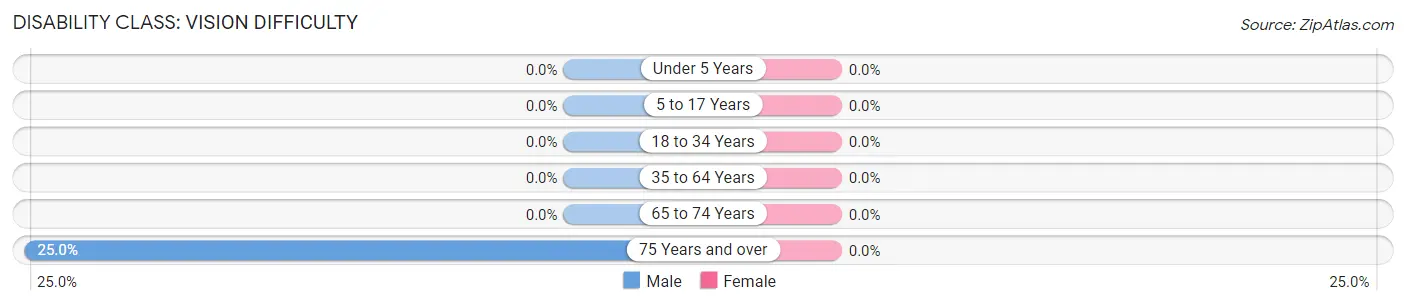
| Age Bracket | Male | Female |
| Under 5 Years | 0 (0.0%) | 0 (0.0%) |
| 5 to 17 Years | 0 (0.0%) | 0 (0.0%) |
| 18 to 34 Years | 0 (0.0%) | 0 (0.0%) |
| 35 to 64 Years | 0 (0.0%) | 0 (0.0%) |
| 65 to 74 Years | 0 (0.0%) | 0 (0.0%) |
| 75 Years and over | 12 (25.0%) | 0 (0.0%) |
Disability Class: Cognitive Difficulty
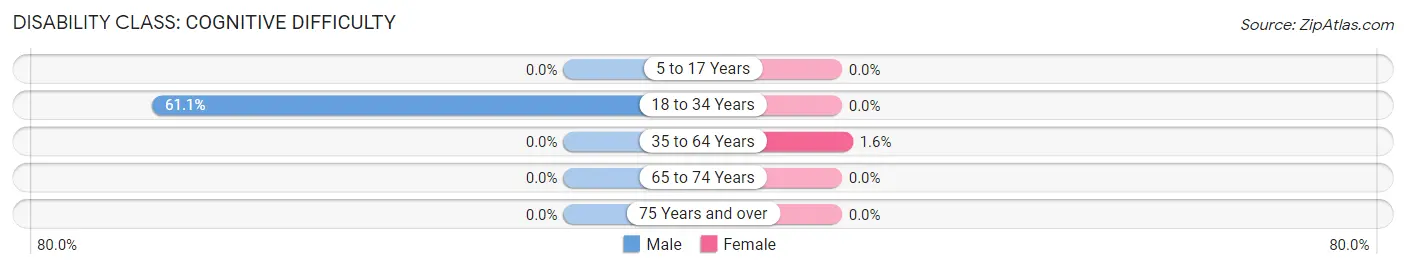
| Age Bracket | Male | Female |
| 5 to 17 Years | 0 (0.0%) | 0 (0.0%) |
| 18 to 34 Years | 69 (61.1%) | 0 (0.0%) |
| 35 to 64 Years | 0 (0.0%) | 5 (1.6%) |
| 65 to 74 Years | 0 (0.0%) | 0 (0.0%) |
| 75 Years and over | 0 (0.0%) | 0 (0.0%) |
Disability Class: Ambulatory Difficulty
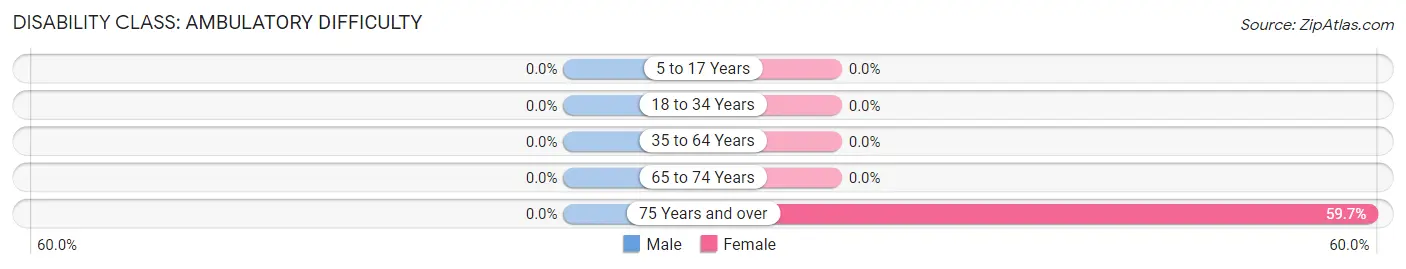
| Age Bracket | Male | Female |
| 5 to 17 Years | 0 (0.0%) | 0 (0.0%) |
| 18 to 34 Years | 0 (0.0%) | 0 (0.0%) |
| 35 to 64 Years | 0 (0.0%) | 0 (0.0%) |
| 65 to 74 Years | 0 (0.0%) | 0 (0.0%) |
| 75 Years and over | 0 (0.0%) | 43 (59.7%) |
Disability Class: Self-Care Difficulty
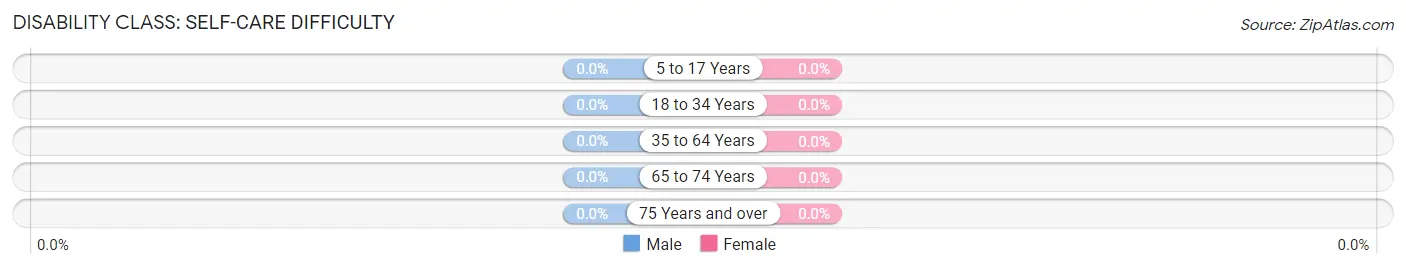
| Age Bracket | Male | Female |
| 5 to 17 Years | 0 (0.0%) | 0 (0.0%) |
| 18 to 34 Years | 0 (0.0%) | 0 (0.0%) |
| 35 to 64 Years | 0 (0.0%) | 0 (0.0%) |
| 65 to 74 Years | 0 (0.0%) | 0 (0.0%) |
| 75 Years and over | 0 (0.0%) | 0 (0.0%) |
Technology Access in Mansfield Center
Computing Device Access in Mansfield Center
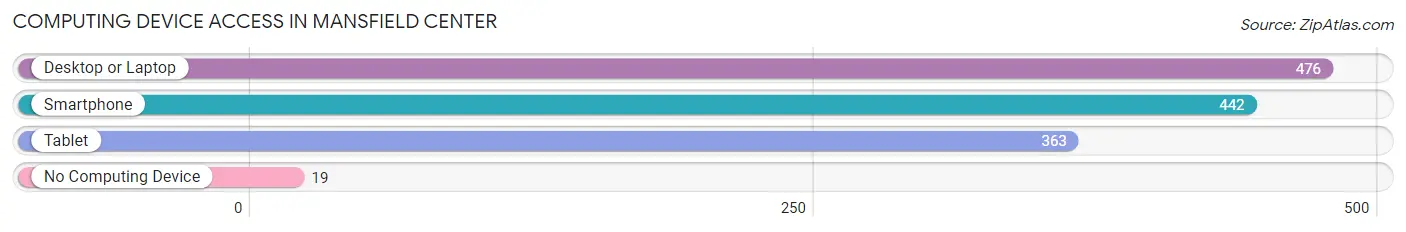
| Device Type | # Households | % Households |
| Desktop or Laptop | 476 | 94.3% |
| Smartphone | 442 | 87.5% |
| Tablet | 363 | 71.9% |
| No Computing Device | 19 | 3.8% |
| Total | 505 | 100.0% |
Internet Access in Mansfield Center
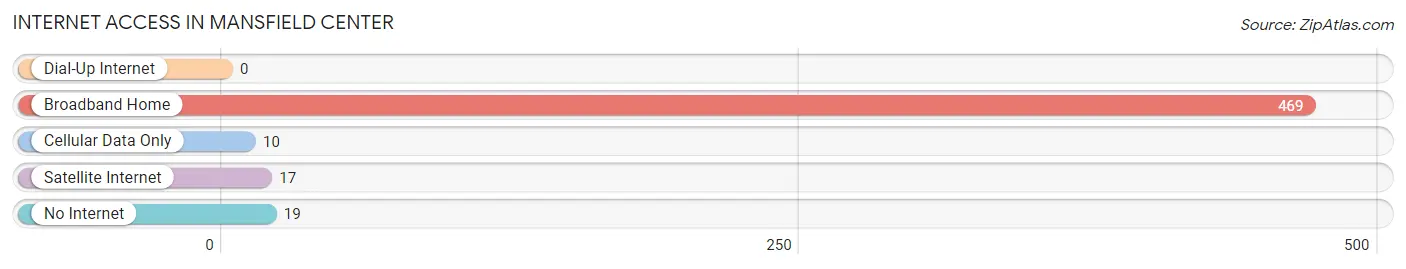
| Internet Type | # Households | % Households |
| Dial-Up Internet | 0 | 0.0% |
| Broadband Home | 469 | 92.9% |
| Cellular Data Only | 10 | 2.0% |
| Satellite Internet | 17 | 3.4% |
| No Internet | 19 | 3.8% |
| Total | 505 | 100.0% |
Mansfield Center Summary
Mansfield Center is a small town located in Tolland County, Connecticut. It is situated in the northeast corner of the state, about 20 miles northeast of Hartford. The town was incorporated in 1702 and has a population of approximately 5,000 people.
Geography
Mansfield Center is located in the northeast corner of Connecticut, in the foothills of the Berkshires. The town is bordered by the towns of Ashford, Willington, Coventry, and Mansfield. The town is situated on the banks of the Fenton River, which flows through the center of town. The terrain is mostly rolling hills, with some flat areas in the center of town. The highest point in town is the summit of Mount Hope, which rises to an elevation of 890 feet.
Climate
Mansfield Center has a humid continental climate, with cold winters and warm summers. The average annual temperature is around 50 degrees Fahrenheit, with an average high of around 70 degrees in the summer and an average low of around 30 degrees in the winter. The town receives an average of 40 inches of precipitation per year, with most of it falling in the form of snow in the winter months.
Economy
Mansfield Center is primarily a residential community, with most of its residents commuting to nearby towns and cities for work. The town does have some small businesses, including a few restaurants, a grocery store, and a few retail stores. The town is also home to the University of Connecticut's Mansfield campus, which provides employment opportunities for many of the town's residents.
Demographics
As of the 2010 census, the population of Mansfield Center was 5,001. The racial makeup of the town was 94.3% White, 1.7% African American, 0.3% Native American, 1.2% Asian, 0.1% Pacific Islander, 1.2% from other races, and 1.4% from two or more races. Hispanic or Latino of any race were 3.2% of the population.
The median household income in Mansfield Center was $76,944, and the median family income was $90,917. The per capita income for the town was $32,945. About 4.2% of families and 5.7% of the population were below the poverty line, including 6.3% of those under age 18 and 4.2% of those age 65 or over.
Conclusion
Mansfield Center is a small town located in the northeast corner of Connecticut. It is a primarily residential community, with most of its residents commuting to nearby towns and cities for work. The town has a humid continental climate, with cold winters and warm summers. The population of Mansfield Center is approximately 5,000 people, with a median household income of $76,944. The town is home to the University of Connecticut's Mansfield campus, which provides employment opportunities for many of the town's residents.
Common Questions
What is Per Capita Income in Mansfield Center?
Per Capita income in Mansfield Center is $46,815.
What is the Median Family Income in Mansfield Center?
Median Family Income in Mansfield Center is $128,750.
What is the Median Household income in Mansfield Center?
Median Household Income in Mansfield Center is $115,655.
What is Income or Wage Gap in Mansfield Center?
Income or Wage Gap in Mansfield Center is 43.2%.
Women in Mansfield Center earn 56.8 cents for every dollar earned by a man.
What is Inequality or Gini Index in Mansfield Center?
Inequality or Gini Index in Mansfield Center is 0.37.
What is the Total Population of Mansfield Center?
Total Population of Mansfield Center is 1,281.
What is the Total Male Population of Mansfield Center?
Total Male Population of Mansfield Center is 544.
What is the Total Female Population of Mansfield Center?
Total Female Population of Mansfield Center is 737.
What is the Ratio of Males per 100 Females in Mansfield Center?
There are 73.81 Males per 100 Females in Mansfield Center.
What is the Ratio of Females per 100 Males in Mansfield Center?
There are 135.48 Females per 100 Males in Mansfield Center.
What is the Median Population Age in Mansfield Center?
Median Population Age in Mansfield Center is 51.6 Years.
What is the Average Family Size in Mansfield Center
Average Family Size in Mansfield Center is 3.4 People.
What is the Average Household Size in Mansfield Center
Average Household Size in Mansfield Center is 2.5 People.
How Large is the Labor Force in Mansfield Center?
There are 552 People in the Labor Forcein in Mansfield Center.
What is the Percentage of People in the Labor Force in Mansfield Center?
47.9% of People are in the Labor Force in Mansfield Center.
What is the Unemployment Rate in Mansfield Center?
Unemployment Rate in Mansfield Center is 3.4%.