Terramuggus, CT Map & Demographics
Terramuggus Map
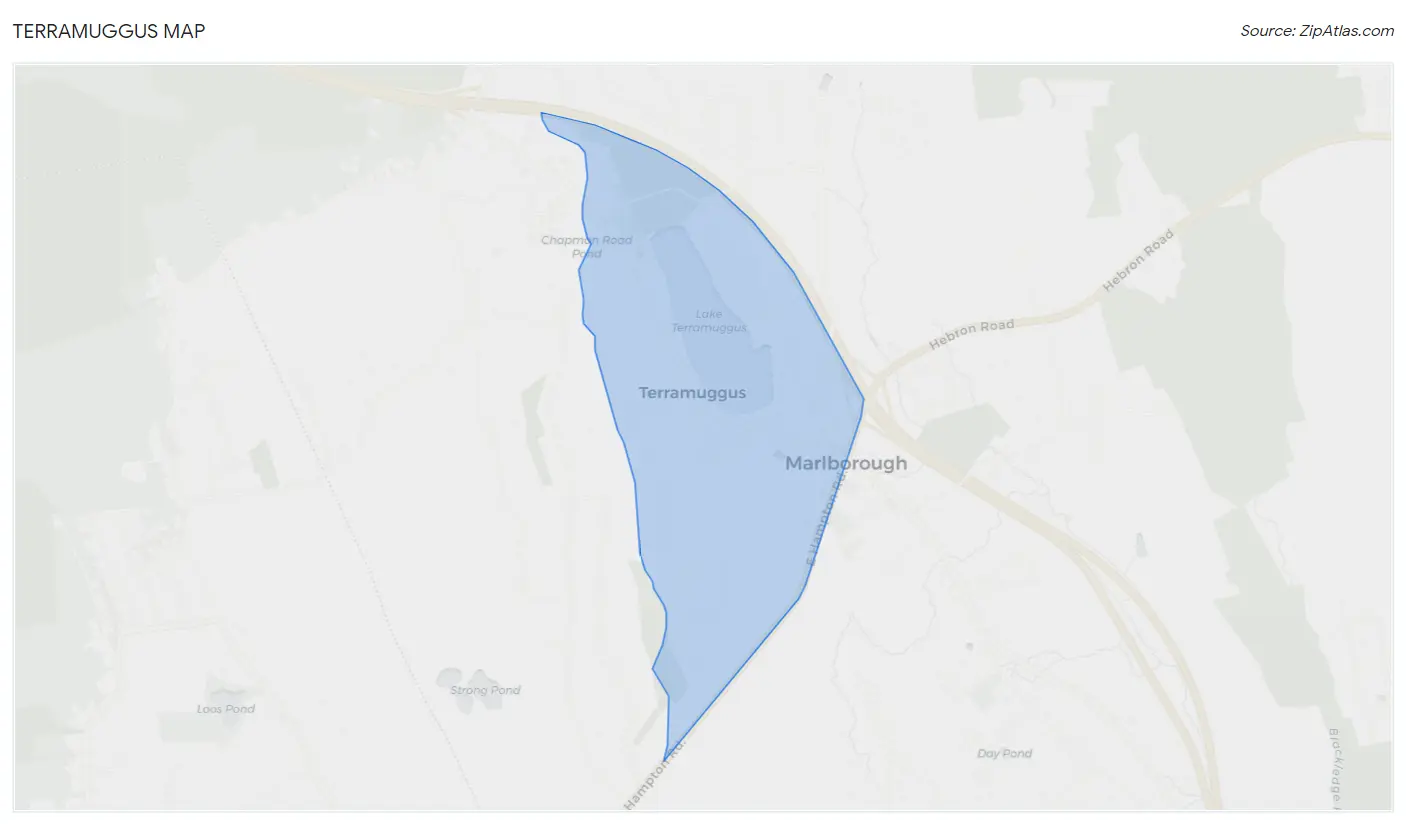
Terramuggus Overview
$56,838
PER CAPITA INCOME
$134,286
AVG FAMILY INCOME
$133,482
AVG HOUSEHOLD INCOME
43.4%
WAGE / INCOME GAP [ % ]
56.6¢/ $1
WAGE / INCOME GAP [ $ ]
0.35
INEQUALITY / GINI INDEX
778
TOTAL POPULATION
357
MALE POPULATION
421
FEMALE POPULATION
84.80
MALES / 100 FEMALES
117.93
FEMALES / 100 MALES
51.5
MEDIAN AGE
2.5
AVG FAMILY SIZE
2.5
AVG HOUSEHOLD SIZE
458
LABOR FORCE [ PEOPLE ]
65.1%
PERCENT IN LABOR FORCE
4.1%
UNEMPLOYMENT RATE
Income in Terramuggus
Income Overview in Terramuggus
Per Capita Income in Terramuggus is $56,838, while median incomes of families and households are $134,286 and $133,482 respectively.
| Characteristic | Number | Measure |
| Per Capita Income | 778 | $56,838 |
| Median Family Income | 306 | $134,286 |
| Mean Family Income | 306 | $143,098 |
| Median Household Income | 315 | $133,482 |
| Mean Household Income | 315 | $140,424 |
| Income Deficit | 306 | $0 |
| Wage / Income Gap (%) | 778 | 43.41% |
| Wage / Income Gap ($) | 778 | 56.59¢ per $1 |
| Gini / Inequality Index | 778 | 0.35 |
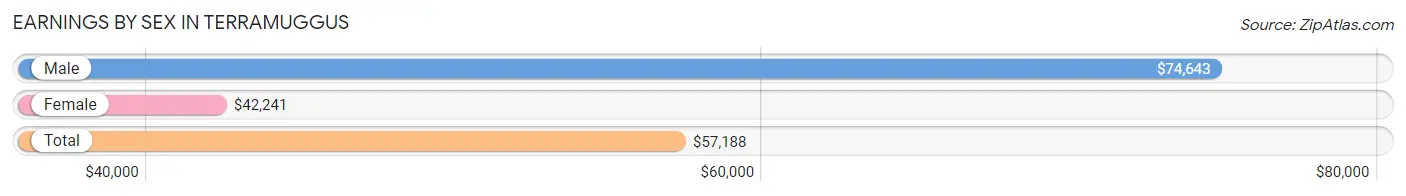
Earnings by Sex in Terramuggus
Average Earnings in Terramuggus are $57,188, $74,643 for men and $42,241 for women, a difference of 43.4%.
| Sex | Number | Average Earnings |
| Male | 268 (53.0%) | $74,643 |
| Female | 238 (47.0%) | $42,241 |
| Total | 506 (100.0%) | $57,188 |
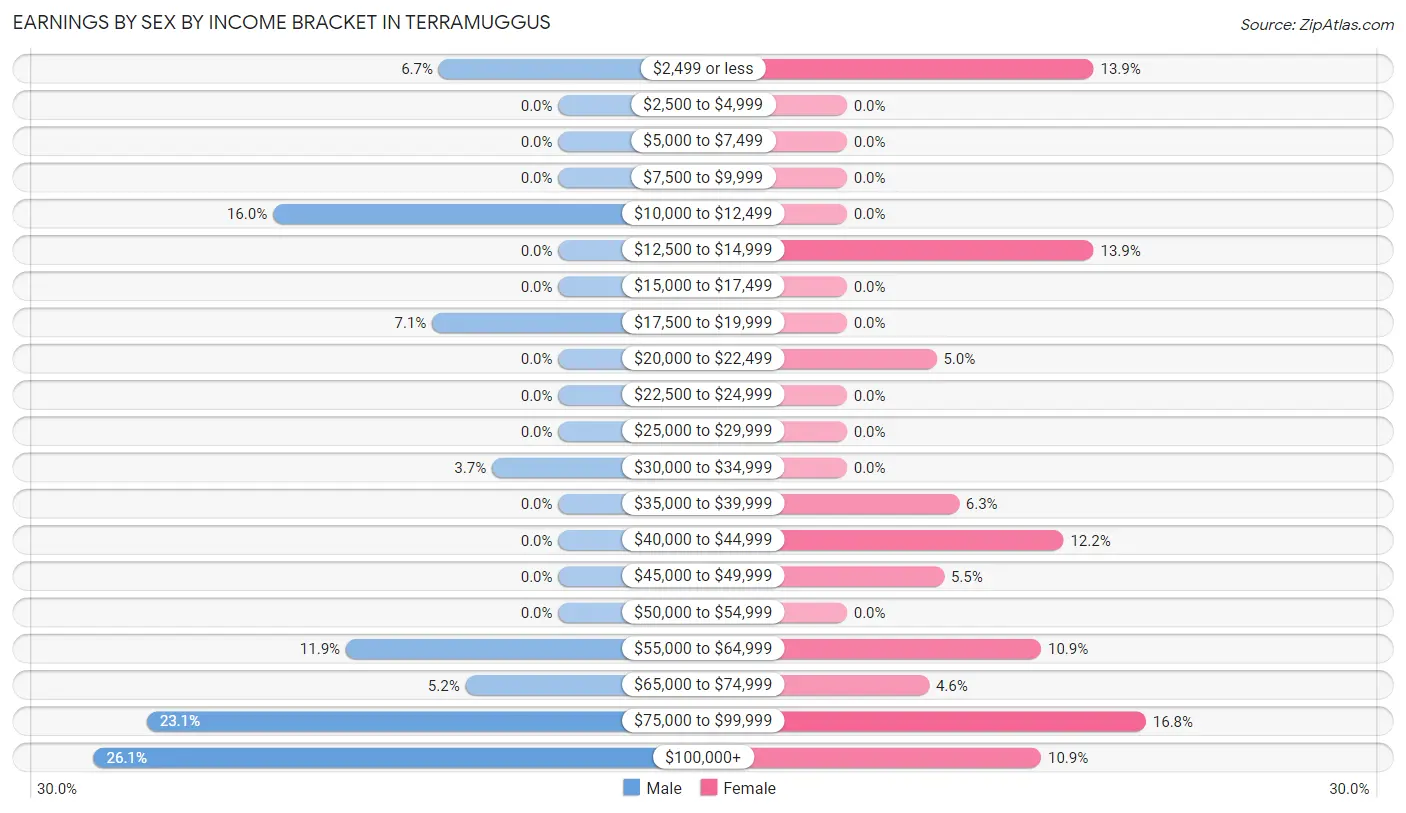
Earnings by Sex by Income Bracket in Terramuggus
The most common earnings brackets in Terramuggus are $100,000+ for men (70 | 26.1%) and $75,000 to $99,999 for women (40 | 16.8%).
| Income | Male | Female |
| $2,499 or less | 18 (6.7%) | 33 (13.9%) |
| $2,500 to $4,999 | 0 (0.0%) | 0 (0.0%) |
| $5,000 to $7,499 | 0 (0.0%) | 0 (0.0%) |
| $7,500 to $9,999 | 0 (0.0%) | 0 (0.0%) |
| $10,000 to $12,499 | 43 (16.0%) | 0 (0.0%) |
| $12,500 to $14,999 | 0 (0.0%) | 33 (13.9%) |
| $15,000 to $17,499 | 0 (0.0%) | 0 (0.0%) |
| $17,500 to $19,999 | 19 (7.1%) | 0 (0.0%) |
| $20,000 to $22,499 | 0 (0.0%) | 12 (5.0%) |
| $22,500 to $24,999 | 0 (0.0%) | 0 (0.0%) |
| $25,000 to $29,999 | 0 (0.0%) | 0 (0.0%) |
| $30,000 to $34,999 | 10 (3.7%) | 0 (0.0%) |
| $35,000 to $39,999 | 0 (0.0%) | 15 (6.3%) |
| $40,000 to $44,999 | 0 (0.0%) | 29 (12.2%) |
| $45,000 to $49,999 | 0 (0.0%) | 13 (5.5%) |
| $50,000 to $54,999 | 0 (0.0%) | 0 (0.0%) |
| $55,000 to $64,999 | 32 (11.9%) | 26 (10.9%) |
| $65,000 to $74,999 | 14 (5.2%) | 11 (4.6%) |
| $75,000 to $99,999 | 62 (23.1%) | 40 (16.8%) |
| $100,000+ | 70 (26.1%) | 26 (10.9%) |
| Total | 268 (100.0%) | 238 (100.0%) |
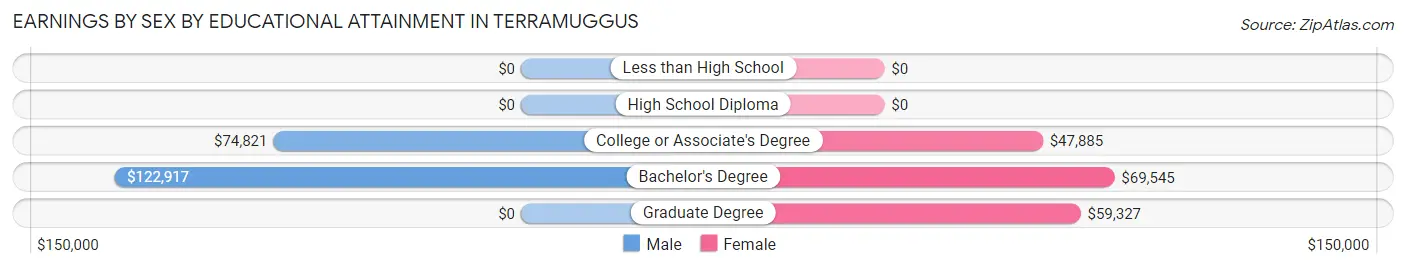
Earnings by Sex by Educational Attainment in Terramuggus
Average earnings in Terramuggus are $76,719 for men and $57,548 for women, a difference of 25.0%. Men with an educational attainment of bachelor's degree enjoy the highest average annual earnings of $122,917, while those with college or associate's degree education earn the least with $74,821. Women with an educational attainment of bachelor's degree earn the most with the average annual earnings of $69,545, while those with college or associate's degree education have the smallest earnings of $47,885.
| Educational Attainment | Male Income | Female Income |
| Less than High School | - | - |
| High School Diploma | - | - |
| College or Associate's Degree | $74,821 | $47,885 |
| Bachelor's Degree | $122,917 | $69,545 |
| Graduate Degree | - | - |
| Total | $76,719 | $57,548 |
Family Income in Terramuggus
Family Income Brackets in Terramuggus
According to the Terramuggus family income data, there are 80 families falling into the $100,000 to $149,999 income range, which is the most common income bracket and makes up 26.1% of all families.
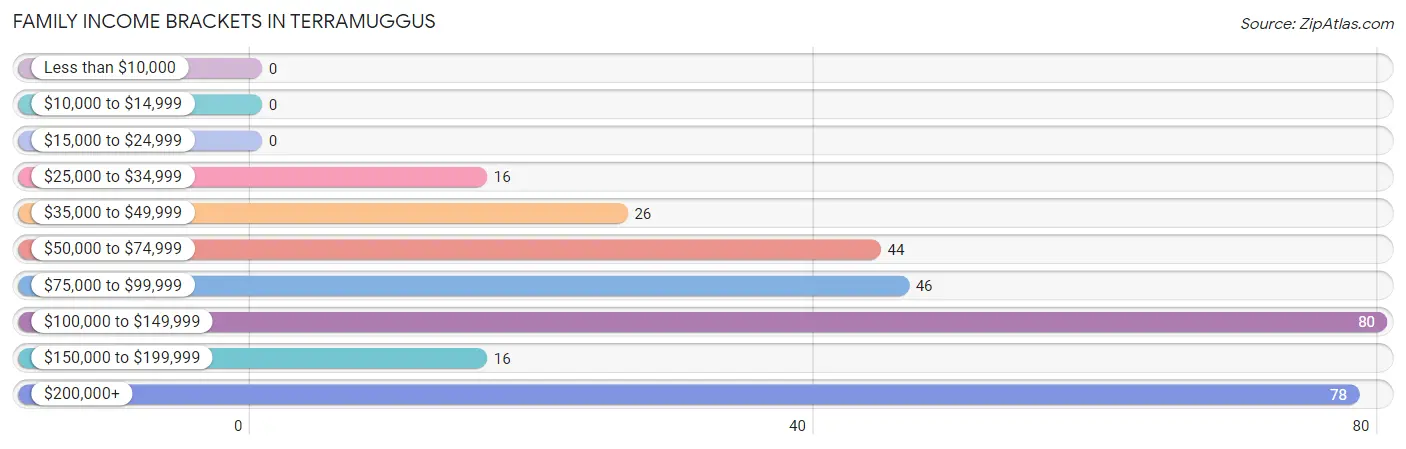
| Income Bracket | # Families | % Families |
| Less than $10,000 | 0 | 0.0% |
| $10,000 to $14,999 | 0 | 0.0% |
| $15,000 to $24,999 | 0 | 0.0% |
| $25,000 to $34,999 | 16 | 5.2% |
| $35,000 to $49,999 | 26 | 8.5% |
| $50,000 to $74,999 | 44 | 14.4% |
| $75,000 to $99,999 | 46 | 15.0% |
| $100,000 to $149,999 | 80 | 26.1% |
| $150,000 to $199,999 | 16 | 5.2% |
| $200,000+ | 78 | 25.5% |
Family Income by Famaliy Size in Terramuggus
2-person families (193 | 63.1%) account for the highest median family income in Terramuggus with $107,386 per family, while 2-person families (193 | 63.1%) have the highest median income of $53,693 per family member.
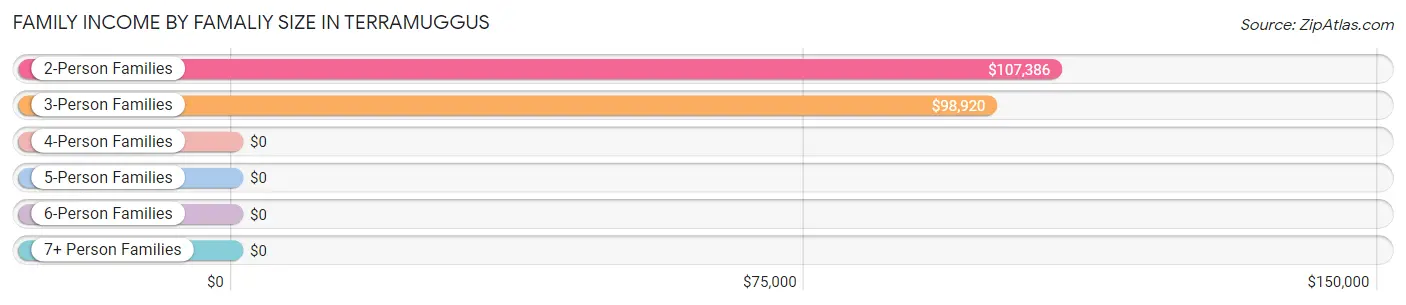
| Income Bracket | # Families | Median Income |
| 2-Person Families | 193 (63.1%) | $107,386 |
| 3-Person Families | 73 (23.9%) | $98,920 |
| 4-Person Families | 40 (13.1%) | $0 |
| 5-Person Families | 0 (0.0%) | $0 |
| 6-Person Families | 0 (0.0%) | $0 |
| 7+ Person Families | 0 (0.0%) | $0 |
| Total | 306 (100.0%) | $134,286 |
Family Income by Number of Earners in Terramuggus
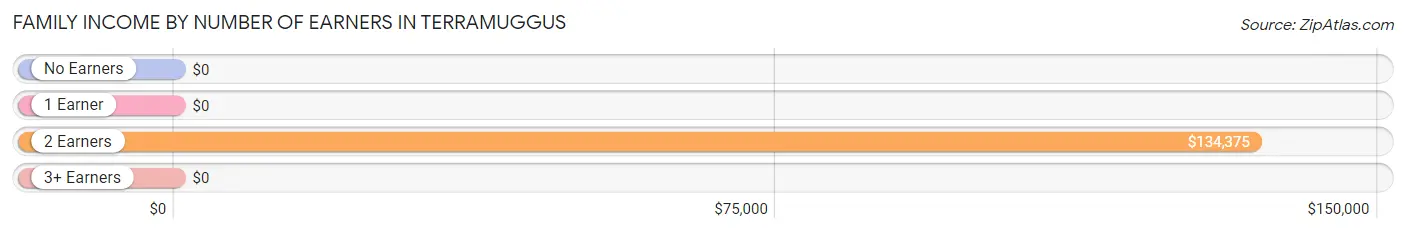
| Number of Earners | # Families | Median Income |
| No Earners | 69 (22.6%) | $0 |
| 1 Earner | 20 (6.5%) | $0 |
| 2 Earners | 201 (65.7%) | $134,375 |
| 3+ Earners | 16 (5.2%) | $0 |
| Total | 306 (100.0%) | $134,286 |
Household Income in Terramuggus
Household Income Brackets in Terramuggus
With 80 households falling in the category, the $100,000 to $149,999 income range is the most frequent in Terramuggus, accounting for 25.4% of all households.
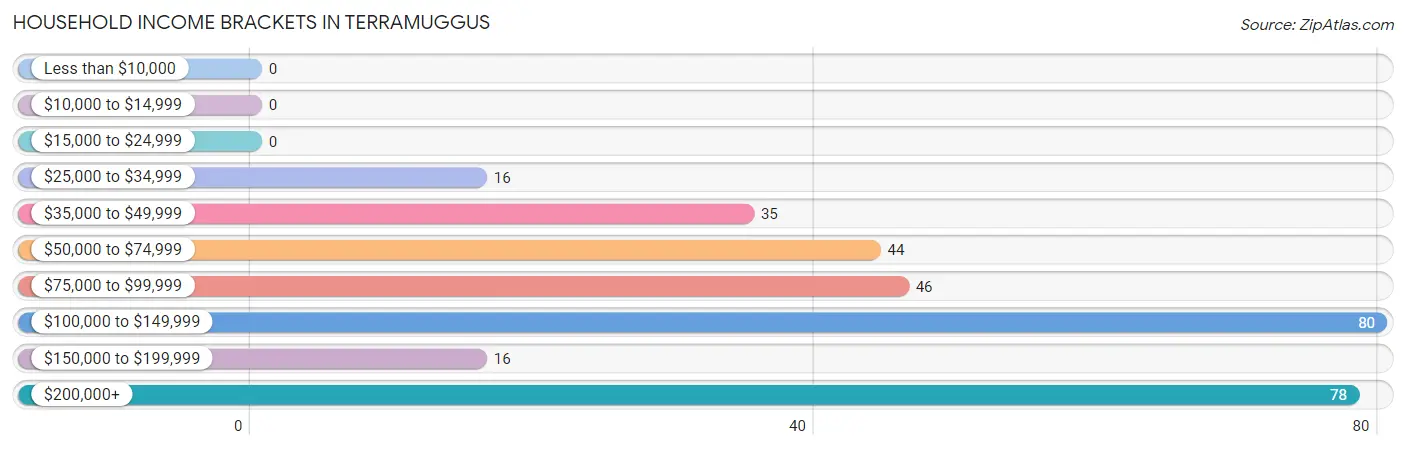
| Income Bracket | # Households | % Households |
| Less than $10,000 | 0 | 0.0% |
| $10,000 to $14,999 | 0 | 0.0% |
| $15,000 to $24,999 | 0 | 0.0% |
| $25,000 to $34,999 | 16 | 5.1% |
| $35,000 to $49,999 | 35 | 11.1% |
| $50,000 to $74,999 | 44 | 14.0% |
| $75,000 to $99,999 | 46 | 14.6% |
| $100,000 to $149,999 | 80 | 25.4% |
| $150,000 to $199,999 | 16 | 5.1% |
| $200,000+ | 78 | 24.8% |
Household Income by Householder Age in Terramuggus
The median household income in Terramuggus is $133,482, with the highest median household income of $147,829 found in the 25 to 44 years age bracket for the primary householder. A total of 81 households (25.7%) fall into this category.
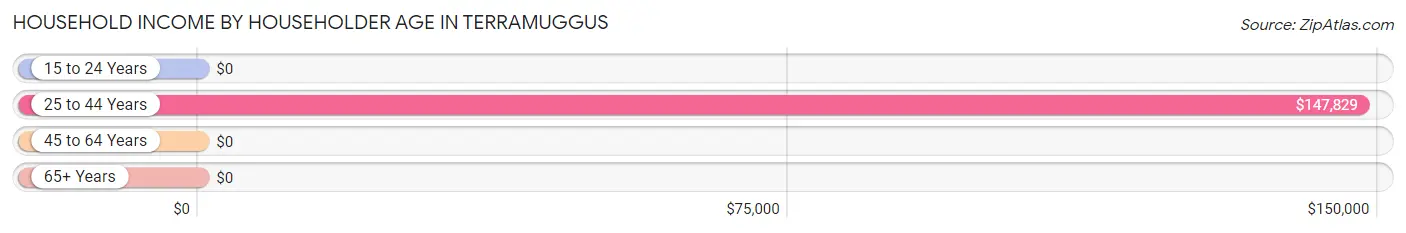
| Income Bracket | # Households | Median Income |
| 15 to 24 Years | 0 (0.0%) | $0 |
| 25 to 44 Years | 81 (25.7%) | $147,829 |
| 45 to 64 Years | 133 (42.2%) | $0 |
| 65+ Years | 101 (32.1%) | $0 |
| Total | 315 (100.0%) | $133,482 |
Poverty in Terramuggus
Income Below Poverty by Sex and Age in Terramuggus
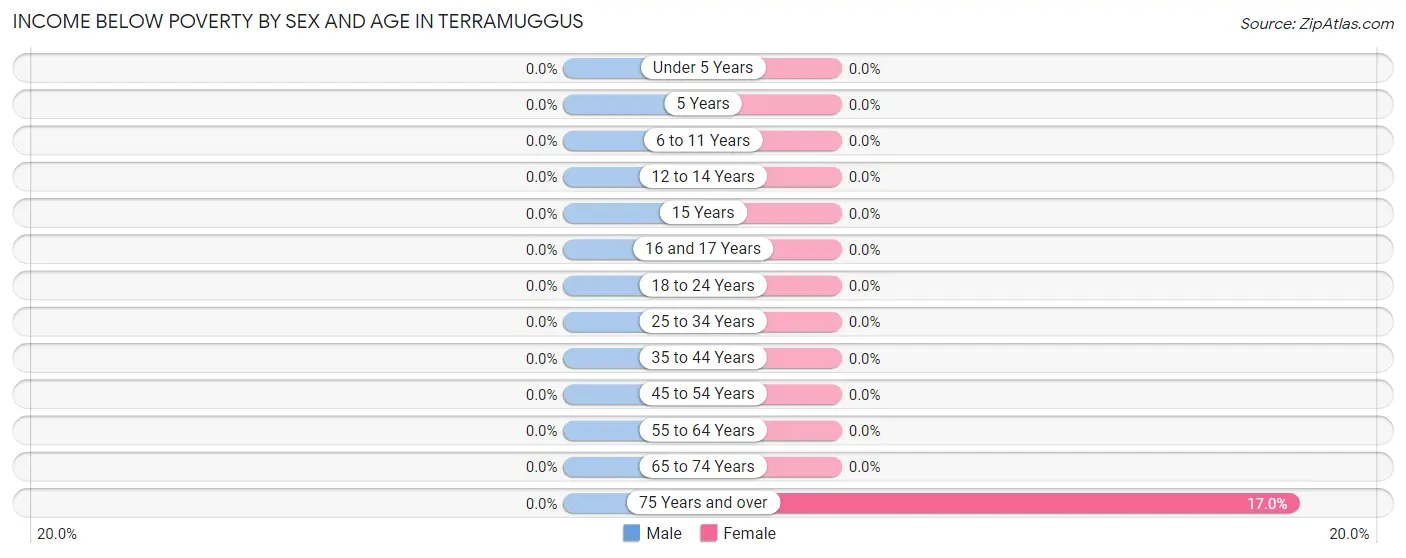
| Age Bracket | Male | Female |
| Under 5 Years | 0 (0.0%) | 0 (0.0%) |
| 5 Years | 0 (0.0%) | 0 (0.0%) |
| 6 to 11 Years | 0 (0.0%) | 0 (0.0%) |
| 12 to 14 Years | 0 (0.0%) | 0 (0.0%) |
| 15 Years | 0 (0.0%) | 0 (0.0%) |
| 16 and 17 Years | 0 (0.0%) | 0 (0.0%) |
| 18 to 24 Years | 0 (0.0%) | 0 (0.0%) |
| 25 to 34 Years | 0 (0.0%) | 0 (0.0%) |
| 35 to 44 Years | 0 (0.0%) | 0 (0.0%) |
| 45 to 54 Years | 0 (0.0%) | 0 (0.0%) |
| 55 to 64 Years | 0 (0.0%) | 0 (0.0%) |
| 65 to 74 Years | 0 (0.0%) | 0 (0.0%) |
| 75 Years and over | 0 (0.0%) | 9 (17.0%) |
| Total | 0 (0.0%) | 9 (2.1%) |
Income Above Poverty by Sex and Age in Terramuggus
According to the poverty statistics in Terramuggus, males aged 16 and 17 years and females aged under 5 years are the age groups that are most secure financially, with 100.0% of males and 100.0% of females in these age groups living above the poverty line.
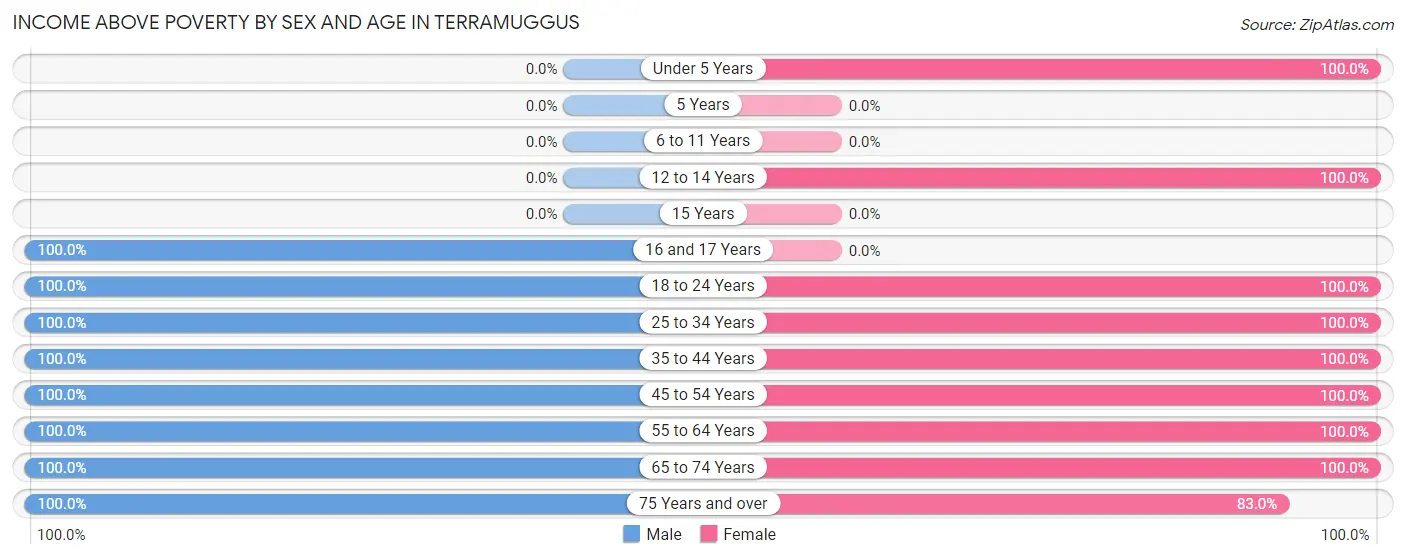
| Age Bracket | Male | Female |
| Under 5 Years | 0 (0.0%) | 38 (100.0%) |
| 5 Years | 0 (0.0%) | 0 (0.0%) |
| 6 to 11 Years | 0 (0.0%) | 0 (0.0%) |
| 12 to 14 Years | 0 (0.0%) | 36 (100.0%) |
| 15 Years | 0 (0.0%) | 0 (0.0%) |
| 16 and 17 Years | 18 (100.0%) | 0 (0.0%) |
| 18 to 24 Years | 19 (100.0%) | 33 (100.0%) |
| 25 to 34 Years | 31 (100.0%) | 26 (100.0%) |
| 35 to 44 Years | 77 (100.0%) | 43 (100.0%) |
| 45 to 54 Years | 22 (100.0%) | 70 (100.0%) |
| 55 to 64 Years | 98 (100.0%) | 62 (100.0%) |
| 65 to 74 Years | 36 (100.0%) | 60 (100.0%) |
| 75 Years and over | 56 (100.0%) | 44 (83.0%) |
| Total | 357 (100.0%) | 412 (97.9%) |
Income Below Poverty Among Married-Couple Families in Terramuggus
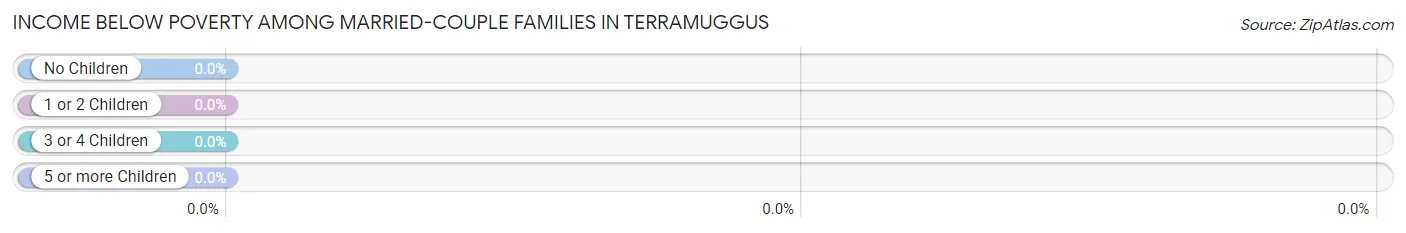
| Children | Above Poverty | Below Poverty |
| No Children | 229 (100.0%) | 0 (0.0%) |
| 1 or 2 Children | 43 (100.0%) | 0 (0.0%) |
| 3 or 4 Children | 0 (0.0%) | 0 (0.0%) |
| 5 or more Children | 0 (0.0%) | 0 (0.0%) |
| Total | 272 (100.0%) | 0 (0.0%) |
Income Below Poverty Among Single-Parent Households in Terramuggus
| Children | Single Father | Single Mother |
| No Children | 0 (0.0%) | 0 (0.0%) |
| 1 or 2 Children | 0 (0.0%) | 0 (0.0%) |
| 3 or 4 Children | 0 (0.0%) | 0 (0.0%) |
| 5 or more Children | 0 (0.0%) | 0 (0.0%) |
| Total | 0 (0.0%) | 0 (0.0%) |
Income Below Poverty Among Married-Couple vs Single-Parent Households in Terramuggus
| Children | Married-Couple Families | Single-Parent Households |
| No Children | 0 (0.0%) | 0 (0.0%) |
| 1 or 2 Children | 0 (0.0%) | 0 (0.0%) |
| 3 or 4 Children | 0 (0.0%) | 0 (0.0%) |
| 5 or more Children | 0 (0.0%) | 0 (0.0%) |
| Total | 0 (0.0%) | 0 (0.0%) |
Race in Terramuggus
The most populous races in Terramuggus are White / Caucasian (753 | 96.8%), Black / African American (13 | 1.7%), and Asian (12 | 1.5%).
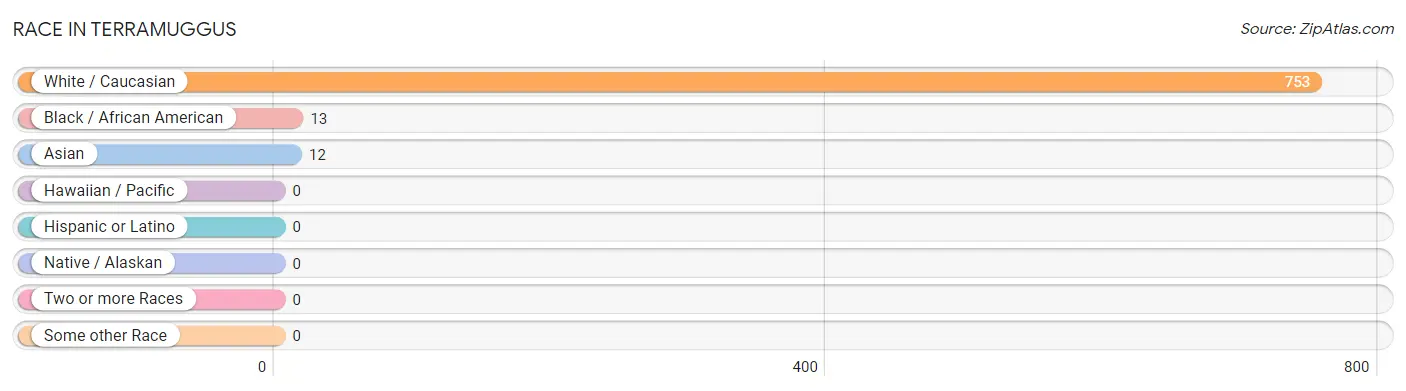
| Race | # Population | % Population |
| Asian | 12 | 1.5% |
| Black / African American | 13 | 1.7% |
| Hawaiian / Pacific | 0 | 0.0% |
| Hispanic or Latino | 0 | 0.0% |
| Native / Alaskan | 0 | 0.0% |
| White / Caucasian | 753 | 96.8% |
| Two or more Races | 0 | 0.0% |
| Some other Race | 0 | 0.0% |
| Total | 778 | 100.0% |
Ancestry in Terramuggus
The most populous ancestries reported in Terramuggus are French (123 | 15.8%), Italian (108 | 13.9%), Irish (102 | 13.1%), English (88 | 11.3%), and Scandinavian (82 | 10.5%), together accounting for 64.7% of all Terramuggus residents.
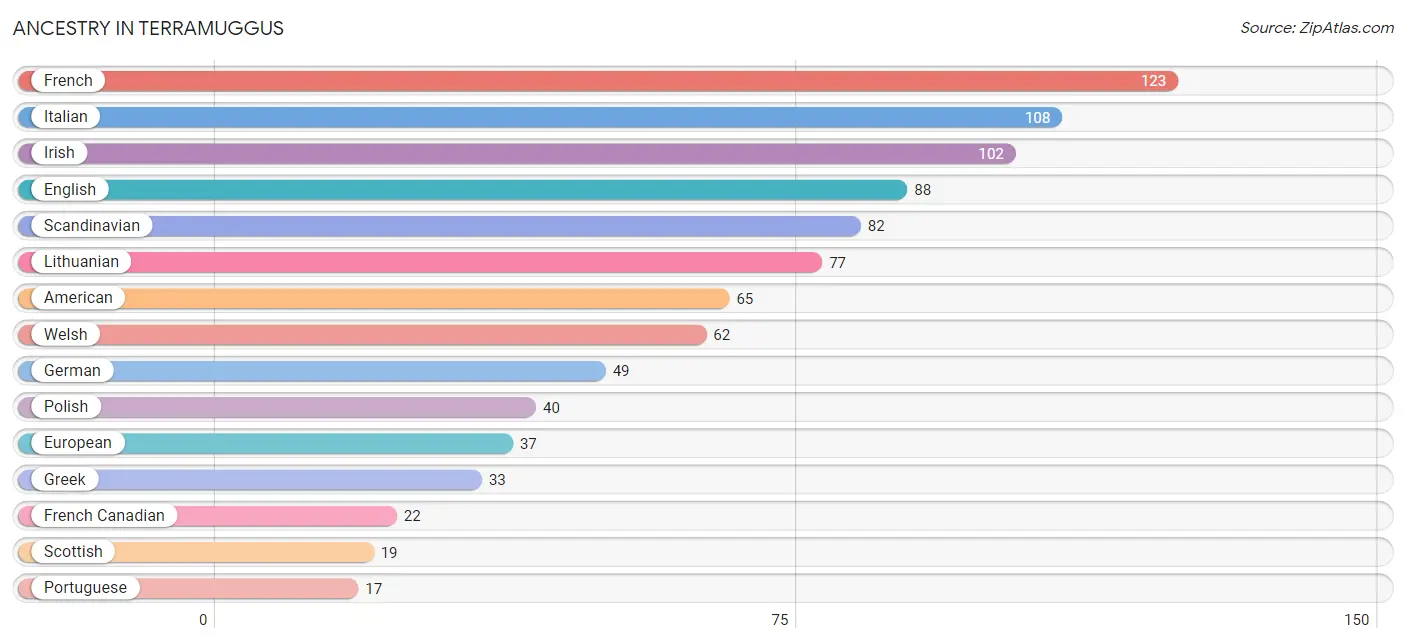
| Ancestry | # Population | % Population |
| American | 65 | 8.4% |
| English | 88 | 11.3% |
| European | 37 | 4.8% |
| French | 123 | 15.8% |
| French Canadian | 22 | 2.8% |
| German | 49 | 6.3% |
| Greek | 33 | 4.2% |
| Indian (Asian) | 12 | 1.5% |
| Irish | 102 | 13.1% |
| Italian | 108 | 13.9% |
| Lithuanian | 77 | 9.9% |
| Polish | 40 | 5.1% |
| Portuguese | 17 | 2.2% |
| Scandinavian | 82 | 10.5% |
| Scottish | 19 | 2.4% |
| Swedish | 12 | 1.5% |
| Welsh | 62 | 8.0% | View All 17 Rows |
Immigrants in Terramuggus
The most numerous immigrant groups reported in Terramuggus came from Canada (22 | 2.8%), Asia (12 | 1.5%), China (12 | 1.5%), and Eastern Asia (12 | 1.5%), together accounting for 7.4% of all Terramuggus residents.
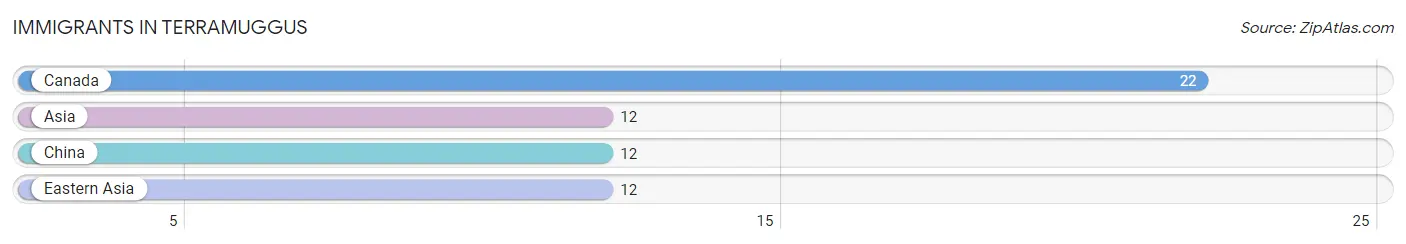
| Immigration Origin | # Population | % Population |
| Asia | 12 | 1.5% |
| Canada | 22 | 2.8% |
| China | 12 | 1.5% |
| Eastern Asia | 12 | 1.5% | View All 4 Rows |
Sex and Age in Terramuggus
Sex and Age in Terramuggus
The most populous age groups in Terramuggus are 60 to 64 Years (88 | 24.6%) for men and 50 to 54 Years (45 | 10.7%) for women.
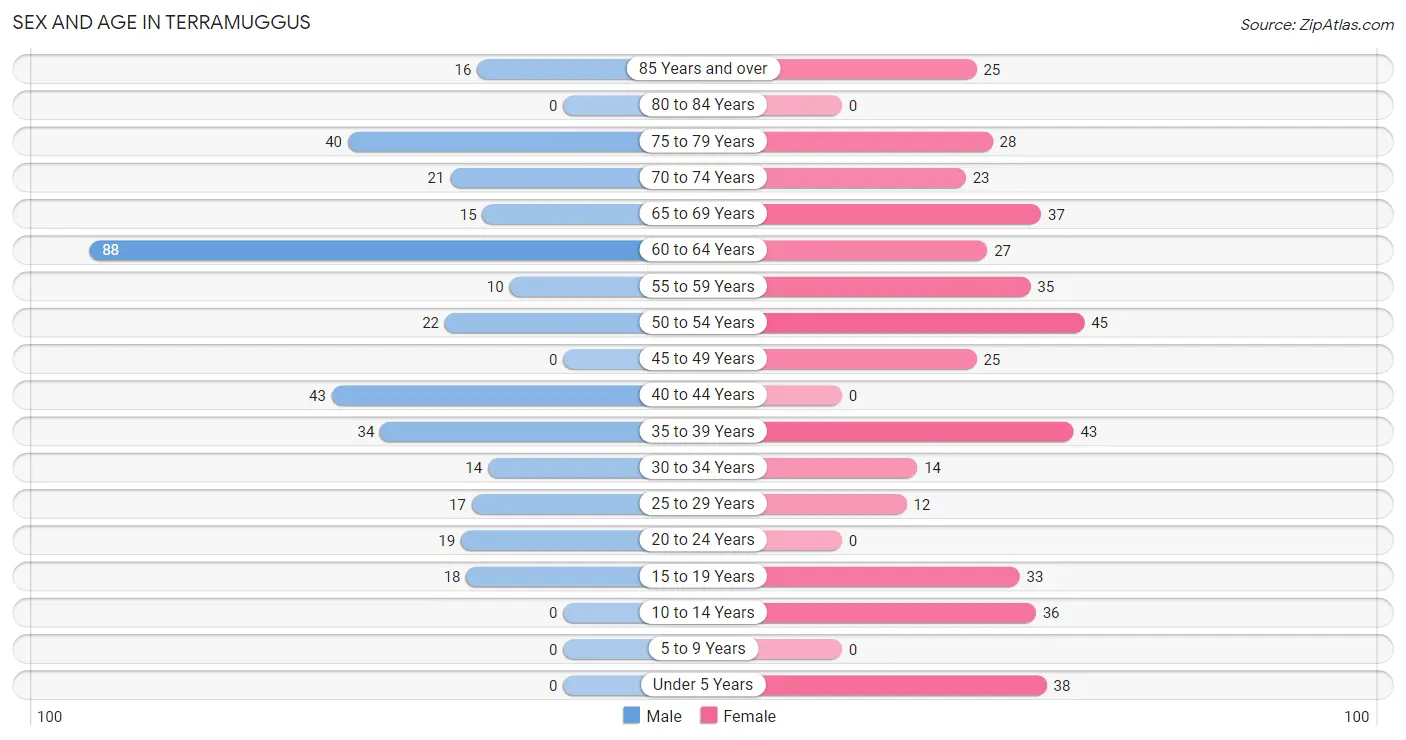
| Age Bracket | Male | Female |
| Under 5 Years | 0 (0.0%) | 38 (9.0%) |
| 5 to 9 Years | 0 (0.0%) | 0 (0.0%) |
| 10 to 14 Years | 0 (0.0%) | 36 (8.6%) |
| 15 to 19 Years | 18 (5.0%) | 33 (7.8%) |
| 20 to 24 Years | 19 (5.3%) | 0 (0.0%) |
| 25 to 29 Years | 17 (4.8%) | 12 (2.9%) |
| 30 to 34 Years | 14 (3.9%) | 14 (3.3%) |
| 35 to 39 Years | 34 (9.5%) | 43 (10.2%) |
| 40 to 44 Years | 43 (12.0%) | 0 (0.0%) |
| 45 to 49 Years | 0 (0.0%) | 25 (5.9%) |
| 50 to 54 Years | 22 (6.2%) | 45 (10.7%) |
| 55 to 59 Years | 10 (2.8%) | 35 (8.3%) |
| 60 to 64 Years | 88 (24.6%) | 27 (6.4%) |
| 65 to 69 Years | 15 (4.2%) | 37 (8.8%) |
| 70 to 74 Years | 21 (5.9%) | 23 (5.5%) |
| 75 to 79 Years | 40 (11.2%) | 28 (6.7%) |
| 80 to 84 Years | 0 (0.0%) | 0 (0.0%) |
| 85 Years and over | 16 (4.5%) | 25 (5.9%) |
| Total | 357 (100.0%) | 421 (100.0%) |
Families and Households in Terramuggus
Median Family Size in Terramuggus
The median family size in Terramuggus is 2.47 persons per family, with single male/father families (22 | 7.2%) accounting for the largest median family size of 2.64 persons per family. On the other hand, single female/mother families (12 | 3.9%) represent the smallest median family size with 2.00 persons per family.
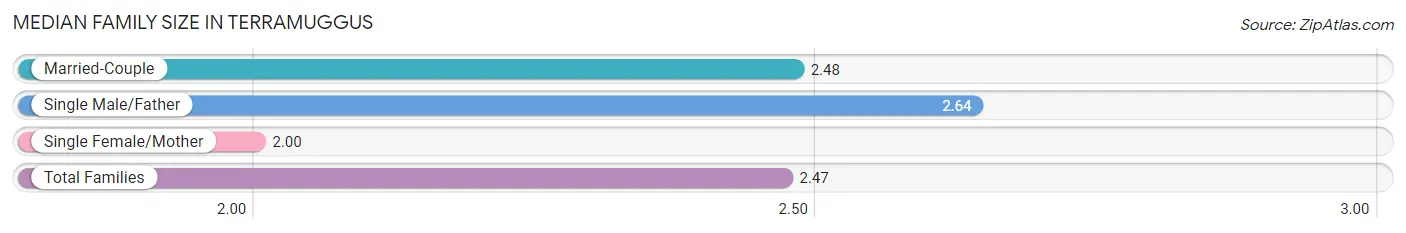
| Family Type | # Families | Family Size |
| Married-Couple | 272 (88.9%) | 2.48 |
| Single Male/Father | 22 (7.2%) | 2.64 |
| Single Female/Mother | 12 (3.9%) | 2.00 |
| Total Families | 306 (100.0%) | 2.47 |
Median Household Size in Terramuggus
The median household size in Terramuggus is 2.47 persons per household, with single male/father households (22 | 7.0%) accounting for the largest median household size of 2.64 persons per household. single female/mother households (12 | 3.8%) represent the smallest median household size with 2.00 persons per household.
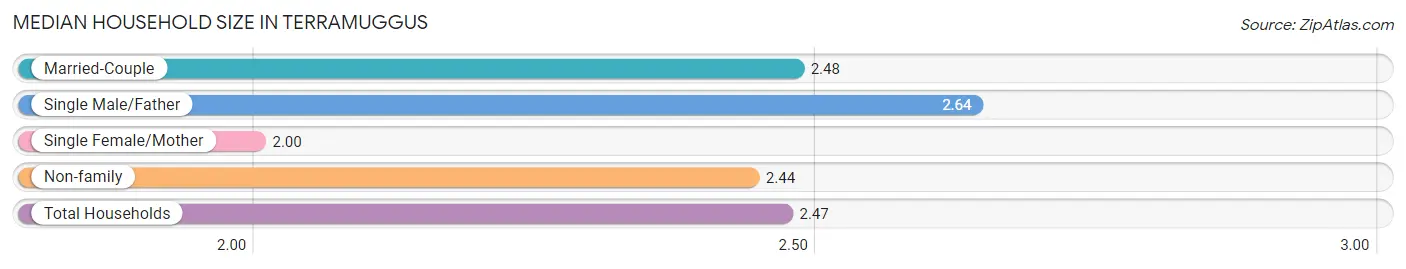
| Household Type | # Households | Household Size |
| Married-Couple | 272 (86.4%) | 2.48 |
| Single Male/Father | 22 (7.0%) | 2.64 |
| Single Female/Mother | 12 (3.8%) | 2.00 |
| Non-family | 9 (2.9%) | 2.44 |
| Total Households | 315 (100.0%) | 2.47 |
Household Size by Marriage Status in Terramuggus
Out of a total of 315 households in Terramuggus, 306 (97.1%) are family households, while 9 (2.9%) are nonfamily households. The most numerous type of family households are 2-person households, comprising 193, and the most common type of nonfamily households are 2-person households, comprising 9.
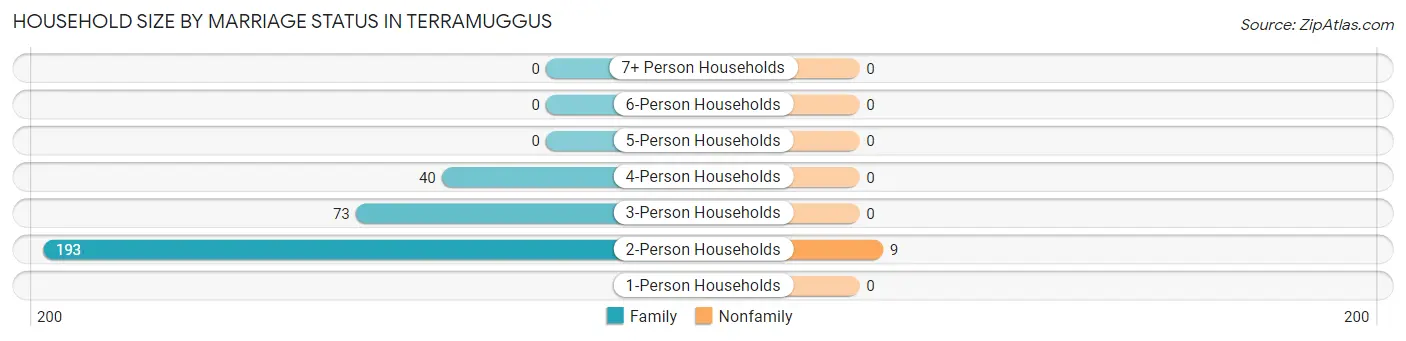
| Household Size | Family Households | Nonfamily Households |
| 1-Person Households | - | 0 (0.0%) |
| 2-Person Households | 193 (61.3%) | 9 (2.9%) |
| 3-Person Households | 73 (23.2%) | 0 (0.0%) |
| 4-Person Households | 40 (12.7%) | 0 (0.0%) |
| 5-Person Households | 0 (0.0%) | 0 (0.0%) |
| 6-Person Households | 0 (0.0%) | 0 (0.0%) |
| 7+ Person Households | 0 (0.0%) | 0 (0.0%) |
| Total | 306 (97.1%) | 9 (2.9%) |
Female Fertility in Terramuggus
Fertility by Age in Terramuggus
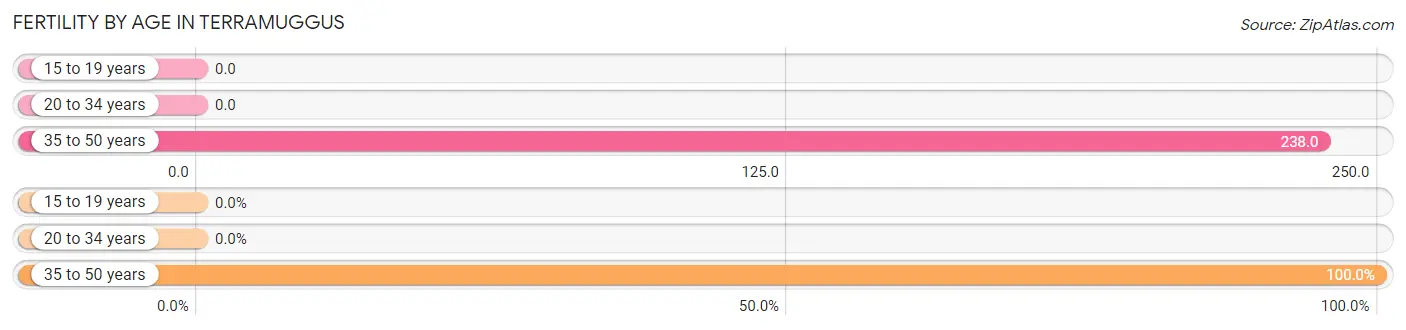
Average fertility rate in Terramuggus is 150.0 births per 1,000 women. Women in the age bracket of 35 to 50 years have the highest fertility rate with 238.0 births per 1,000 women. Women in the age bracket of 35 to 50 years acount for 100.0% of all women with births.
| Age Bracket | Women with Births | Births / 1,000 Women |
| 15 to 19 years | 0 (0.0%) | 0.0 |
| 20 to 34 years | 0 (0.0%) | 0.0 |
| 35 to 50 years | 24 (100.0%) | 238.0 |
| Total | 24 (100.0%) | 150.0 |
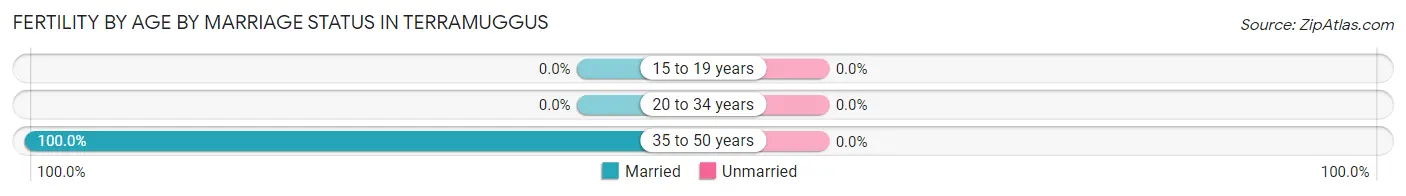
Fertility by Age by Marriage Status in Terramuggus
| Age Bracket | Married | Unmarried |
| 15 to 19 years | 0 (0.0%) | 0 (0.0%) |
| 20 to 34 years | 0 (0.0%) | 0 (0.0%) |
| 35 to 50 years | 24 (100.0%) | 0 (0.0%) |
| Total | 24 (100.0%) | 0 (0.0%) |
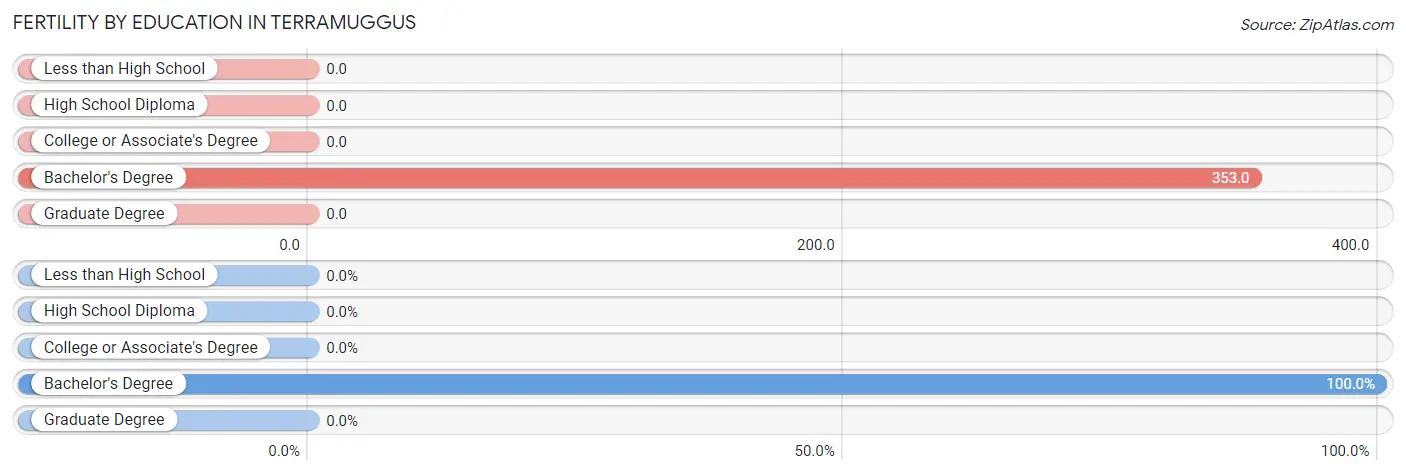
Fertility by Education in Terramuggus
| Educational Attainment | Women with Births | Births / 1,000 Women |
| Less than High School | 0 (0.0%) | 0.0 |
| High School Diploma | 0 (0.0%) | 0.0 |
| College or Associate's Degree | 0 (0.0%) | 0.0 |
| Bachelor's Degree | 24 (100.0%) | 353.0 |
| Graduate Degree | 0 (0.0%) | 0.0 |
| Total | 24 (100.0%) | 150.0 |
Fertility by Education by Marriage Status in Terramuggus
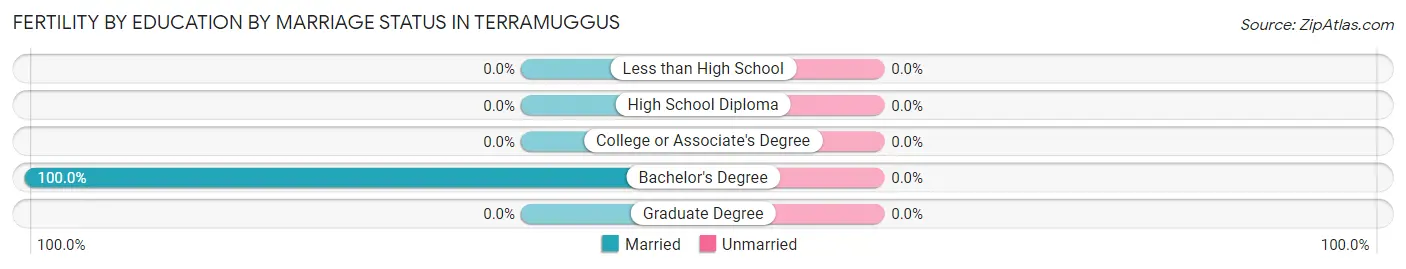
| Educational Attainment | Married | Unmarried |
| Less than High School | 0 (0.0%) | 0 (0.0%) |
| High School Diploma | 0 (0.0%) | 0 (0.0%) |
| College or Associate's Degree | 0 (0.0%) | 0 (0.0%) |
| Bachelor's Degree | 24 (100.0%) | 0 (0.0%) |
| Graduate Degree | 0 (0.0%) | 0 (0.0%) |
| Total | 24 (100.0%) | 0 (0.0%) |
Employment Characteristics in Terramuggus
Employment by Class of Employer in Terramuggus
Among the 404 employed individuals in Terramuggus, private company employees (258 | 63.9%), unpaid family workers (65 | 16.1%), and not-for-profit organizations (36 | 8.9%) make up the most common classes of employment.
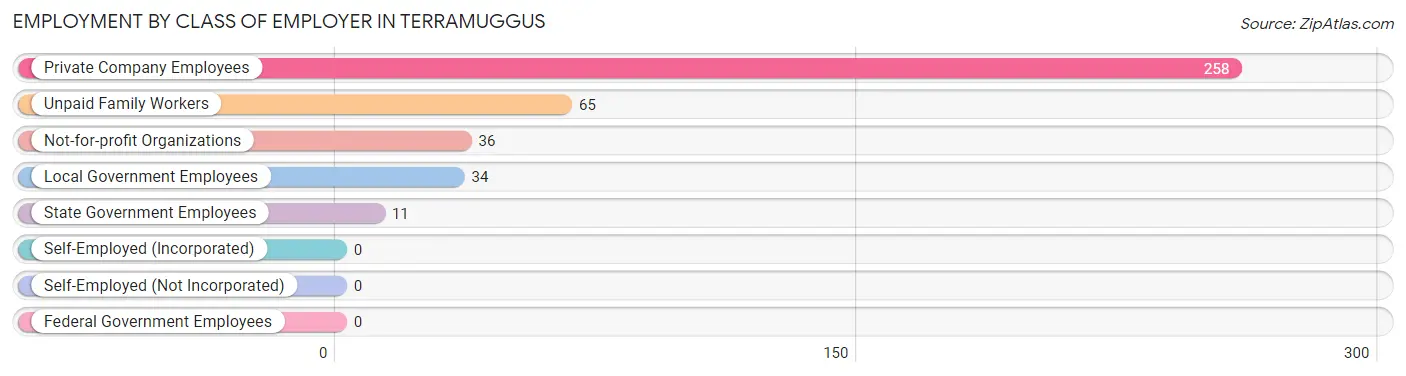
| Employer Class | # Employees | % Employees |
| Private Company Employees | 258 | 63.9% |
| Self-Employed (Incorporated) | 0 | 0.0% |
| Self-Employed (Not Incorporated) | 0 | 0.0% |
| Not-for-profit Organizations | 36 | 8.9% |
| Local Government Employees | 34 | 8.4% |
| State Government Employees | 11 | 2.7% |
| Federal Government Employees | 0 | 0.0% |
| Unpaid Family Workers | 65 | 16.1% |
| Total | 404 | 100.0% |
Employment Status by Age in Terramuggus
According to the labor force statistics for Terramuggus, out of the total population over 16 years of age (704), 65.1% or 458 individuals are in the labor force, with 4.1% or 19 of them unemployed. The age group with the highest labor force participation rate is 20 to 24 years, with 100.0% or 19 individuals in the labor force. Within the labor force, the 35 to 44 years age range has the highest percentage of unemployed individuals, with 15.8% or 19 of them being unemployed.
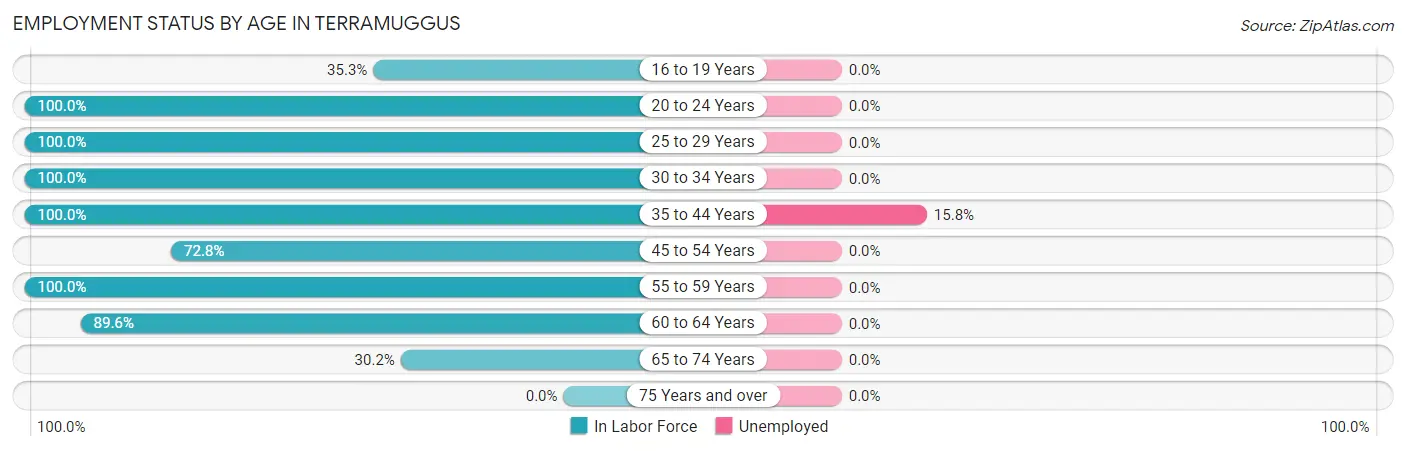
| Age Bracket | In Labor Force | Unemployed |
| 16 to 19 Years | 18 (35.3%) | 0 (0.0%) |
| 20 to 24 Years | 19 (100.0%) | 0 (0.0%) |
| 25 to 29 Years | 29 (100.0%) | 0 (0.0%) |
| 30 to 34 Years | 28 (100.0%) | 0 (0.0%) |
| 35 to 44 Years | 120 (100.0%) | 19 (15.8%) |
| 45 to 54 Years | 67 (72.8%) | 0 (0.0%) |
| 55 to 59 Years | 45 (100.0%) | 0 (0.0%) |
| 60 to 64 Years | 103 (89.6%) | 0 (0.0%) |
| 65 to 74 Years | 29 (30.2%) | 0 (0.0%) |
| 75 Years and over | 0 (0.0%) | 0 (0.0%) |
| Total | 458 (65.1%) | 19 (4.1%) |
Employment Status by Educational Attainment in Terramuggus
According to labor force statistics for Terramuggus, 91.4% of individuals (392) out of the total population between 25 and 64 years of age (429) are in the labor force, with 4.8% or 19 of them being unemployed. The group with the highest labor force participation rate are those with the educational attainment of college / associate degree, with 100.0% or 102 individuals in the labor force. Within the labor force, individuals with bachelor's degree or higher education have the highest percentage of unemployment, with 8.8% or 19 of them being unemployed.
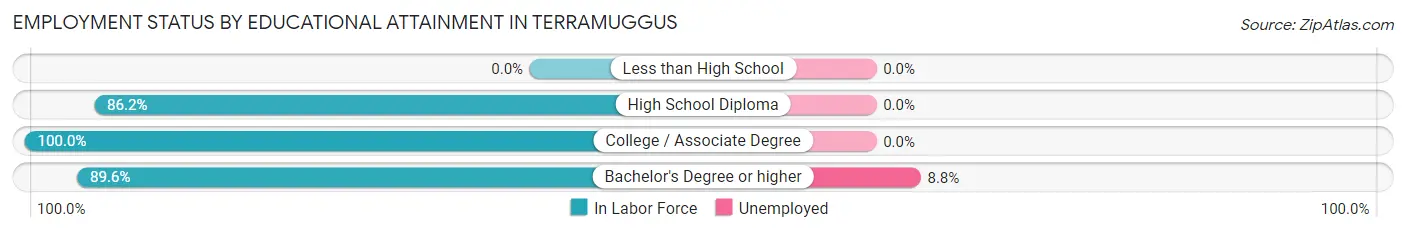
| Educational Attainment | In Labor Force | Unemployed |
| Less than High School | 0 (0.0%) | 0 (0.0%) |
| High School Diploma | 75 (86.2%) | 0 (0.0%) |
| College / Associate Degree | 102 (100.0%) | 0 (0.0%) |
| Bachelor's Degree or higher | 215 (89.6%) | 21 (8.8%) |
| Total | 392 (91.4%) | 21 (4.8%) |
Employment Occupations by Sex in Terramuggus
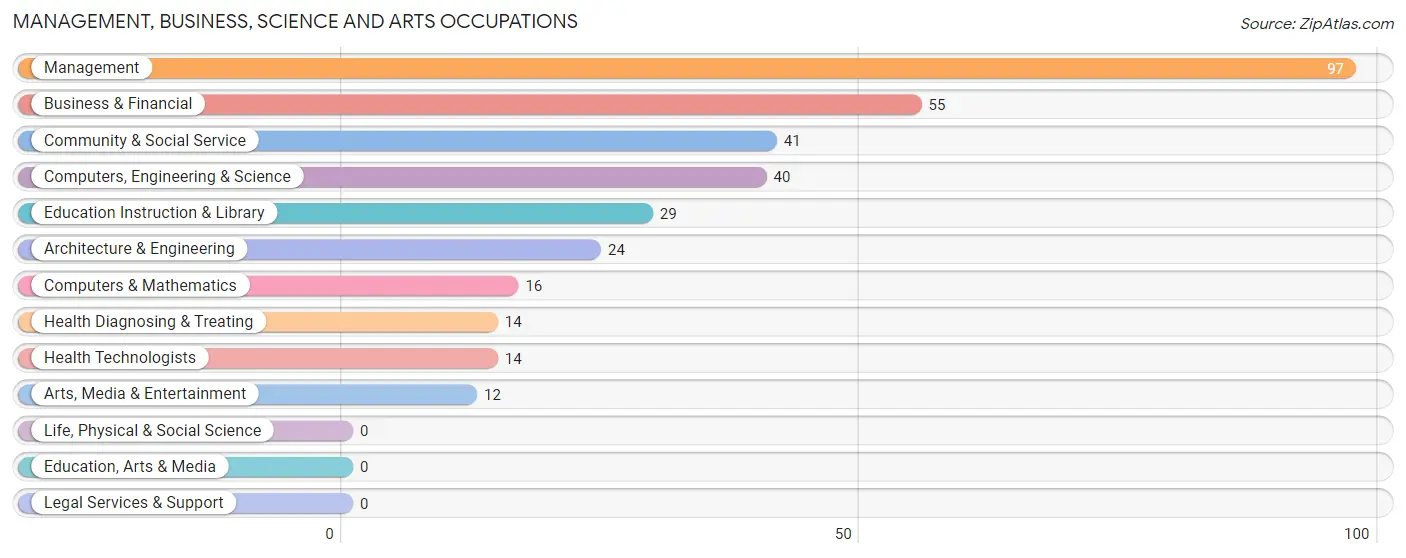
Management, Business, Science and Arts Occupations
The most common Management, Business, Science and Arts occupations in Terramuggus are Management (97 | 22.1%), Business & Financial (55 | 12.5%), Community & Social Service (41 | 9.3%), Computers, Engineering & Science (40 | 9.1%), and Education Instruction & Library (29 | 6.6%).
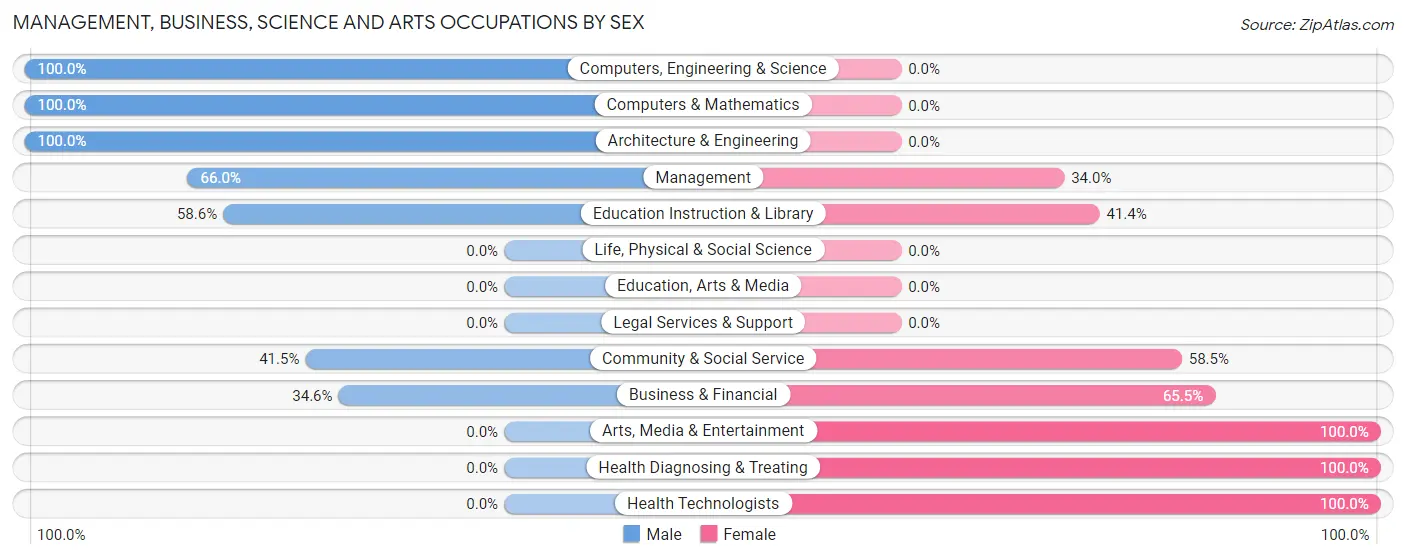
Management, Business, Science and Arts Occupations by Sex
Within the Management, Business, Science and Arts occupations in Terramuggus, the most male-oriented occupations are Computers, Engineering & Science (100.0%), Computers & Mathematics (100.0%), and Architecture & Engineering (100.0%), while the most female-oriented occupations are Arts, Media & Entertainment (100.0%), Health Diagnosing & Treating (100.0%), and Health Technologists (100.0%).
| Occupation | Male | Female |
| Management | 64 (66.0%) | 33 (34.0%) |
| Business & Financial | 19 (34.5%) | 36 (65.4%) |
| Computers, Engineering & Science | 40 (100.0%) | 0 (0.0%) |
| Computers & Mathematics | 16 (100.0%) | 0 (0.0%) |
| Architecture & Engineering | 24 (100.0%) | 0 (0.0%) |
| Life, Physical & Social Science | 0 (0.0%) | 0 (0.0%) |
| Community & Social Service | 17 (41.5%) | 24 (58.5%) |
| Education, Arts & Media | 0 (0.0%) | 0 (0.0%) |
| Legal Services & Support | 0 (0.0%) | 0 (0.0%) |
| Education Instruction & Library | 17 (58.6%) | 12 (41.4%) |
| Arts, Media & Entertainment | 0 (0.0%) | 12 (100.0%) |
| Health Diagnosing & Treating | 0 (0.0%) | 14 (100.0%) |
| Health Technologists | 0 (0.0%) | 14 (100.0%) |
| Total (Category) | 140 (56.7%) | 107 (43.3%) |
| Total (Overall) | 253 (57.6%) | 186 (42.4%) |
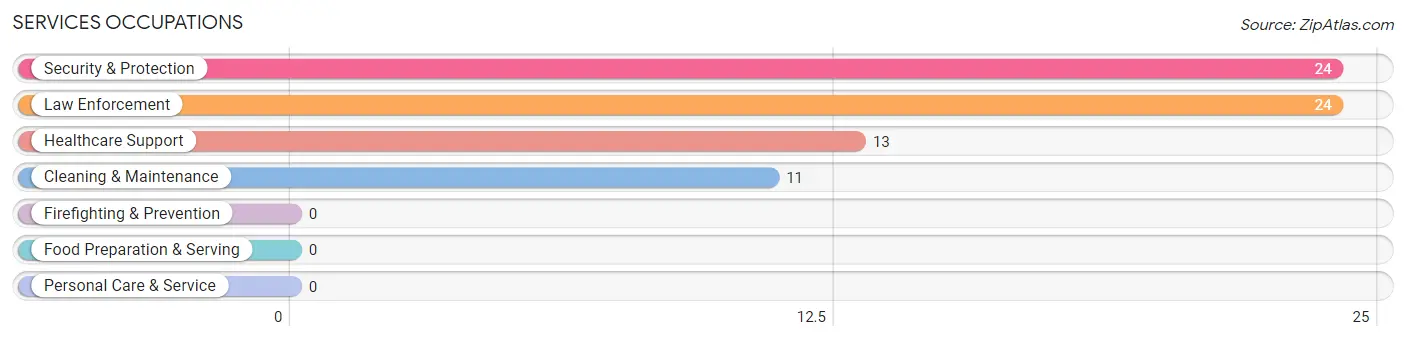
Services Occupations
The most common Services occupations in Terramuggus are Security & Protection (24 | 5.5%), Law Enforcement (24 | 5.5%), Healthcare Support (13 | 3.0%), and Cleaning & Maintenance (11 | 2.5%).
Services Occupations by Sex
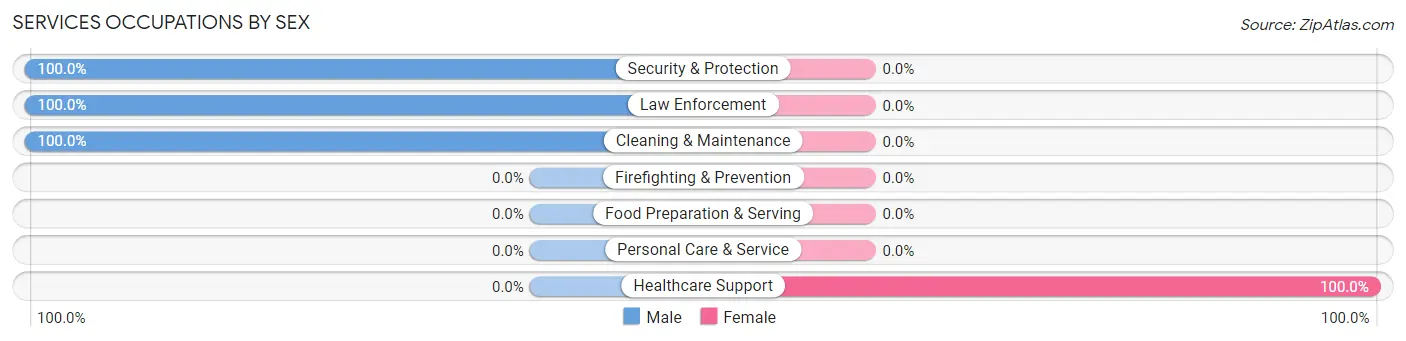
| Occupation | Male | Female |
| Healthcare Support | 0 (0.0%) | 13 (100.0%) |
| Security & Protection | 24 (100.0%) | 0 (0.0%) |
| Firefighting & Prevention | 0 (0.0%) | 0 (0.0%) |
| Law Enforcement | 24 (100.0%) | 0 (0.0%) |
| Food Preparation & Serving | 0 (0.0%) | 0 (0.0%) |
| Cleaning & Maintenance | 11 (100.0%) | 0 (0.0%) |
| Personal Care & Service | 0 (0.0%) | 0 (0.0%) |
| Total (Category) | 35 (72.9%) | 13 (27.1%) |
| Total (Overall) | 253 (57.6%) | 186 (42.4%) |
Sales and Office Occupations
The most common Sales and Office occupations in Terramuggus are Office & Administration (66 | 15.0%), and Sales & Related (64 | 14.6%).
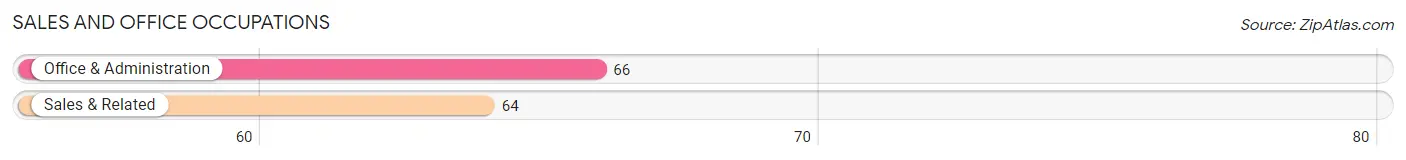
Sales and Office Occupations by Sex

| Occupation | Male | Female |
| Sales & Related | 64 (100.0%) | 0 (0.0%) |
| Office & Administration | 0 (0.0%) | 66 (100.0%) |
| Total (Category) | 64 (49.2%) | 66 (50.8%) |
| Total (Overall) | 253 (57.6%) | 186 (42.4%) |
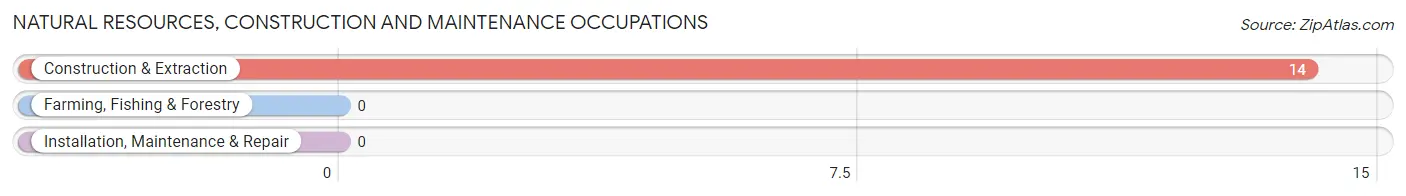
Natural Resources, Construction and Maintenance Occupations
The most common Natural Resources, Construction and Maintenance occupations in Terramuggus are , and Construction & Extraction (14 | 3.2%).
Natural Resources, Construction and Maintenance Occupations by Sex
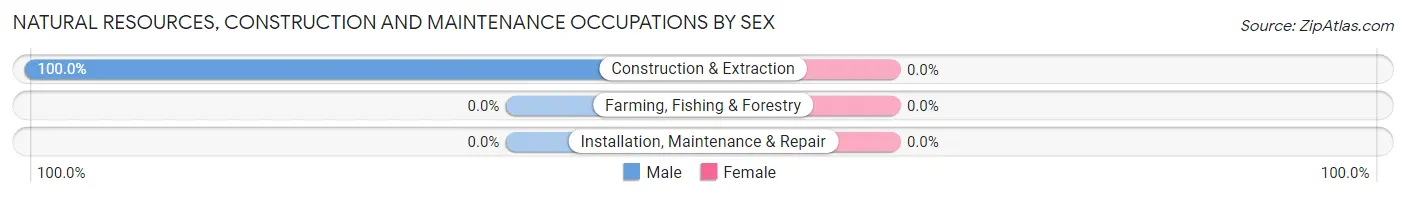
| Occupation | Male | Female |
| Farming, Fishing & Forestry | 0 (0.0%) | 0 (0.0%) |
| Construction & Extraction | 14 (100.0%) | 0 (0.0%) |
| Installation, Maintenance & Repair | 0 (0.0%) | 0 (0.0%) |
| Total (Category) | 14 (100.0%) | 0 (0.0%) |
| Total (Overall) | 253 (57.6%) | 186 (42.4%) |
Production, Transportation and Moving Occupations
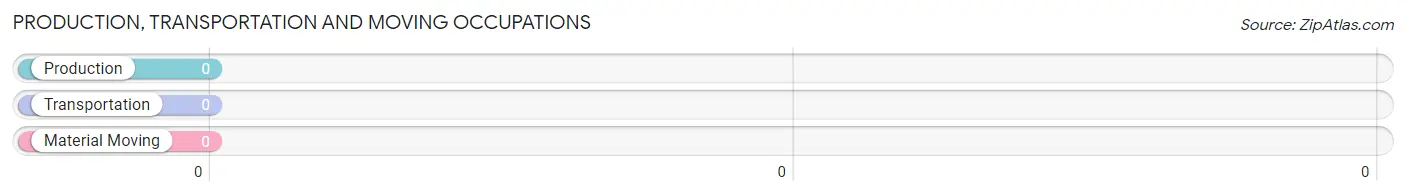
Production, Transportation and Moving Occupations by Sex
| Occupation | Male | Female |
| Production | 0 (0.0%) | 0 (0.0%) |
| Transportation | 0 (0.0%) | 0 (0.0%) |
| Material Moving | 0 (0.0%) | 0 (0.0%) |
| Total (Category) | 0 (0.0%) | 0 (0.0%) |
| Total (Overall) | 253 (57.6%) | 186 (42.4%) |
Employment Industries by Sex in Terramuggus
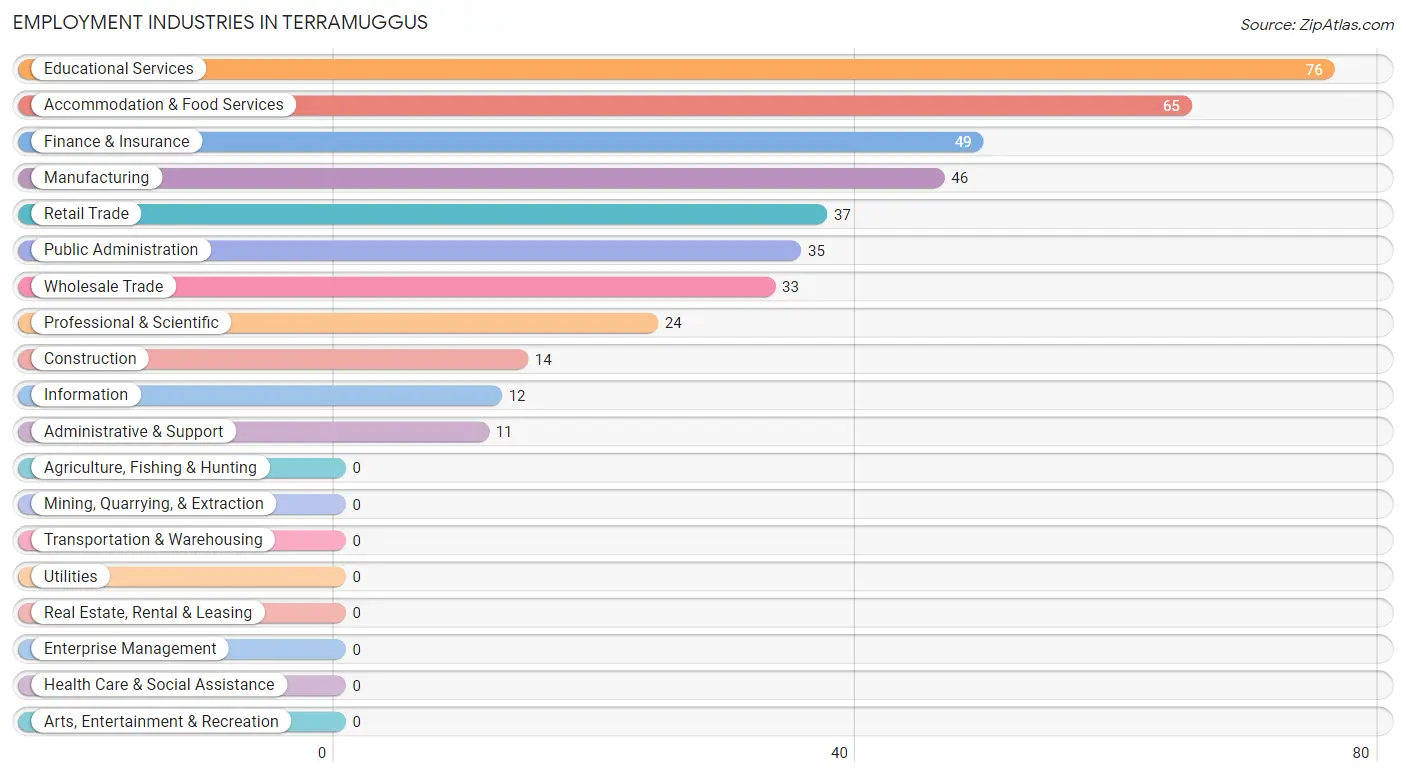
Employment Industries in Terramuggus
The major employment industries in Terramuggus include Educational Services (76 | 17.3%), Accommodation & Food Services (65 | 14.8%), Finance & Insurance (49 | 11.2%), Manufacturing (46 | 10.5%), and Retail Trade (37 | 8.4%).
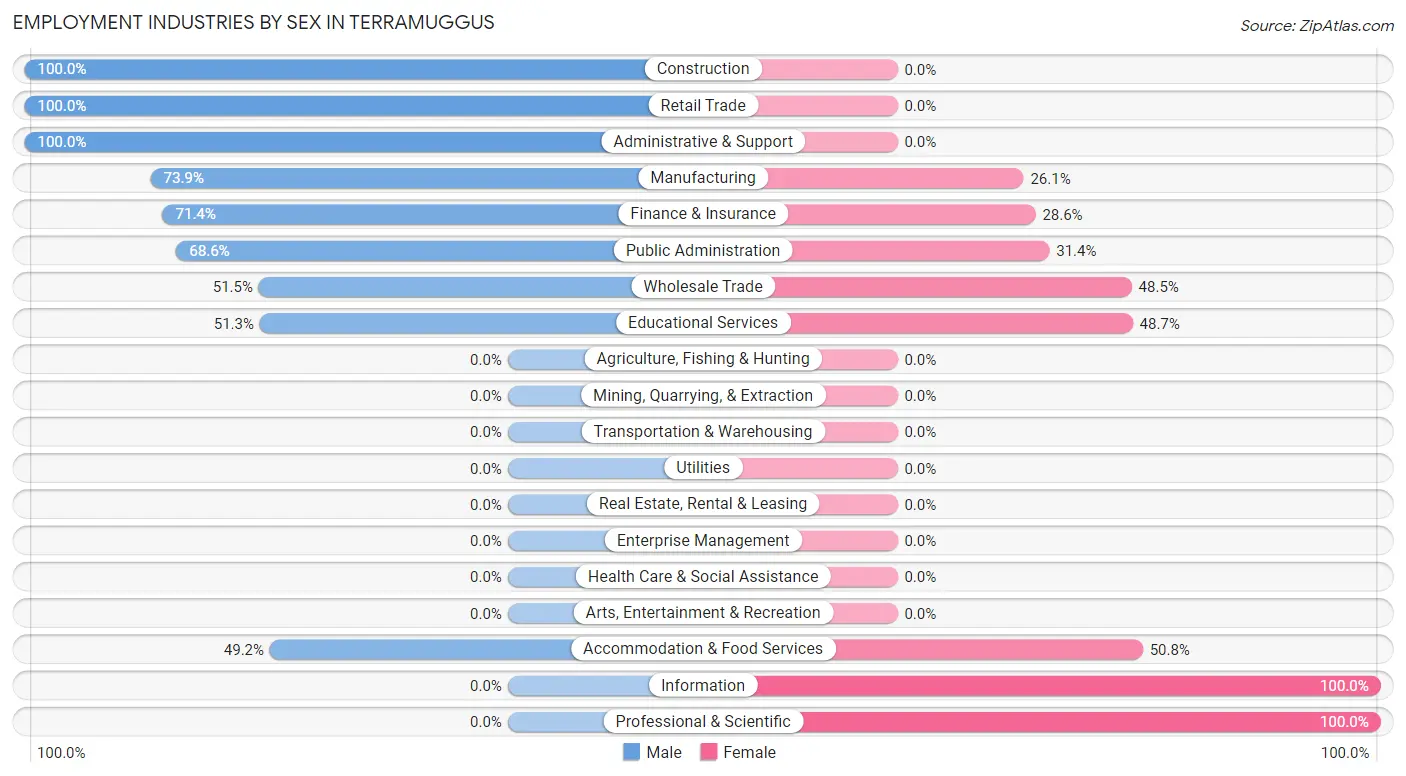
Employment Industries by Sex in Terramuggus
The Terramuggus industries that see more men than women are Construction (100.0%), Retail Trade (100.0%), and Administrative & Support (100.0%), whereas the industries that tend to have a higher number of women are Information (100.0%), Professional & Scientific (100.0%), and Accommodation & Food Services (50.8%).
| Industry | Male | Female |
| Agriculture, Fishing & Hunting | 0 (0.0%) | 0 (0.0%) |
| Mining, Quarrying, & Extraction | 0 (0.0%) | 0 (0.0%) |
| Construction | 14 (100.0%) | 0 (0.0%) |
| Manufacturing | 34 (73.9%) | 12 (26.1%) |
| Wholesale Trade | 17 (51.5%) | 16 (48.5%) |
| Retail Trade | 37 (100.0%) | 0 (0.0%) |
| Transportation & Warehousing | 0 (0.0%) | 0 (0.0%) |
| Utilities | 0 (0.0%) | 0 (0.0%) |
| Information | 0 (0.0%) | 12 (100.0%) |
| Finance & Insurance | 35 (71.4%) | 14 (28.6%) |
| Real Estate, Rental & Leasing | 0 (0.0%) | 0 (0.0%) |
| Professional & Scientific | 0 (0.0%) | 24 (100.0%) |
| Enterprise Management | 0 (0.0%) | 0 (0.0%) |
| Administrative & Support | 11 (100.0%) | 0 (0.0%) |
| Educational Services | 39 (51.3%) | 37 (48.7%) |
| Health Care & Social Assistance | 0 (0.0%) | 0 (0.0%) |
| Arts, Entertainment & Recreation | 0 (0.0%) | 0 (0.0%) |
| Accommodation & Food Services | 32 (49.2%) | 33 (50.8%) |
| Public Administration | 24 (68.6%) | 11 (31.4%) |
| Total | 253 (57.6%) | 186 (42.4%) |
Education in Terramuggus
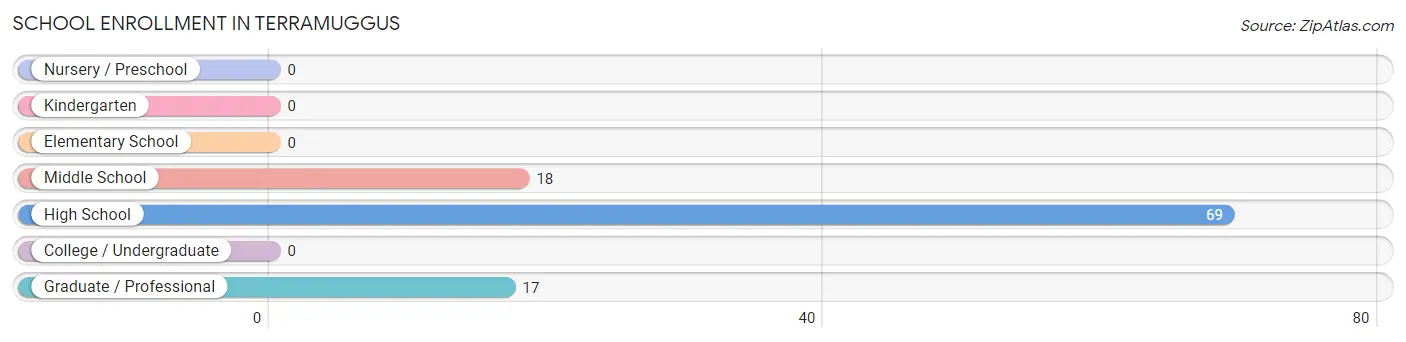
School Enrollment in Terramuggus
The most common levels of schooling among the 104 students in Terramuggus are high school (69 | 66.3%), middle school (18 | 17.3%), and graduate / professional (17 | 16.4%).
| School Level | # Students | % Students |
| Nursery / Preschool | 0 | 0.0% |
| Kindergarten | 0 | 0.0% |
| Elementary School | 0 | 0.0% |
| Middle School | 18 | 17.3% |
| High School | 69 | 66.3% |
| College / Undergraduate | 0 | 0.0% |
| Graduate / Professional | 17 | 16.4% |
| Total | 104 | 100.0% |
School Enrollment by Age by Funding Source in Terramuggus
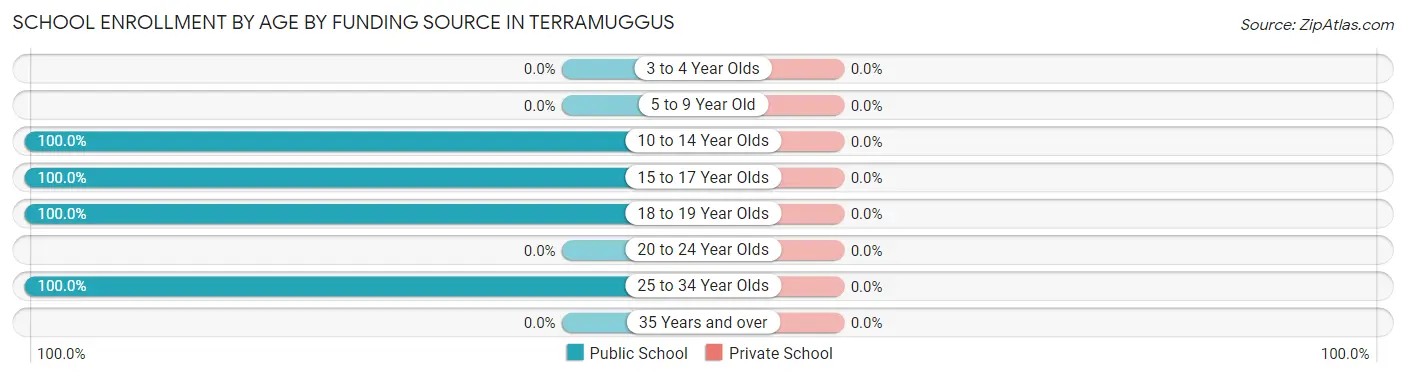
| Age Bracket | Public School | Private School |
| 3 to 4 Year Olds | 0 (0.0%) | 0 (0.0%) |
| 5 to 9 Year Old | 0 (0.0%) | 0 (0.0%) |
| 10 to 14 Year Olds | 36 (100.0%) | 0 (0.0%) |
| 15 to 17 Year Olds | 18 (100.0%) | 0 (0.0%) |
| 18 to 19 Year Olds | 33 (100.0%) | 0 (0.0%) |
| 20 to 24 Year Olds | 0 (0.0%) | 0 (0.0%) |
| 25 to 34 Year Olds | 17 (100.0%) | 0 (0.0%) |
| 35 Years and over | 0 (0.0%) | 0 (0.0%) |
| Total | 104 (100.0%) | 0 (0.0%) |
Educational Attainment by Field of Study in Terramuggus
Psychology (101 | 30.6%), engineering (57 | 17.3%), business (42 | 12.7%), communications (36 | 10.9%), and education (32 | 9.7%) are the most common fields of study among 330 individuals in Terramuggus who have obtained a bachelor's degree or higher.
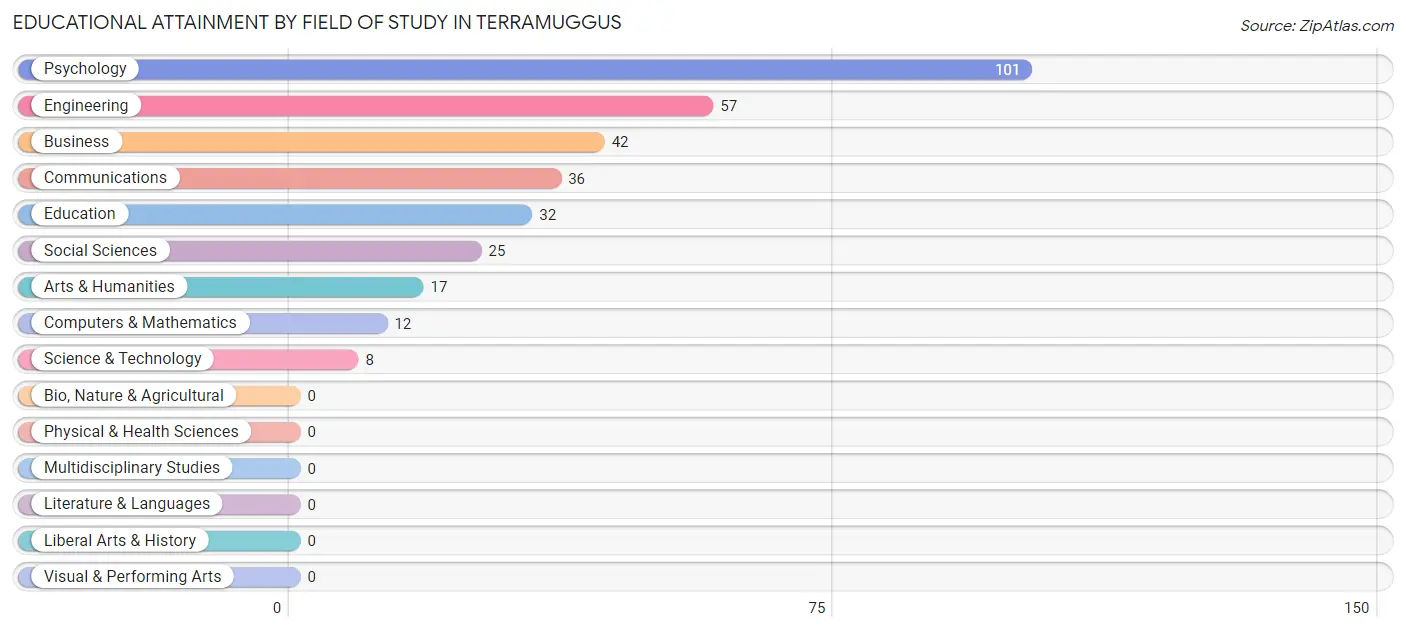
| Field of Study | # Graduates | % Graduates |
| Computers & Mathematics | 12 | 3.6% |
| Bio, Nature & Agricultural | 0 | 0.0% |
| Physical & Health Sciences | 0 | 0.0% |
| Psychology | 101 | 30.6% |
| Social Sciences | 25 | 7.6% |
| Engineering | 57 | 17.3% |
| Multidisciplinary Studies | 0 | 0.0% |
| Science & Technology | 8 | 2.4% |
| Business | 42 | 12.7% |
| Education | 32 | 9.7% |
| Literature & Languages | 0 | 0.0% |
| Liberal Arts & History | 0 | 0.0% |
| Visual & Performing Arts | 0 | 0.0% |
| Communications | 36 | 10.9% |
| Arts & Humanities | 17 | 5.1% |
| Total | 330 | 100.0% |
Transportation & Commute in Terramuggus
Vehicle Availability by Sex in Terramuggus
The most prevalent vehicle ownership categories in Terramuggus are males with 1 vehicle (72, accounting for 29.7%) and females with 1 vehicle (57, making up 44.4%).
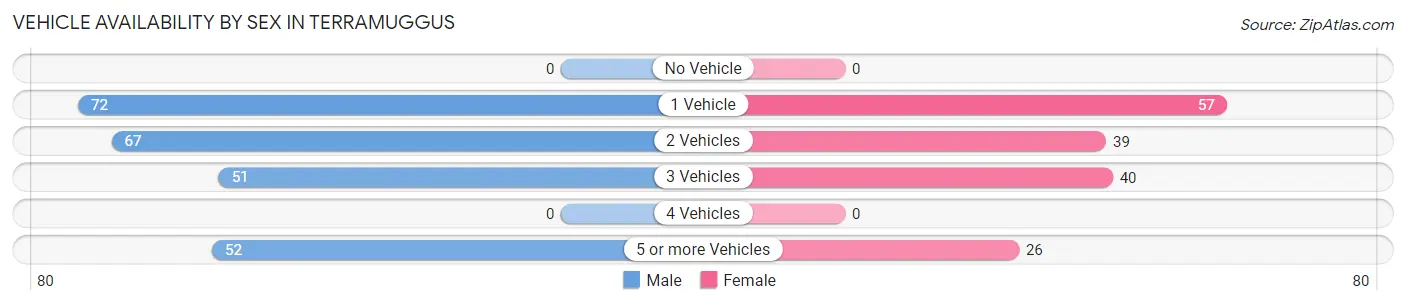
| Vehicles Available | Male | Female |
| No Vehicle | 0 (0.0%) | 0 (0.0%) |
| 1 Vehicle | 72 (29.7%) | 57 (35.2%) |
| 2 Vehicles | 67 (27.7%) | 39 (24.1%) |
| 3 Vehicles | 51 (21.1%) | 40 (24.7%) |
| 4 Vehicles | 0 (0.0%) | 0 (0.0%) |
| 5 or more Vehicles | 52 (21.5%) | 26 (16.1%) |
| Total | 242 (100.0%) | 162 (100.0%) |
Commute Time in Terramuggus
The most frequently occuring commute durations in Terramuggus are 25 to 29 minutes (55 commuters, 21.1%), 20 to 24 minutes (50 commuters, 19.2%), and 30 to 34 minutes (40 commuters, 15.4%).
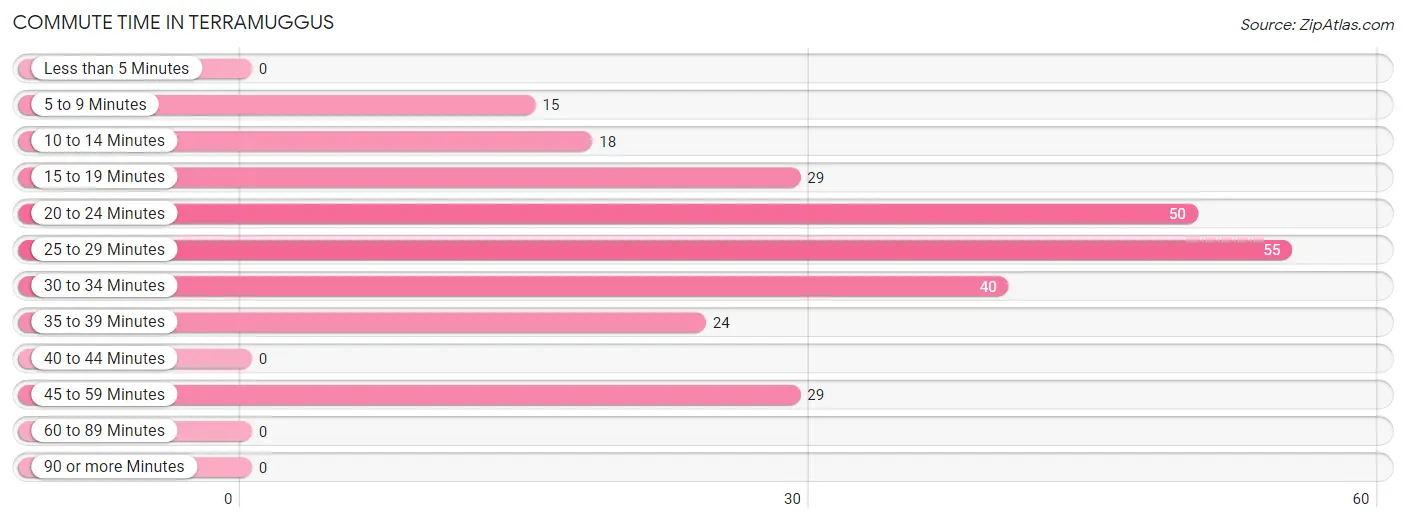
| Commute Time | # Commuters | % Commuters |
| Less than 5 Minutes | 0 | 0.0% |
| 5 to 9 Minutes | 15 | 5.8% |
| 10 to 14 Minutes | 18 | 6.9% |
| 15 to 19 Minutes | 29 | 11.2% |
| 20 to 24 Minutes | 50 | 19.2% |
| 25 to 29 Minutes | 55 | 21.1% |
| 30 to 34 Minutes | 40 | 15.4% |
| 35 to 39 Minutes | 24 | 9.2% |
| 40 to 44 Minutes | 0 | 0.0% |
| 45 to 59 Minutes | 29 | 11.2% |
| 60 to 89 Minutes | 0 | 0.0% |
| 90 or more Minutes | 0 | 0.0% |
Commute Time by Sex in Terramuggus
The most common commute times in Terramuggus are 25 to 29 minutes (41 commuters, 24.3%) for males and 45 to 59 minutes (29 commuters, 31.9%) for females.
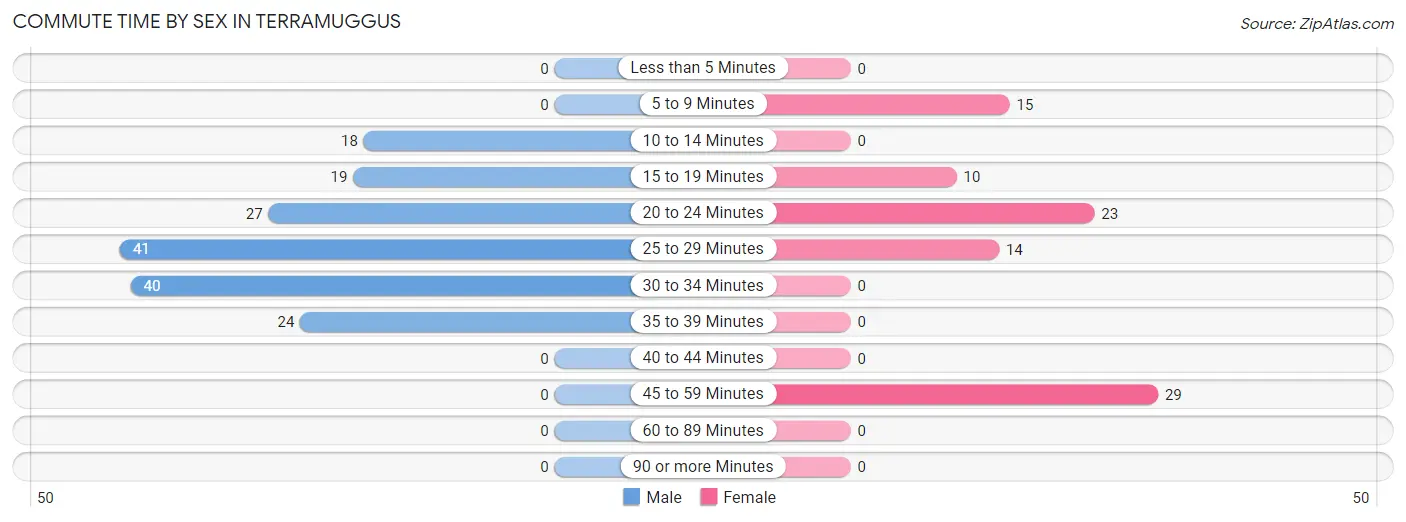
| Commute Time | Male | Female |
| Less than 5 Minutes | 0 (0.0%) | 0 (0.0%) |
| 5 to 9 Minutes | 0 (0.0%) | 15 (16.5%) |
| 10 to 14 Minutes | 18 (10.6%) | 0 (0.0%) |
| 15 to 19 Minutes | 19 (11.2%) | 10 (11.0%) |
| 20 to 24 Minutes | 27 (16.0%) | 23 (25.3%) |
| 25 to 29 Minutes | 41 (24.3%) | 14 (15.4%) |
| 30 to 34 Minutes | 40 (23.7%) | 0 (0.0%) |
| 35 to 39 Minutes | 24 (14.2%) | 0 (0.0%) |
| 40 to 44 Minutes | 0 (0.0%) | 0 (0.0%) |
| 45 to 59 Minutes | 0 (0.0%) | 29 (31.9%) |
| 60 to 89 Minutes | 0 (0.0%) | 0 (0.0%) |
| 90 or more Minutes | 0 (0.0%) | 0 (0.0%) |
Time of Departure to Work by Sex in Terramuggus
The most frequent times of departure to work in Terramuggus are 7:00 AM to 7:29 AM (56, 33.1%) for males and 7:00 AM to 7:29 AM (42, 46.2%) for females.
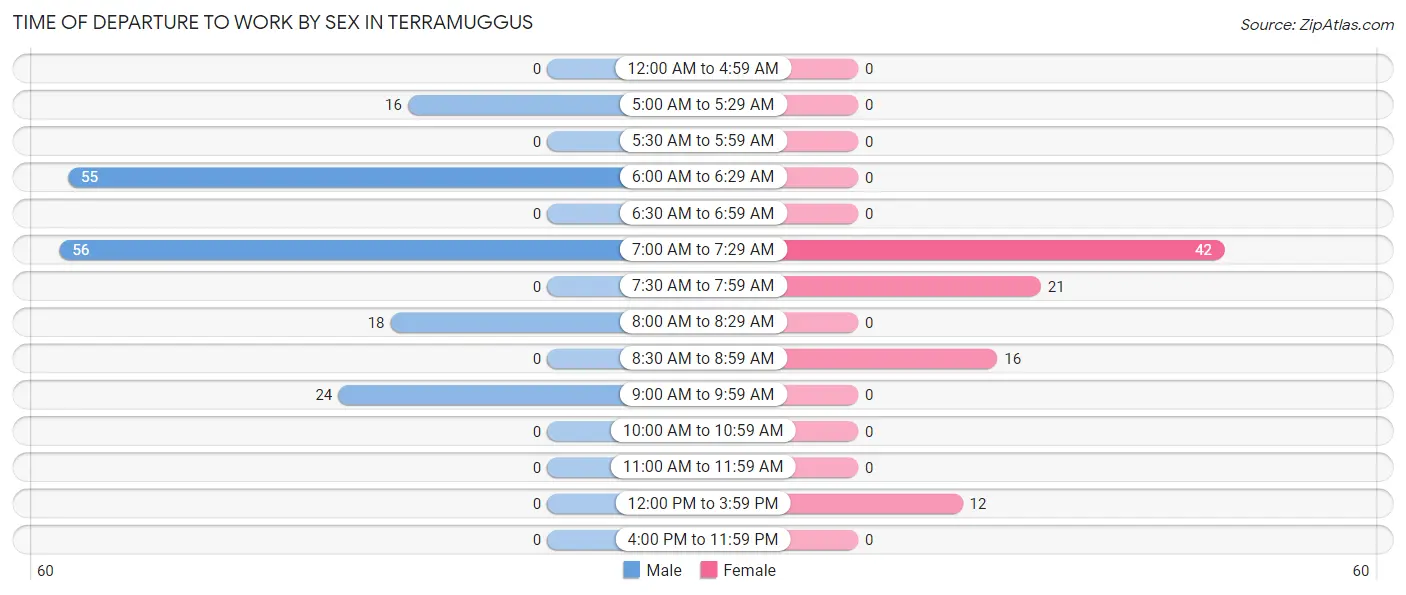
| Time of Departure | Male | Female |
| 12:00 AM to 4:59 AM | 0 (0.0%) | 0 (0.0%) |
| 5:00 AM to 5:29 AM | 16 (9.5%) | 0 (0.0%) |
| 5:30 AM to 5:59 AM | 0 (0.0%) | 0 (0.0%) |
| 6:00 AM to 6:29 AM | 55 (32.5%) | 0 (0.0%) |
| 6:30 AM to 6:59 AM | 0 (0.0%) | 0 (0.0%) |
| 7:00 AM to 7:29 AM | 56 (33.1%) | 42 (46.2%) |
| 7:30 AM to 7:59 AM | 0 (0.0%) | 21 (23.1%) |
| 8:00 AM to 8:29 AM | 18 (10.6%) | 0 (0.0%) |
| 8:30 AM to 8:59 AM | 0 (0.0%) | 16 (17.6%) |
| 9:00 AM to 9:59 AM | 24 (14.2%) | 0 (0.0%) |
| 10:00 AM to 10:59 AM | 0 (0.0%) | 0 (0.0%) |
| 11:00 AM to 11:59 AM | 0 (0.0%) | 0 (0.0%) |
| 12:00 PM to 3:59 PM | 0 (0.0%) | 12 (13.2%) |
| 4:00 PM to 11:59 PM | 0 (0.0%) | 0 (0.0%) |
| Total | 169 (100.0%) | 91 (100.0%) |
Housing Occupancy in Terramuggus
Occupancy by Ownership in Terramuggus
Of the total 315 dwellings in Terramuggus, owner-occupied units account for 253 (80.3%), while renter-occupied units make up 62 (19.7%).
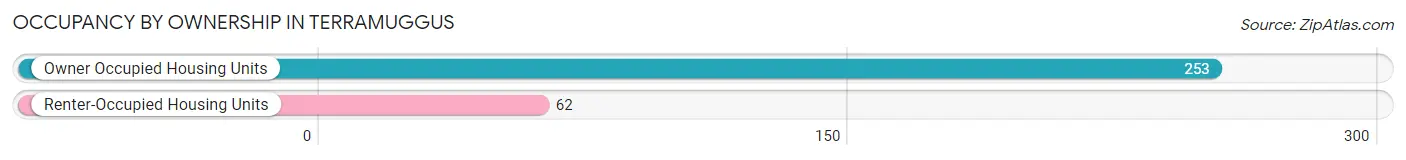
| Occupancy | # Housing Units | % Housing Units |
| Owner Occupied Housing Units | 253 | 80.3% |
| Renter-Occupied Housing Units | 62 | 19.7% |
| Total Occupied Housing Units | 315 | 100.0% |
Occupancy by Household Size in Terramuggus
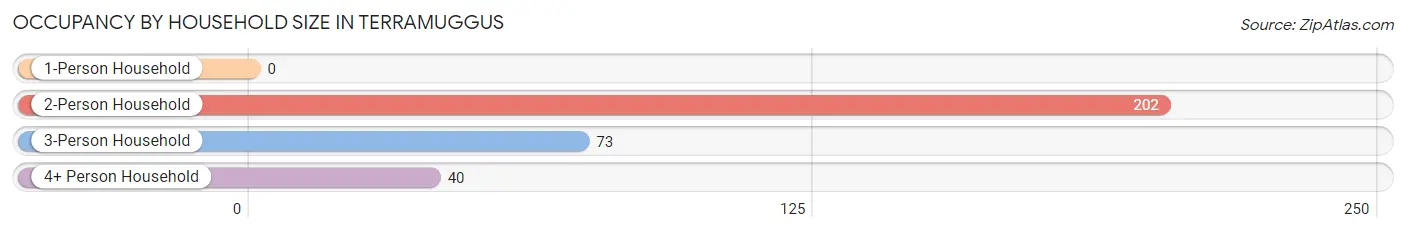
| Household Size | # Housing Units | % Housing Units |
| 1-Person Household | 0 | 0.0% |
| 2-Person Household | 202 | 64.1% |
| 3-Person Household | 73 | 23.2% |
| 4+ Person Household | 40 | 12.7% |
| Total Housing Units | 315 | 100.0% |
Occupancy by Ownership by Household Size in Terramuggus
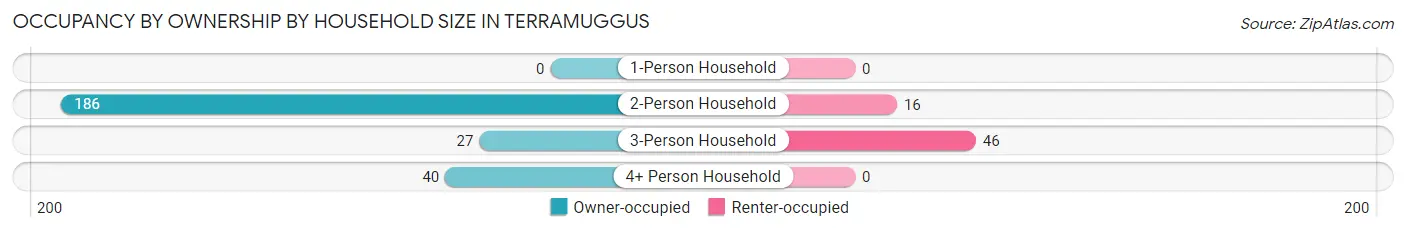
| Household Size | Owner-occupied | Renter-occupied |
| 1-Person Household | 0 (0.0%) | 0 (0.0%) |
| 2-Person Household | 186 (92.1%) | 16 (7.9%) |
| 3-Person Household | 27 (37.0%) | 46 (63.0%) |
| 4+ Person Household | 40 (100.0%) | 0 (0.0%) |
| Total Housing Units | 253 (80.3%) | 62 (19.7%) |
Occupancy by Educational Attainment in Terramuggus
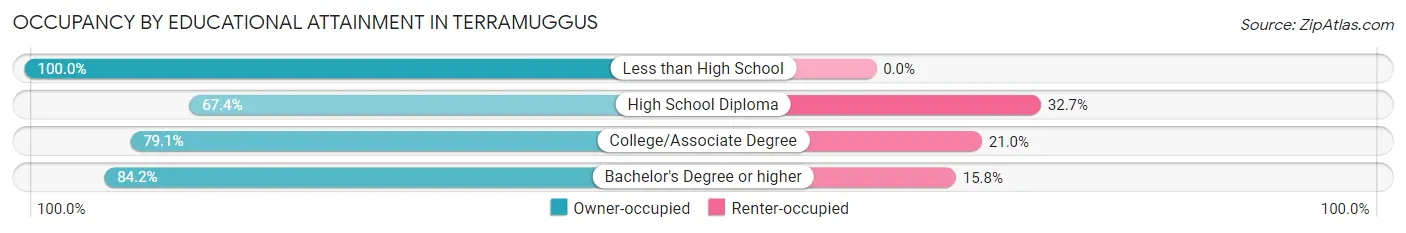
| Household Size | Owner-occupied | Renter-occupied |
| Less than High School | 9 (100.0%) | 0 (0.0%) |
| High School Diploma | 33 (67.3%) | 16 (32.7%) |
| College/Associate Degree | 83 (79.0%) | 22 (20.9%) |
| Bachelor's Degree or higher | 128 (84.2%) | 24 (15.8%) |
Occupancy by Age of Householder in Terramuggus
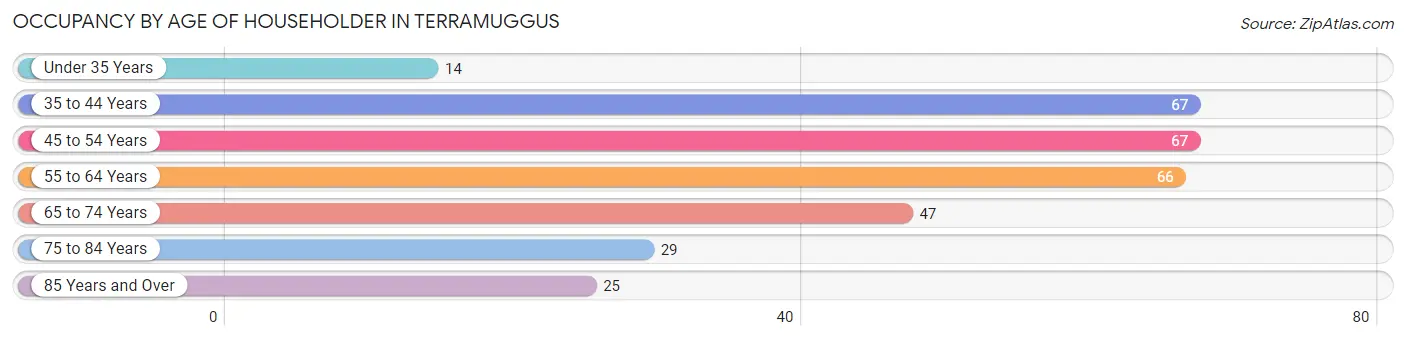
| Age Bracket | # Households | % Households |
| Under 35 Years | 14 | 4.4% |
| 35 to 44 Years | 67 | 21.3% |
| 45 to 54 Years | 67 | 21.3% |
| 55 to 64 Years | 66 | 20.9% |
| 65 to 74 Years | 47 | 14.9% |
| 75 to 84 Years | 29 | 9.2% |
| 85 Years and Over | 25 | 7.9% |
| Total | 315 | 100.0% |
Housing Finances in Terramuggus
Median Income by Occupancy in Terramuggus
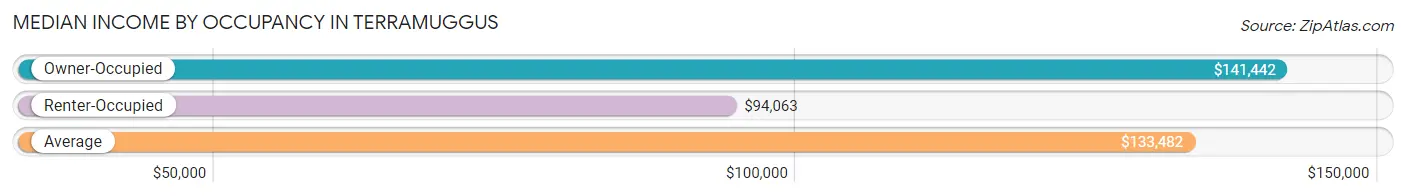
| Occupancy Type | # Households | Median Income |
| Owner-Occupied | 253 (80.3%) | $141,442 |
| Renter-Occupied | 62 (19.7%) | $94,063 |
| Average | 315 (100.0%) | $133,482 |
Occupancy by Householder Income Bracket in Terramuggus
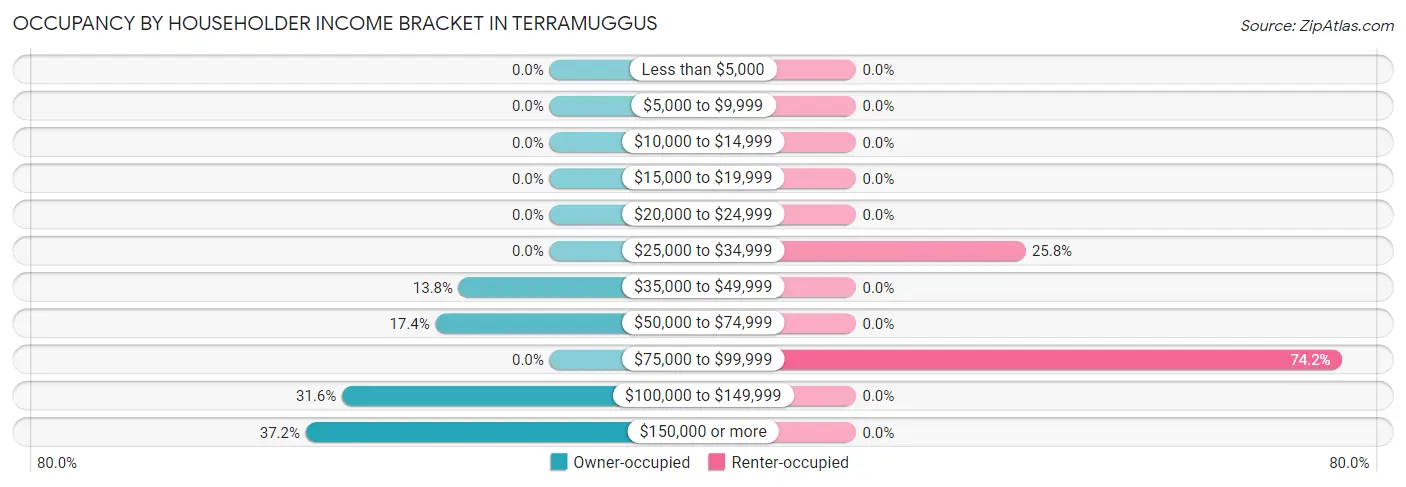
| Income Bracket | Owner-occupied | Renter-occupied |
| Less than $5,000 | 0 (0.0%) | 0 (0.0%) |
| $5,000 to $9,999 | 0 (0.0%) | 0 (0.0%) |
| $10,000 to $14,999 | 0 (0.0%) | 0 (0.0%) |
| $15,000 to $19,999 | 0 (0.0%) | 0 (0.0%) |
| $20,000 to $24,999 | 0 (0.0%) | 0 (0.0%) |
| $25,000 to $34,999 | 0 (0.0%) | 16 (25.8%) |
| $35,000 to $49,999 | 35 (13.8%) | 0 (0.0%) |
| $50,000 to $74,999 | 44 (17.4%) | 0 (0.0%) |
| $75,000 to $99,999 | 0 (0.0%) | 46 (74.2%) |
| $100,000 to $149,999 | 80 (31.6%) | 0 (0.0%) |
| $150,000 or more | 94 (37.1%) | 0 (0.0%) |
| Total | 253 (100.0%) | 62 (100.0%) |
Monthly Housing Cost Tiers in Terramuggus
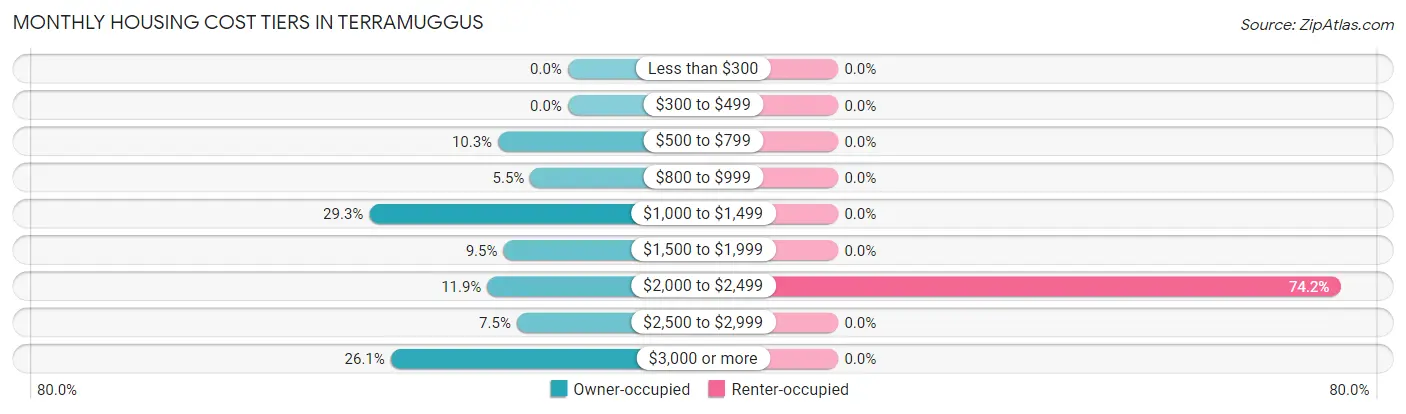
| Monthly Cost | Owner-occupied | Renter-occupied |
| Less than $300 | 0 (0.0%) | 0 (0.0%) |
| $300 to $499 | 0 (0.0%) | 0 (0.0%) |
| $500 to $799 | 26 (10.3%) | 0 (0.0%) |
| $800 to $999 | 14 (5.5%) | 0 (0.0%) |
| $1,000 to $1,499 | 74 (29.2%) | 0 (0.0%) |
| $1,500 to $1,999 | 24 (9.5%) | 0 (0.0%) |
| $2,000 to $2,499 | 30 (11.9%) | 46 (74.2%) |
| $2,500 to $2,999 | 19 (7.5%) | 0 (0.0%) |
| $3,000 or more | 66 (26.1%) | 0 (0.0%) |
| Total | 253 (100.0%) | 62 (100.0%) |
Physical Housing Characteristics in Terramuggus
Housing Structures in Terramuggus
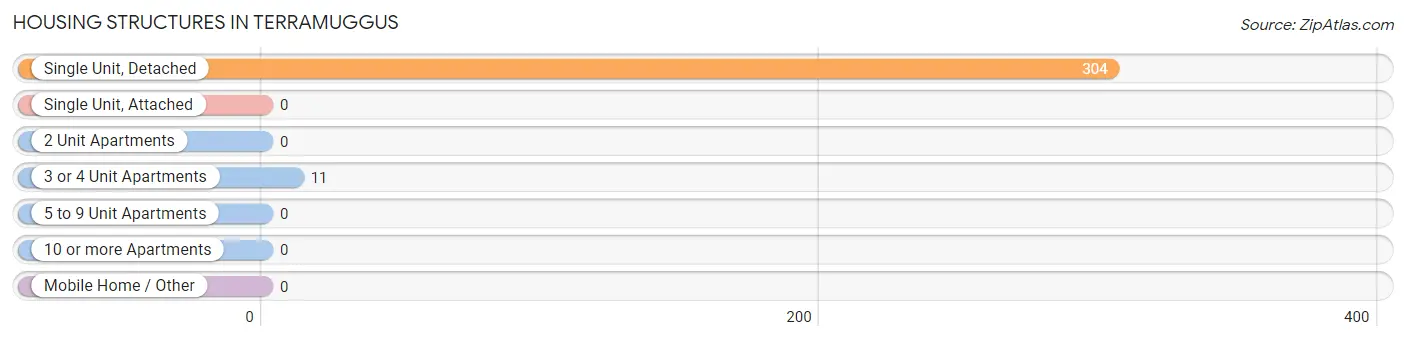
| Structure Type | # Housing Units | % Housing Units |
| Single Unit, Detached | 304 | 96.5% |
| Single Unit, Attached | 0 | 0.0% |
| 2 Unit Apartments | 0 | 0.0% |
| 3 or 4 Unit Apartments | 11 | 3.5% |
| 5 to 9 Unit Apartments | 0 | 0.0% |
| 10 or more Apartments | 0 | 0.0% |
| Mobile Home / Other | 0 | 0.0% |
| Total | 315 | 100.0% |
Housing Structures by Occupancy in Terramuggus
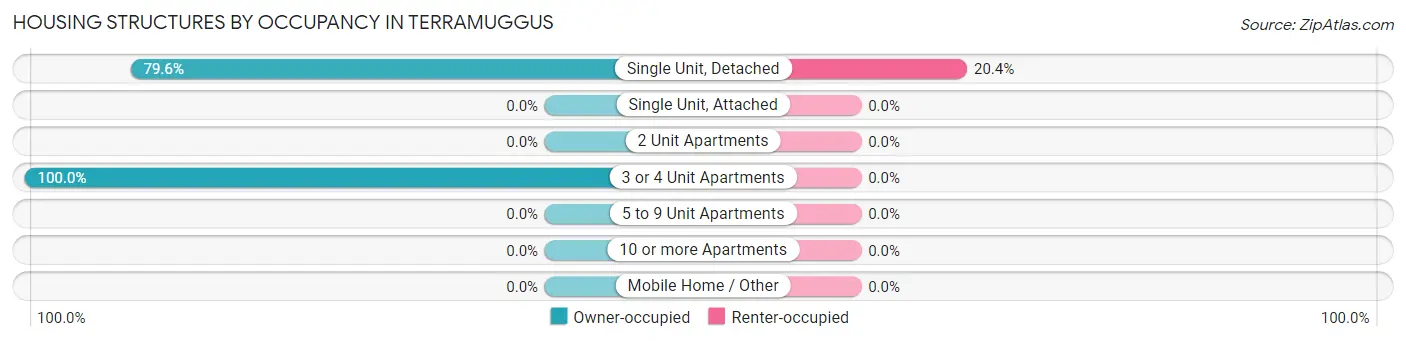
| Structure Type | Owner-occupied | Renter-occupied |
| Single Unit, Detached | 242 (79.6%) | 62 (20.4%) |
| Single Unit, Attached | 0 (0.0%) | 0 (0.0%) |
| 2 Unit Apartments | 0 (0.0%) | 0 (0.0%) |
| 3 or 4 Unit Apartments | 11 (100.0%) | 0 (0.0%) |
| 5 to 9 Unit Apartments | 0 (0.0%) | 0 (0.0%) |
| 10 or more Apartments | 0 (0.0%) | 0 (0.0%) |
| Mobile Home / Other | 0 (0.0%) | 0 (0.0%) |
| Total | 253 (80.3%) | 62 (19.7%) |
Housing Structures by Number of Rooms in Terramuggus
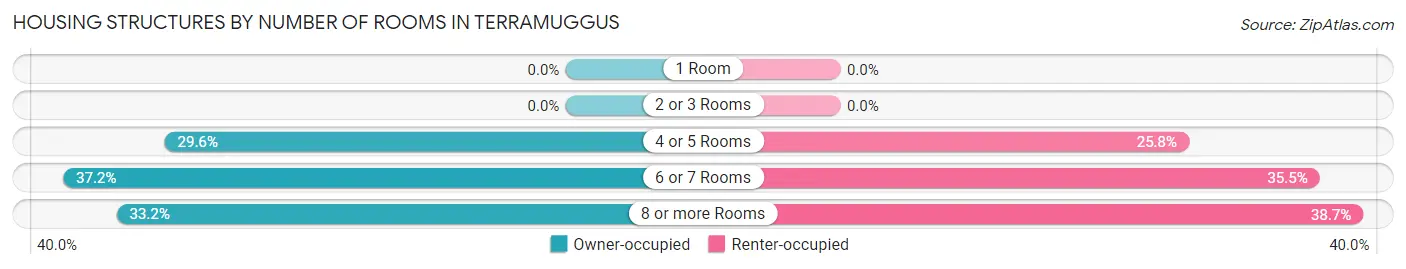
| Number of Rooms | Owner-occupied | Renter-occupied |
| 1 Room | 0 (0.0%) | 0 (0.0%) |
| 2 or 3 Rooms | 0 (0.0%) | 0 (0.0%) |
| 4 or 5 Rooms | 75 (29.6%) | 16 (25.8%) |
| 6 or 7 Rooms | 94 (37.1%) | 22 (35.5%) |
| 8 or more Rooms | 84 (33.2%) | 24 (38.7%) |
| Total | 253 (100.0%) | 62 (100.0%) |
Housing Structure by Heating Type in Terramuggus
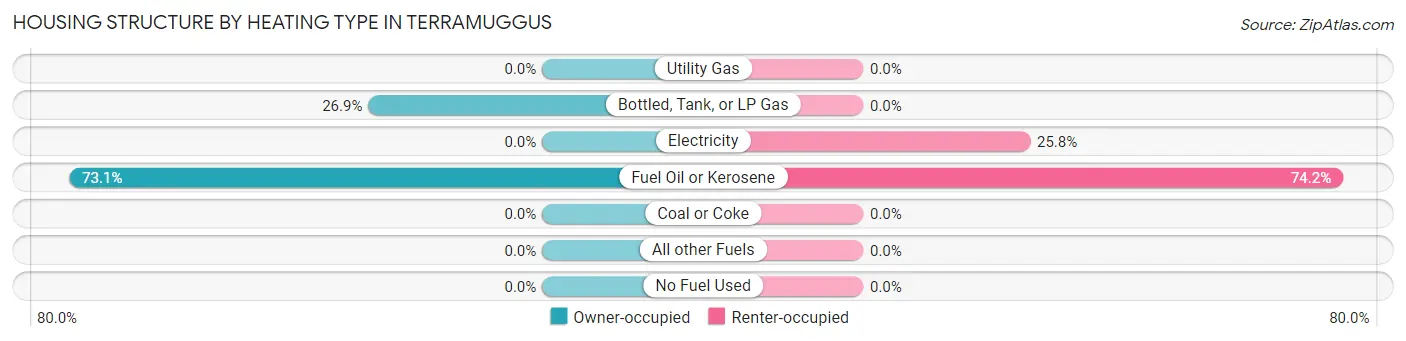
| Heating Type | Owner-occupied | Renter-occupied |
| Utility Gas | 0 (0.0%) | 0 (0.0%) |
| Bottled, Tank, or LP Gas | 68 (26.9%) | 0 (0.0%) |
| Electricity | 0 (0.0%) | 16 (25.8%) |
| Fuel Oil or Kerosene | 185 (73.1%) | 46 (74.2%) |
| Coal or Coke | 0 (0.0%) | 0 (0.0%) |
| All other Fuels | 0 (0.0%) | 0 (0.0%) |
| No Fuel Used | 0 (0.0%) | 0 (0.0%) |
| Total | 253 (100.0%) | 62 (100.0%) |
Household Vehicle Usage in Terramuggus
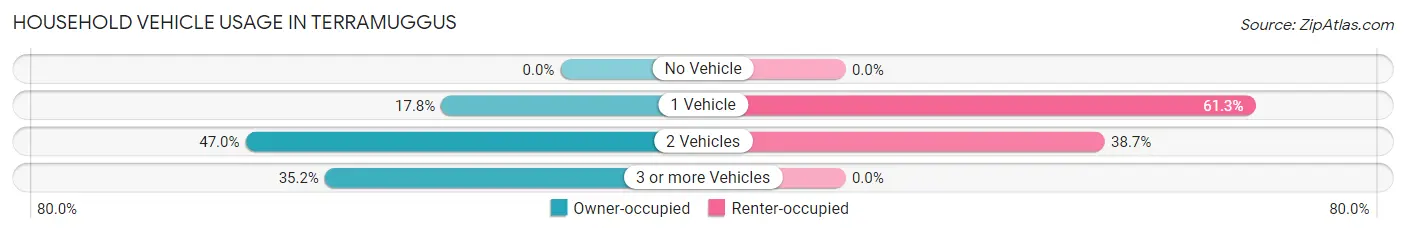
| Vehicles per Household | Owner-occupied | Renter-occupied |
| No Vehicle | 0 (0.0%) | 0 (0.0%) |
| 1 Vehicle | 45 (17.8%) | 38 (61.3%) |
| 2 Vehicles | 119 (47.0%) | 24 (38.7%) |
| 3 or more Vehicles | 89 (35.2%) | 0 (0.0%) |
| Total | 253 (100.0%) | 62 (100.0%) |
Real Estate & Mortgages in Terramuggus
Real Estate and Mortgage Overview in Terramuggus
| Characteristic | Without Mortgage | With Mortgage |
| Housing Units | 114 | 139 |
| Median Property Value | $400,000 | $309,500 |
| Median Household Income | $105,909 | $94 |
| Monthly Housing Costs | $1,250 | $66 |
| Real Estate Taxes | $8,750 | $0 |
Property Value by Mortgage Status in Terramuggus
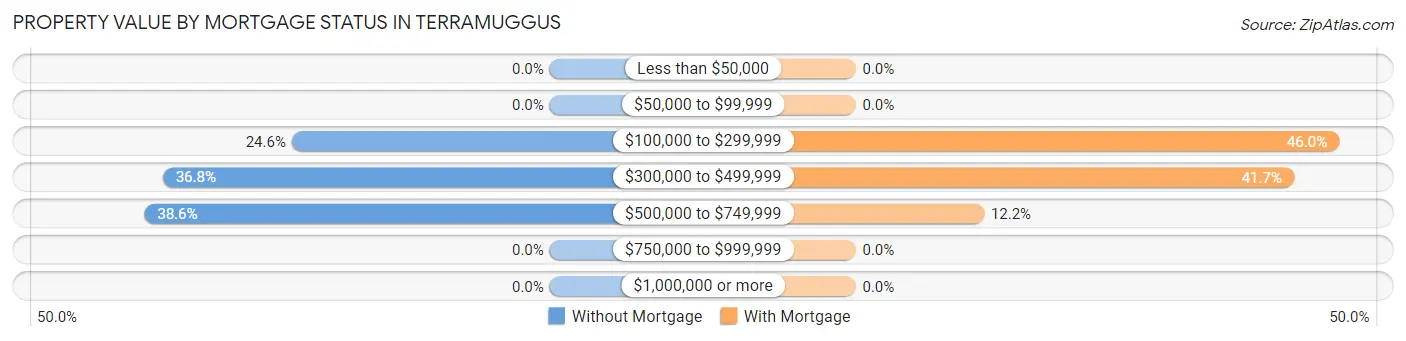
| Property Value | Without Mortgage | With Mortgage |
| Less than $50,000 | 0 (0.0%) | 0 (0.0%) |
| $50,000 to $99,999 | 0 (0.0%) | 0 (0.0%) |
| $100,000 to $299,999 | 28 (24.6%) | 64 (46.0%) |
| $300,000 to $499,999 | 42 (36.8%) | 58 (41.7%) |
| $500,000 to $749,999 | 44 (38.6%) | 17 (12.2%) |
| $750,000 to $999,999 | 0 (0.0%) | 0 (0.0%) |
| $1,000,000 or more | 0 (0.0%) | 0 (0.0%) |
| Total | 114 (100.0%) | 139 (100.0%) |
Household Income by Mortgage Status in Terramuggus
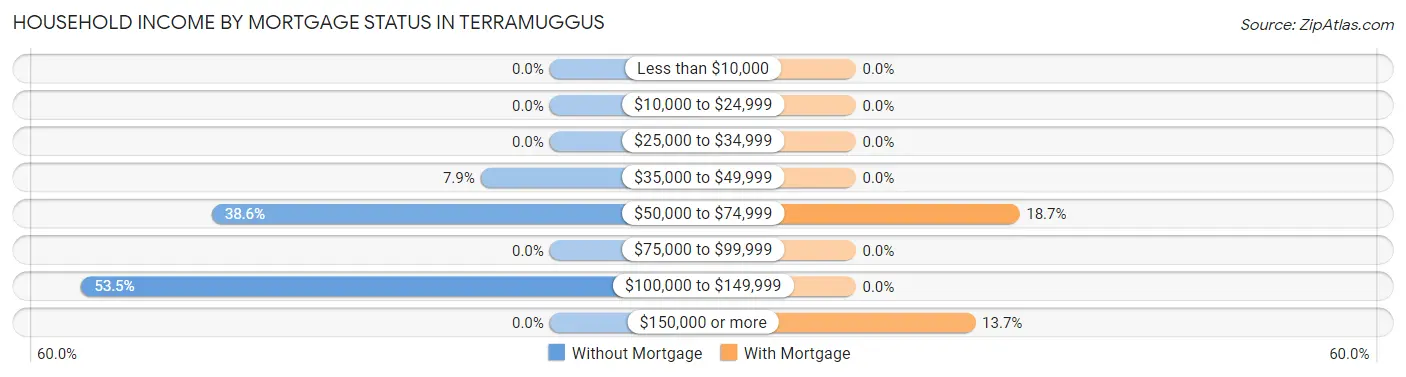
| Household Income | Without Mortgage | With Mortgage |
| Less than $10,000 | 0 (0.0%) | 0 (0.0%) |
| $10,000 to $24,999 | 0 (0.0%) | 0 (0.0%) |
| $25,000 to $34,999 | 0 (0.0%) | 0 (0.0%) |
| $35,000 to $49,999 | 9 (7.9%) | 0 (0.0%) |
| $50,000 to $74,999 | 44 (38.6%) | 26 (18.7%) |
| $75,000 to $99,999 | 0 (0.0%) | 0 (0.0%) |
| $100,000 to $149,999 | 61 (53.5%) | 0 (0.0%) |
| $150,000 or more | 0 (0.0%) | 19 (13.7%) |
| Total | 114 (100.0%) | 139 (100.0%) |
Property Value to Household Income Ratio in Terramuggus
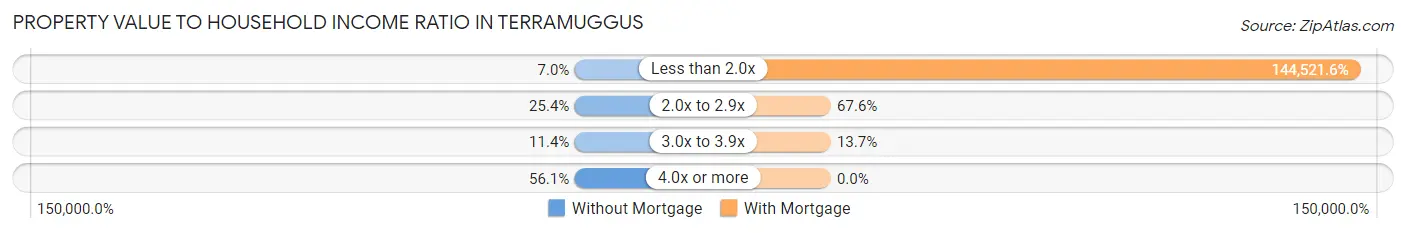
| Value-to-Income Ratio | Without Mortgage | With Mortgage |
| Less than 2.0x | 8 (7.0%) | 200,885 (144,521.6%) |
| 2.0x to 2.9x | 29 (25.4%) | 94 (67.6%) |
| 3.0x to 3.9x | 13 (11.4%) | 19 (13.7%) |
| 4.0x or more | 64 (56.1%) | 0 (0.0%) |
| Total | 114 (100.0%) | 139 (100.0%) |
Real Estate Taxes by Mortgage Status in Terramuggus
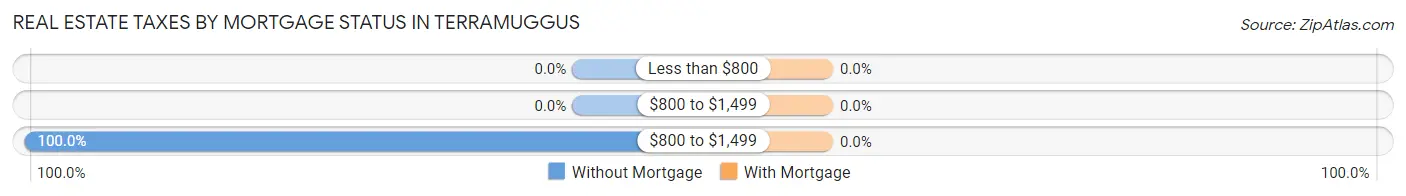
| Property Taxes | Without Mortgage | With Mortgage |
| Less than $800 | 0 (0.0%) | 0 (0.0%) |
| $800 to $1,499 | 0 (0.0%) | 0 (0.0%) |
| $800 to $1,499 | 114 (100.0%) | 0 (0.0%) |
| Total | 114 (100.0%) | 139 (100.0%) |
Health & Disability in Terramuggus
Health Insurance Coverage by Age in Terramuggus
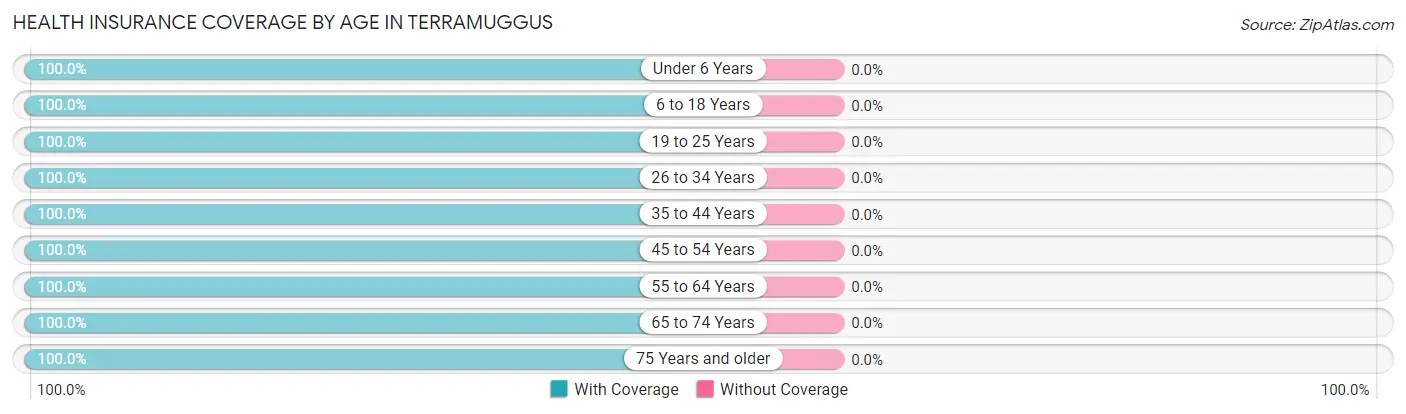
| Age Bracket | With Coverage | Without Coverage |
| Under 6 Years | 38 (100.0%) | 0 (0.0%) |
| 6 to 18 Years | 87 (100.0%) | 0 (0.0%) |
| 19 to 25 Years | 31 (100.0%) | 0 (0.0%) |
| 26 to 34 Years | 45 (100.0%) | 0 (0.0%) |
| 35 to 44 Years | 120 (100.0%) | 0 (0.0%) |
| 45 to 54 Years | 92 (100.0%) | 0 (0.0%) |
| 55 to 64 Years | 160 (100.0%) | 0 (0.0%) |
| 65 to 74 Years | 96 (100.0%) | 0 (0.0%) |
| 75 Years and older | 109 (100.0%) | 0 (0.0%) |
| Total | 778 (100.0%) | 0 (0.0%) |
Health Insurance Coverage by Citizenship Status in Terramuggus
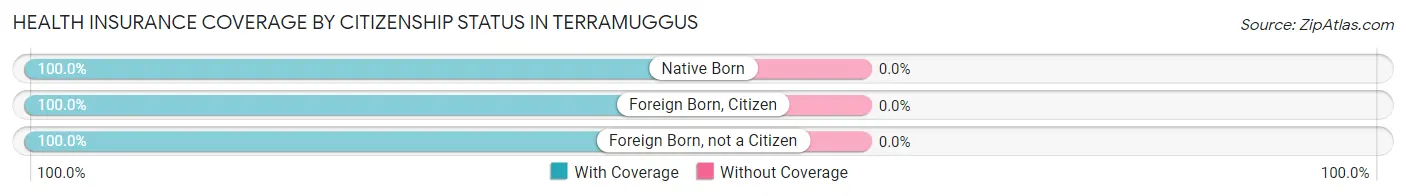
| Citizenship Status | With Coverage | Without Coverage |
| Native Born | 38 (100.0%) | 0 (0.0%) |
| Foreign Born, Citizen | 87 (100.0%) | 0 (0.0%) |
| Foreign Born, not a Citizen | 31 (100.0%) | 0 (0.0%) |
Health Insurance Coverage by Household Income in Terramuggus
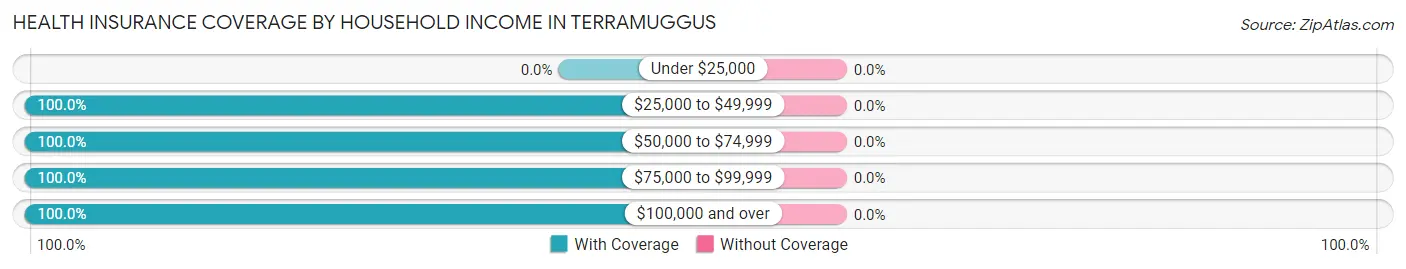
| Household Income | With Coverage | Without Coverage |
| Under $25,000 | 0 (0.0%) | 0 (0.0%) |
| $25,000 to $49,999 | 105 (100.0%) | 0 (0.0%) |
| $50,000 to $74,999 | 87 (100.0%) | 0 (0.0%) |
| $75,000 to $99,999 | 140 (100.0%) | 0 (0.0%) |
| $100,000 and over | 446 (100.0%) | 0 (0.0%) |
Public vs Private Health Insurance Coverage by Age in Terramuggus
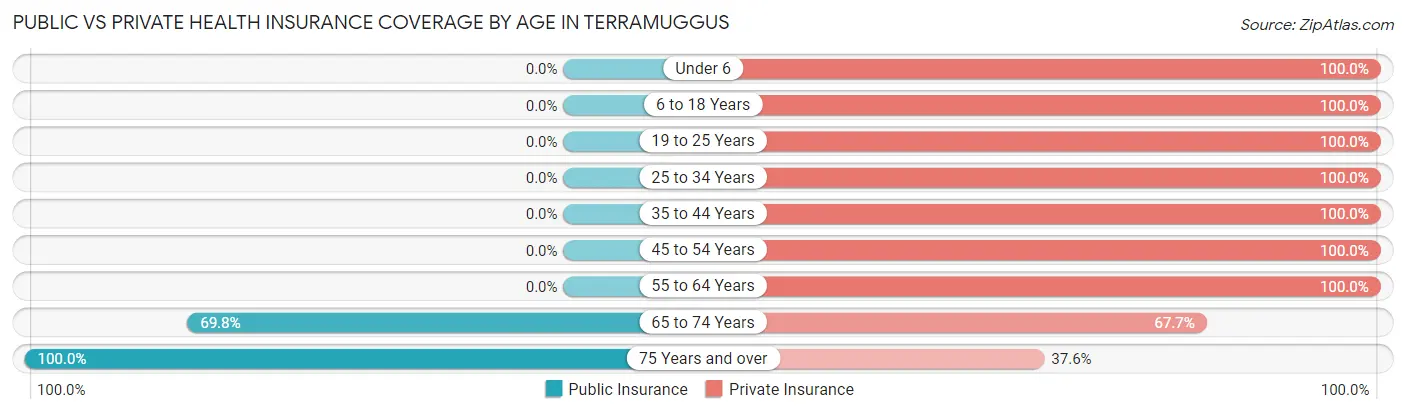
| Age Bracket | Public Insurance | Private Insurance |
| Under 6 | 0 (0.0%) | 38 (100.0%) |
| 6 to 18 Years | 0 (0.0%) | 87 (100.0%) |
| 19 to 25 Years | 0 (0.0%) | 31 (100.0%) |
| 25 to 34 Years | 0 (0.0%) | 45 (100.0%) |
| 35 to 44 Years | 0 (0.0%) | 120 (100.0%) |
| 45 to 54 Years | 0 (0.0%) | 92 (100.0%) |
| 55 to 64 Years | 0 (0.0%) | 160 (100.0%) |
| 65 to 74 Years | 67 (69.8%) | 65 (67.7%) |
| 75 Years and over | 109 (100.0%) | 41 (37.6%) |
| Total | 176 (22.6%) | 679 (87.3%) |
Disability Status by Sex by Age in Terramuggus
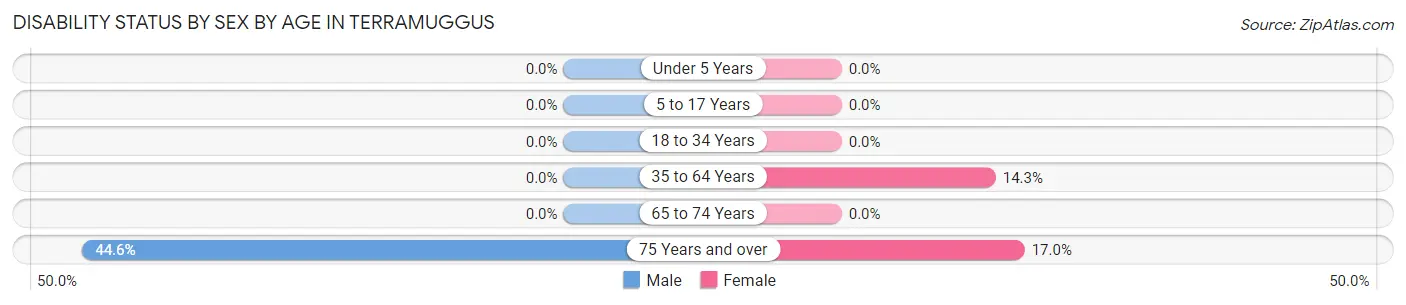
| Age Bracket | Male | Female |
| Under 5 Years | 0 (0.0%) | 0 (0.0%) |
| 5 to 17 Years | 0 (0.0%) | 0 (0.0%) |
| 18 to 34 Years | 0 (0.0%) | 0 (0.0%) |
| 35 to 64 Years | 0 (0.0%) | 25 (14.3%) |
| 65 to 74 Years | 0 (0.0%) | 0 (0.0%) |
| 75 Years and over | 25 (44.6%) | 9 (17.0%) |
Disability Class by Sex by Age in Terramuggus
Disability Class: Hearing Difficulty
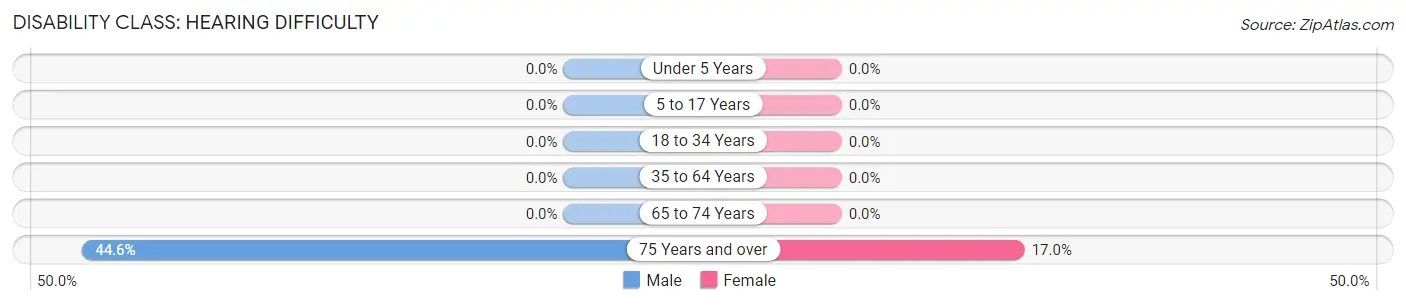
| Age Bracket | Male | Female |
| Under 5 Years | 0 (0.0%) | 0 (0.0%) |
| 5 to 17 Years | 0 (0.0%) | 0 (0.0%) |
| 18 to 34 Years | 0 (0.0%) | 0 (0.0%) |
| 35 to 64 Years | 0 (0.0%) | 0 (0.0%) |
| 65 to 74 Years | 0 (0.0%) | 0 (0.0%) |
| 75 Years and over | 25 (44.6%) | 9 (17.0%) |
Disability Class: Vision Difficulty
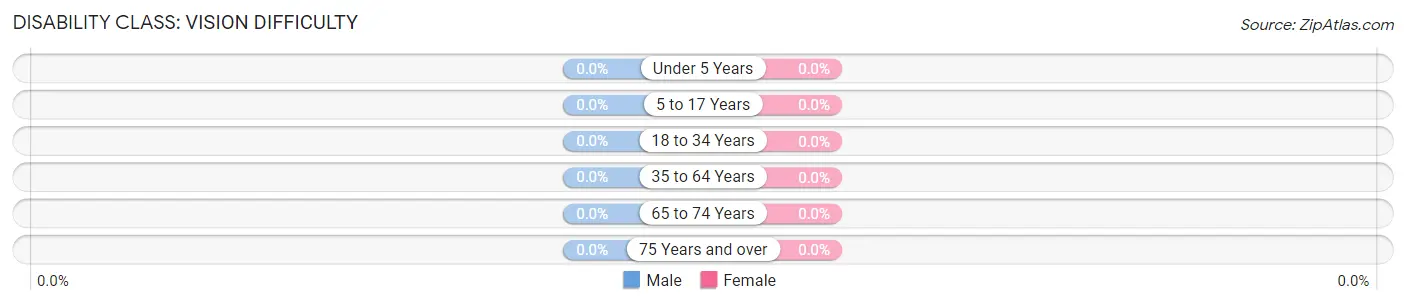
| Age Bracket | Male | Female |
| Under 5 Years | 0 (0.0%) | 0 (0.0%) |
| 5 to 17 Years | 0 (0.0%) | 0 (0.0%) |
| 18 to 34 Years | 0 (0.0%) | 0 (0.0%) |
| 35 to 64 Years | 0 (0.0%) | 0 (0.0%) |
| 65 to 74 Years | 0 (0.0%) | 0 (0.0%) |
| 75 Years and over | 0 (0.0%) | 0 (0.0%) |
Disability Class: Cognitive Difficulty
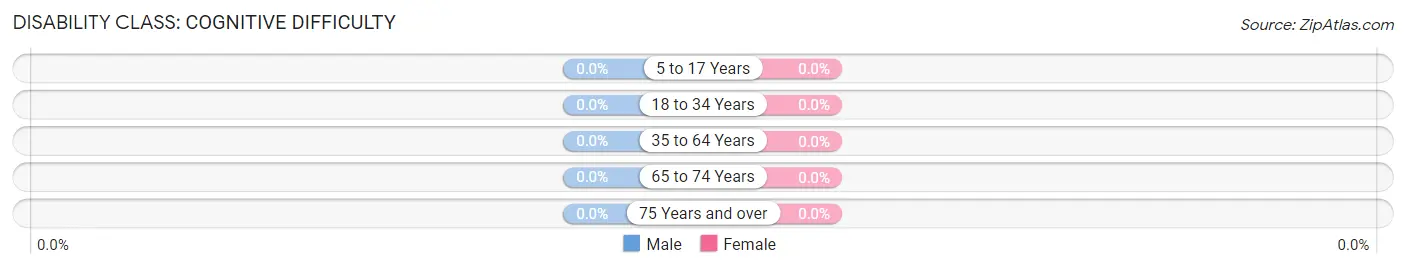
| Age Bracket | Male | Female |
| 5 to 17 Years | 0 (0.0%) | 0 (0.0%) |
| 18 to 34 Years | 0 (0.0%) | 0 (0.0%) |
| 35 to 64 Years | 0 (0.0%) | 0 (0.0%) |
| 65 to 74 Years | 0 (0.0%) | 0 (0.0%) |
| 75 Years and over | 0 (0.0%) | 0 (0.0%) |
Disability Class: Ambulatory Difficulty
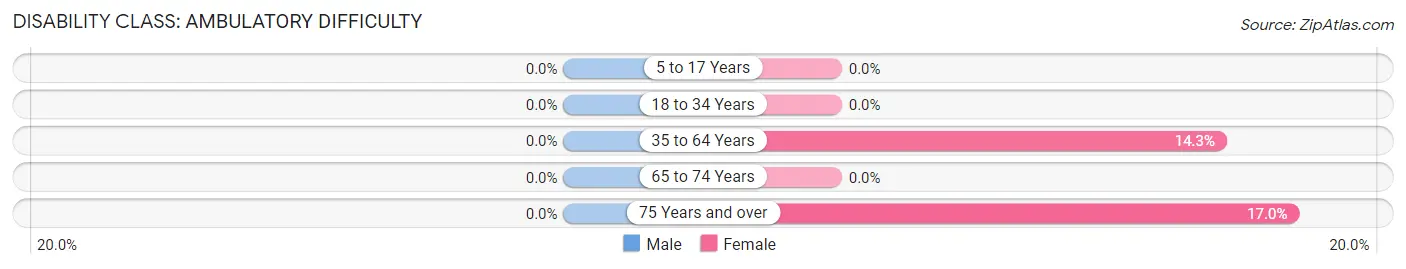
| Age Bracket | Male | Female |
| 5 to 17 Years | 0 (0.0%) | 0 (0.0%) |
| 18 to 34 Years | 0 (0.0%) | 0 (0.0%) |
| 35 to 64 Years | 0 (0.0%) | 25 (14.3%) |
| 65 to 74 Years | 0 (0.0%) | 0 (0.0%) |
| 75 Years and over | 0 (0.0%) | 9 (17.0%) |
Disability Class: Self-Care Difficulty
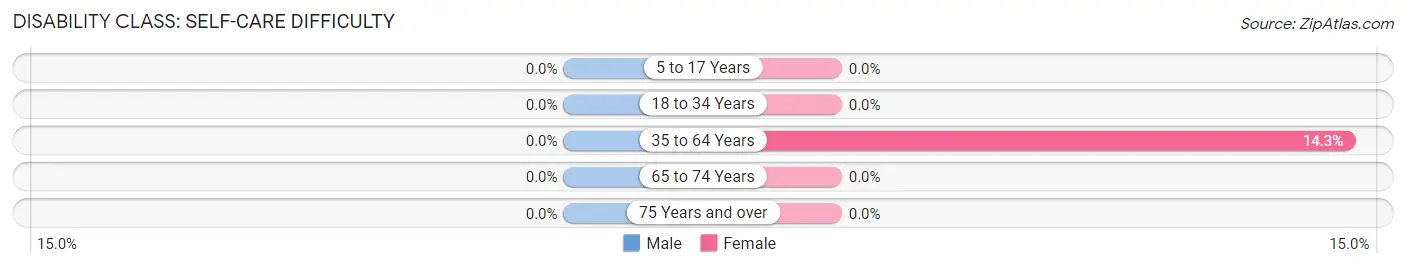
| Age Bracket | Male | Female |
| 5 to 17 Years | 0 (0.0%) | 0 (0.0%) |
| 18 to 34 Years | 0 (0.0%) | 0 (0.0%) |
| 35 to 64 Years | 0 (0.0%) | 25 (14.3%) |
| 65 to 74 Years | 0 (0.0%) | 0 (0.0%) |
| 75 Years and over | 0 (0.0%) | 0 (0.0%) |
Technology Access in Terramuggus
Computing Device Access in Terramuggus
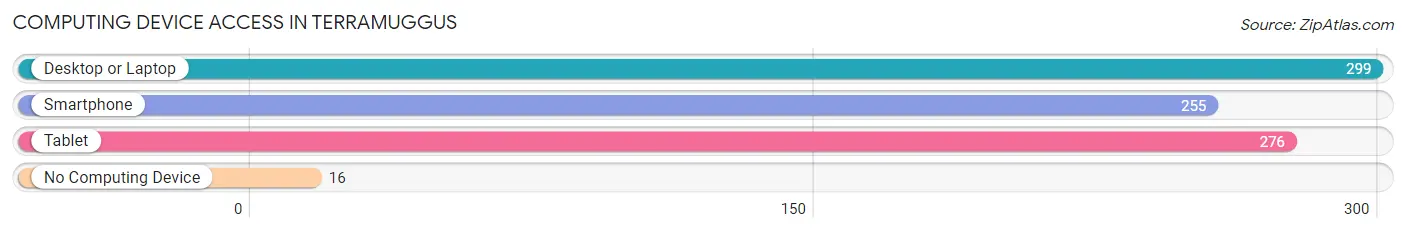
| Device Type | # Households | % Households |
| Desktop or Laptop | 299 | 94.9% |
| Smartphone | 255 | 80.9% |
| Tablet | 276 | 87.6% |
| No Computing Device | 16 | 5.1% |
| Total | 315 | 100.0% |
Internet Access in Terramuggus
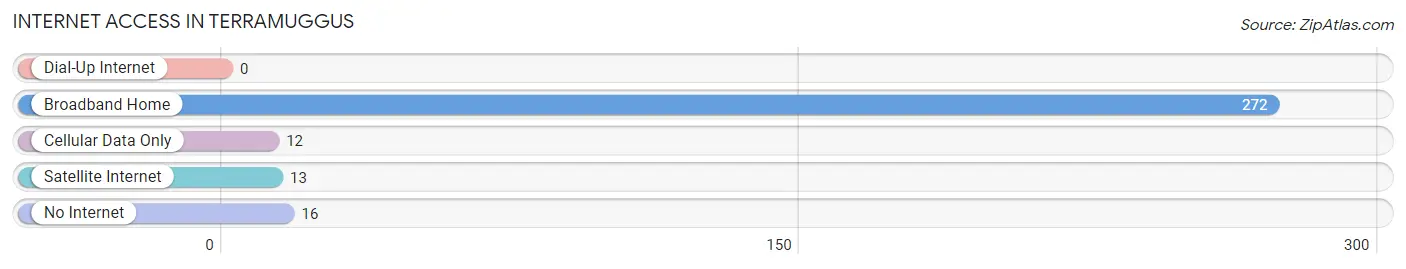
| Internet Type | # Households | % Households |
| Dial-Up Internet | 0 | 0.0% |
| Broadband Home | 272 | 86.4% |
| Cellular Data Only | 12 | 3.8% |
| Satellite Internet | 13 | 4.1% |
| No Internet | 16 | 5.1% |
| Total | 315 | 100.0% |
Terramuggus Summary
Terramuggus is a small town located in the state of Connecticut, in the United States. It is situated in the town of Marlborough, in Middlesex County. The town has a population of approximately 1,500 people, and is located about 20 miles east of Hartford, the state capital.
History
The area that is now Terramuggus was originally inhabited by the Wangunk Native American tribe. The first European settlers arrived in the area in the early 1700s, and the town was officially incorporated in 1786. The town was named after the Wangunk chief, Terramuggus, who was a leader of the tribe.
The town was primarily an agricultural community for much of its history, with the main crops being corn, wheat, and hay. In the late 1800s, the town began to develop a small manufacturing industry, with several small factories producing textiles, paper, and other goods.
Geography
Terramuggus is located in the eastern part of Connecticut, in the town of Marlborough. It is situated on the banks of the Connecticut River, and is bordered by the towns of East Hampton, Hebron, and Colchester. The town has a total area of 4.2 square miles, with 0.2 square miles of water.
The terrain of the town is mostly flat, with some rolling hills in the northern part of the town. The highest point in the town is located at an elevation of 545 feet. The town is located in a temperate climate, with hot summers and cold winters.
Economy
The economy of Terramuggus is primarily based on agriculture and manufacturing. The town is home to several small farms, which produce corn, wheat, hay, and other crops. The town also has several small factories, which produce textiles, paper, and other goods.
In addition, the town is home to several small businesses, including restaurants, retail stores, and service providers. The town also has a small tourism industry, with several bed and breakfasts and other attractions.
Demographics
As of the 2010 census, the population of Terramuggus was 1,500 people. The racial makeup of the town was 95.3% White, 1.3% African American, 0.7% Native American, 0.7% Asian, and 1.7% from other races. The median household income was $60,000, and the median family income was $68,000.
The town has a high rate of homeownership, with over 80% of the population owning their own homes. The town also has a high rate of educational attainment, with over 90% of the population having at least a high school diploma.
Conclusion
Terramuggus is a small town located in the state of Connecticut, in the United States. It has a population of approximately 1,500 people, and is located about 20 miles east of Hartford, the state capital. The town has a long history, and is primarily an agricultural and manufacturing community. The town has a high rate of homeownership and educational attainment, and is home to several small businesses.
Common Questions
What is Per Capita Income in Terramuggus?
Per Capita income in Terramuggus is $56,838.
What is the Median Family Income in Terramuggus?
Median Family Income in Terramuggus is $134,286.
What is the Median Household income in Terramuggus?
Median Household Income in Terramuggus is $133,482.
What is Income or Wage Gap in Terramuggus?
Income or Wage Gap in Terramuggus is 43.4%.
Women in Terramuggus earn 56.6 cents for every dollar earned by a man.
What is Inequality or Gini Index in Terramuggus?
Inequality or Gini Index in Terramuggus is 0.35.
What is the Total Population of Terramuggus?
Total Population of Terramuggus is 778.
What is the Total Male Population of Terramuggus?
Total Male Population of Terramuggus is 357.
What is the Total Female Population of Terramuggus?
Total Female Population of Terramuggus is 421.
What is the Ratio of Males per 100 Females in Terramuggus?
There are 84.80 Males per 100 Females in Terramuggus.
What is the Ratio of Females per 100 Males in Terramuggus?
There are 117.93 Females per 100 Males in Terramuggus.
What is the Median Population Age in Terramuggus?
Median Population Age in Terramuggus is 51.5 Years.
What is the Average Family Size in Terramuggus
Average Family Size in Terramuggus is 2.5 People.
What is the Average Household Size in Terramuggus
Average Household Size in Terramuggus is 2.5 People.
How Large is the Labor Force in Terramuggus?
There are 458 People in the Labor Forcein in Terramuggus.
What is the Percentage of People in the Labor Force in Terramuggus?
65.1% of People are in the Labor Force in Terramuggus.
What is the Unemployment Rate in Terramuggus?
Unemployment Rate in Terramuggus is 4.1%.