Northwest Harwinton, CT Map & Demographics
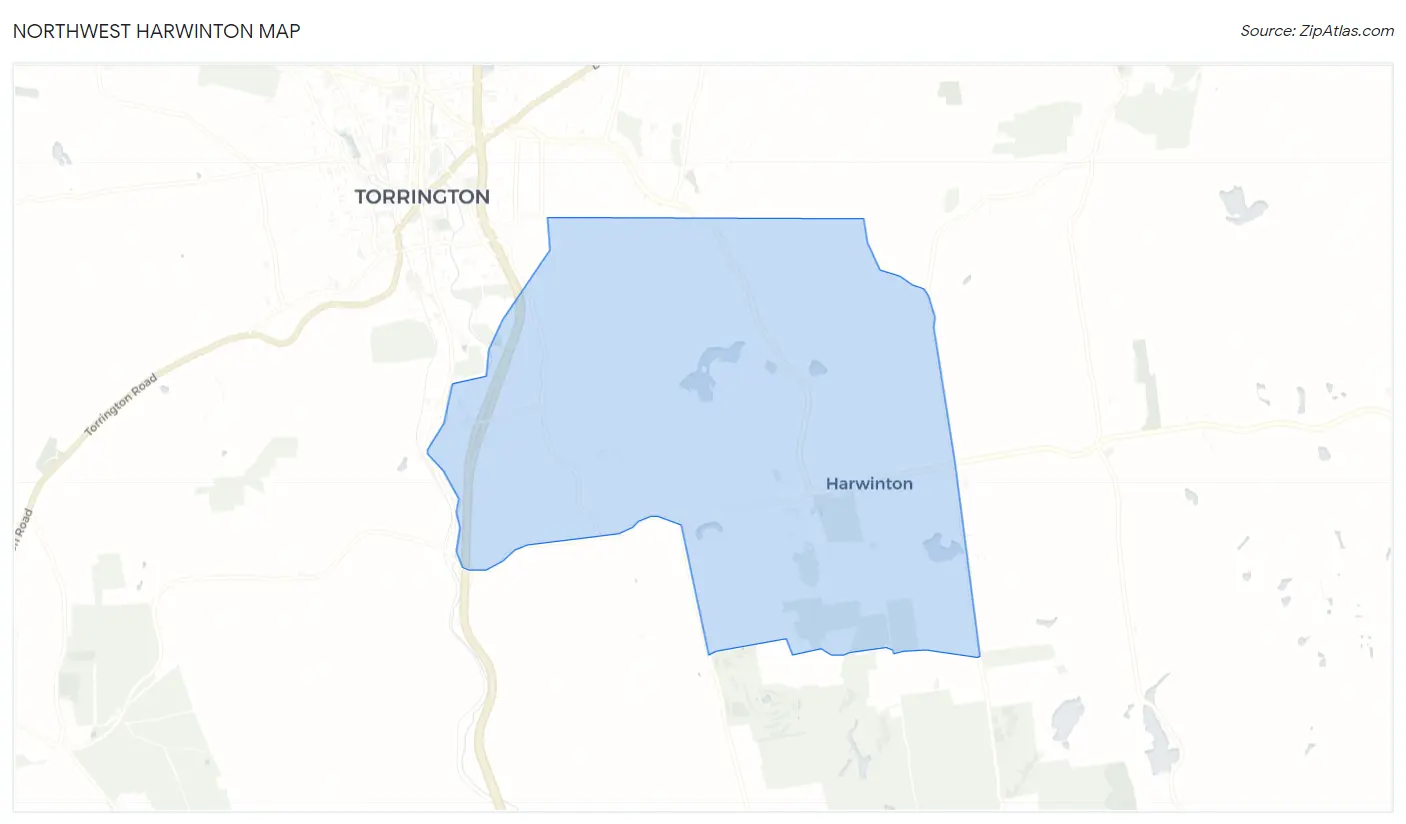
Northwest Harwinton Map
Northwest Harwinton Overview
$48,836
PER CAPITA INCOME
$93,950
AVG FAMILY INCOME
$93,521
AVG HOUSEHOLD INCOME
22.1%
WAGE / INCOME GAP [ % ]
77.9¢/ $1
WAGE / INCOME GAP [ $ ]
0.37
INEQUALITY / GINI INDEX
3,202
TOTAL POPULATION
1,713
MALE POPULATION
1,489
FEMALE POPULATION
115.04
MALES / 100 FEMALES
86.92
FEMALES / 100 MALES
47.0
MEDIAN AGE
2.8
AVG FAMILY SIZE
2.4
AVG HOUSEHOLD SIZE
1,705
LABOR FORCE [ PEOPLE ]
67.9%
PERCENT IN LABOR FORCE
4.5%
UNEMPLOYMENT RATE
Income in Northwest Harwinton
Income Overview in Northwest Harwinton
Per Capita Income in Northwest Harwinton is $48,836, while median incomes of families and households are $93,950 and $93,521 respectively.
| Characteristic | Number | Measure |
| Per Capita Income | 3,202 | $48,836 |
| Median Family Income | 922 | $93,950 |
| Mean Family Income | 922 | $124,522 |
| Median Household Income | 1,315 | $93,521 |
| Mean Household Income | 1,315 | $120,852 |
| Income Deficit | 922 | $0 |
| Wage / Income Gap (%) | 3,202 | 22.12% |
| Wage / Income Gap ($) | 3,202 | 77.88¢ per $1 |
| Gini / Inequality Index | 3,202 | 0.37 |
Earnings by Sex in Northwest Harwinton
Average Earnings in Northwest Harwinton are $57,357, $65,375 for men and $50,912 for women, a difference of 22.1%.
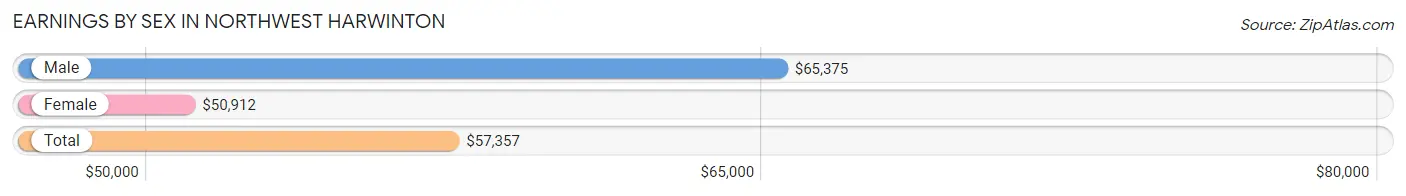
| Sex | Number | Average Earnings |
| Male | 923 (51.9%) | $65,375 |
| Female | 855 (48.1%) | $50,912 |
| Total | 1,778 (100.0%) | $57,357 |
Earnings by Sex by Income Bracket in Northwest Harwinton
The most common earnings brackets in Northwest Harwinton are $100,000+ for men (224 | 24.3%) and $100,000+ for women (112 | 13.1%).
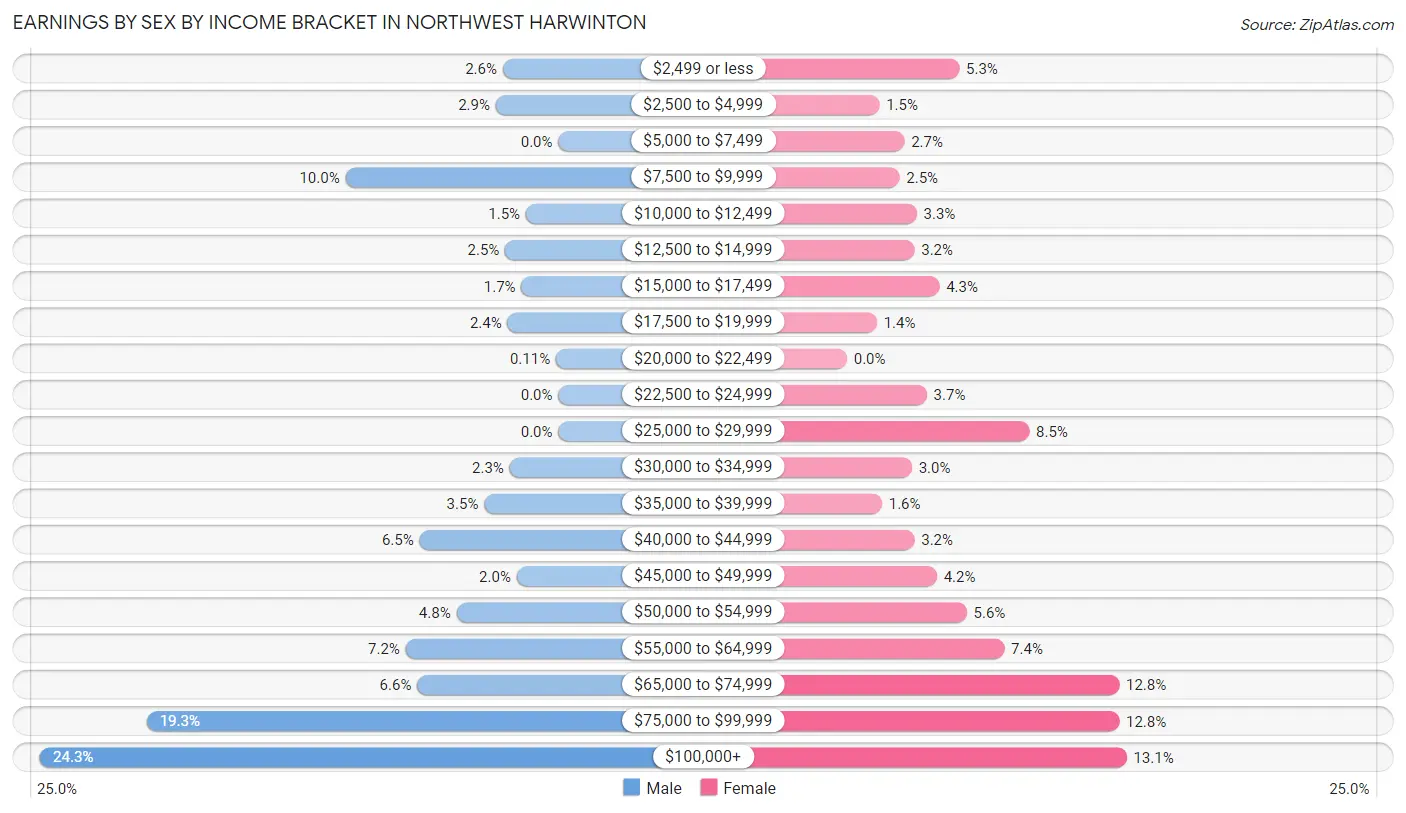
| Income | Male | Female |
| $2,499 or less | 24 (2.6%) | 45 (5.3%) |
| $2,500 to $4,999 | 27 (2.9%) | 13 (1.5%) |
| $5,000 to $7,499 | 0 (0.0%) | 23 (2.7%) |
| $7,500 to $9,999 | 92 (10.0%) | 21 (2.5%) |
| $10,000 to $12,499 | 14 (1.5%) | 28 (3.3%) |
| $12,500 to $14,999 | 23 (2.5%) | 27 (3.2%) |
| $15,000 to $17,499 | 16 (1.7%) | 37 (4.3%) |
| $17,500 to $19,999 | 22 (2.4%) | 12 (1.4%) |
| $20,000 to $22,499 | 1 (0.1%) | 0 (0.0%) |
| $22,500 to $24,999 | 0 (0.0%) | 32 (3.7%) |
| $25,000 to $29,999 | 0 (0.0%) | 73 (8.5%) |
| $30,000 to $34,999 | 21 (2.3%) | 26 (3.0%) |
| $35,000 to $39,999 | 32 (3.5%) | 14 (1.6%) |
| $40,000 to $44,999 | 60 (6.5%) | 27 (3.2%) |
| $45,000 to $49,999 | 18 (1.9%) | 36 (4.2%) |
| $50,000 to $54,999 | 44 (4.8%) | 48 (5.6%) |
| $55,000 to $64,999 | 66 (7.1%) | 63 (7.4%) |
| $65,000 to $74,999 | 61 (6.6%) | 109 (12.8%) |
| $75,000 to $99,999 | 178 (19.3%) | 109 (12.8%) |
| $100,000+ | 224 (24.3%) | 112 (13.1%) |
| Total | 923 (100.0%) | 855 (100.0%) |
Earnings by Sex by Educational Attainment in Northwest Harwinton
Average earnings in Northwest Harwinton are $76,550 for men and $54,205 for women, a difference of 29.2%. Men with an educational attainment of bachelor's degree enjoy the highest average annual earnings of $113,500, while those with high school diploma education earn the least with $54,569. Women with an educational attainment of graduate degree earn the most with the average annual earnings of $87,750, while those with college or associate's degree education have the smallest earnings of $55,804.
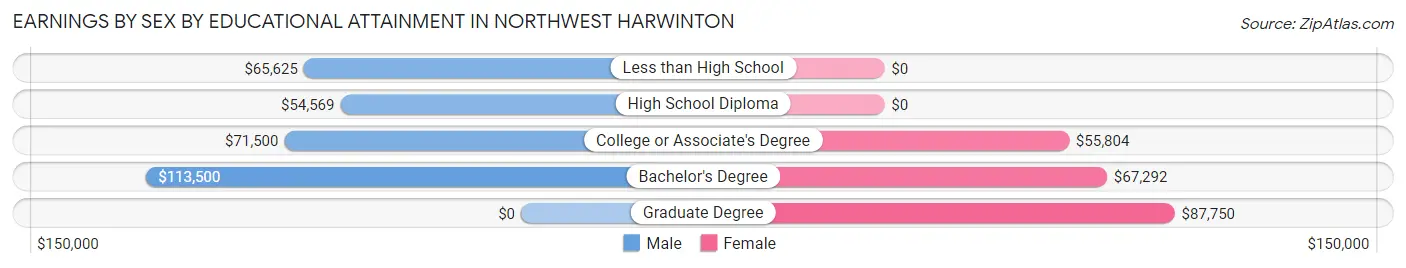
| Educational Attainment | Male Income | Female Income |
| Less than High School | $65,625 | $0 |
| High School Diploma | $54,569 | $0 |
| College or Associate's Degree | $71,500 | $55,804 |
| Bachelor's Degree | $113,500 | $67,292 |
| Graduate Degree | - | - |
| Total | $76,550 | $54,205 |
Family Income in Northwest Harwinton
Family Income Brackets in Northwest Harwinton
According to the Northwest Harwinton family income data, there are 246 families falling into the $50,000 to $74,999 income range, which is the most common income bracket and makes up 26.7% of all families.
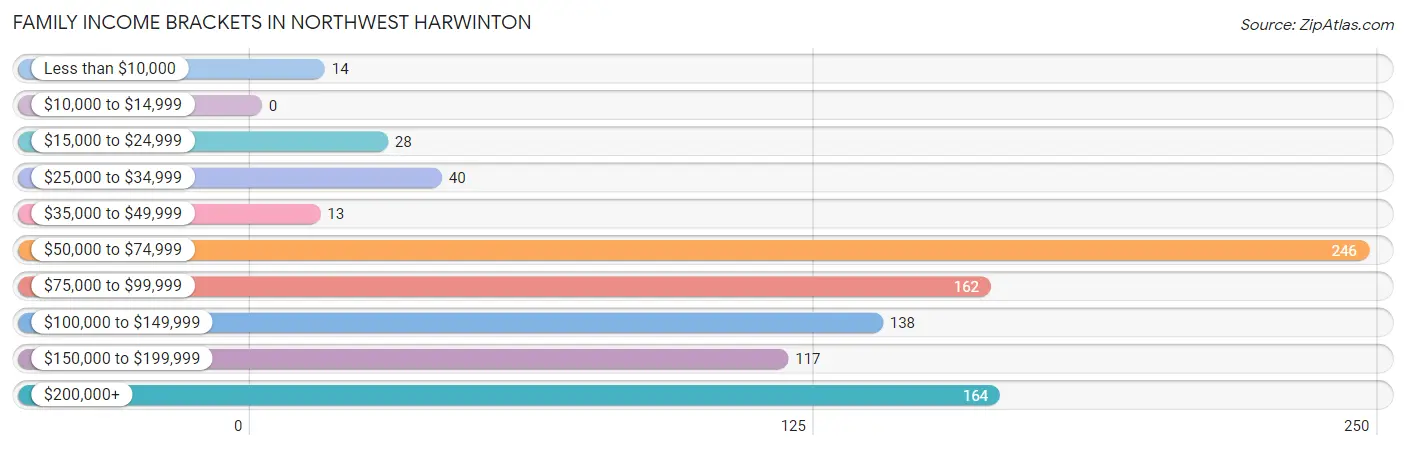
| Income Bracket | # Families | % Families |
| Less than $10,000 | 14 | 1.5% |
| $10,000 to $14,999 | 0 | 0.0% |
| $15,000 to $24,999 | 28 | 3.0% |
| $25,000 to $34,999 | 40 | 4.3% |
| $35,000 to $49,999 | 13 | 1.4% |
| $50,000 to $74,999 | 246 | 26.7% |
| $75,000 to $99,999 | 162 | 17.6% |
| $100,000 to $149,999 | 138 | 15.0% |
| $150,000 to $199,999 | 117 | 12.7% |
| $200,000+ | 164 | 17.8% |
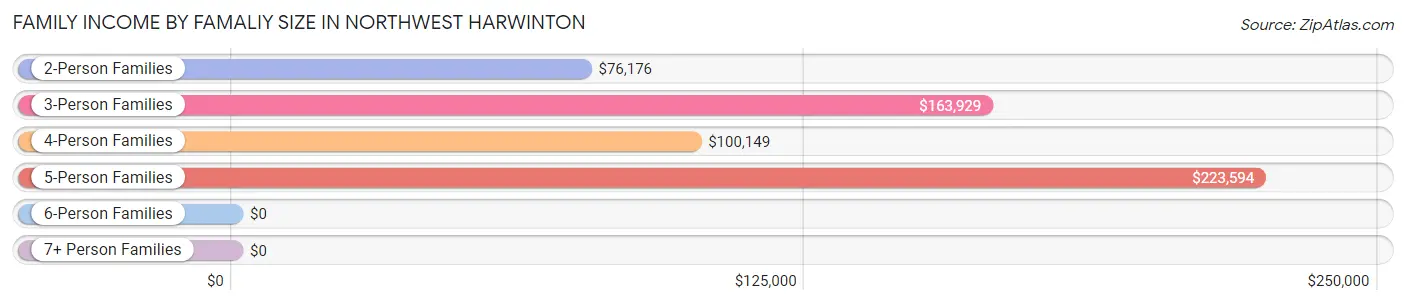
Family Income by Famaliy Size in Northwest Harwinton
5-person families (33 | 3.6%) account for the highest median family income in Northwest Harwinton with $223,594 per family, while 3-person families (154 | 16.7%) have the highest median income of $54,643 per family member.
| Income Bracket | # Families | Median Income |
| 2-Person Families | 462 (50.1%) | $76,176 |
| 3-Person Families | 154 (16.7%) | $163,929 |
| 4-Person Families | 267 (29.0%) | $100,149 |
| 5-Person Families | 33 (3.6%) | $223,594 |
| 6-Person Families | 6 (0.6%) | $0 |
| 7+ Person Families | 0 (0.0%) | $0 |
| Total | 922 (100.0%) | $93,950 |
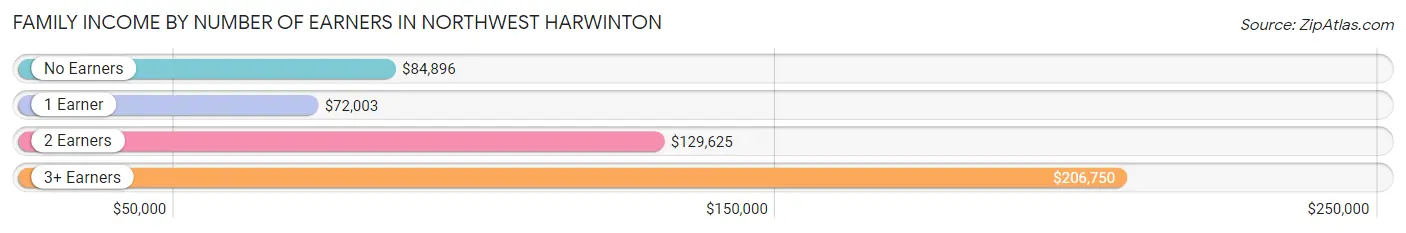
Family Income by Number of Earners in Northwest Harwinton
The median family income in Northwest Harwinton is $93,950, with families comprising 3+ earners (127) having the highest median family income of $206,750, while families with 1 earner (445) have the lowest median family income of $72,003, accounting for 13.8% and 48.3% of families, respectively.
| Number of Earners | # Families | Median Income |
| No Earners | 95 (10.3%) | $84,896 |
| 1 Earner | 445 (48.3%) | $72,003 |
| 2 Earners | 255 (27.7%) | $129,625 |
| 3+ Earners | 127 (13.8%) | $206,750 |
| Total | 922 (100.0%) | $93,950 |
Household Income in Northwest Harwinton
Household Income Brackets in Northwest Harwinton
With 302 households falling in the category, the $50,000 to $74,999 income range is the most frequent in Northwest Harwinton, accounting for 23.0% of all households.
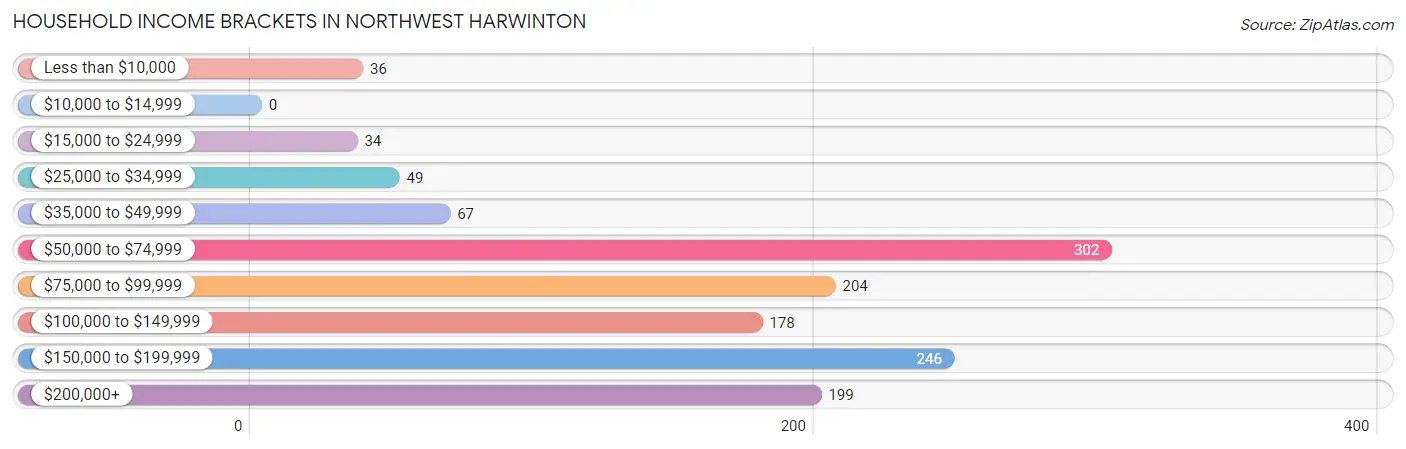
| Income Bracket | # Households | % Households |
| Less than $10,000 | 36 | 2.7% |
| $10,000 to $14,999 | 0 | 0.0% |
| $15,000 to $24,999 | 34 | 2.6% |
| $25,000 to $34,999 | 49 | 3.7% |
| $35,000 to $49,999 | 67 | 5.1% |
| $50,000 to $74,999 | 302 | 23.0% |
| $75,000 to $99,999 | 204 | 15.5% |
| $100,000 to $149,999 | 178 | 13.5% |
| $150,000 to $199,999 | 246 | 18.7% |
| $200,000+ | 199 | 15.1% |
Household Income by Householder Age in Northwest Harwinton
The median household income in Northwest Harwinton is $93,521, with the highest median household income of $134,167 found in the 45 to 64 years age bracket for the primary householder. A total of 596 households (45.3%) fall into this category. Meanwhile, the 15 to 24 years age bracket for the primary householder has the lowest median household income of $0, with 14 households (1.1%) in this group.
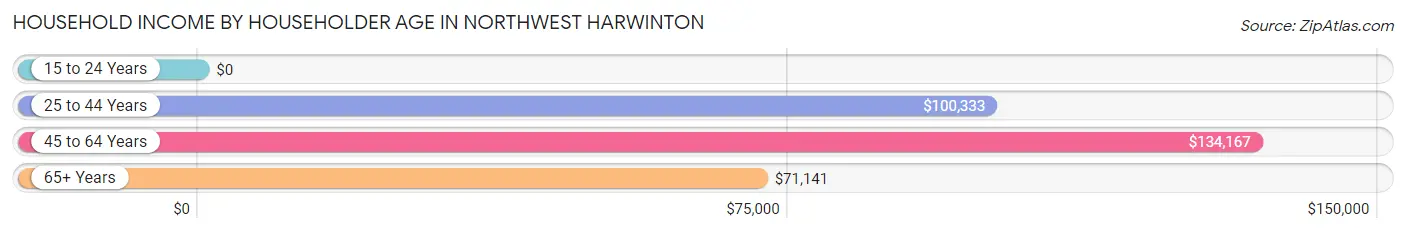
| Income Bracket | # Households | Median Income |
| 15 to 24 Years | 14 (1.1%) | $0 |
| 25 to 44 Years | 302 (23.0%) | $100,333 |
| 45 to 64 Years | 596 (45.3%) | $134,167 |
| 65+ Years | 403 (30.6%) | $71,141 |
| Total | 1,315 (100.0%) | $93,521 |
Poverty in Northwest Harwinton
Income Below Poverty by Sex and Age in Northwest Harwinton
With 4.3% poverty level for males and 4.4% for females among the residents of Northwest Harwinton, 25 to 34 year old males and 16 and 17 year old females are the most vulnerable to poverty, with 18 males (18.2%) and 12 females (100.0%) in their respective age groups living below the poverty level.
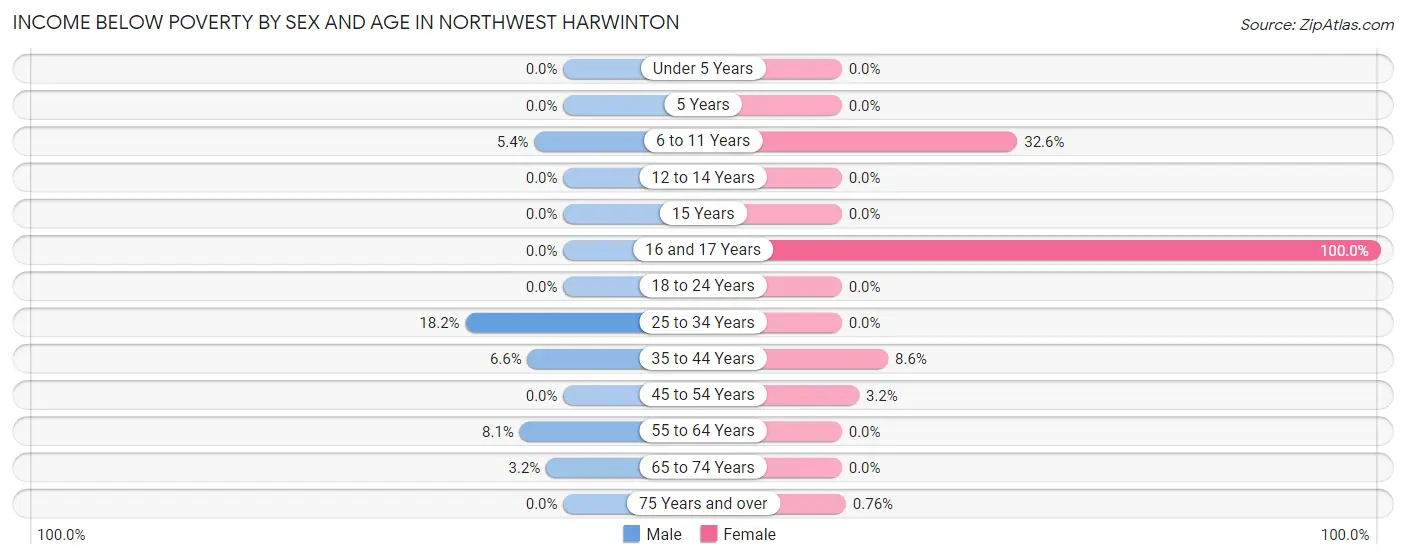
| Age Bracket | Male | Female |
| Under 5 Years | 0 (0.0%) | 0 (0.0%) |
| 5 Years | 0 (0.0%) | 0 (0.0%) |
| 6 to 11 Years | 13 (5.4%) | 29 (32.6%) |
| 12 to 14 Years | 0 (0.0%) | 0 (0.0%) |
| 15 Years | 0 (0.0%) | 0 (0.0%) |
| 16 and 17 Years | 0 (0.0%) | 12 (100.0%) |
| 18 to 24 Years | 0 (0.0%) | 0 (0.0%) |
| 25 to 34 Years | 18 (18.2%) | 0 (0.0%) |
| 35 to 44 Years | 14 (6.6%) | 14 (8.6%) |
| 45 to 54 Years | 0 (0.0%) | 9 (3.2%) |
| 55 to 64 Years | 23 (8.1%) | 0 (0.0%) |
| 65 to 74 Years | 6 (3.2%) | 0 (0.0%) |
| 75 Years and over | 0 (0.0%) | 1 (0.8%) |
| Total | 74 (4.3%) | 65 (4.4%) |
Income Above Poverty by Sex and Age in Northwest Harwinton
According to the poverty statistics in Northwest Harwinton, males aged under 5 years and females aged under 5 years are the age groups that are most secure financially, with 100.0% of males and 100.0% of females in these age groups living above the poverty line.
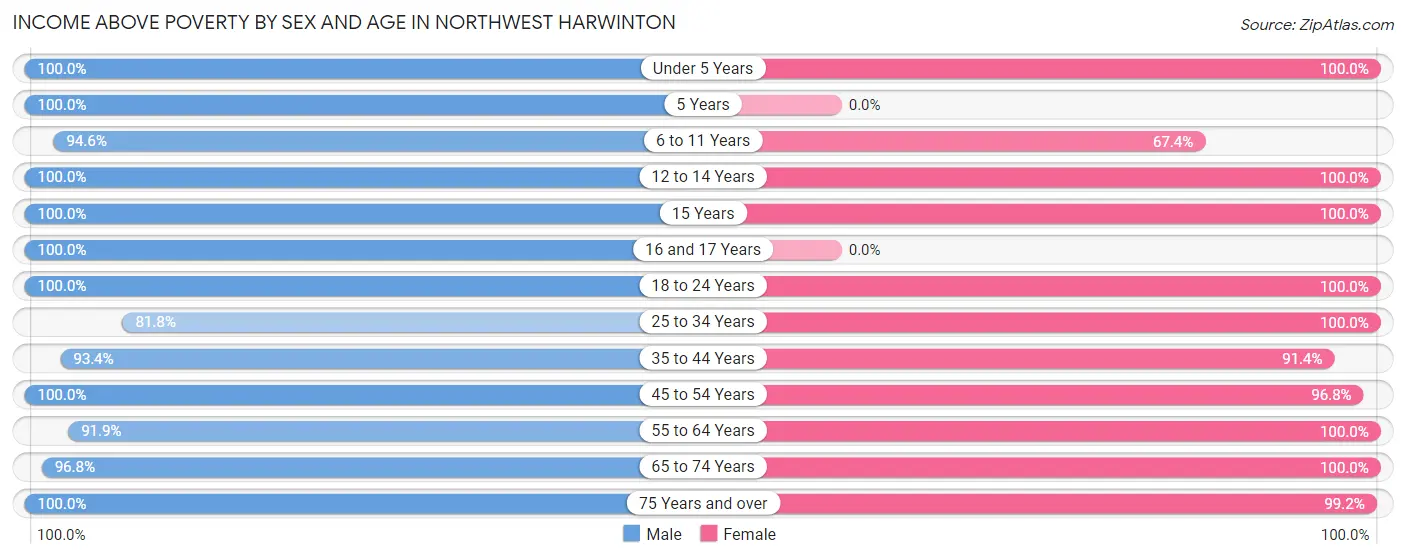
| Age Bracket | Male | Female |
| Under 5 Years | 17 (100.0%) | 33 (100.0%) |
| 5 Years | 5 (100.0%) | 0 (0.0%) |
| 6 to 11 Years | 229 (94.6%) | 60 (67.4%) |
| 12 to 14 Years | 125 (100.0%) | 114 (100.0%) |
| 15 Years | 12 (100.0%) | 38 (100.0%) |
| 16 and 17 Years | 36 (100.0%) | 0 (0.0%) |
| 18 to 24 Years | 149 (100.0%) | 50 (100.0%) |
| 25 to 34 Years | 81 (81.8%) | 101 (100.0%) |
| 35 to 44 Years | 197 (93.4%) | 149 (91.4%) |
| 45 to 54 Years | 194 (100.0%) | 274 (96.8%) |
| 55 to 64 Years | 261 (91.9%) | 250 (100.0%) |
| 65 to 74 Years | 182 (96.8%) | 221 (100.0%) |
| 75 Years and over | 138 (100.0%) | 130 (99.2%) |
| Total | 1,626 (95.7%) | 1,420 (95.6%) |
Income Below Poverty Among Married-Couple Families in Northwest Harwinton
The poverty statistics for married-couple families in Northwest Harwinton show that 2.3% or 14 of the total 618 families live below the poverty line. Families with 1 or 2 children have the highest poverty rate of 10.4%, comprising of 14 families. On the other hand, families with no children have the lowest poverty rate of 0.0%, which includes 0 families.

| Children | Above Poverty | Below Poverty |
| No Children | 484 (100.0%) | 0 (0.0%) |
| 1 or 2 Children | 120 (89.5%) | 14 (10.4%) |
| 3 or 4 Children | 0 (0.0%) | 0 (0.0%) |
| 5 or more Children | 0 (0.0%) | 0 (0.0%) |
| Total | 604 (97.7%) | 14 (2.3%) |
Income Below Poverty Among Single-Parent Households in Northwest Harwinton
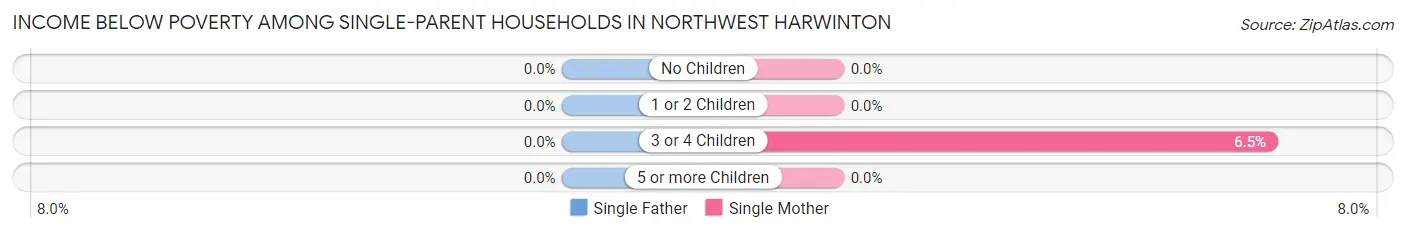
| Children | Single Father | Single Mother |
| No Children | 0 (0.0%) | 0 (0.0%) |
| 1 or 2 Children | 0 (0.0%) | 0 (0.0%) |
| 3 or 4 Children | 0 (0.0%) | 9 (6.5%) |
| 5 or more Children | 0 (0.0%) | 0 (0.0%) |
| Total | 0 (0.0%) | 9 (4.5%) |
Income Below Poverty Among Married-Couple vs Single-Parent Households in Northwest Harwinton
The poverty data for Northwest Harwinton shows that 14 of the married-couple family households (2.3%) and 9 of the single-parent households (3.0%) are living below the poverty level. Within the married-couple family households, those with 1 or 2 children have the highest poverty rate, with 14 households (10.4%) falling below the poverty line. Among the single-parent households, those with 3 or 4 children have the highest poverty rate, with 9 household (5.9%) living below poverty.
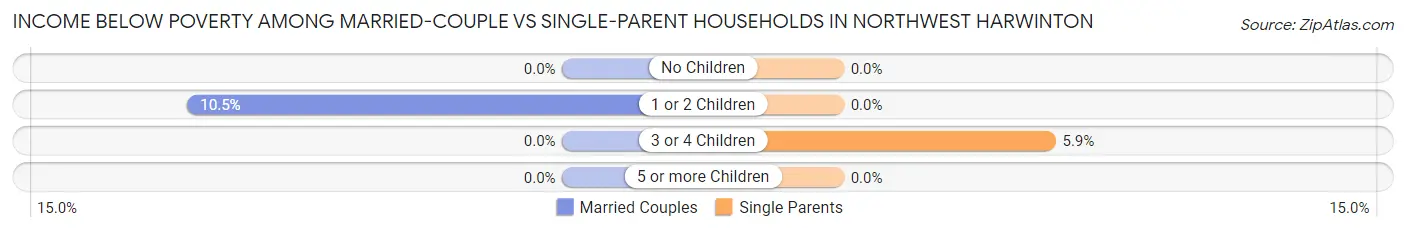
| Children | Married-Couple Families | Single-Parent Households |
| No Children | 0 (0.0%) | 0 (0.0%) |
| 1 or 2 Children | 14 (10.4%) | 0 (0.0%) |
| 3 or 4 Children | 0 (0.0%) | 9 (5.9%) |
| 5 or more Children | 0 (0.0%) | 0 (0.0%) |
| Total | 14 (2.3%) | 9 (3.0%) |
Race in Northwest Harwinton
The most populous races in Northwest Harwinton are White / Caucasian (2,770 | 86.5%), Black / African American (277 | 8.6%), and Hispanic or Latino (214 | 6.7%).
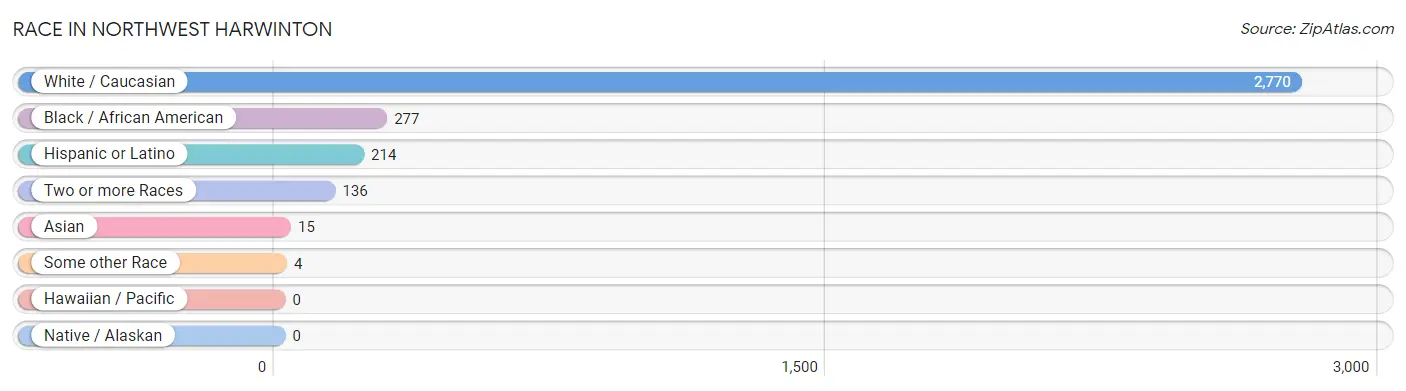
| Race | # Population | % Population |
| Asian | 15 | 0.5% |
| Black / African American | 277 | 8.6% |
| Hawaiian / Pacific | 0 | 0.0% |
| Hispanic or Latino | 214 | 6.7% |
| Native / Alaskan | 0 | 0.0% |
| White / Caucasian | 2,770 | 86.5% |
| Two or more Races | 136 | 4.3% |
| Some other Race | 4 | 0.1% |
| Total | 3,202 | 100.0% |
Ancestry in Northwest Harwinton
The most populous ancestries reported in Northwest Harwinton are Italian (708 | 22.1%), Irish (571 | 17.8%), English (455 | 14.2%), German (437 | 13.7%), and Polish (338 | 10.6%), together accounting for 78.4% of all Northwest Harwinton residents.
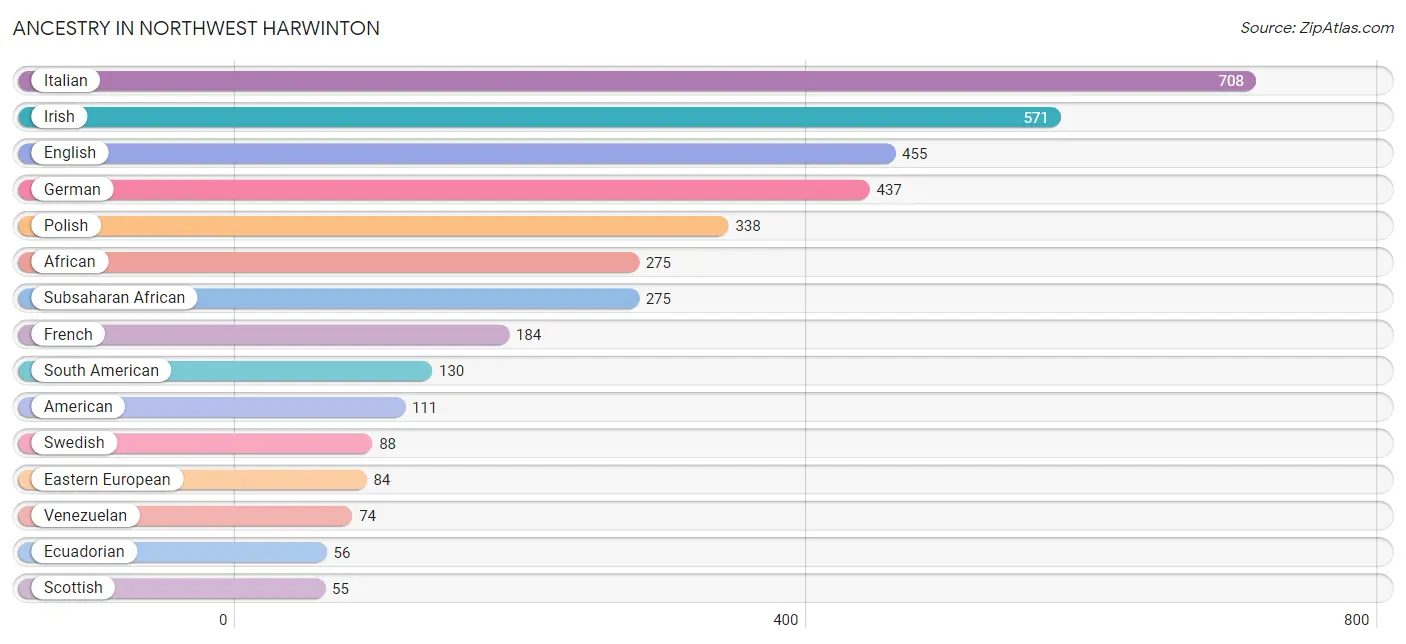
| Ancestry | # Population | % Population |
| African | 275 | 8.6% |
| American | 111 | 3.5% |
| Brazilian | 17 | 0.5% |
| British | 9 | 0.3% |
| Canadian | 7 | 0.2% |
| Cuban | 45 | 1.4% |
| Czech | 15 | 0.5% |
| Czechoslovakian | 10 | 0.3% |
| Danish | 28 | 0.9% |
| Dutch | 12 | 0.4% |
| Eastern European | 84 | 2.6% |
| Ecuadorian | 56 | 1.8% |
| English | 455 | 14.2% |
| European | 16 | 0.5% |
| Finnish | 27 | 0.8% |
| French | 184 | 5.8% |
| French Canadian | 7 | 0.2% |
| German | 437 | 13.7% |
| Hungarian | 7 | 0.2% |
| Irish | 571 | 17.8% |
| Italian | 708 | 22.1% |
| Lithuanian | 19 | 0.6% |
| Mexican | 12 | 0.4% |
| Polish | 338 | 10.6% |
| Portuguese | 7 | 0.2% |
| Puerto Rican | 27 | 0.8% |
| Romanian | 26 | 0.8% |
| Scotch-Irish | 14 | 0.4% |
| Scottish | 55 | 1.7% |
| Slovak | 51 | 1.6% |
| South American | 130 | 4.1% |
| Subsaharan African | 275 | 8.6% |
| Swedish | 88 | 2.8% |
| Swiss | 6 | 0.2% |
| Venezuelan | 74 | 2.3% |
| Welsh | 11 | 0.3% | View All 36 Rows |
Immigrants in Northwest Harwinton
The most numerous immigrant groups reported in Northwest Harwinton came from Latin America (153 | 4.8%), South America (136 | 4.3%), Africa (135 | 4.2%), Ghana (135 | 4.2%), and Western Africa (135 | 4.2%), together accounting for 21.7% of all Northwest Harwinton residents.
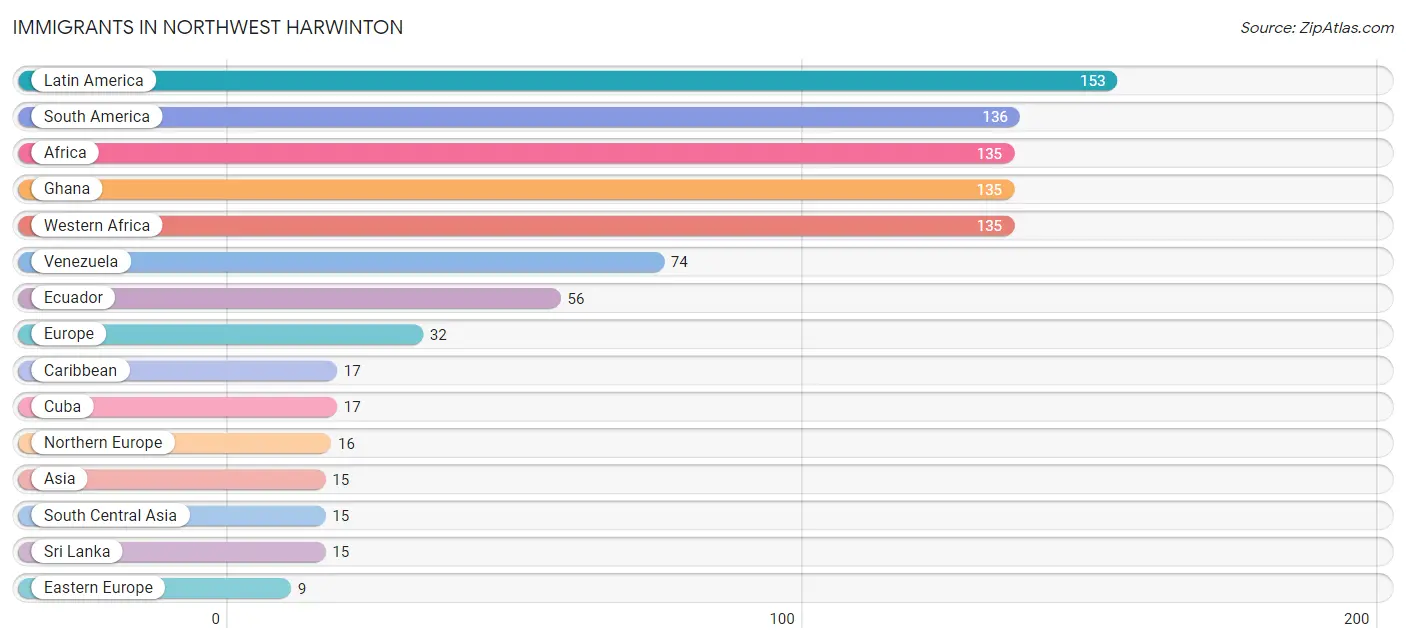
| Immigration Origin | # Population | % Population |
| Africa | 135 | 4.2% |
| Asia | 15 | 0.5% |
| Brazil | 6 | 0.2% |
| Caribbean | 17 | 0.5% |
| Cuba | 17 | 0.5% |
| Eastern Europe | 9 | 0.3% |
| Ecuador | 56 | 1.8% |
| England | 8 | 0.3% |
| Europe | 32 | 1.0% |
| Ghana | 135 | 4.2% |
| Ireland | 8 | 0.3% |
| Latin America | 153 | 4.8% |
| Northern Europe | 16 | 0.5% |
| Poland | 8 | 0.3% |
| Portugal | 7 | 0.2% |
| Russia | 1 | 0.0% |
| South America | 136 | 4.3% |
| South Central Asia | 15 | 0.5% |
| Southern Europe | 7 | 0.2% |
| Sri Lanka | 15 | 0.5% |
| Venezuela | 74 | 2.3% |
| Western Africa | 135 | 4.2% | View All 22 Rows |
Sex and Age in Northwest Harwinton
Sex and Age in Northwest Harwinton
The most populous age groups in Northwest Harwinton are 10 to 14 Years (209 | 12.2%) for men and 10 to 14 Years (172 | 11.6%) for women.
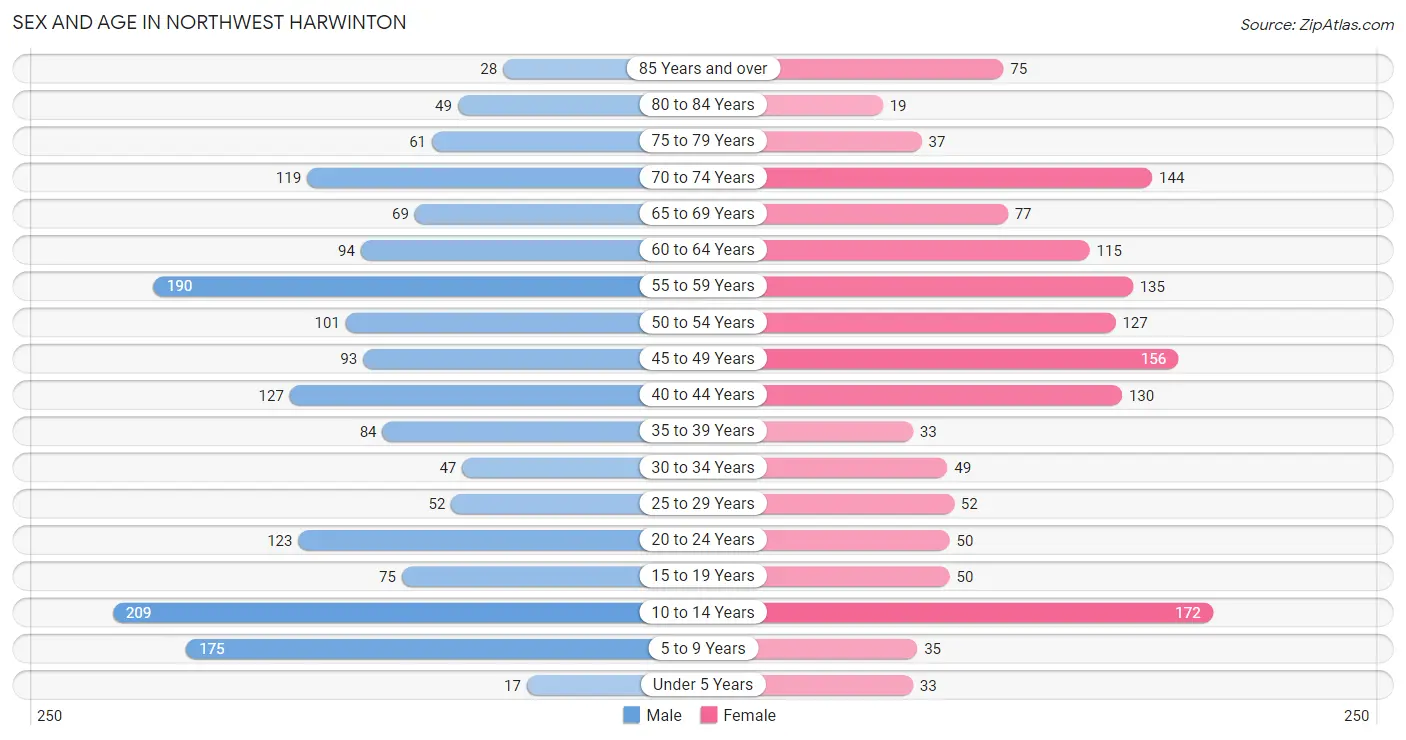
| Age Bracket | Male | Female |
| Under 5 Years | 17 (1.0%) | 33 (2.2%) |
| 5 to 9 Years | 175 (10.2%) | 35 (2.4%) |
| 10 to 14 Years | 209 (12.2%) | 172 (11.6%) |
| 15 to 19 Years | 75 (4.4%) | 50 (3.4%) |
| 20 to 24 Years | 123 (7.2%) | 50 (3.4%) |
| 25 to 29 Years | 52 (3.0%) | 52 (3.5%) |
| 30 to 34 Years | 47 (2.7%) | 49 (3.3%) |
| 35 to 39 Years | 84 (4.9%) | 33 (2.2%) |
| 40 to 44 Years | 127 (7.4%) | 130 (8.7%) |
| 45 to 49 Years | 93 (5.4%) | 156 (10.5%) |
| 50 to 54 Years | 101 (5.9%) | 127 (8.5%) |
| 55 to 59 Years | 190 (11.1%) | 135 (9.1%) |
| 60 to 64 Years | 94 (5.5%) | 115 (7.7%) |
| 65 to 69 Years | 69 (4.0%) | 77 (5.2%) |
| 70 to 74 Years | 119 (7.0%) | 144 (9.7%) |
| 75 to 79 Years | 61 (3.6%) | 37 (2.5%) |
| 80 to 84 Years | 49 (2.9%) | 19 (1.3%) |
| 85 Years and over | 28 (1.6%) | 75 (5.0%) |
| Total | 1,713 (100.0%) | 1,489 (100.0%) |
Families and Households in Northwest Harwinton
Median Family Size in Northwest Harwinton
The median family size in Northwest Harwinton is 2.81 persons per family, with single female/mother families (199 | 21.6%) accounting for the largest median family size of 3.04 persons per family. On the other hand, married-couple families (618 | 67.0%) represent the smallest median family size with 2.73 persons per family.
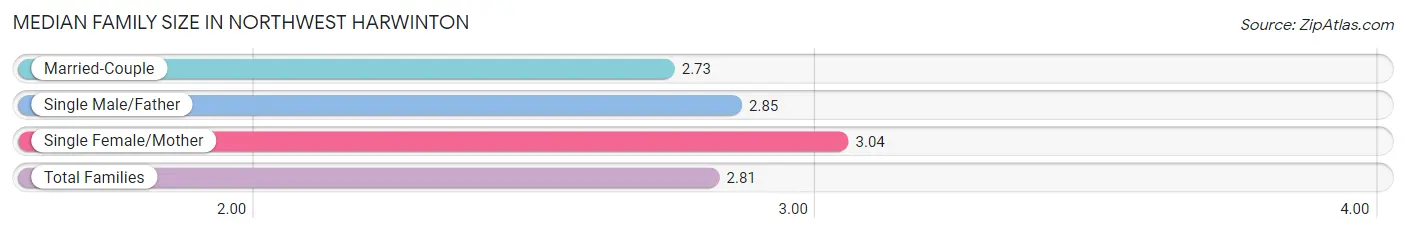
| Family Type | # Families | Family Size |
| Married-Couple | 618 (67.0%) | 2.73 |
| Single Male/Father | 105 (11.4%) | 2.85 |
| Single Female/Mother | 199 (21.6%) | 3.04 |
| Total Families | 922 (100.0%) | 2.81 |
Median Household Size in Northwest Harwinton
The median household size in Northwest Harwinton is 2.42 persons per household, with single female/mother households (199 | 15.1%) accounting for the largest median household size of 3.41 persons per household. non-family households (393 | 29.9%) represent the smallest median household size with 1.31 persons per household.
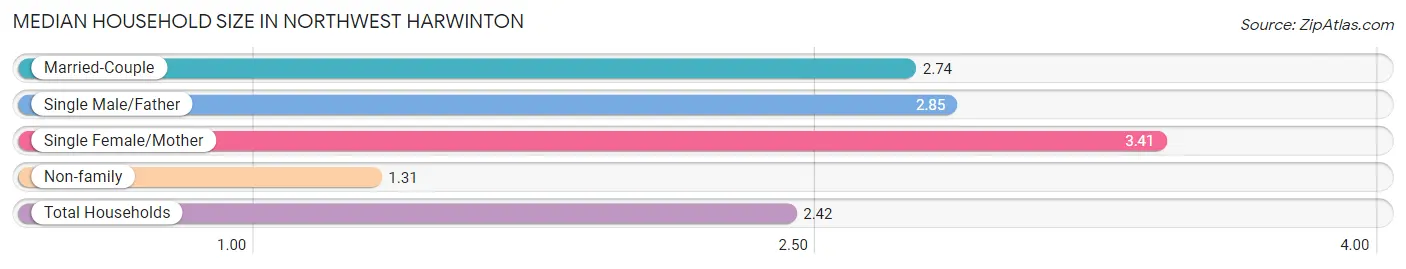
| Household Type | # Households | Household Size |
| Married-Couple | 618 (47.0%) | 2.74 |
| Single Male/Father | 105 (8.0%) | 2.85 |
| Single Female/Mother | 199 (15.1%) | 3.41 |
| Non-family | 393 (29.9%) | 1.31 |
| Total Households | 1,315 (100.0%) | 2.42 |
Household Size by Marriage Status in Northwest Harwinton
Out of a total of 1,315 households in Northwest Harwinton, 922 (70.1%) are family households, while 393 (29.9%) are nonfamily households. The most numerous type of family households are 2-person households, comprising 441, and the most common type of nonfamily households are 1-person households, comprising 283.
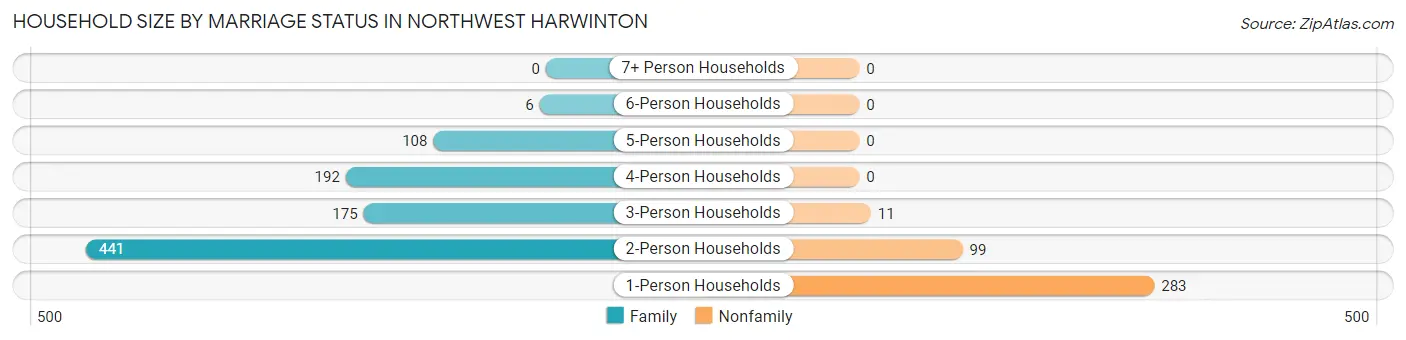
| Household Size | Family Households | Nonfamily Households |
| 1-Person Households | - | 283 (21.5%) |
| 2-Person Households | 441 (33.5%) | 99 (7.5%) |
| 3-Person Households | 175 (13.3%) | 11 (0.8%) |
| 4-Person Households | 192 (14.6%) | 0 (0.0%) |
| 5-Person Households | 108 (8.2%) | 0 (0.0%) |
| 6-Person Households | 6 (0.5%) | 0 (0.0%) |
| 7+ Person Households | 0 (0.0%) | 0 (0.0%) |
| Total | 922 (70.1%) | 393 (29.9%) |
Female Fertility in Northwest Harwinton
Fertility by Age in Northwest Harwinton
Average fertility rate in Northwest Harwinton is 36.0 births per 1,000 women. Women in the age bracket of 20 to 34 years have the highest fertility rate with 126.0 births per 1,000 women. Women in the age bracket of 20 to 34 years acount for 100.0% of all women with births.
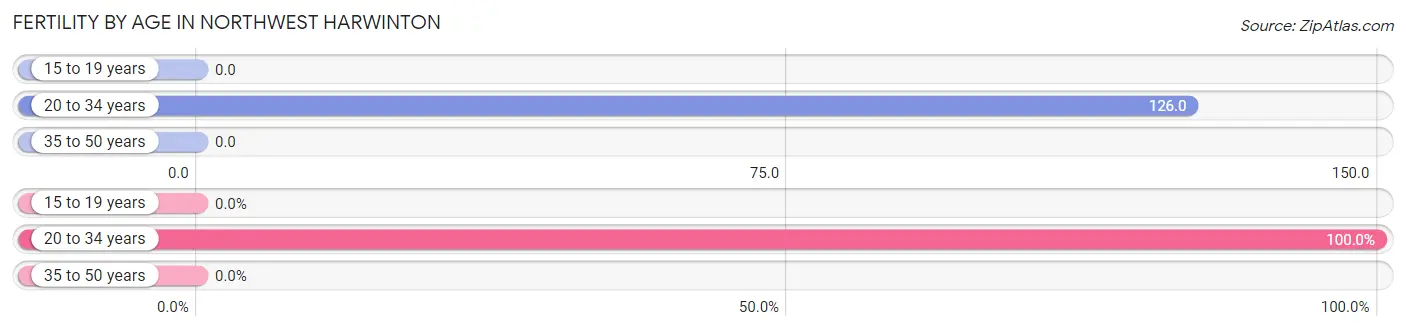
| Age Bracket | Women with Births | Births / 1,000 Women |
| 15 to 19 years | 0 (0.0%) | 0.0 |
| 20 to 34 years | 19 (100.0%) | 126.0 |
| 35 to 50 years | 0 (0.0%) | 0.0 |
| Total | 19 (100.0%) | 36.0 |
Fertility by Age by Marriage Status in Northwest Harwinton
78.9% of women with births (19) in Northwest Harwinton are married. The highest percentage of unmarried women with births falls into 20 to 34 years age bracket with 21.0% of them unmarried at the time of birth, while the lowest percentage of unmarried women with births belong to 20 to 34 years age bracket with 21.1% of them unmarried.
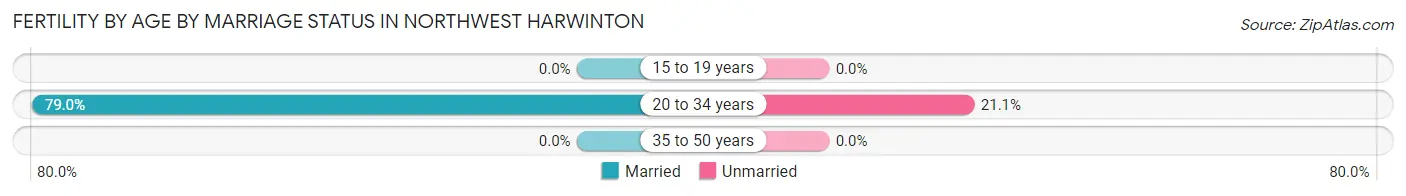
| Age Bracket | Married | Unmarried |
| 15 to 19 years | 0 (0.0%) | 0 (0.0%) |
| 20 to 34 years | 15 (78.9%) | 4 (21.0%) |
| 35 to 50 years | 0 (0.0%) | 0 (0.0%) |
| Total | 15 (78.9%) | 4 (21.0%) |
Fertility by Education in Northwest Harwinton
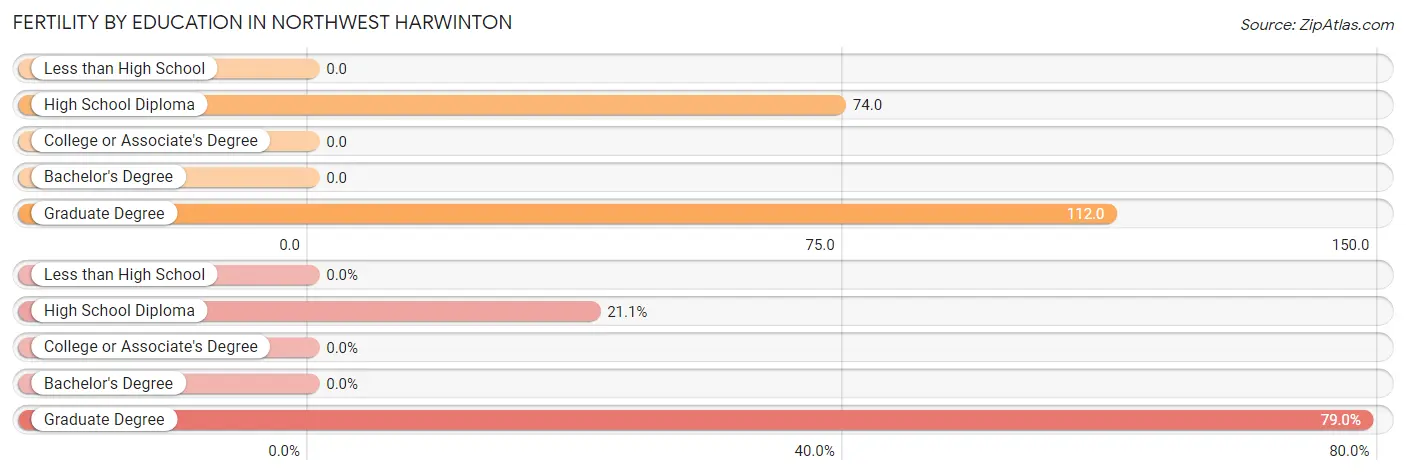
| Educational Attainment | Women with Births | Births / 1,000 Women |
| Less than High School | 0 (0.0%) | 0.0 |
| High School Diploma | 4 (21.0%) | 74.0 |
| College or Associate's Degree | 0 (0.0%) | 0.0 |
| Bachelor's Degree | 0 (0.0%) | 0.0 |
| Graduate Degree | 15 (78.9%) | 112.0 |
| Total | 19 (100.0%) | 36.0 |
Fertility by Education by Marriage Status in Northwest Harwinton
21.0% of women with births in Northwest Harwinton are unmarried. Women with the educational attainment of graduate degree are most likely to be married with 100.0% of them married at childbirth, while women with the educational attainment of high school diploma are least likely to be married with 100.0% of them unmarried at childbirth.
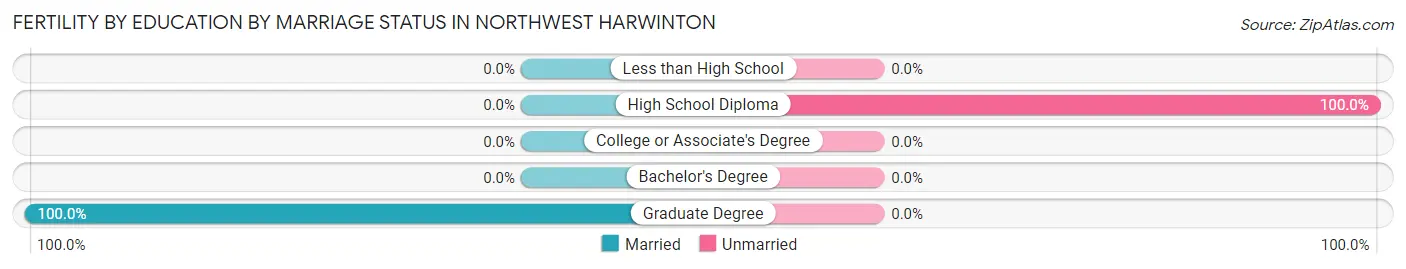
| Educational Attainment | Married | Unmarried |
| Less than High School | 0 (0.0%) | 0 (0.0%) |
| High School Diploma | 0 (0.0%) | 4 (100.0%) |
| College or Associate's Degree | 0 (0.0%) | 0 (0.0%) |
| Bachelor's Degree | 0 (0.0%) | 0 (0.0%) |
| Graduate Degree | 15 (100.0%) | 0 (0.0%) |
| Total | 15 (78.9%) | 4 (21.0%) |
Employment Characteristics in Northwest Harwinton
Employment by Class of Employer in Northwest Harwinton
Among the 1,622 employed individuals in Northwest Harwinton, private company employees (923 | 56.9%), local government employees (264 | 16.3%), and not-for-profit organizations (143 | 8.8%) make up the most common classes of employment.
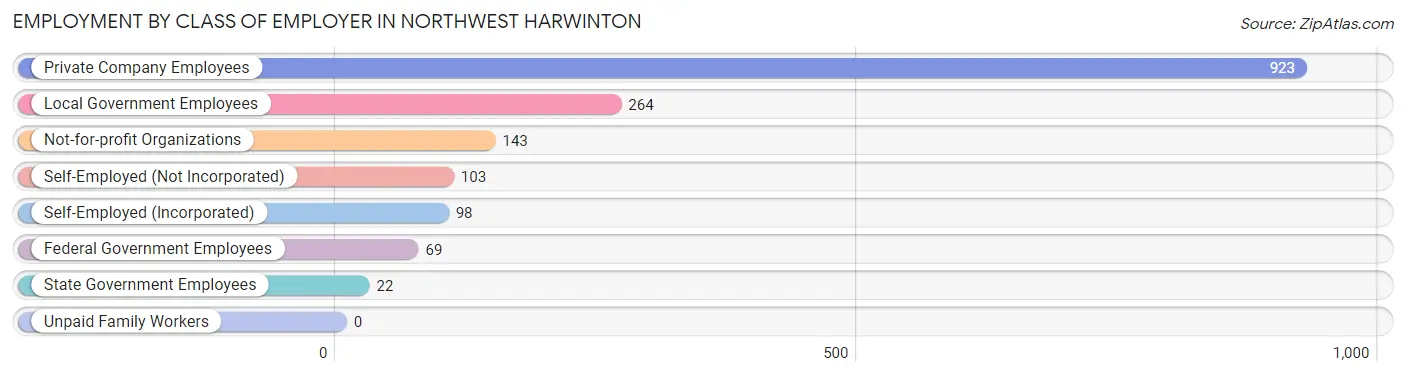
| Employer Class | # Employees | % Employees |
| Private Company Employees | 923 | 56.9% |
| Self-Employed (Incorporated) | 98 | 6.0% |
| Self-Employed (Not Incorporated) | 103 | 6.4% |
| Not-for-profit Organizations | 143 | 8.8% |
| Local Government Employees | 264 | 16.3% |
| State Government Employees | 22 | 1.4% |
| Federal Government Employees | 69 | 4.3% |
| Unpaid Family Workers | 0 | 0.0% |
| Total | 1,622 | 100.0% |
Employment Status by Age in Northwest Harwinton
According to the labor force statistics for Northwest Harwinton, out of the total population over 16 years of age (2,511), 67.9% or 1,705 individuals are in the labor force, with 4.5% or 77 of them unemployed. The age group with the highest labor force participation rate is 30 to 34 years, with 100.0% or 96 individuals in the labor force. Within the labor force, the 16 to 19 years age range has the highest percentage of unemployed individuals, with 47.2% or 17 of them being unemployed.
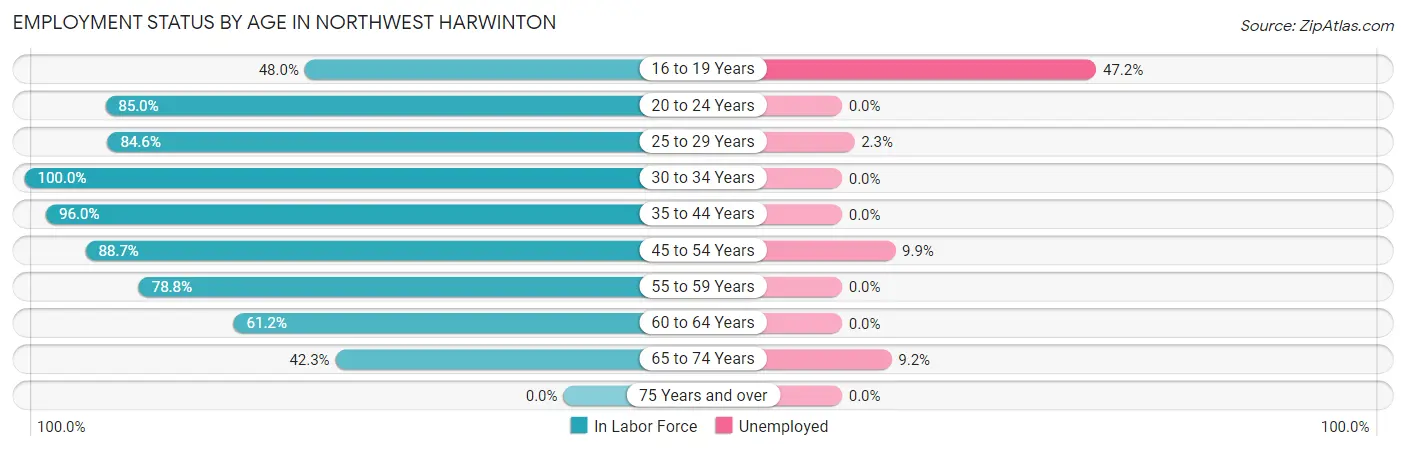
| Age Bracket | In Labor Force | Unemployed |
| 16 to 19 Years | 36 (48.0%) | 17 (47.2%) |
| 20 to 24 Years | 147 (85.0%) | 0 (0.0%) |
| 25 to 29 Years | 88 (84.6%) | 2 (2.3%) |
| 30 to 34 Years | 96 (100.0%) | 0 (0.0%) |
| 35 to 44 Years | 359 (96.0%) | 0 (0.0%) |
| 45 to 54 Years | 423 (88.7%) | 42 (9.9%) |
| 55 to 59 Years | 256 (78.8%) | 0 (0.0%) |
| 60 to 64 Years | 128 (61.2%) | 0 (0.0%) |
| 65 to 74 Years | 173 (42.3%) | 16 (9.2%) |
| 75 Years and over | 0 (0.0%) | 0 (0.0%) |
| Total | 1,705 (67.9%) | 77 (4.5%) |
Employment Status by Educational Attainment in Northwest Harwinton
According to labor force statistics for Northwest Harwinton, 85.2% of individuals (1,350) out of the total population between 25 and 64 years of age (1,585) are in the labor force, with 3.3% or 45 of them being unemployed. The group with the highest labor force participation rate are those with the educational attainment of bachelor's degree or higher, with 87.9% or 586 individuals in the labor force. Within the labor force, individuals with college / associate degree education have the highest percentage of unemployment, with 5.9% or 23 of them being unemployed.
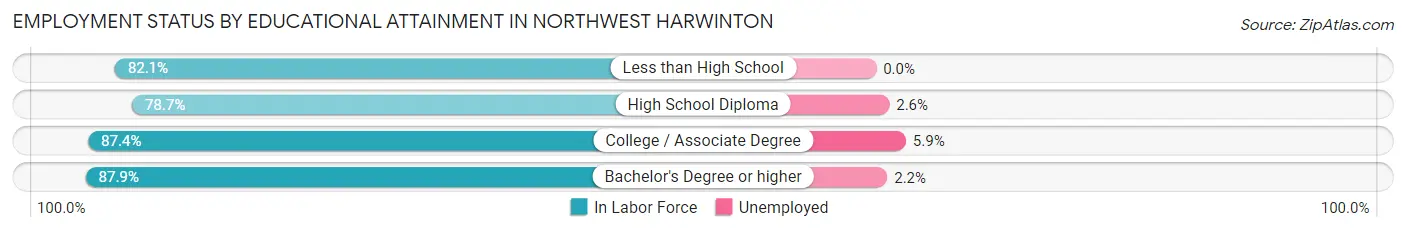
| Educational Attainment | In Labor Force | Unemployed |
| Less than High School | 64 (82.1%) | 0 (0.0%) |
| High School Diploma | 311 (78.7%) | 10 (2.6%) |
| College / Associate Degree | 389 (87.4%) | 26 (5.9%) |
| Bachelor's Degree or higher | 586 (87.9%) | 15 (2.2%) |
| Total | 1,350 (85.2%) | 52 (3.3%) |
Employment Occupations by Sex in Northwest Harwinton
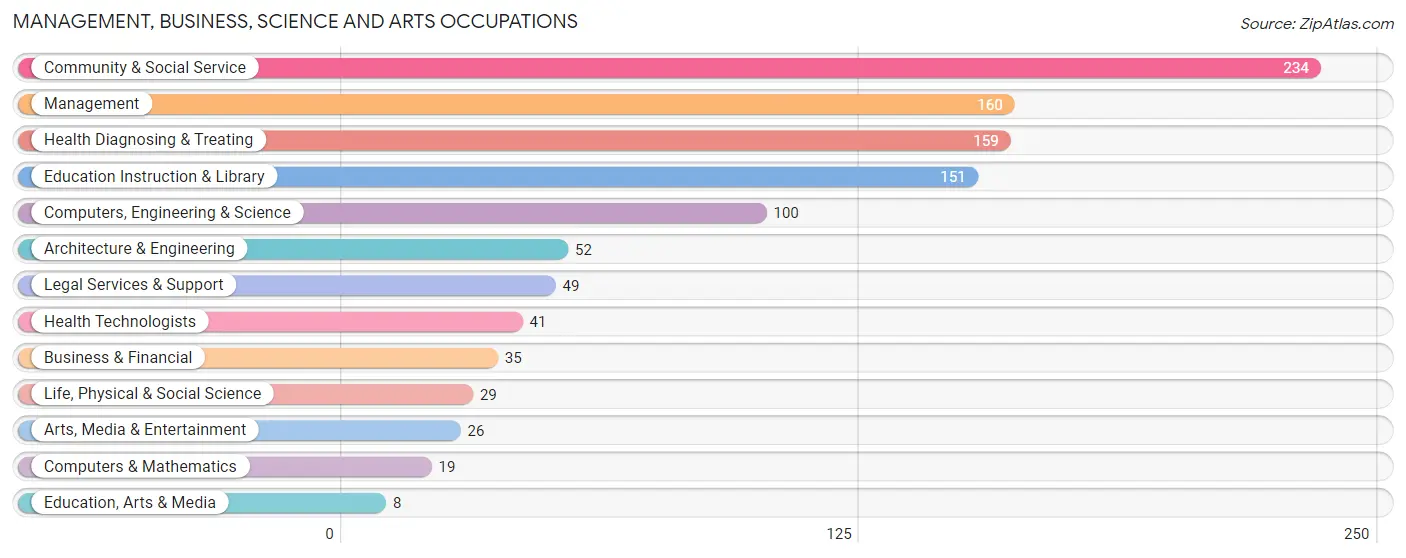
Management, Business, Science and Arts Occupations
The most common Management, Business, Science and Arts occupations in Northwest Harwinton are Community & Social Service (234 | 14.4%), Management (160 | 9.8%), Health Diagnosing & Treating (159 | 9.8%), Education Instruction & Library (151 | 9.3%), and Computers, Engineering & Science (100 | 6.1%).
Management, Business, Science and Arts Occupations by Sex
Within the Management, Business, Science and Arts occupations in Northwest Harwinton, the most male-oriented occupations are Computers, Engineering & Science (100.0%), Computers & Mathematics (100.0%), and Architecture & Engineering (100.0%), while the most female-oriented occupations are Health Technologists (100.0%), Health Diagnosing & Treating (94.3%), and Education Instruction & Library (89.4%).
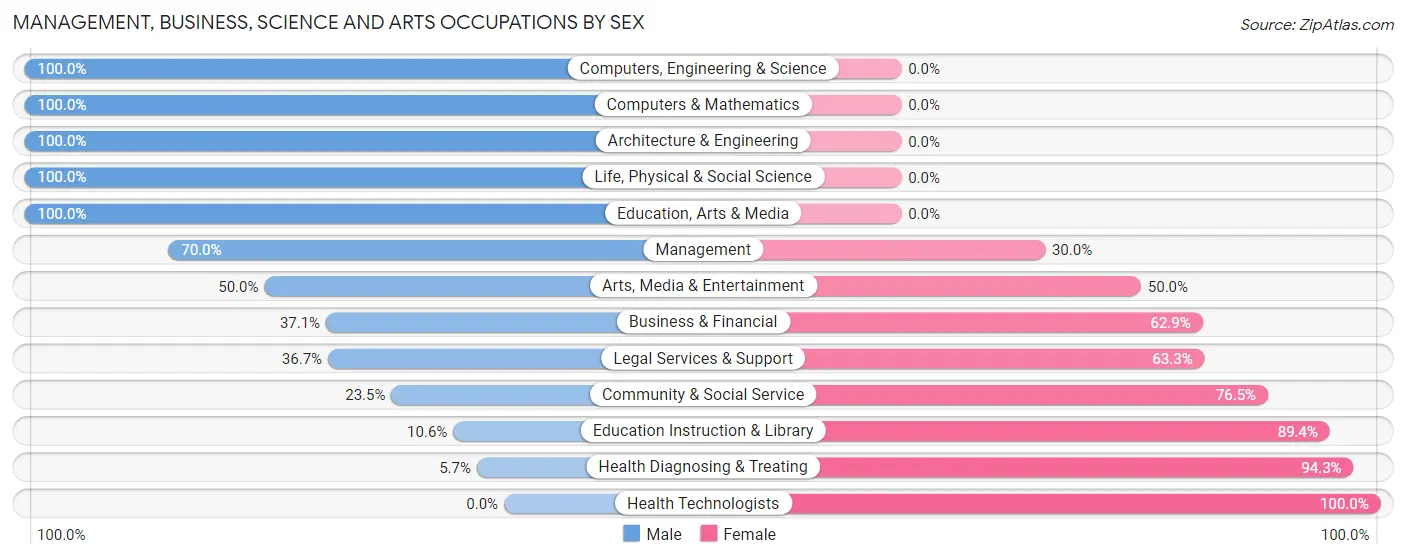
| Occupation | Male | Female |
| Management | 112 (70.0%) | 48 (30.0%) |
| Business & Financial | 13 (37.1%) | 22 (62.9%) |
| Computers, Engineering & Science | 100 (100.0%) | 0 (0.0%) |
| Computers & Mathematics | 19 (100.0%) | 0 (0.0%) |
| Architecture & Engineering | 52 (100.0%) | 0 (0.0%) |
| Life, Physical & Social Science | 29 (100.0%) | 0 (0.0%) |
| Community & Social Service | 55 (23.5%) | 179 (76.5%) |
| Education, Arts & Media | 8 (100.0%) | 0 (0.0%) |
| Legal Services & Support | 18 (36.7%) | 31 (63.3%) |
| Education Instruction & Library | 16 (10.6%) | 135 (89.4%) |
| Arts, Media & Entertainment | 13 (50.0%) | 13 (50.0%) |
| Health Diagnosing & Treating | 9 (5.7%) | 150 (94.3%) |
| Health Technologists | 0 (0.0%) | 41 (100.0%) |
| Total (Category) | 289 (42.0%) | 399 (58.0%) |
| Total (Overall) | 837 (51.4%) | 792 (48.6%) |
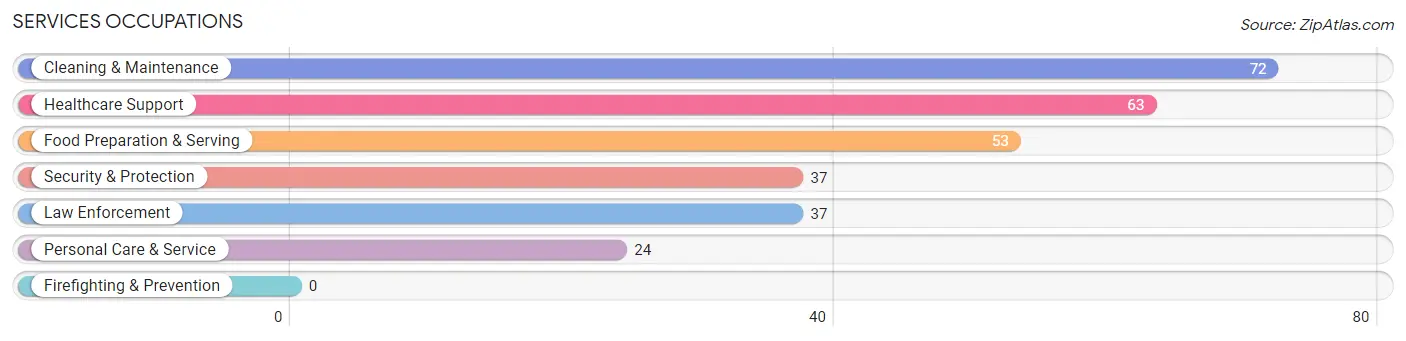
Services Occupations
The most common Services occupations in Northwest Harwinton are Cleaning & Maintenance (72 | 4.4%), Healthcare Support (63 | 3.9%), Food Preparation & Serving (53 | 3.3%), Security & Protection (37 | 2.3%), and Law Enforcement (37 | 2.3%).
Services Occupations by Sex
Within the Services occupations in Northwest Harwinton, the most male-oriented occupations are Cleaning & Maintenance (72.2%), Security & Protection (62.2%), and Law Enforcement (62.2%), while the most female-oriented occupations are Healthcare Support (100.0%), Personal Care & Service (100.0%), and Food Preparation & Serving (50.9%).
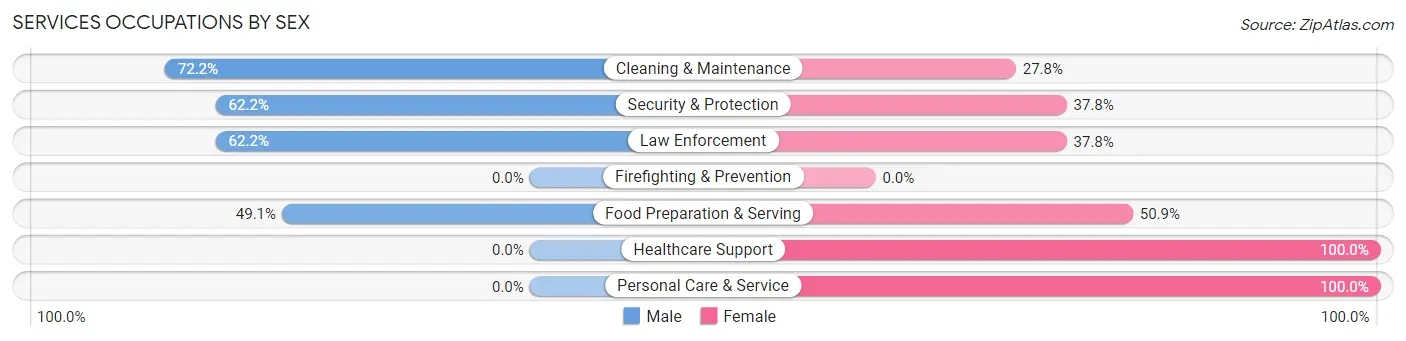
| Occupation | Male | Female |
| Healthcare Support | 0 (0.0%) | 63 (100.0%) |
| Security & Protection | 23 (62.2%) | 14 (37.8%) |
| Firefighting & Prevention | 0 (0.0%) | 0 (0.0%) |
| Law Enforcement | 23 (62.2%) | 14 (37.8%) |
| Food Preparation & Serving | 26 (49.1%) | 27 (50.9%) |
| Cleaning & Maintenance | 52 (72.2%) | 20 (27.8%) |
| Personal Care & Service | 0 (0.0%) | 24 (100.0%) |
| Total (Category) | 101 (40.6%) | 148 (59.4%) |
| Total (Overall) | 837 (51.4%) | 792 (48.6%) |
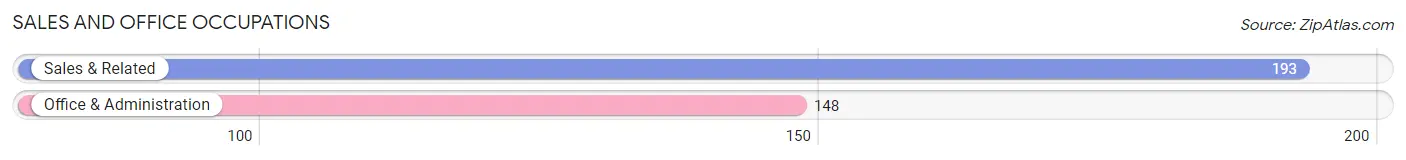
Sales and Office Occupations
The most common Sales and Office occupations in Northwest Harwinton are Sales & Related (193 | 11.8%), and Office & Administration (148 | 9.1%).
Sales and Office Occupations by Sex
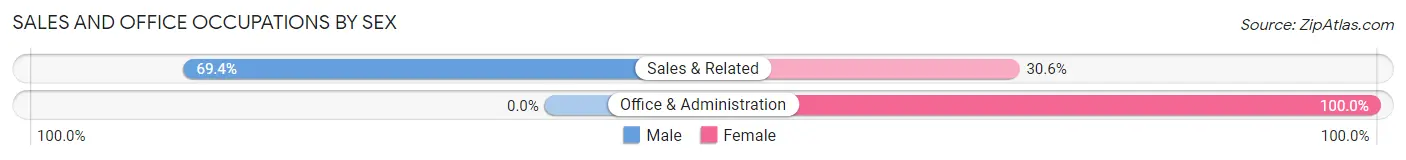
| Occupation | Male | Female |
| Sales & Related | 134 (69.4%) | 59 (30.6%) |
| Office & Administration | 0 (0.0%) | 148 (100.0%) |
| Total (Category) | 134 (39.3%) | 207 (60.7%) |
| Total (Overall) | 837 (51.4%) | 792 (48.6%) |
Natural Resources, Construction and Maintenance Occupations
The most common Natural Resources, Construction and Maintenance occupations in Northwest Harwinton are Installation, Maintenance & Repair (118 | 7.2%), Construction & Extraction (78 | 4.8%), and Farming, Fishing & Forestry (9 | 0.5%).
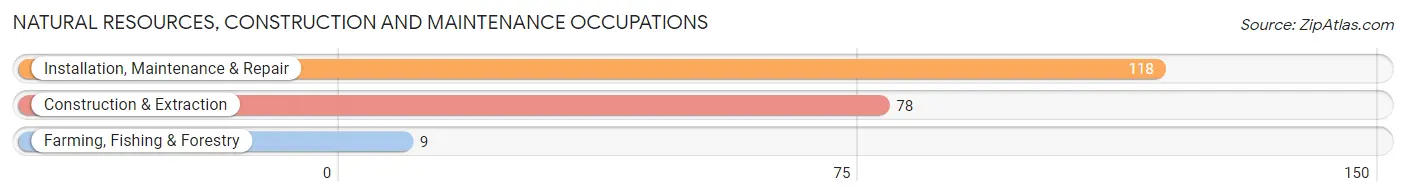
Natural Resources, Construction and Maintenance Occupations by Sex
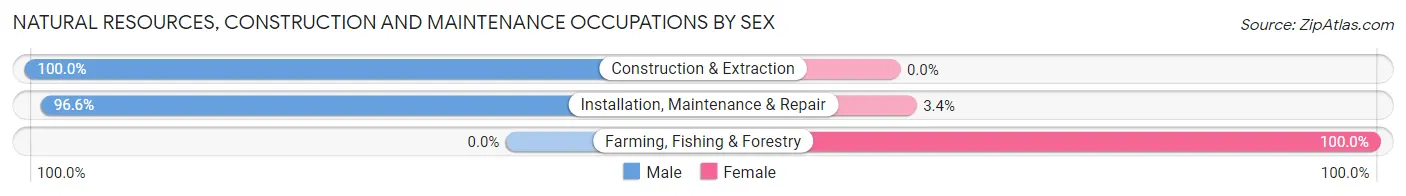
| Occupation | Male | Female |
| Farming, Fishing & Forestry | 0 (0.0%) | 9 (100.0%) |
| Construction & Extraction | 78 (100.0%) | 0 (0.0%) |
| Installation, Maintenance & Repair | 114 (96.6%) | 4 (3.4%) |
| Total (Category) | 192 (93.7%) | 13 (6.3%) |
| Total (Overall) | 837 (51.4%) | 792 (48.6%) |
Production, Transportation and Moving Occupations
The most common Production, Transportation and Moving occupations in Northwest Harwinton are Transportation (86 | 5.3%), Production (46 | 2.8%), and Material Moving (14 | 0.9%).
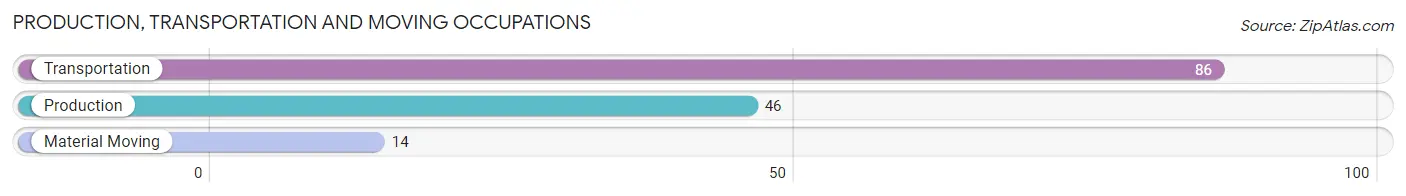
Production, Transportation and Moving Occupations by Sex
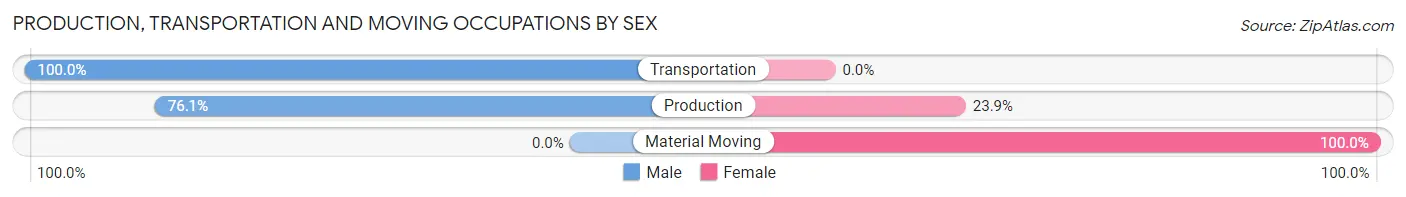
| Occupation | Male | Female |
| Production | 35 (76.1%) | 11 (23.9%) |
| Transportation | 86 (100.0%) | 0 (0.0%) |
| Material Moving | 0 (0.0%) | 14 (100.0%) |
| Total (Category) | 121 (82.9%) | 25 (17.1%) |
| Total (Overall) | 837 (51.4%) | 792 (48.6%) |
Employment Industries by Sex in Northwest Harwinton
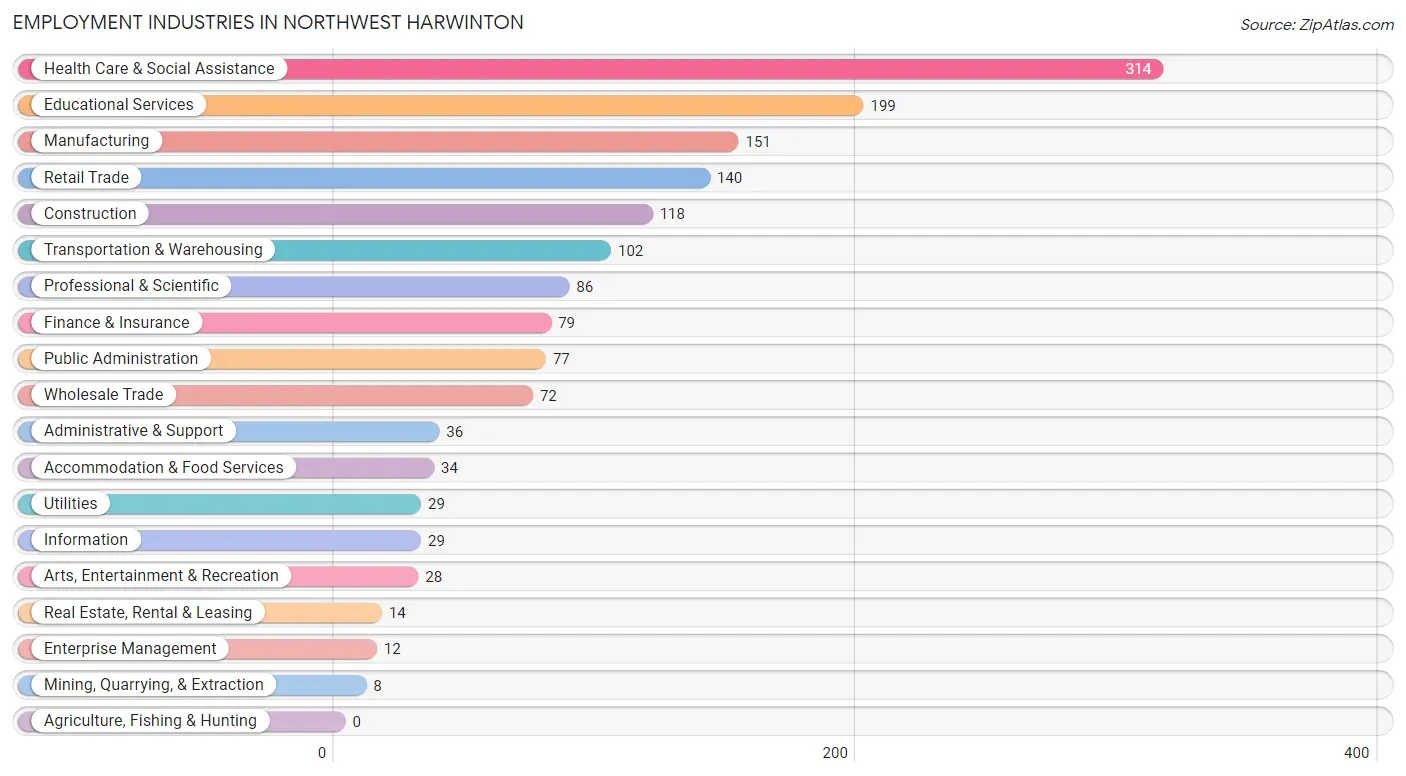
Employment Industries in Northwest Harwinton
The major employment industries in Northwest Harwinton include Health Care & Social Assistance (314 | 19.3%), Educational Services (199 | 12.2%), Manufacturing (151 | 9.3%), Retail Trade (140 | 8.6%), and Construction (118 | 7.2%).
Employment Industries by Sex in Northwest Harwinton
The Northwest Harwinton industries that see more men than women are Mining, Quarrying, & Extraction (100.0%), Construction (100.0%), and Wholesale Trade (100.0%), whereas the industries that tend to have a higher number of women are Health Care & Social Assistance (80.9%), Accommodation & Food Services (79.4%), and Educational Services (76.9%).
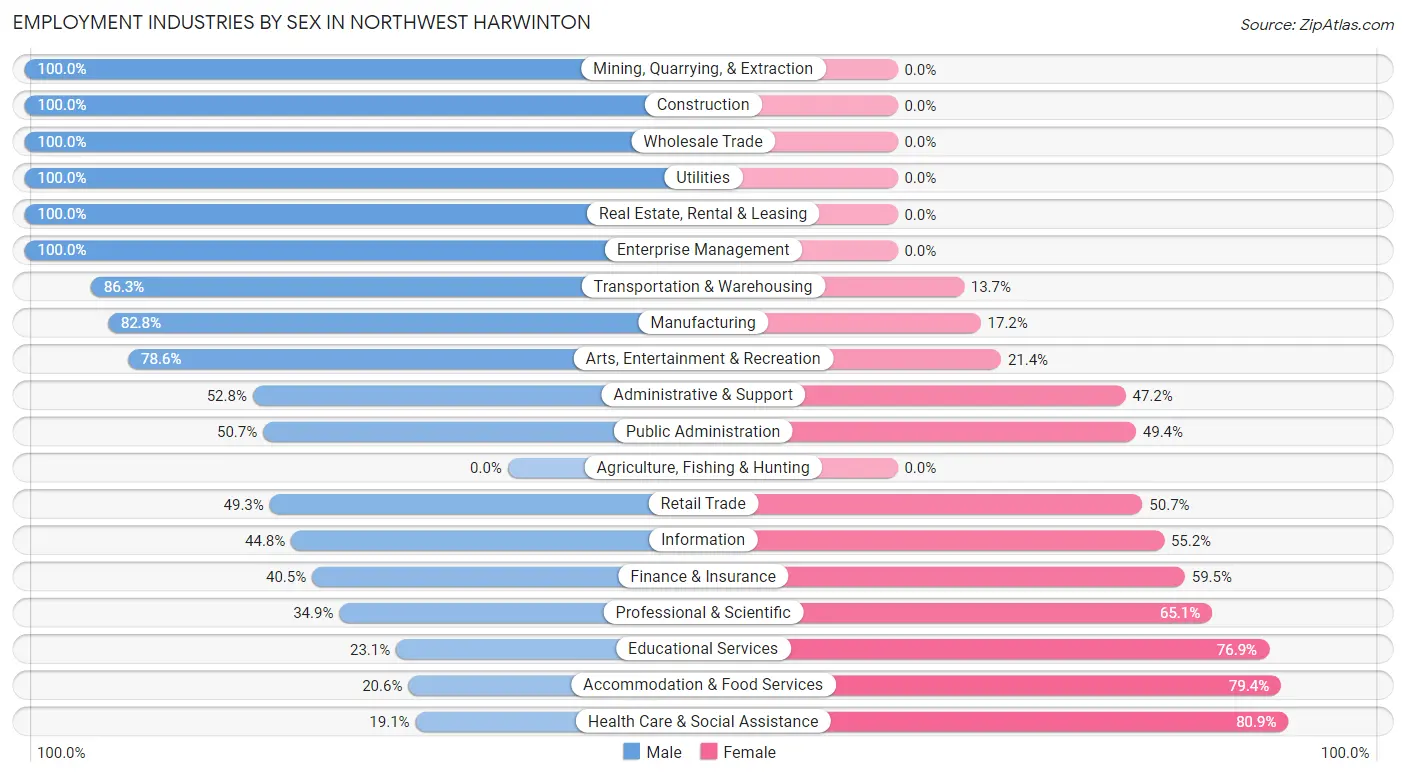
| Industry | Male | Female |
| Agriculture, Fishing & Hunting | 0 (0.0%) | 0 (0.0%) |
| Mining, Quarrying, & Extraction | 8 (100.0%) | 0 (0.0%) |
| Construction | 118 (100.0%) | 0 (0.0%) |
| Manufacturing | 125 (82.8%) | 26 (17.2%) |
| Wholesale Trade | 72 (100.0%) | 0 (0.0%) |
| Retail Trade | 69 (49.3%) | 71 (50.7%) |
| Transportation & Warehousing | 88 (86.3%) | 14 (13.7%) |
| Utilities | 29 (100.0%) | 0 (0.0%) |
| Information | 13 (44.8%) | 16 (55.2%) |
| Finance & Insurance | 32 (40.5%) | 47 (59.5%) |
| Real Estate, Rental & Leasing | 14 (100.0%) | 0 (0.0%) |
| Professional & Scientific | 30 (34.9%) | 56 (65.1%) |
| Enterprise Management | 12 (100.0%) | 0 (0.0%) |
| Administrative & Support | 19 (52.8%) | 17 (47.2%) |
| Educational Services | 46 (23.1%) | 153 (76.9%) |
| Health Care & Social Assistance | 60 (19.1%) | 254 (80.9%) |
| Arts, Entertainment & Recreation | 22 (78.6%) | 6 (21.4%) |
| Accommodation & Food Services | 7 (20.6%) | 27 (79.4%) |
| Public Administration | 39 (50.6%) | 38 (49.3%) |
| Total | 837 (51.4%) | 792 (48.6%) |
Education in Northwest Harwinton
School Enrollment in Northwest Harwinton
The most common levels of schooling among the 793 students in Northwest Harwinton are middle school (273 | 34.4%), elementary school (211 | 26.6%), and high school (185 | 23.3%).
| School Level | # Students | % Students |
| Nursery / Preschool | 0 | 0.0% |
| Kindergarten | 9 | 1.1% |
| Elementary School | 211 | 26.6% |
| Middle School | 273 | 34.4% |
| High School | 185 | 23.3% |
| College / Undergraduate | 99 | 12.5% |
| Graduate / Professional | 16 | 2.0% |
| Total | 793 | 100.0% |
School Enrollment by Age by Funding Source in Northwest Harwinton
Out of a total of 793 students who are enrolled in schools in Northwest Harwinton, 69 (8.7%) attend a private institution, while the remaining 724 (91.3%) are enrolled in public schools. The age group of 20 to 24 year olds has the highest likelihood of being enrolled in private schools, with 50 (63.3% in the age bracket) enrolled. Conversely, the age group of 5 to 9 year old has the lowest likelihood of being enrolled in a private school, with 210 (100.0% in the age bracket) attending a public institution.
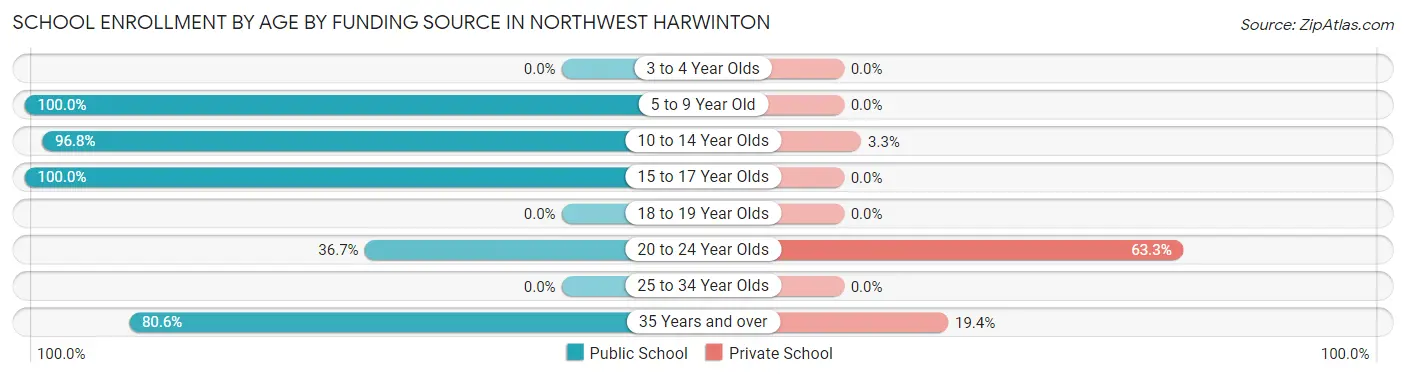
| Age Bracket | Public School | Private School |
| 3 to 4 Year Olds | 0 (0.0%) | 0 (0.0%) |
| 5 to 9 Year Old | 210 (100.0%) | 0 (0.0%) |
| 10 to 14 Year Olds | 357 (96.8%) | 12 (3.3%) |
| 15 to 17 Year Olds | 99 (100.0%) | 0 (0.0%) |
| 18 to 19 Year Olds | 0 (0.0%) | 0 (0.0%) |
| 20 to 24 Year Olds | 29 (36.7%) | 50 (63.3%) |
| 25 to 34 Year Olds | 0 (0.0%) | 0 (0.0%) |
| 35 Years and over | 29 (80.6%) | 7 (19.4%) |
| Total | 724 (91.3%) | 69 (8.7%) |
Educational Attainment by Field of Study in Northwest Harwinton
Business (226 | 24.6%), science & technology (124 | 13.5%), education (106 | 11.5%), literature & languages (86 | 9.4%), and visual & performing arts (68 | 7.4%) are the most common fields of study among 919 individuals in Northwest Harwinton who have obtained a bachelor's degree or higher.
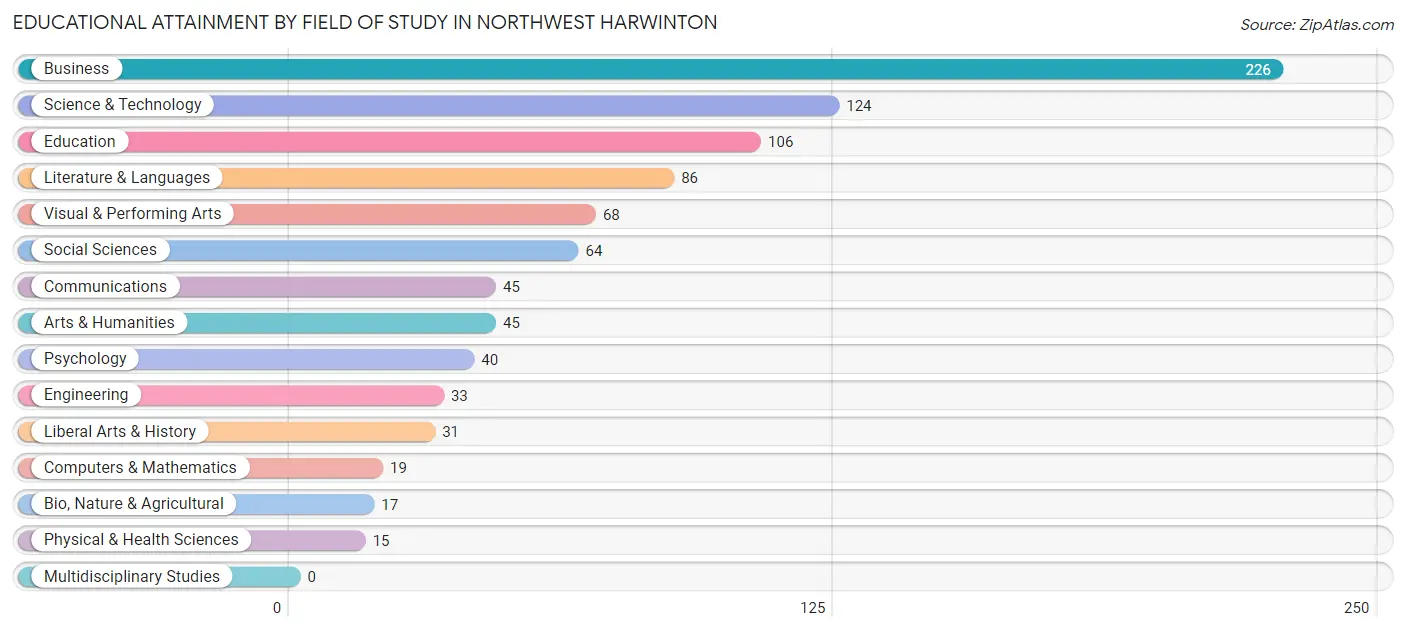
| Field of Study | # Graduates | % Graduates |
| Computers & Mathematics | 19 | 2.1% |
| Bio, Nature & Agricultural | 17 | 1.8% |
| Physical & Health Sciences | 15 | 1.6% |
| Psychology | 40 | 4.3% |
| Social Sciences | 64 | 7.0% |
| Engineering | 33 | 3.6% |
| Multidisciplinary Studies | 0 | 0.0% |
| Science & Technology | 124 | 13.5% |
| Business | 226 | 24.6% |
| Education | 106 | 11.5% |
| Literature & Languages | 86 | 9.4% |
| Liberal Arts & History | 31 | 3.4% |
| Visual & Performing Arts | 68 | 7.4% |
| Communications | 45 | 4.9% |
| Arts & Humanities | 45 | 4.9% |
| Total | 919 | 100.0% |
Transportation & Commute in Northwest Harwinton
Vehicle Availability by Sex in Northwest Harwinton
The most prevalent vehicle ownership categories in Northwest Harwinton are males with 2 vehicles (251, accounting for 30.0%) and females with 2 vehicles (319, making up 32.1%).
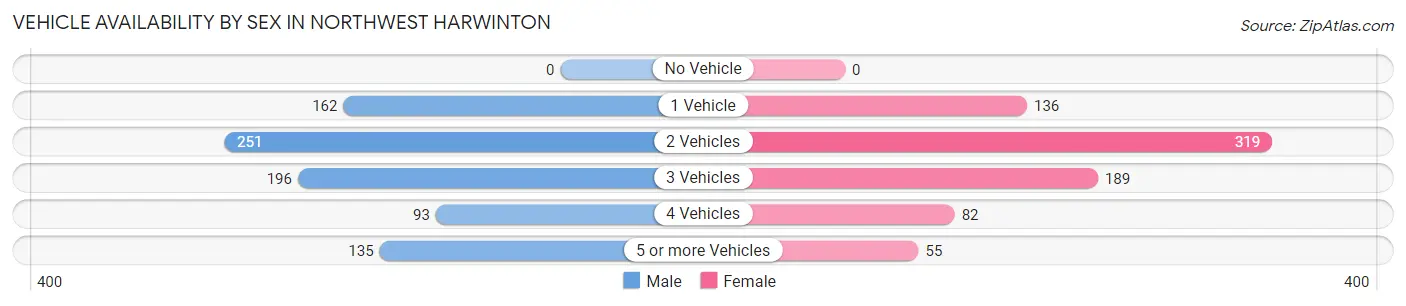
| Vehicles Available | Male | Female |
| No Vehicle | 0 (0.0%) | 0 (0.0%) |
| 1 Vehicle | 162 (19.4%) | 136 (17.4%) |
| 2 Vehicles | 251 (30.0%) | 319 (40.8%) |
| 3 Vehicles | 196 (23.4%) | 189 (24.2%) |
| 4 Vehicles | 93 (11.1%) | 82 (10.5%) |
| 5 or more Vehicles | 135 (16.1%) | 55 (7.0%) |
| Total | 837 (100.0%) | 781 (100.0%) |
Commute Time in Northwest Harwinton
The most frequently occuring commute durations in Northwest Harwinton are 45 to 59 minutes (324 commuters, 21.3%), 10 to 14 minutes (264 commuters, 17.3%), and 15 to 19 minutes (167 commuters, 11.0%).
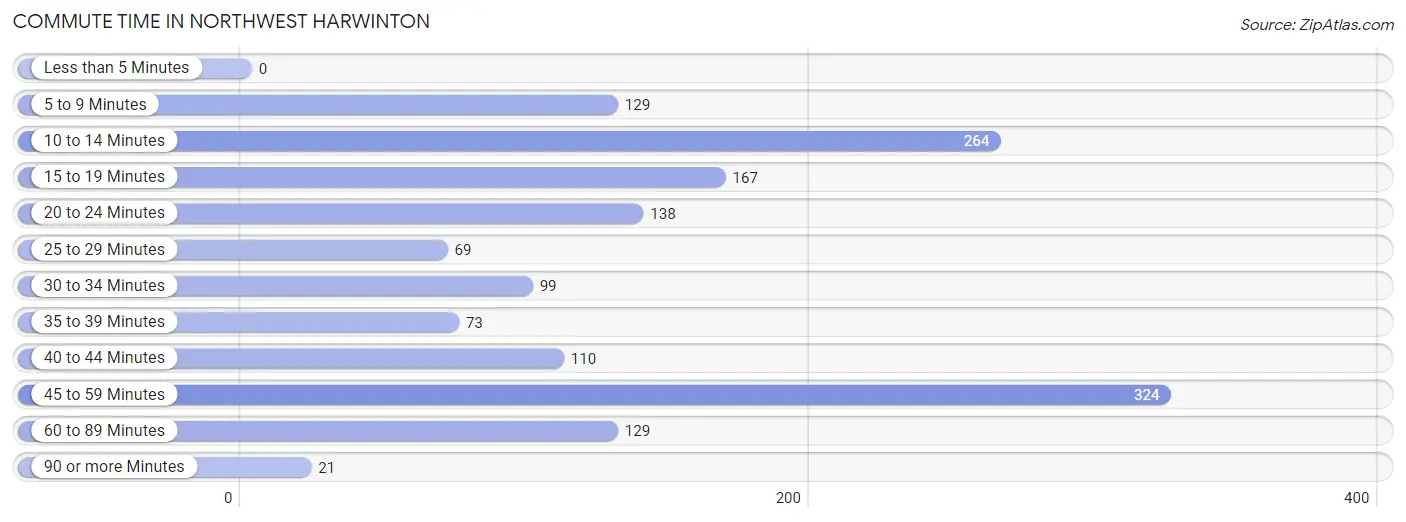
| Commute Time | # Commuters | % Commuters |
| Less than 5 Minutes | 0 | 0.0% |
| 5 to 9 Minutes | 129 | 8.5% |
| 10 to 14 Minutes | 264 | 17.3% |
| 15 to 19 Minutes | 167 | 11.0% |
| 20 to 24 Minutes | 138 | 9.1% |
| 25 to 29 Minutes | 69 | 4.5% |
| 30 to 34 Minutes | 99 | 6.5% |
| 35 to 39 Minutes | 73 | 4.8% |
| 40 to 44 Minutes | 110 | 7.2% |
| 45 to 59 Minutes | 324 | 21.3% |
| 60 to 89 Minutes | 129 | 8.5% |
| 90 or more Minutes | 21 | 1.4% |
Commute Time by Sex in Northwest Harwinton
The most common commute times in Northwest Harwinton are 45 to 59 minutes (152 commuters, 19.5%) for males and 45 to 59 minutes (172 commuters, 23.1%) for females.
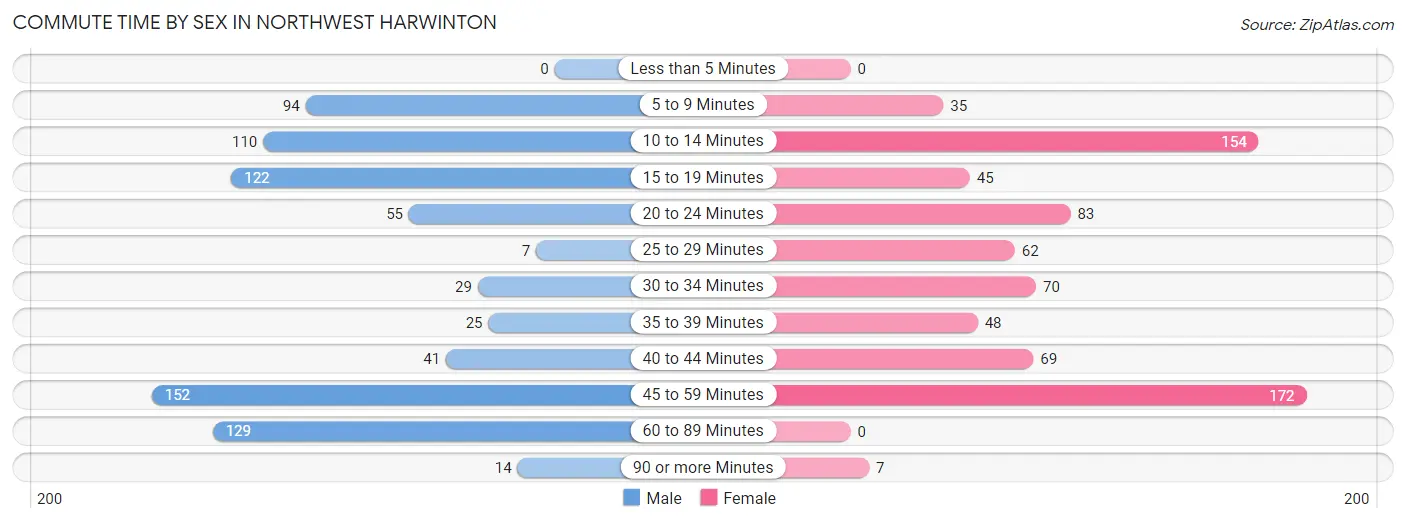
| Commute Time | Male | Female |
| Less than 5 Minutes | 0 (0.0%) | 0 (0.0%) |
| 5 to 9 Minutes | 94 (12.1%) | 35 (4.7%) |
| 10 to 14 Minutes | 110 (14.1%) | 154 (20.7%) |
| 15 to 19 Minutes | 122 (15.7%) | 45 (6.0%) |
| 20 to 24 Minutes | 55 (7.1%) | 83 (11.1%) |
| 25 to 29 Minutes | 7 (0.9%) | 62 (8.3%) |
| 30 to 34 Minutes | 29 (3.7%) | 70 (9.4%) |
| 35 to 39 Minutes | 25 (3.2%) | 48 (6.4%) |
| 40 to 44 Minutes | 41 (5.3%) | 69 (9.3%) |
| 45 to 59 Minutes | 152 (19.5%) | 172 (23.1%) |
| 60 to 89 Minutes | 129 (16.6%) | 0 (0.0%) |
| 90 or more Minutes | 14 (1.8%) | 7 (0.9%) |
Time of Departure to Work by Sex in Northwest Harwinton
The most frequent times of departure to work in Northwest Harwinton are 7:30 AM to 7:59 AM (133, 17.1%) for males and 8:00 AM to 8:29 AM (109, 14.6%) for females.
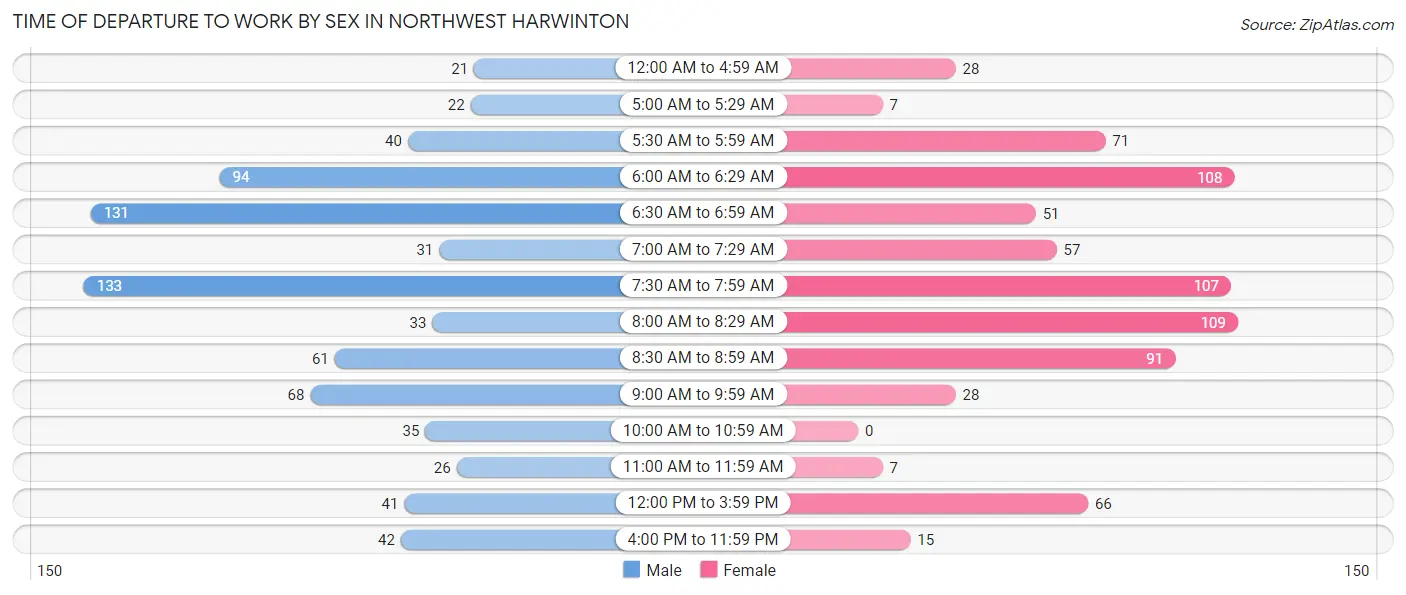
| Time of Departure | Male | Female |
| 12:00 AM to 4:59 AM | 21 (2.7%) | 28 (3.8%) |
| 5:00 AM to 5:29 AM | 22 (2.8%) | 7 (0.9%) |
| 5:30 AM to 5:59 AM | 40 (5.1%) | 71 (9.5%) |
| 6:00 AM to 6:29 AM | 94 (12.1%) | 108 (14.5%) |
| 6:30 AM to 6:59 AM | 131 (16.8%) | 51 (6.9%) |
| 7:00 AM to 7:29 AM | 31 (4.0%) | 57 (7.6%) |
| 7:30 AM to 7:59 AM | 133 (17.1%) | 107 (14.4%) |
| 8:00 AM to 8:29 AM | 33 (4.2%) | 109 (14.6%) |
| 8:30 AM to 8:59 AM | 61 (7.8%) | 91 (12.2%) |
| 9:00 AM to 9:59 AM | 68 (8.7%) | 28 (3.8%) |
| 10:00 AM to 10:59 AM | 35 (4.5%) | 0 (0.0%) |
| 11:00 AM to 11:59 AM | 26 (3.3%) | 7 (0.9%) |
| 12:00 PM to 3:59 PM | 41 (5.3%) | 66 (8.9%) |
| 4:00 PM to 11:59 PM | 42 (5.4%) | 15 (2.0%) |
| Total | 778 (100.0%) | 745 (100.0%) |
Housing Occupancy in Northwest Harwinton
Occupancy by Ownership in Northwest Harwinton
Of the total 1,315 dwellings in Northwest Harwinton, owner-occupied units account for 1,213 (92.2%), while renter-occupied units make up 102 (7.8%).
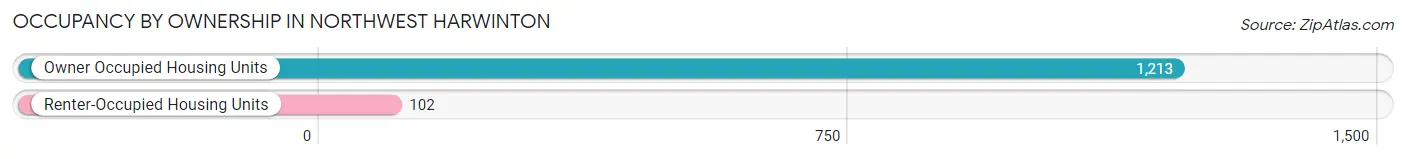
| Occupancy | # Housing Units | % Housing Units |
| Owner Occupied Housing Units | 1,213 | 92.2% |
| Renter-Occupied Housing Units | 102 | 7.8% |
| Total Occupied Housing Units | 1,315 | 100.0% |
Occupancy by Household Size in Northwest Harwinton
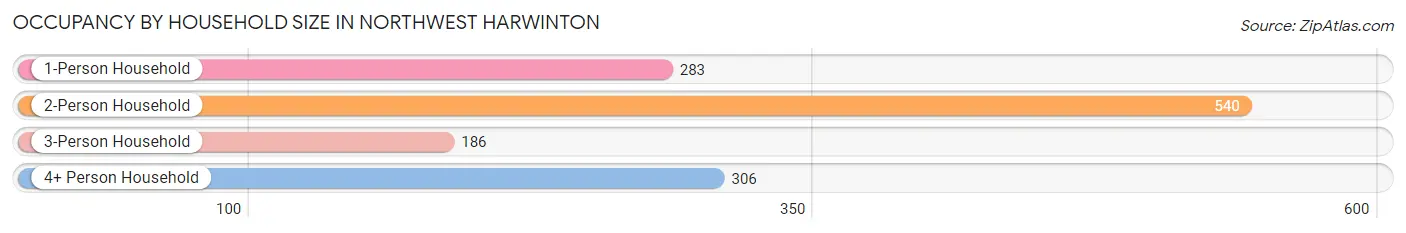
| Household Size | # Housing Units | % Housing Units |
| 1-Person Household | 283 | 21.5% |
| 2-Person Household | 540 | 41.1% |
| 3-Person Household | 186 | 14.1% |
| 4+ Person Household | 306 | 23.3% |
| Total Housing Units | 1,315 | 100.0% |
Occupancy by Ownership by Household Size in Northwest Harwinton
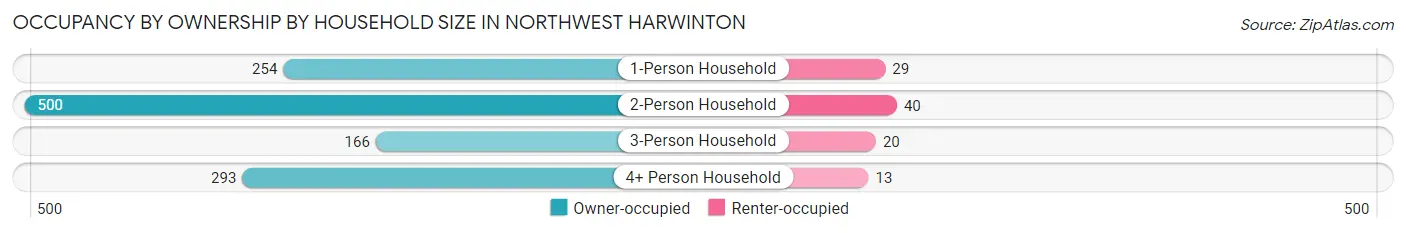
| Household Size | Owner-occupied | Renter-occupied |
| 1-Person Household | 254 (89.7%) | 29 (10.2%) |
| 2-Person Household | 500 (92.6%) | 40 (7.4%) |
| 3-Person Household | 166 (89.2%) | 20 (10.7%) |
| 4+ Person Household | 293 (95.8%) | 13 (4.3%) |
| Total Housing Units | 1,213 (92.2%) | 102 (7.8%) |
Occupancy by Educational Attainment in Northwest Harwinton
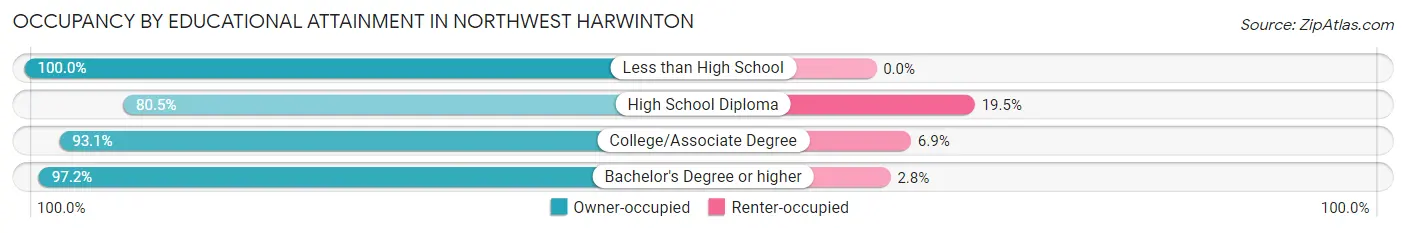
| Household Size | Owner-occupied | Renter-occupied |
| Less than High School | 17 (100.0%) | 0 (0.0%) |
| High School Diploma | 243 (80.5%) | 59 (19.5%) |
| College/Associate Degree | 338 (93.1%) | 25 (6.9%) |
| Bachelor's Degree or higher | 615 (97.2%) | 18 (2.8%) |
Occupancy by Age of Householder in Northwest Harwinton
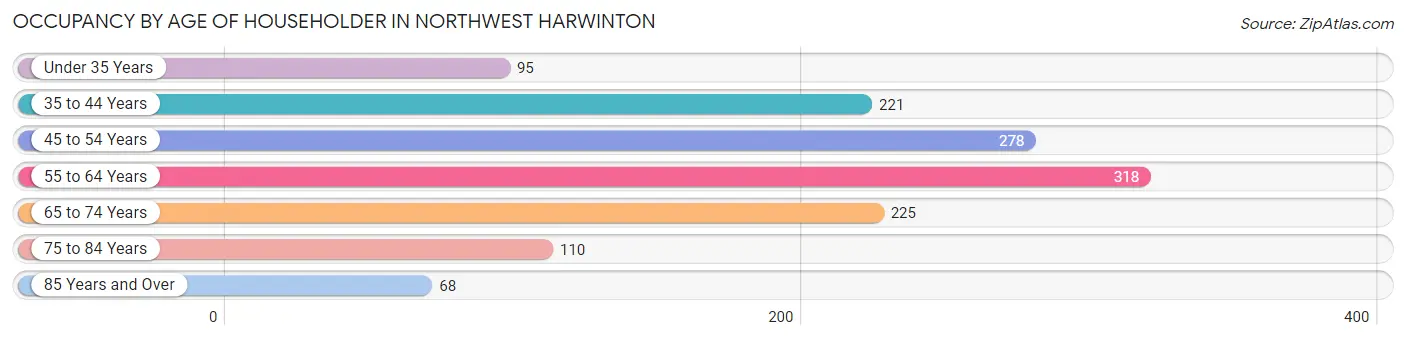
| Age Bracket | # Households | % Households |
| Under 35 Years | 95 | 7.2% |
| 35 to 44 Years | 221 | 16.8% |
| 45 to 54 Years | 278 | 21.1% |
| 55 to 64 Years | 318 | 24.2% |
| 65 to 74 Years | 225 | 17.1% |
| 75 to 84 Years | 110 | 8.4% |
| 85 Years and Over | 68 | 5.2% |
| Total | 1,315 | 100.0% |
Housing Finances in Northwest Harwinton
Median Income by Occupancy in Northwest Harwinton
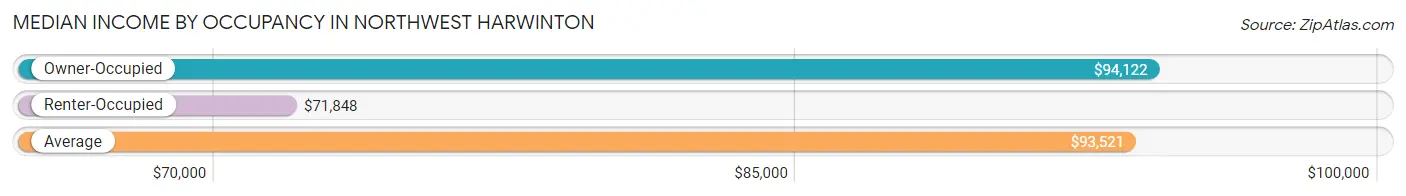
| Occupancy Type | # Households | Median Income |
| Owner-Occupied | 1,213 (92.2%) | $94,122 |
| Renter-Occupied | 102 (7.8%) | $71,848 |
| Average | 1,315 (100.0%) | $93,521 |
Occupancy by Householder Income Bracket in Northwest Harwinton
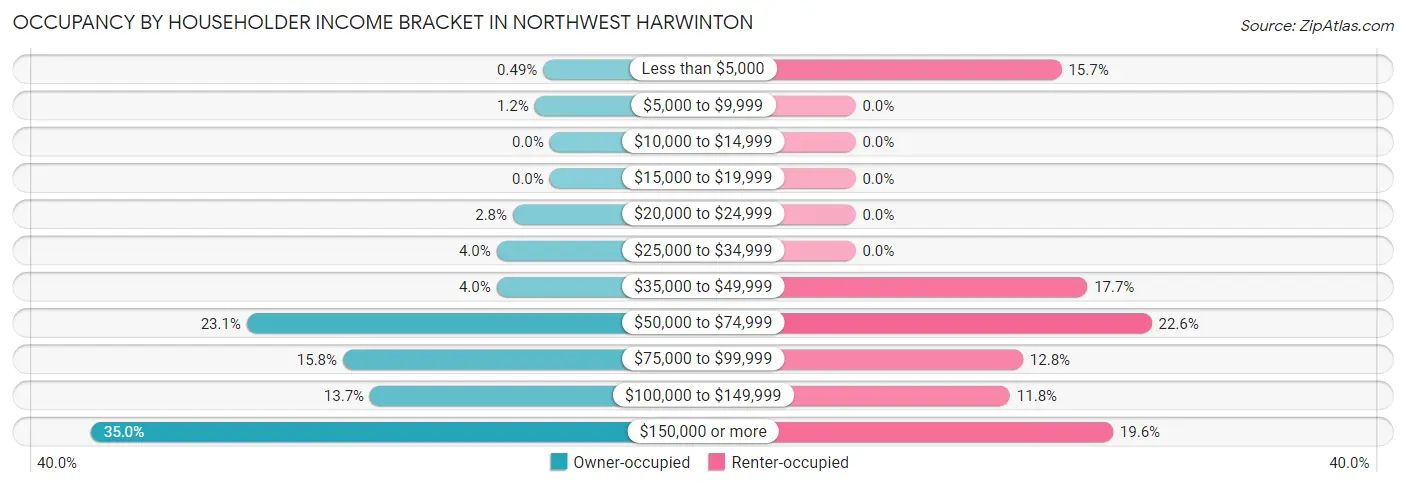
| Income Bracket | Owner-occupied | Renter-occupied |
| Less than $5,000 | 6 (0.5%) | 16 (15.7%) |
| $5,000 to $9,999 | 14 (1.1%) | 0 (0.0%) |
| $10,000 to $14,999 | 0 (0.0%) | 0 (0.0%) |
| $15,000 to $19,999 | 0 (0.0%) | 0 (0.0%) |
| $20,000 to $24,999 | 34 (2.8%) | 0 (0.0%) |
| $25,000 to $34,999 | 49 (4.0%) | 0 (0.0%) |
| $35,000 to $49,999 | 49 (4.0%) | 18 (17.6%) |
| $50,000 to $74,999 | 280 (23.1%) | 23 (22.6%) |
| $75,000 to $99,999 | 191 (15.8%) | 13 (12.8%) |
| $100,000 to $149,999 | 166 (13.7%) | 12 (11.8%) |
| $150,000 or more | 424 (34.9%) | 20 (19.6%) |
| Total | 1,213 (100.0%) | 102 (100.0%) |
Monthly Housing Cost Tiers in Northwest Harwinton
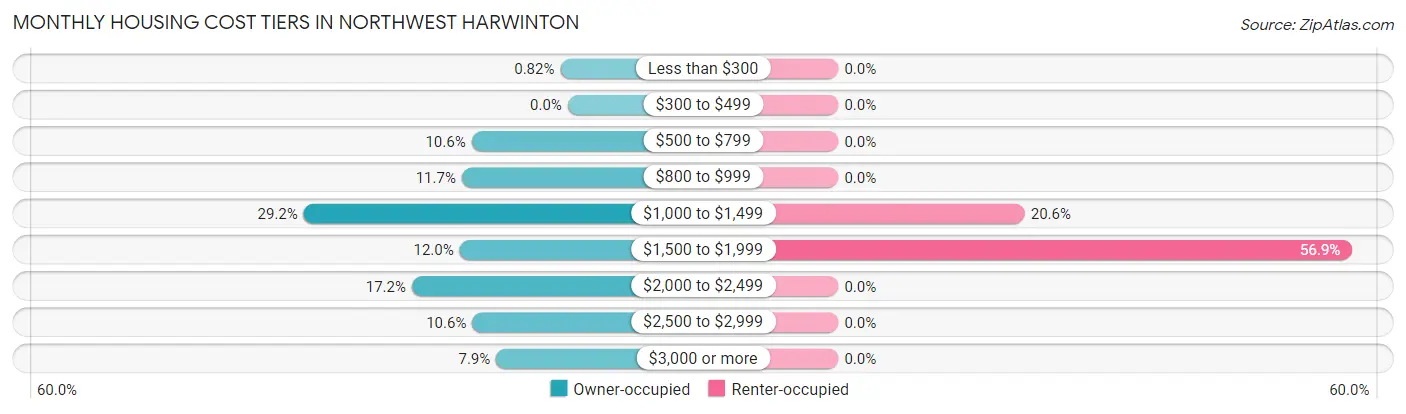
| Monthly Cost | Owner-occupied | Renter-occupied |
| Less than $300 | 10 (0.8%) | 0 (0.0%) |
| $300 to $499 | 0 (0.0%) | 0 (0.0%) |
| $500 to $799 | 129 (10.6%) | 0 (0.0%) |
| $800 to $999 | 142 (11.7%) | 0 (0.0%) |
| $1,000 to $1,499 | 354 (29.2%) | 21 (20.6%) |
| $1,500 to $1,999 | 145 (11.9%) | 58 (56.9%) |
| $2,000 to $2,499 | 209 (17.2%) | 0 (0.0%) |
| $2,500 to $2,999 | 128 (10.5%) | 0 (0.0%) |
| $3,000 or more | 96 (7.9%) | 0 (0.0%) |
| Total | 1,213 (100.0%) | 102 (100.0%) |
Physical Housing Characteristics in Northwest Harwinton
Housing Structures in Northwest Harwinton
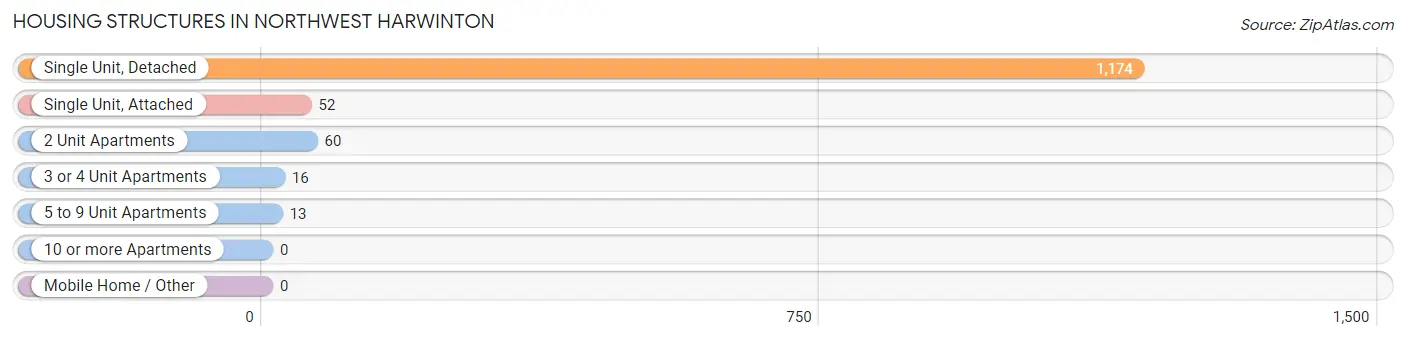
| Structure Type | # Housing Units | % Housing Units |
| Single Unit, Detached | 1,174 | 89.3% |
| Single Unit, Attached | 52 | 4.0% |
| 2 Unit Apartments | 60 | 4.6% |
| 3 or 4 Unit Apartments | 16 | 1.2% |
| 5 to 9 Unit Apartments | 13 | 1.0% |
| 10 or more Apartments | 0 | 0.0% |
| Mobile Home / Other | 0 | 0.0% |
| Total | 1,315 | 100.0% |
Housing Structures by Occupancy in Northwest Harwinton
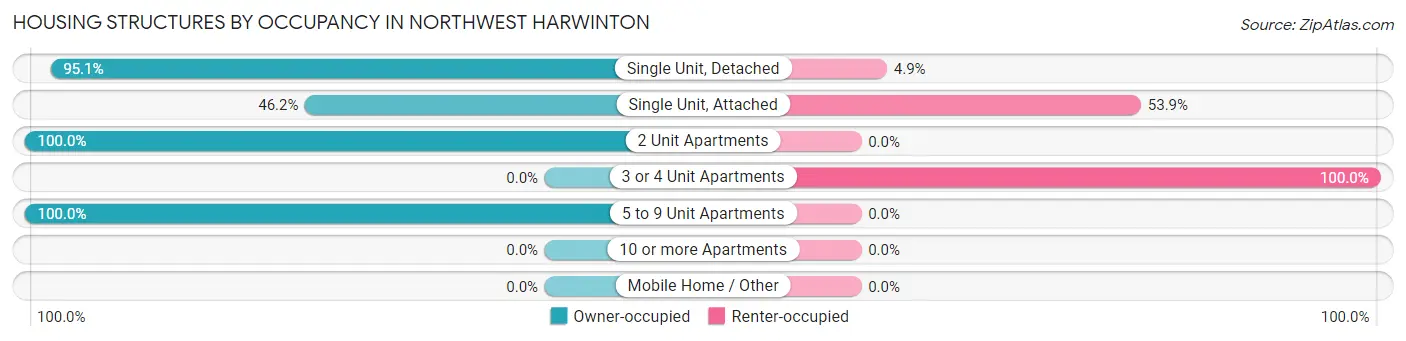
| Structure Type | Owner-occupied | Renter-occupied |
| Single Unit, Detached | 1,116 (95.1%) | 58 (4.9%) |
| Single Unit, Attached | 24 (46.2%) | 28 (53.8%) |
| 2 Unit Apartments | 60 (100.0%) | 0 (0.0%) |
| 3 or 4 Unit Apartments | 0 (0.0%) | 16 (100.0%) |
| 5 to 9 Unit Apartments | 13 (100.0%) | 0 (0.0%) |
| 10 or more Apartments | 0 (0.0%) | 0 (0.0%) |
| Mobile Home / Other | 0 (0.0%) | 0 (0.0%) |
| Total | 1,213 (92.2%) | 102 (7.8%) |
Housing Structures by Number of Rooms in Northwest Harwinton
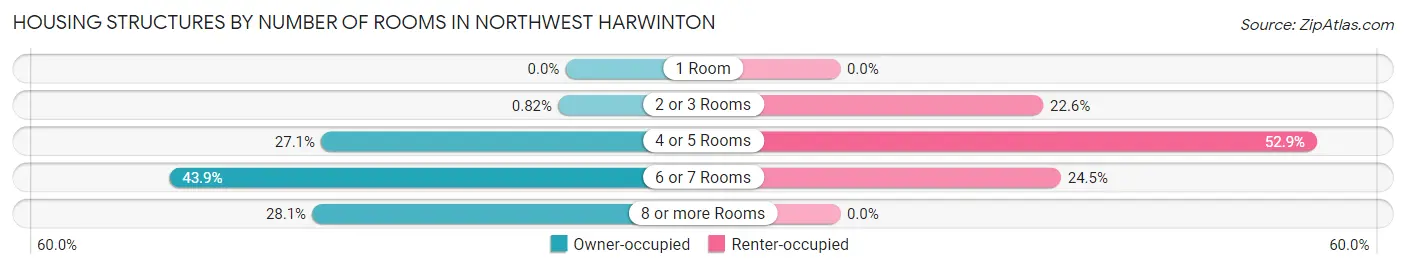
| Number of Rooms | Owner-occupied | Renter-occupied |
| 1 Room | 0 (0.0%) | 0 (0.0%) |
| 2 or 3 Rooms | 10 (0.8%) | 23 (22.6%) |
| 4 or 5 Rooms | 329 (27.1%) | 54 (52.9%) |
| 6 or 7 Rooms | 533 (43.9%) | 25 (24.5%) |
| 8 or more Rooms | 341 (28.1%) | 0 (0.0%) |
| Total | 1,213 (100.0%) | 102 (100.0%) |
Housing Structure by Heating Type in Northwest Harwinton
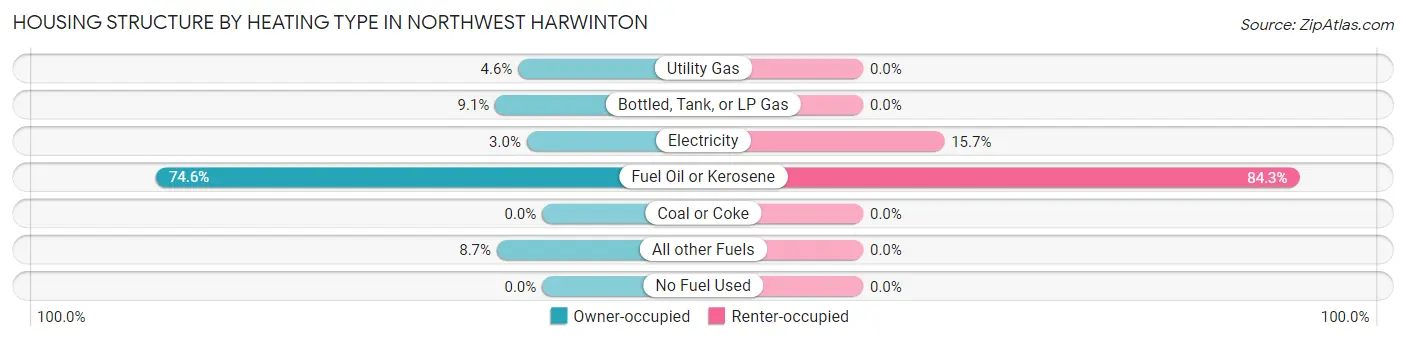
| Heating Type | Owner-occupied | Renter-occupied |
| Utility Gas | 56 (4.6%) | 0 (0.0%) |
| Bottled, Tank, or LP Gas | 110 (9.1%) | 0 (0.0%) |
| Electricity | 36 (3.0%) | 16 (15.7%) |
| Fuel Oil or Kerosene | 905 (74.6%) | 86 (84.3%) |
| Coal or Coke | 0 (0.0%) | 0 (0.0%) |
| All other Fuels | 106 (8.7%) | 0 (0.0%) |
| No Fuel Used | 0 (0.0%) | 0 (0.0%) |
| Total | 1,213 (100.0%) | 102 (100.0%) |
Household Vehicle Usage in Northwest Harwinton
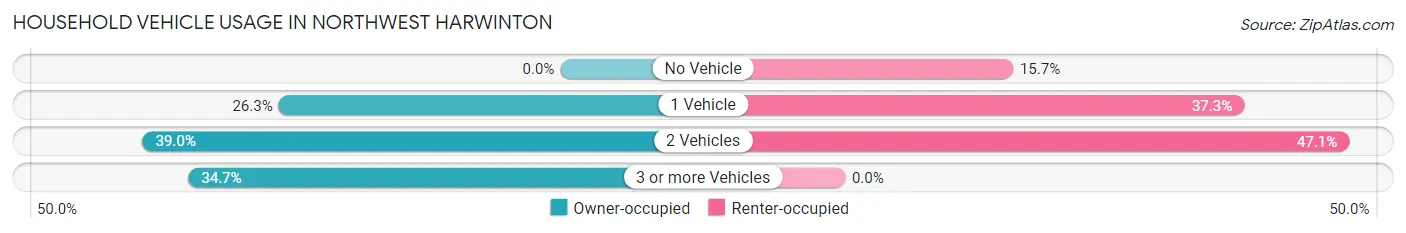
| Vehicles per Household | Owner-occupied | Renter-occupied |
| No Vehicle | 0 (0.0%) | 16 (15.7%) |
| 1 Vehicle | 319 (26.3%) | 38 (37.2%) |
| 2 Vehicles | 473 (39.0%) | 48 (47.1%) |
| 3 or more Vehicles | 421 (34.7%) | 0 (0.0%) |
| Total | 1,213 (100.0%) | 102 (100.0%) |
Real Estate & Mortgages in Northwest Harwinton
Real Estate and Mortgage Overview in Northwest Harwinton
| Characteristic | Without Mortgage | With Mortgage |
| Housing Units | 452 | 761 |
| Median Property Value | $334,100 | $327,100 |
| Median Household Income | $93,382 | $255 |
| Monthly Housing Costs | $972 | $96 |
| Real Estate Taxes | $6,525 | $0 |
Property Value by Mortgage Status in Northwest Harwinton
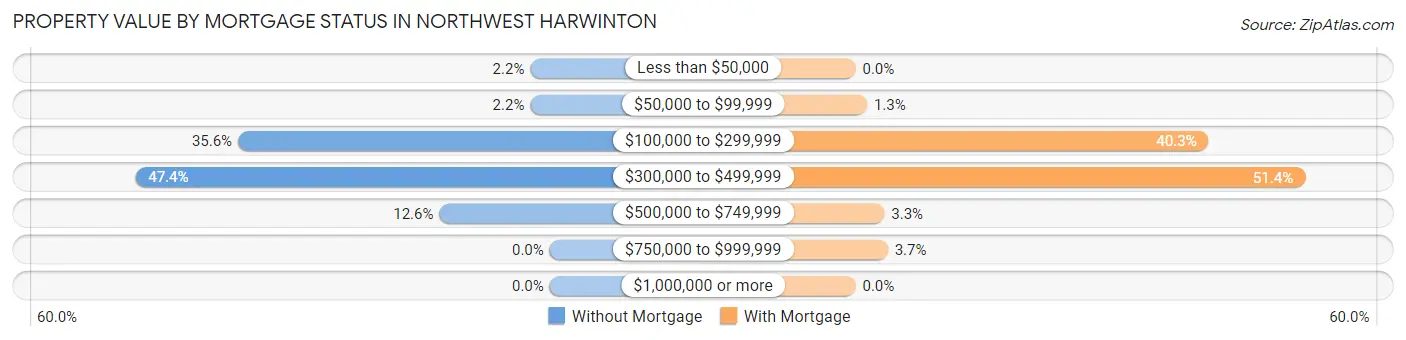
| Property Value | Without Mortgage | With Mortgage |
| Less than $50,000 | 10 (2.2%) | 0 (0.0%) |
| $50,000 to $99,999 | 10 (2.2%) | 10 (1.3%) |
| $100,000 to $299,999 | 161 (35.6%) | 307 (40.3%) |
| $300,000 to $499,999 | 214 (47.3%) | 391 (51.4%) |
| $500,000 to $749,999 | 57 (12.6%) | 25 (3.3%) |
| $750,000 to $999,999 | 0 (0.0%) | 28 (3.7%) |
| $1,000,000 or more | 0 (0.0%) | 0 (0.0%) |
| Total | 452 (100.0%) | 761 (100.0%) |
Household Income by Mortgage Status in Northwest Harwinton
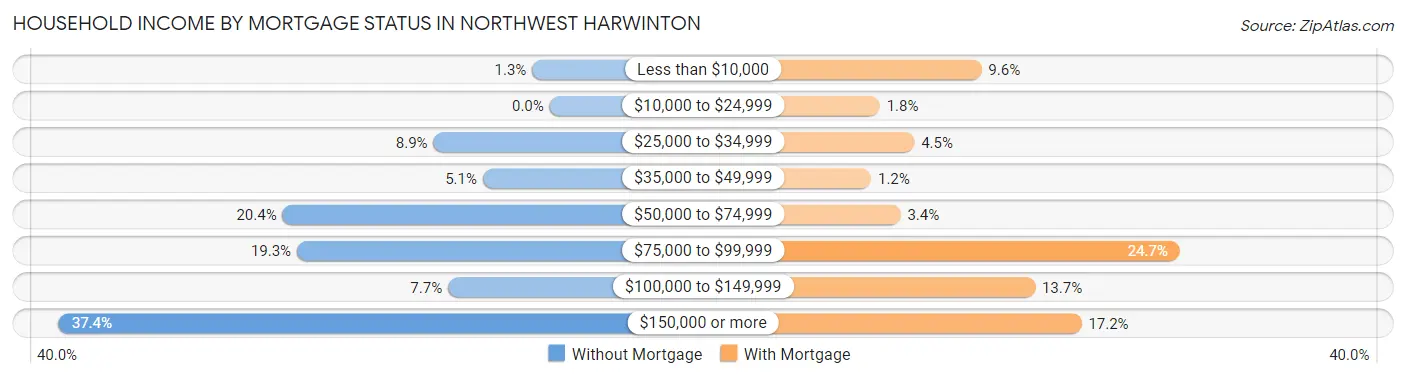
| Household Income | Without Mortgage | With Mortgage |
| Less than $10,000 | 6 (1.3%) | 73 (9.6%) |
| $10,000 to $24,999 | 0 (0.0%) | 14 (1.8%) |
| $25,000 to $34,999 | 40 (8.8%) | 34 (4.5%) |
| $35,000 to $49,999 | 23 (5.1%) | 9 (1.2%) |
| $50,000 to $74,999 | 92 (20.3%) | 26 (3.4%) |
| $75,000 to $99,999 | 87 (19.3%) | 188 (24.7%) |
| $100,000 to $149,999 | 35 (7.7%) | 104 (13.7%) |
| $150,000 or more | 169 (37.4%) | 131 (17.2%) |
| Total | 452 (100.0%) | 761 (100.0%) |
Property Value to Household Income Ratio in Northwest Harwinton
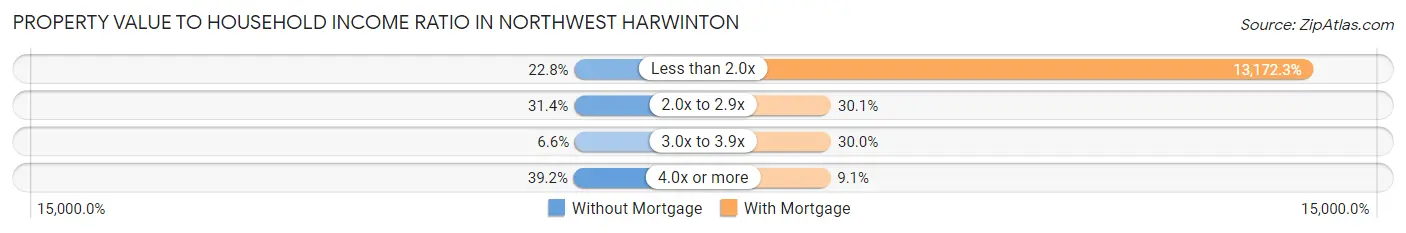
| Value-to-Income Ratio | Without Mortgage | With Mortgage |
| Less than 2.0x | 103 (22.8%) | 100,241 (13,172.3%) |
| 2.0x to 2.9x | 142 (31.4%) | 229 (30.1%) |
| 3.0x to 3.9x | 30 (6.6%) | 228 (30.0%) |
| 4.0x or more | 177 (39.2%) | 69 (9.1%) |
| Total | 452 (100.0%) | 761 (100.0%) |
Real Estate Taxes by Mortgage Status in Northwest Harwinton
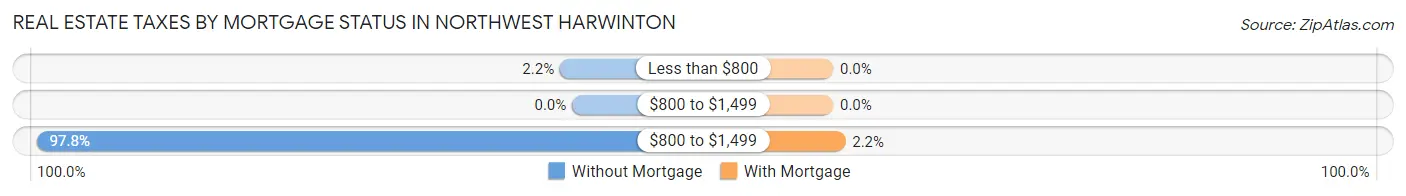
| Property Taxes | Without Mortgage | With Mortgage |
| Less than $800 | 10 (2.2%) | 0 (0.0%) |
| $800 to $1,499 | 0 (0.0%) | 0 (0.0%) |
| $800 to $1,499 | 442 (97.8%) | 17 (2.2%) |
| Total | 452 (100.0%) | 761 (100.0%) |
Health & Disability in Northwest Harwinton
Health Insurance Coverage by Age in Northwest Harwinton
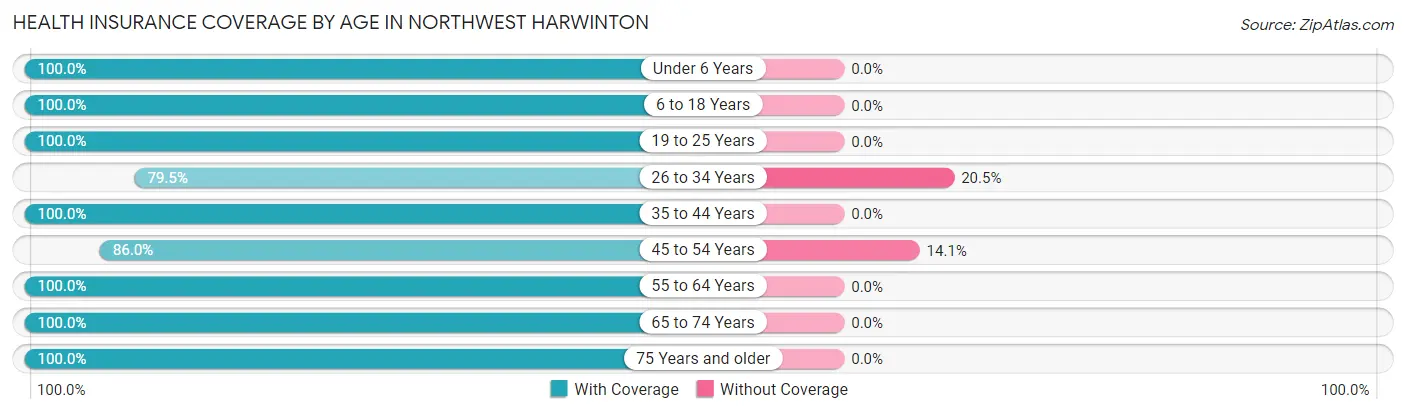
| Age Bracket | With Coverage | Without Coverage |
| Under 6 Years | 59 (100.0%) | 0 (0.0%) |
| 6 to 18 Years | 680 (100.0%) | 0 (0.0%) |
| 19 to 25 Years | 199 (100.0%) | 0 (0.0%) |
| 26 to 34 Years | 159 (79.5%) | 41 (20.5%) |
| 35 to 44 Years | 374 (100.0%) | 0 (0.0%) |
| 45 to 54 Years | 410 (86.0%) | 67 (14.1%) |
| 55 to 64 Years | 534 (100.0%) | 0 (0.0%) |
| 65 to 74 Years | 409 (100.0%) | 0 (0.0%) |
| 75 Years and older | 269 (100.0%) | 0 (0.0%) |
| Total | 3,093 (96.6%) | 108 (3.4%) |
Health Insurance Coverage by Citizenship Status in Northwest Harwinton
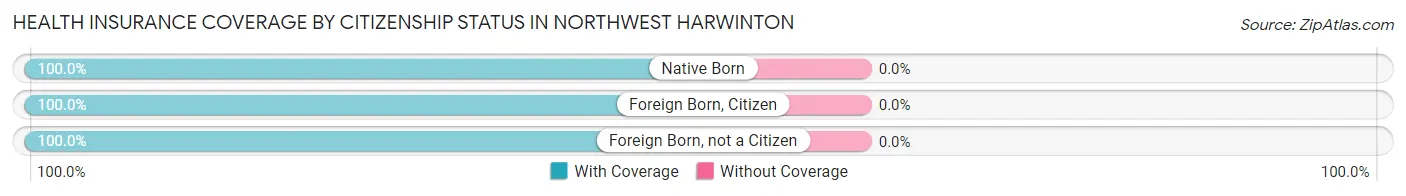
| Citizenship Status | With Coverage | Without Coverage |
| Native Born | 59 (100.0%) | 0 (0.0%) |
| Foreign Born, Citizen | 680 (100.0%) | 0 (0.0%) |
| Foreign Born, not a Citizen | 199 (100.0%) | 0 (0.0%) |
Health Insurance Coverage by Household Income in Northwest Harwinton
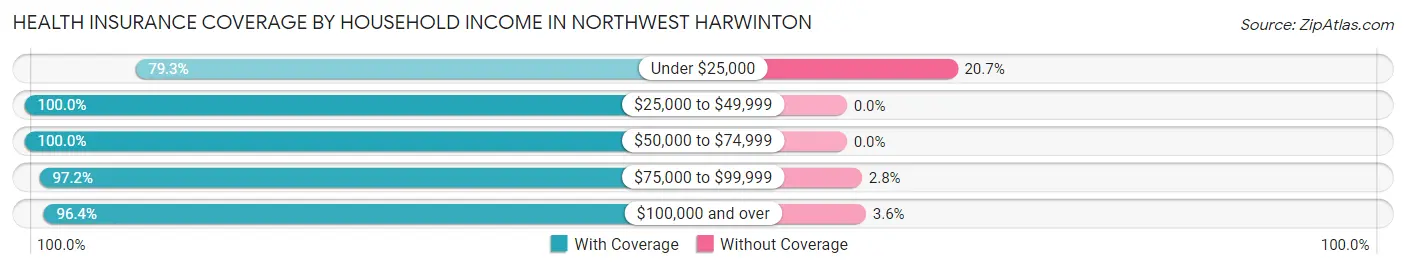
| Household Income | With Coverage | Without Coverage |
| Under $25,000 | 107 (79.3%) | 28 (20.7%) |
| $25,000 to $49,999 | 195 (100.0%) | 0 (0.0%) |
| $50,000 to $74,999 | 516 (100.0%) | 0 (0.0%) |
| $75,000 to $99,999 | 448 (97.2%) | 13 (2.8%) |
| $100,000 and over | 1,812 (96.4%) | 67 (3.6%) |
Public vs Private Health Insurance Coverage by Age in Northwest Harwinton
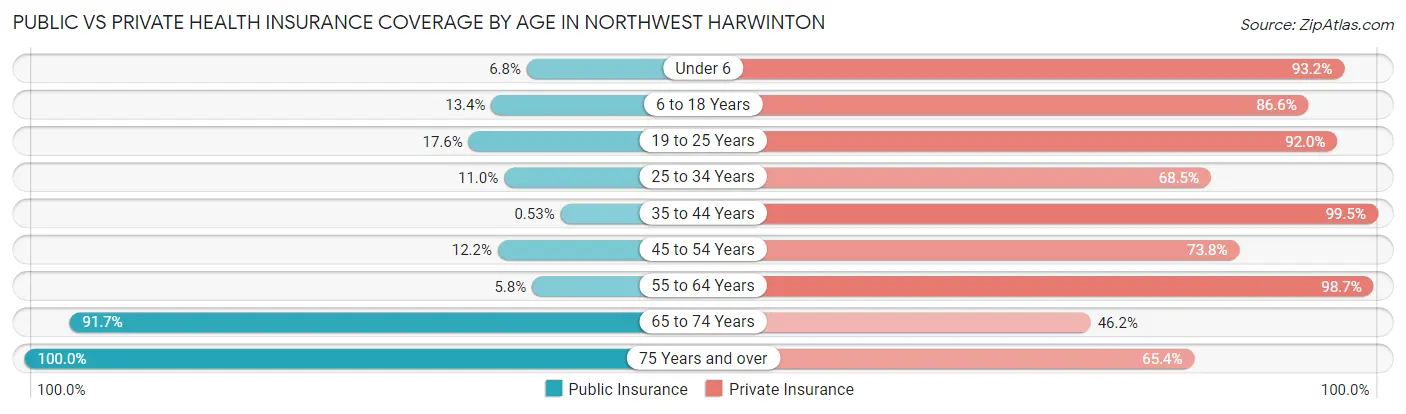
| Age Bracket | Public Insurance | Private Insurance |
| Under 6 | 4 (6.8%) | 55 (93.2%) |
| 6 to 18 Years | 91 (13.4%) | 589 (86.6%) |
| 19 to 25 Years | 35 (17.6%) | 183 (92.0%) |
| 25 to 34 Years | 22 (11.0%) | 137 (68.5%) |
| 35 to 44 Years | 2 (0.5%) | 372 (99.5%) |
| 45 to 54 Years | 58 (12.2%) | 352 (73.8%) |
| 55 to 64 Years | 31 (5.8%) | 527 (98.7%) |
| 65 to 74 Years | 375 (91.7%) | 189 (46.2%) |
| 75 Years and over | 269 (100.0%) | 176 (65.4%) |
| Total | 887 (27.7%) | 2,580 (80.6%) |
Disability Status by Sex by Age in Northwest Harwinton
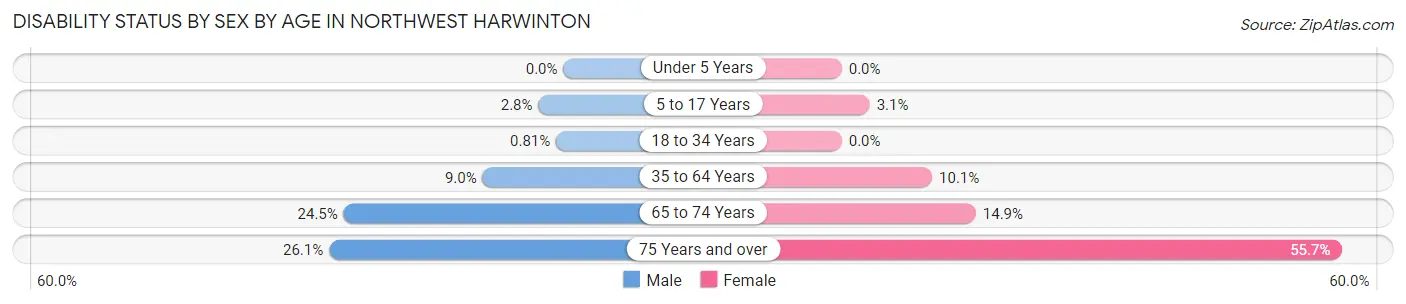
| Age Bracket | Male | Female |
| Under 5 Years | 0 (0.0%) | 0 (0.0%) |
| 5 to 17 Years | 12 (2.8%) | 8 (3.1%) |
| 18 to 34 Years | 2 (0.8%) | 0 (0.0%) |
| 35 to 64 Years | 62 (9.0%) | 70 (10.1%) |
| 65 to 74 Years | 46 (24.5%) | 33 (14.9%) |
| 75 Years and over | 36 (26.1%) | 73 (55.7%) |
Disability Class by Sex by Age in Northwest Harwinton
Disability Class: Hearing Difficulty
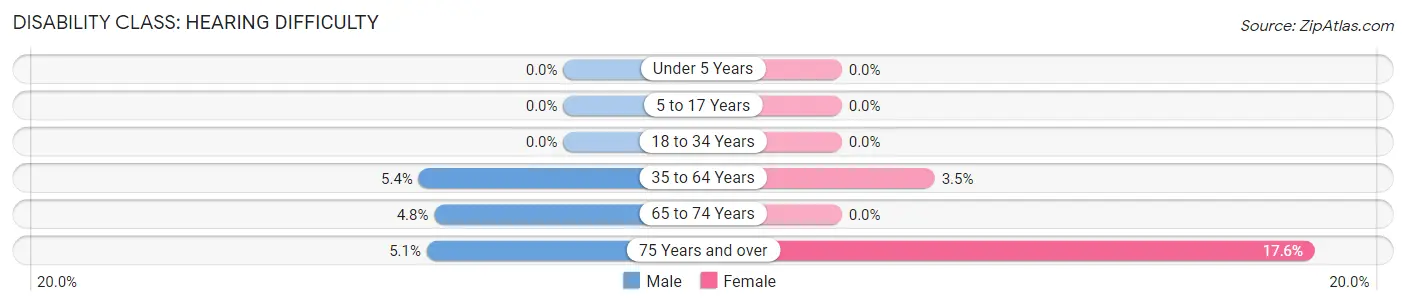
| Age Bracket | Male | Female |
| Under 5 Years | 0 (0.0%) | 0 (0.0%) |
| 5 to 17 Years | 0 (0.0%) | 0 (0.0%) |
| 18 to 34 Years | 0 (0.0%) | 0 (0.0%) |
| 35 to 64 Years | 37 (5.4%) | 24 (3.5%) |
| 65 to 74 Years | 9 (4.8%) | 0 (0.0%) |
| 75 Years and over | 7 (5.1%) | 23 (17.6%) |
Disability Class: Vision Difficulty
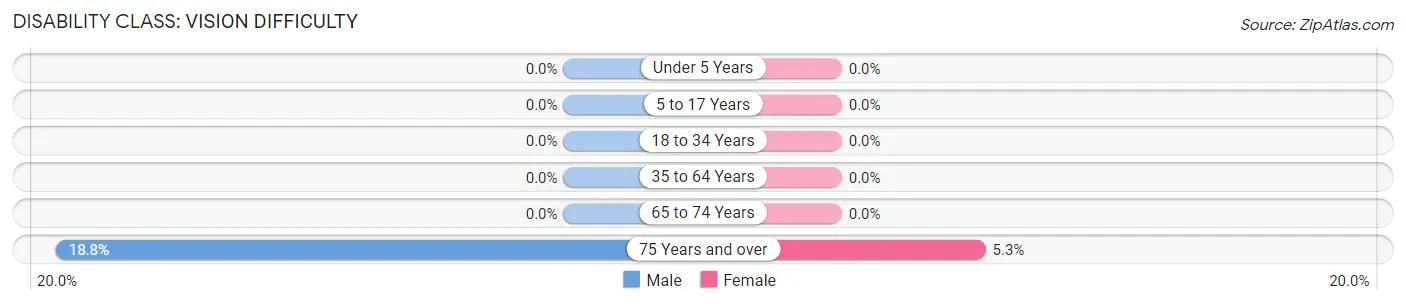
| Age Bracket | Male | Female |
| Under 5 Years | 0 (0.0%) | 0 (0.0%) |
| 5 to 17 Years | 0 (0.0%) | 0 (0.0%) |
| 18 to 34 Years | 0 (0.0%) | 0 (0.0%) |
| 35 to 64 Years | 0 (0.0%) | 0 (0.0%) |
| 65 to 74 Years | 0 (0.0%) | 0 (0.0%) |
| 75 Years and over | 26 (18.8%) | 7 (5.3%) |
Disability Class: Cognitive Difficulty
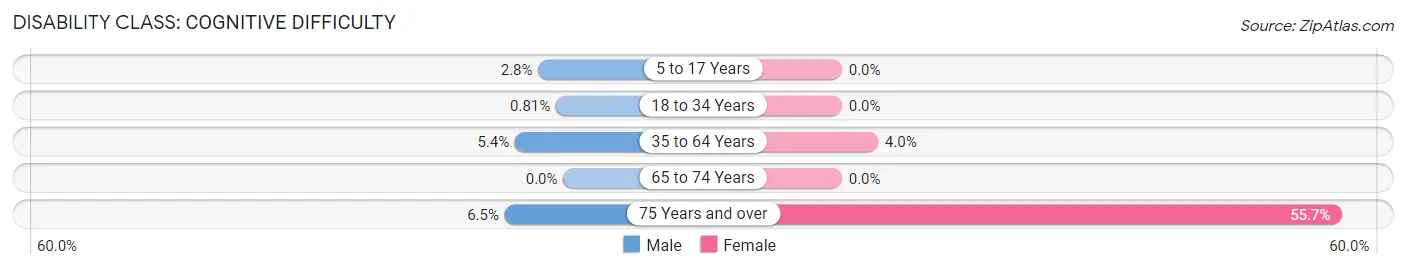
| Age Bracket | Male | Female |
| 5 to 17 Years | 12 (2.8%) | 0 (0.0%) |
| 18 to 34 Years | 2 (0.8%) | 0 (0.0%) |
| 35 to 64 Years | 37 (5.4%) | 28 (4.0%) |
| 65 to 74 Years | 0 (0.0%) | 0 (0.0%) |
| 75 Years and over | 9 (6.5%) | 73 (55.7%) |
Disability Class: Ambulatory Difficulty
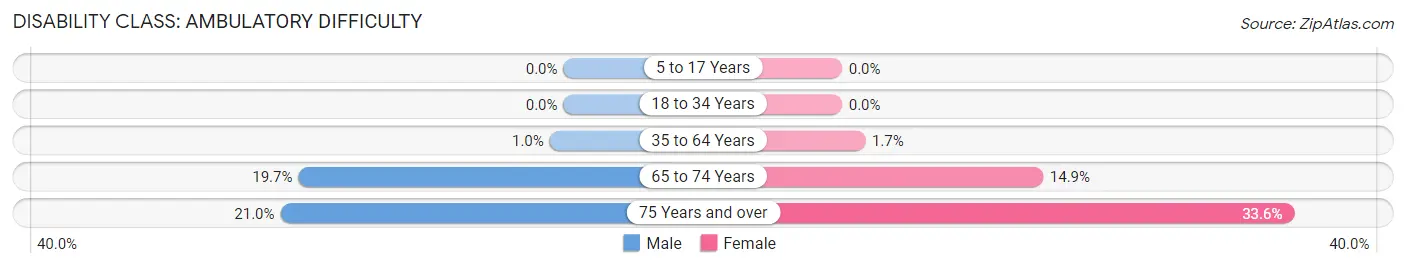
| Age Bracket | Male | Female |
| 5 to 17 Years | 0 (0.0%) | 0 (0.0%) |
| 18 to 34 Years | 0 (0.0%) | 0 (0.0%) |
| 35 to 64 Years | 7 (1.0%) | 12 (1.7%) |
| 65 to 74 Years | 37 (19.7%) | 33 (14.9%) |
| 75 Years and over | 29 (21.0%) | 44 (33.6%) |
Disability Class: Self-Care Difficulty
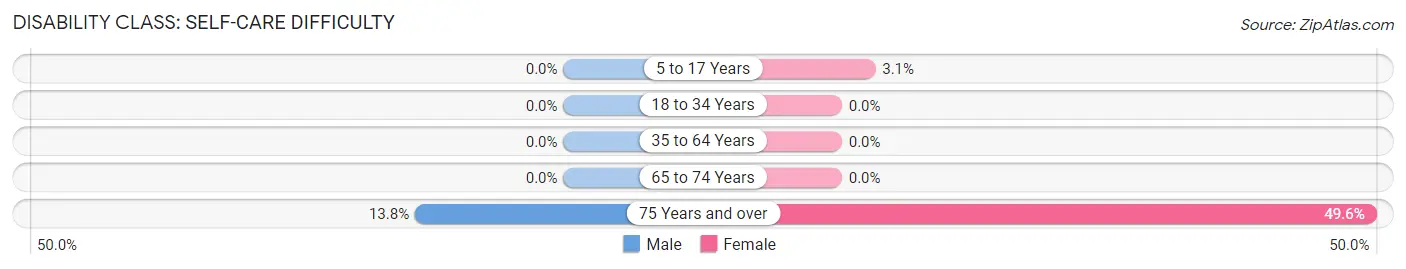
| Age Bracket | Male | Female |
| 5 to 17 Years | 0 (0.0%) | 8 (3.1%) |
| 18 to 34 Years | 0 (0.0%) | 0 (0.0%) |
| 35 to 64 Years | 0 (0.0%) | 0 (0.0%) |
| 65 to 74 Years | 0 (0.0%) | 0 (0.0%) |
| 75 Years and over | 19 (13.8%) | 65 (49.6%) |
Technology Access in Northwest Harwinton
Computing Device Access in Northwest Harwinton
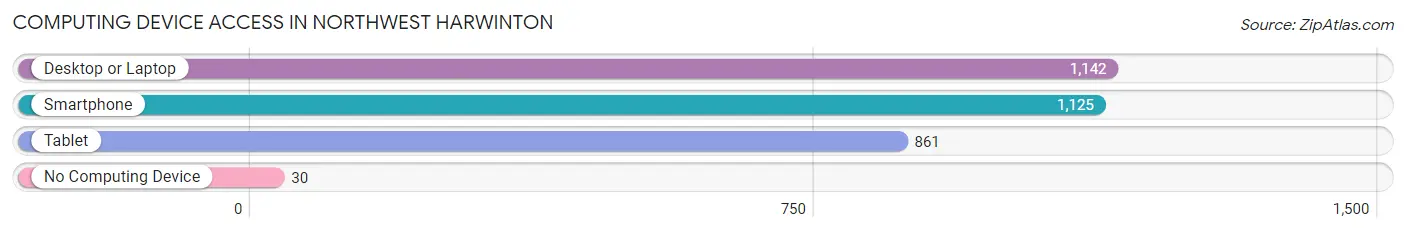
| Device Type | # Households | % Households |
| Desktop or Laptop | 1,142 | 86.8% |
| Smartphone | 1,125 | 85.6% |
| Tablet | 861 | 65.5% |
| No Computing Device | 30 | 2.3% |
| Total | 1,315 | 100.0% |
Internet Access in Northwest Harwinton
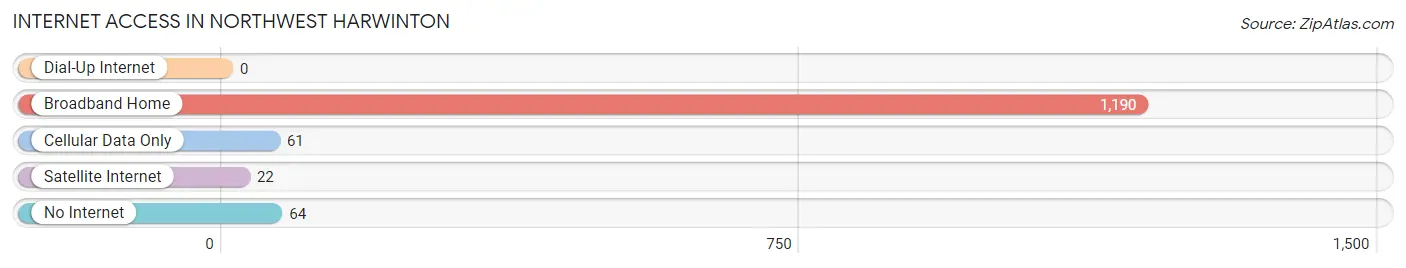
| Internet Type | # Households | % Households |
| Dial-Up Internet | 0 | 0.0% |
| Broadband Home | 1,190 | 90.5% |
| Cellular Data Only | 61 | 4.6% |
| Satellite Internet | 22 | 1.7% |
| No Internet | 64 | 4.9% |
| Total | 1,315 | 100.0% |
Northwest Harwinton Summary
Northwest Harwinton, Connecticut is a small town located in the northwest corner of the state. It is bordered by the towns of Litchfield, Morris, and Burlington. The town has a population of approximately 4,000 people and covers an area of approximately 28 square miles.
Geography
Northwest Harwinton is located in the northwest corner of Connecticut, in Litchfield County. It is bordered by the towns of Litchfield, Morris, and Burlington. The town is located in the foothills of the Berkshire Mountains, and is part of the Housatonic River Valley. The terrain is mostly rolling hills, with some flat areas. The highest point in the town is the summit of Bald Mountain, at 1,717 feet. The town is home to several small lakes, including Lake Harwinton, Lake McDonough, and Lake Lillinonah.
Climate
Northwest Harwinton has a humid continental climate, with cold winters and warm summers. The average annual temperature is around 48°F, with an average high of around 70°F in the summer and an average low of around 25°F in the winter. The town receives an average of around 40 inches of precipitation per year, with the majority of it falling in the form of snow in the winter months.
Economy
Northwest Harwinton is a primarily rural town, with a small but growing economy. The town is home to several small businesses, including a few restaurants, a grocery store, and a few retail stores. The town is also home to several farms, which produce a variety of crops, including corn, hay, and vegetables. The town is also home to several small manufacturing companies, which produce a variety of products, including furniture, clothing, and electronics.
Demographics
As of the 2010 census, the population of Northwest Harwinton was 4,092. The racial makeup of the town was 95.3% White, 0.7% African American, 0.3% Native American, 0.7% Asian, 0.1% Pacific Islander, 1.2% from other races, and 1.9% from two or more races. Hispanic or Latino of any race were 3.2% of the population.
The median household income in Northwest Harwinton was $68,750, and the median family income was $76,250. The per capita income for the town was $30,945. About 5.2% of families and 6.7% of the population were below the poverty line, including 8.2% of those under age 18 and 4.2% of those age 65 or over.
Conclusion
Northwest Harwinton, Connecticut is a small town located in the northwest corner of the state. It is bordered by the towns of Litchfield, Morris, and Burlington. The town has a population of approximately 4,000 people and covers an area of approximately 28 square miles. The town has a humid continental climate, with cold winters and warm summers. The economy of the town is primarily rural, with a small but growing number of businesses. The population of the town is mostly white, with a small percentage of other races. The median household income in the town is $68,750, and the per capita income is $30,945.
Common Questions
What is Per Capita Income in Northwest Harwinton?
Per Capita income in Northwest Harwinton is $48,836.
What is the Median Family Income in Northwest Harwinton?
Median Family Income in Northwest Harwinton is $93,950.
What is the Median Household income in Northwest Harwinton?
Median Household Income in Northwest Harwinton is $93,521.
What is Income or Wage Gap in Northwest Harwinton?
Income or Wage Gap in Northwest Harwinton is 22.1%.
Women in Northwest Harwinton earn 77.9 cents for every dollar earned by a man.
What is Inequality or Gini Index in Northwest Harwinton?
Inequality or Gini Index in Northwest Harwinton is 0.37.
What is the Total Population of Northwest Harwinton?
Total Population of Northwest Harwinton is 3,202.
What is the Total Male Population of Northwest Harwinton?
Total Male Population of Northwest Harwinton is 1,713.
What is the Total Female Population of Northwest Harwinton?
Total Female Population of Northwest Harwinton is 1,489.
What is the Ratio of Males per 100 Females in Northwest Harwinton?
There are 115.04 Males per 100 Females in Northwest Harwinton.
What is the Ratio of Females per 100 Males in Northwest Harwinton?
There are 86.92 Females per 100 Males in Northwest Harwinton.
What is the Median Population Age in Northwest Harwinton?
Median Population Age in Northwest Harwinton is 47.0 Years.
What is the Average Family Size in Northwest Harwinton
Average Family Size in Northwest Harwinton is 2.8 People.
What is the Average Household Size in Northwest Harwinton
Average Household Size in Northwest Harwinton is 2.4 People.
How Large is the Labor Force in Northwest Harwinton?
There are 1,705 People in the Labor Forcein in Northwest Harwinton.
What is the Percentage of People in the Labor Force in Northwest Harwinton?
67.9% of People are in the Labor Force in Northwest Harwinton.
What is the Unemployment Rate in Northwest Harwinton?
Unemployment Rate in Northwest Harwinton is 4.5%.