Hazardville, CT Map & Demographics
Hazardville Map
Hazardville Overview
$45,011
PER CAPITA INCOME
$115,391
AVG FAMILY INCOME
$93,486
AVG HOUSEHOLD INCOME
7.8%
WAGE / INCOME GAP [ % ]
92.2¢/ $1
WAGE / INCOME GAP [ $ ]
0.38
INEQUALITY / GINI INDEX
6,123
TOTAL POPULATION
3,172
MALE POPULATION
2,951
FEMALE POPULATION
107.49
MALES / 100 FEMALES
93.03
FEMALES / 100 MALES
43.9
MEDIAN AGE
2.8
AVG FAMILY SIZE
2.3
AVG HOUSEHOLD SIZE
3,411
LABOR FORCE [ PEOPLE ]
65.1%
PERCENT IN LABOR FORCE
4.3%
UNEMPLOYMENT RATE
Income in Hazardville
Income Overview in Hazardville
Per Capita Income in Hazardville is $45,011, while median incomes of families and households are $115,391 and $93,486 respectively.
| Characteristic | Number | Measure |
| Per Capita Income | 6,123 | $45,011 |
| Median Family Income | 1,634 | $115,391 |
| Mean Family Income | 1,634 | $127,548 |
| Median Household Income | 2,563 | $93,486 |
| Mean Household Income | 2,563 | $104,751 |
| Income Deficit | 1,634 | $0 |
| Wage / Income Gap (%) | 6,123 | 7.85% |
| Wage / Income Gap ($) | 6,123 | 92.15¢ per $1 |
| Gini / Inequality Index | 6,123 | 0.38 |
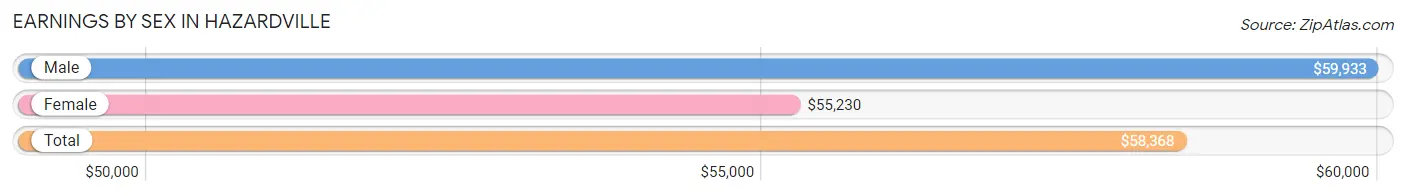
Earnings by Sex in Hazardville
Average Earnings in Hazardville are $58,368, $59,933 for men and $55,230 for women, a difference of 7.9%.
| Sex | Number | Average Earnings |
| Male | 1,815 (52.1%) | $59,933 |
| Female | 1,667 (47.9%) | $55,230 |
| Total | 3,482 (100.0%) | $58,368 |
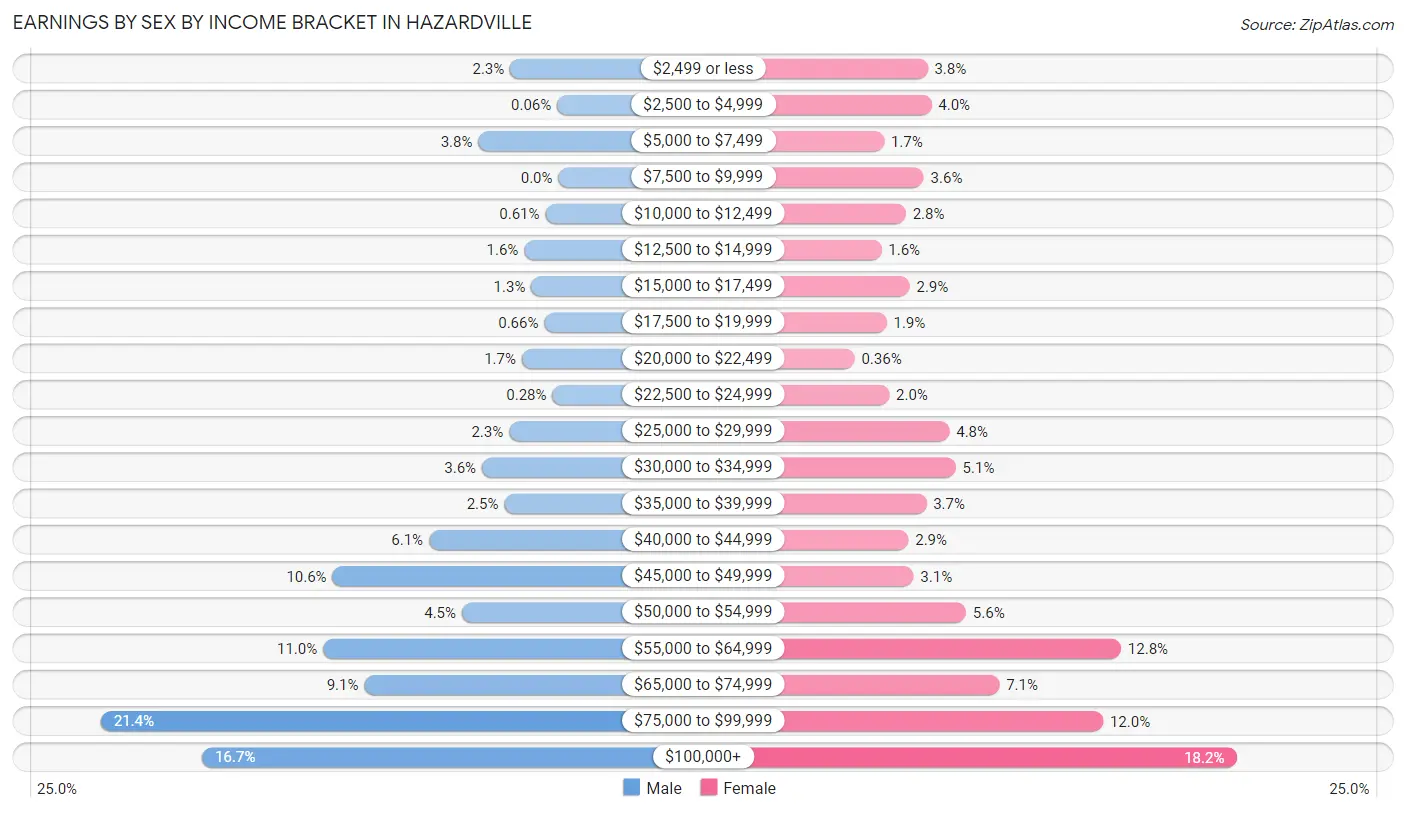
Earnings by Sex by Income Bracket in Hazardville
The most common earnings brackets in Hazardville are $75,000 to $99,999 for men (389 | 21.4%) and $100,000+ for women (304 | 18.2%).
| Income | Male | Female |
| $2,499 or less | 41 (2.3%) | 63 (3.8%) |
| $2,500 to $4,999 | 1 (0.1%) | 66 (4.0%) |
| $5,000 to $7,499 | 68 (3.7%) | 29 (1.7%) |
| $7,500 to $9,999 | 0 (0.0%) | 60 (3.6%) |
| $10,000 to $12,499 | 11 (0.6%) | 46 (2.8%) |
| $12,500 to $14,999 | 29 (1.6%) | 27 (1.6%) |
| $15,000 to $17,499 | 23 (1.3%) | 49 (2.9%) |
| $17,500 to $19,999 | 12 (0.7%) | 31 (1.9%) |
| $20,000 to $22,499 | 31 (1.7%) | 6 (0.4%) |
| $22,500 to $24,999 | 5 (0.3%) | 33 (2.0%) |
| $25,000 to $29,999 | 42 (2.3%) | 80 (4.8%) |
| $30,000 to $34,999 | 65 (3.6%) | 85 (5.1%) |
| $35,000 to $39,999 | 46 (2.5%) | 62 (3.7%) |
| $40,000 to $44,999 | 110 (6.1%) | 48 (2.9%) |
| $45,000 to $49,999 | 192 (10.6%) | 52 (3.1%) |
| $50,000 to $54,999 | 82 (4.5%) | 93 (5.6%) |
| $55,000 to $64,999 | 200 (11.0%) | 214 (12.8%) |
| $65,000 to $74,999 | 165 (9.1%) | 119 (7.1%) |
| $75,000 to $99,999 | 389 (21.4%) | 200 (12.0%) |
| $100,000+ | 303 (16.7%) | 304 (18.2%) |
| Total | 1,815 (100.0%) | 1,667 (100.0%) |
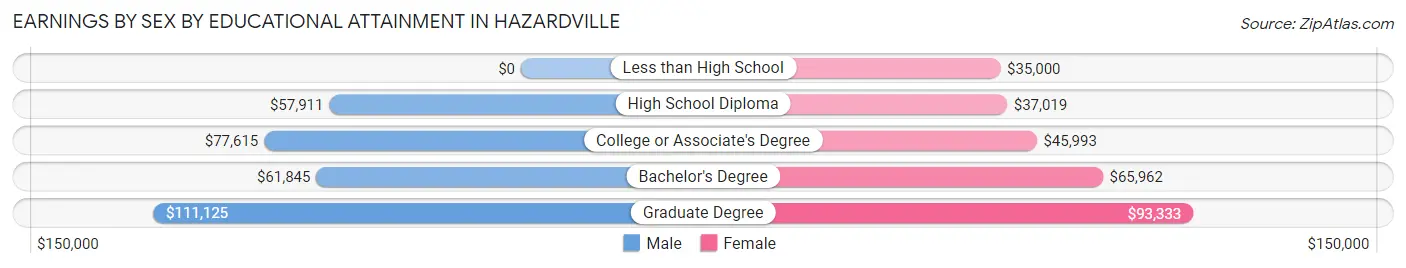
Earnings by Sex by Educational Attainment in Hazardville
Average earnings in Hazardville are $65,588 for men and $57,889 for women, a difference of 11.7%. Men with an educational attainment of graduate degree enjoy the highest average annual earnings of $111,125, while those with high school diploma education earn the least with $57,911. Women with an educational attainment of graduate degree earn the most with the average annual earnings of $93,333, while those with less than high school education have the smallest earnings of $35,000.
| Educational Attainment | Male Income | Female Income |
| Less than High School | - | - |
| High School Diploma | $57,911 | $37,019 |
| College or Associate's Degree | $77,615 | $45,993 |
| Bachelor's Degree | $61,845 | $65,962 |
| Graduate Degree | $111,125 | $93,333 |
| Total | $65,588 | $57,889 |
Family Income in Hazardville
Family Income Brackets in Hazardville
According to the Hazardville family income data, there are 443 families falling into the $100,000 to $149,999 income range, which is the most common income bracket and makes up 27.1% of all families.
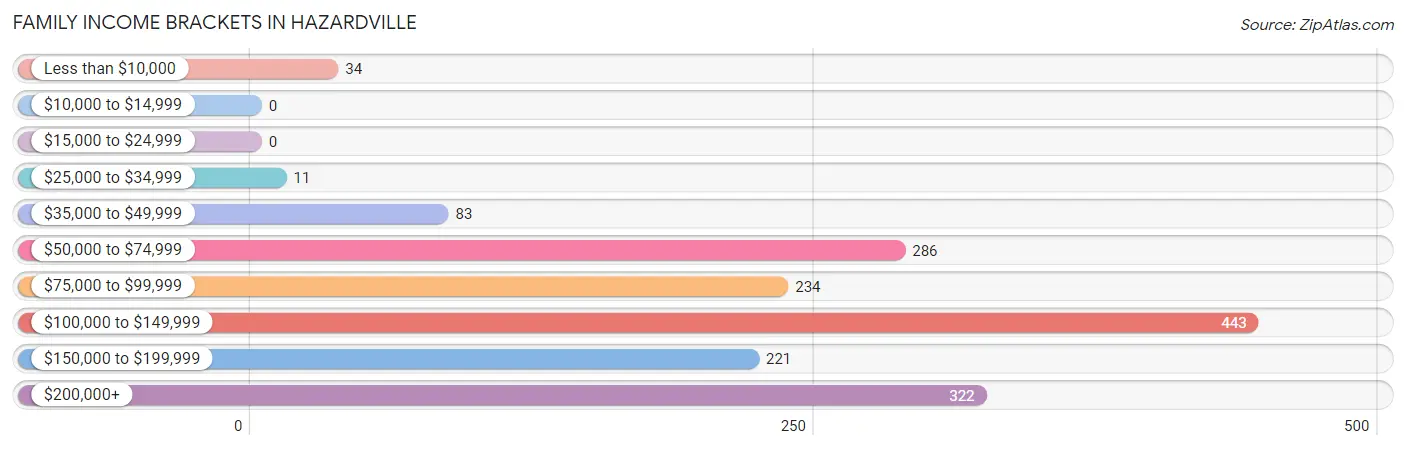
| Income Bracket | # Families | % Families |
| Less than $10,000 | 34 | 2.1% |
| $10,000 to $14,999 | 0 | 0.0% |
| $15,000 to $24,999 | 0 | 0.0% |
| $25,000 to $34,999 | 11 | 0.7% |
| $35,000 to $49,999 | 83 | 5.1% |
| $50,000 to $74,999 | 286 | 17.5% |
| $75,000 to $99,999 | 234 | 14.3% |
| $100,000 to $149,999 | 443 | 27.1% |
| $150,000 to $199,999 | 221 | 13.5% |
| $200,000+ | 322 | 19.7% |
Family Income by Famaliy Size in Hazardville
4-person families (175 | 10.7%) account for the highest median family income in Hazardville with $164,519 per family, while 2-person families (841 | 51.5%) have the highest median income of $58,304 per family member.
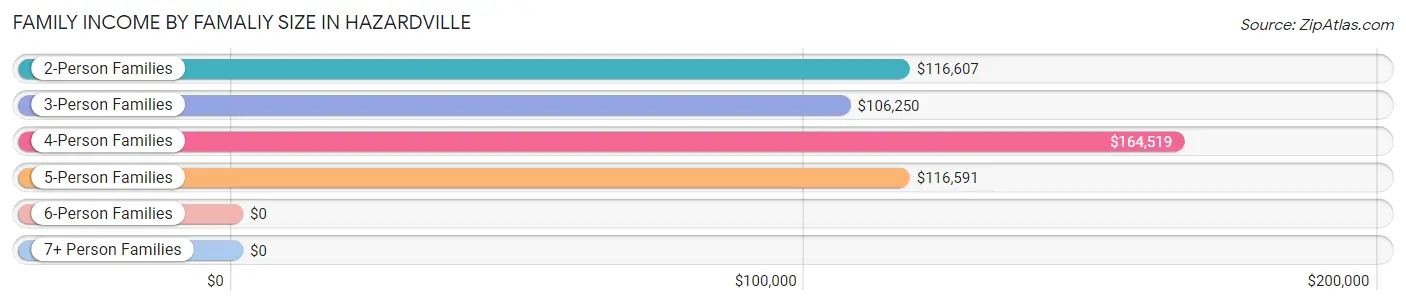
| Income Bracket | # Families | Median Income |
| 2-Person Families | 841 (51.5%) | $116,607 |
| 3-Person Families | 512 (31.3%) | $106,250 |
| 4-Person Families | 175 (10.7%) | $164,519 |
| 5-Person Families | 88 (5.4%) | $116,591 |
| 6-Person Families | 18 (1.1%) | $0 |
| 7+ Person Families | 0 (0.0%) | $0 |
| Total | 1,634 (100.0%) | $115,391 |
Family Income by Number of Earners in Hazardville
The median family income in Hazardville is $115,391, with families comprising 3+ earners (155) having the highest median family income of $154,792, while families with no earners (199) have the lowest median family income of $57,356, accounting for 9.5% and 12.2% of families, respectively.
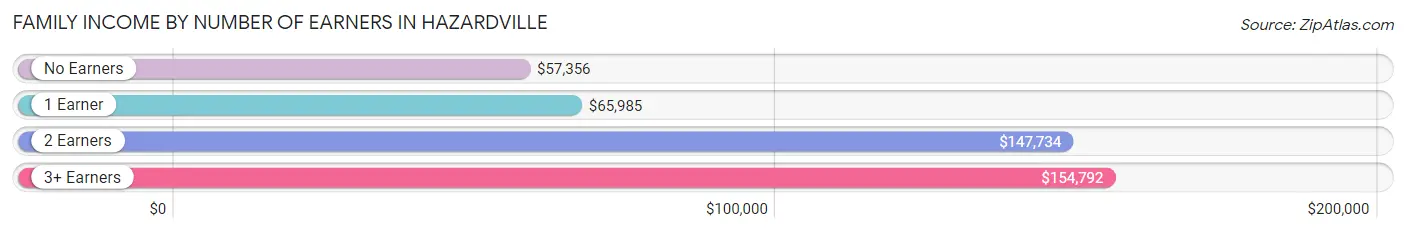
| Number of Earners | # Families | Median Income |
| No Earners | 199 (12.2%) | $57,356 |
| 1 Earner | 362 (22.2%) | $65,985 |
| 2 Earners | 918 (56.2%) | $147,734 |
| 3+ Earners | 155 (9.5%) | $154,792 |
| Total | 1,634 (100.0%) | $115,391 |
Household Income in Hazardville
Household Income Brackets in Hazardville
With 592 households falling in the category, the $100,000 to $149,999 income range is the most frequent in Hazardville, accounting for 23.1% of all households. In contrast, only 59 households (2.3%) fall into the $10,000 to $14,999 income bracket, making it the least populous group.
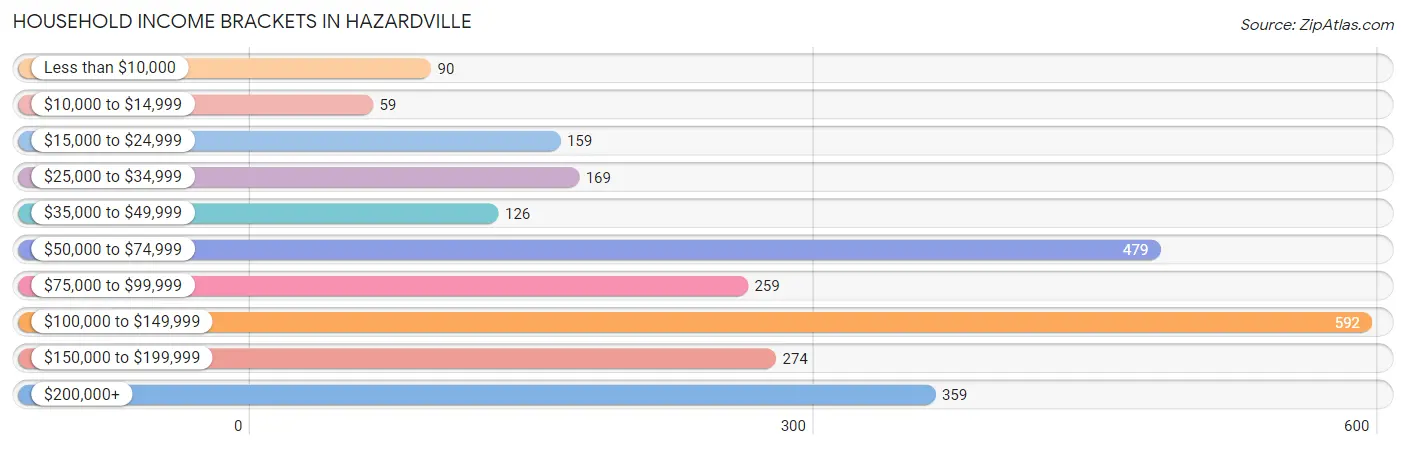
| Income Bracket | # Households | % Households |
| Less than $10,000 | 90 | 3.5% |
| $10,000 to $14,999 | 59 | 2.3% |
| $15,000 to $24,999 | 159 | 6.2% |
| $25,000 to $34,999 | 169 | 6.6% |
| $35,000 to $49,999 | 126 | 4.9% |
| $50,000 to $74,999 | 479 | 18.7% |
| $75,000 to $99,999 | 259 | 10.1% |
| $100,000 to $149,999 | 592 | 23.1% |
| $150,000 to $199,999 | 274 | 10.7% |
| $200,000+ | 359 | 14.0% |
Household Income by Householder Age in Hazardville
The median household income in Hazardville is $93,486, with the highest median household income of $116,029 found in the 45 to 64 years age bracket for the primary householder. A total of 988 households (38.6%) fall into this category. Meanwhile, the 15 to 24 years age bracket for the primary householder has the lowest median household income of $31,711, with 26 households (1.0%) in this group.
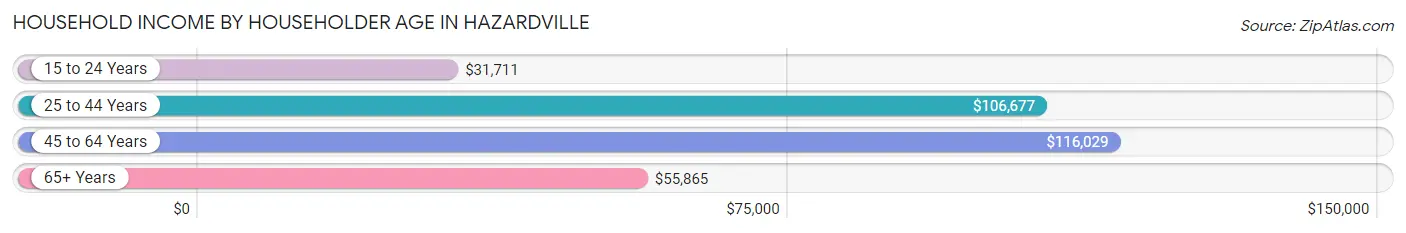
| Income Bracket | # Households | Median Income |
| 15 to 24 Years | 26 (1.0%) | $31,711 |
| 25 to 44 Years | 771 (30.1%) | $106,677 |
| 45 to 64 Years | 988 (38.6%) | $116,029 |
| 65+ Years | 778 (30.4%) | $55,865 |
| Total | 2,563 (100.0%) | $93,486 |
Poverty in Hazardville
Income Below Poverty by Sex and Age in Hazardville
With 3.7% poverty level for males and 7.3% for females among the residents of Hazardville, 6 to 11 year old males and 12 to 14 year old females are the most vulnerable to poverty, with 15 males (12.1%) and 19 females (21.8%) in their respective age groups living below the poverty level.
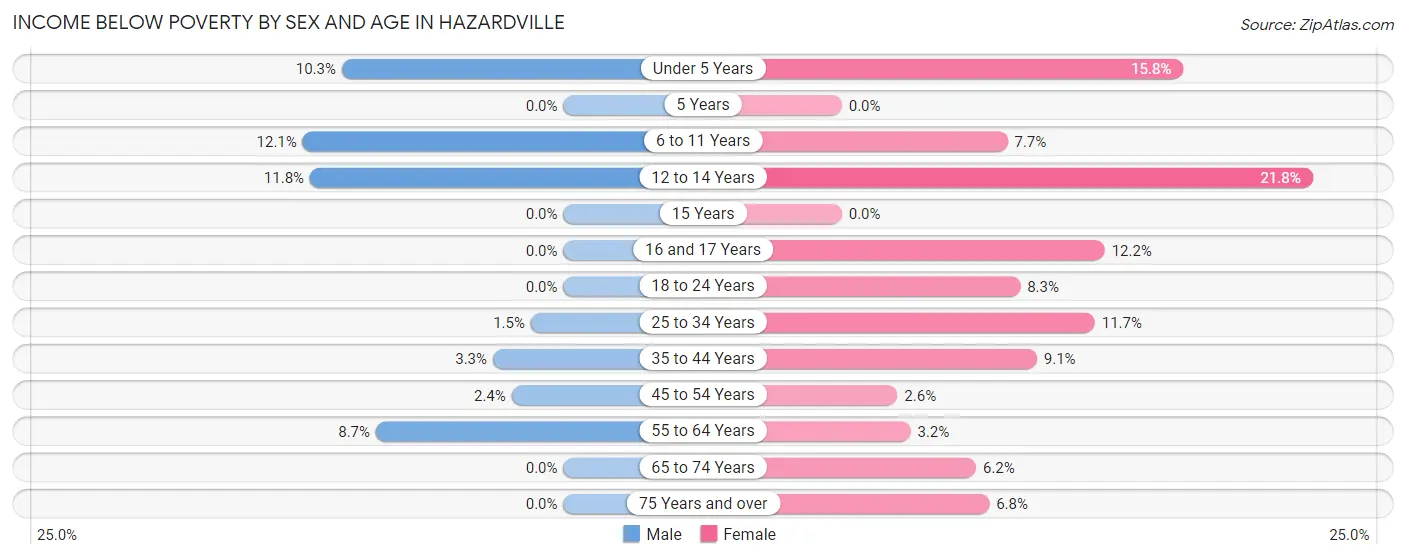
| Age Bracket | Male | Female |
| Under 5 Years | 22 (10.3%) | 16 (15.8%) |
| 5 Years | 0 (0.0%) | 0 (0.0%) |
| 6 to 11 Years | 15 (12.1%) | 14 (7.7%) |
| 12 to 14 Years | 4 (11.8%) | 19 (21.8%) |
| 15 Years | 0 (0.0%) | 0 (0.0%) |
| 16 and 17 Years | 0 (0.0%) | 5 (12.2%) |
| 18 to 24 Years | 0 (0.0%) | 12 (8.3%) |
| 25 to 34 Years | 6 (1.5%) | 35 (11.7%) |
| 35 to 44 Years | 15 (3.3%) | 44 (9.0%) |
| 45 to 54 Years | 12 (2.4%) | 12 (2.6%) |
| 55 to 64 Years | 32 (8.7%) | 14 (3.2%) |
| 65 to 74 Years | 0 (0.0%) | 21 (6.2%) |
| 75 Years and over | 0 (0.0%) | 21 (6.8%) |
| Total | 106 (3.7%) | 213 (7.3%) |
Income Above Poverty by Sex and Age in Hazardville
According to the poverty statistics in Hazardville, males aged 5 years and females aged 5 years are the age groups that are most secure financially, with 100.0% of males and 100.0% of females in these age groups living above the poverty line.
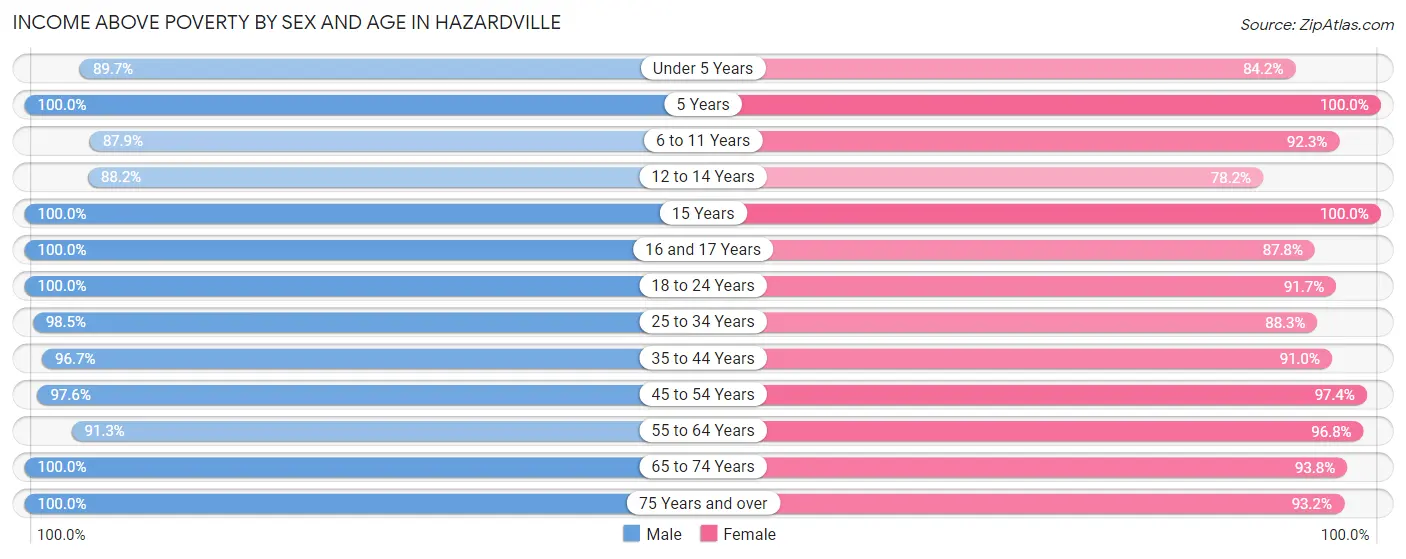
| Age Bracket | Male | Female |
| Under 5 Years | 192 (89.7%) | 85 (84.2%) |
| 5 Years | 54 (100.0%) | 22 (100.0%) |
| 6 to 11 Years | 109 (87.9%) | 168 (92.3%) |
| 12 to 14 Years | 30 (88.2%) | 68 (78.2%) |
| 15 Years | 20 (100.0%) | 5 (100.0%) |
| 16 and 17 Years | 48 (100.0%) | 36 (87.8%) |
| 18 to 24 Years | 152 (100.0%) | 133 (91.7%) |
| 25 to 34 Years | 392 (98.5%) | 263 (88.3%) |
| 35 to 44 Years | 444 (96.7%) | 442 (90.9%) |
| 45 to 54 Years | 487 (97.6%) | 454 (97.4%) |
| 55 to 64 Years | 336 (91.3%) | 425 (96.8%) |
| 65 to 74 Years | 314 (100.0%) | 316 (93.8%) |
| 75 Years and over | 196 (100.0%) | 286 (93.2%) |
| Total | 2,774 (96.3%) | 2,703 (92.7%) |
Income Below Poverty Among Married-Couple Families in Hazardville
The poverty statistics for married-couple families in Hazardville show that 0.6% or 8 of the total 1,351 families live below the poverty line. Families with 3 or 4 children have the highest poverty rate of 11.4%, comprising of 8 families. On the other hand, families with no children have the lowest poverty rate of 0.0%, which includes 0 families.
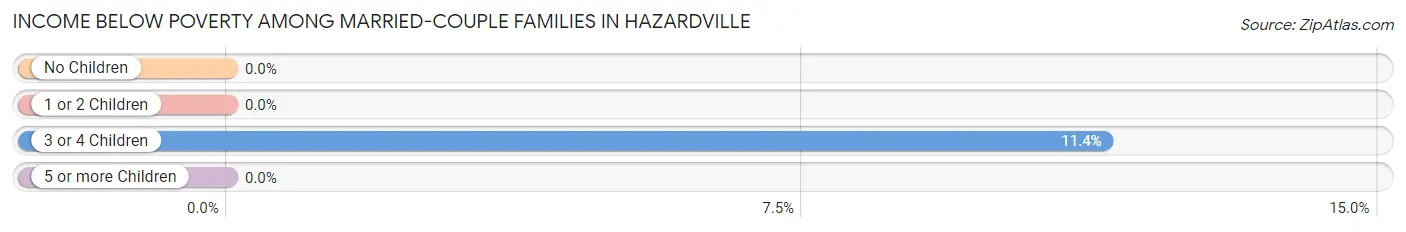
| Children | Above Poverty | Below Poverty |
| No Children | 907 (100.0%) | 0 (0.0%) |
| 1 or 2 Children | 374 (100.0%) | 0 (0.0%) |
| 3 or 4 Children | 62 (88.6%) | 8 (11.4%) |
| 5 or more Children | 0 (0.0%) | 0 (0.0%) |
| Total | 1,343 (99.4%) | 8 (0.6%) |
Income Below Poverty Among Single-Parent Households in Hazardville
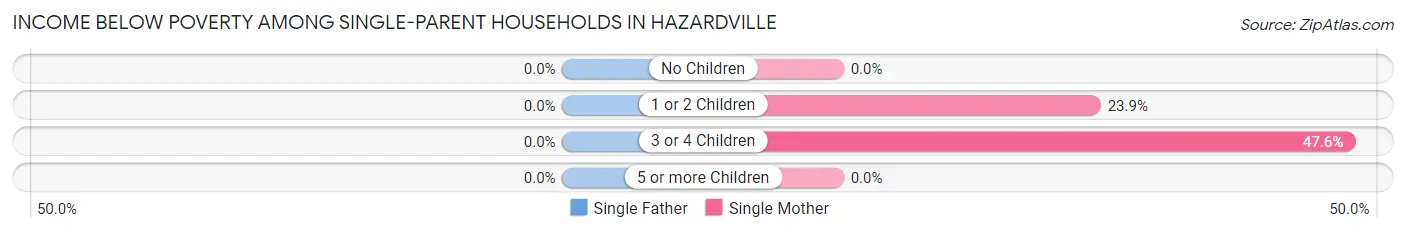
| Children | Single Father | Single Mother |
| No Children | 0 (0.0%) | 0 (0.0%) |
| 1 or 2 Children | 0 (0.0%) | 17 (23.9%) |
| 3 or 4 Children | 0 (0.0%) | 10 (47.6%) |
| 5 or more Children | 0 (0.0%) | 0 (0.0%) |
| Total | 0 (0.0%) | 27 (15.8%) |
Income Below Poverty Among Married-Couple vs Single-Parent Households in Hazardville
The poverty data for Hazardville shows that 8 of the married-couple family households (0.6%) and 27 of the single-parent households (9.5%) are living below the poverty level. Within the married-couple family households, those with 3 or 4 children have the highest poverty rate, with 8 households (11.4%) falling below the poverty line. Among the single-parent households, those with 3 or 4 children have the highest poverty rate, with 10 household (47.6%) living below poverty.
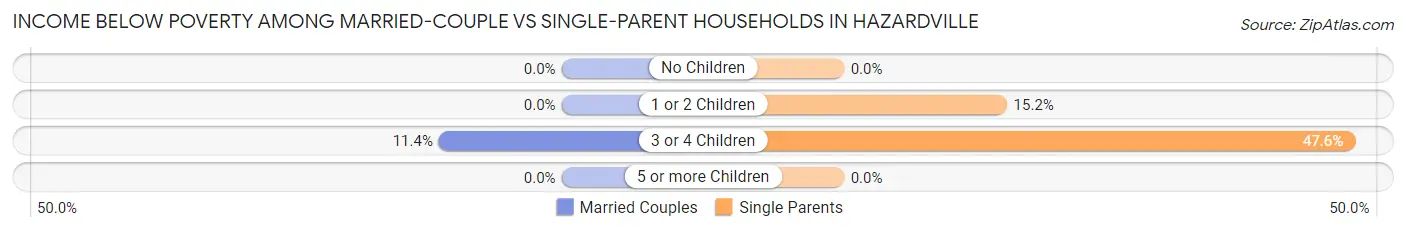
| Children | Married-Couple Families | Single-Parent Households |
| No Children | 0 (0.0%) | 0 (0.0%) |
| 1 or 2 Children | 0 (0.0%) | 17 (15.2%) |
| 3 or 4 Children | 8 (11.4%) | 10 (47.6%) |
| 5 or more Children | 0 (0.0%) | 0 (0.0%) |
| Total | 8 (0.6%) | 27 (9.5%) |
Race in Hazardville
The most populous races in Hazardville are White / Caucasian (5,391 | 88.0%), Hispanic or Latino (530 | 8.7%), and Two or more Races (360 | 5.9%).
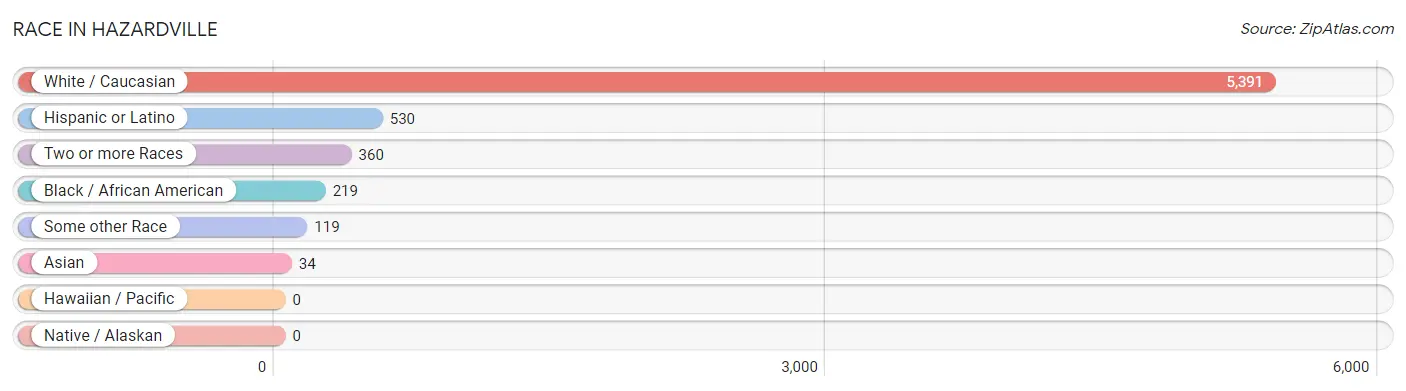
| Race | # Population | % Population |
| Asian | 34 | 0.6% |
| Black / African American | 219 | 3.6% |
| Hawaiian / Pacific | 0 | 0.0% |
| Hispanic or Latino | 530 | 8.7% |
| Native / Alaskan | 0 | 0.0% |
| White / Caucasian | 5,391 | 88.0% |
| Two or more Races | 360 | 5.9% |
| Some other Race | 119 | 1.9% |
| Total | 6,123 | 100.0% |
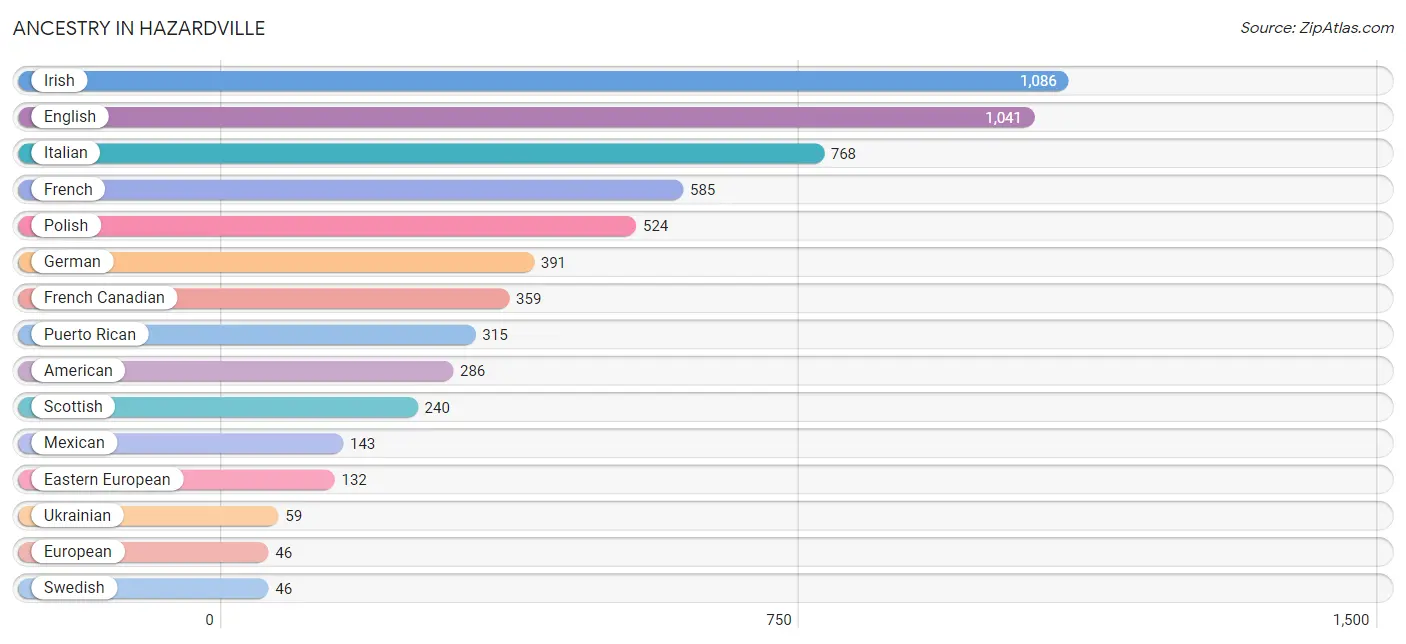
Ancestry in Hazardville
The most populous ancestries reported in Hazardville are Irish (1,086 | 17.7%), English (1,041 | 17.0%), Italian (768 | 12.5%), French (585 | 9.6%), and Polish (524 | 8.6%), together accounting for 65.4% of all Hazardville residents.
| Ancestry | # Population | % Population |
| African | 11 | 0.2% |
| American | 286 | 4.7% |
| Arab | 14 | 0.2% |
| Armenian | 4 | 0.1% |
| Austrian | 16 | 0.3% |
| Bhutanese | 17 | 0.3% |
| Brazilian | 5 | 0.1% |
| British | 19 | 0.3% |
| Canadian | 20 | 0.3% |
| Central American | 20 | 0.3% |
| Cherokee | 10 | 0.2% |
| Czechoslovakian | 4 | 0.1% |
| Danish | 4 | 0.1% |
| Dutch | 42 | 0.7% |
| Eastern European | 132 | 2.2% |
| English | 1,041 | 17.0% |
| European | 46 | 0.7% |
| Finnish | 7 | 0.1% |
| French | 585 | 9.6% |
| French American Indian | 12 | 0.2% |
| French Canadian | 359 | 5.9% |
| German | 391 | 6.4% |
| Greek | 8 | 0.1% |
| Guyanese | 8 | 0.1% |
| Hungarian | 14 | 0.2% |
| Irish | 1,086 | 17.7% |
| Italian | 768 | 12.5% |
| Jamaican | 12 | 0.2% |
| Japanese | 3 | 0.1% |
| Korean | 43 | 0.7% |
| Latvian | 8 | 0.1% |
| Lithuanian | 26 | 0.4% |
| Malaysian | 27 | 0.4% |
| Mexican | 143 | 2.3% |
| Moroccan | 14 | 0.2% |
| New Zealander | 1 | 0.0% |
| Nicaraguan | 20 | 0.3% |
| Norwegian | 41 | 0.7% |
| Polish | 524 | 8.6% |
| Portuguese | 15 | 0.2% |
| Puerto Rican | 315 | 5.1% |
| Russian | 24 | 0.4% |
| Scandinavian | 22 | 0.4% |
| Scotch-Irish | 17 | 0.3% |
| Scottish | 240 | 3.9% |
| Slovak | 5 | 0.1% |
| Slovene | 4 | 0.1% |
| Subsaharan African | 11 | 0.2% |
| Swedish | 46 | 0.7% |
| Swiss | 6 | 0.1% |
| Thai | 13 | 0.2% |
| Turkish | 14 | 0.2% |
| Ukrainian | 59 | 1.0% |
| Welsh | 25 | 0.4% | View All 54 Rows |
Immigrants in Hazardville
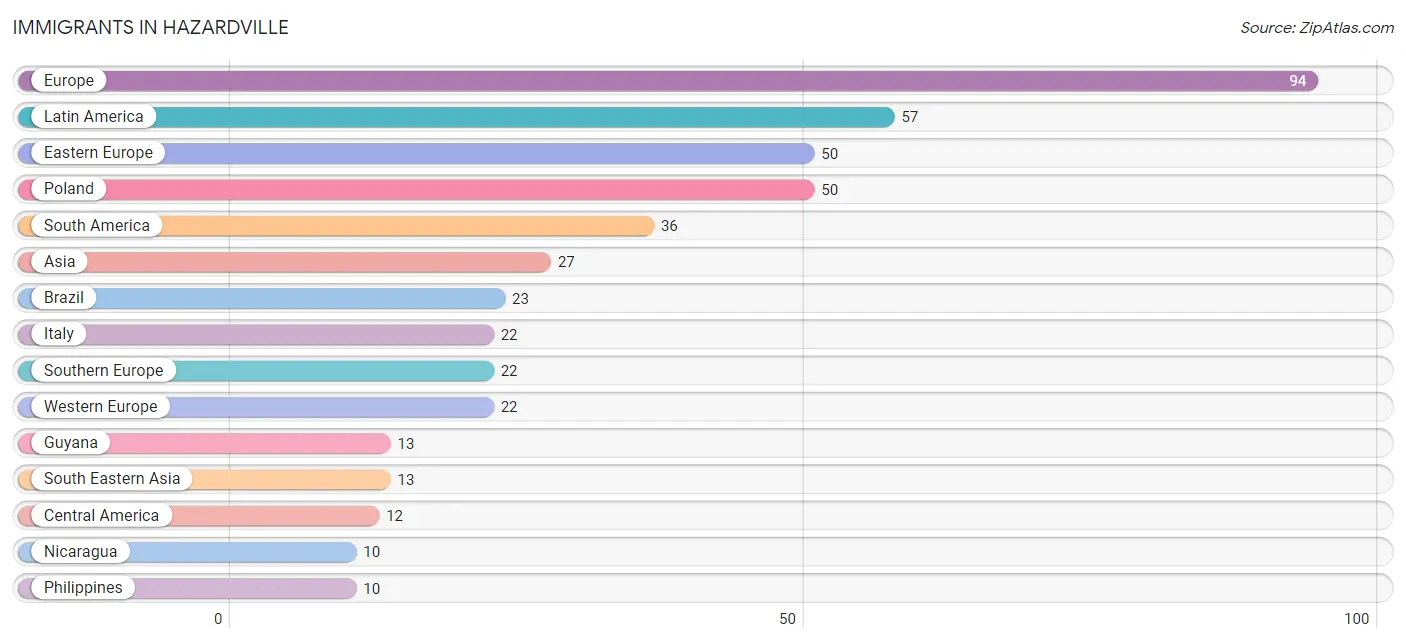
The most numerous immigrant groups reported in Hazardville came from Europe (94 | 1.5%), Latin America (57 | 0.9%), Eastern Europe (50 | 0.8%), Poland (50 | 0.8%), and South America (36 | 0.6%), together accounting for 4.7% of all Hazardville residents.
| Immigration Origin | # Population | % Population |
| Africa | 7 | 0.1% |
| Asia | 27 | 0.4% |
| Brazil | 23 | 0.4% |
| Cambodia | 3 | 0.1% |
| Canada | 4 | 0.1% |
| Caribbean | 9 | 0.2% |
| Central America | 12 | 0.2% |
| Eastern Europe | 50 | 0.8% |
| Europe | 94 | 1.5% |
| France | 6 | 0.1% |
| Germany | 8 | 0.1% |
| Guyana | 13 | 0.2% |
| India | 9 | 0.2% |
| Italy | 22 | 0.4% |
| Jamaica | 9 | 0.2% |
| Latin America | 57 | 0.9% |
| Mexico | 2 | 0.0% |
| Morocco | 7 | 0.1% |
| Netherlands | 8 | 0.1% |
| Nicaragua | 10 | 0.2% |
| Northern Africa | 7 | 0.1% |
| Oceania | 1 | 0.0% |
| Philippines | 10 | 0.2% |
| Poland | 50 | 0.8% |
| South America | 36 | 0.6% |
| South Central Asia | 9 | 0.2% |
| South Eastern Asia | 13 | 0.2% |
| Southern Europe | 22 | 0.4% |
| Turkey | 5 | 0.1% |
| Western Asia | 5 | 0.1% |
| Western Europe | 22 | 0.4% | View All 31 Rows |
Sex and Age in Hazardville
Sex and Age in Hazardville
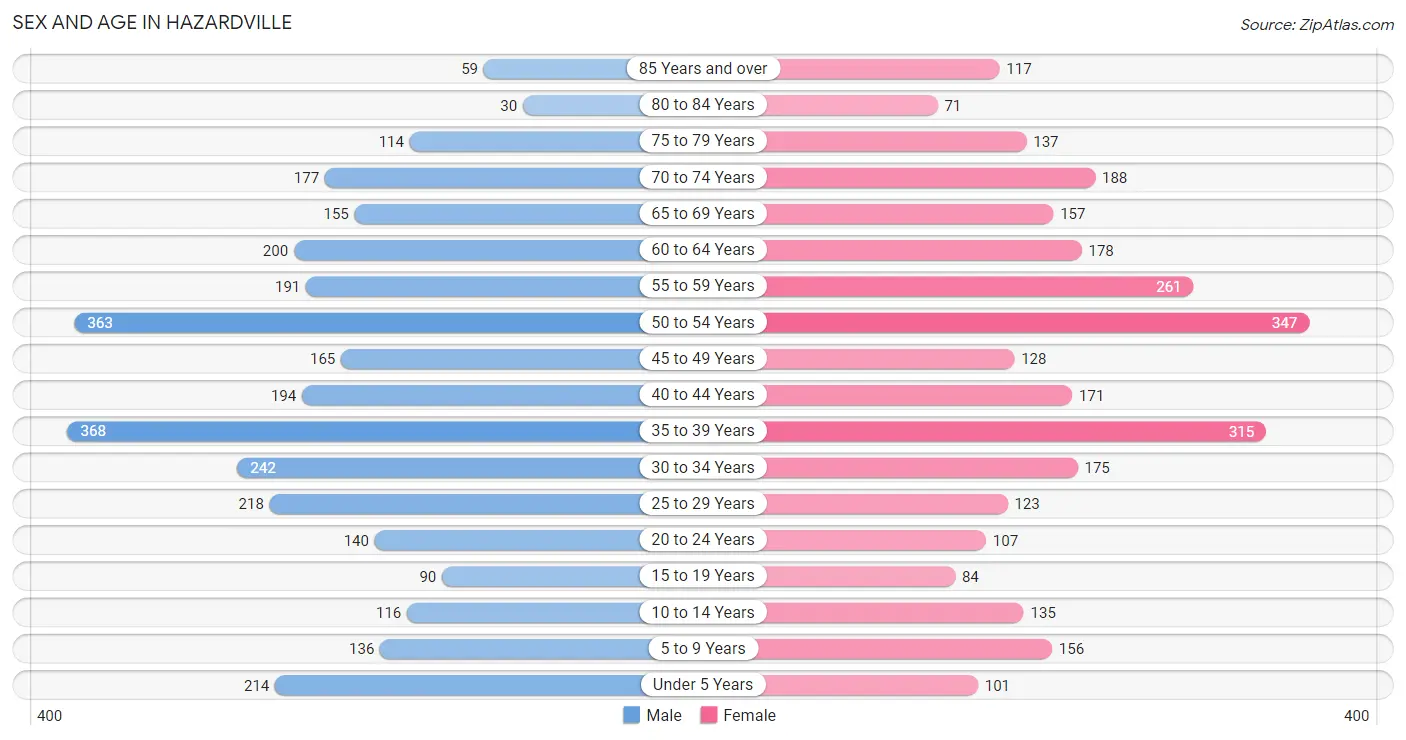
The most populous age groups in Hazardville are 35 to 39 Years (368 | 11.6%) for men and 50 to 54 Years (347 | 11.8%) for women.
| Age Bracket | Male | Female |
| Under 5 Years | 214 (6.8%) | 101 (3.4%) |
| 5 to 9 Years | 136 (4.3%) | 156 (5.3%) |
| 10 to 14 Years | 116 (3.7%) | 135 (4.6%) |
| 15 to 19 Years | 90 (2.8%) | 84 (2.9%) |
| 20 to 24 Years | 140 (4.4%) | 107 (3.6%) |
| 25 to 29 Years | 218 (6.9%) | 123 (4.2%) |
| 30 to 34 Years | 242 (7.6%) | 175 (5.9%) |
| 35 to 39 Years | 368 (11.6%) | 315 (10.7%) |
| 40 to 44 Years | 194 (6.1%) | 171 (5.8%) |
| 45 to 49 Years | 165 (5.2%) | 128 (4.3%) |
| 50 to 54 Years | 363 (11.4%) | 347 (11.8%) |
| 55 to 59 Years | 191 (6.0%) | 261 (8.8%) |
| 60 to 64 Years | 200 (6.3%) | 178 (6.0%) |
| 65 to 69 Years | 155 (4.9%) | 157 (5.3%) |
| 70 to 74 Years | 177 (5.6%) | 188 (6.4%) |
| 75 to 79 Years | 114 (3.6%) | 137 (4.6%) |
| 80 to 84 Years | 30 (0.9%) | 71 (2.4%) |
| 85 Years and over | 59 (1.9%) | 117 (4.0%) |
| Total | 3,172 (100.0%) | 2,951 (100.0%) |
Families and Households in Hazardville
Median Family Size in Hazardville
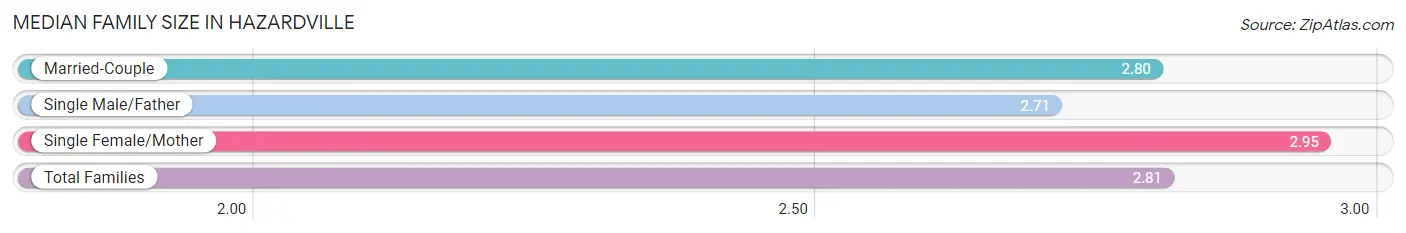
The median family size in Hazardville is 2.81 persons per family, with single female/mother families (171 | 10.5%) accounting for the largest median family size of 2.95 persons per family. On the other hand, single male/father families (112 | 6.9%) represent the smallest median family size with 2.71 persons per family.
| Family Type | # Families | Family Size |
| Married-Couple | 1,351 (82.7%) | 2.80 |
| Single Male/Father | 112 (6.9%) | 2.71 |
| Single Female/Mother | 171 (10.5%) | 2.95 |
| Total Families | 1,634 (100.0%) | 2.81 |
Median Household Size in Hazardville
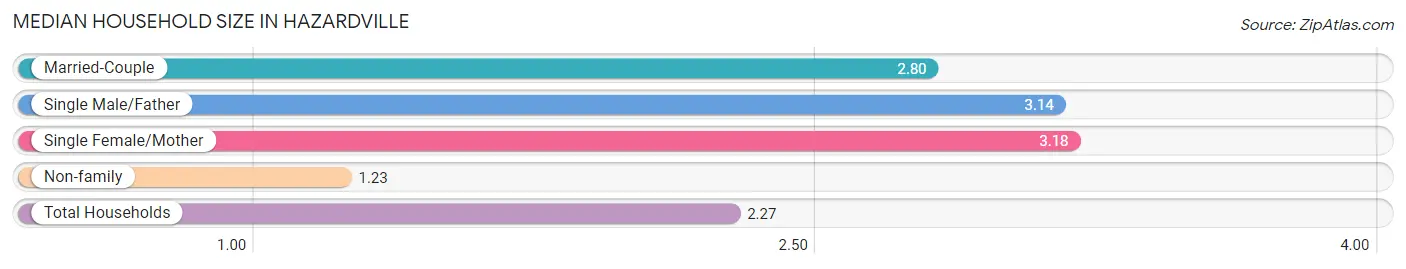
The median household size in Hazardville is 2.27 persons per household, with single female/mother households (171 | 6.7%) accounting for the largest median household size of 3.18 persons per household. non-family households (929 | 36.2%) represent the smallest median household size with 1.23 persons per household.
| Household Type | # Households | Household Size |
| Married-Couple | 1,351 (52.7%) | 2.80 |
| Single Male/Father | 112 (4.4%) | 3.14 |
| Single Female/Mother | 171 (6.7%) | 3.18 |
| Non-family | 929 (36.2%) | 1.23 |
| Total Households | 2,563 (100.0%) | 2.27 |
Household Size by Marriage Status in Hazardville
Out of a total of 2,563 households in Hazardville, 1,634 (63.7%) are family households, while 929 (36.2%) are nonfamily households. The most numerous type of family households are 2-person households, comprising 811, and the most common type of nonfamily households are 1-person households, comprising 762.
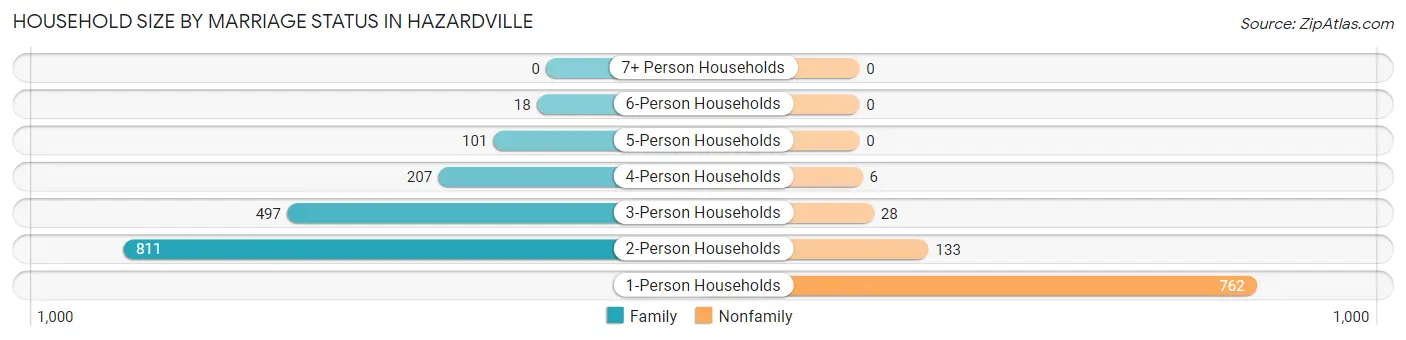
| Household Size | Family Households | Nonfamily Households |
| 1-Person Households | - | 762 (29.7%) |
| 2-Person Households | 811 (31.6%) | 133 (5.2%) |
| 3-Person Households | 497 (19.4%) | 28 (1.1%) |
| 4-Person Households | 207 (8.1%) | 6 (0.2%) |
| 5-Person Households | 101 (3.9%) | 0 (0.0%) |
| 6-Person Households | 18 (0.7%) | 0 (0.0%) |
| 7+ Person Households | 0 (0.0%) | 0 (0.0%) |
| Total | 1,634 (63.7%) | 929 (36.2%) |
Female Fertility in Hazardville
Fertility by Age in Hazardville
Average fertility rate in Hazardville is 41.0 births per 1,000 women. Women in the age bracket of 20 to 34 years have the highest fertility rate with 114.0 births per 1,000 women. Women in the age bracket of 20 to 34 years acount for 86.8% of all women with births.
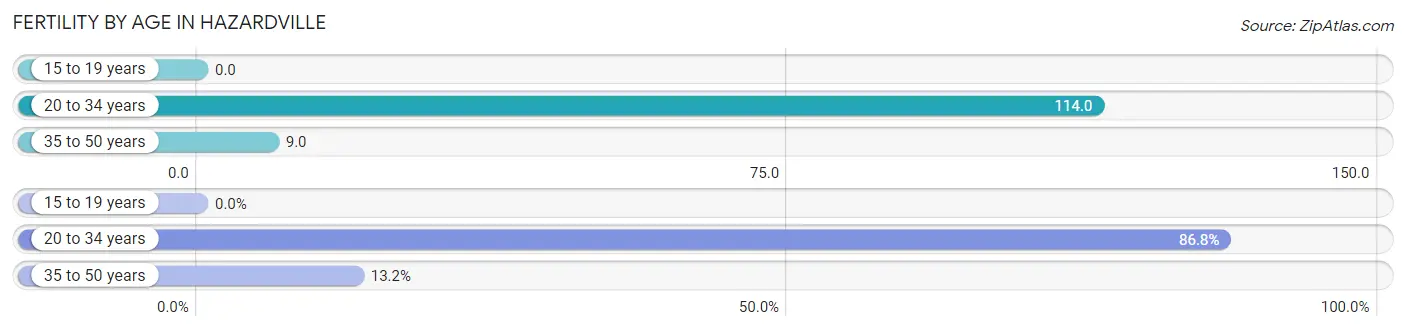
| Age Bracket | Women with Births | Births / 1,000 Women |
| 15 to 19 years | 0 (0.0%) | 0.0 |
| 20 to 34 years | 46 (86.8%) | 114.0 |
| 35 to 50 years | 7 (13.2%) | 9.0 |
| Total | 53 (100.0%) | 41.0 |
Fertility by Age by Marriage Status in Hazardville
52.8% of women with births (53) in Hazardville are married. The highest percentage of unmarried women with births falls into 35 to 50 years age bracket with 71.4% of them unmarried at the time of birth, while the lowest percentage of unmarried women with births belong to 20 to 34 years age bracket with 43.5% of them unmarried.
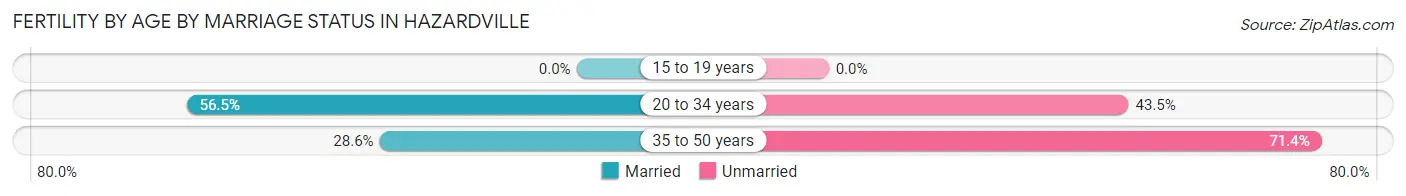
| Age Bracket | Married | Unmarried |
| 15 to 19 years | 0 (0.0%) | 0 (0.0%) |
| 20 to 34 years | 26 (56.5%) | 20 (43.5%) |
| 35 to 50 years | 2 (28.6%) | 5 (71.4%) |
| Total | 28 (52.8%) | 25 (47.2%) |
Fertility by Education in Hazardville
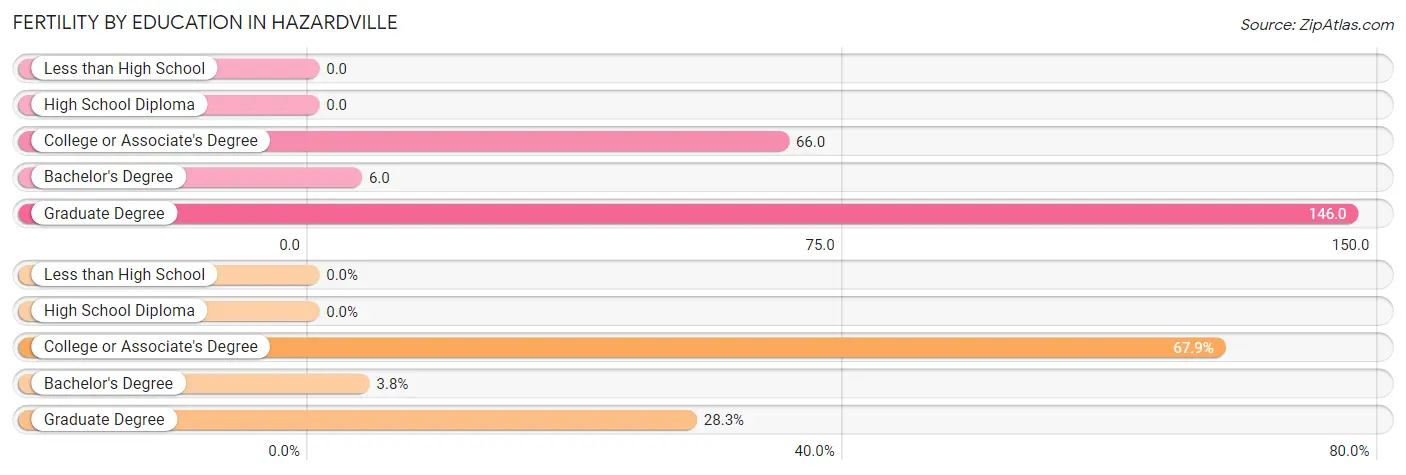
| Educational Attainment | Women with Births | Births / 1,000 Women |
| Less than High School | 0 (0.0%) | 0.0 |
| High School Diploma | 0 (0.0%) | 0.0 |
| College or Associate's Degree | 36 (67.9%) | 66.0 |
| Bachelor's Degree | 2 (3.8%) | 6.0 |
| Graduate Degree | 15 (28.3%) | 146.0 |
| Total | 53 (100.0%) | 41.0 |
Fertility by Education by Marriage Status in Hazardville
47.2% of women with births in Hazardville are unmarried. Women with the educational attainment of bachelor's degree are most likely to be married with 100.0% of them married at childbirth, while women with the educational attainment of college or associate's degree are least likely to be married with 69.4% of them unmarried at childbirth.
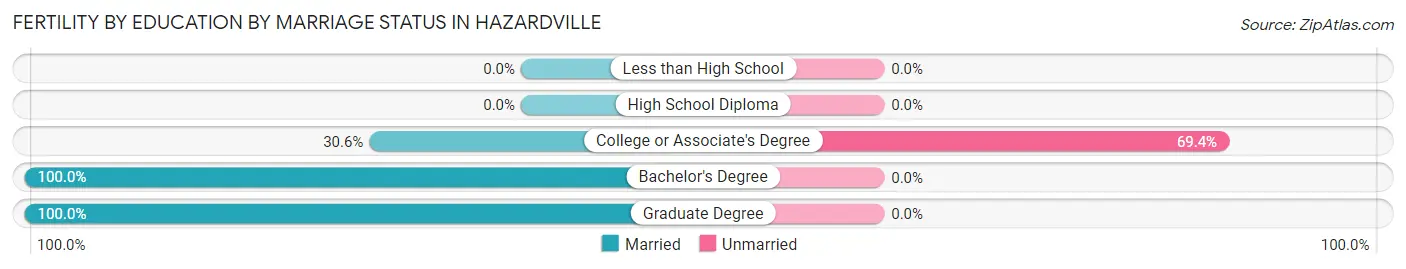
| Educational Attainment | Married | Unmarried |
| Less than High School | 0 (0.0%) | 0 (0.0%) |
| High School Diploma | 0 (0.0%) | 0 (0.0%) |
| College or Associate's Degree | 11 (30.6%) | 25 (69.4%) |
| Bachelor's Degree | 2 (100.0%) | 0 (0.0%) |
| Graduate Degree | 15 (100.0%) | 0 (0.0%) |
| Total | 28 (52.8%) | 25 (47.2%) |
Employment Characteristics in Hazardville
Employment by Class of Employer in Hazardville
Among the 3,211 employed individuals in Hazardville, private company employees (2,424 | 75.5%), local government employees (197 | 6.1%), and not-for-profit organizations (153 | 4.8%) make up the most common classes of employment.
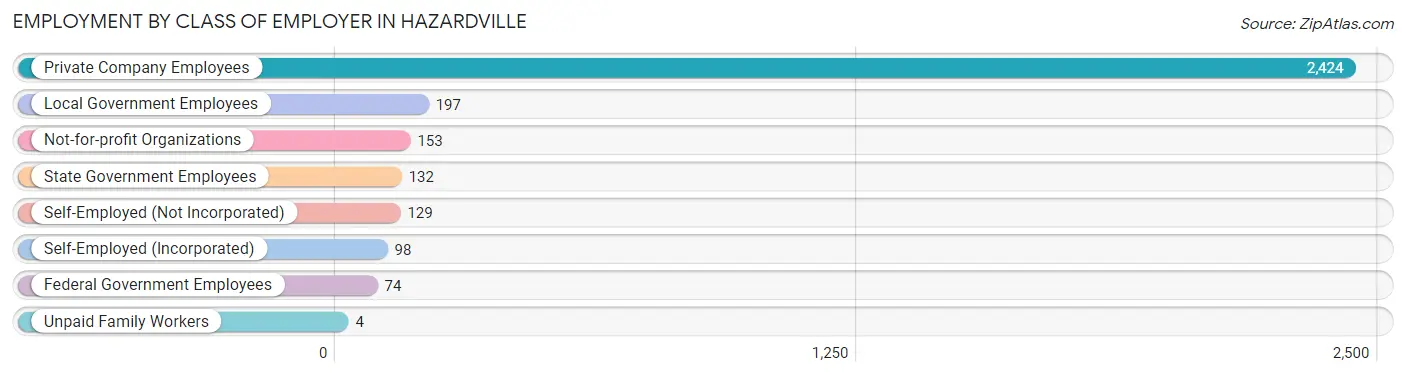
| Employer Class | # Employees | % Employees |
| Private Company Employees | 2,424 | 75.5% |
| Self-Employed (Incorporated) | 98 | 3.0% |
| Self-Employed (Not Incorporated) | 129 | 4.0% |
| Not-for-profit Organizations | 153 | 4.8% |
| Local Government Employees | 197 | 6.1% |
| State Government Employees | 132 | 4.1% |
| Federal Government Employees | 74 | 2.3% |
| Unpaid Family Workers | 4 | 0.1% |
| Total | 3,211 | 100.0% |
Employment Status by Age in Hazardville
According to the labor force statistics for Hazardville, out of the total population over 16 years of age (5,240), 65.1% or 3,411 individuals are in the labor force, with 4.3% or 147 of them unemployed. The age group with the highest labor force participation rate is 45 to 54 years, with 90.5% or 908 individuals in the labor force. Within the labor force, the 16 to 19 years age range has the highest percentage of unemployed individuals, with 60.0% or 39 of them being unemployed.
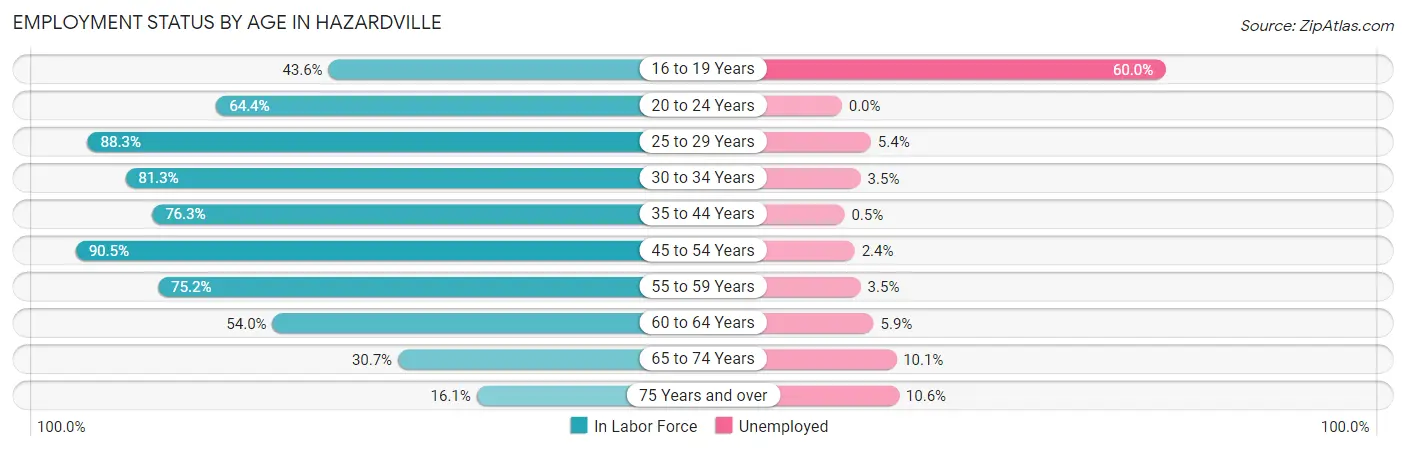
| Age Bracket | In Labor Force | Unemployed |
| 16 to 19 Years | 65 (43.6%) | 39 (60.0%) |
| 20 to 24 Years | 159 (64.4%) | 0 (0.0%) |
| 25 to 29 Years | 301 (88.3%) | 16 (5.4%) |
| 30 to 34 Years | 339 (81.3%) | 12 (3.5%) |
| 35 to 44 Years | 800 (76.3%) | 4 (0.5%) |
| 45 to 54 Years | 908 (90.5%) | 22 (2.4%) |
| 55 to 59 Years | 340 (75.2%) | 12 (3.5%) |
| 60 to 64 Years | 204 (54.0%) | 12 (5.9%) |
| 65 to 74 Years | 208 (30.7%) | 21 (10.1%) |
| 75 Years and over | 85 (16.1%) | 9 (10.6%) |
| Total | 3,411 (65.1%) | 147 (4.3%) |
Employment Status by Educational Attainment in Hazardville
According to labor force statistics for Hazardville, 79.5% of individuals (2,893) out of the total population between 25 and 64 years of age (3,639) are in the labor force, with 2.7% or 78 of them being unemployed. The group with the highest labor force participation rate are those with the educational attainment of bachelor's degree or higher, with 89.4% or 882 individuals in the labor force. Within the labor force, individuals with high school diploma education have the highest percentage of unemployment, with 6.7% or 51 of them being unemployed.
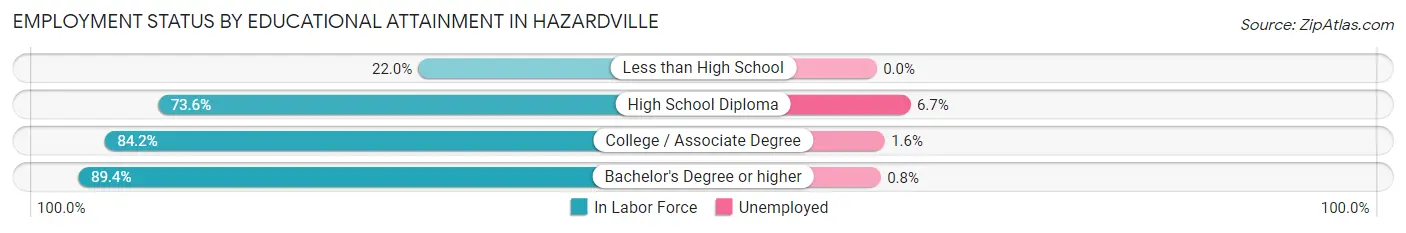
| Educational Attainment | In Labor Force | Unemployed |
| Less than High School | 40 (22.0%) | 0 (0.0%) |
| High School Diploma | 765 (73.6%) | 70 (6.7%) |
| College / Associate Degree | 1,205 (84.2%) | 23 (1.6%) |
| Bachelor's Degree or higher | 882 (89.4%) | 8 (0.8%) |
| Total | 2,893 (79.5%) | 98 (2.7%) |
Employment Occupations by Sex in Hazardville
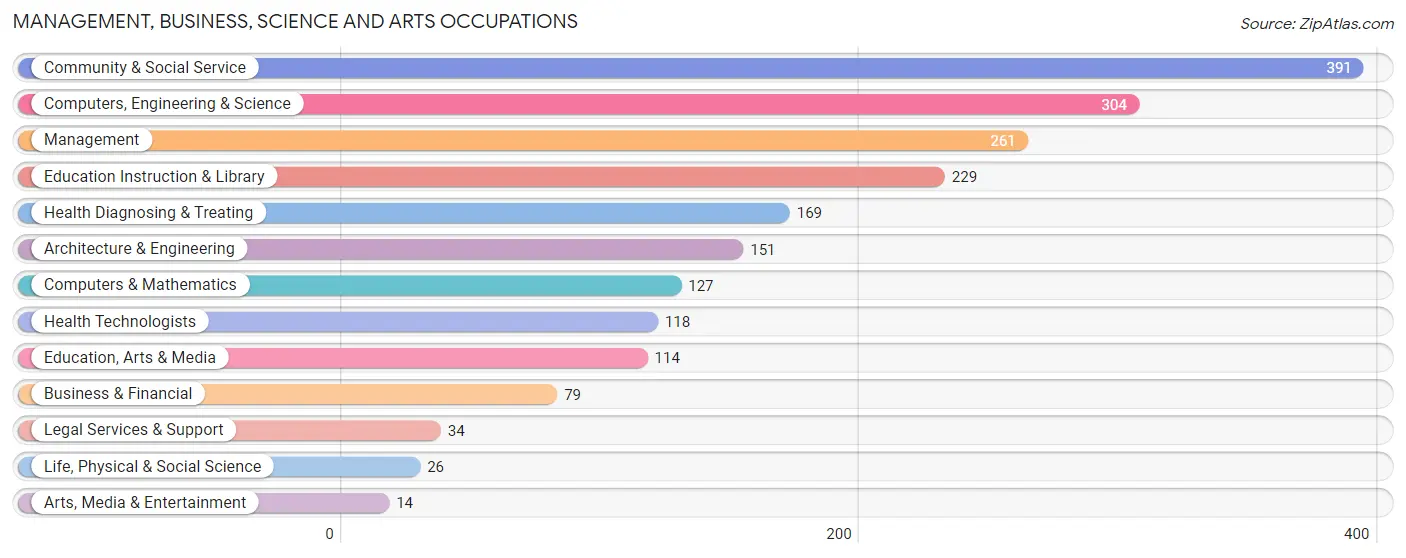
Management, Business, Science and Arts Occupations
The most common Management, Business, Science and Arts occupations in Hazardville are Community & Social Service (391 | 12.1%), Computers, Engineering & Science (304 | 9.4%), Management (261 | 8.1%), Education Instruction & Library (229 | 7.1%), and Health Diagnosing & Treating (169 | 5.2%).
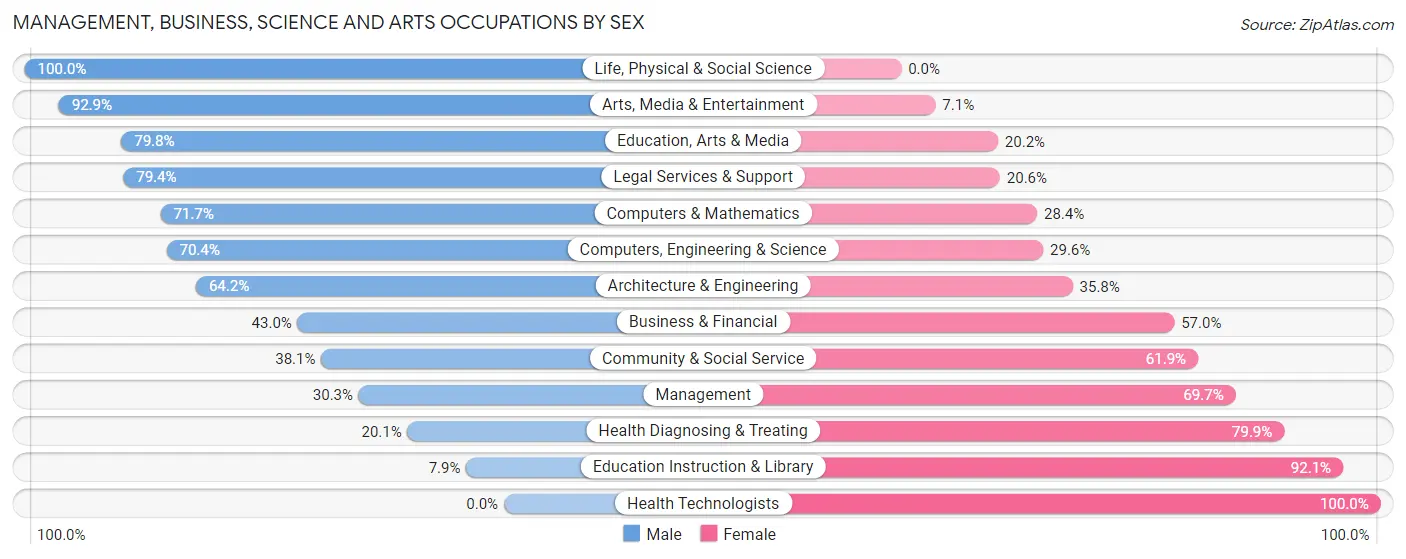
Management, Business, Science and Arts Occupations by Sex
Within the Management, Business, Science and Arts occupations in Hazardville, the most male-oriented occupations are Life, Physical & Social Science (100.0%), Arts, Media & Entertainment (92.9%), and Education, Arts & Media (79.8%), while the most female-oriented occupations are Health Technologists (100.0%), Education Instruction & Library (92.1%), and Health Diagnosing & Treating (79.9%).
| Occupation | Male | Female |
| Management | 79 (30.3%) | 182 (69.7%) |
| Business & Financial | 34 (43.0%) | 45 (57.0%) |
| Computers, Engineering & Science | 214 (70.4%) | 90 (29.6%) |
| Computers & Mathematics | 91 (71.7%) | 36 (28.3%) |
| Architecture & Engineering | 97 (64.2%) | 54 (35.8%) |
| Life, Physical & Social Science | 26 (100.0%) | 0 (0.0%) |
| Community & Social Service | 149 (38.1%) | 242 (61.9%) |
| Education, Arts & Media | 91 (79.8%) | 23 (20.2%) |
| Legal Services & Support | 27 (79.4%) | 7 (20.6%) |
| Education Instruction & Library | 18 (7.9%) | 211 (92.1%) |
| Arts, Media & Entertainment | 13 (92.9%) | 1 (7.1%) |
| Health Diagnosing & Treating | 34 (20.1%) | 135 (79.9%) |
| Health Technologists | 0 (0.0%) | 118 (100.0%) |
| Total (Category) | 510 (42.4%) | 694 (57.6%) |
| Total (Overall) | 1,677 (52.1%) | 1,544 (47.9%) |
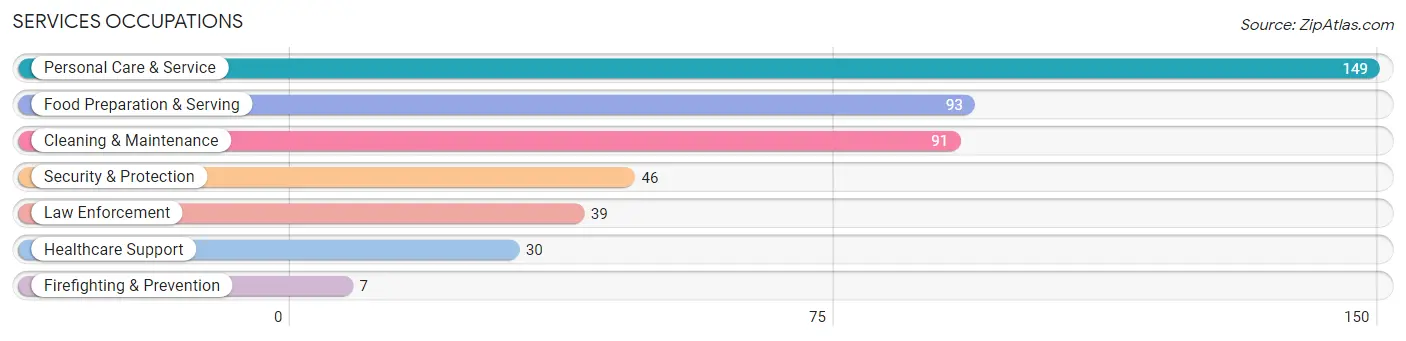
Services Occupations
The most common Services occupations in Hazardville are Personal Care & Service (149 | 4.6%), Food Preparation & Serving (93 | 2.9%), Cleaning & Maintenance (91 | 2.8%), Security & Protection (46 | 1.4%), and Law Enforcement (39 | 1.2%).
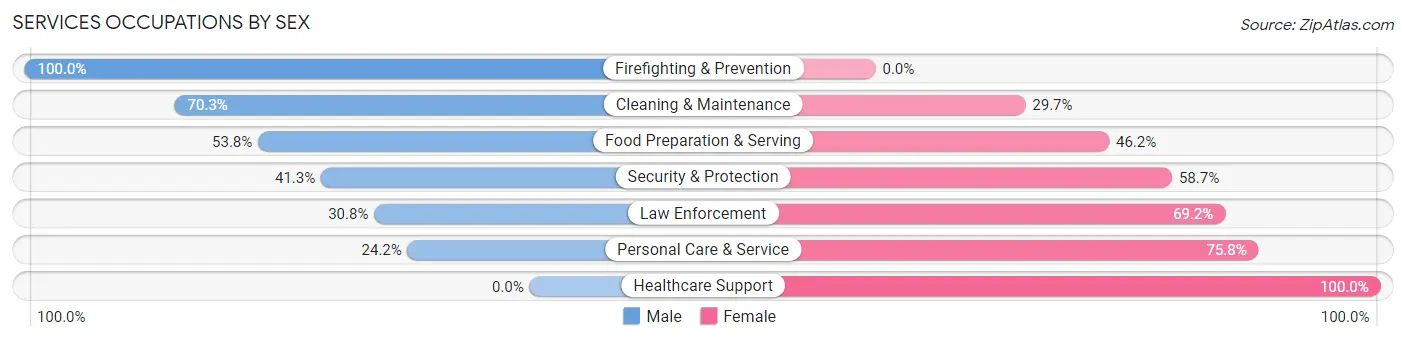
Services Occupations by Sex
Within the Services occupations in Hazardville, the most male-oriented occupations are Firefighting & Prevention (100.0%), Cleaning & Maintenance (70.3%), and Food Preparation & Serving (53.8%), while the most female-oriented occupations are Healthcare Support (100.0%), Personal Care & Service (75.8%), and Law Enforcement (69.2%).
| Occupation | Male | Female |
| Healthcare Support | 0 (0.0%) | 30 (100.0%) |
| Security & Protection | 19 (41.3%) | 27 (58.7%) |
| Firefighting & Prevention | 7 (100.0%) | 0 (0.0%) |
| Law Enforcement | 12 (30.8%) | 27 (69.2%) |
| Food Preparation & Serving | 50 (53.8%) | 43 (46.2%) |
| Cleaning & Maintenance | 64 (70.3%) | 27 (29.7%) |
| Personal Care & Service | 36 (24.2%) | 113 (75.8%) |
| Total (Category) | 169 (41.3%) | 240 (58.7%) |
| Total (Overall) | 1,677 (52.1%) | 1,544 (47.9%) |
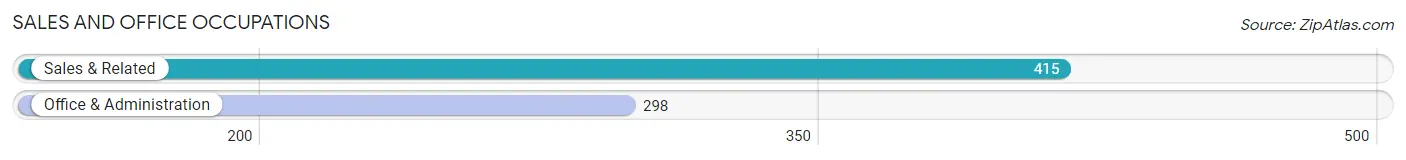
Sales and Office Occupations
The most common Sales and Office occupations in Hazardville are Sales & Related (415 | 12.9%), and Office & Administration (298 | 9.2%).
Sales and Office Occupations by Sex
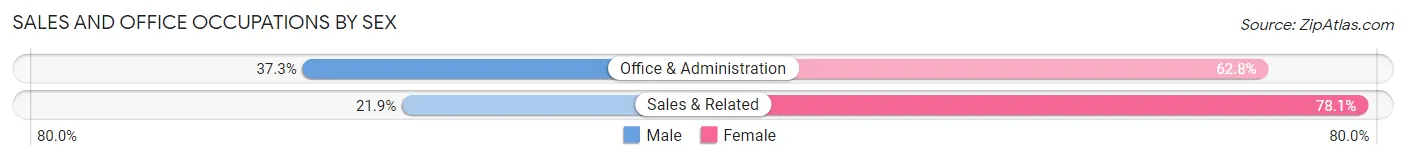
| Occupation | Male | Female |
| Sales & Related | 91 (21.9%) | 324 (78.1%) |
| Office & Administration | 111 (37.2%) | 187 (62.7%) |
| Total (Category) | 202 (28.3%) | 511 (71.7%) |
| Total (Overall) | 1,677 (52.1%) | 1,544 (47.9%) |
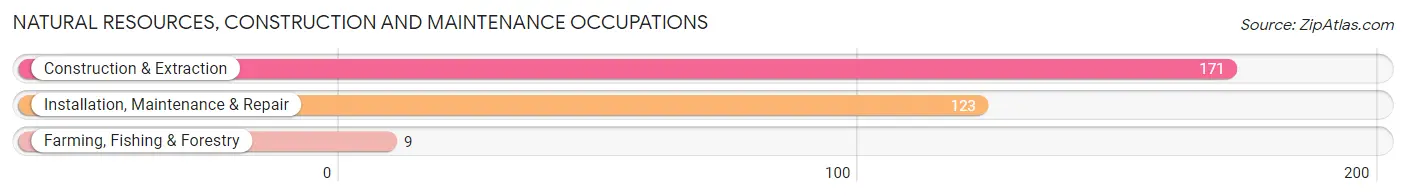
Natural Resources, Construction and Maintenance Occupations
The most common Natural Resources, Construction and Maintenance occupations in Hazardville are Construction & Extraction (171 | 5.3%), Installation, Maintenance & Repair (123 | 3.8%), and Farming, Fishing & Forestry (9 | 0.3%).
Natural Resources, Construction and Maintenance Occupations by Sex
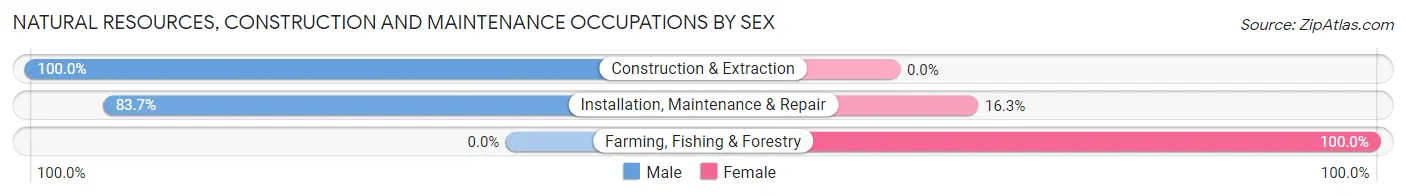
| Occupation | Male | Female |
| Farming, Fishing & Forestry | 0 (0.0%) | 9 (100.0%) |
| Construction & Extraction | 171 (100.0%) | 0 (0.0%) |
| Installation, Maintenance & Repair | 103 (83.7%) | 20 (16.3%) |
| Total (Category) | 274 (90.4%) | 29 (9.6%) |
| Total (Overall) | 1,677 (52.1%) | 1,544 (47.9%) |
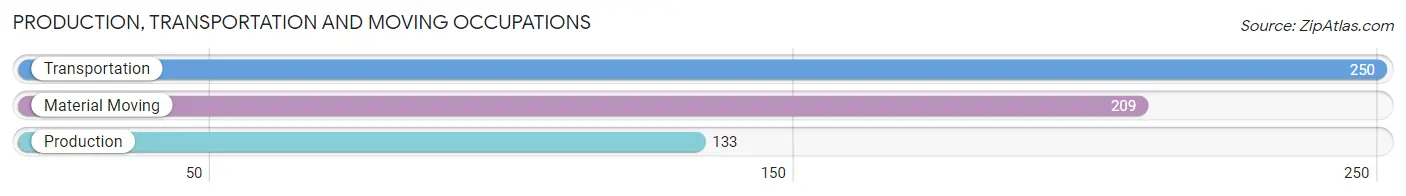
Production, Transportation and Moving Occupations
The most common Production, Transportation and Moving occupations in Hazardville are Transportation (250 | 7.8%), Material Moving (209 | 6.5%), and Production (133 | 4.1%).
Production, Transportation and Moving Occupations by Sex
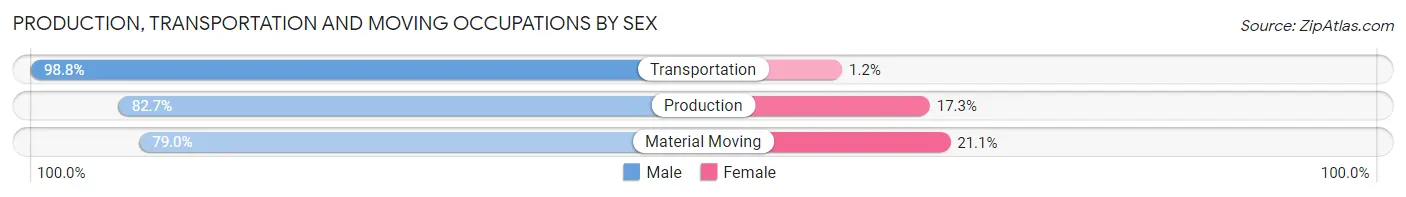
| Occupation | Male | Female |
| Production | 110 (82.7%) | 23 (17.3%) |
| Transportation | 247 (98.8%) | 3 (1.2%) |
| Material Moving | 165 (78.9%) | 44 (21.0%) |
| Total (Category) | 522 (88.2%) | 70 (11.8%) |
| Total (Overall) | 1,677 (52.1%) | 1,544 (47.9%) |
Employment Industries by Sex in Hazardville
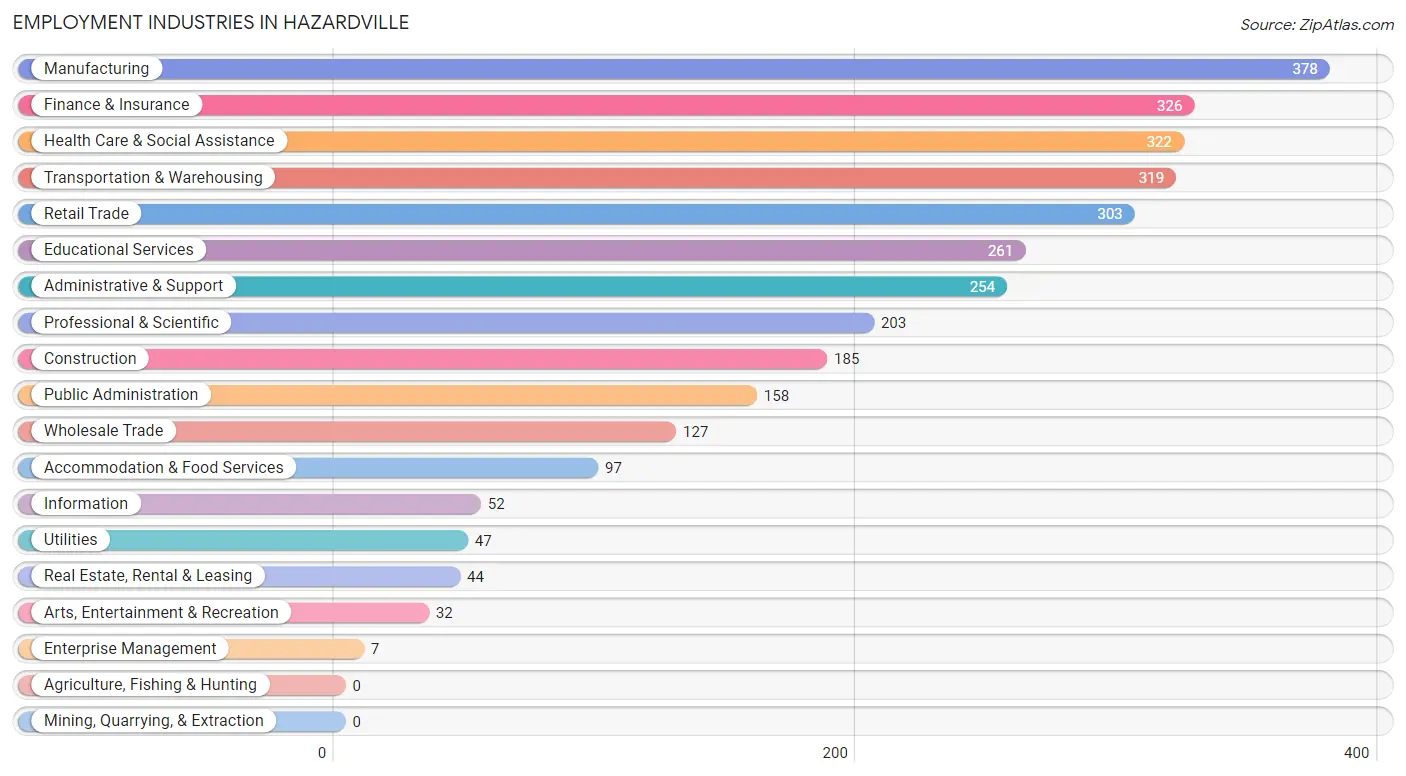
Employment Industries in Hazardville
The major employment industries in Hazardville include Manufacturing (378 | 11.7%), Finance & Insurance (326 | 10.1%), Health Care & Social Assistance (322 | 10.0%), Transportation & Warehousing (319 | 9.9%), and Retail Trade (303 | 9.4%).
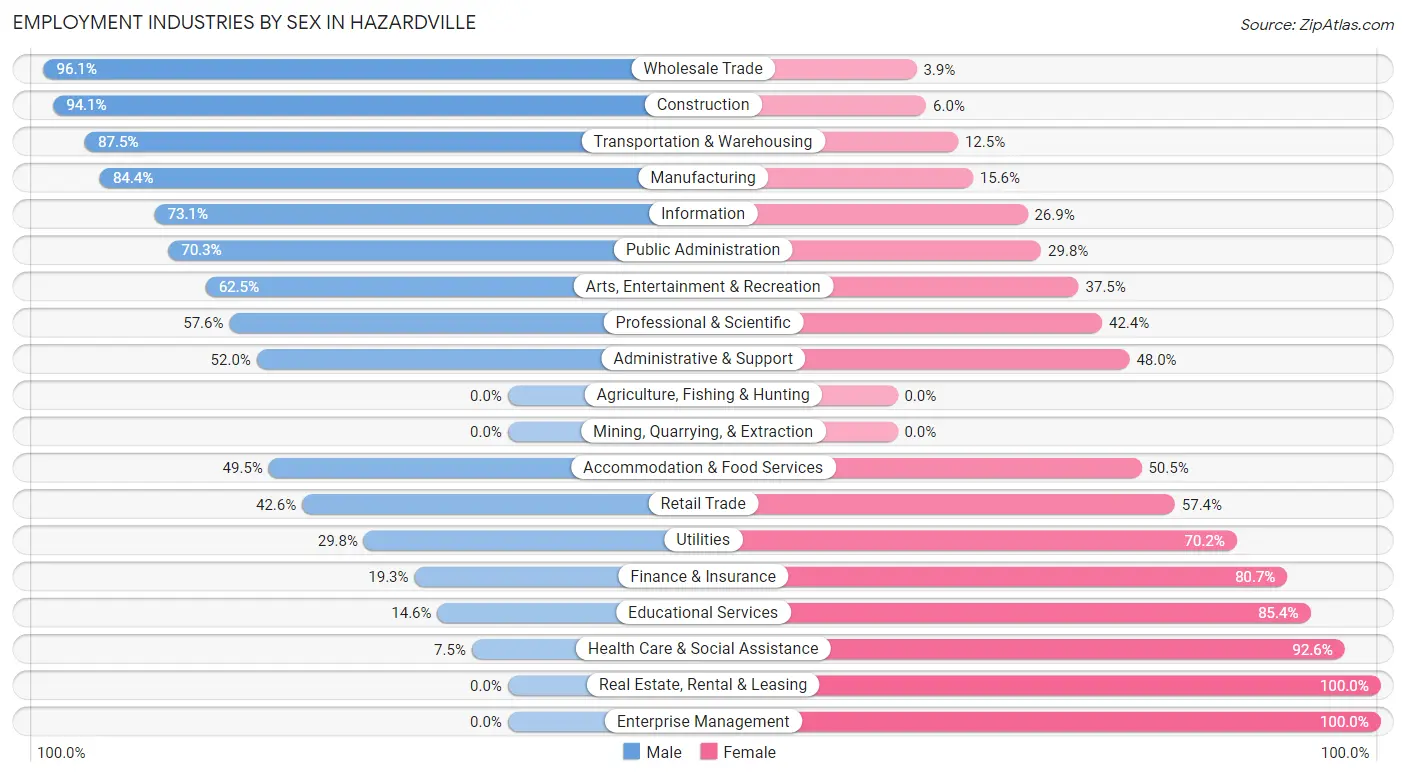
Employment Industries by Sex in Hazardville
The Hazardville industries that see more men than women are Wholesale Trade (96.1%), Construction (94.1%), and Transportation & Warehousing (87.5%), whereas the industries that tend to have a higher number of women are Real Estate, Rental & Leasing (100.0%), Enterprise Management (100.0%), and Health Care & Social Assistance (92.5%).
| Industry | Male | Female |
| Agriculture, Fishing & Hunting | 0 (0.0%) | 0 (0.0%) |
| Mining, Quarrying, & Extraction | 0 (0.0%) | 0 (0.0%) |
| Construction | 174 (94.1%) | 11 (5.9%) |
| Manufacturing | 319 (84.4%) | 59 (15.6%) |
| Wholesale Trade | 122 (96.1%) | 5 (3.9%) |
| Retail Trade | 129 (42.6%) | 174 (57.4%) |
| Transportation & Warehousing | 279 (87.5%) | 40 (12.5%) |
| Utilities | 14 (29.8%) | 33 (70.2%) |
| Information | 38 (73.1%) | 14 (26.9%) |
| Finance & Insurance | 63 (19.3%) | 263 (80.7%) |
| Real Estate, Rental & Leasing | 0 (0.0%) | 44 (100.0%) |
| Professional & Scientific | 117 (57.6%) | 86 (42.4%) |
| Enterprise Management | 0 (0.0%) | 7 (100.0%) |
| Administrative & Support | 132 (52.0%) | 122 (48.0%) |
| Educational Services | 38 (14.6%) | 223 (85.4%) |
| Health Care & Social Assistance | 24 (7.4%) | 298 (92.5%) |
| Arts, Entertainment & Recreation | 20 (62.5%) | 12 (37.5%) |
| Accommodation & Food Services | 48 (49.5%) | 49 (50.5%) |
| Public Administration | 111 (70.3%) | 47 (29.7%) |
| Total | 1,677 (52.1%) | 1,544 (47.9%) |
Education in Hazardville
School Enrollment in Hazardville
The most common levels of schooling among the 959 students in Hazardville are elementary school (298 | 31.1%), college / undergraduate (180 | 18.8%), and high school (164 | 17.1%).
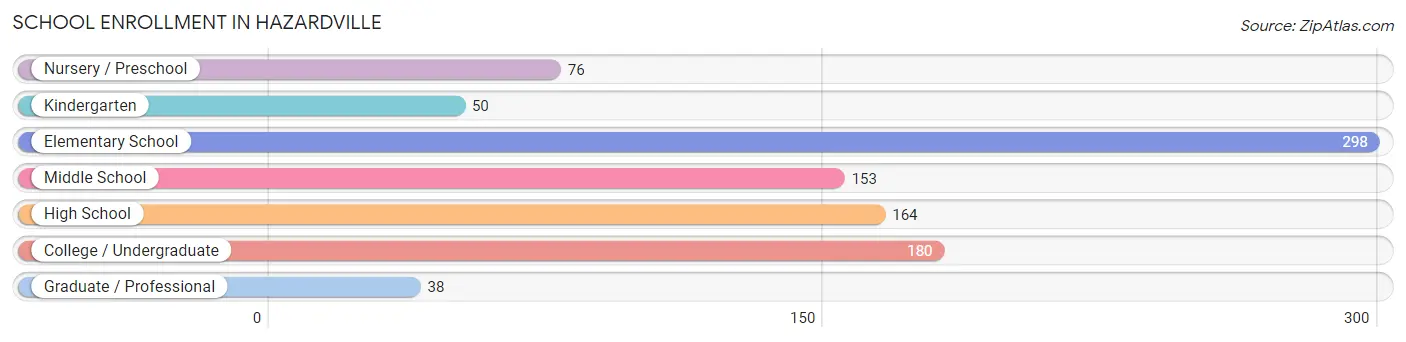
| School Level | # Students | % Students |
| Nursery / Preschool | 76 | 7.9% |
| Kindergarten | 50 | 5.2% |
| Elementary School | 298 | 31.1% |
| Middle School | 153 | 16.0% |
| High School | 164 | 17.1% |
| College / Undergraduate | 180 | 18.8% |
| Graduate / Professional | 38 | 4.0% |
| Total | 959 | 100.0% |
School Enrollment by Age by Funding Source in Hazardville
Out of a total of 959 students who are enrolled in schools in Hazardville, 217 (22.6%) attend a private institution, while the remaining 742 (77.4%) are enrolled in public schools. The age group of 3 to 4 year olds has the highest likelihood of being enrolled in private schools, with 56 (87.5% in the age bracket) enrolled. Conversely, the age group of 18 to 19 year olds has the lowest likelihood of being enrolled in a private school, with 39 (100.0% in the age bracket) attending a public institution.
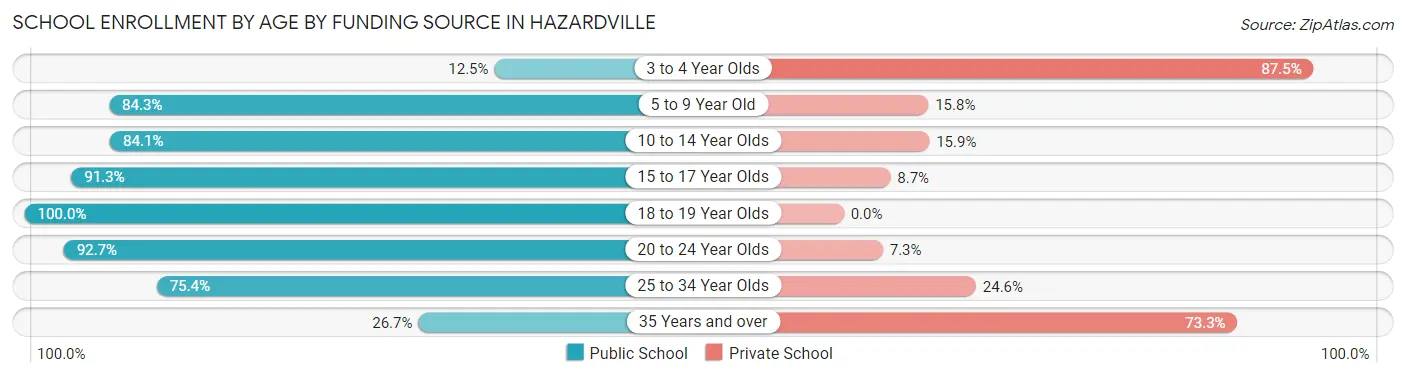
| Age Bracket | Public School | Private School |
| 3 to 4 Year Olds | 8 (12.5%) | 56 (87.5%) |
| 5 to 9 Year Old | 246 (84.3%) | 46 (15.8%) |
| 10 to 14 Year Olds | 211 (84.1%) | 40 (15.9%) |
| 15 to 17 Year Olds | 84 (91.3%) | 8 (8.7%) |
| 18 to 19 Year Olds | 39 (100.0%) | 0 (0.0%) |
| 20 to 24 Year Olds | 89 (92.7%) | 7 (7.3%) |
| 25 to 34 Year Olds | 49 (75.4%) | 16 (24.6%) |
| 35 Years and over | 16 (26.7%) | 44 (73.3%) |
| Total | 742 (77.4%) | 217 (22.6%) |
Educational Attainment by Field of Study in Hazardville
Business (238 | 16.9%), arts & humanities (183 | 13.0%), education (153 | 10.9%), psychology (150 | 10.6%), and visual & performing arts (137 | 9.7%) are the most common fields of study among 1,409 individuals in Hazardville who have obtained a bachelor's degree or higher.
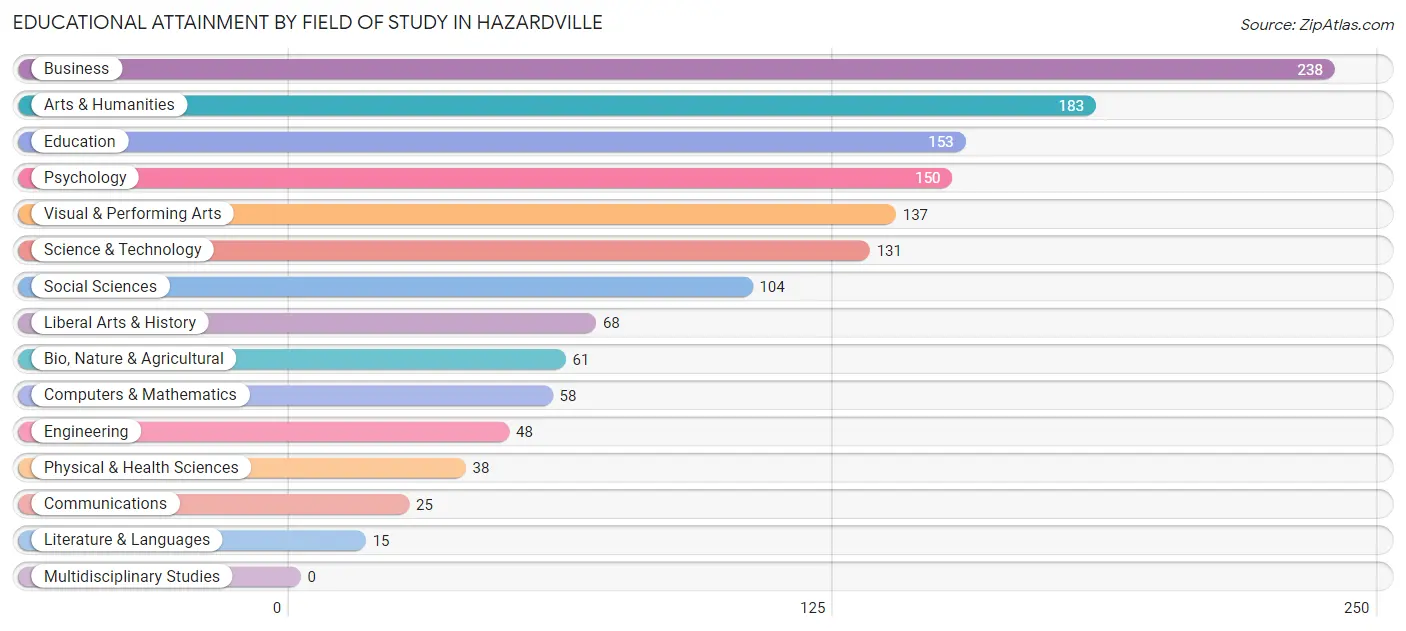
| Field of Study | # Graduates | % Graduates |
| Computers & Mathematics | 58 | 4.1% |
| Bio, Nature & Agricultural | 61 | 4.3% |
| Physical & Health Sciences | 38 | 2.7% |
| Psychology | 150 | 10.6% |
| Social Sciences | 104 | 7.4% |
| Engineering | 48 | 3.4% |
| Multidisciplinary Studies | 0 | 0.0% |
| Science & Technology | 131 | 9.3% |
| Business | 238 | 16.9% |
| Education | 153 | 10.9% |
| Literature & Languages | 15 | 1.1% |
| Liberal Arts & History | 68 | 4.8% |
| Visual & Performing Arts | 137 | 9.7% |
| Communications | 25 | 1.8% |
| Arts & Humanities | 183 | 13.0% |
| Total | 1,409 | 100.0% |
Transportation & Commute in Hazardville
Vehicle Availability by Sex in Hazardville
The most prevalent vehicle ownership categories in Hazardville are males with 2 vehicles (803, accounting for 46.7%) and females with 2 vehicles (757, making up 53.8%).
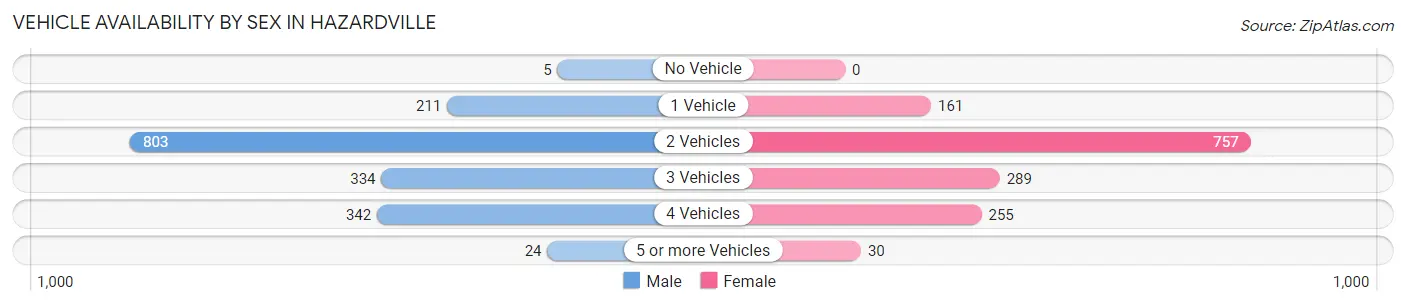
| Vehicles Available | Male | Female |
| No Vehicle | 5 (0.3%) | 0 (0.0%) |
| 1 Vehicle | 211 (12.3%) | 161 (10.8%) |
| 2 Vehicles | 803 (46.7%) | 757 (50.7%) |
| 3 Vehicles | 334 (19.4%) | 289 (19.4%) |
| 4 Vehicles | 342 (19.9%) | 255 (17.1%) |
| 5 or more Vehicles | 24 (1.4%) | 30 (2.0%) |
| Total | 1,719 (100.0%) | 1,492 (100.0%) |
Commute Time in Hazardville
The most frequently occuring commute durations in Hazardville are 30 to 34 minutes (627 commuters, 21.1%), 20 to 24 minutes (622 commuters, 20.9%), and 15 to 19 minutes (341 commuters, 11.5%).
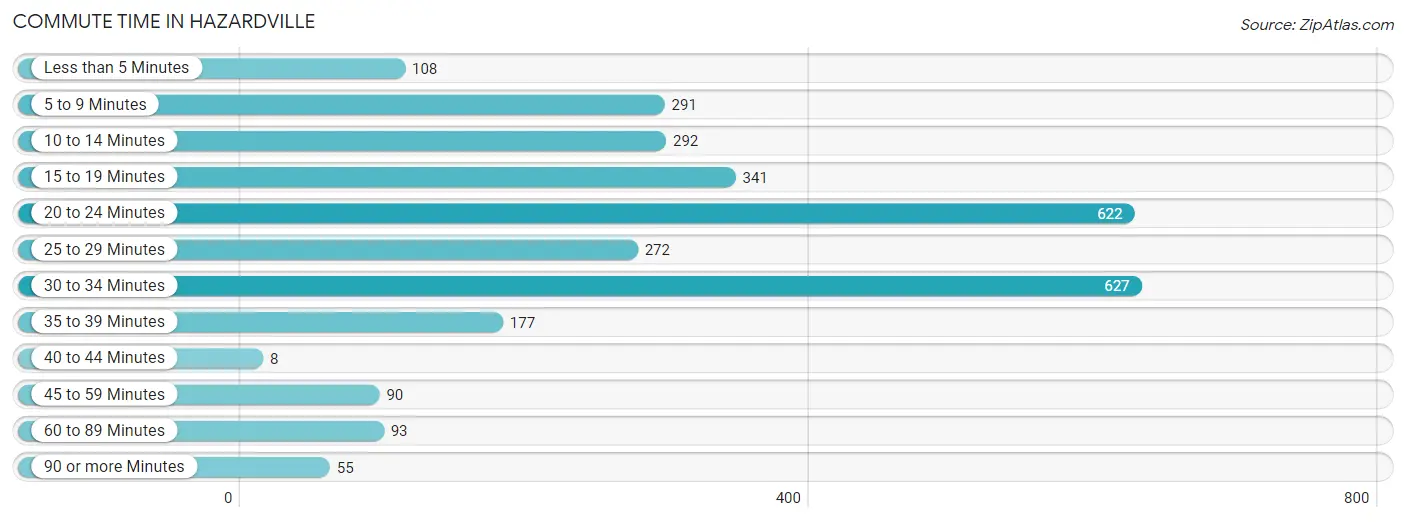
| Commute Time | # Commuters | % Commuters |
| Less than 5 Minutes | 108 | 3.6% |
| 5 to 9 Minutes | 291 | 9.8% |
| 10 to 14 Minutes | 292 | 9.8% |
| 15 to 19 Minutes | 341 | 11.5% |
| 20 to 24 Minutes | 622 | 20.9% |
| 25 to 29 Minutes | 272 | 9.1% |
| 30 to 34 Minutes | 627 | 21.1% |
| 35 to 39 Minutes | 177 | 5.9% |
| 40 to 44 Minutes | 8 | 0.3% |
| 45 to 59 Minutes | 90 | 3.0% |
| 60 to 89 Minutes | 93 | 3.1% |
| 90 or more Minutes | 55 | 1.8% |
Commute Time by Sex in Hazardville
The most common commute times in Hazardville are 30 to 34 minutes (500 commuters, 30.3%) for males and 20 to 24 minutes (321 commuters, 24.2%) for females.
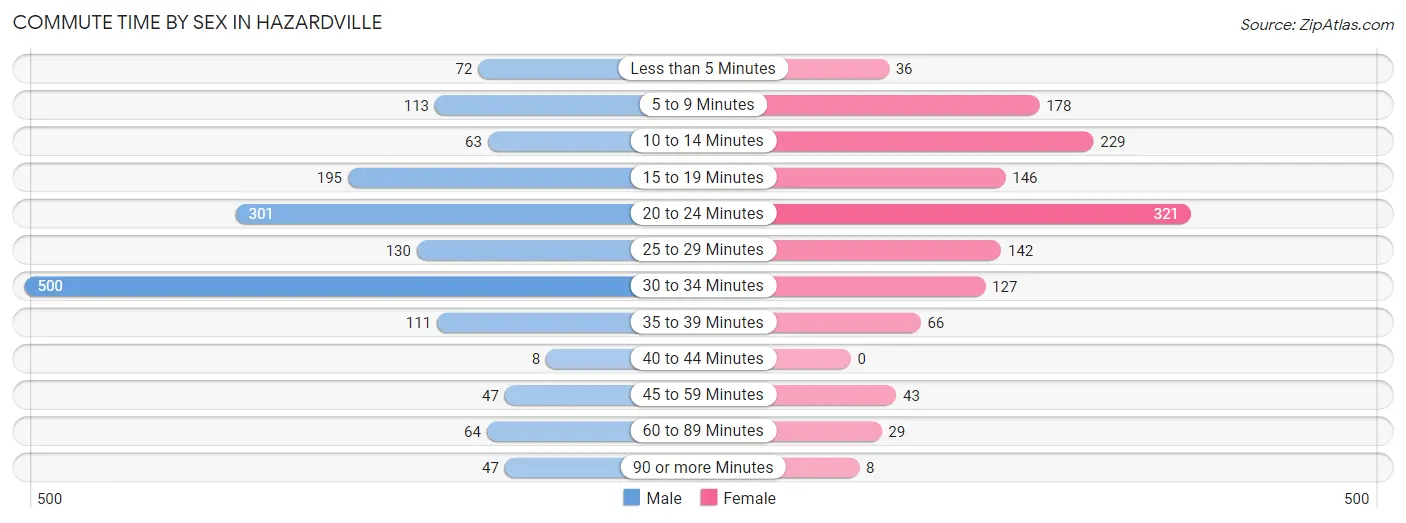
| Commute Time | Male | Female |
| Less than 5 Minutes | 72 (4.4%) | 36 (2.7%) |
| 5 to 9 Minutes | 113 (6.8%) | 178 (13.4%) |
| 10 to 14 Minutes | 63 (3.8%) | 229 (17.3%) |
| 15 to 19 Minutes | 195 (11.8%) | 146 (11.0%) |
| 20 to 24 Minutes | 301 (18.2%) | 321 (24.2%) |
| 25 to 29 Minutes | 130 (7.9%) | 142 (10.7%) |
| 30 to 34 Minutes | 500 (30.3%) | 127 (9.6%) |
| 35 to 39 Minutes | 111 (6.7%) | 66 (5.0%) |
| 40 to 44 Minutes | 8 (0.5%) | 0 (0.0%) |
| 45 to 59 Minutes | 47 (2.9%) | 43 (3.3%) |
| 60 to 89 Minutes | 64 (3.9%) | 29 (2.2%) |
| 90 or more Minutes | 47 (2.9%) | 8 (0.6%) |
Time of Departure to Work by Sex in Hazardville
The most frequent times of departure to work in Hazardville are 7:30 AM to 7:59 AM (255, 15.4%) for males and 7:30 AM to 7:59 AM (369, 27.9%) for females.
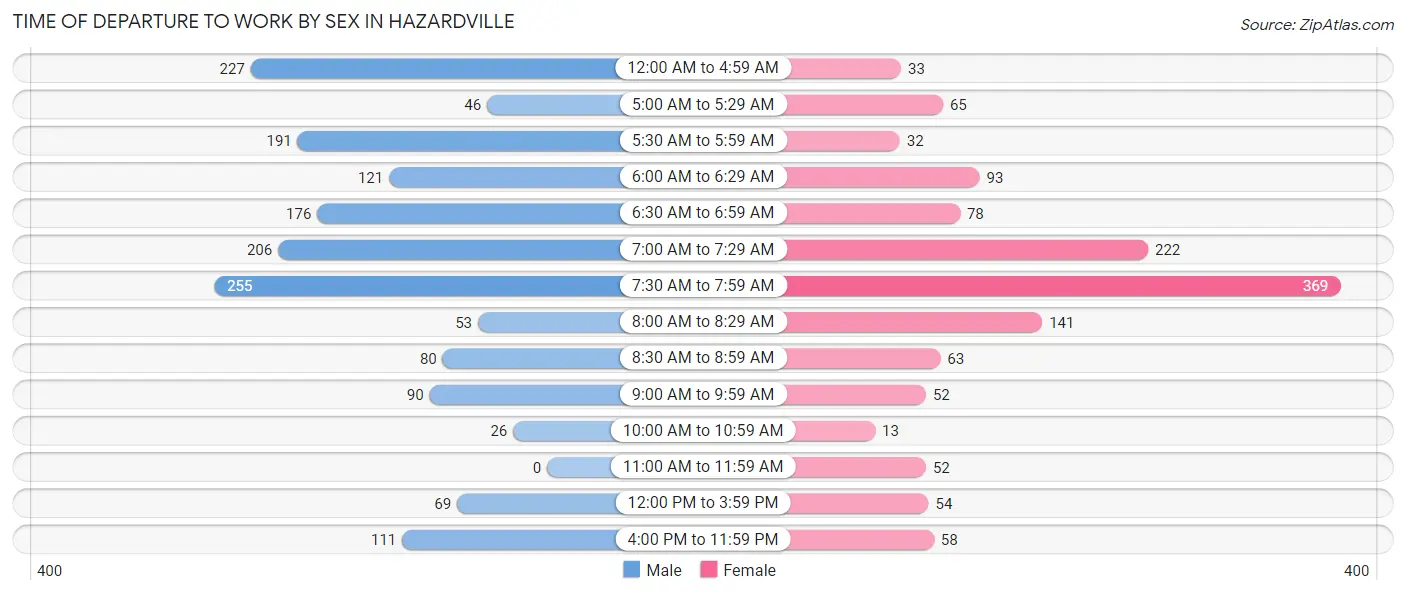
| Time of Departure | Male | Female |
| 12:00 AM to 4:59 AM | 227 (13.8%) | 33 (2.5%) |
| 5:00 AM to 5:29 AM | 46 (2.8%) | 65 (4.9%) |
| 5:30 AM to 5:59 AM | 191 (11.6%) | 32 (2.4%) |
| 6:00 AM to 6:29 AM | 121 (7.3%) | 93 (7.0%) |
| 6:30 AM to 6:59 AM | 176 (10.7%) | 78 (5.9%) |
| 7:00 AM to 7:29 AM | 206 (12.5%) | 222 (16.8%) |
| 7:30 AM to 7:59 AM | 255 (15.4%) | 369 (27.9%) |
| 8:00 AM to 8:29 AM | 53 (3.2%) | 141 (10.6%) |
| 8:30 AM to 8:59 AM | 80 (4.9%) | 63 (4.8%) |
| 9:00 AM to 9:59 AM | 90 (5.4%) | 52 (3.9%) |
| 10:00 AM to 10:59 AM | 26 (1.6%) | 13 (1.0%) |
| 11:00 AM to 11:59 AM | 0 (0.0%) | 52 (3.9%) |
| 12:00 PM to 3:59 PM | 69 (4.2%) | 54 (4.1%) |
| 4:00 PM to 11:59 PM | 111 (6.7%) | 58 (4.4%) |
| Total | 1,651 (100.0%) | 1,325 (100.0%) |
Housing Occupancy in Hazardville
Occupancy by Ownership in Hazardville
Of the total 2,563 dwellings in Hazardville, owner-occupied units account for 2,197 (85.7%), while renter-occupied units make up 366 (14.3%).
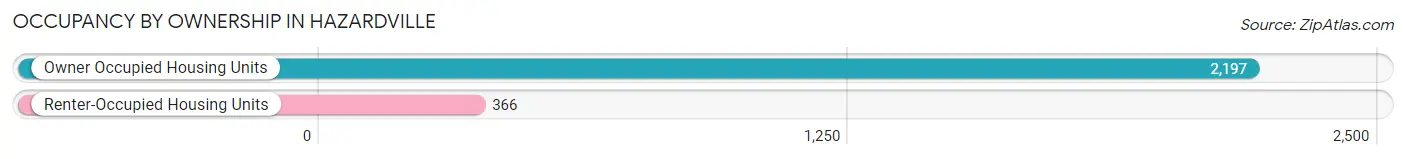
| Occupancy | # Housing Units | % Housing Units |
| Owner Occupied Housing Units | 2,197 | 85.7% |
| Renter-Occupied Housing Units | 366 | 14.3% |
| Total Occupied Housing Units | 2,563 | 100.0% |
Occupancy by Household Size in Hazardville
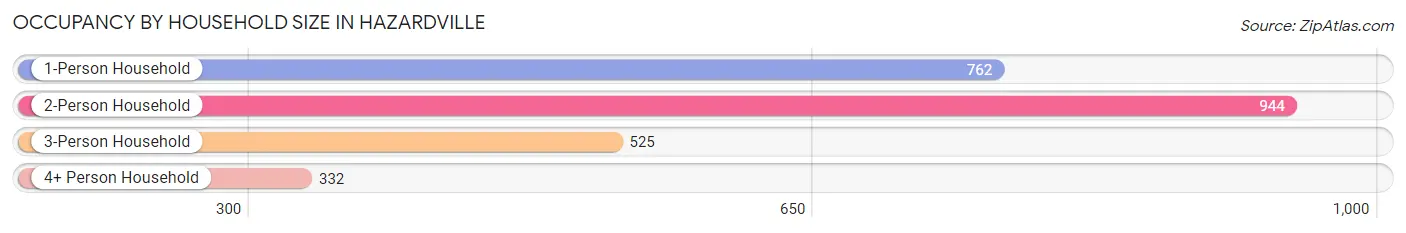
| Household Size | # Housing Units | % Housing Units |
| 1-Person Household | 762 | 29.7% |
| 2-Person Household | 944 | 36.8% |
| 3-Person Household | 525 | 20.5% |
| 4+ Person Household | 332 | 13.0% |
| Total Housing Units | 2,563 | 100.0% |
Occupancy by Ownership by Household Size in Hazardville
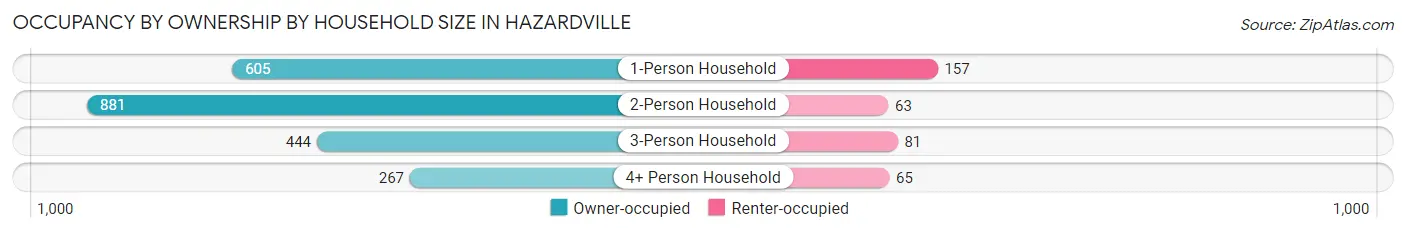
| Household Size | Owner-occupied | Renter-occupied |
| 1-Person Household | 605 (79.4%) | 157 (20.6%) |
| 2-Person Household | 881 (93.3%) | 63 (6.7%) |
| 3-Person Household | 444 (84.6%) | 81 (15.4%) |
| 4+ Person Household | 267 (80.4%) | 65 (19.6%) |
| Total Housing Units | 2,197 (85.7%) | 366 (14.3%) |
Occupancy by Educational Attainment in Hazardville
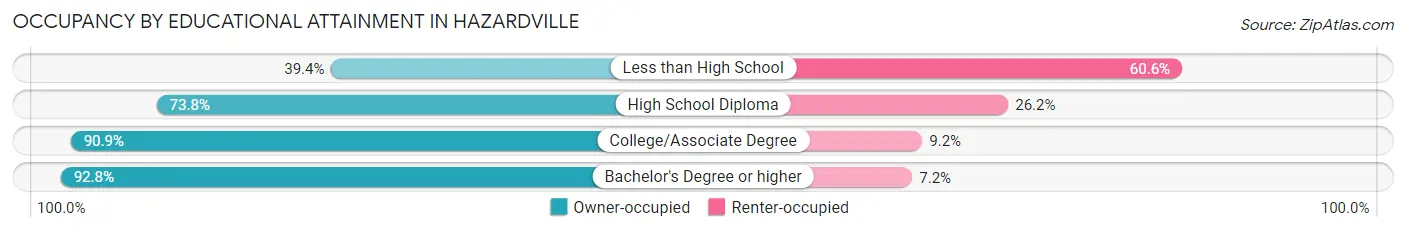
| Household Size | Owner-occupied | Renter-occupied |
| Less than High School | 13 (39.4%) | 20 (60.6%) |
| High School Diploma | 572 (73.8%) | 203 (26.2%) |
| College/Associate Degree | 784 (90.8%) | 79 (9.1%) |
| Bachelor's Degree or higher | 828 (92.8%) | 64 (7.2%) |
Occupancy by Age of Householder in Hazardville
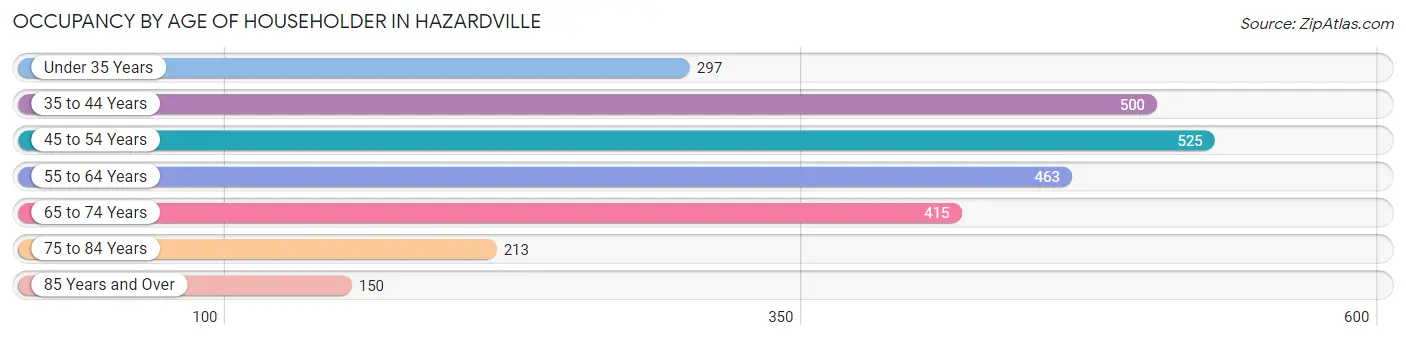
| Age Bracket | # Households | % Households |
| Under 35 Years | 297 | 11.6% |
| 35 to 44 Years | 500 | 19.5% |
| 45 to 54 Years | 525 | 20.5% |
| 55 to 64 Years | 463 | 18.1% |
| 65 to 74 Years | 415 | 16.2% |
| 75 to 84 Years | 213 | 8.3% |
| 85 Years and Over | 150 | 5.9% |
| Total | 2,563 | 100.0% |
Housing Finances in Hazardville
Median Income by Occupancy in Hazardville
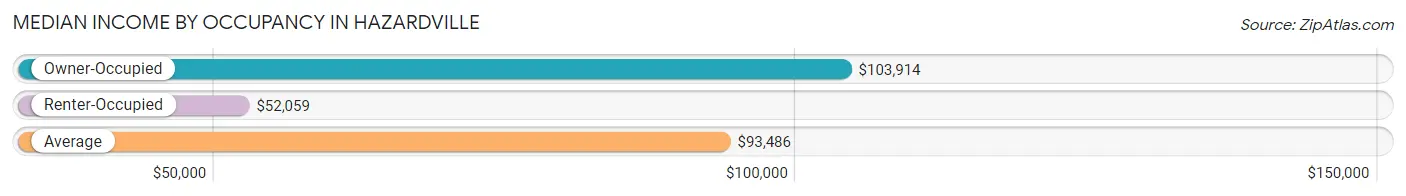
| Occupancy Type | # Households | Median Income |
| Owner-Occupied | 2,197 (85.7%) | $103,914 |
| Renter-Occupied | 366 (14.3%) | $52,059 |
| Average | 2,563 (100.0%) | $93,486 |
Occupancy by Householder Income Bracket in Hazardville
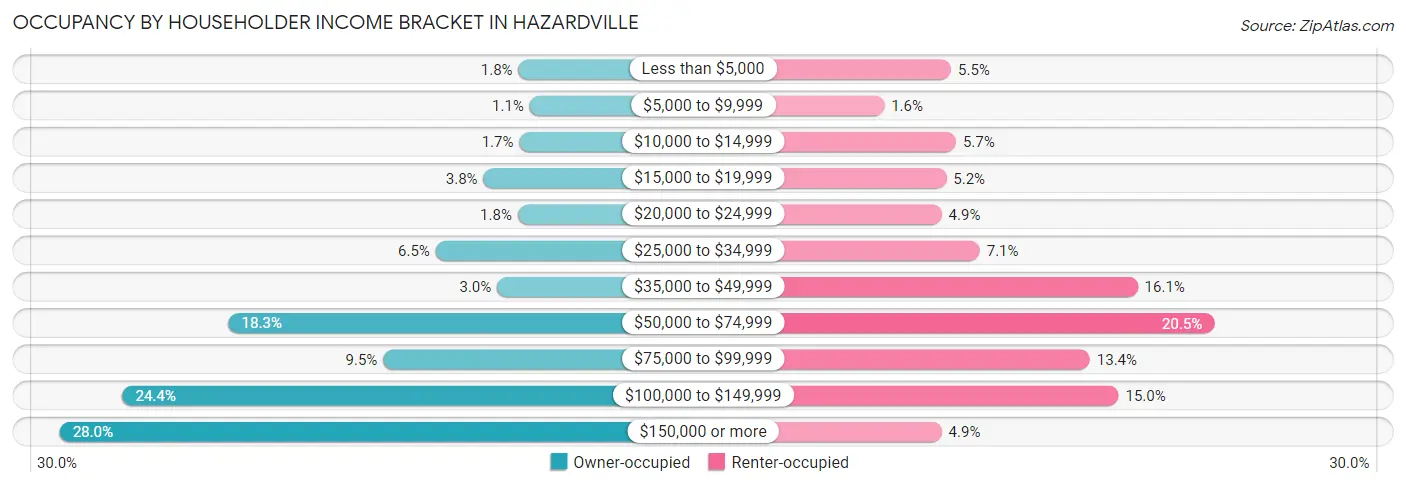
| Income Bracket | Owner-occupied | Renter-occupied |
| Less than $5,000 | 39 (1.8%) | 20 (5.5%) |
| $5,000 to $9,999 | 25 (1.1%) | 6 (1.6%) |
| $10,000 to $14,999 | 38 (1.7%) | 21 (5.7%) |
| $15,000 to $19,999 | 83 (3.8%) | 19 (5.2%) |
| $20,000 to $24,999 | 40 (1.8%) | 18 (4.9%) |
| $25,000 to $34,999 | 143 (6.5%) | 26 (7.1%) |
| $35,000 to $49,999 | 66 (3.0%) | 59 (16.1%) |
| $50,000 to $74,999 | 403 (18.3%) | 75 (20.5%) |
| $75,000 to $99,999 | 209 (9.5%) | 49 (13.4%) |
| $100,000 to $149,999 | 536 (24.4%) | 55 (15.0%) |
| $150,000 or more | 615 (28.0%) | 18 (4.9%) |
| Total | 2,197 (100.0%) | 366 (100.0%) |
Monthly Housing Cost Tiers in Hazardville
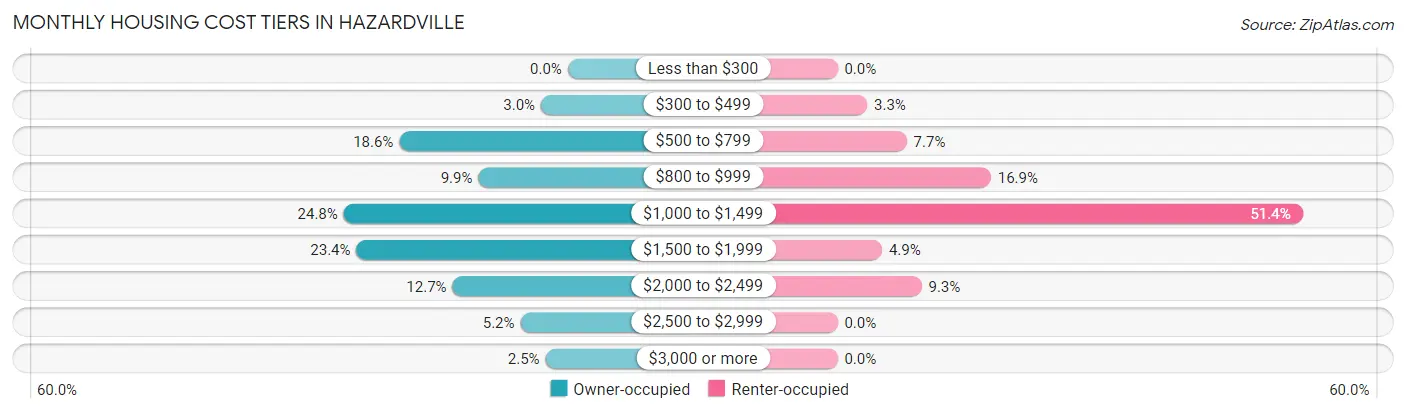
| Monthly Cost | Owner-occupied | Renter-occupied |
| Less than $300 | 0 (0.0%) | 0 (0.0%) |
| $300 to $499 | 65 (3.0%) | 12 (3.3%) |
| $500 to $799 | 409 (18.6%) | 28 (7.6%) |
| $800 to $999 | 217 (9.9%) | 62 (16.9%) |
| $1,000 to $1,499 | 544 (24.8%) | 188 (51.4%) |
| $1,500 to $1,999 | 513 (23.4%) | 18 (4.9%) |
| $2,000 to $2,499 | 280 (12.7%) | 34 (9.3%) |
| $2,500 to $2,999 | 115 (5.2%) | 0 (0.0%) |
| $3,000 or more | 54 (2.5%) | 0 (0.0%) |
| Total | 2,197 (100.0%) | 366 (100.0%) |
Physical Housing Characteristics in Hazardville
Housing Structures in Hazardville
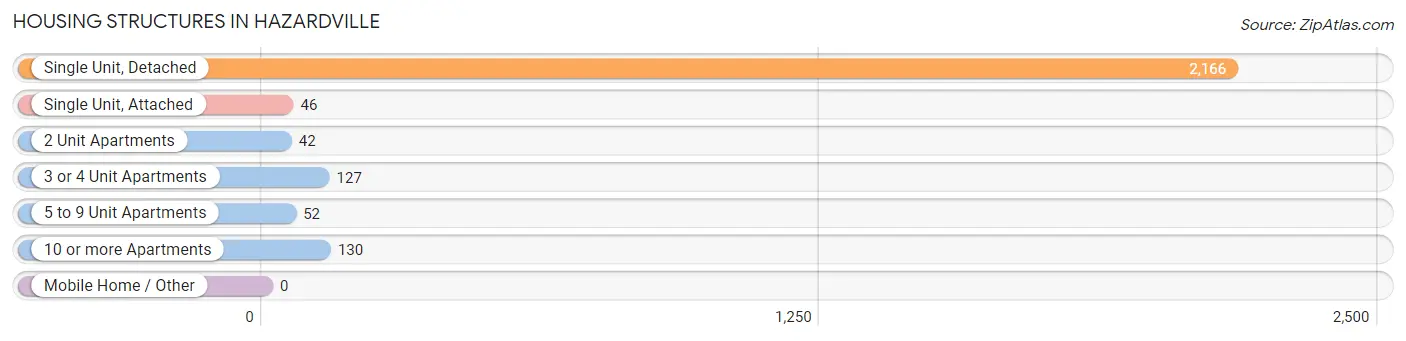
| Structure Type | # Housing Units | % Housing Units |
| Single Unit, Detached | 2,166 | 84.5% |
| Single Unit, Attached | 46 | 1.8% |
| 2 Unit Apartments | 42 | 1.6% |
| 3 or 4 Unit Apartments | 127 | 5.0% |
| 5 to 9 Unit Apartments | 52 | 2.0% |
| 10 or more Apartments | 130 | 5.1% |
| Mobile Home / Other | 0 | 0.0% |
| Total | 2,563 | 100.0% |
Housing Structures by Occupancy in Hazardville
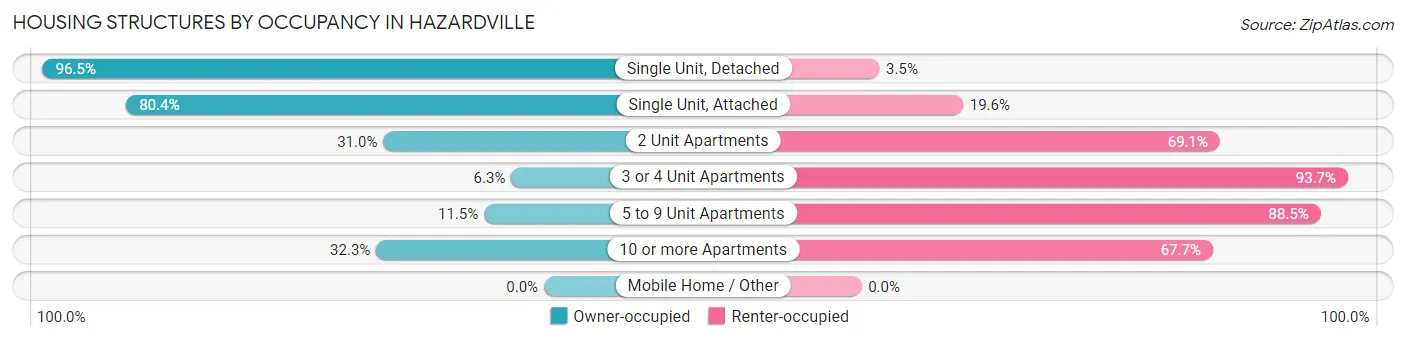
| Structure Type | Owner-occupied | Renter-occupied |
| Single Unit, Detached | 2,091 (96.5%) | 75 (3.5%) |
| Single Unit, Attached | 37 (80.4%) | 9 (19.6%) |
| 2 Unit Apartments | 13 (30.9%) | 29 (69.1%) |
| 3 or 4 Unit Apartments | 8 (6.3%) | 119 (93.7%) |
| 5 to 9 Unit Apartments | 6 (11.5%) | 46 (88.5%) |
| 10 or more Apartments | 42 (32.3%) | 88 (67.7%) |
| Mobile Home / Other | 0 (0.0%) | 0 (0.0%) |
| Total | 2,197 (85.7%) | 366 (14.3%) |
Housing Structures by Number of Rooms in Hazardville
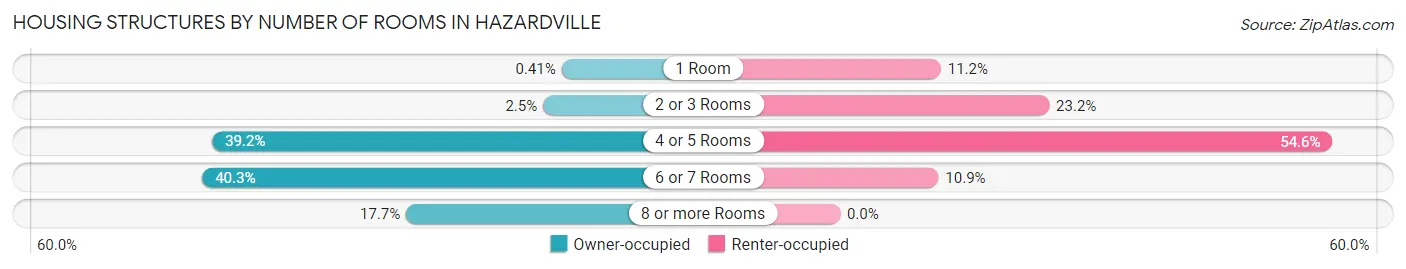
| Number of Rooms | Owner-occupied | Renter-occupied |
| 1 Room | 9 (0.4%) | 41 (11.2%) |
| 2 or 3 Rooms | 54 (2.5%) | 85 (23.2%) |
| 4 or 5 Rooms | 861 (39.2%) | 200 (54.6%) |
| 6 or 7 Rooms | 885 (40.3%) | 40 (10.9%) |
| 8 or more Rooms | 388 (17.7%) | 0 (0.0%) |
| Total | 2,197 (100.0%) | 366 (100.0%) |
Housing Structure by Heating Type in Hazardville
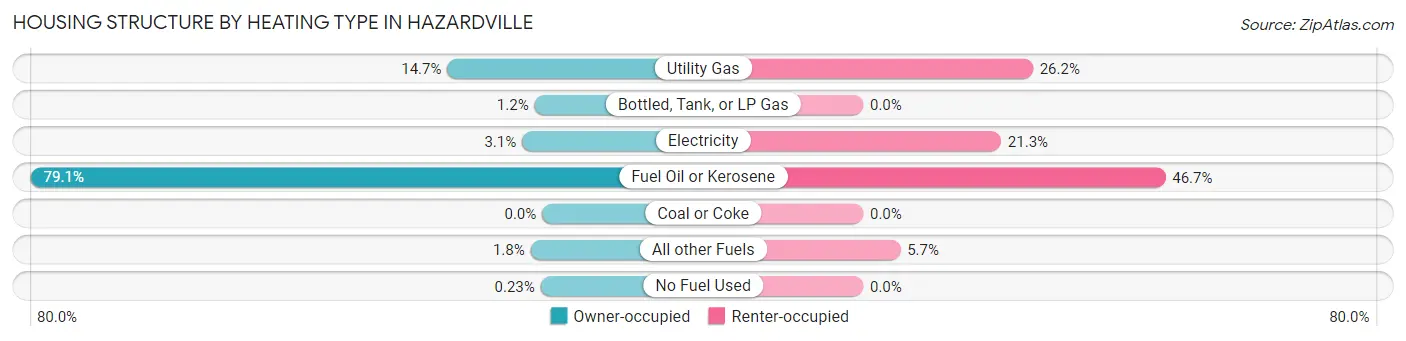
| Heating Type | Owner-occupied | Renter-occupied |
| Utility Gas | 322 (14.7%) | 96 (26.2%) |
| Bottled, Tank, or LP Gas | 26 (1.2%) | 0 (0.0%) |
| Electricity | 68 (3.1%) | 78 (21.3%) |
| Fuel Oil or Kerosene | 1,737 (79.1%) | 171 (46.7%) |
| Coal or Coke | 0 (0.0%) | 0 (0.0%) |
| All other Fuels | 39 (1.8%) | 21 (5.7%) |
| No Fuel Used | 5 (0.2%) | 0 (0.0%) |
| Total | 2,197 (100.0%) | 366 (100.0%) |
Household Vehicle Usage in Hazardville
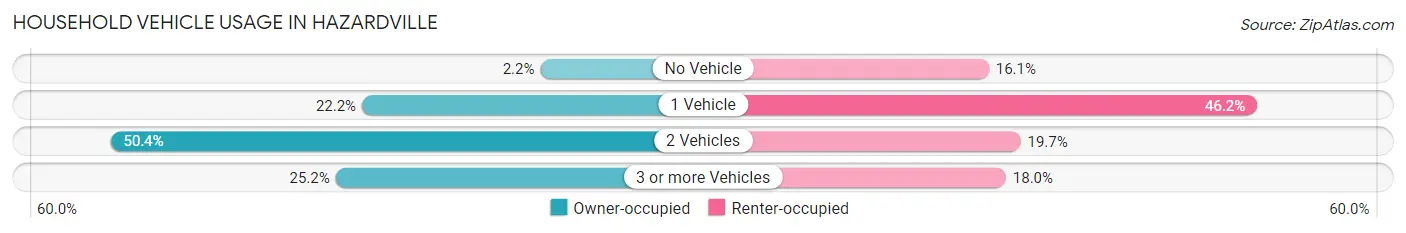
| Vehicles per Household | Owner-occupied | Renter-occupied |
| No Vehicle | 49 (2.2%) | 59 (16.1%) |
| 1 Vehicle | 488 (22.2%) | 169 (46.2%) |
| 2 Vehicles | 1,107 (50.4%) | 72 (19.7%) |
| 3 or more Vehicles | 553 (25.2%) | 66 (18.0%) |
| Total | 2,197 (100.0%) | 366 (100.0%) |
Real Estate & Mortgages in Hazardville
Real Estate and Mortgage Overview in Hazardville
| Characteristic | Without Mortgage | With Mortgage |
| Housing Units | 811 | 1,386 |
| Median Property Value | $225,800 | $219,500 |
| Median Household Income | $65,096 | $522 |
| Monthly Housing Costs | $780 | $54 |
| Real Estate Taxes | $4,803 | $9 |
Property Value by Mortgage Status in Hazardville
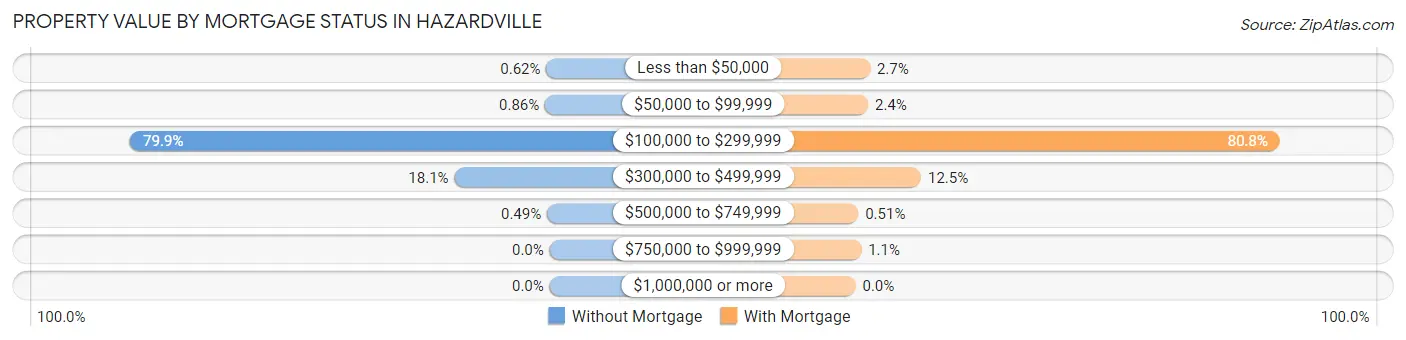
| Property Value | Without Mortgage | With Mortgage |
| Less than $50,000 | 5 (0.6%) | 38 (2.7%) |
| $50,000 to $99,999 | 7 (0.9%) | 33 (2.4%) |
| $100,000 to $299,999 | 648 (79.9%) | 1,120 (80.8%) |
| $300,000 to $499,999 | 147 (18.1%) | 173 (12.5%) |
| $500,000 to $749,999 | 4 (0.5%) | 7 (0.5%) |
| $750,000 to $999,999 | 0 (0.0%) | 15 (1.1%) |
| $1,000,000 or more | 0 (0.0%) | 0 (0.0%) |
| Total | 811 (100.0%) | 1,386 (100.0%) |
Household Income by Mortgage Status in Hazardville
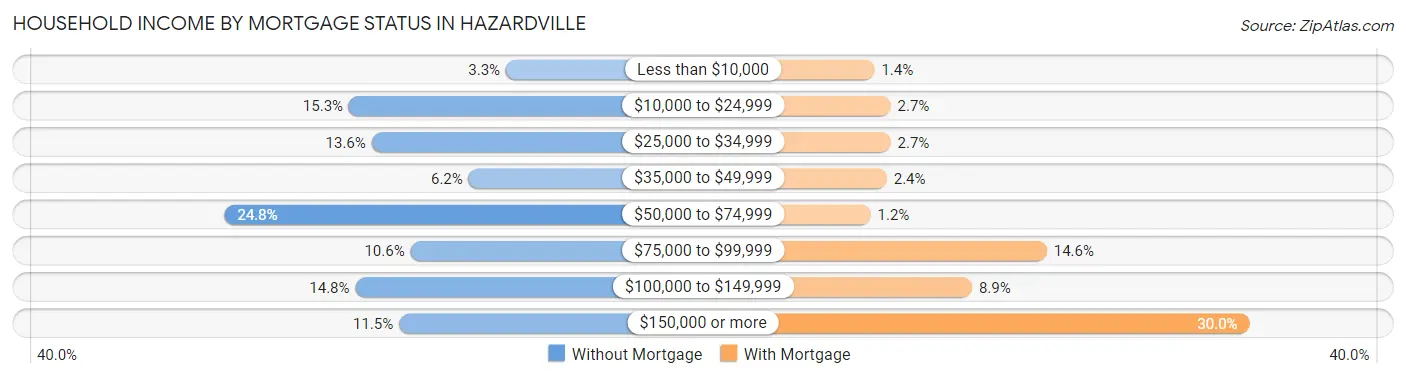
| Household Income | Without Mortgage | With Mortgage |
| Less than $10,000 | 27 (3.3%) | 20 (1.4%) |
| $10,000 to $24,999 | 124 (15.3%) | 37 (2.7%) |
| $25,000 to $34,999 | 110 (13.6%) | 37 (2.7%) |
| $35,000 to $49,999 | 50 (6.2%) | 33 (2.4%) |
| $50,000 to $74,999 | 201 (24.8%) | 16 (1.1%) |
| $75,000 to $99,999 | 86 (10.6%) | 202 (14.6%) |
| $100,000 to $149,999 | 120 (14.8%) | 123 (8.9%) |
| $150,000 or more | 93 (11.5%) | 416 (30.0%) |
| Total | 811 (100.0%) | 1,386 (100.0%) |
Property Value to Household Income Ratio in Hazardville
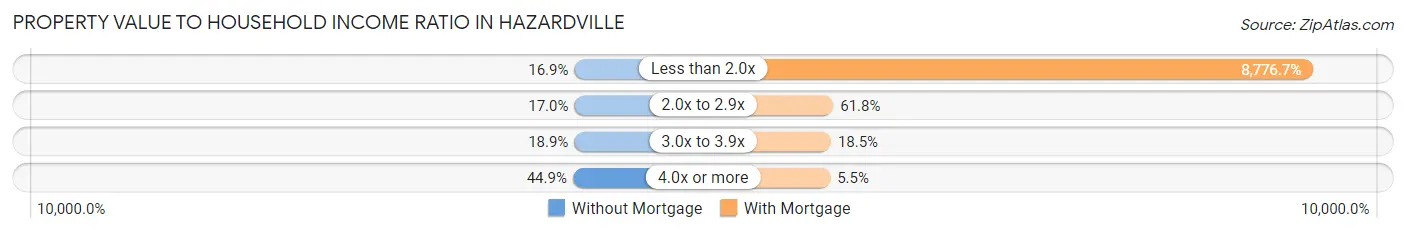
| Value-to-Income Ratio | Without Mortgage | With Mortgage |
| Less than 2.0x | 137 (16.9%) | 121,645 (8,776.7%) |
| 2.0x to 2.9x | 138 (17.0%) | 857 (61.8%) |
| 3.0x to 3.9x | 153 (18.9%) | 257 (18.5%) |
| 4.0x or more | 364 (44.9%) | 76 (5.5%) |
| Total | 811 (100.0%) | 1,386 (100.0%) |
Real Estate Taxes by Mortgage Status in Hazardville
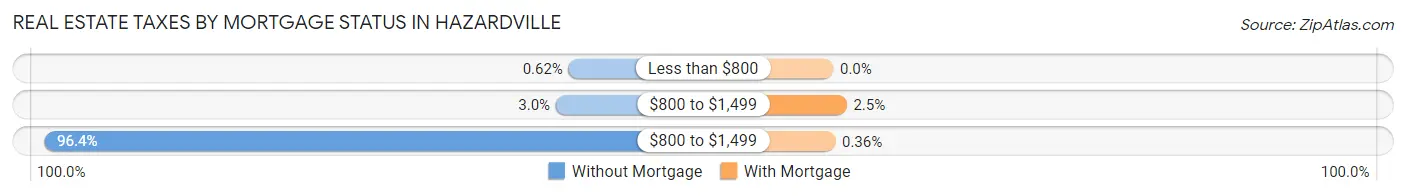
| Property Taxes | Without Mortgage | With Mortgage |
| Less than $800 | 5 (0.6%) | 0 (0.0%) |
| $800 to $1,499 | 24 (3.0%) | 34 (2.5%) |
| $800 to $1,499 | 782 (96.4%) | 5 (0.4%) |
| Total | 811 (100.0%) | 1,386 (100.0%) |
Health & Disability in Hazardville
Health Insurance Coverage by Age in Hazardville
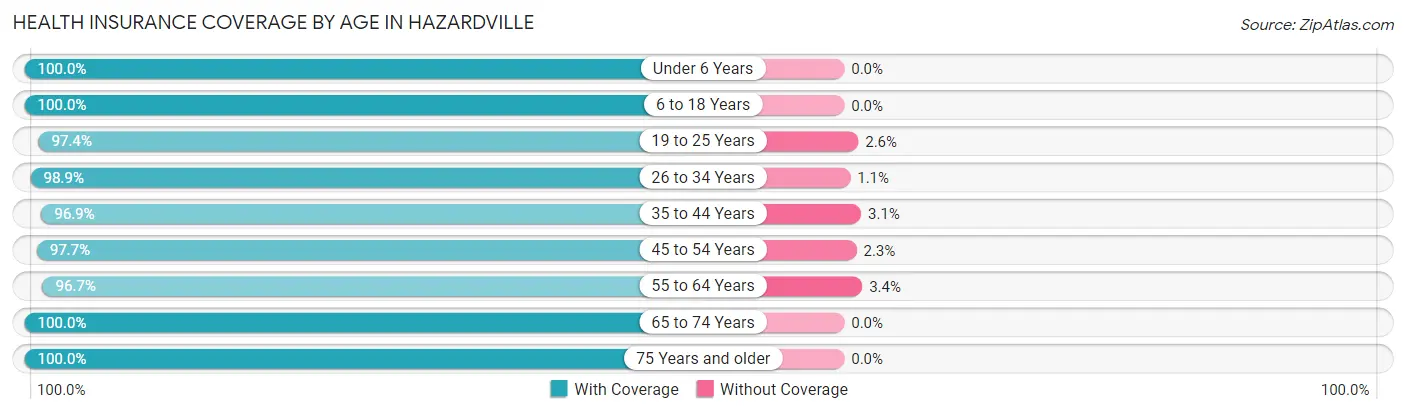
| Age Bracket | With Coverage | Without Coverage |
| Under 6 Years | 391 (100.0%) | 0 (0.0%) |
| 6 to 18 Years | 618 (100.0%) | 0 (0.0%) |
| 19 to 25 Years | 298 (97.4%) | 8 (2.6%) |
| 26 to 34 Years | 619 (98.9%) | 7 (1.1%) |
| 35 to 44 Years | 897 (96.9%) | 29 (3.1%) |
| 45 to 54 Years | 943 (97.7%) | 22 (2.3%) |
| 55 to 64 Years | 780 (96.7%) | 27 (3.4%) |
| 65 to 74 Years | 651 (100.0%) | 0 (0.0%) |
| 75 Years and older | 503 (100.0%) | 0 (0.0%) |
| Total | 5,700 (98.4%) | 93 (1.6%) |
Health Insurance Coverage by Citizenship Status in Hazardville
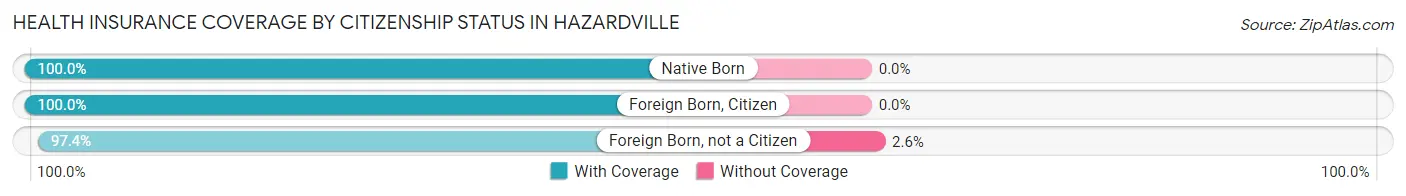
| Citizenship Status | With Coverage | Without Coverage |
| Native Born | 391 (100.0%) | 0 (0.0%) |
| Foreign Born, Citizen | 618 (100.0%) | 0 (0.0%) |
| Foreign Born, not a Citizen | 298 (97.4%) | 8 (2.6%) |
Health Insurance Coverage by Household Income in Hazardville
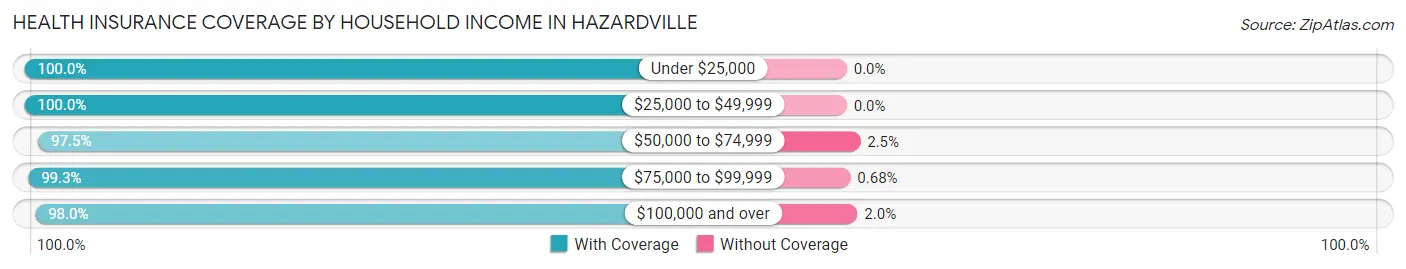
| Household Income | With Coverage | Without Coverage |
| Under $25,000 | 411 (100.0%) | 0 (0.0%) |
| $25,000 to $49,999 | 454 (100.0%) | 0 (0.0%) |
| $50,000 to $74,999 | 847 (97.5%) | 22 (2.5%) |
| $75,000 to $99,999 | 727 (99.3%) | 5 (0.7%) |
| $100,000 and over | 3,253 (98.0%) | 66 (2.0%) |
Public vs Private Health Insurance Coverage by Age in Hazardville
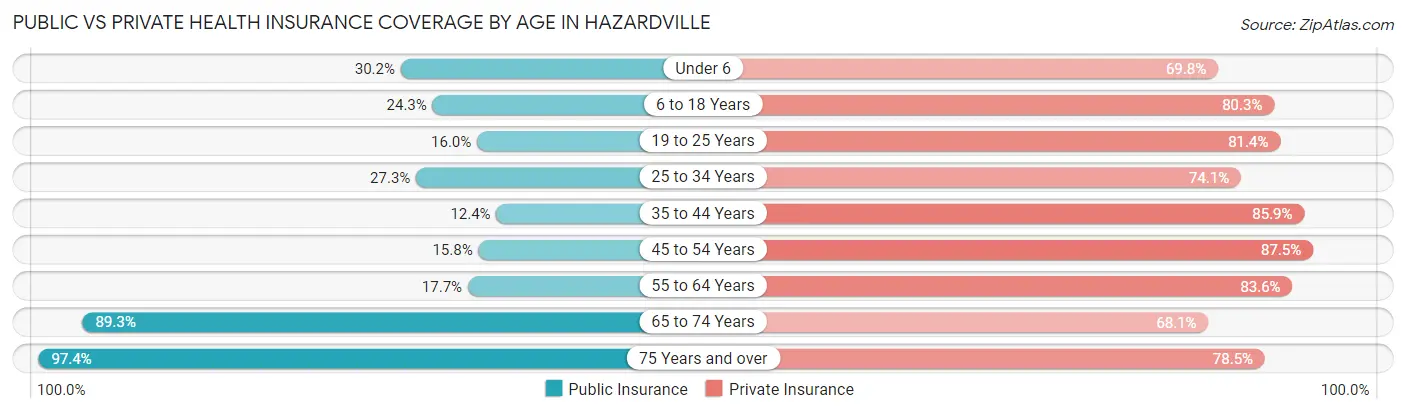
| Age Bracket | Public Insurance | Private Insurance |
| Under 6 | 118 (30.2%) | 273 (69.8%) |
| 6 to 18 Years | 150 (24.3%) | 496 (80.3%) |
| 19 to 25 Years | 49 (16.0%) | 249 (81.4%) |
| 25 to 34 Years | 171 (27.3%) | 464 (74.1%) |
| 35 to 44 Years | 115 (12.4%) | 795 (85.9%) |
| 45 to 54 Years | 152 (15.8%) | 844 (87.5%) |
| 55 to 64 Years | 143 (17.7%) | 675 (83.6%) |
| 65 to 74 Years | 581 (89.2%) | 443 (68.0%) |
| 75 Years and over | 490 (97.4%) | 395 (78.5%) |
| Total | 1,969 (34.0%) | 4,634 (80.0%) |
Disability Status by Sex by Age in Hazardville
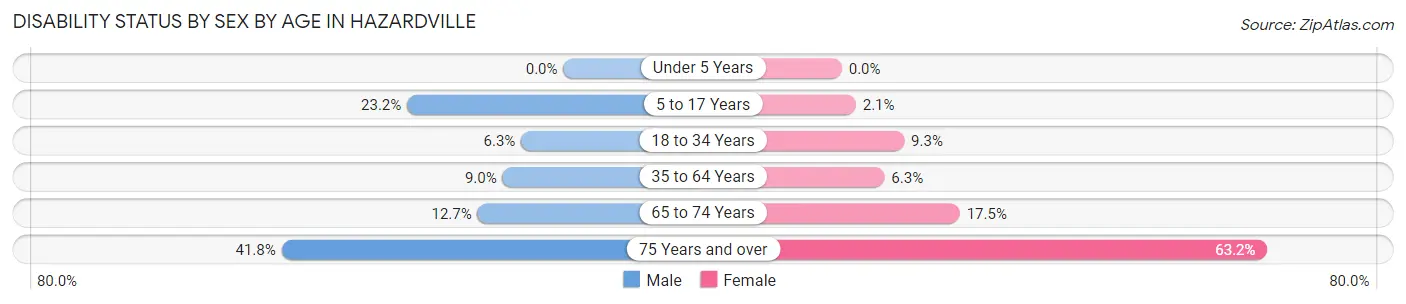
| Age Bracket | Male | Female |
| Under 5 Years | 0 (0.0%) | 0 (0.0%) |
| 5 to 17 Years | 74 (23.2%) | 7 (2.1%) |
| 18 to 34 Years | 33 (6.3%) | 41 (9.3%) |
| 35 to 64 Years | 118 (9.0%) | 88 (6.3%) |
| 65 to 74 Years | 40 (12.7%) | 59 (17.5%) |
| 75 Years and over | 82 (41.8%) | 194 (63.2%) |
Disability Class by Sex by Age in Hazardville
Disability Class: Hearing Difficulty
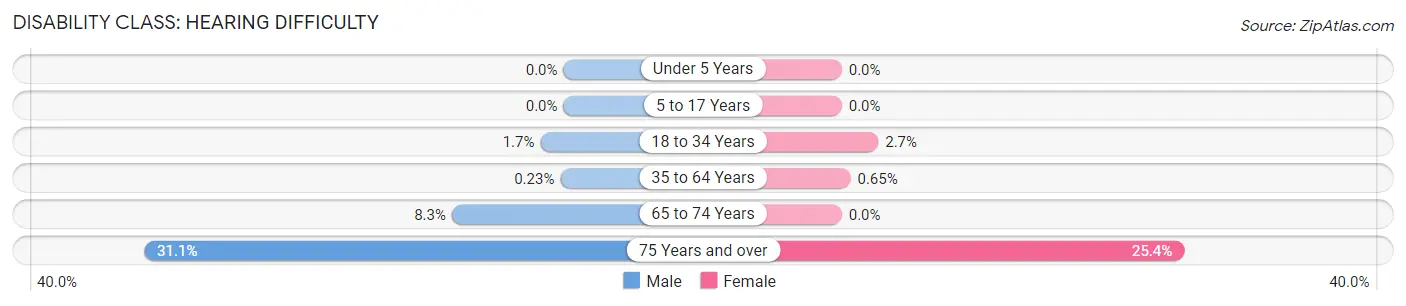
| Age Bracket | Male | Female |
| Under 5 Years | 0 (0.0%) | 0 (0.0%) |
| 5 to 17 Years | 0 (0.0%) | 0 (0.0%) |
| 18 to 34 Years | 9 (1.7%) | 12 (2.7%) |
| 35 to 64 Years | 3 (0.2%) | 9 (0.6%) |
| 65 to 74 Years | 26 (8.3%) | 0 (0.0%) |
| 75 Years and over | 61 (31.1%) | 78 (25.4%) |
Disability Class: Vision Difficulty
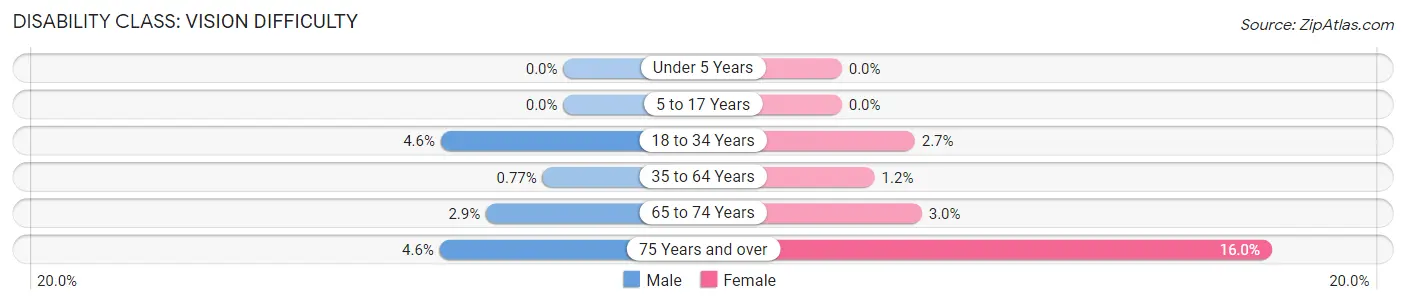
| Age Bracket | Male | Female |
| Under 5 Years | 0 (0.0%) | 0 (0.0%) |
| 5 to 17 Years | 0 (0.0%) | 0 (0.0%) |
| 18 to 34 Years | 24 (4.5%) | 12 (2.7%) |
| 35 to 64 Years | 10 (0.8%) | 17 (1.2%) |
| 65 to 74 Years | 9 (2.9%) | 10 (3.0%) |
| 75 Years and over | 9 (4.6%) | 49 (16.0%) |
Disability Class: Cognitive Difficulty
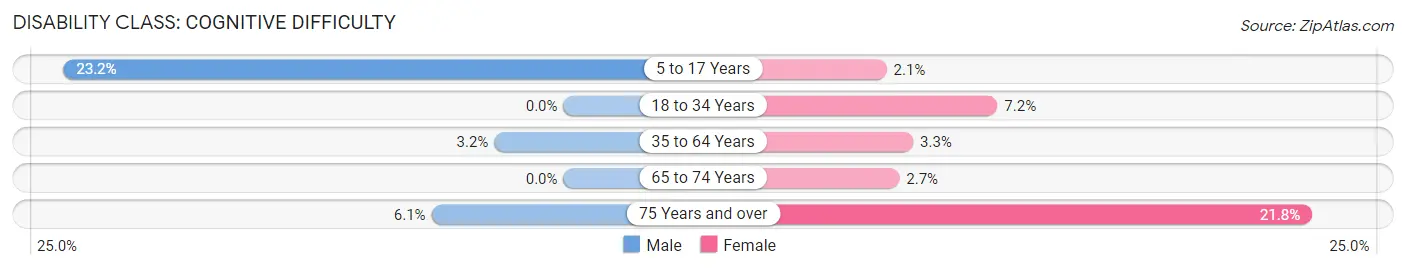
| Age Bracket | Male | Female |
| 5 to 17 Years | 74 (23.2%) | 7 (2.1%) |
| 18 to 34 Years | 0 (0.0%) | 32 (7.2%) |
| 35 to 64 Years | 42 (3.2%) | 46 (3.3%) |
| 65 to 74 Years | 0 (0.0%) | 9 (2.7%) |
| 75 Years and over | 12 (6.1%) | 67 (21.8%) |
Disability Class: Ambulatory Difficulty
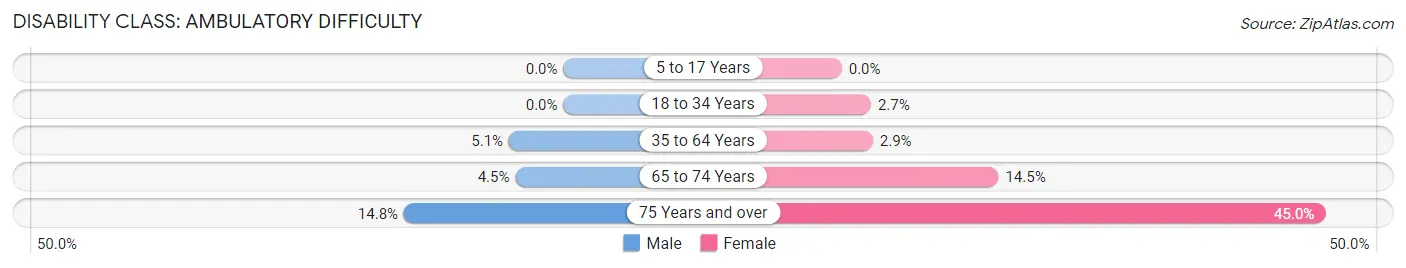
| Age Bracket | Male | Female |
| 5 to 17 Years | 0 (0.0%) | 0 (0.0%) |
| 18 to 34 Years | 0 (0.0%) | 12 (2.7%) |
| 35 to 64 Years | 66 (5.1%) | 40 (2.9%) |
| 65 to 74 Years | 14 (4.5%) | 49 (14.5%) |
| 75 Years and over | 29 (14.8%) | 138 (45.0%) |
Disability Class: Self-Care Difficulty
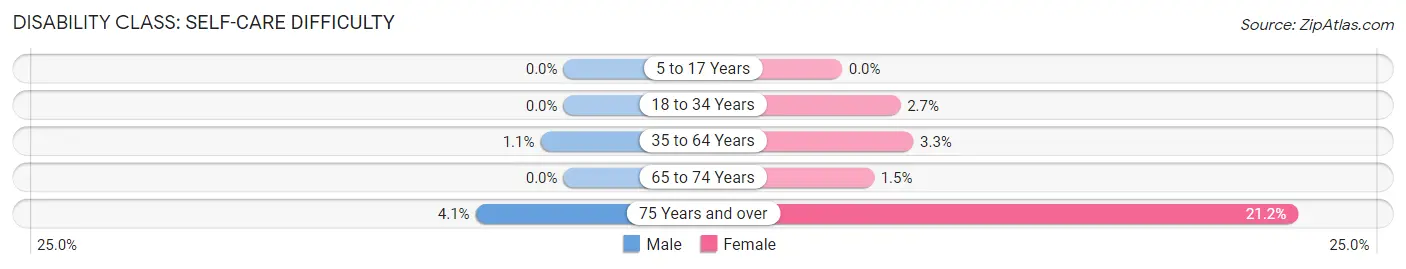
| Age Bracket | Male | Female |
| 5 to 17 Years | 0 (0.0%) | 0 (0.0%) |
| 18 to 34 Years | 0 (0.0%) | 12 (2.7%) |
| 35 to 64 Years | 14 (1.1%) | 46 (3.3%) |
| 65 to 74 Years | 0 (0.0%) | 5 (1.5%) |
| 75 Years and over | 8 (4.1%) | 65 (21.2%) |
Technology Access in Hazardville
Computing Device Access in Hazardville
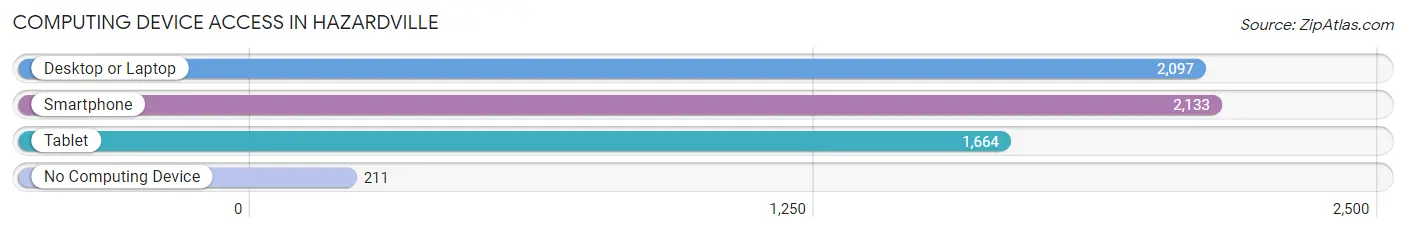
| Device Type | # Households | % Households |
| Desktop or Laptop | 2,097 | 81.8% |
| Smartphone | 2,133 | 83.2% |
| Tablet | 1,664 | 64.9% |
| No Computing Device | 211 | 8.2% |
| Total | 2,563 | 100.0% |
Internet Access in Hazardville
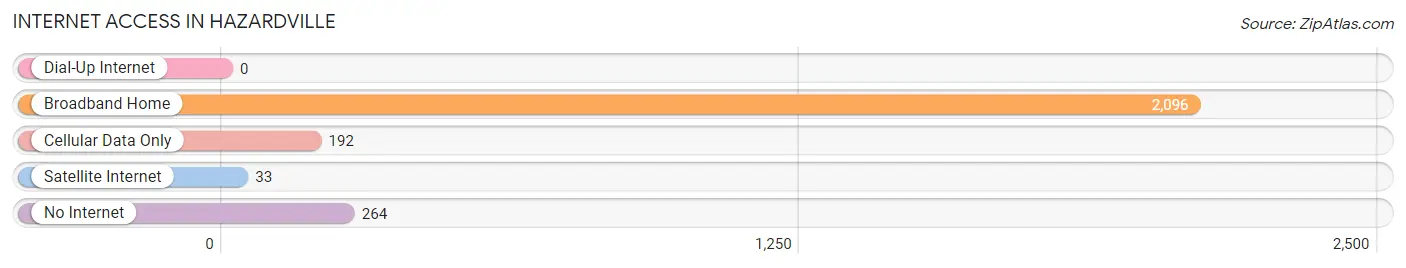
| Internet Type | # Households | % Households |
| Dial-Up Internet | 0 | 0.0% |
| Broadband Home | 2,096 | 81.8% |
| Cellular Data Only | 192 | 7.5% |
| Satellite Internet | 33 | 1.3% |
| No Internet | 264 | 10.3% |
| Total | 2,563 | 100.0% |
Hazardville Summary
Hazardville is a small village located in the town of Enfield, Connecticut. It is situated in the north-central part of the state, about 20 miles north of Hartford. The village is named after Colonel Augustus George Hazard, who founded the Hazard Powder Company in 1835. The company was the first in the United States to manufacture gunpowder, and it was the largest gunpowder manufacturer in the world for many years.
Hazardville is a small village with a population of about 2,000 people. The village is located in a rural area, and it is surrounded by forests and rolling hills. The village is home to a few small businesses, including a grocery store, a hardware store, and a few restaurants. The village is also home to a few churches, a library, and a post office.
The village of Hazardville is located in the Connecticut River Valley, and it is part of the Hartford metropolitan area. The village is located near the Connecticut River, and it is close to the Massachusetts border. The village is also close to the towns of Windsor, East Windsor, and Suffield.
The economy of Hazardville is largely based on the manufacturing industry. The Hazard Powder Company is still in operation, and it is the largest employer in the village. The company produces a variety of products, including gunpowder, explosives, and fireworks. The village also has a few small businesses, including a grocery store, a hardware store, and a few restaurants.
The demographics of Hazardville are largely white, with a small percentage of African Americans and Hispanics. The median household income in the village is around $50,000, and the median home value is around $200,000. The village has a low crime rate, and it is considered to be a safe place to live.
Hazardville is a small village with a rich history and a unique culture. The village is home to a few small businesses, and it is surrounded by forests and rolling hills. The village is close to the Connecticut River, and it is part of the Hartford metropolitan area. The village has a low crime rate, and it is considered to be a safe place to live. The village is home to the Hazard Powder Company, which is the largest employer in the village. The village has a median household income of around $50,000, and the median home value is around $200,000. The village is largely white, with a small percentage of African Americans and Hispanics.
Common Questions
What is Per Capita Income in Hazardville?
Per Capita income in Hazardville is $45,011.
What is the Median Family Income in Hazardville?
Median Family Income in Hazardville is $115,391.
What is the Median Household income in Hazardville?
Median Household Income in Hazardville is $93,486.
What is Income or Wage Gap in Hazardville?
Income or Wage Gap in Hazardville is 7.8%.
Women in Hazardville earn 92.2 cents for every dollar earned by a man.
What is Inequality or Gini Index in Hazardville?
Inequality or Gini Index in Hazardville is 0.38.
What is the Total Population of Hazardville?
Total Population of Hazardville is 6,123.
What is the Total Male Population of Hazardville?
Total Male Population of Hazardville is 3,172.
What is the Total Female Population of Hazardville?
Total Female Population of Hazardville is 2,951.
What is the Ratio of Males per 100 Females in Hazardville?
There are 107.49 Males per 100 Females in Hazardville.
What is the Ratio of Females per 100 Males in Hazardville?
There are 93.03 Females per 100 Males in Hazardville.
What is the Median Population Age in Hazardville?
Median Population Age in Hazardville is 43.9 Years.
What is the Average Family Size in Hazardville
Average Family Size in Hazardville is 2.8 People.
What is the Average Household Size in Hazardville
Average Household Size in Hazardville is 2.3 People.
How Large is the Labor Force in Hazardville?
There are 3,411 People in the Labor Forcein in Hazardville.
What is the Percentage of People in the Labor Force in Hazardville?
65.1% of People are in the Labor Force in Hazardville.
What is the Unemployment Rate in Hazardville?
Unemployment Rate in Hazardville is 4.3%.