Plainfield Village, CT Map & Demographics
Plainfield Village Map
Plainfield Village Overview
$24,079
PER CAPITA INCOME
$49,867
AVG FAMILY INCOME
$62,638
AVG HOUSEHOLD INCOME
51.7%
WAGE / INCOME GAP [ % ]
48.3¢/ $1
WAGE / INCOME GAP [ $ ]
0.36
INEQUALITY / GINI INDEX
2,681
TOTAL POPULATION
1,225
MALE POPULATION
1,456
FEMALE POPULATION
84.13
MALES / 100 FEMALES
118.86
FEMALES / 100 MALES
26.4
MEDIAN AGE
3.3
AVG FAMILY SIZE
2.4
AVG HOUSEHOLD SIZE
1,231
LABOR FORCE [ PEOPLE ]
62.0%
PERCENT IN LABOR FORCE
10.2%
UNEMPLOYMENT RATE
Income in Plainfield Village
Income Overview in Plainfield Village
Per Capita Income in Plainfield Village is $24,079, while median incomes of families and households are $49,867 and $62,638 respectively.
| Characteristic | Number | Measure |
| Per Capita Income | 2,681 | $24,079 |
| Median Family Income | 525 | $49,867 |
| Mean Family Income | 525 | $62,009 |
| Median Household Income | 1,054 | $62,638 |
| Mean Household Income | 1,054 | $63,300 |
| Income Deficit | 525 | $0 |
| Wage / Income Gap (%) | 2,681 | 51.69% |
| Wage / Income Gap ($) | 2,681 | 48.31¢ per $1 |
| Gini / Inequality Index | 2,681 | 0.36 |
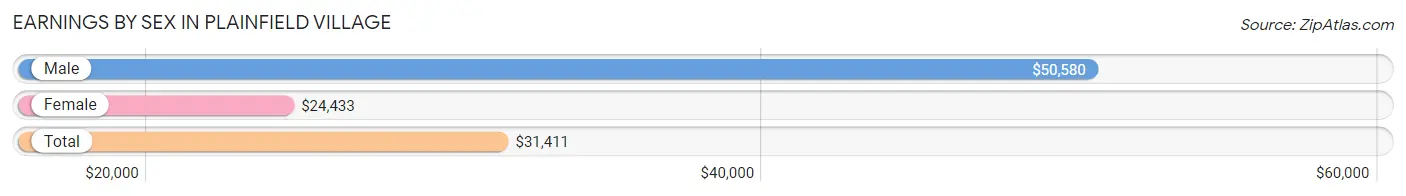
Earnings by Sex in Plainfield Village
Average Earnings in Plainfield Village are $31,411, $50,580 for men and $24,433 for women, a difference of 51.7%.
| Sex | Number | Average Earnings |
| Male | 647 (51.5%) | $50,580 |
| Female | 608 (48.4%) | $24,433 |
| Total | 1,255 (100.0%) | $31,411 |
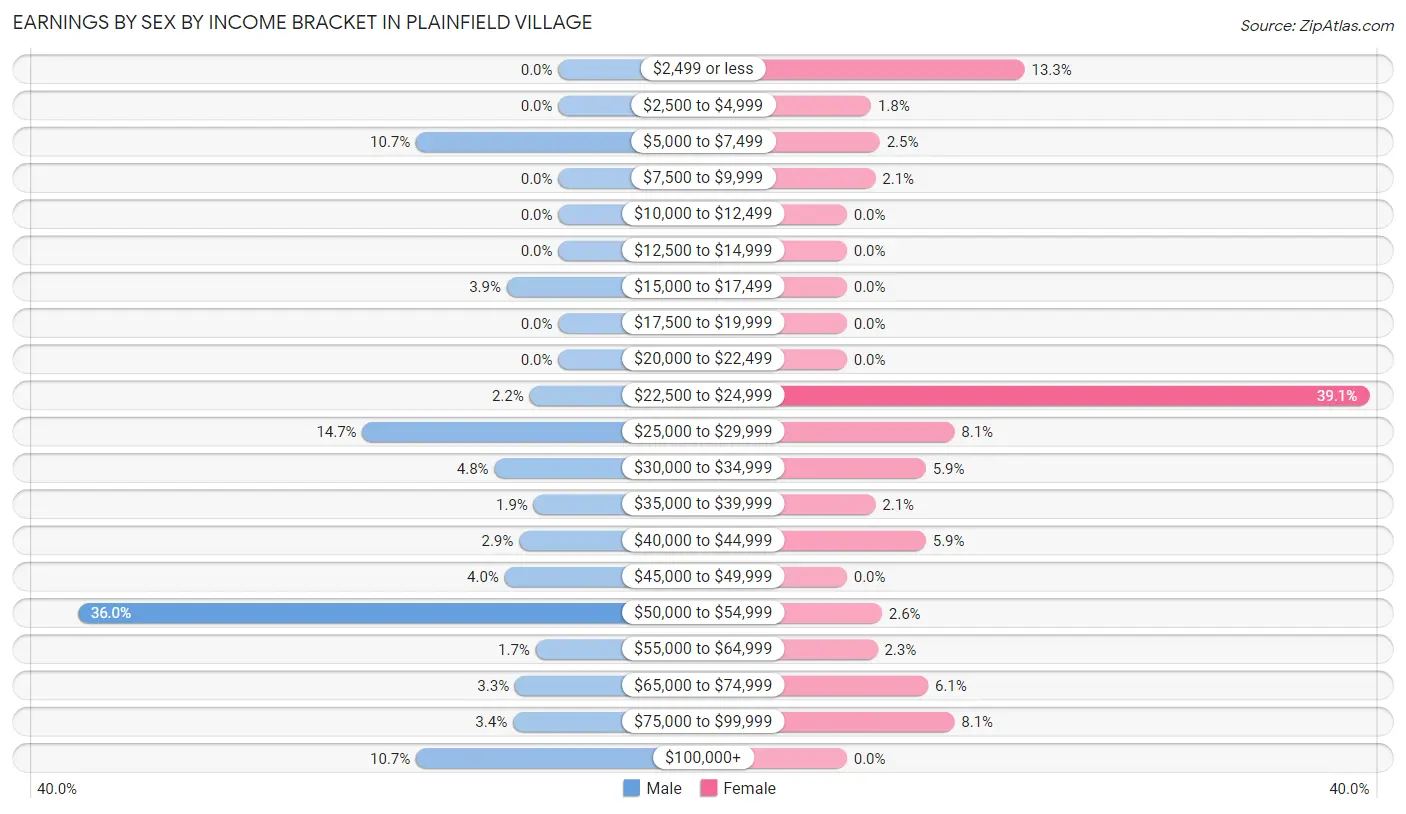
Earnings by Sex by Income Bracket in Plainfield Village
The most common earnings brackets in Plainfield Village are $50,000 to $54,999 for men (233 | 36.0%) and $22,500 to $24,999 for women (238 | 39.1%).
| Income | Male | Female |
| $2,499 or less | 0 (0.0%) | 81 (13.3%) |
| $2,500 to $4,999 | 0 (0.0%) | 11 (1.8%) |
| $5,000 to $7,499 | 69 (10.7%) | 15 (2.5%) |
| $7,500 to $9,999 | 0 (0.0%) | 13 (2.1%) |
| $10,000 to $12,499 | 0 (0.0%) | 0 (0.0%) |
| $12,500 to $14,999 | 0 (0.0%) | 0 (0.0%) |
| $15,000 to $17,499 | 25 (3.9%) | 0 (0.0%) |
| $17,500 to $19,999 | 0 (0.0%) | 0 (0.0%) |
| $20,000 to $22,499 | 0 (0.0%) | 0 (0.0%) |
| $22,500 to $24,999 | 14 (2.2%) | 238 (39.1%) |
| $25,000 to $29,999 | 95 (14.7%) | 49 (8.1%) |
| $30,000 to $34,999 | 31 (4.8%) | 36 (5.9%) |
| $35,000 to $39,999 | 12 (1.8%) | 13 (2.1%) |
| $40,000 to $44,999 | 19 (2.9%) | 36 (5.9%) |
| $45,000 to $49,999 | 26 (4.0%) | 0 (0.0%) |
| $50,000 to $54,999 | 233 (36.0%) | 16 (2.6%) |
| $55,000 to $64,999 | 11 (1.7%) | 14 (2.3%) |
| $65,000 to $74,999 | 21 (3.3%) | 37 (6.1%) |
| $75,000 to $99,999 | 22 (3.4%) | 49 (8.1%) |
| $100,000+ | 69 (10.7%) | 0 (0.0%) |
| Total | 647 (100.0%) | 608 (100.0%) |
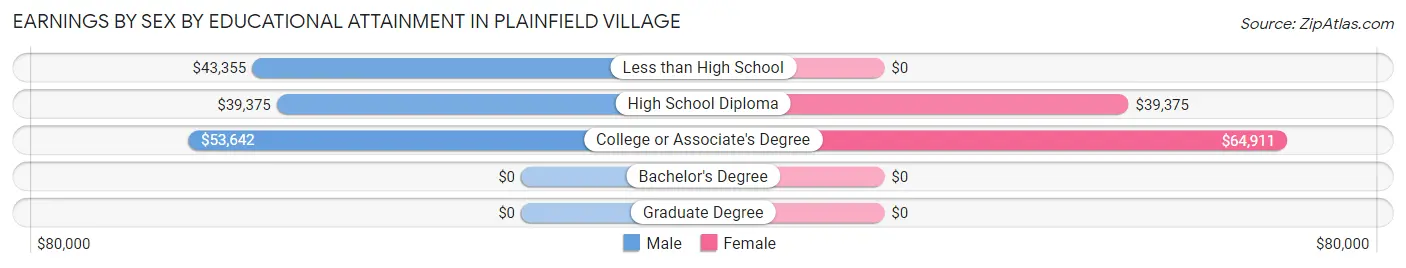
Earnings by Sex by Educational Attainment in Plainfield Village
Average earnings in Plainfield Village are $50,208 for men and $41,250 for women, a difference of 17.8%. Men with an educational attainment of college or associate's degree enjoy the highest average annual earnings of $53,642, while those with high school diploma education earn the least with $39,375. Women with an educational attainment of college or associate's degree earn the most with the average annual earnings of $64,911, while those with high school diploma education have the smallest earnings of $39,375.
| Educational Attainment | Male Income | Female Income |
| Less than High School | $43,355 | $0 |
| High School Diploma | $39,375 | $39,375 |
| College or Associate's Degree | $53,642 | $64,911 |
| Bachelor's Degree | - | - |
| Graduate Degree | - | - |
| Total | $50,208 | $41,250 |
Family Income in Plainfield Village
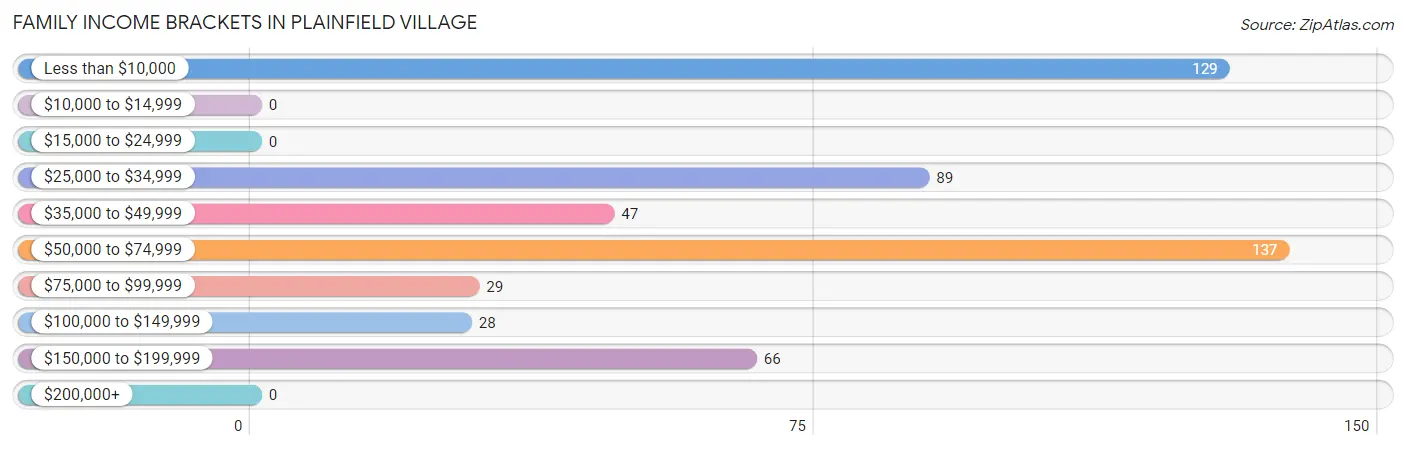
Family Income Brackets in Plainfield Village
According to the Plainfield Village family income data, there are 137 families falling into the $50,000 to $74,999 income range, which is the most common income bracket and makes up 26.1% of all families.
| Income Bracket | # Families | % Families |
| Less than $10,000 | 129 | 24.6% |
| $10,000 to $14,999 | 0 | 0.0% |
| $15,000 to $24,999 | 0 | 0.0% |
| $25,000 to $34,999 | 89 | 17.0% |
| $35,000 to $49,999 | 47 | 9.0% |
| $50,000 to $74,999 | 137 | 26.1% |
| $75,000 to $99,999 | 29 | 5.5% |
| $100,000 to $149,999 | 28 | 5.3% |
| $150,000 to $199,999 | 66 | 12.6% |
| $200,000+ | 0 | 0.0% |
Family Income by Famaliy Size in Plainfield Village
| Income Bracket | # Families | Median Income |
| 2-Person Families | 127 (24.2%) | $0 |
| 3-Person Families | 163 (31.0%) | $0 |
| 4-Person Families | 177 (33.7%) | $0 |
| 5-Person Families | 58 (11.1%) | $0 |
| 6-Person Families | 0 (0.0%) | $0 |
| 7+ Person Families | 0 (0.0%) | $0 |
| Total | 525 (100.0%) | $49,867 |
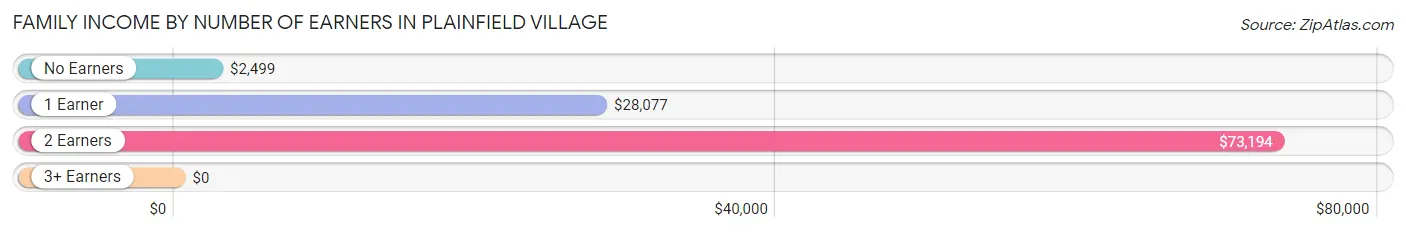
Family Income by Number of Earners in Plainfield Village
| Number of Earners | # Families | Median Income |
| No Earners | 141 (26.9%) | $2,499 |
| 1 Earner | 202 (38.5%) | $28,077 |
| 2 Earners | 124 (23.6%) | $73,194 |
| 3+ Earners | 58 (11.1%) | $0 |
| Total | 525 (100.0%) | $49,867 |
Household Income in Plainfield Village
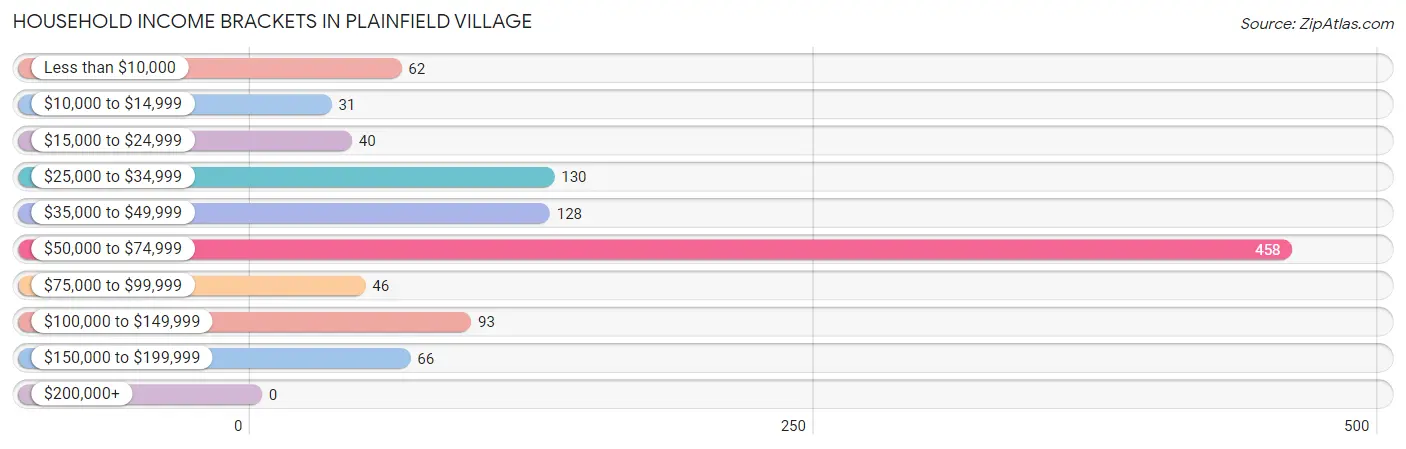
Household Income Brackets in Plainfield Village
With 458 households falling in the category, the $50,000 to $74,999 income range is the most frequent in Plainfield Village, accounting for 43.4% of all households.
| Income Bracket | # Households | % Households |
| Less than $10,000 | 62 | 5.9% |
| $10,000 to $14,999 | 31 | 2.9% |
| $15,000 to $24,999 | 40 | 3.8% |
| $25,000 to $34,999 | 130 | 12.3% |
| $35,000 to $49,999 | 128 | 12.1% |
| $50,000 to $74,999 | 458 | 43.5% |
| $75,000 to $99,999 | 46 | 4.4% |
| $100,000 to $149,999 | 93 | 8.8% |
| $150,000 to $199,999 | 66 | 6.3% |
| $200,000+ | 0 | 0.0% |
Household Income by Householder Age in Plainfield Village
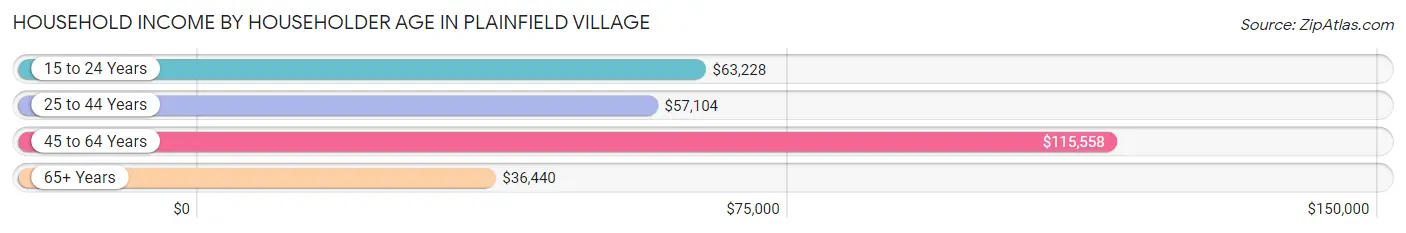
The median household income in Plainfield Village is $62,638, with the highest median household income of $115,558 found in the 45 to 64 years age bracket for the primary householder. A total of 263 households (24.9%) fall into this category. Meanwhile, the 65+ years age bracket for the primary householder has the lowest median household income of $36,440, with 225 households (21.3%) in this group.
| Income Bracket | # Households | Median Income |
| 15 to 24 Years | 309 (29.3%) | $63,228 |
| 25 to 44 Years | 257 (24.4%) | $57,104 |
| 45 to 64 Years | 263 (24.9%) | $115,558 |
| 65+ Years | 225 (21.3%) | $36,440 |
| Total | 1,054 (100.0%) | $62,638 |
Poverty in Plainfield Village
Income Below Poverty by Sex and Age in Plainfield Village
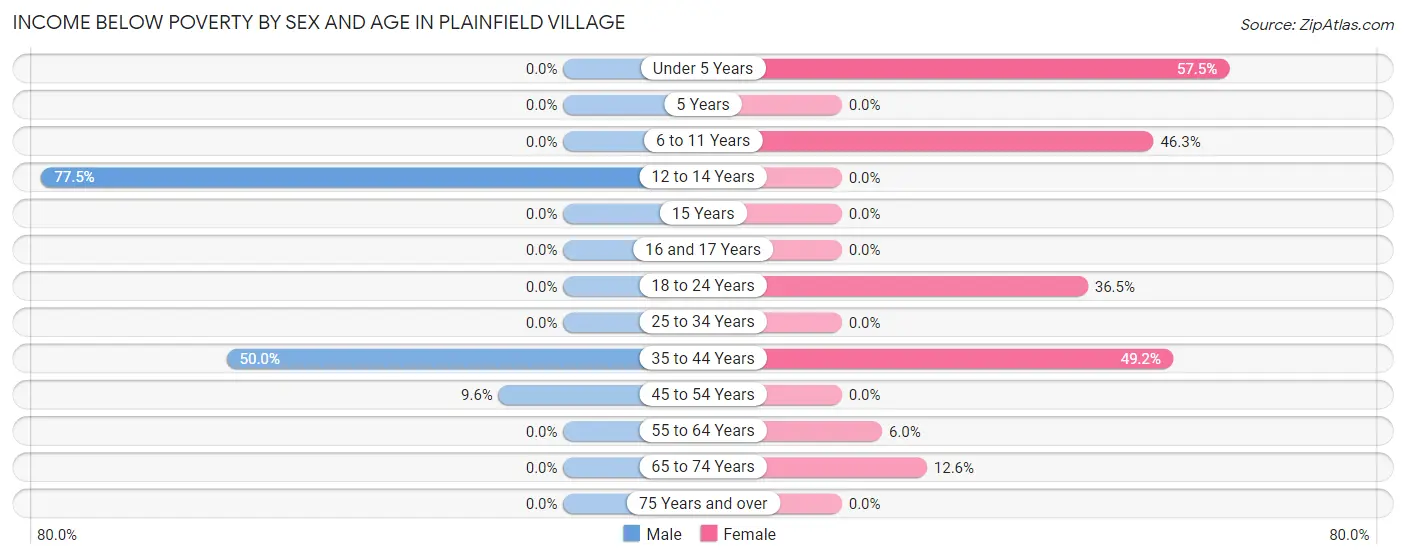
With 15.9% poverty level for males and 28.2% for females among the residents of Plainfield Village, 12 to 14 year old males and under 5 year old females are the most vulnerable to poverty, with 124 males (77.5%) and 115 females (57.5%) in their respective age groups living below the poverty level.
| Age Bracket | Male | Female |
| Under 5 Years | 0 (0.0%) | 115 (57.5%) |
| 5 Years | 0 (0.0%) | 0 (0.0%) |
| 6 to 11 Years | 0 (0.0%) | 56 (46.3%) |
| 12 to 14 Years | 124 (77.5%) | 0 (0.0%) |
| 15 Years | 0 (0.0%) | 0 (0.0%) |
| 16 and 17 Years | 0 (0.0%) | 0 (0.0%) |
| 18 to 24 Years | 0 (0.0%) | 137 (36.5%) |
| 25 to 34 Years | 0 (0.0%) | 0 (0.0%) |
| 35 to 44 Years | 45 (50.0%) | 58 (49.1%) |
| 45 to 54 Years | 19 (9.6%) | 0 (0.0%) |
| 55 to 64 Years | 0 (0.0%) | 4 (6.0%) |
| 65 to 74 Years | 0 (0.0%) | 12 (12.6%) |
| 75 Years and over | 0 (0.0%) | 0 (0.0%) |
| Total | 188 (15.9%) | 382 (28.2%) |
Income Above Poverty by Sex and Age in Plainfield Village
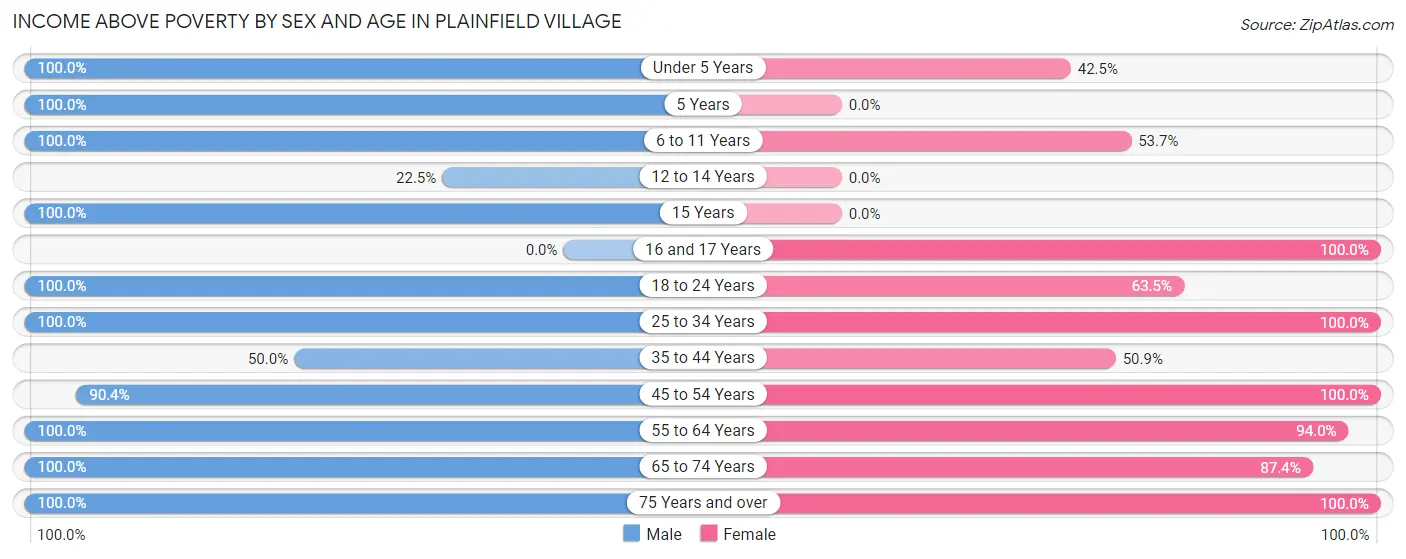
According to the poverty statistics in Plainfield Village, males aged under 5 years and females aged 16 and 17 years are the age groups that are most secure financially, with 100.0% of males and 100.0% of females in these age groups living above the poverty line.
| Age Bracket | Male | Female |
| Under 5 Years | 135 (100.0%) | 85 (42.5%) |
| 5 Years | 55 (100.0%) | 0 (0.0%) |
| 6 to 11 Years | 12 (100.0%) | 65 (53.7%) |
| 12 to 14 Years | 36 (22.5%) | 0 (0.0%) |
| 15 Years | 13 (100.0%) | 0 (0.0%) |
| 16 and 17 Years | 0 (0.0%) | 58 (100.0%) |
| 18 to 24 Years | 105 (100.0%) | 238 (63.5%) |
| 25 to 34 Years | 250 (100.0%) | 133 (100.0%) |
| 35 to 44 Years | 45 (50.0%) | 60 (50.8%) |
| 45 to 54 Years | 179 (90.4%) | 93 (100.0%) |
| 55 to 64 Years | 89 (100.0%) | 63 (94.0%) |
| 65 to 74 Years | 55 (100.0%) | 83 (87.4%) |
| 75 Years and over | 21 (100.0%) | 92 (100.0%) |
| Total | 995 (84.1%) | 970 (71.8%) |
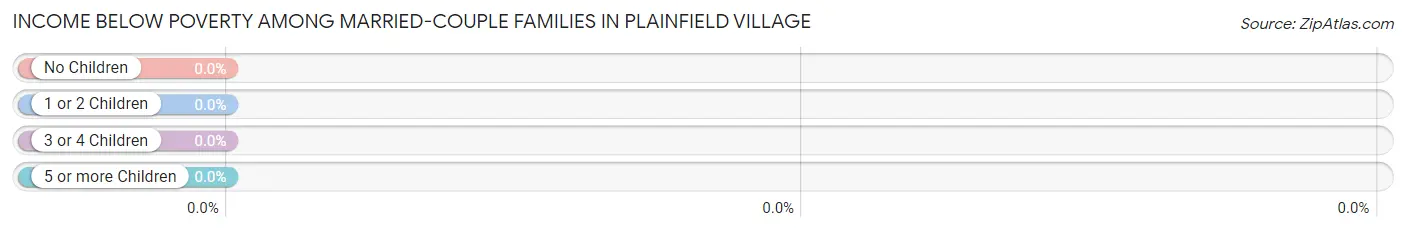
Income Below Poverty Among Married-Couple Families in Plainfield Village
| Children | Above Poverty | Below Poverty |
| No Children | 166 (100.0%) | 0 (0.0%) |
| 1 or 2 Children | 88 (100.0%) | 0 (0.0%) |
| 3 or 4 Children | 0 (0.0%) | 0 (0.0%) |
| 5 or more Children | 0 (0.0%) | 0 (0.0%) |
| Total | 254 (100.0%) | 0 (0.0%) |
Income Below Poverty Among Single-Parent Households in Plainfield Village
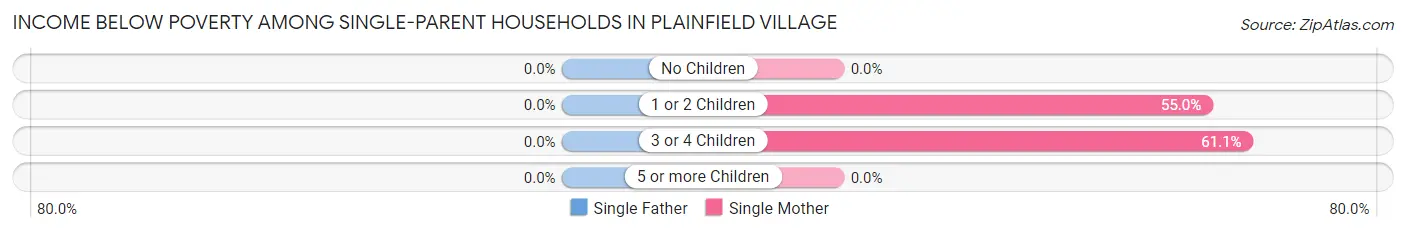
| Children | Single Father | Single Mother |
| No Children | 0 (0.0%) | 0 (0.0%) |
| 1 or 2 Children | 0 (0.0%) | 71 (55.0%) |
| 3 or 4 Children | 0 (0.0%) | 58 (61.1%) |
| 5 or more Children | 0 (0.0%) | 0 (0.0%) |
| Total | 0 (0.0%) | 129 (47.6%) |
Income Below Poverty Among Married-Couple vs Single-Parent Households in Plainfield Village
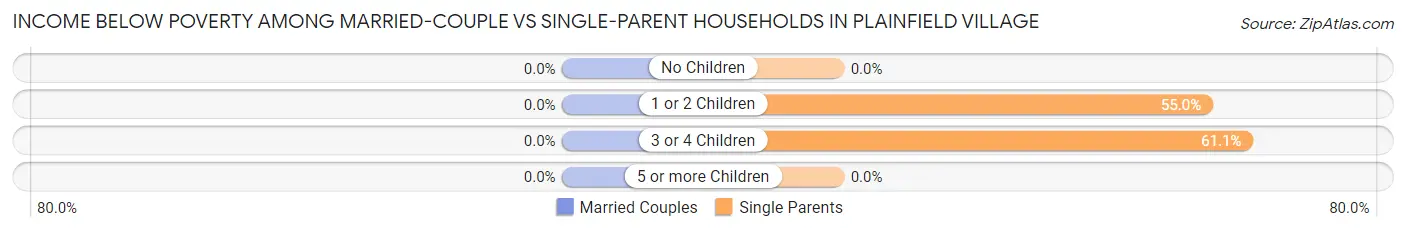
| Children | Married-Couple Families | Single-Parent Households |
| No Children | 0 (0.0%) | 0 (0.0%) |
| 1 or 2 Children | 0 (0.0%) | 71 (55.0%) |
| 3 or 4 Children | 0 (0.0%) | 58 (61.1%) |
| 5 or more Children | 0 (0.0%) | 0 (0.0%) |
| Total | 0 (0.0%) | 129 (47.6%) |
Race in Plainfield Village
The most populous races in Plainfield Village are White / Caucasian (2,415 | 90.1%), Hispanic or Latino (571 | 21.3%), and Some other Race (224 | 8.4%).
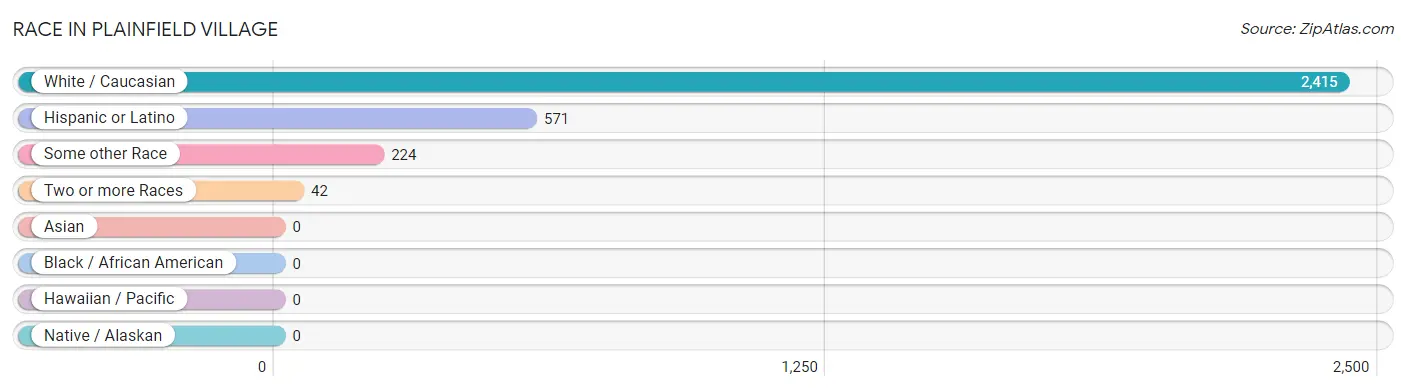
| Race | # Population | % Population |
| Asian | 0 | 0.0% |
| Black / African American | 0 | 0.0% |
| Hawaiian / Pacific | 0 | 0.0% |
| Hispanic or Latino | 571 | 21.3% |
| Native / Alaskan | 0 | 0.0% |
| White / Caucasian | 2,415 | 90.1% |
| Two or more Races | 42 | 1.6% |
| Some other Race | 224 | 8.4% |
| Total | 2,681 | 100.0% |
Ancestry in Plainfield Village
The most populous ancestries reported in Plainfield Village are Mexican (424 | 15.8%), English (386 | 14.4%), Italian (302 | 11.3%), French (294 | 11.0%), and British (212 | 7.9%), together accounting for 60.3% of all Plainfield Village residents.
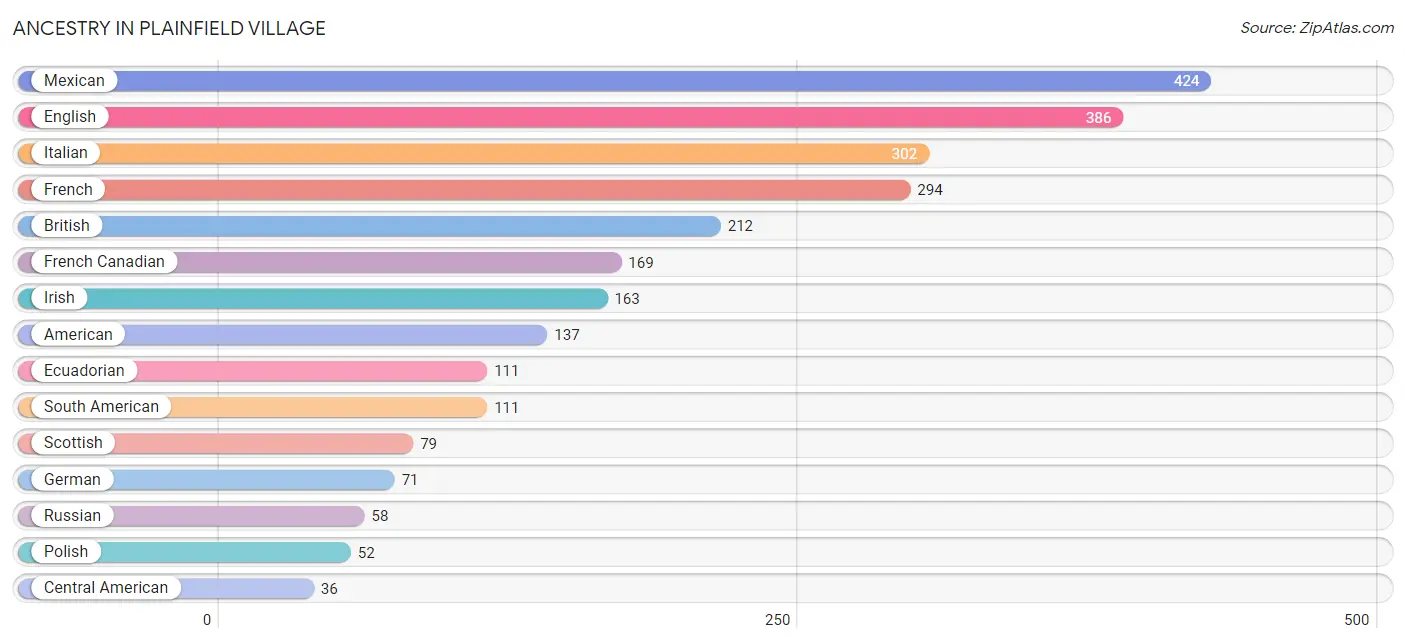
| Ancestry | # Population | % Population |
| American | 137 | 5.1% |
| Belgian | 12 | 0.4% |
| British | 212 | 7.9% |
| Canadian | 17 | 0.6% |
| Central American | 36 | 1.3% |
| Dutch | 12 | 0.4% |
| Ecuadorian | 111 | 4.1% |
| English | 386 | 14.4% |
| Finnish | 19 | 0.7% |
| French | 294 | 11.0% |
| French Canadian | 169 | 6.3% |
| German | 71 | 2.6% |
| Guatemalan | 36 | 1.3% |
| Irish | 163 | 6.1% |
| Italian | 302 | 11.3% |
| Mexican | 424 | 15.8% |
| Polish | 52 | 1.9% |
| Portuguese | 23 | 0.9% |
| Russian | 58 | 2.2% |
| Scotch-Irish | 26 | 1.0% |
| Scottish | 79 | 2.9% |
| South American | 111 | 4.1% |
| Swedish | 13 | 0.5% |
| Ukrainian | 6 | 0.2% | View All 24 Rows |
Immigrants in Plainfield Village
The most numerous immigrant groups reported in Plainfield Village came from Europe (30 | 1.1%), Germany (20 | 0.7%), Western Europe (20 | 0.7%), Canada (19 | 0.7%), and Northern Europe (10 | 0.4%), together accounting for 3.7% of all Plainfield Village residents.
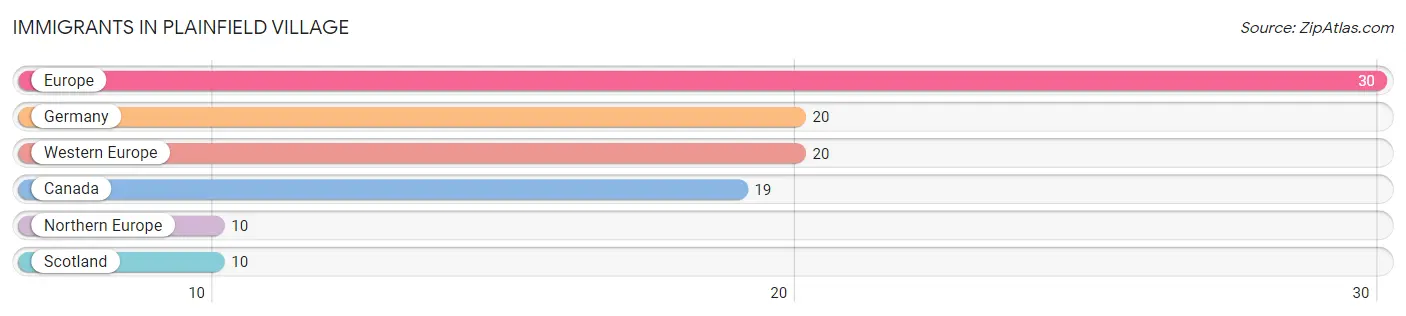
| Immigration Origin | # Population | % Population |
| Canada | 19 | 0.7% |
| Europe | 30 | 1.1% |
| Germany | 20 | 0.7% |
| Northern Europe | 10 | 0.4% |
| Scotland | 10 | 0.4% |
| Western Europe | 20 | 0.7% | View All 6 Rows |
Sex and Age in Plainfield Village
Sex and Age in Plainfield Village
The most populous age groups in Plainfield Village are 25 to 29 Years (195 | 15.9%) for men and 20 to 24 Years (375 | 25.8%) for women.
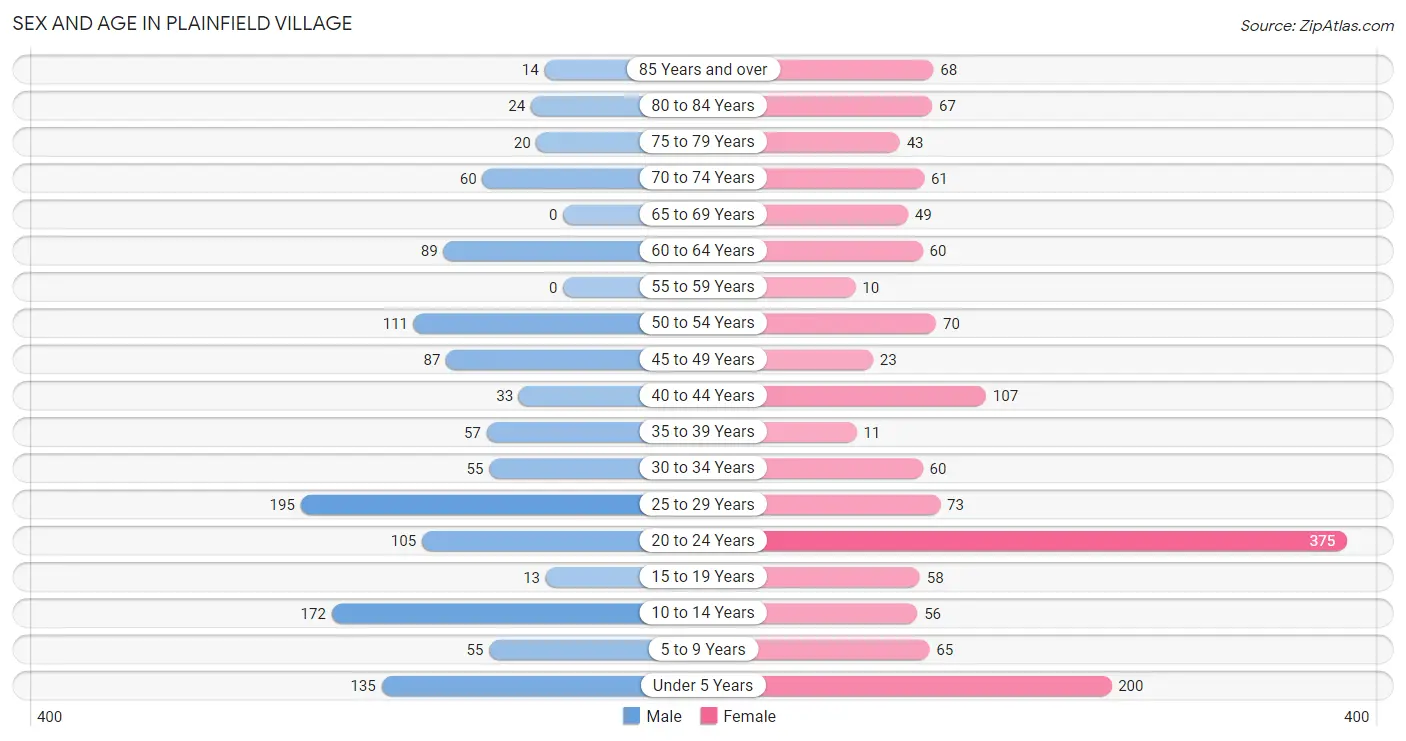
| Age Bracket | Male | Female |
| Under 5 Years | 135 (11.0%) | 200 (13.7%) |
| 5 to 9 Years | 55 (4.5%) | 65 (4.5%) |
| 10 to 14 Years | 172 (14.0%) | 56 (3.8%) |
| 15 to 19 Years | 13 (1.1%) | 58 (4.0%) |
| 20 to 24 Years | 105 (8.6%) | 375 (25.8%) |
| 25 to 29 Years | 195 (15.9%) | 73 (5.0%) |
| 30 to 34 Years | 55 (4.5%) | 60 (4.1%) |
| 35 to 39 Years | 57 (4.6%) | 11 (0.8%) |
| 40 to 44 Years | 33 (2.7%) | 107 (7.3%) |
| 45 to 49 Years | 87 (7.1%) | 23 (1.6%) |
| 50 to 54 Years | 111 (9.1%) | 70 (4.8%) |
| 55 to 59 Years | 0 (0.0%) | 10 (0.7%) |
| 60 to 64 Years | 89 (7.3%) | 60 (4.1%) |
| 65 to 69 Years | 0 (0.0%) | 49 (3.4%) |
| 70 to 74 Years | 60 (4.9%) | 61 (4.2%) |
| 75 to 79 Years | 20 (1.6%) | 43 (2.9%) |
| 80 to 84 Years | 24 (2.0%) | 67 (4.6%) |
| 85 Years and over | 14 (1.1%) | 68 (4.7%) |
| Total | 1,225 (100.0%) | 1,456 (100.0%) |
Families and Households in Plainfield Village
Median Family Size in Plainfield Village
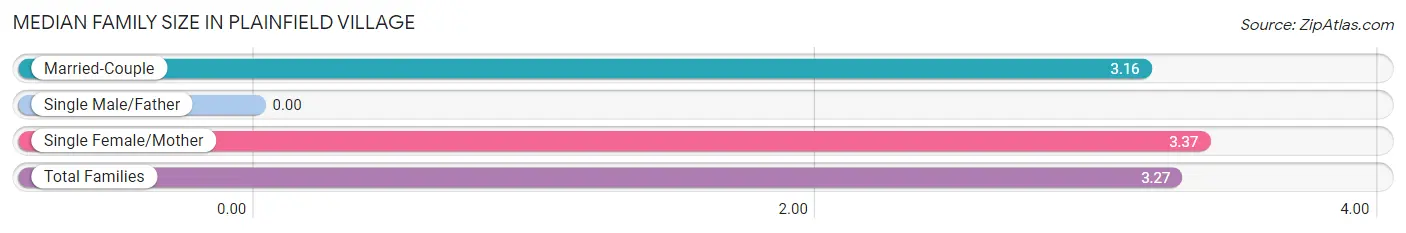
| Family Type | # Families | Family Size |
| Married-Couple | 254 (48.4%) | 3.16 |
| Single Male/Father | 0 (0.0%) | - |
| Single Female/Mother | 271 (51.6%) | 3.37 |
| Total Families | 525 (100.0%) | 3.27 |
Median Household Size in Plainfield Village
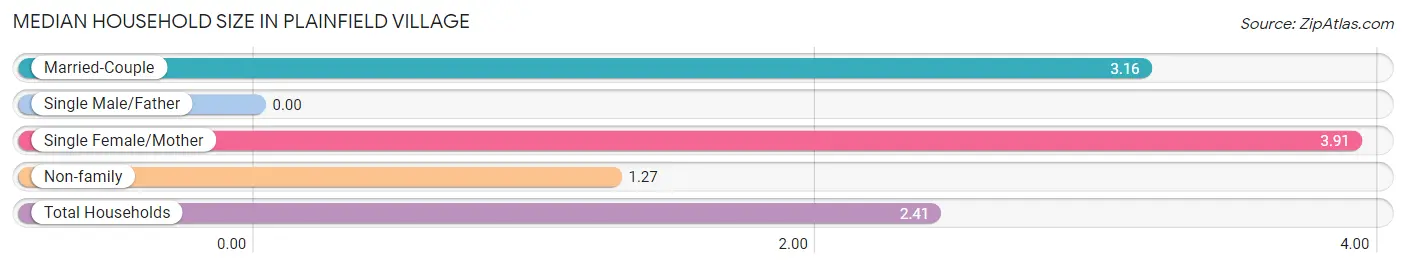
| Household Type | # Households | Household Size |
| Married-Couple | 254 (24.1%) | 3.16 |
| Single Male/Father | 0 (0.0%) | - |
| Single Female/Mother | 271 (25.7%) | 3.91 |
| Non-family | 529 (50.2%) | 1.27 |
| Total Households | 1,054 (100.0%) | 2.41 |
Household Size by Marriage Status in Plainfield Village
Out of a total of 1,054 households in Plainfield Village, 525 (49.8%) are family households, while 529 (50.2%) are nonfamily households. The most numerous type of family households are 4-person households, comprising 211, and the most common type of nonfamily households are 1-person households, comprising 288.
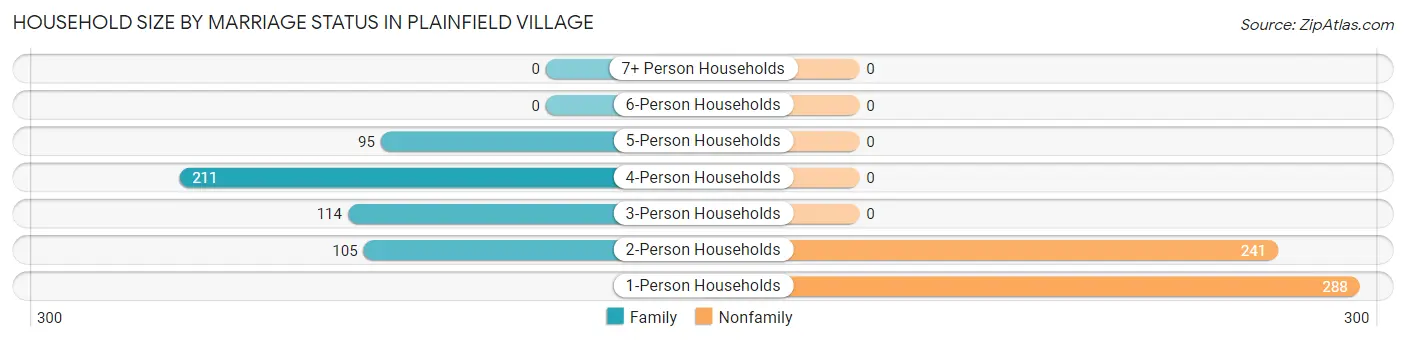
| Household Size | Family Households | Nonfamily Households |
| 1-Person Households | - | 288 (27.3%) |
| 2-Person Households | 105 (10.0%) | 241 (22.9%) |
| 3-Person Households | 114 (10.8%) | 0 (0.0%) |
| 4-Person Households | 211 (20.0%) | 0 (0.0%) |
| 5-Person Households | 95 (9.0%) | 0 (0.0%) |
| 6-Person Households | 0 (0.0%) | 0 (0.0%) |
| 7+ Person Households | 0 (0.0%) | 0 (0.0%) |
| Total | 525 (49.8%) | 529 (50.2%) |
Female Fertility in Plainfield Village
Fertility by Age in Plainfield Village
Average fertility rate in Plainfield Village is 165.0 births per 1,000 women. Women in the age bracket of 20 to 34 years have the highest fertility rate with 230.0 births per 1,000 women. Women in the age bracket of 20 to 34 years acount for 100.0% of all women with births.
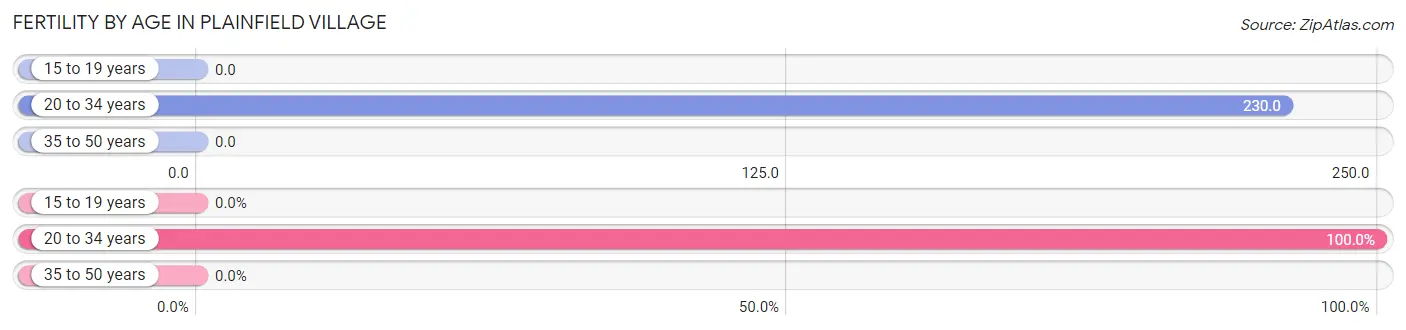
| Age Bracket | Women with Births | Births / 1,000 Women |
| 15 to 19 years | 0 (0.0%) | 0.0 |
| 20 to 34 years | 117 (100.0%) | 230.0 |
| 35 to 50 years | 0 (0.0%) | 0.0 |
| Total | 117 (100.0%) | 165.0 |
Fertility by Age by Marriage Status in Plainfield Village
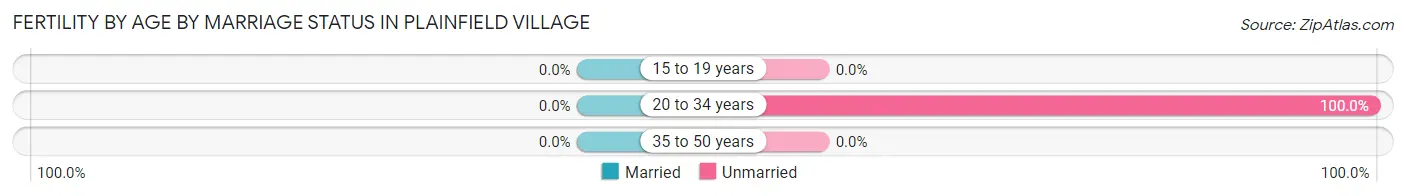
| Age Bracket | Married | Unmarried |
| 15 to 19 years | 0 (0.0%) | 0 (0.0%) |
| 20 to 34 years | 0 (0.0%) | 117 (100.0%) |
| 35 to 50 years | 0 (0.0%) | 0 (0.0%) |
| Total | 0 (0.0%) | 117 (100.0%) |
Fertility by Education in Plainfield Village
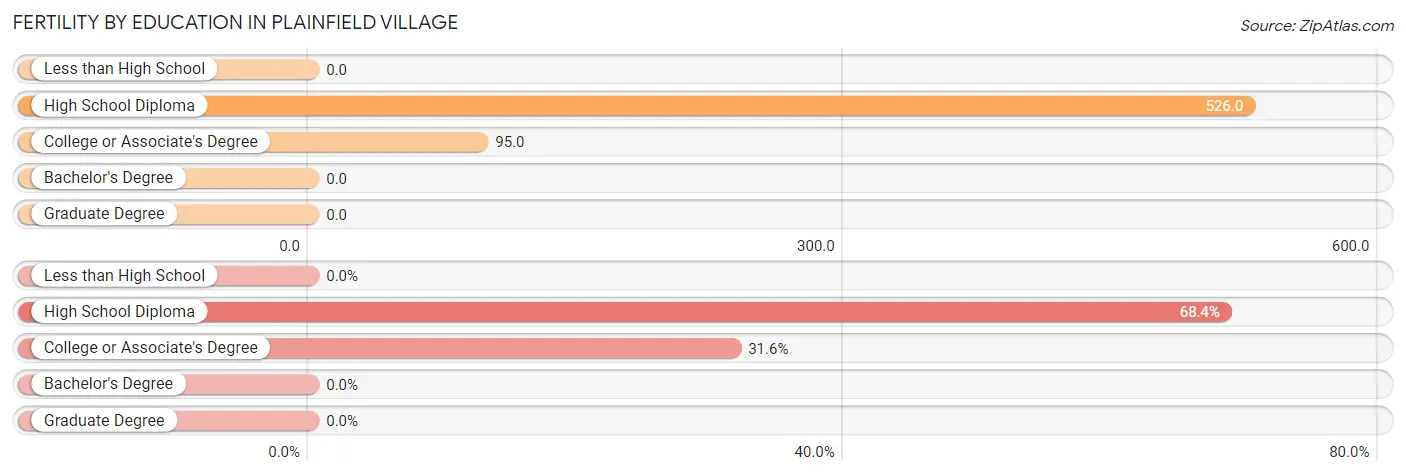
| Educational Attainment | Women with Births | Births / 1,000 Women |
| Less than High School | 0 (0.0%) | 0.0 |
| High School Diploma | 80 (68.4%) | 526.0 |
| College or Associate's Degree | 37 (31.6%) | 95.0 |
| Bachelor's Degree | 0 (0.0%) | 0.0 |
| Graduate Degree | 0 (0.0%) | 0.0 |
| Total | 117 (100.0%) | 165.0 |
Fertility by Education by Marriage Status in Plainfield Village
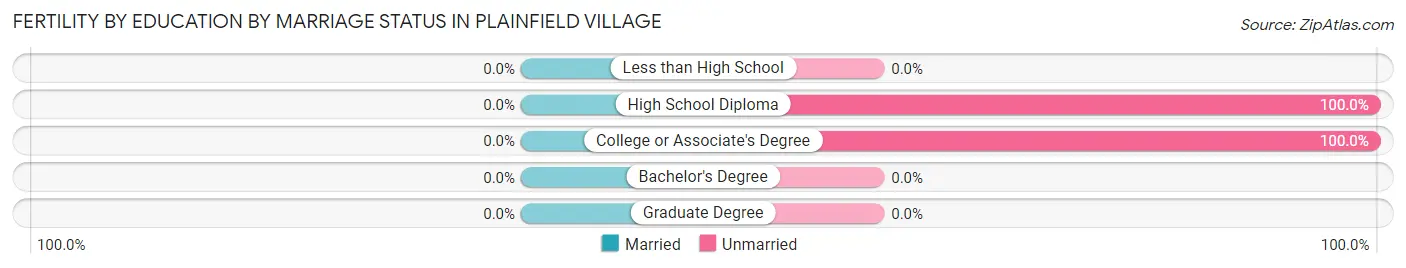
| Educational Attainment | Married | Unmarried |
| Less than High School | 0 (0.0%) | 0 (0.0%) |
| High School Diploma | 0 (0.0%) | 80 (100.0%) |
| College or Associate's Degree | 0 (0.0%) | 37 (100.0%) |
| Bachelor's Degree | 0 (0.0%) | 0 (0.0%) |
| Graduate Degree | 0 (0.0%) | 0 (0.0%) |
| Total | 0 (0.0%) | 117 (100.0%) |
Employment Characteristics in Plainfield Village
Employment by Class of Employer in Plainfield Village
Among the 1,106 employed individuals in Plainfield Village, private company employees (880 | 79.6%), local government employees (66 | 6.0%), and self-employed (incorporated) (58 | 5.2%) make up the most common classes of employment.
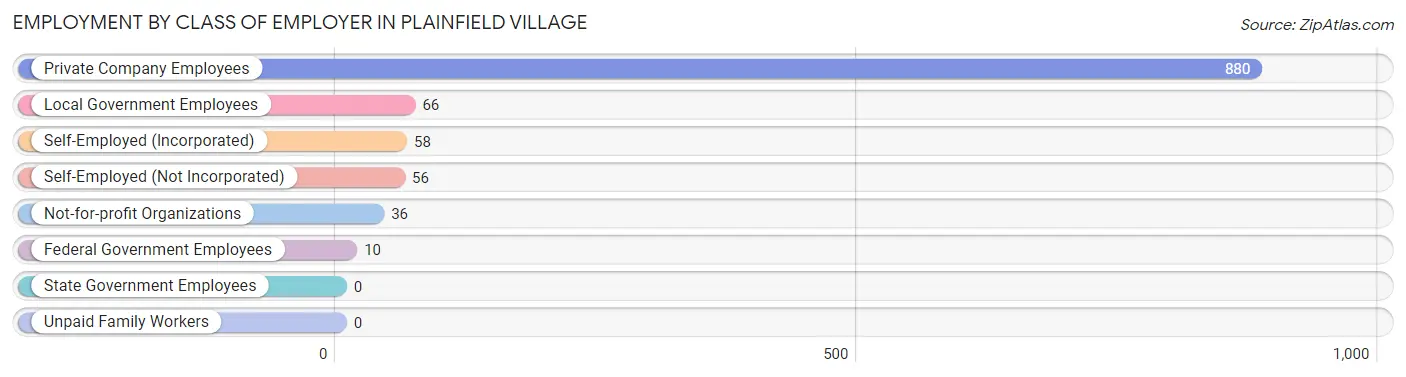
| Employer Class | # Employees | % Employees |
| Private Company Employees | 880 | 79.6% |
| Self-Employed (Incorporated) | 58 | 5.2% |
| Self-Employed (Not Incorporated) | 56 | 5.1% |
| Not-for-profit Organizations | 36 | 3.3% |
| Local Government Employees | 66 | 6.0% |
| State Government Employees | 0 | 0.0% |
| Federal Government Employees | 10 | 0.9% |
| Unpaid Family Workers | 0 | 0.0% |
| Total | 1,106 | 100.0% |
Employment Status by Age in Plainfield Village
According to the labor force statistics for Plainfield Village, out of the total population over 16 years of age (1,985), 62.0% or 1,231 individuals are in the labor force, with 10.2% or 126 of them unemployed. The age group with the highest labor force participation rate is 30 to 34 years, with 100.0% or 115 individuals in the labor force. Within the labor force, the 16 to 19 years age range has the highest percentage of unemployed individuals, with 100.0% or 44 of them being unemployed.
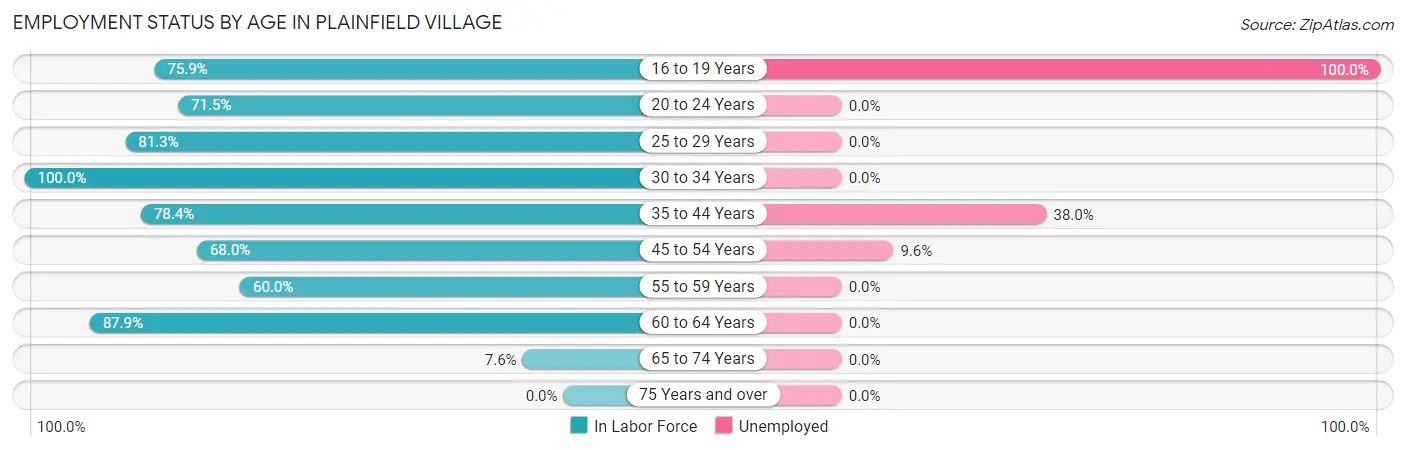
| Age Bracket | In Labor Force | Unemployed |
| 16 to 19 Years | 44 (75.9%) | 44 (100.0%) |
| 20 to 24 Years | 343 (71.5%) | 0 (0.0%) |
| 25 to 29 Years | 218 (81.3%) | 0 (0.0%) |
| 30 to 34 Years | 115 (100.0%) | 0 (0.0%) |
| 35 to 44 Years | 163 (78.4%) | 62 (38.0%) |
| 45 to 54 Years | 198 (68.0%) | 19 (9.6%) |
| 55 to 59 Years | 6 (60.0%) | 0 (0.0%) |
| 60 to 64 Years | 131 (87.9%) | 0 (0.0%) |
| 65 to 74 Years | 13 (7.6%) | 0 (0.0%) |
| 75 Years and over | 0 (0.0%) | 0 (0.0%) |
| Total | 1,231 (62.0%) | 126 (10.2%) |
Employment Status by Educational Attainment in Plainfield Village
According to labor force statistics for Plainfield Village, 79.8% of individuals (831) out of the total population between 25 and 64 years of age (1,041) are in the labor force, with 9.7% or 81 of them being unemployed. The group with the highest labor force participation rate are those with the educational attainment of college / associate degree, with 94.0% or 358 individuals in the labor force. Within the labor force, individuals with bachelor's degree or higher education have the highest percentage of unemployment, with 29.1% or 58 of them being unemployed.
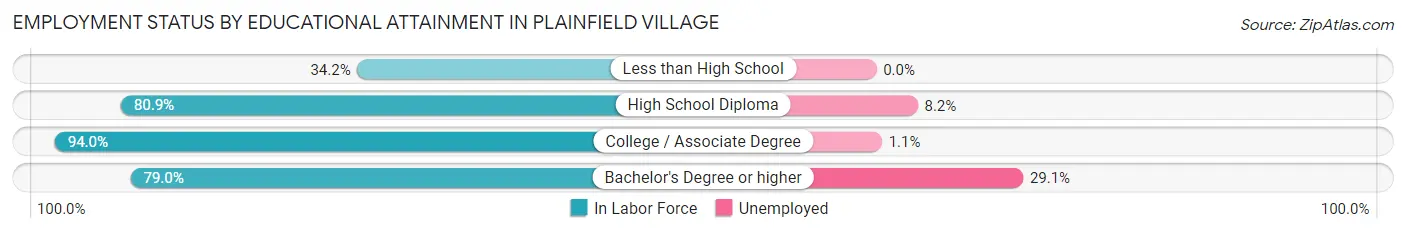
| Educational Attainment | In Labor Force | Unemployed |
| Less than High School | 41 (34.2%) | 0 (0.0%) |
| High School Diploma | 233 (80.9%) | 24 (8.2%) |
| College / Associate Degree | 358 (94.0%) | 4 (1.1%) |
| Bachelor's Degree or higher | 199 (79.0%) | 73 (29.1%) |
| Total | 831 (79.8%) | 101 (9.7%) |
Employment Occupations by Sex in Plainfield Village
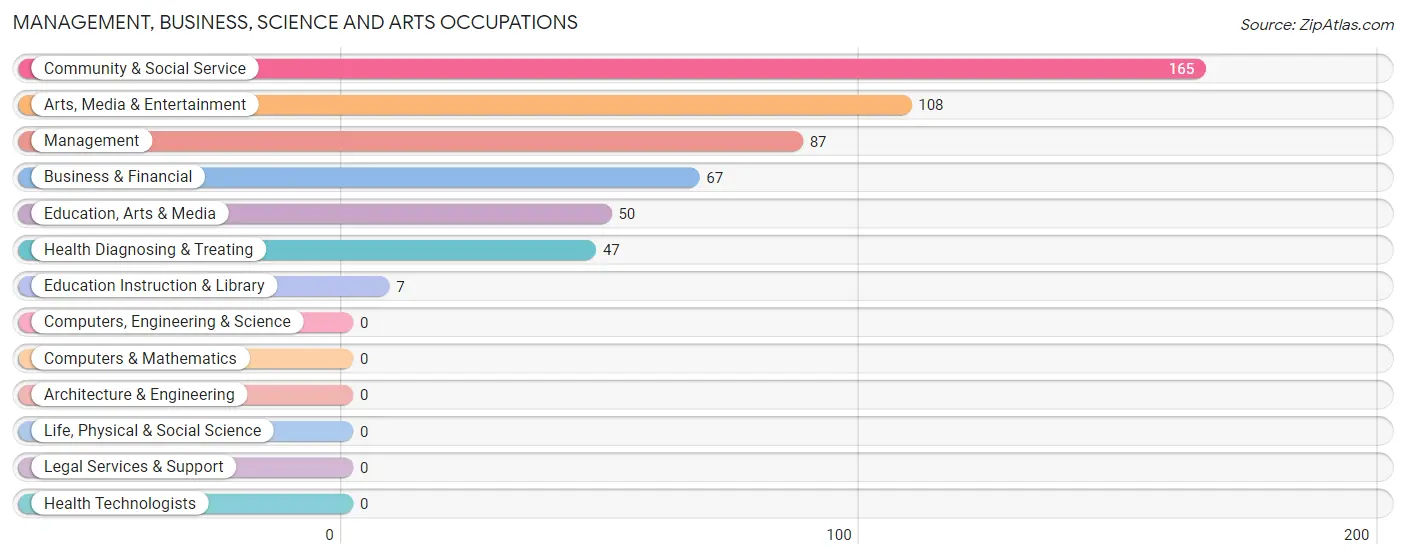
Management, Business, Science and Arts Occupations
The most common Management, Business, Science and Arts occupations in Plainfield Village are Community & Social Service (165 | 14.9%), Arts, Media & Entertainment (108 | 9.8%), Management (87 | 7.9%), Business & Financial (67 | 6.1%), and Education, Arts & Media (50 | 4.5%).
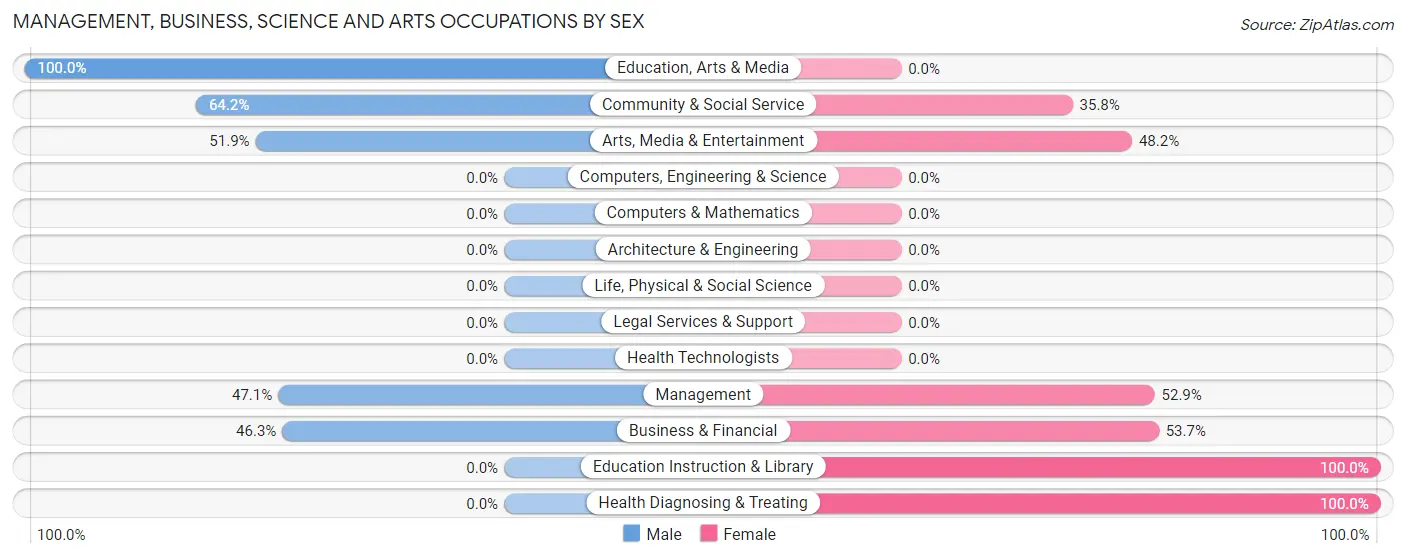
Management, Business, Science and Arts Occupations by Sex
Within the Management, Business, Science and Arts occupations in Plainfield Village, the most male-oriented occupations are Education, Arts & Media (100.0%), Community & Social Service (64.2%), and Arts, Media & Entertainment (51.8%), while the most female-oriented occupations are Education Instruction & Library (100.0%), Health Diagnosing & Treating (100.0%), and Business & Financial (53.7%).
| Occupation | Male | Female |
| Management | 41 (47.1%) | 46 (52.9%) |
| Business & Financial | 31 (46.3%) | 36 (53.7%) |
| Computers, Engineering & Science | 0 (0.0%) | 0 (0.0%) |
| Computers & Mathematics | 0 (0.0%) | 0 (0.0%) |
| Architecture & Engineering | 0 (0.0%) | 0 (0.0%) |
| Life, Physical & Social Science | 0 (0.0%) | 0 (0.0%) |
| Community & Social Service | 106 (64.2%) | 59 (35.8%) |
| Education, Arts & Media | 50 (100.0%) | 0 (0.0%) |
| Legal Services & Support | 0 (0.0%) | 0 (0.0%) |
| Education Instruction & Library | 0 (0.0%) | 7 (100.0%) |
| Arts, Media & Entertainment | 56 (51.8%) | 52 (48.1%) |
| Health Diagnosing & Treating | 0 (0.0%) | 47 (100.0%) |
| Health Technologists | 0 (0.0%) | 0 (0.0%) |
| Total (Category) | 178 (48.6%) | 188 (51.4%) |
| Total (Overall) | 568 (51.4%) | 538 (48.6%) |
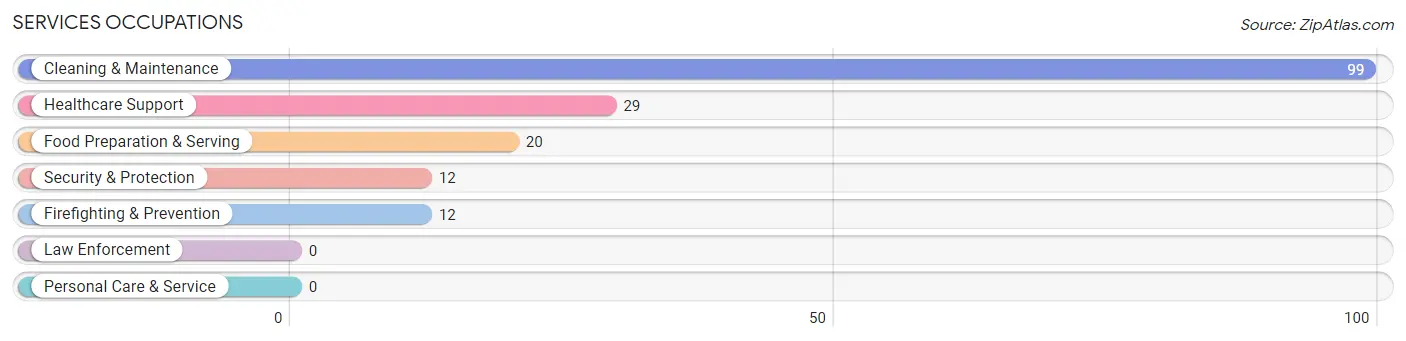
Services Occupations
The most common Services occupations in Plainfield Village are Cleaning & Maintenance (99 | 8.9%), Healthcare Support (29 | 2.6%), Food Preparation & Serving (20 | 1.8%), Security & Protection (12 | 1.1%), and Firefighting & Prevention (12 | 1.1%).
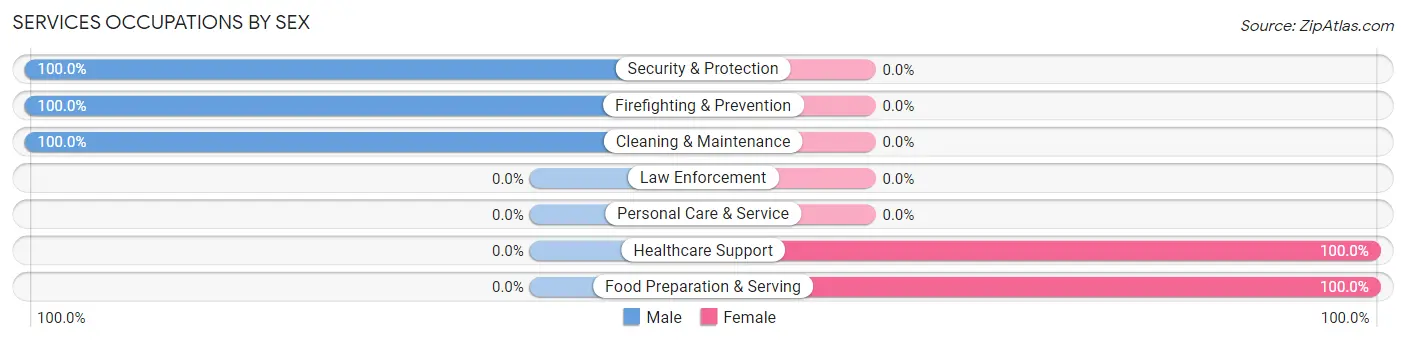
Services Occupations by Sex
Within the Services occupations in Plainfield Village, the most male-oriented occupations are Security & Protection (100.0%), Firefighting & Prevention (100.0%), and Cleaning & Maintenance (100.0%), while the most female-oriented occupations are Healthcare Support (100.0%), and Food Preparation & Serving (100.0%).
| Occupation | Male | Female |
| Healthcare Support | 0 (0.0%) | 29 (100.0%) |
| Security & Protection | 12 (100.0%) | 0 (0.0%) |
| Firefighting & Prevention | 12 (100.0%) | 0 (0.0%) |
| Law Enforcement | 0 (0.0%) | 0 (0.0%) |
| Food Preparation & Serving | 0 (0.0%) | 20 (100.0%) |
| Cleaning & Maintenance | 99 (100.0%) | 0 (0.0%) |
| Personal Care & Service | 0 (0.0%) | 0 (0.0%) |
| Total (Category) | 111 (69.4%) | 49 (30.6%) |
| Total (Overall) | 568 (51.4%) | 538 (48.6%) |
Sales and Office Occupations
The most common Sales and Office occupations in Plainfield Village are Sales & Related (145 | 13.1%), and Office & Administration (30 | 2.7%).
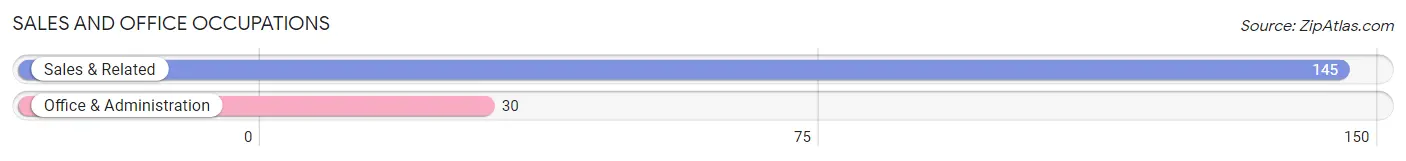
Sales and Office Occupations by Sex
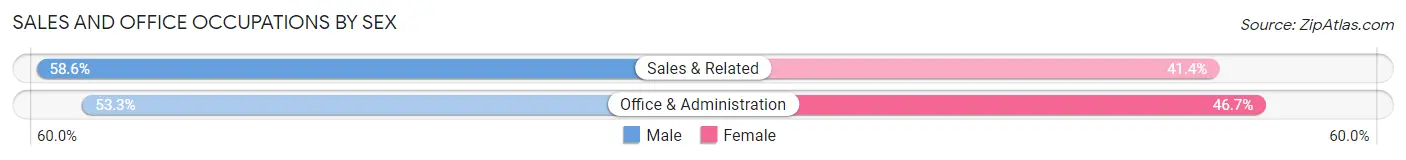
| Occupation | Male | Female |
| Sales & Related | 85 (58.6%) | 60 (41.4%) |
| Office & Administration | 16 (53.3%) | 14 (46.7%) |
| Total (Category) | 101 (57.7%) | 74 (42.3%) |
| Total (Overall) | 568 (51.4%) | 538 (48.6%) |
Natural Resources, Construction and Maintenance Occupations
The most common Natural Resources, Construction and Maintenance occupations in Plainfield Village are Construction & Extraction (42 | 3.8%), and Installation, Maintenance & Repair (19 | 1.7%).
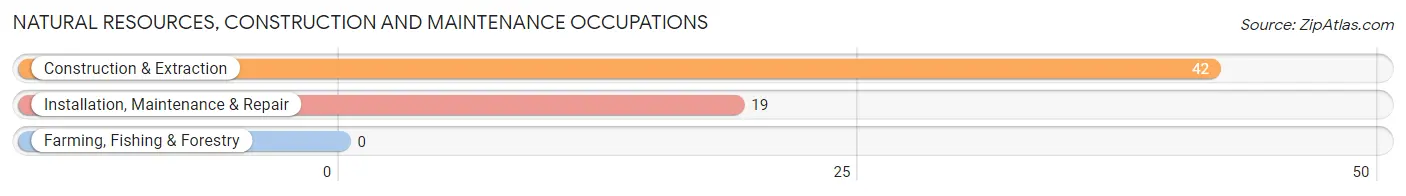
Natural Resources, Construction and Maintenance Occupations by Sex
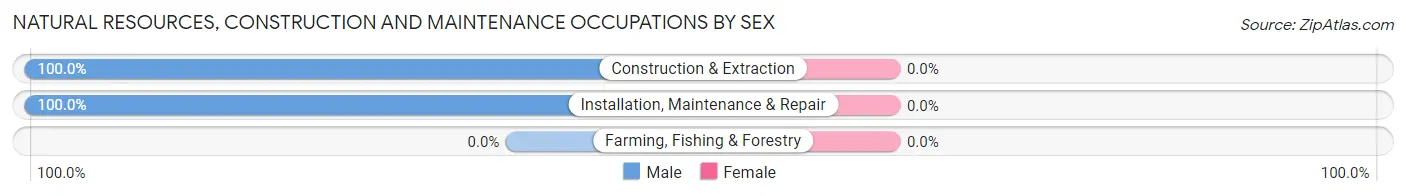
| Occupation | Male | Female |
| Farming, Fishing & Forestry | 0 (0.0%) | 0 (0.0%) |
| Construction & Extraction | 42 (100.0%) | 0 (0.0%) |
| Installation, Maintenance & Repair | 19 (100.0%) | 0 (0.0%) |
| Total (Category) | 61 (100.0%) | 0 (0.0%) |
| Total (Overall) | 568 (51.4%) | 538 (48.6%) |
Production, Transportation and Moving Occupations
The most common Production, Transportation and Moving occupations in Plainfield Village are Material Moving (322 | 29.1%), and Production (22 | 2.0%).
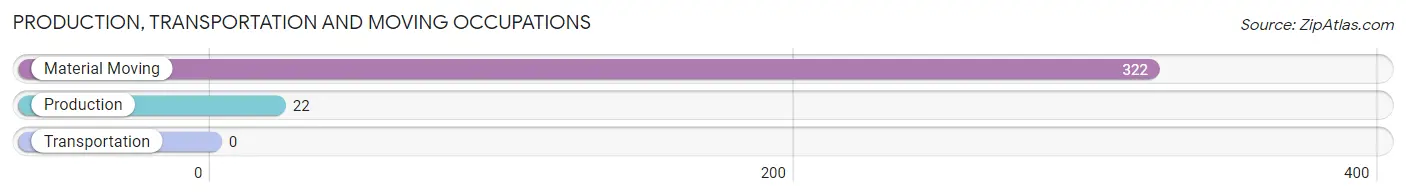
Production, Transportation and Moving Occupations by Sex
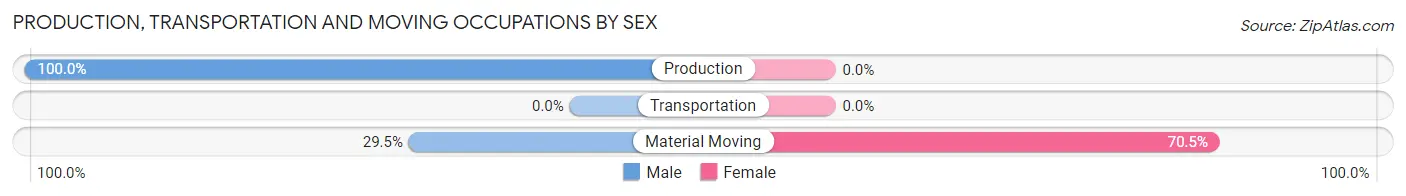
| Occupation | Male | Female |
| Production | 22 (100.0%) | 0 (0.0%) |
| Transportation | 0 (0.0%) | 0 (0.0%) |
| Material Moving | 95 (29.5%) | 227 (70.5%) |
| Total (Category) | 117 (34.0%) | 227 (66.0%) |
| Total (Overall) | 568 (51.4%) | 538 (48.6%) |
Employment Industries by Sex in Plainfield Village
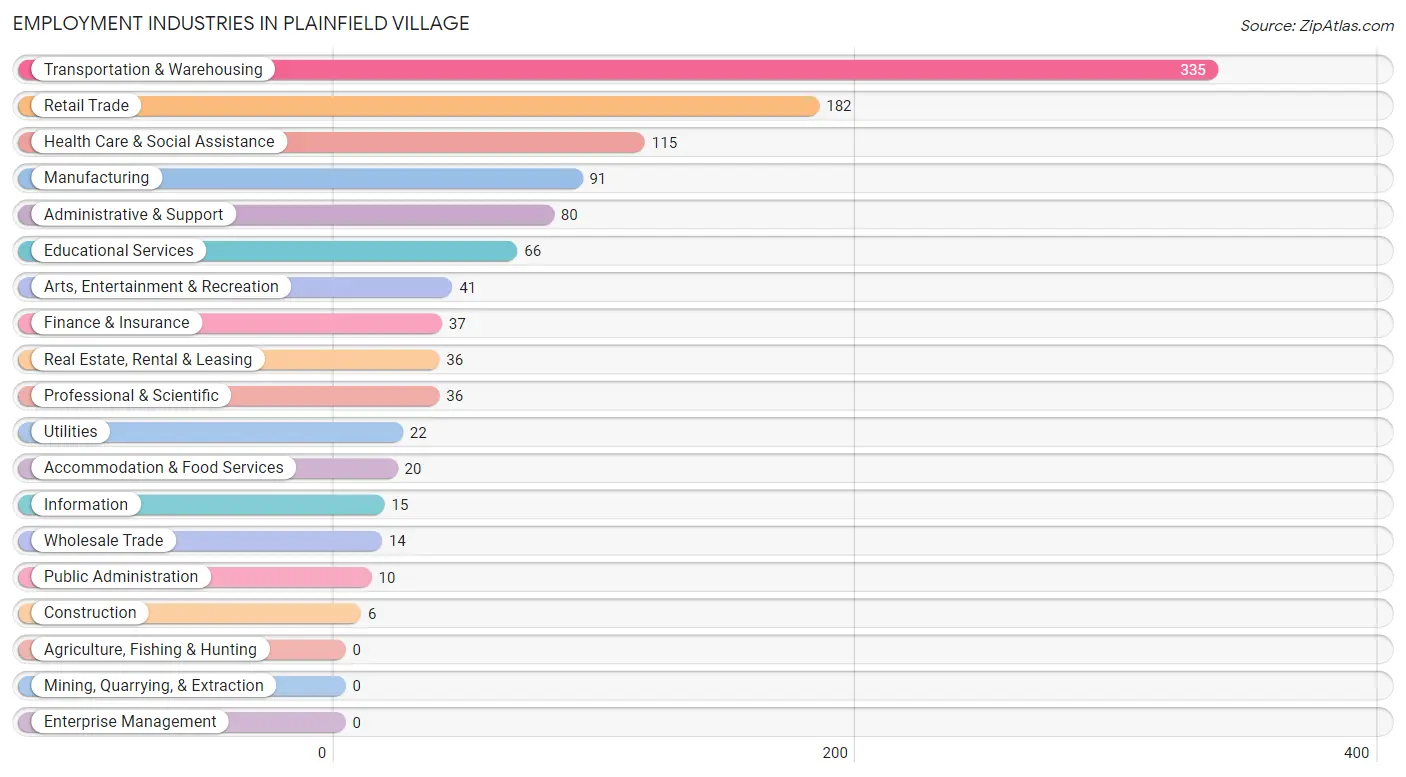
Employment Industries in Plainfield Village
The major employment industries in Plainfield Village include Transportation & Warehousing (335 | 30.3%), Retail Trade (182 | 16.5%), Health Care & Social Assistance (115 | 10.4%), Manufacturing (91 | 8.2%), and Administrative & Support (80 | 7.2%).
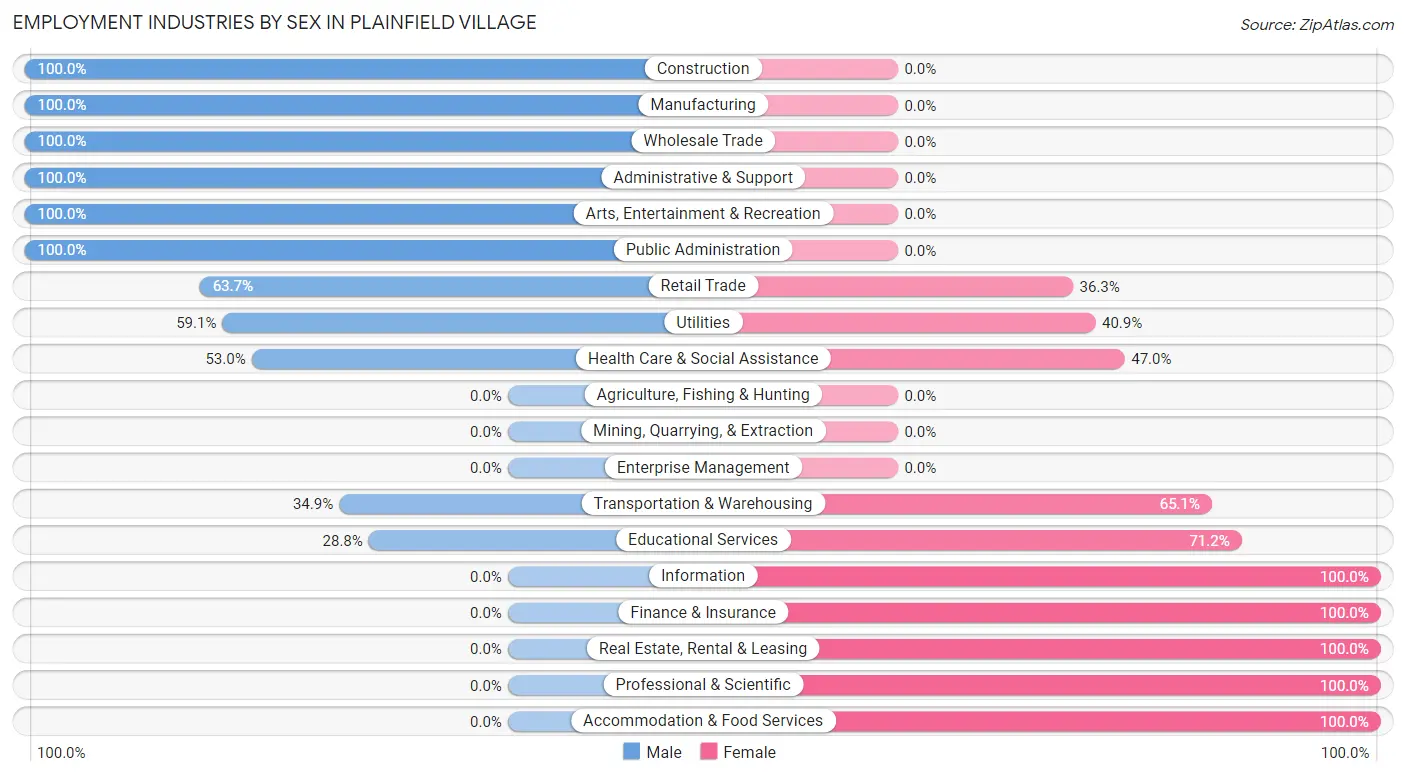
Employment Industries by Sex in Plainfield Village
The Plainfield Village industries that see more men than women are Construction (100.0%), Manufacturing (100.0%), and Wholesale Trade (100.0%), whereas the industries that tend to have a higher number of women are Information (100.0%), Finance & Insurance (100.0%), and Real Estate, Rental & Leasing (100.0%).
| Industry | Male | Female |
| Agriculture, Fishing & Hunting | 0 (0.0%) | 0 (0.0%) |
| Mining, Quarrying, & Extraction | 0 (0.0%) | 0 (0.0%) |
| Construction | 6 (100.0%) | 0 (0.0%) |
| Manufacturing | 91 (100.0%) | 0 (0.0%) |
| Wholesale Trade | 14 (100.0%) | 0 (0.0%) |
| Retail Trade | 116 (63.7%) | 66 (36.3%) |
| Transportation & Warehousing | 117 (34.9%) | 218 (65.1%) |
| Utilities | 13 (59.1%) | 9 (40.9%) |
| Information | 0 (0.0%) | 15 (100.0%) |
| Finance & Insurance | 0 (0.0%) | 37 (100.0%) |
| Real Estate, Rental & Leasing | 0 (0.0%) | 36 (100.0%) |
| Professional & Scientific | 0 (0.0%) | 36 (100.0%) |
| Enterprise Management | 0 (0.0%) | 0 (0.0%) |
| Administrative & Support | 80 (100.0%) | 0 (0.0%) |
| Educational Services | 19 (28.8%) | 47 (71.2%) |
| Health Care & Social Assistance | 61 (53.0%) | 54 (47.0%) |
| Arts, Entertainment & Recreation | 41 (100.0%) | 0 (0.0%) |
| Accommodation & Food Services | 0 (0.0%) | 20 (100.0%) |
| Public Administration | 10 (100.0%) | 0 (0.0%) |
| Total | 568 (51.4%) | 538 (48.6%) |
Education in Plainfield Village
School Enrollment in Plainfield Village
The most common levels of schooling among the 530 students in Plainfield Village are middle school (192 | 36.2%), high school (107 | 20.2%), and kindergarten (99 | 18.7%).
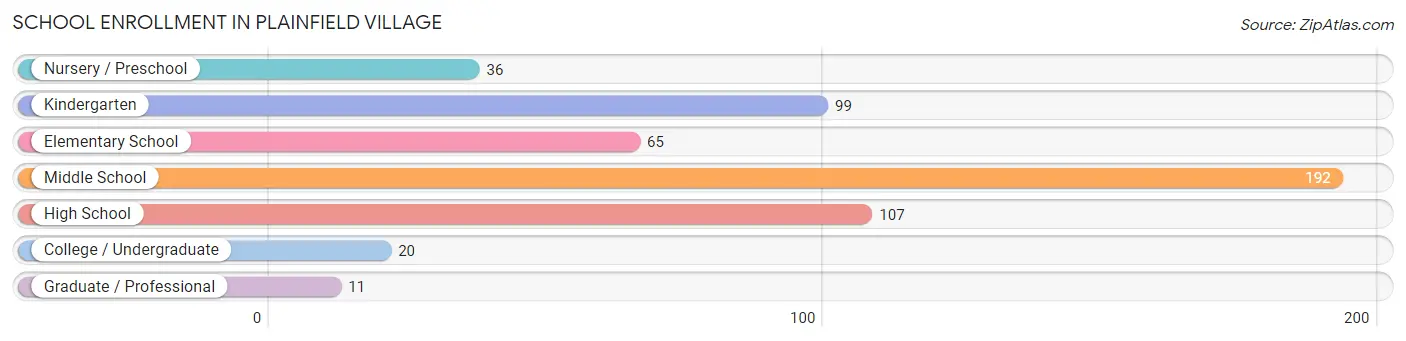
| School Level | # Students | % Students |
| Nursery / Preschool | 36 | 6.8% |
| Kindergarten | 99 | 18.7% |
| Elementary School | 65 | 12.3% |
| Middle School | 192 | 36.2% |
| High School | 107 | 20.2% |
| College / Undergraduate | 20 | 3.8% |
| Graduate / Professional | 11 | 2.1% |
| Total | 530 | 100.0% |
School Enrollment by Age by Funding Source in Plainfield Village
Out of a total of 530 students who are enrolled in schools in Plainfield Village, 36 (6.8%) attend a private institution, while the remaining 494 (93.2%) are enrolled in public schools. The age group of 10 to 14 year olds has the highest likelihood of being enrolled in private schools, with 36 (15.8% in the age bracket) enrolled. Conversely, the age group of 3 to 4 year olds has the lowest likelihood of being enrolled in a private school, with 80 (100.0% in the age bracket) attending a public institution.
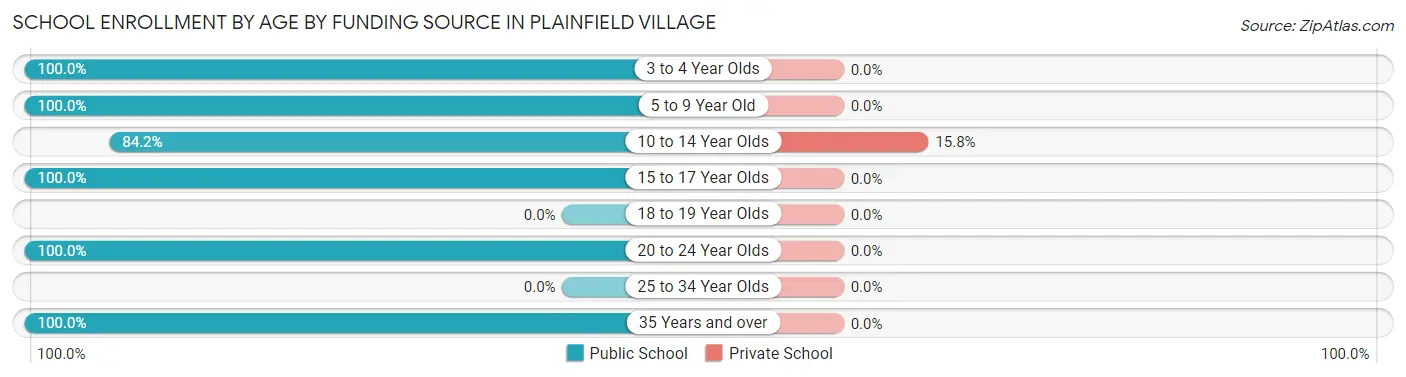
| Age Bracket | Public School | Private School |
| 3 to 4 Year Olds | 80 (100.0%) | 0 (0.0%) |
| 5 to 9 Year Old | 120 (100.0%) | 0 (0.0%) |
| 10 to 14 Year Olds | 192 (84.2%) | 36 (15.8%) |
| 15 to 17 Year Olds | 71 (100.0%) | 0 (0.0%) |
| 18 to 19 Year Olds | 0 (0.0%) | 0 (0.0%) |
| 20 to 24 Year Olds | 20 (100.0%) | 0 (0.0%) |
| 25 to 34 Year Olds | 0 (0.0%) | 0 (0.0%) |
| 35 Years and over | 11 (100.0%) | 0 (0.0%) |
| Total | 494 (93.2%) | 36 (6.8%) |
Educational Attainment by Field of Study in Plainfield Village
Social sciences (58 | 18.5%), arts & humanities (55 | 17.6%), physical & health sciences (50 | 16.0%), business (40 | 12.8%), and psychology (36 | 11.5%) are the most common fields of study among 313 individuals in Plainfield Village who have obtained a bachelor's degree or higher.
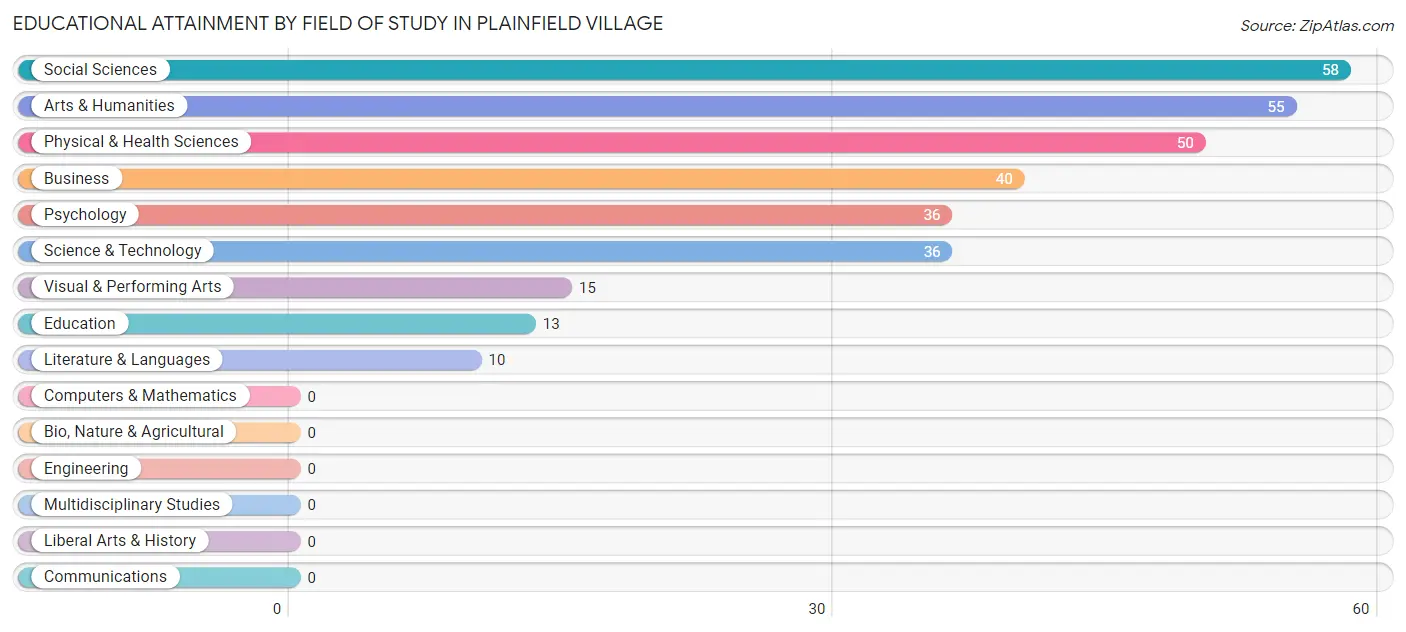
| Field of Study | # Graduates | % Graduates |
| Computers & Mathematics | 0 | 0.0% |
| Bio, Nature & Agricultural | 0 | 0.0% |
| Physical & Health Sciences | 50 | 16.0% |
| Psychology | 36 | 11.5% |
| Social Sciences | 58 | 18.5% |
| Engineering | 0 | 0.0% |
| Multidisciplinary Studies | 0 | 0.0% |
| Science & Technology | 36 | 11.5% |
| Business | 40 | 12.8% |
| Education | 13 | 4.2% |
| Literature & Languages | 10 | 3.2% |
| Liberal Arts & History | 0 | 0.0% |
| Visual & Performing Arts | 15 | 4.8% |
| Communications | 0 | 0.0% |
| Arts & Humanities | 55 | 17.6% |
| Total | 313 | 100.0% |
Transportation & Commute in Plainfield Village
Vehicle Availability by Sex in Plainfield Village
The most prevalent vehicle ownership categories in Plainfield Village are males with 1 vehicle (177, accounting for 31.2%) and females with 1 vehicle (62, making up 32.9%).
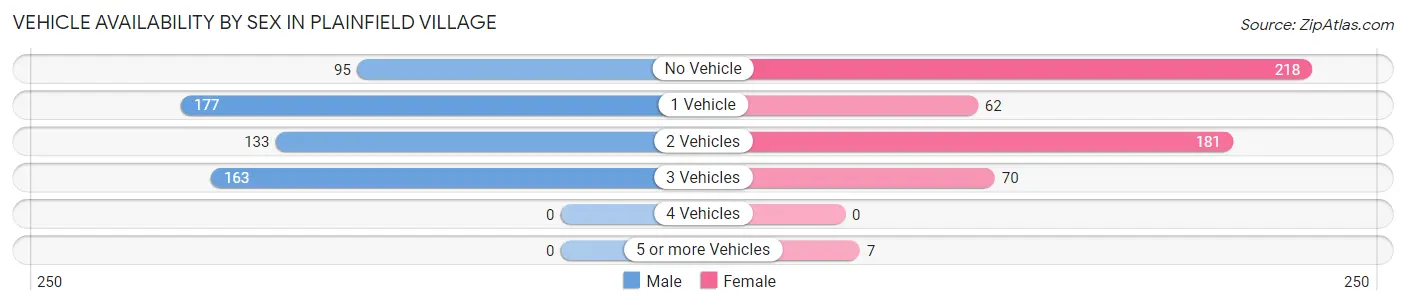
| Vehicles Available | Male | Female |
| No Vehicle | 95 (16.7%) | 218 (40.5%) |
| 1 Vehicle | 177 (31.2%) | 62 (11.5%) |
| 2 Vehicles | 133 (23.4%) | 181 (33.6%) |
| 3 Vehicles | 163 (28.7%) | 70 (13.0%) |
| 4 Vehicles | 0 (0.0%) | 0 (0.0%) |
| 5 or more Vehicles | 0 (0.0%) | 7 (1.3%) |
| Total | 568 (100.0%) | 538 (100.0%) |
Commute Time in Plainfield Village
The most frequently occuring commute durations in Plainfield Village are 5 to 9 minutes (349 commuters, 34.7%), 40 to 44 minutes (99 commuters, 9.8%), and 15 to 19 minutes (97 commuters, 9.6%).
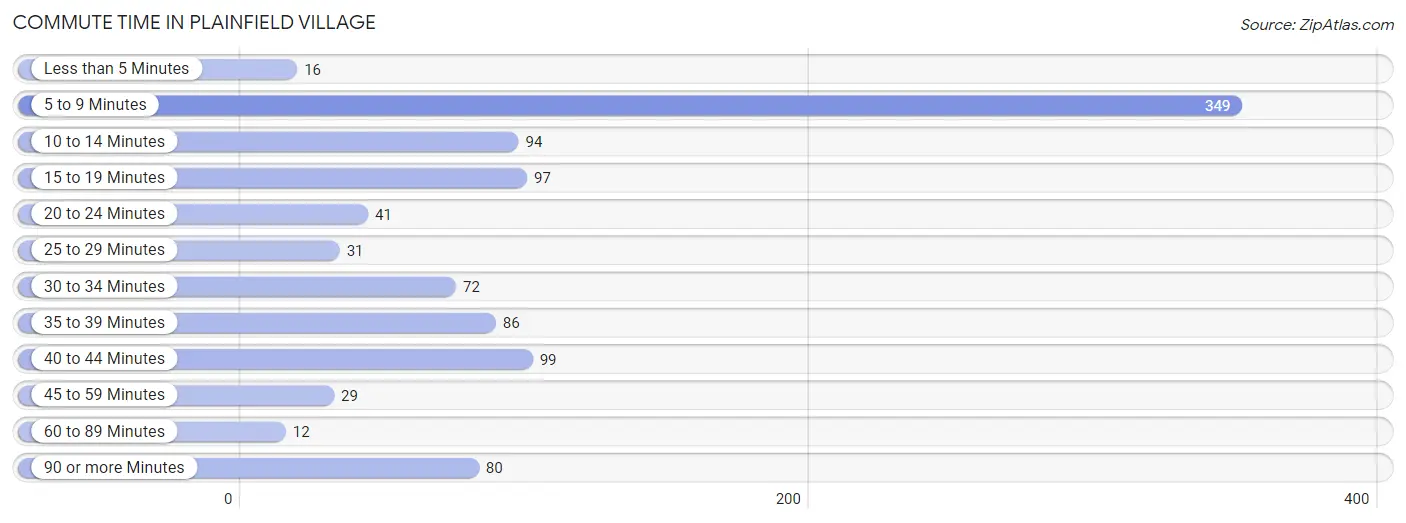
| Commute Time | # Commuters | % Commuters |
| Less than 5 Minutes | 16 | 1.6% |
| 5 to 9 Minutes | 349 | 34.7% |
| 10 to 14 Minutes | 94 | 9.3% |
| 15 to 19 Minutes | 97 | 9.6% |
| 20 to 24 Minutes | 41 | 4.1% |
| 25 to 29 Minutes | 31 | 3.1% |
| 30 to 34 Minutes | 72 | 7.2% |
| 35 to 39 Minutes | 86 | 8.6% |
| 40 to 44 Minutes | 99 | 9.8% |
| 45 to 59 Minutes | 29 | 2.9% |
| 60 to 89 Minutes | 12 | 1.2% |
| 90 or more Minutes | 80 | 8.0% |
Commute Time by Sex in Plainfield Village
The most common commute times in Plainfield Village are 15 to 19 minutes (97 commuters, 18.4%) for males and 5 to 9 minutes (254 commuters, 53.0%) for females.
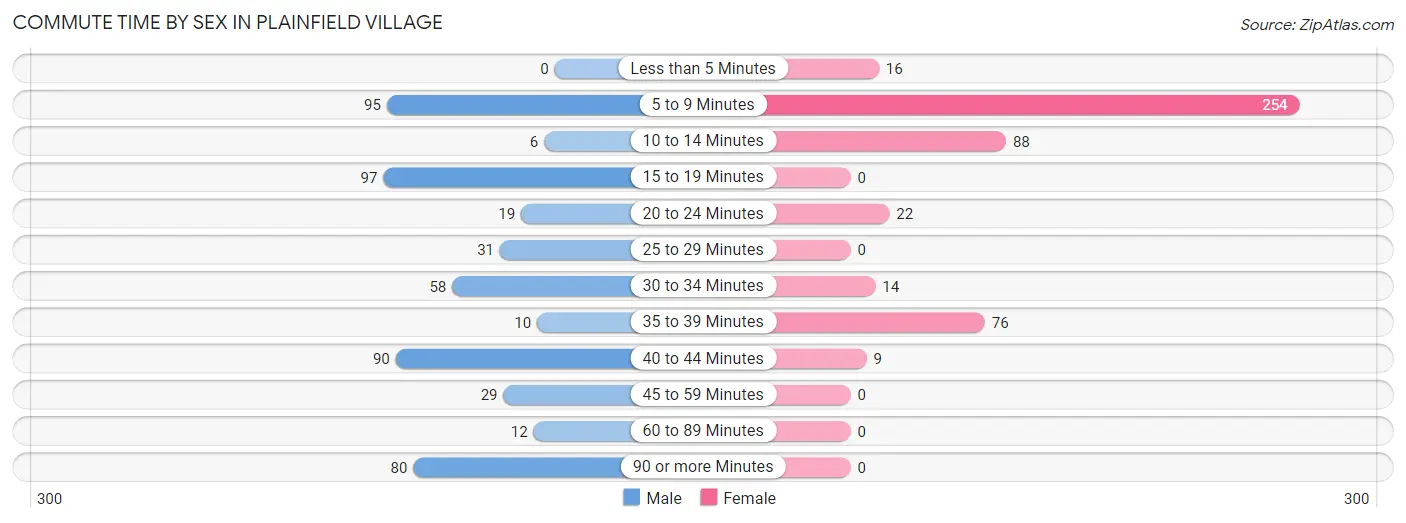
| Commute Time | Male | Female |
| Less than 5 Minutes | 0 (0.0%) | 16 (3.3%) |
| 5 to 9 Minutes | 95 (18.0%) | 254 (53.0%) |
| 10 to 14 Minutes | 6 (1.1%) | 88 (18.4%) |
| 15 to 19 Minutes | 97 (18.4%) | 0 (0.0%) |
| 20 to 24 Minutes | 19 (3.6%) | 22 (4.6%) |
| 25 to 29 Minutes | 31 (5.9%) | 0 (0.0%) |
| 30 to 34 Minutes | 58 (11.0%) | 14 (2.9%) |
| 35 to 39 Minutes | 10 (1.9%) | 76 (15.9%) |
| 40 to 44 Minutes | 90 (17.1%) | 9 (1.9%) |
| 45 to 59 Minutes | 29 (5.5%) | 0 (0.0%) |
| 60 to 89 Minutes | 12 (2.3%) | 0 (0.0%) |
| 90 or more Minutes | 80 (15.2%) | 0 (0.0%) |
Time of Departure to Work by Sex in Plainfield Village
The most frequent times of departure to work in Plainfield Village are 12:00 AM to 4:59 AM (146, 27.7%) for males and 5:30 AM to 5:59 AM (254, 53.0%) for females.
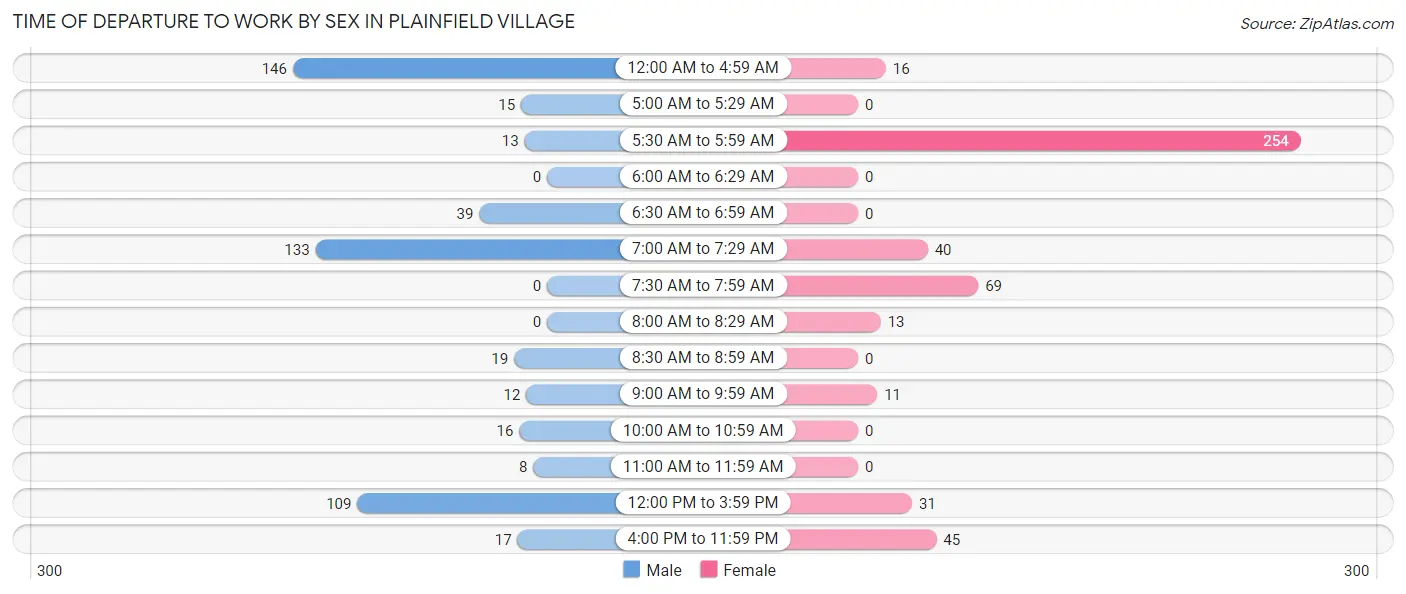
| Time of Departure | Male | Female |
| 12:00 AM to 4:59 AM | 146 (27.7%) | 16 (3.3%) |
| 5:00 AM to 5:29 AM | 15 (2.9%) | 0 (0.0%) |
| 5:30 AM to 5:59 AM | 13 (2.5%) | 254 (53.0%) |
| 6:00 AM to 6:29 AM | 0 (0.0%) | 0 (0.0%) |
| 6:30 AM to 6:59 AM | 39 (7.4%) | 0 (0.0%) |
| 7:00 AM to 7:29 AM | 133 (25.2%) | 40 (8.4%) |
| 7:30 AM to 7:59 AM | 0 (0.0%) | 69 (14.4%) |
| 8:00 AM to 8:29 AM | 0 (0.0%) | 13 (2.7%) |
| 8:30 AM to 8:59 AM | 19 (3.6%) | 0 (0.0%) |
| 9:00 AM to 9:59 AM | 12 (2.3%) | 11 (2.3%) |
| 10:00 AM to 10:59 AM | 16 (3.0%) | 0 (0.0%) |
| 11:00 AM to 11:59 AM | 8 (1.5%) | 0 (0.0%) |
| 12:00 PM to 3:59 PM | 109 (20.7%) | 31 (6.5%) |
| 4:00 PM to 11:59 PM | 17 (3.2%) | 45 (9.4%) |
| Total | 527 (100.0%) | 479 (100.0%) |
Housing Occupancy in Plainfield Village
Occupancy by Ownership in Plainfield Village
Of the total 1,054 dwellings in Plainfield Village, owner-occupied units account for 513 (48.7%), while renter-occupied units make up 541 (51.3%).
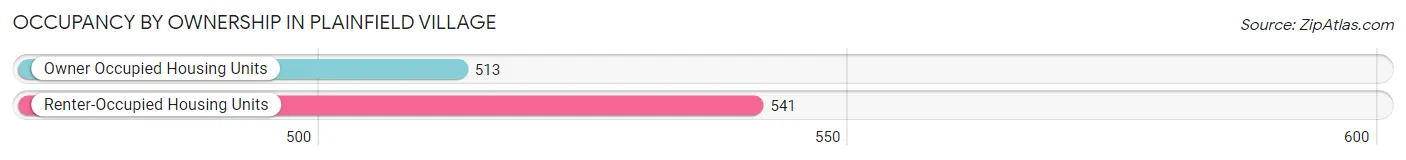
| Occupancy | # Housing Units | % Housing Units |
| Owner Occupied Housing Units | 513 | 48.7% |
| Renter-Occupied Housing Units | 541 | 51.3% |
| Total Occupied Housing Units | 1,054 | 100.0% |
Occupancy by Household Size in Plainfield Village
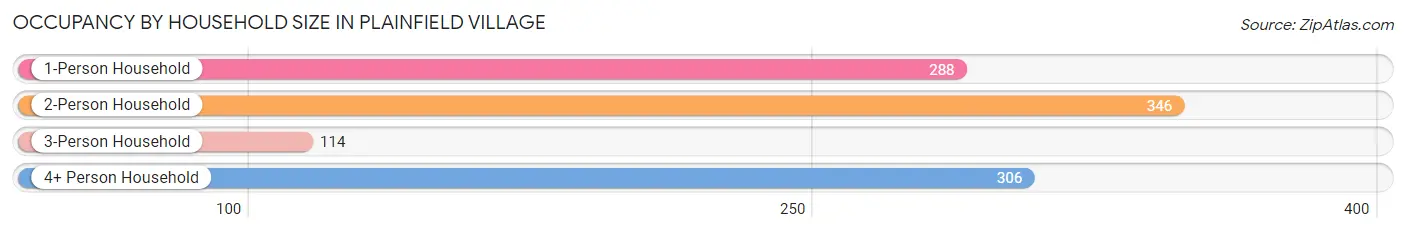
| Household Size | # Housing Units | % Housing Units |
| 1-Person Household | 288 | 27.3% |
| 2-Person Household | 346 | 32.8% |
| 3-Person Household | 114 | 10.8% |
| 4+ Person Household | 306 | 29.0% |
| Total Housing Units | 1,054 | 100.0% |
Occupancy by Ownership by Household Size in Plainfield Village
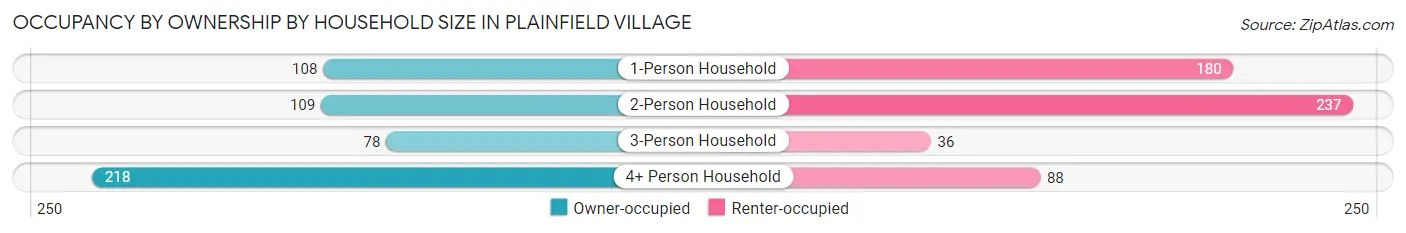
| Household Size | Owner-occupied | Renter-occupied |
| 1-Person Household | 108 (37.5%) | 180 (62.5%) |
| 2-Person Household | 109 (31.5%) | 237 (68.5%) |
| 3-Person Household | 78 (68.4%) | 36 (31.6%) |
| 4+ Person Household | 218 (71.2%) | 88 (28.8%) |
| Total Housing Units | 513 (48.7%) | 541 (51.3%) |
Occupancy by Educational Attainment in Plainfield Village
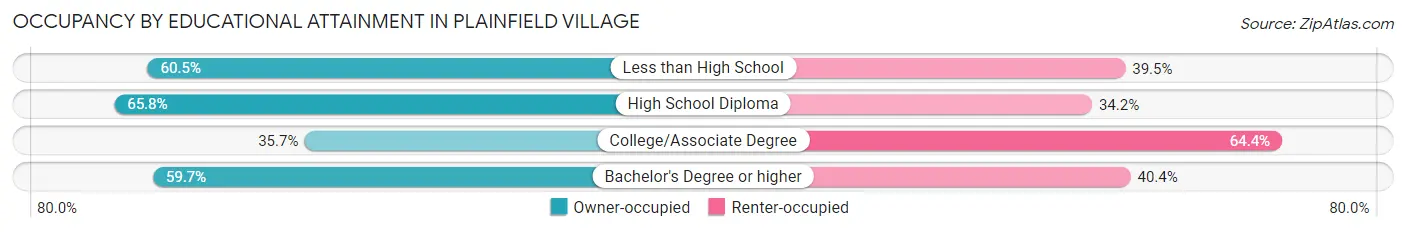
| Household Size | Owner-occupied | Renter-occupied |
| Less than High School | 49 (60.5%) | 32 (39.5%) |
| High School Diploma | 196 (65.8%) | 102 (34.2%) |
| College/Associate Degree | 200 (35.6%) | 361 (64.3%) |
| Bachelor's Degree or higher | 68 (59.7%) | 46 (40.4%) |
Occupancy by Age of Householder in Plainfield Village
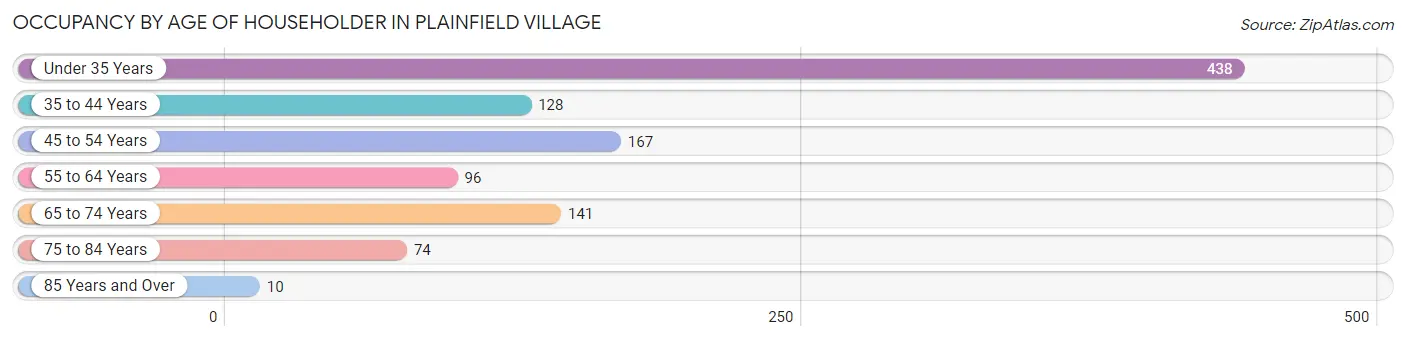
| Age Bracket | # Households | % Households |
| Under 35 Years | 438 | 41.6% |
| 35 to 44 Years | 128 | 12.1% |
| 45 to 54 Years | 167 | 15.8% |
| 55 to 64 Years | 96 | 9.1% |
| 65 to 74 Years | 141 | 13.4% |
| 75 to 84 Years | 74 | 7.0% |
| 85 Years and Over | 10 | 0.9% |
| Total | 1,054 | 100.0% |
Housing Finances in Plainfield Village
Median Income by Occupancy in Plainfield Village
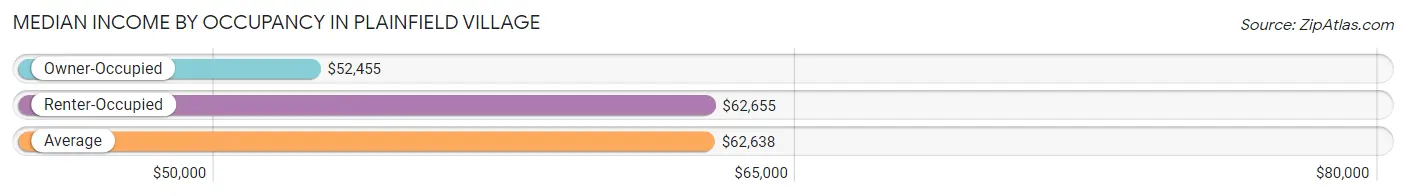
| Occupancy Type | # Households | Median Income |
| Owner-Occupied | 513 (48.7%) | $52,455 |
| Renter-Occupied | 541 (51.3%) | $62,655 |
| Average | 1,054 (100.0%) | $62,638 |
Occupancy by Householder Income Bracket in Plainfield Village
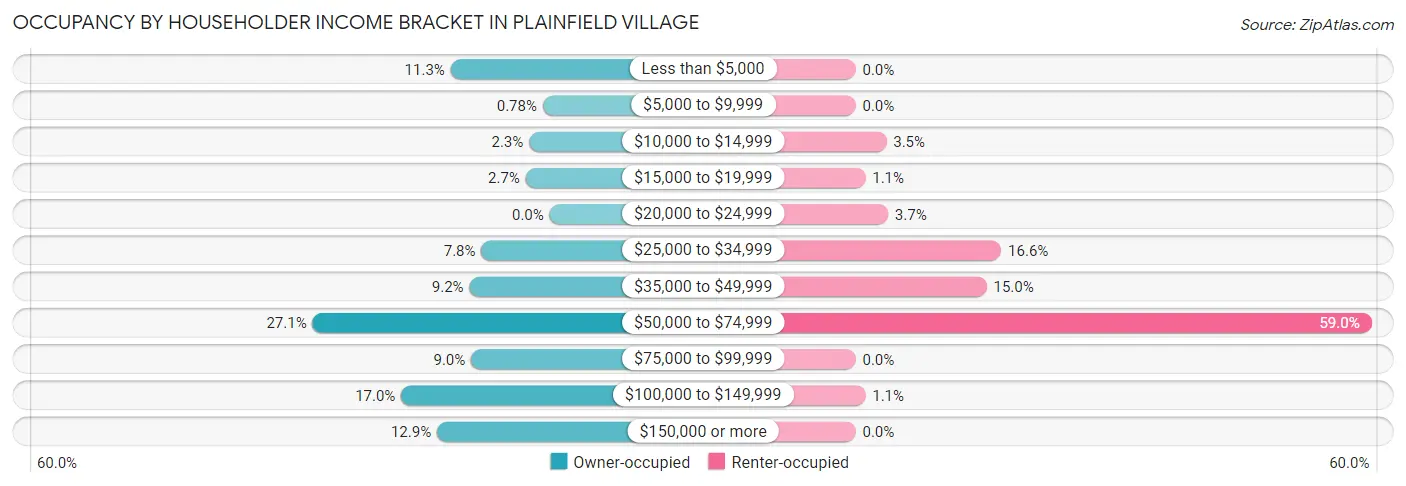
| Income Bracket | Owner-occupied | Renter-occupied |
| Less than $5,000 | 58 (11.3%) | 0 (0.0%) |
| $5,000 to $9,999 | 4 (0.8%) | 0 (0.0%) |
| $10,000 to $14,999 | 12 (2.3%) | 19 (3.5%) |
| $15,000 to $19,999 | 14 (2.7%) | 6 (1.1%) |
| $20,000 to $24,999 | 0 (0.0%) | 20 (3.7%) |
| $25,000 to $34,999 | 40 (7.8%) | 90 (16.6%) |
| $35,000 to $49,999 | 47 (9.2%) | 81 (15.0%) |
| $50,000 to $74,999 | 139 (27.1%) | 319 (59.0%) |
| $75,000 to $99,999 | 46 (9.0%) | 0 (0.0%) |
| $100,000 to $149,999 | 87 (17.0%) | 6 (1.1%) |
| $150,000 or more | 66 (12.9%) | 0 (0.0%) |
| Total | 513 (100.0%) | 541 (100.0%) |
Monthly Housing Cost Tiers in Plainfield Village
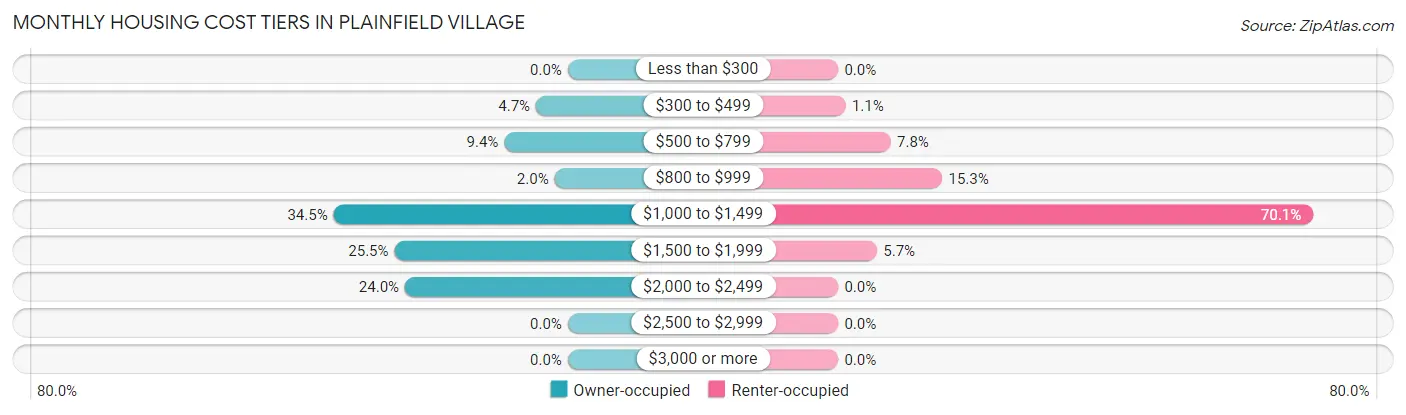
| Monthly Cost | Owner-occupied | Renter-occupied |
| Less than $300 | 0 (0.0%) | 0 (0.0%) |
| $300 to $499 | 24 (4.7%) | 6 (1.1%) |
| $500 to $799 | 48 (9.4%) | 42 (7.8%) |
| $800 to $999 | 10 (1.9%) | 83 (15.3%) |
| $1,000 to $1,499 | 177 (34.5%) | 379 (70.1%) |
| $1,500 to $1,999 | 131 (25.5%) | 31 (5.7%) |
| $2,000 to $2,499 | 123 (24.0%) | 0 (0.0%) |
| $2,500 to $2,999 | 0 (0.0%) | 0 (0.0%) |
| $3,000 or more | 0 (0.0%) | 0 (0.0%) |
| Total | 513 (100.0%) | 541 (100.0%) |
Physical Housing Characteristics in Plainfield Village
Housing Structures in Plainfield Village
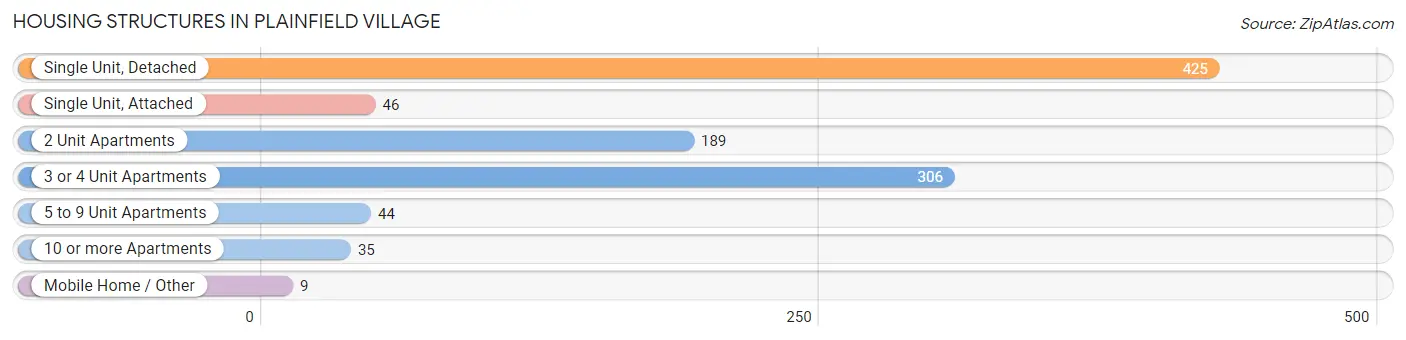
| Structure Type | # Housing Units | % Housing Units |
| Single Unit, Detached | 425 | 40.3% |
| Single Unit, Attached | 46 | 4.4% |
| 2 Unit Apartments | 189 | 17.9% |
| 3 or 4 Unit Apartments | 306 | 29.0% |
| 5 to 9 Unit Apartments | 44 | 4.2% |
| 10 or more Apartments | 35 | 3.3% |
| Mobile Home / Other | 9 | 0.9% |
| Total | 1,054 | 100.0% |
Housing Structures by Occupancy in Plainfield Village
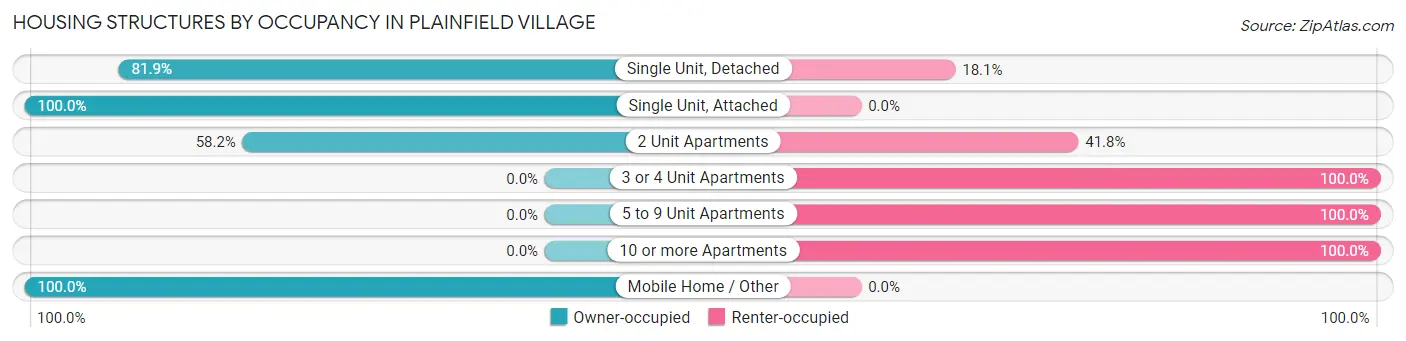
| Structure Type | Owner-occupied | Renter-occupied |
| Single Unit, Detached | 348 (81.9%) | 77 (18.1%) |
| Single Unit, Attached | 46 (100.0%) | 0 (0.0%) |
| 2 Unit Apartments | 110 (58.2%) | 79 (41.8%) |
| 3 or 4 Unit Apartments | 0 (0.0%) | 306 (100.0%) |
| 5 to 9 Unit Apartments | 0 (0.0%) | 44 (100.0%) |
| 10 or more Apartments | 0 (0.0%) | 35 (100.0%) |
| Mobile Home / Other | 9 (100.0%) | 0 (0.0%) |
| Total | 513 (48.7%) | 541 (51.3%) |
Housing Structures by Number of Rooms in Plainfield Village
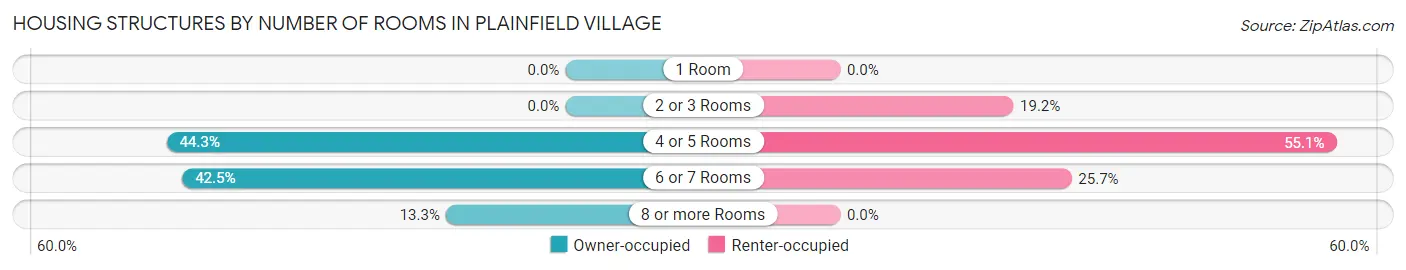
| Number of Rooms | Owner-occupied | Renter-occupied |
| 1 Room | 0 (0.0%) | 0 (0.0%) |
| 2 or 3 Rooms | 0 (0.0%) | 104 (19.2%) |
| 4 or 5 Rooms | 227 (44.3%) | 298 (55.1%) |
| 6 or 7 Rooms | 218 (42.5%) | 139 (25.7%) |
| 8 or more Rooms | 68 (13.3%) | 0 (0.0%) |
| Total | 513 (100.0%) | 541 (100.0%) |
Housing Structure by Heating Type in Plainfield Village
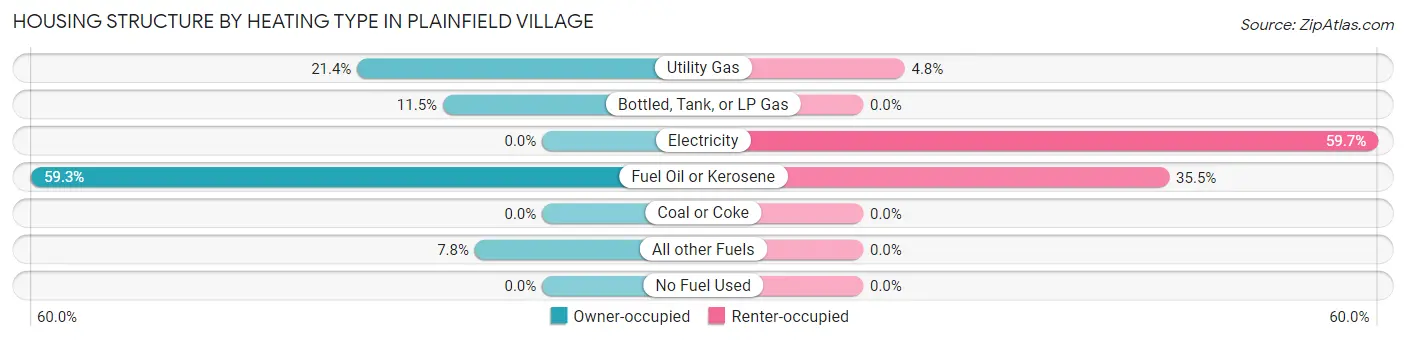
| Heating Type | Owner-occupied | Renter-occupied |
| Utility Gas | 110 (21.4%) | 26 (4.8%) |
| Bottled, Tank, or LP Gas | 59 (11.5%) | 0 (0.0%) |
| Electricity | 0 (0.0%) | 323 (59.7%) |
| Fuel Oil or Kerosene | 304 (59.3%) | 192 (35.5%) |
| Coal or Coke | 0 (0.0%) | 0 (0.0%) |
| All other Fuels | 40 (7.8%) | 0 (0.0%) |
| No Fuel Used | 0 (0.0%) | 0 (0.0%) |
| Total | 513 (100.0%) | 541 (100.0%) |
Household Vehicle Usage in Plainfield Village
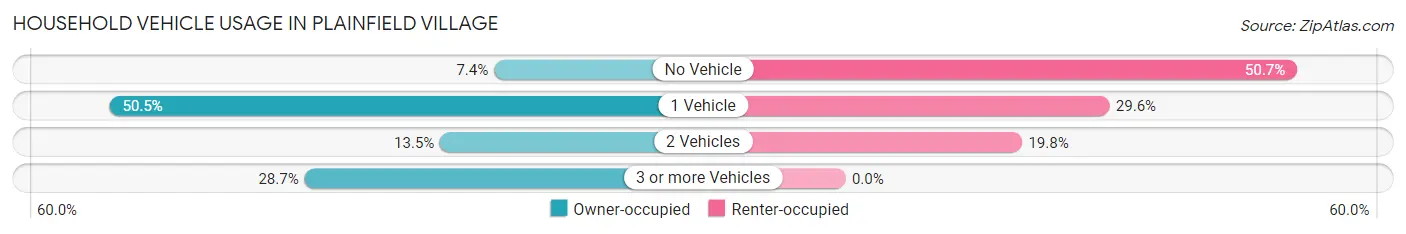
| Vehicles per Household | Owner-occupied | Renter-occupied |
| No Vehicle | 38 (7.4%) | 274 (50.6%) |
| 1 Vehicle | 259 (50.5%) | 160 (29.6%) |
| 2 Vehicles | 69 (13.5%) | 107 (19.8%) |
| 3 or more Vehicles | 147 (28.6%) | 0 (0.0%) |
| Total | 513 (100.0%) | 541 (100.0%) |
Real Estate & Mortgages in Plainfield Village
Real Estate and Mortgage Overview in Plainfield Village
| Characteristic | Without Mortgage | With Mortgage |
| Housing Units | 103 | 410 |
| Median Property Value | $219,300 | $218,700 |
| Median Household Income | $49,495 | $66 |
| Monthly Housing Costs | $672 | $0 |
| Real Estate Taxes | $2,491 | $0 |
Property Value by Mortgage Status in Plainfield Village
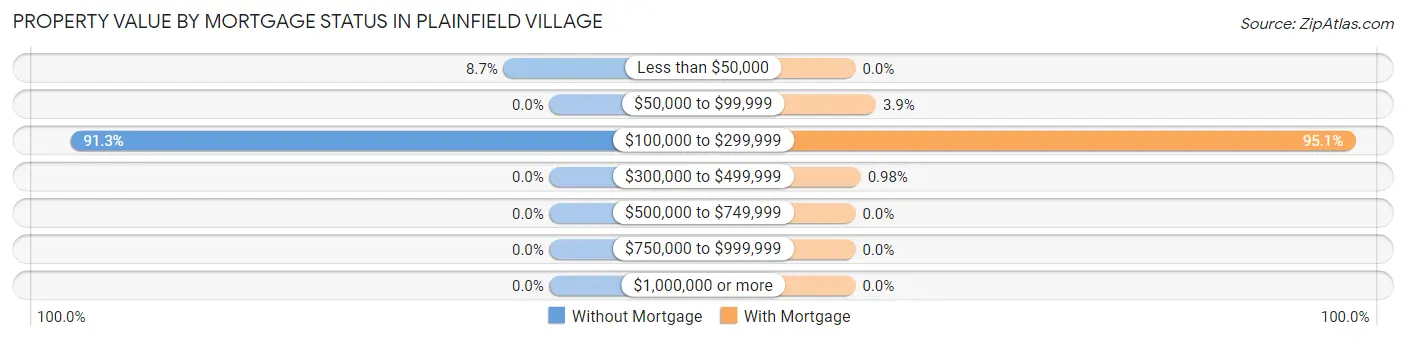
| Property Value | Without Mortgage | With Mortgage |
| Less than $50,000 | 9 (8.7%) | 0 (0.0%) |
| $50,000 to $99,999 | 0 (0.0%) | 16 (3.9%) |
| $100,000 to $299,999 | 94 (91.3%) | 390 (95.1%) |
| $300,000 to $499,999 | 0 (0.0%) | 4 (1.0%) |
| $500,000 to $749,999 | 0 (0.0%) | 0 (0.0%) |
| $750,000 to $999,999 | 0 (0.0%) | 0 (0.0%) |
| $1,000,000 or more | 0 (0.0%) | 0 (0.0%) |
| Total | 103 (100.0%) | 410 (100.0%) |
Household Income by Mortgage Status in Plainfield Village
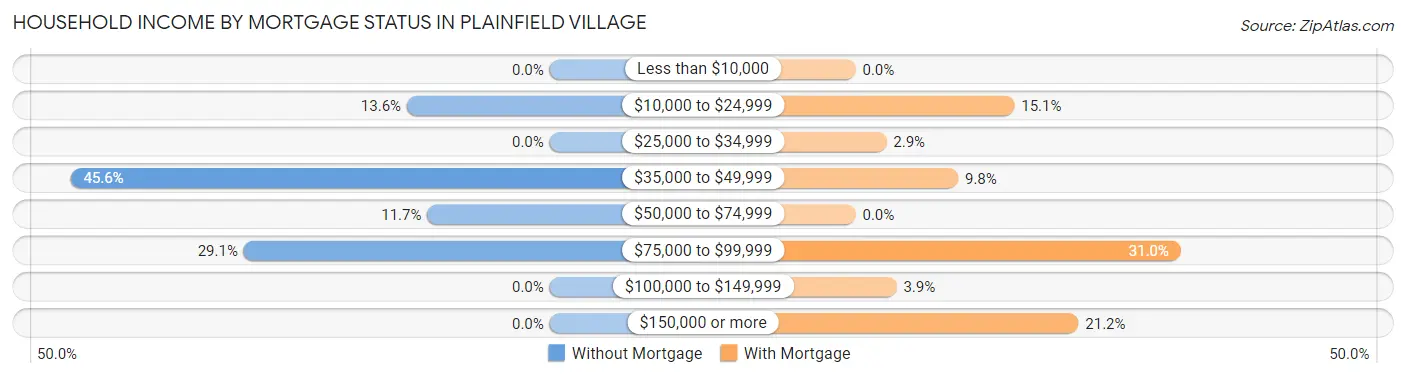
| Household Income | Without Mortgage | With Mortgage |
| Less than $10,000 | 0 (0.0%) | 0 (0.0%) |
| $10,000 to $24,999 | 14 (13.6%) | 62 (15.1%) |
| $25,000 to $34,999 | 0 (0.0%) | 12 (2.9%) |
| $35,000 to $49,999 | 47 (45.6%) | 40 (9.8%) |
| $50,000 to $74,999 | 12 (11.7%) | 0 (0.0%) |
| $75,000 to $99,999 | 30 (29.1%) | 127 (31.0%) |
| $100,000 to $149,999 | 0 (0.0%) | 16 (3.9%) |
| $150,000 or more | 0 (0.0%) | 87 (21.2%) |
| Total | 103 (100.0%) | 410 (100.0%) |
Property Value to Household Income Ratio in Plainfield Village
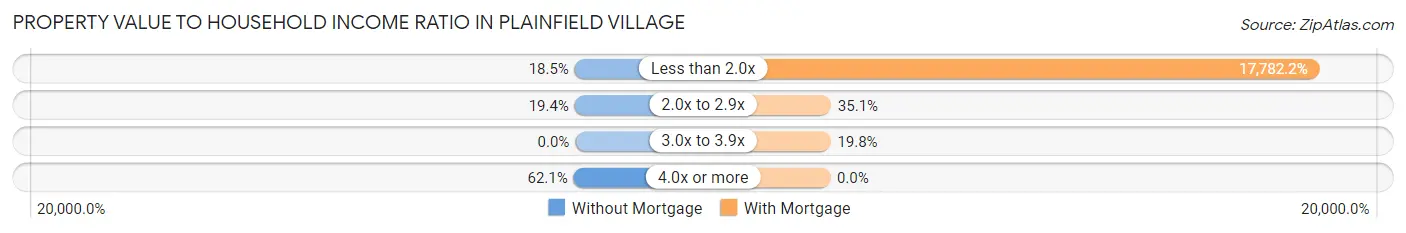
| Value-to-Income Ratio | Without Mortgage | With Mortgage |
| Less than 2.0x | 19 (18.4%) | 72,907 (17,782.2%) |
| 2.0x to 2.9x | 20 (19.4%) | 144 (35.1%) |
| 3.0x to 3.9x | 0 (0.0%) | 81 (19.8%) |
| 4.0x or more | 64 (62.1%) | 0 (0.0%) |
| Total | 103 (100.0%) | 410 (100.0%) |
Real Estate Taxes by Mortgage Status in Plainfield Village
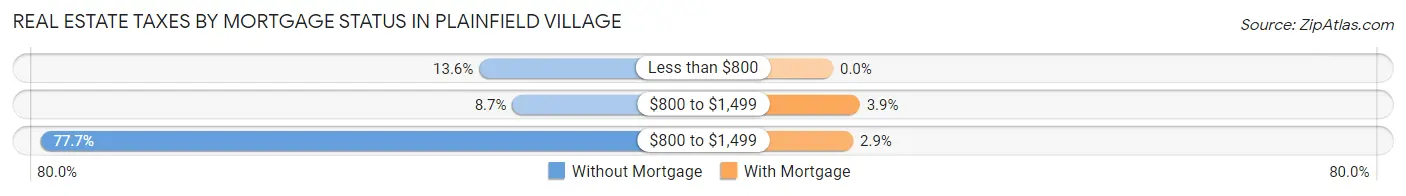
| Property Taxes | Without Mortgage | With Mortgage |
| Less than $800 | 14 (13.6%) | 0 (0.0%) |
| $800 to $1,499 | 9 (8.7%) | 16 (3.9%) |
| $800 to $1,499 | 80 (77.7%) | 12 (2.9%) |
| Total | 103 (100.0%) | 410 (100.0%) |
Health & Disability in Plainfield Village
Health Insurance Coverage by Age in Plainfield Village
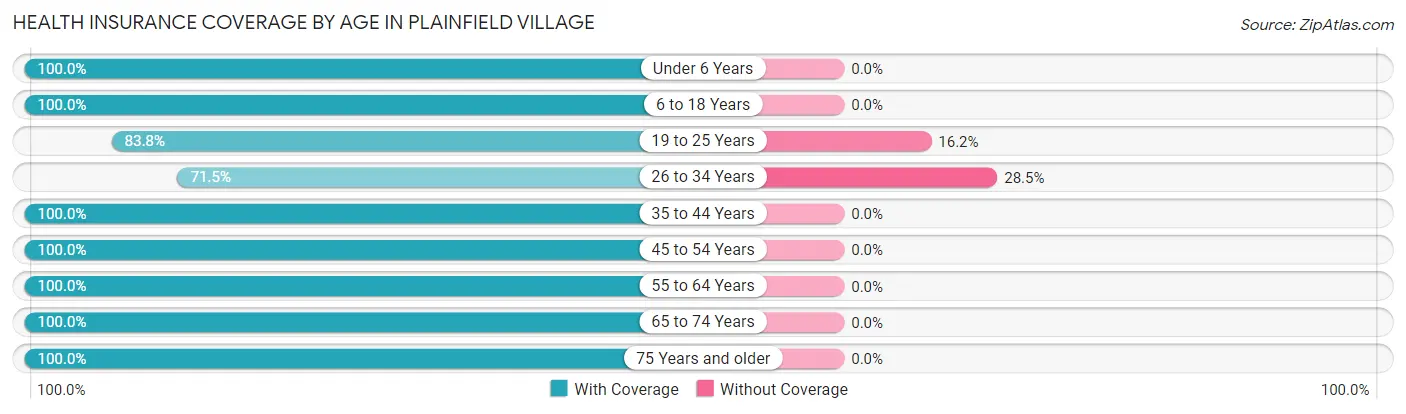
| Age Bracket | With Coverage | Without Coverage |
| Under 6 Years | 390 (100.0%) | 0 (0.0%) |
| 6 to 18 Years | 364 (100.0%) | 0 (0.0%) |
| 19 to 25 Years | 444 (83.8%) | 86 (16.2%) |
| 26 to 34 Years | 238 (71.5%) | 95 (28.5%) |
| 35 to 44 Years | 208 (100.0%) | 0 (0.0%) |
| 45 to 54 Years | 291 (100.0%) | 0 (0.0%) |
| 55 to 64 Years | 156 (100.0%) | 0 (0.0%) |
| 65 to 74 Years | 150 (100.0%) | 0 (0.0%) |
| 75 Years and older | 113 (100.0%) | 0 (0.0%) |
| Total | 2,354 (92.9%) | 181 (7.1%) |
Health Insurance Coverage by Citizenship Status in Plainfield Village
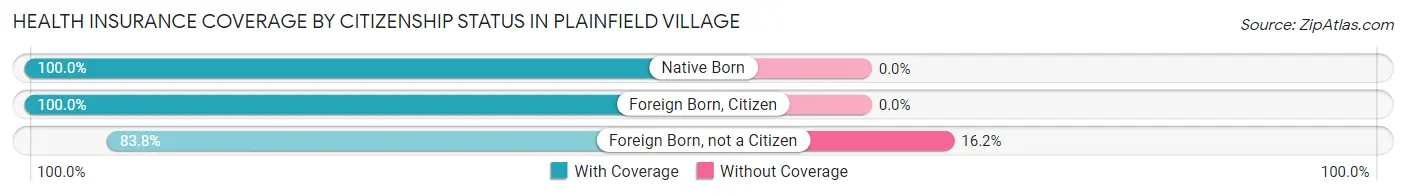
| Citizenship Status | With Coverage | Without Coverage |
| Native Born | 390 (100.0%) | 0 (0.0%) |
| Foreign Born, Citizen | 364 (100.0%) | 0 (0.0%) |
| Foreign Born, not a Citizen | 444 (83.8%) | 86 (16.2%) |
Health Insurance Coverage by Household Income in Plainfield Village
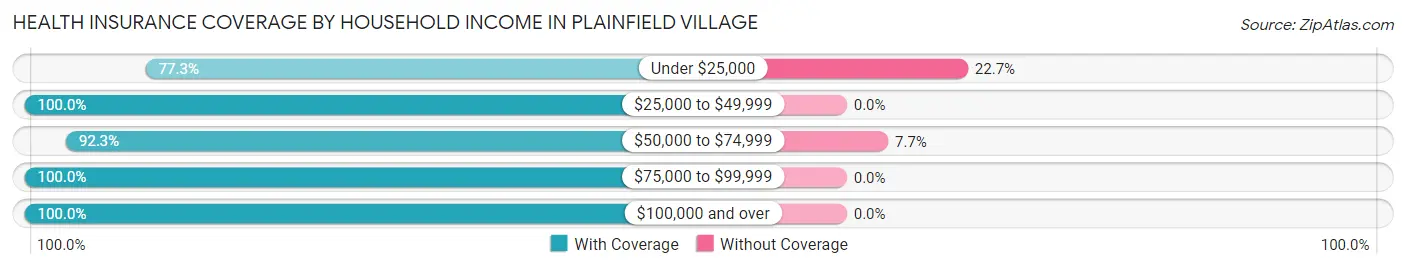
| Household Income | With Coverage | Without Coverage |
| Under $25,000 | 293 (77.3%) | 86 (22.7%) |
| $25,000 to $49,999 | 455 (100.0%) | 0 (0.0%) |
| $50,000 to $74,999 | 1,133 (92.3%) | 95 (7.7%) |
| $75,000 to $99,999 | 109 (100.0%) | 0 (0.0%) |
| $100,000 and over | 364 (100.0%) | 0 (0.0%) |
Public vs Private Health Insurance Coverage by Age in Plainfield Village
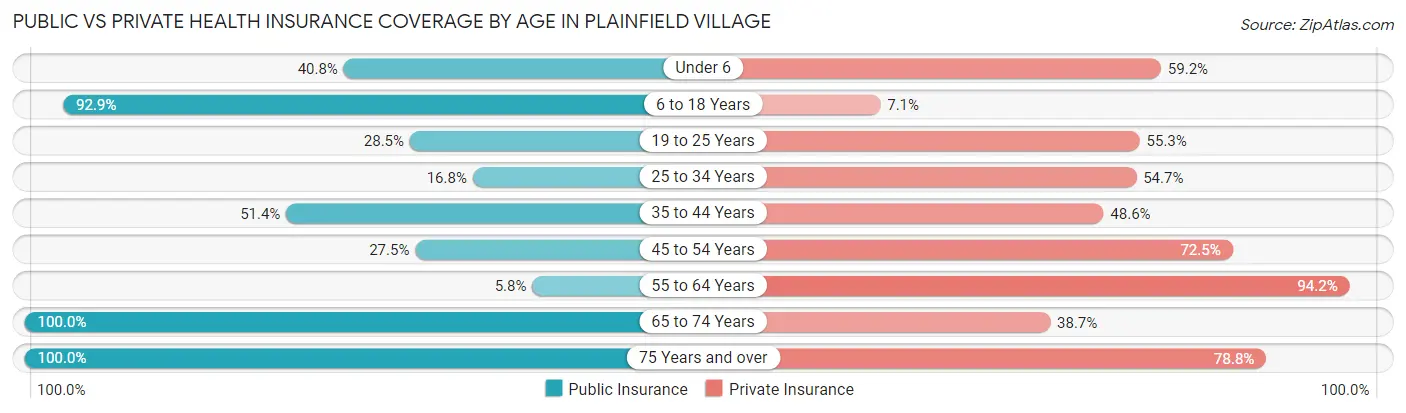
| Age Bracket | Public Insurance | Private Insurance |
| Under 6 | 159 (40.8%) | 231 (59.2%) |
| 6 to 18 Years | 338 (92.9%) | 26 (7.1%) |
| 19 to 25 Years | 151 (28.5%) | 293 (55.3%) |
| 25 to 34 Years | 56 (16.8%) | 182 (54.6%) |
| 35 to 44 Years | 107 (51.4%) | 101 (48.6%) |
| 45 to 54 Years | 80 (27.5%) | 211 (72.5%) |
| 55 to 64 Years | 9 (5.8%) | 147 (94.2%) |
| 65 to 74 Years | 150 (100.0%) | 58 (38.7%) |
| 75 Years and over | 113 (100.0%) | 89 (78.8%) |
| Total | 1,163 (45.9%) | 1,338 (52.8%) |
Disability Status by Sex by Age in Plainfield Village
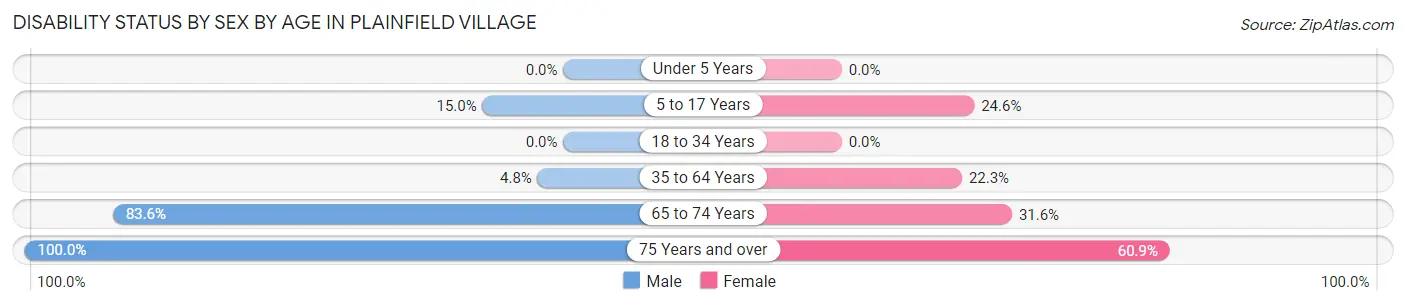
| Age Bracket | Male | Female |
| Under 5 Years | 0 (0.0%) | 0 (0.0%) |
| 5 to 17 Years | 36 (15.0%) | 44 (24.6%) |
| 18 to 34 Years | 0 (0.0%) | 0 (0.0%) |
| 35 to 64 Years | 18 (4.8%) | 62 (22.3%) |
| 65 to 74 Years | 46 (83.6%) | 30 (31.6%) |
| 75 Years and over | 21 (100.0%) | 56 (60.9%) |
Disability Class by Sex by Age in Plainfield Village
Disability Class: Hearing Difficulty
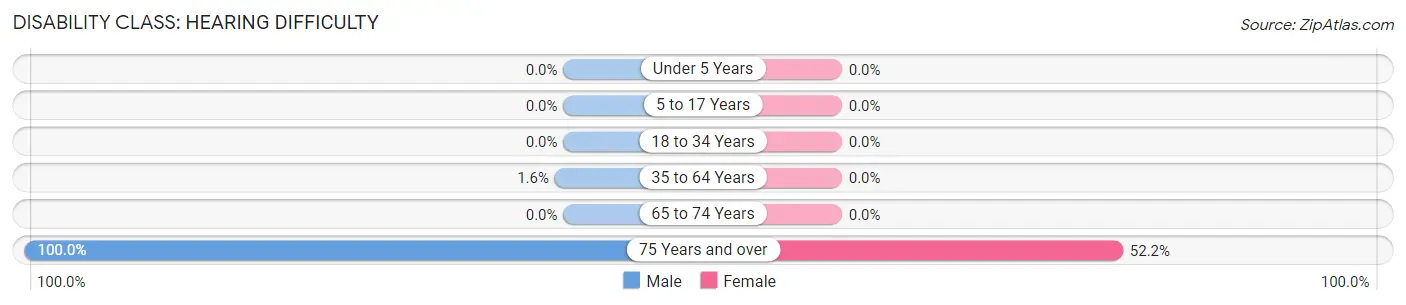
| Age Bracket | Male | Female |
| Under 5 Years | 0 (0.0%) | 0 (0.0%) |
| 5 to 17 Years | 0 (0.0%) | 0 (0.0%) |
| 18 to 34 Years | 0 (0.0%) | 0 (0.0%) |
| 35 to 64 Years | 6 (1.6%) | 0 (0.0%) |
| 65 to 74 Years | 0 (0.0%) | 0 (0.0%) |
| 75 Years and over | 21 (100.0%) | 48 (52.2%) |
Disability Class: Vision Difficulty
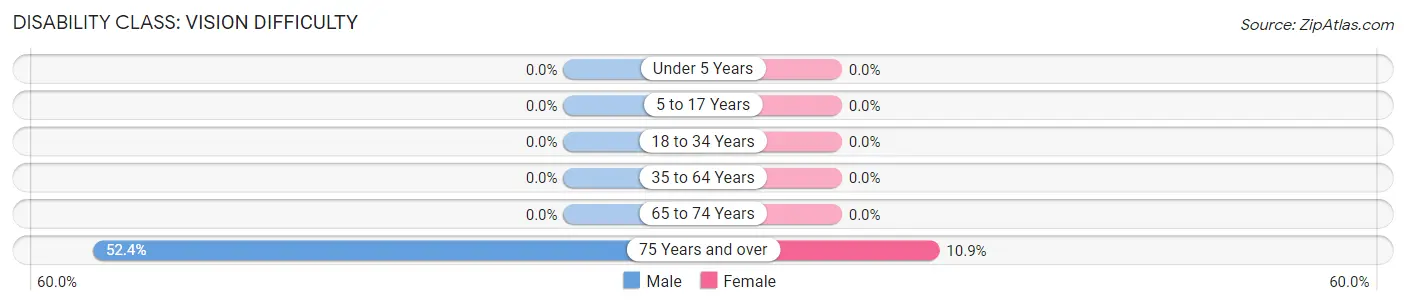
| Age Bracket | Male | Female |
| Under 5 Years | 0 (0.0%) | 0 (0.0%) |
| 5 to 17 Years | 0 (0.0%) | 0 (0.0%) |
| 18 to 34 Years | 0 (0.0%) | 0 (0.0%) |
| 35 to 64 Years | 0 (0.0%) | 0 (0.0%) |
| 65 to 74 Years | 0 (0.0%) | 0 (0.0%) |
| 75 Years and over | 11 (52.4%) | 10 (10.9%) |
Disability Class: Cognitive Difficulty
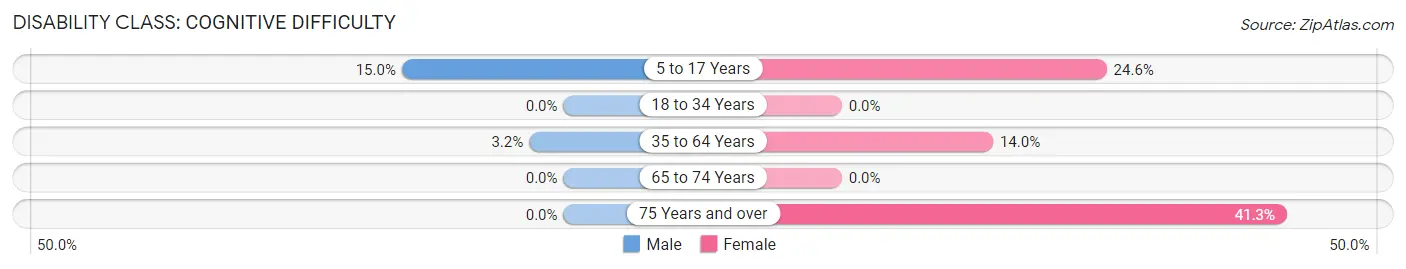
| Age Bracket | Male | Female |
| 5 to 17 Years | 36 (15.0%) | 44 (24.6%) |
| 18 to 34 Years | 0 (0.0%) | 0 (0.0%) |
| 35 to 64 Years | 12 (3.2%) | 39 (14.0%) |
| 65 to 74 Years | 0 (0.0%) | 0 (0.0%) |
| 75 Years and over | 0 (0.0%) | 38 (41.3%) |
Disability Class: Ambulatory Difficulty
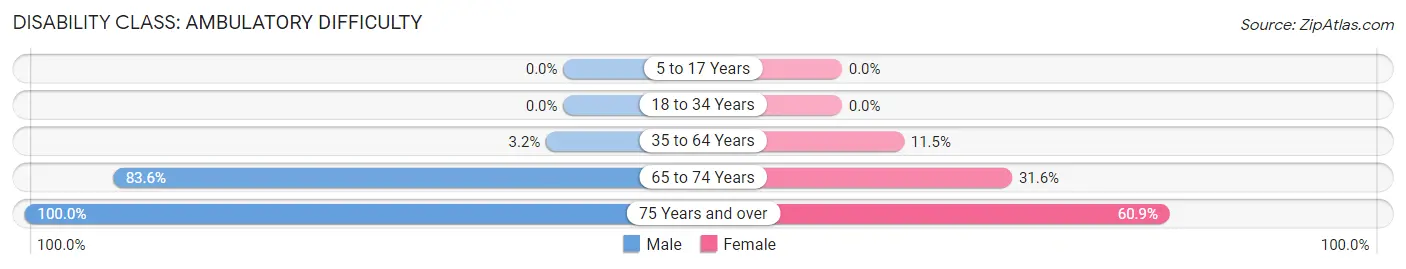
| Age Bracket | Male | Female |
| 5 to 17 Years | 0 (0.0%) | 0 (0.0%) |
| 18 to 34 Years | 0 (0.0%) | 0 (0.0%) |
| 35 to 64 Years | 12 (3.2%) | 32 (11.5%) |
| 65 to 74 Years | 46 (83.6%) | 30 (31.6%) |
| 75 Years and over | 21 (100.0%) | 56 (60.9%) |
Disability Class: Self-Care Difficulty
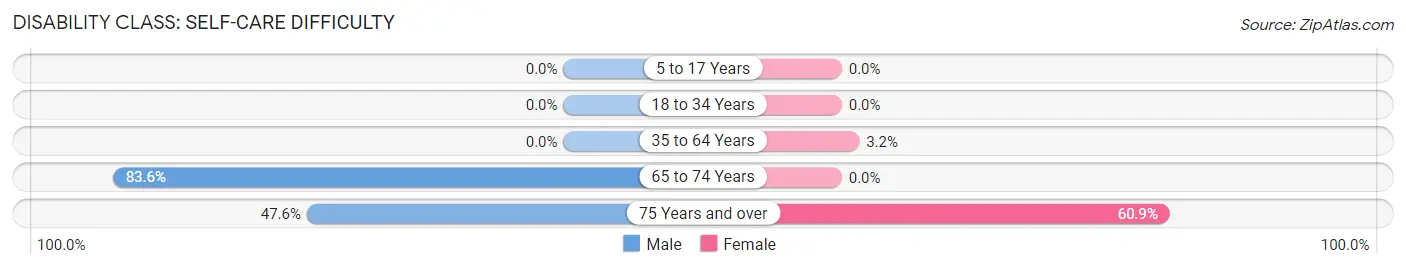
| Age Bracket | Male | Female |
| 5 to 17 Years | 0 (0.0%) | 0 (0.0%) |
| 18 to 34 Years | 0 (0.0%) | 0 (0.0%) |
| 35 to 64 Years | 0 (0.0%) | 9 (3.2%) |
| 65 to 74 Years | 46 (83.6%) | 0 (0.0%) |
| 75 Years and over | 10 (47.6%) | 56 (60.9%) |
Technology Access in Plainfield Village
Computing Device Access in Plainfield Village
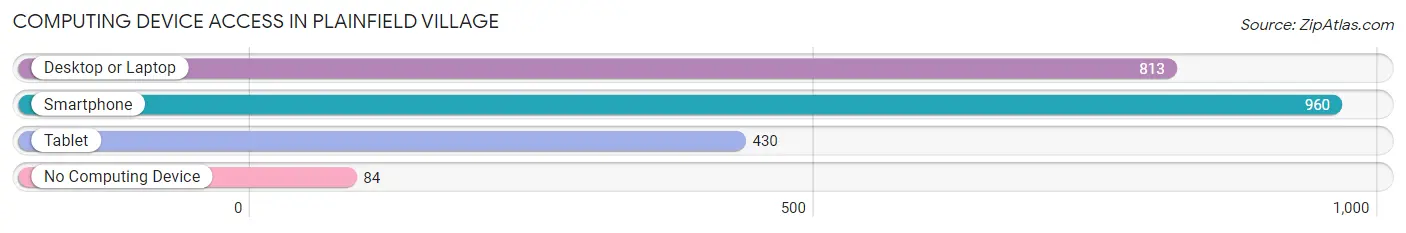
| Device Type | # Households | % Households |
| Desktop or Laptop | 813 | 77.1% |
| Smartphone | 960 | 91.1% |
| Tablet | 430 | 40.8% |
| No Computing Device | 84 | 8.0% |
| Total | 1,054 | 100.0% |
Internet Access in Plainfield Village
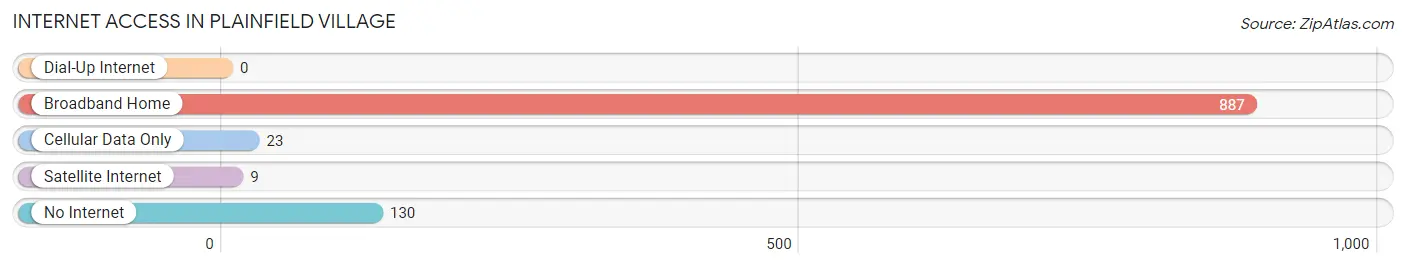
| Internet Type | # Households | % Households |
| Dial-Up Internet | 0 | 0.0% |
| Broadband Home | 887 | 84.2% |
| Cellular Data Only | 23 | 2.2% |
| Satellite Internet | 9 | 0.9% |
| No Internet | 130 | 12.3% |
| Total | 1,054 | 100.0% |
Plainfield Village Summary
Plainfield Village is a small village located in Windham County, Connecticut. It is situated in the northeastern corner of the state, near the Massachusetts border. The village is part of the town of Plainfield, which is the largest town in Windham County. The village is home to approximately 1,500 people, and is known for its rural charm and small-town atmosphere.
Geography
Plainfield Village is located in the northeastern corner of Connecticut, near the Massachusetts border. The village is situated in the town of Plainfield, which is the largest town in Windham County. The village is bordered by the towns of Canterbury, Brooklyn, and Sterling. The village is located in the Quinebaug River Valley, and is surrounded by rolling hills and forests. The village is located at an elevation of approximately 500 feet above sea level.
The climate in Plainfield Village is classified as humid continental, with warm summers and cold winters. The average annual temperature is around 50 degrees Fahrenheit, with an average high of around 75 degrees in the summer and an average low of around 25 degrees in the winter. The average annual precipitation is around 40 inches, with most of the precipitation occurring in the spring and summer months.
Economy
The economy of Plainfield Village is largely based on agriculture and tourism. The village is home to several small farms, which produce a variety of crops, including corn, soybeans, and hay. The village is also home to several small businesses, including a general store, a hardware store, and a few restaurants.
The village is also a popular tourist destination, due to its rural charm and small-town atmosphere. The village is home to several historic sites, including the Plainfield Congregational Church, which was built in 1790, and the Plainfield Academy, which was built in 1820. The village is also home to several parks and recreational areas, including the Quinebaug River State Park, which offers fishing, boating, and camping.
Demographics
As of the 2010 census, the population of Plainfield Village was 1,521. The racial makeup of the village was 97.3% White, 0.7% African American, 0.3% Native American, 0.3% Asian, 0.2% from other races, and 1.2% from two or more races. Hispanic or Latino of any race were 1.2% of the population.
The median household income in Plainfield Village was $50,938, and the median family income was $60,000. The per capita income for the village was $25,938. About 8.3% of families and 10.2% of the population were below the poverty line, including 14.3% of those under age 18 and 5.2% of those age 65 or over.
Conclusion
Plainfield Village is a small village located in Windham County, Connecticut. It is situated in the northeastern corner of the state, near the Massachusetts border. The village is home to approximately 1,500 people, and is known for its rural charm and small-town atmosphere. The economy of Plainfield Village is largely based on agriculture and tourism, and the village is a popular tourist destination due to its historic sites and recreational areas. The population of Plainfield Village is predominantly White, with a small percentage of African American, Native American, and Asian residents. The median household income in Plainfield Village is $50,938, and the per capita income is $25,938.
Common Questions
What is Per Capita Income in Plainfield Village?
Per Capita income in Plainfield Village is $24,079.
What is the Median Family Income in Plainfield Village?
Median Family Income in Plainfield Village is $49,867.
What is the Median Household income in Plainfield Village?
Median Household Income in Plainfield Village is $62,638.
What is Income or Wage Gap in Plainfield Village?
Income or Wage Gap in Plainfield Village is 51.7%.
Women in Plainfield Village earn 48.3 cents for every dollar earned by a man.
What is Inequality or Gini Index in Plainfield Village?
Inequality or Gini Index in Plainfield Village is 0.36.
What is the Total Population of Plainfield Village?
Total Population of Plainfield Village is 2,681.
What is the Total Male Population of Plainfield Village?
Total Male Population of Plainfield Village is 1,225.
What is the Total Female Population of Plainfield Village?
Total Female Population of Plainfield Village is 1,456.
What is the Ratio of Males per 100 Females in Plainfield Village?
There are 84.13 Males per 100 Females in Plainfield Village.
What is the Ratio of Females per 100 Males in Plainfield Village?
There are 118.86 Females per 100 Males in Plainfield Village.
What is the Median Population Age in Plainfield Village?
Median Population Age in Plainfield Village is 26.4 Years.
What is the Average Family Size in Plainfield Village
Average Family Size in Plainfield Village is 3.3 People.
What is the Average Household Size in Plainfield Village
Average Household Size in Plainfield Village is 2.4 People.
How Large is the Labor Force in Plainfield Village?
There are 1,231 People in the Labor Forcein in Plainfield Village.
What is the Percentage of People in the Labor Force in Plainfield Village?
62.0% of People are in the Labor Force in Plainfield Village.
What is the Unemployment Rate in Plainfield Village?
Unemployment Rate in Plainfield Village is 10.2%.