Guilford Center, CT Map & Demographics
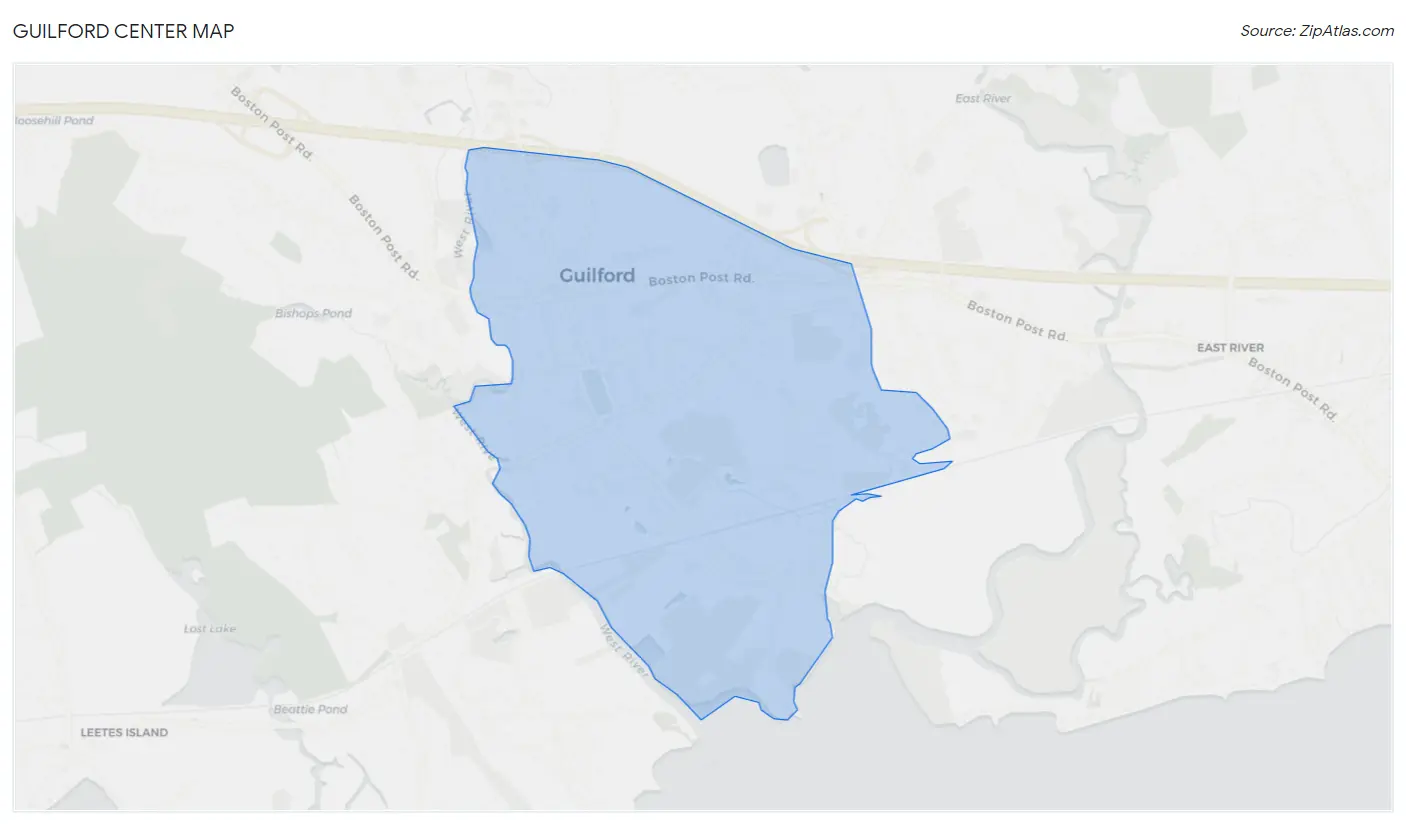
Guilford Center Map
Guilford Center Overview
$102,205
PER CAPITA INCOME
$133,884
AVG FAMILY INCOME
$88,850
AVG HOUSEHOLD INCOME
50.1%
WAGE / INCOME GAP [ % ]
49.9¢/ $1
WAGE / INCOME GAP [ $ ]
0.62
INEQUALITY / GINI INDEX
2,541
TOTAL POPULATION
1,183
MALE POPULATION
1,358
FEMALE POPULATION
87.11
MALES / 100 FEMALES
114.79
FEMALES / 100 MALES
52.6
MEDIAN AGE
2.6
AVG FAMILY SIZE
2.0
AVG HOUSEHOLD SIZE
1,409
LABOR FORCE [ PEOPLE ]
62.8%
PERCENT IN LABOR FORCE
0.6%
UNEMPLOYMENT RATE
Income in Guilford Center
Income Overview in Guilford Center
Per Capita Income in Guilford Center is $102,205, while median incomes of families and households are $133,884 and $88,850 respectively.
| Characteristic | Number | Measure |
| Per Capita Income | 2,541 | $102,205 |
| Median Family Income | 701 | $133,884 |
| Mean Family Income | 701 | $230,400 |
| Median Household Income | 1,241 | $88,850 |
| Mean Household Income | 1,241 | $200,918 |
| Income Deficit | 701 | $0 |
| Wage / Income Gap (%) | 2,541 | 50.08% |
| Wage / Income Gap ($) | 2,541 | 49.92¢ per $1 |
| Gini / Inequality Index | 2,541 | 0.62 |
Earnings by Sex in Guilford Center
Average Earnings in Guilford Center are $52,288, $85,260 for men and $42,561 for women, a difference of 50.1%.
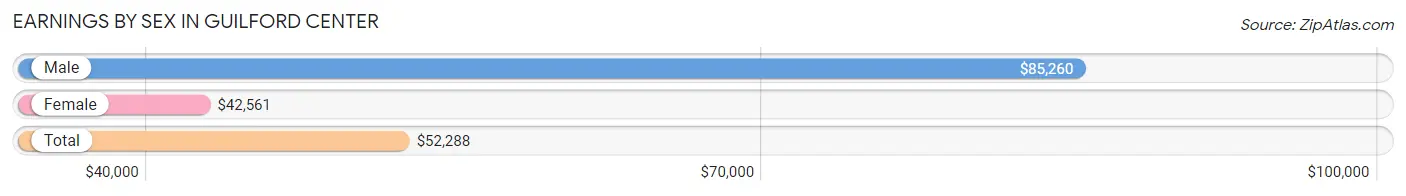
| Sex | Number | Average Earnings |
| Male | 761 (51.4%) | $85,260 |
| Female | 718 (48.5%) | $42,561 |
| Total | 1,479 (100.0%) | $52,288 |
Earnings by Sex by Income Bracket in Guilford Center
The most common earnings brackets in Guilford Center are $100,000+ for men (341 | 44.8%) and $75,000 to $99,999 for women (112 | 15.6%).
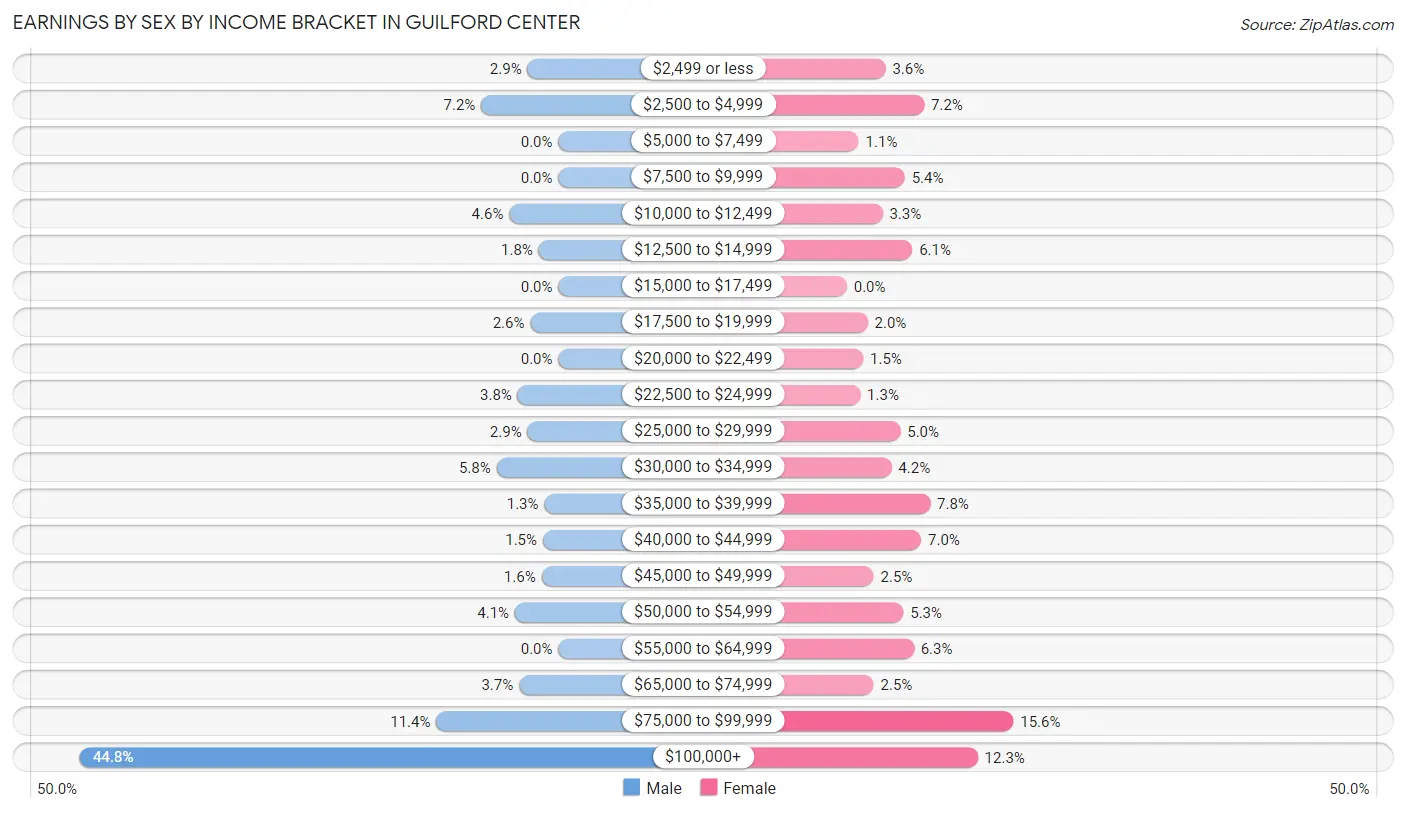
| Income | Male | Female |
| $2,499 or less | 22 (2.9%) | 26 (3.6%) |
| $2,500 to $4,999 | 55 (7.2%) | 52 (7.2%) |
| $5,000 to $7,499 | 0 (0.0%) | 8 (1.1%) |
| $7,500 to $9,999 | 0 (0.0%) | 39 (5.4%) |
| $10,000 to $12,499 | 35 (4.6%) | 24 (3.3%) |
| $12,500 to $14,999 | 14 (1.8%) | 44 (6.1%) |
| $15,000 to $17,499 | 0 (0.0%) | 0 (0.0%) |
| $17,500 to $19,999 | 20 (2.6%) | 14 (1.9%) |
| $20,000 to $22,499 | 0 (0.0%) | 11 (1.5%) |
| $22,500 to $24,999 | 29 (3.8%) | 9 (1.3%) |
| $25,000 to $29,999 | 22 (2.9%) | 36 (5.0%) |
| $30,000 to $34,999 | 44 (5.8%) | 30 (4.2%) |
| $35,000 to $39,999 | 10 (1.3%) | 56 (7.8%) |
| $40,000 to $44,999 | 11 (1.5%) | 50 (7.0%) |
| $45,000 to $49,999 | 12 (1.6%) | 18 (2.5%) |
| $50,000 to $54,999 | 31 (4.1%) | 38 (5.3%) |
| $55,000 to $64,999 | 0 (0.0%) | 45 (6.3%) |
| $65,000 to $74,999 | 28 (3.7%) | 18 (2.5%) |
| $75,000 to $99,999 | 87 (11.4%) | 112 (15.6%) |
| $100,000+ | 341 (44.8%) | 88 (12.3%) |
| Total | 761 (100.0%) | 718 (100.0%) |
Earnings by Sex by Educational Attainment in Guilford Center
Average earnings in Guilford Center are $112,757 for men and $43,415 for women, a difference of 61.5%. Men with an educational attainment of college or associate's degree enjoy the highest average annual earnings of $114,911, while those with bachelor's degree education earn the least with $75,625. Women with an educational attainment of graduate degree earn the most with the average annual earnings of $63,906, while those with high school diploma education have the smallest earnings of $37,727.
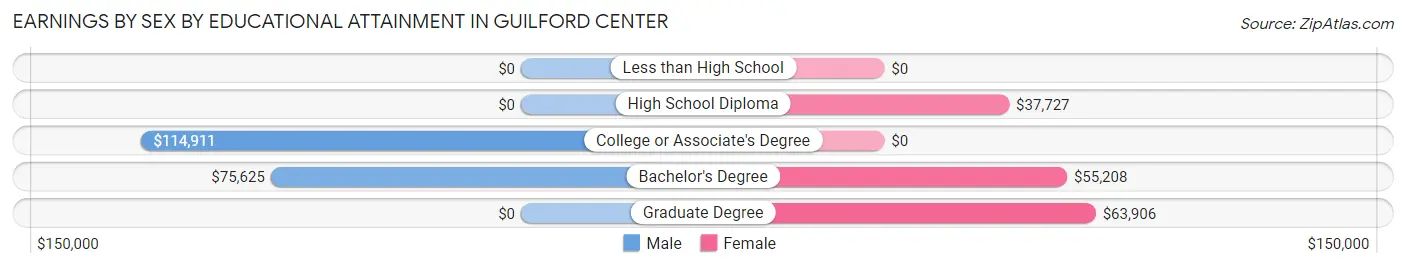
| Educational Attainment | Male Income | Female Income |
| Less than High School | - | - |
| High School Diploma | - | - |
| College or Associate's Degree | $114,911 | $0 |
| Bachelor's Degree | $75,625 | $55,208 |
| Graduate Degree | - | - |
| Total | $112,757 | $43,415 |
Family Income in Guilford Center
Family Income Brackets in Guilford Center
According to the Guilford Center family income data, there are 224 families falling into the $200,000+ income range, which is the most common income bracket and makes up 32.0% of all families.
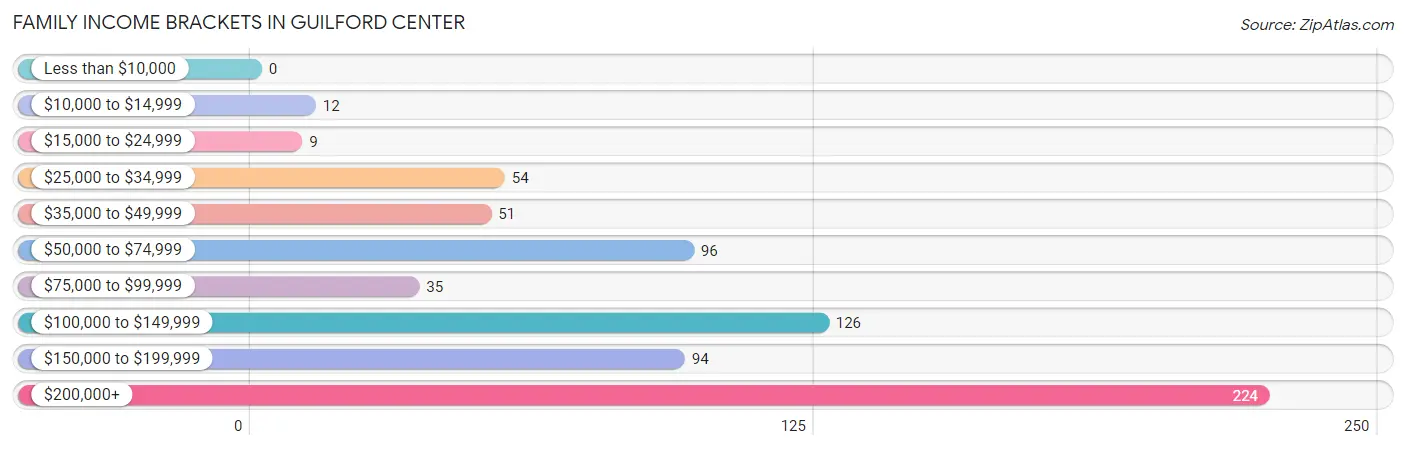
| Income Bracket | # Families | % Families |
| Less than $10,000 | 0 | 0.0% |
| $10,000 to $14,999 | 12 | 1.7% |
| $15,000 to $24,999 | 9 | 1.3% |
| $25,000 to $34,999 | 54 | 7.7% |
| $35,000 to $49,999 | 51 | 7.3% |
| $50,000 to $74,999 | 96 | 13.7% |
| $75,000 to $99,999 | 35 | 5.0% |
| $100,000 to $149,999 | 126 | 18.0% |
| $150,000 to $199,999 | 94 | 13.4% |
| $200,000+ | 224 | 32.0% |
Family Income by Famaliy Size in Guilford Center
4-person families (89 | 12.7%) account for the highest median family income in Guilford Center with $250,001 per family, while 2-person families (464 | 66.2%) have the highest median income of $62,678 per family member.
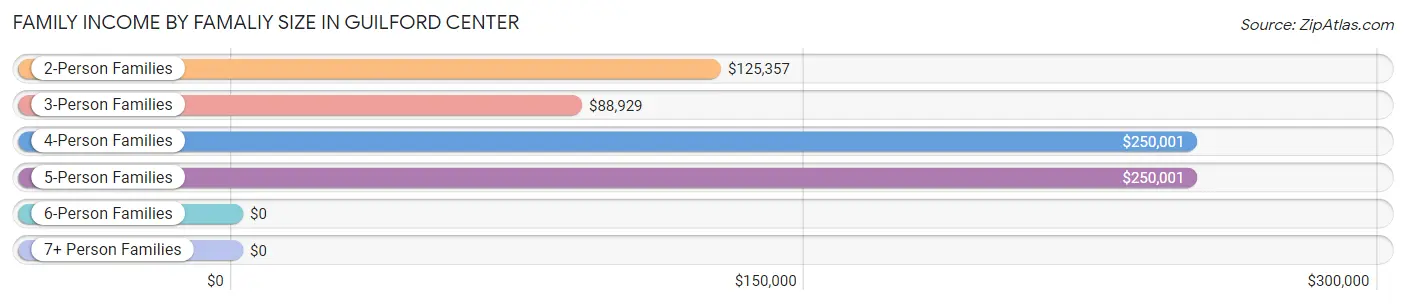
| Income Bracket | # Families | Median Income |
| 2-Person Families | 464 (66.2%) | $125,357 |
| 3-Person Families | 118 (16.8%) | $88,929 |
| 4-Person Families | 89 (12.7%) | $250,001 |
| 5-Person Families | 30 (4.3%) | $250,001 |
| 6-Person Families | 0 (0.0%) | $0 |
| 7+ Person Families | 0 (0.0%) | $0 |
| Total | 701 (100.0%) | $133,884 |
Family Income by Number of Earners in Guilford Center
The median family income in Guilford Center is $133,884, with families comprising 3+ earners (47) having the highest median family income of $245,781, while families with 1 earner (190) have the lowest median family income of $88,700, accounting for 6.7% and 27.1% of families, respectively.
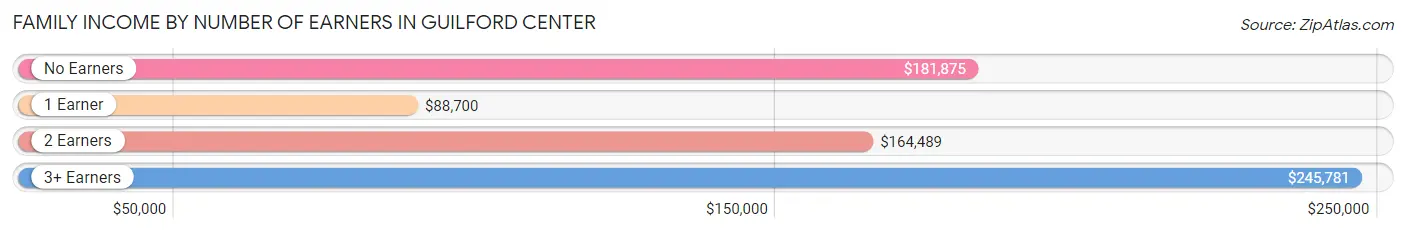
| Number of Earners | # Families | Median Income |
| No Earners | 67 (9.6%) | $181,875 |
| 1 Earner | 190 (27.1%) | $88,700 |
| 2 Earners | 397 (56.6%) | $164,489 |
| 3+ Earners | 47 (6.7%) | $245,781 |
| Total | 701 (100.0%) | $133,884 |
Household Income in Guilford Center
Household Income Brackets in Guilford Center
With 302 households falling in the category, the $200,000+ income range is the most frequent in Guilford Center, accounting for 24.3% of all households. In contrast, only 24 households (1.9%) fall into the less than $10,000 income bracket, making it the least populous group.
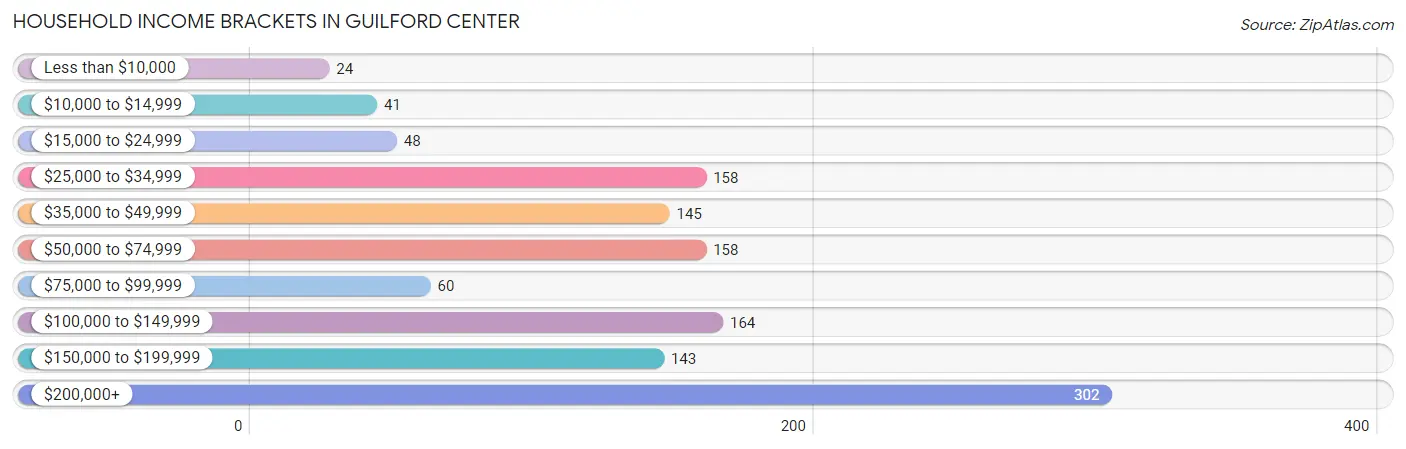
| Income Bracket | # Households | % Households |
| Less than $10,000 | 24 | 1.9% |
| $10,000 to $14,999 | 41 | 3.3% |
| $15,000 to $24,999 | 48 | 3.9% |
| $25,000 to $34,999 | 158 | 12.7% |
| $35,000 to $49,999 | 145 | 11.7% |
| $50,000 to $74,999 | 158 | 12.7% |
| $75,000 to $99,999 | 60 | 4.8% |
| $100,000 to $149,999 | 164 | 13.2% |
| $150,000 to $199,999 | 143 | 11.5% |
| $200,000+ | 302 | 24.3% |
Household Income by Householder Age in Guilford Center
The median household income in Guilford Center is $88,850, with the highest median household income of $250,001 found in the 25 to 44 years age bracket for the primary householder. A total of 202 households (16.3%) fall into this category. Meanwhile, the 15 to 24 years age bracket for the primary householder has the lowest median household income of $0, with 10 households (0.8%) in this group.
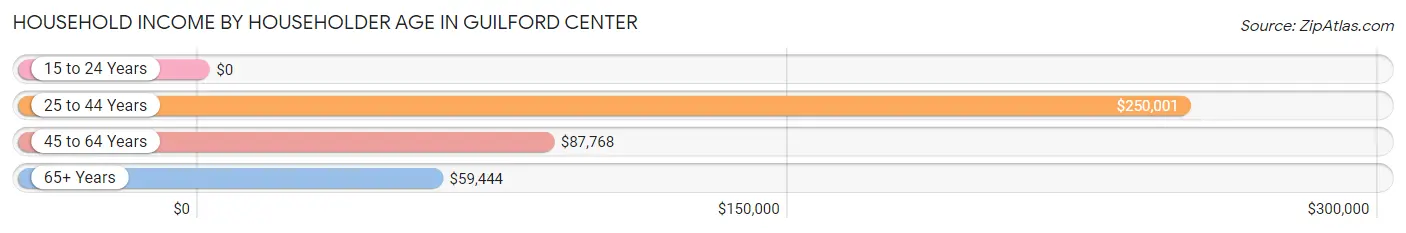
| Income Bracket | # Households | Median Income |
| 15 to 24 Years | 10 (0.8%) | $0 |
| 25 to 44 Years | 202 (16.3%) | $250,001 |
| 45 to 64 Years | 523 (42.1%) | $87,768 |
| 65+ Years | 506 (40.8%) | $59,444 |
| Total | 1,241 (100.0%) | $88,850 |
Poverty in Guilford Center
Income Below Poverty by Sex and Age in Guilford Center
With 4.6% poverty level for males and 4.2% for females among the residents of Guilford Center, 15 year old males and 18 to 24 year old females are the most vulnerable to poverty, with 13 males (59.1%) and 13 females (37.1%) in their respective age groups living below the poverty level.
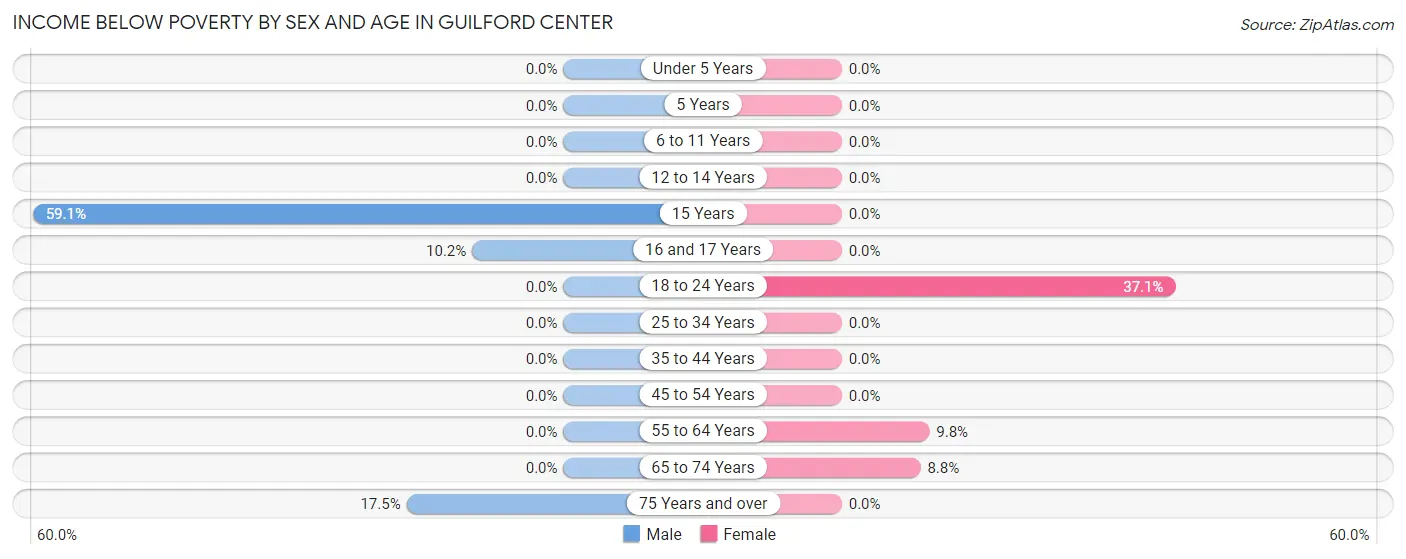
| Age Bracket | Male | Female |
| Under 5 Years | 0 (0.0%) | 0 (0.0%) |
| 5 Years | 0 (0.0%) | 0 (0.0%) |
| 6 to 11 Years | 0 (0.0%) | 0 (0.0%) |
| 12 to 14 Years | 0 (0.0%) | 0 (0.0%) |
| 15 Years | 13 (59.1%) | 0 (0.0%) |
| 16 and 17 Years | 13 (10.2%) | 0 (0.0%) |
| 18 to 24 Years | 0 (0.0%) | 13 (37.1%) |
| 25 to 34 Years | 0 (0.0%) | 0 (0.0%) |
| 35 to 44 Years | 0 (0.0%) | 0 (0.0%) |
| 45 to 54 Years | 0 (0.0%) | 0 (0.0%) |
| 55 to 64 Years | 0 (0.0%) | 27 (9.8%) |
| 65 to 74 Years | 0 (0.0%) | 17 (8.8%) |
| 75 Years and over | 29 (17.5%) | 0 (0.0%) |
| Total | 55 (4.6%) | 57 (4.2%) |
Income Above Poverty by Sex and Age in Guilford Center
According to the poverty statistics in Guilford Center, males aged under 5 years and females aged under 5 years are the age groups that are most secure financially, with 100.0% of males and 100.0% of females in these age groups living above the poverty line.
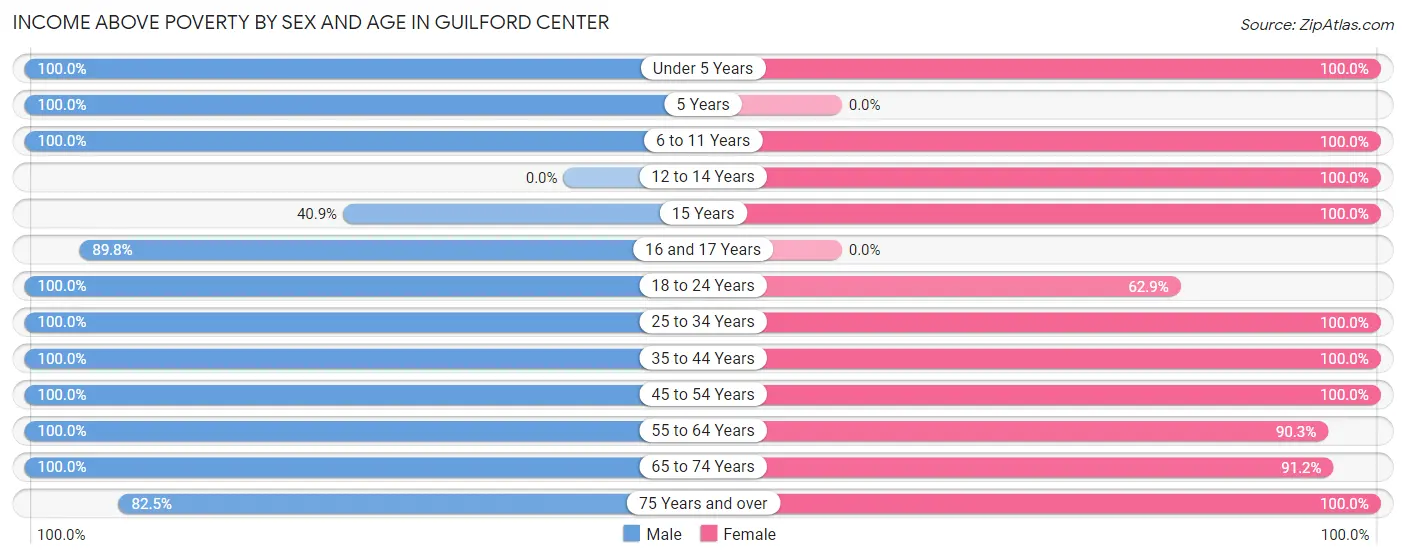
| Age Bracket | Male | Female |
| Under 5 Years | 51 (100.0%) | 42 (100.0%) |
| 5 Years | 26 (100.0%) | 0 (0.0%) |
| 6 to 11 Years | 42 (100.0%) | 86 (100.0%) |
| 12 to 14 Years | 0 (0.0%) | 16 (100.0%) |
| 15 Years | 9 (40.9%) | 12 (100.0%) |
| 16 and 17 Years | 115 (89.8%) | 0 (0.0%) |
| 18 to 24 Years | 69 (100.0%) | 22 (62.9%) |
| 25 to 34 Years | 114 (100.0%) | 109 (100.0%) |
| 35 to 44 Years | 87 (100.0%) | 126 (100.0%) |
| 45 to 54 Years | 182 (100.0%) | 199 (100.0%) |
| 55 to 64 Years | 176 (100.0%) | 250 (90.2%) |
| 65 to 74 Years | 120 (100.0%) | 177 (91.2%) |
| 75 Years and over | 137 (82.5%) | 248 (100.0%) |
| Total | 1,128 (95.4%) | 1,287 (95.8%) |
Income Below Poverty Among Married-Couple Families in Guilford Center
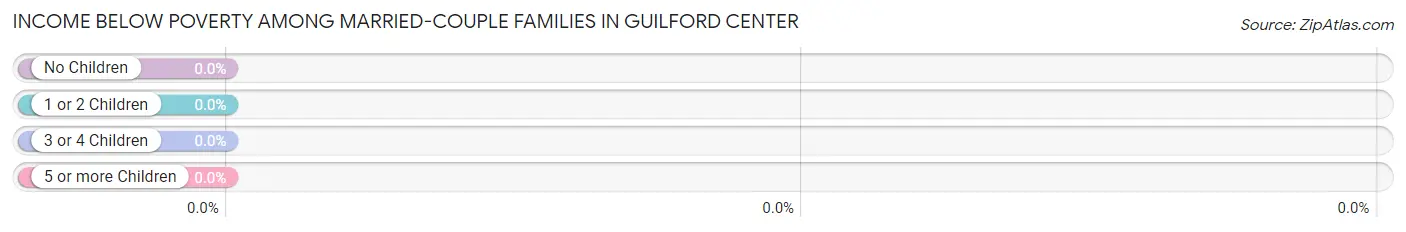
| Children | Above Poverty | Below Poverty |
| No Children | 397 (100.0%) | 0 (0.0%) |
| 1 or 2 Children | 137 (100.0%) | 0 (0.0%) |
| 3 or 4 Children | 30 (100.0%) | 0 (0.0%) |
| 5 or more Children | 0 (0.0%) | 0 (0.0%) |
| Total | 564 (100.0%) | 0 (0.0%) |
Income Below Poverty Among Single-Parent Households in Guilford Center
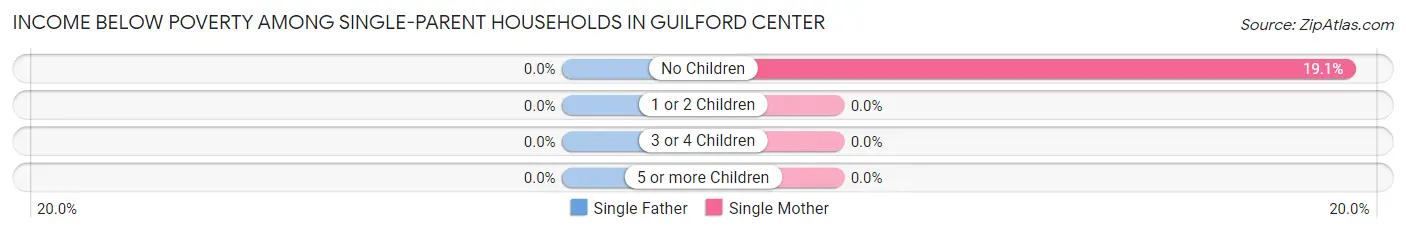
| Children | Single Father | Single Mother |
| No Children | 0 (0.0%) | 12 (19.1%) |
| 1 or 2 Children | 0 (0.0%) | 0 (0.0%) |
| 3 or 4 Children | 0 (0.0%) | 0 (0.0%) |
| 5 or more Children | 0 (0.0%) | 0 (0.0%) |
| Total | 0 (0.0%) | 12 (9.4%) |
Income Below Poverty Among Married-Couple vs Single-Parent Households in Guilford Center
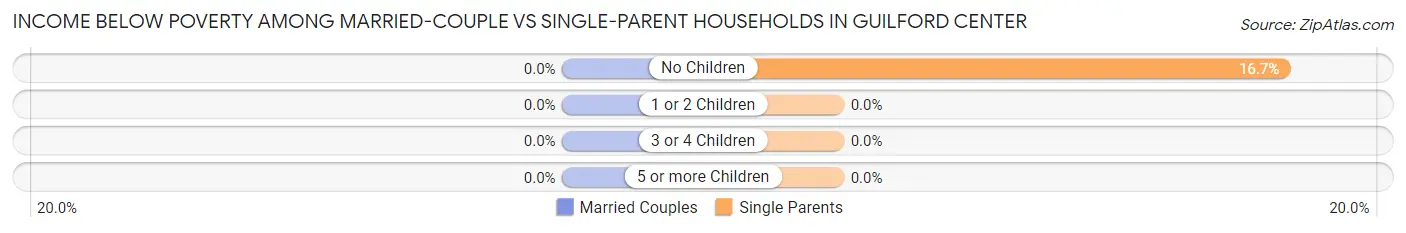
| Children | Married-Couple Families | Single-Parent Households |
| No Children | 0 (0.0%) | 12 (16.7%) |
| 1 or 2 Children | 0 (0.0%) | 0 (0.0%) |
| 3 or 4 Children | 0 (0.0%) | 0 (0.0%) |
| 5 or more Children | 0 (0.0%) | 0 (0.0%) |
| Total | 0 (0.0%) | 12 (8.8%) |
Race in Guilford Center
The most populous races in Guilford Center are White / Caucasian (2,267 | 89.2%), Hispanic or Latino (162 | 6.4%), and Two or more Races (89 | 3.5%).
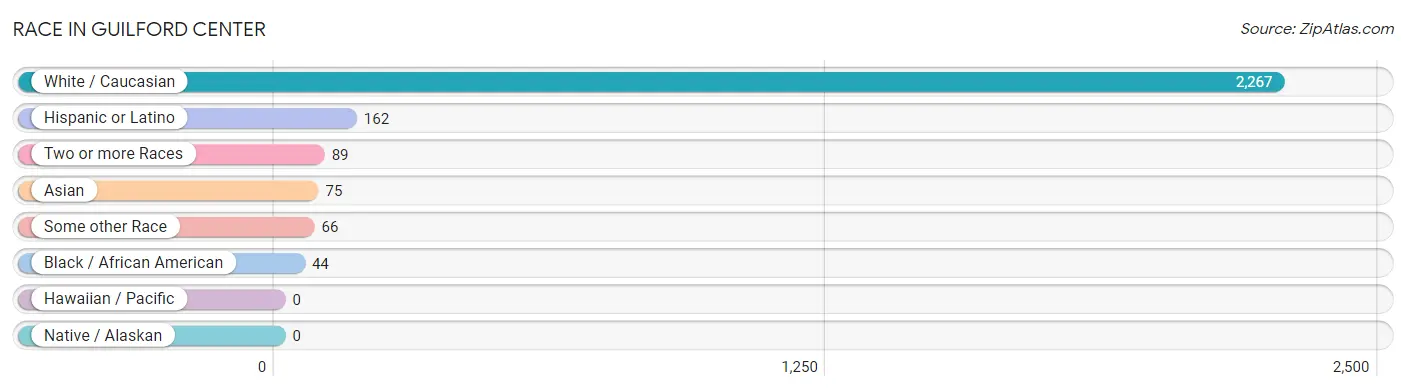
| Race | # Population | % Population |
| Asian | 75 | 2.9% |
| Black / African American | 44 | 1.7% |
| Hawaiian / Pacific | 0 | 0.0% |
| Hispanic or Latino | 162 | 6.4% |
| Native / Alaskan | 0 | 0.0% |
| White / Caucasian | 2,267 | 89.2% |
| Two or more Races | 89 | 3.5% |
| Some other Race | 66 | 2.6% |
| Total | 2,541 | 100.0% |
Ancestry in Guilford Center
The most populous ancestries reported in Guilford Center are Italian (603 | 23.7%), Irish (575 | 22.6%), German (379 | 14.9%), English (322 | 12.7%), and French Canadian (132 | 5.2%), together accounting for 79.1% of all Guilford Center residents.
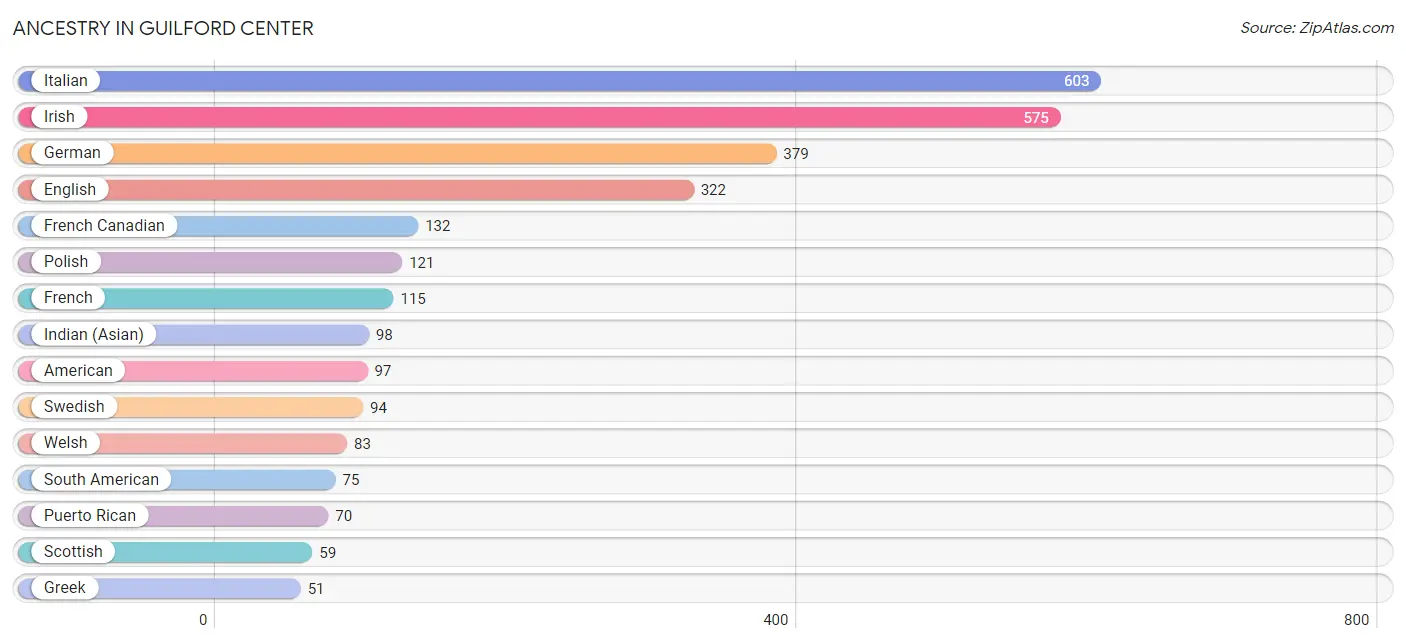
| Ancestry | # Population | % Population |
| African | 6 | 0.2% |
| American | 97 | 3.8% |
| Argentinean | 32 | 1.3% |
| Belgian | 23 | 0.9% |
| British | 13 | 0.5% |
| Bulgarian | 23 | 0.9% |
| Canadian | 8 | 0.3% |
| Central American Indian | 6 | 0.2% |
| Czech | 26 | 1.0% |
| Dutch | 9 | 0.4% |
| Eastern European | 6 | 0.2% |
| Ecuadorian | 35 | 1.4% |
| English | 322 | 12.7% |
| European | 7 | 0.3% |
| French | 115 | 4.5% |
| French Canadian | 132 | 5.2% |
| German | 379 | 14.9% |
| Greek | 51 | 2.0% |
| Hungarian | 25 | 1.0% |
| Indian (Asian) | 98 | 3.9% |
| Irish | 575 | 22.6% |
| Italian | 603 | 23.7% |
| Jamaican | 35 | 1.4% |
| Lithuanian | 15 | 0.6% |
| Mexican | 17 | 0.7% |
| Norwegian | 23 | 0.9% |
| Polish | 121 | 4.8% |
| Portuguese | 45 | 1.8% |
| Puerto Rican | 70 | 2.8% |
| Russian | 16 | 0.6% |
| Scotch-Irish | 26 | 1.0% |
| Scottish | 59 | 2.3% |
| South American | 75 | 2.9% |
| Subsaharan African | 6 | 0.2% |
| Swedish | 94 | 3.7% |
| Swiss | 5 | 0.2% |
| Ukrainian | 16 | 0.6% |
| Welsh | 83 | 3.3% | View All 38 Rows |
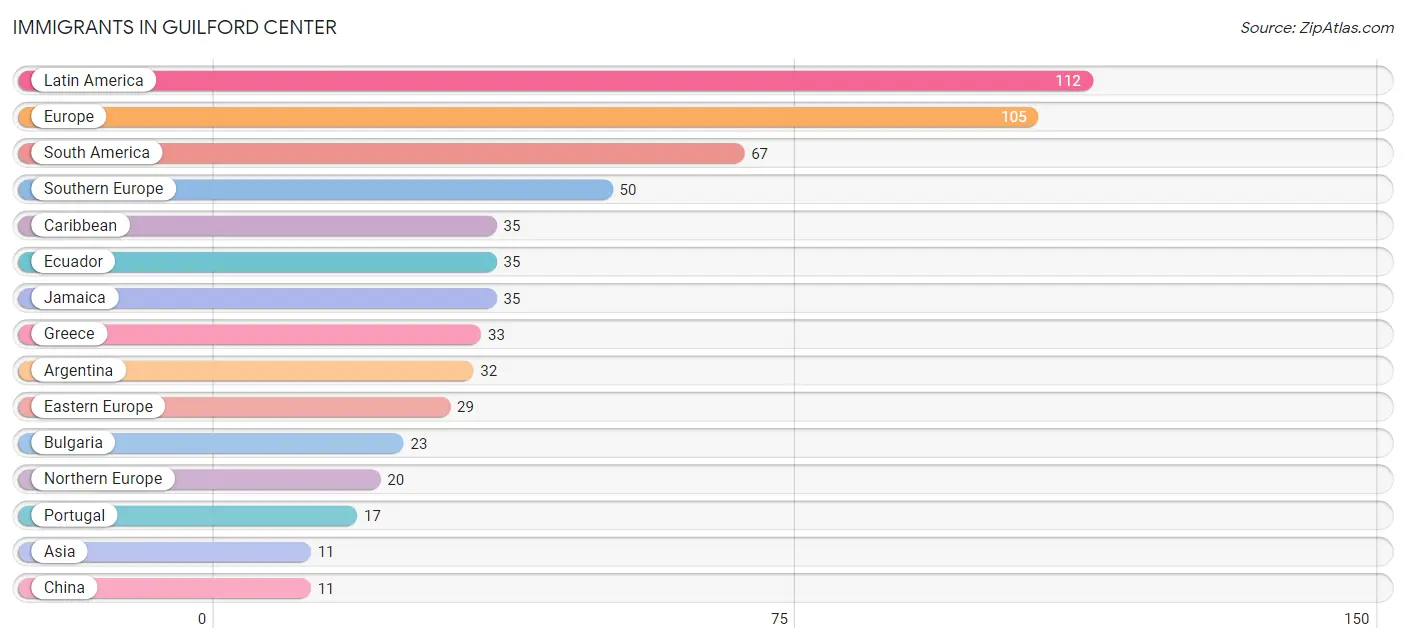
Immigrants in Guilford Center
The most numerous immigrant groups reported in Guilford Center came from Latin America (112 | 4.4%), Europe (105 | 4.1%), South America (67 | 2.6%), Southern Europe (50 | 2.0%), and Caribbean (35 | 1.4%), together accounting for 14.5% of all Guilford Center residents.
| Immigration Origin | # Population | % Population |
| Argentina | 32 | 1.3% |
| Asia | 11 | 0.4% |
| Belarus | 6 | 0.2% |
| Bulgaria | 23 | 0.9% |
| Canada | 8 | 0.3% |
| Caribbean | 35 | 1.4% |
| Central America | 10 | 0.4% |
| China | 11 | 0.4% |
| Eastern Asia | 11 | 0.4% |
| Eastern Europe | 29 | 1.1% |
| Ecuador | 35 | 1.4% |
| England | 10 | 0.4% |
| Europe | 105 | 4.1% |
| Germany | 6 | 0.2% |
| Greece | 33 | 1.3% |
| Ireland | 10 | 0.4% |
| Jamaica | 35 | 1.4% |
| Latin America | 112 | 4.4% |
| Mexico | 10 | 0.4% |
| Northern Europe | 20 | 0.8% |
| Portugal | 17 | 0.7% |
| South America | 67 | 2.6% |
| Southern Europe | 50 | 2.0% |
| Western Europe | 6 | 0.2% | View All 24 Rows |
Sex and Age in Guilford Center
Sex and Age in Guilford Center
The most populous age groups in Guilford Center are 15 to 19 Years (167 | 14.1%) for men and 55 to 59 Years (162 | 11.9%) for women.
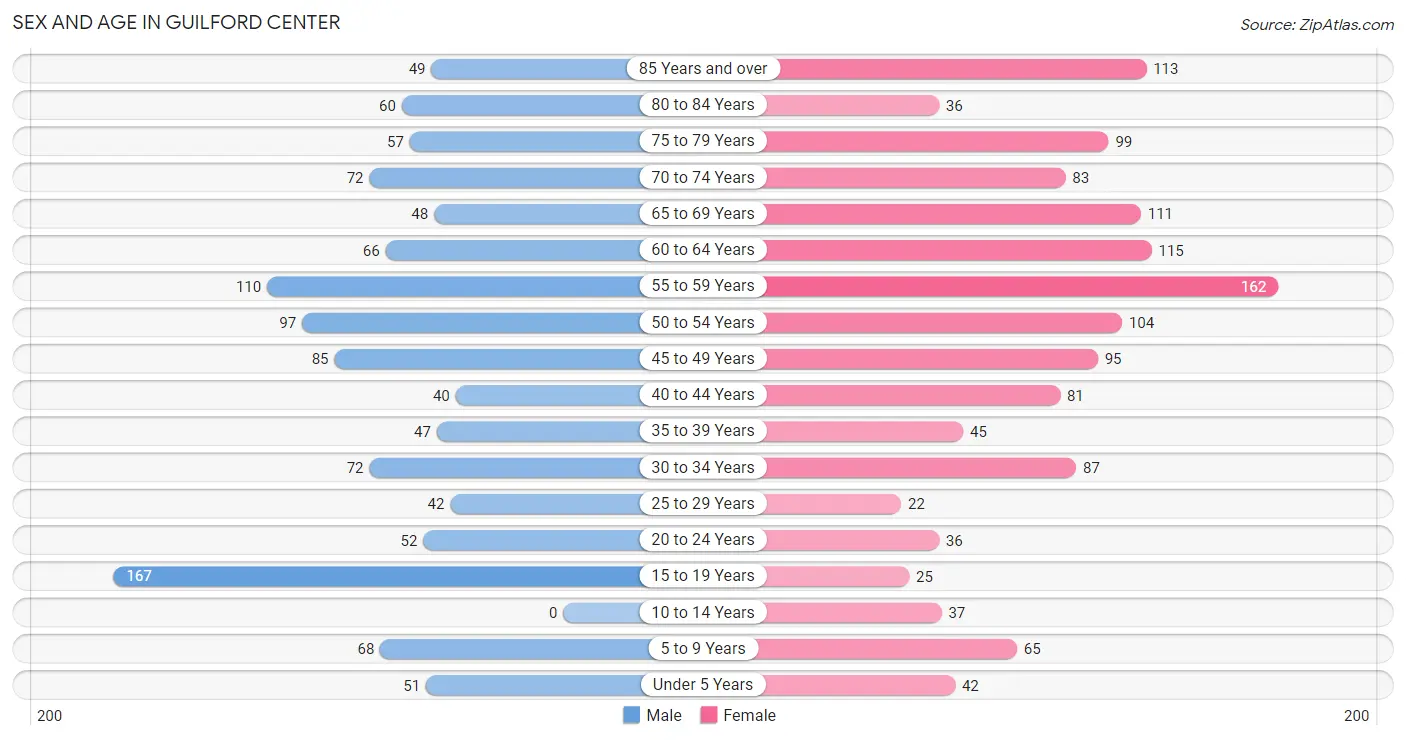
| Age Bracket | Male | Female |
| Under 5 Years | 51 (4.3%) | 42 (3.1%) |
| 5 to 9 Years | 68 (5.8%) | 65 (4.8%) |
| 10 to 14 Years | 0 (0.0%) | 37 (2.7%) |
| 15 to 19 Years | 167 (14.1%) | 25 (1.8%) |
| 20 to 24 Years | 52 (4.4%) | 36 (2.6%) |
| 25 to 29 Years | 42 (3.5%) | 22 (1.6%) |
| 30 to 34 Years | 72 (6.1%) | 87 (6.4%) |
| 35 to 39 Years | 47 (4.0%) | 45 (3.3%) |
| 40 to 44 Years | 40 (3.4%) | 81 (6.0%) |
| 45 to 49 Years | 85 (7.2%) | 95 (7.0%) |
| 50 to 54 Years | 97 (8.2%) | 104 (7.7%) |
| 55 to 59 Years | 110 (9.3%) | 162 (11.9%) |
| 60 to 64 Years | 66 (5.6%) | 115 (8.5%) |
| 65 to 69 Years | 48 (4.1%) | 111 (8.2%) |
| 70 to 74 Years | 72 (6.1%) | 83 (6.1%) |
| 75 to 79 Years | 57 (4.8%) | 99 (7.3%) |
| 80 to 84 Years | 60 (5.1%) | 36 (2.6%) |
| 85 Years and over | 49 (4.1%) | 113 (8.3%) |
| Total | 1,183 (100.0%) | 1,358 (100.0%) |
Families and Households in Guilford Center
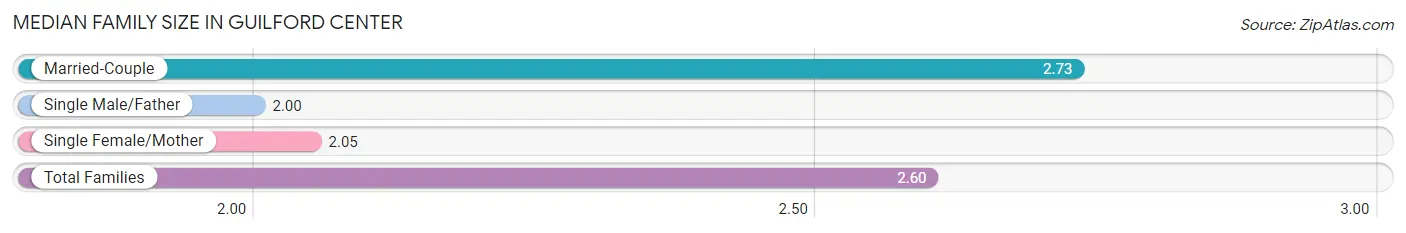
Median Family Size in Guilford Center
The median family size in Guilford Center is 2.60 persons per family, with married-couple families (564 | 80.5%) accounting for the largest median family size of 2.73 persons per family. On the other hand, single male/father families (9 | 1.3%) represent the smallest median family size with 2.00 persons per family.
| Family Type | # Families | Family Size |
| Married-Couple | 564 (80.5%) | 2.73 |
| Single Male/Father | 9 (1.3%) | 2.00 |
| Single Female/Mother | 128 (18.3%) | 2.05 |
| Total Families | 701 (100.0%) | 2.60 |
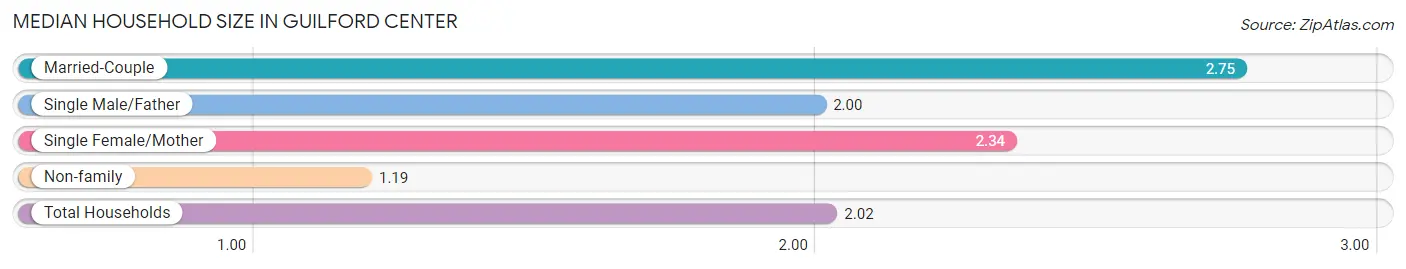
Median Household Size in Guilford Center
The median household size in Guilford Center is 2.02 persons per household, with married-couple households (564 | 45.5%) accounting for the largest median household size of 2.75 persons per household. non-family households (540 | 43.5%) represent the smallest median household size with 1.19 persons per household.
| Household Type | # Households | Household Size |
| Married-Couple | 564 (45.5%) | 2.75 |
| Single Male/Father | 9 (0.7%) | 2.00 |
| Single Female/Mother | 128 (10.3%) | 2.34 |
| Non-family | 540 (43.5%) | 1.19 |
| Total Households | 1,241 (100.0%) | 2.02 |
Household Size by Marriage Status in Guilford Center
Out of a total of 1,241 households in Guilford Center, 701 (56.5%) are family households, while 540 (43.5%) are nonfamily households. The most numerous type of family households are 2-person households, comprising 454, and the most common type of nonfamily households are 1-person households, comprising 447.
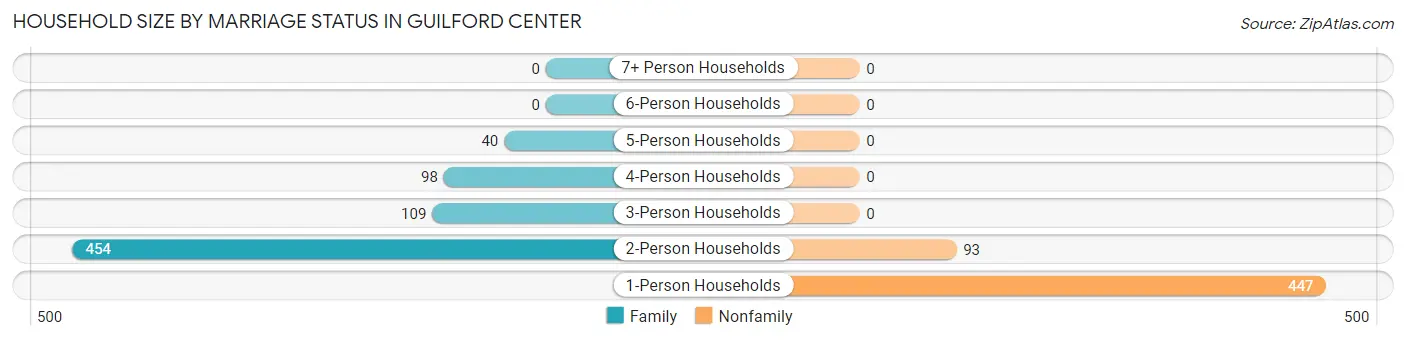
| Household Size | Family Households | Nonfamily Households |
| 1-Person Households | - | 447 (36.0%) |
| 2-Person Households | 454 (36.6%) | 93 (7.5%) |
| 3-Person Households | 109 (8.8%) | 0 (0.0%) |
| 4-Person Households | 98 (7.9%) | 0 (0.0%) |
| 5-Person Households | 40 (3.2%) | 0 (0.0%) |
| 6-Person Households | 0 (0.0%) | 0 (0.0%) |
| 7+ Person Households | 0 (0.0%) | 0 (0.0%) |
| Total | 701 (56.5%) | 540 (43.5%) |
Female Fertility in Guilford Center
Fertility by Age in Guilford Center
| Age Bracket | Women with Births | Births / 1,000 Women |
| 15 to 19 years | 0 (0.0%) | 0.0 |
| 20 to 34 years | 0 (0.0%) | 0.0 |
| 35 to 50 years | 0 (0.0%) | 0.0 |
| Total | 0 (0.0%) | 0.0 |
Fertility by Age by Marriage Status in Guilford Center
| Age Bracket | Married | Unmarried |
| 15 to 19 years | 0 (0.0%) | 0 (0.0%) |
| 20 to 34 years | 0 (0.0%) | 0 (0.0%) |
| 35 to 50 years | 0 (0.0%) | 0 (0.0%) |
| Total | 0 (0.0%) | 0 (0.0%) |
Fertility by Education in Guilford Center
| Educational Attainment | Women with Births | Births / 1,000 Women |
| Less than High School | 0 (0.0%) | 0.0 |
| High School Diploma | 0 (0.0%) | 0.0 |
| College or Associate's Degree | 0 (0.0%) | 0.0 |
| Bachelor's Degree | 0 (0.0%) | 0.0 |
| Graduate Degree | 0 (0.0%) | 0.0 |
| Total | 0 (0.0%) | 0.0 |
Fertility by Education by Marriage Status in Guilford Center
| Educational Attainment | Married | Unmarried |
| Less than High School | 0 (0.0%) | 0 (0.0%) |
| High School Diploma | 0 (0.0%) | 0 (0.0%) |
| College or Associate's Degree | 0 (0.0%) | 0 (0.0%) |
| Bachelor's Degree | 0 (0.0%) | 0 (0.0%) |
| Graduate Degree | 0 (0.0%) | 0 (0.0%) |
| Total | 0 (0.0%) | 0 (0.0%) |
Employment Characteristics in Guilford Center
Employment by Class of Employer in Guilford Center
Among the 1,400 employed individuals in Guilford Center, private company employees (738 | 52.7%), not-for-profit organizations (290 | 20.7%), and self-employed (not incorporated) (137 | 9.8%) make up the most common classes of employment.
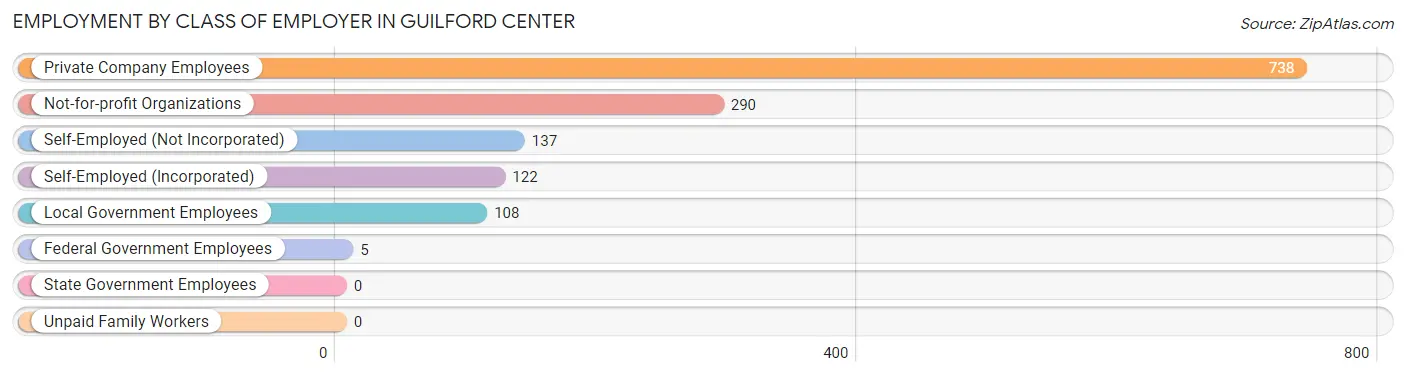
| Employer Class | # Employees | % Employees |
| Private Company Employees | 738 | 52.7% |
| Self-Employed (Incorporated) | 122 | 8.7% |
| Self-Employed (Not Incorporated) | 137 | 9.8% |
| Not-for-profit Organizations | 290 | 20.7% |
| Local Government Employees | 108 | 7.7% |
| State Government Employees | 0 | 0.0% |
| Federal Government Employees | 5 | 0.4% |
| Unpaid Family Workers | 0 | 0.0% |
| Total | 1,400 | 100.0% |
Employment Status by Age in Guilford Center
According to the labor force statistics for Guilford Center, out of the total population over 16 years of age (2,243), 62.8% or 1,409 individuals are in the labor force, with 0.6% or 8 of them unemployed. The age group with the highest labor force participation rate is 20 to 24 years, with 100.0% or 88 individuals in the labor force. Within the labor force, the 65 to 74 years age range has the highest percentage of unemployed individuals, with 8.0% or 9 of them being unemployed.
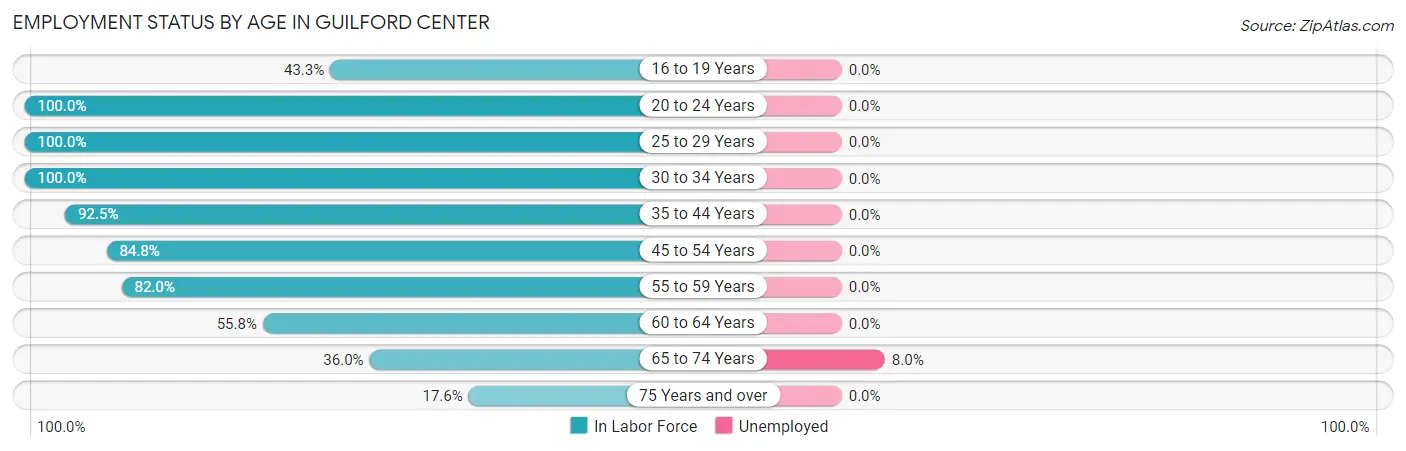
| Age Bracket | In Labor Force | Unemployed |
| 16 to 19 Years | 68 (43.3%) | 0 (0.0%) |
| 20 to 24 Years | 88 (100.0%) | 0 (0.0%) |
| 25 to 29 Years | 64 (100.0%) | 0 (0.0%) |
| 30 to 34 Years | 159 (100.0%) | 0 (0.0%) |
| 35 to 44 Years | 197 (92.5%) | 0 (0.0%) |
| 45 to 54 Years | 323 (84.8%) | 0 (0.0%) |
| 55 to 59 Years | 223 (82.0%) | 0 (0.0%) |
| 60 to 64 Years | 101 (55.8%) | 0 (0.0%) |
| 65 to 74 Years | 113 (36.0%) | 9 (8.0%) |
| 75 Years and over | 73 (17.6%) | 0 (0.0%) |
| Total | 1,409 (62.8%) | 8 (0.6%) |
Employment Status by Educational Attainment in Guilford Center
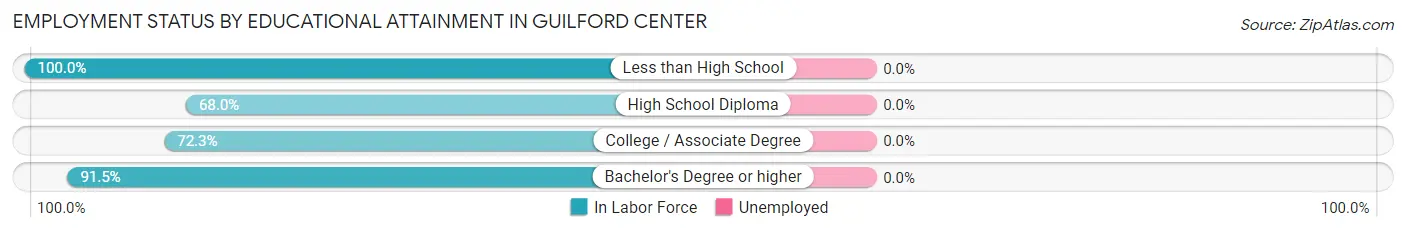
| Educational Attainment | In Labor Force | Unemployed |
| Less than High School | 32 (100.0%) | 0 (0.0%) |
| High School Diploma | 132 (68.0%) | 0 (0.0%) |
| College / Associate Degree | 196 (72.3%) | 0 (0.0%) |
| Bachelor's Degree or higher | 707 (91.5%) | 0 (0.0%) |
| Total | 1,067 (84.0%) | 0 (0.0%) |
Employment Occupations by Sex in Guilford Center
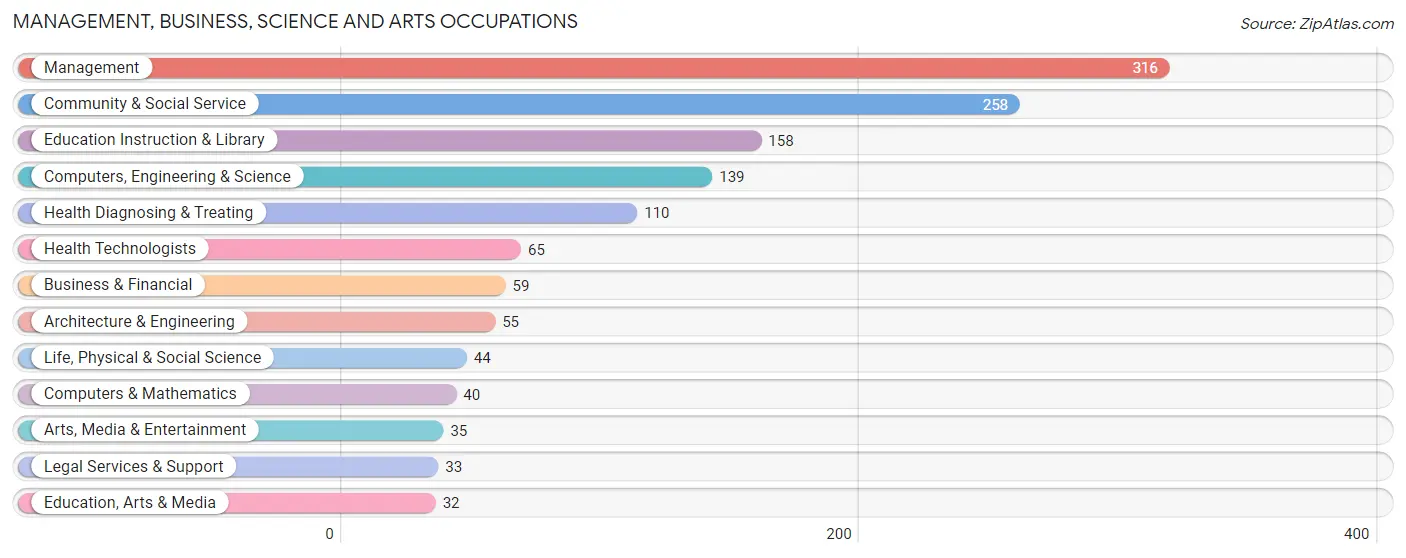
Management, Business, Science and Arts Occupations
The most common Management, Business, Science and Arts occupations in Guilford Center are Management (316 | 22.6%), Community & Social Service (258 | 18.4%), Education Instruction & Library (158 | 11.3%), Computers, Engineering & Science (139 | 9.9%), and Health Diagnosing & Treating (110 | 7.9%).
Management, Business, Science and Arts Occupations by Sex
Within the Management, Business, Science and Arts occupations in Guilford Center, the most male-oriented occupations are Architecture & Engineering (100.0%), Management (86.4%), and Computers, Engineering & Science (83.5%), while the most female-oriented occupations are Business & Financial (89.8%), Education, Arts & Media (84.4%), and Health Diagnosing & Treating (77.3%).
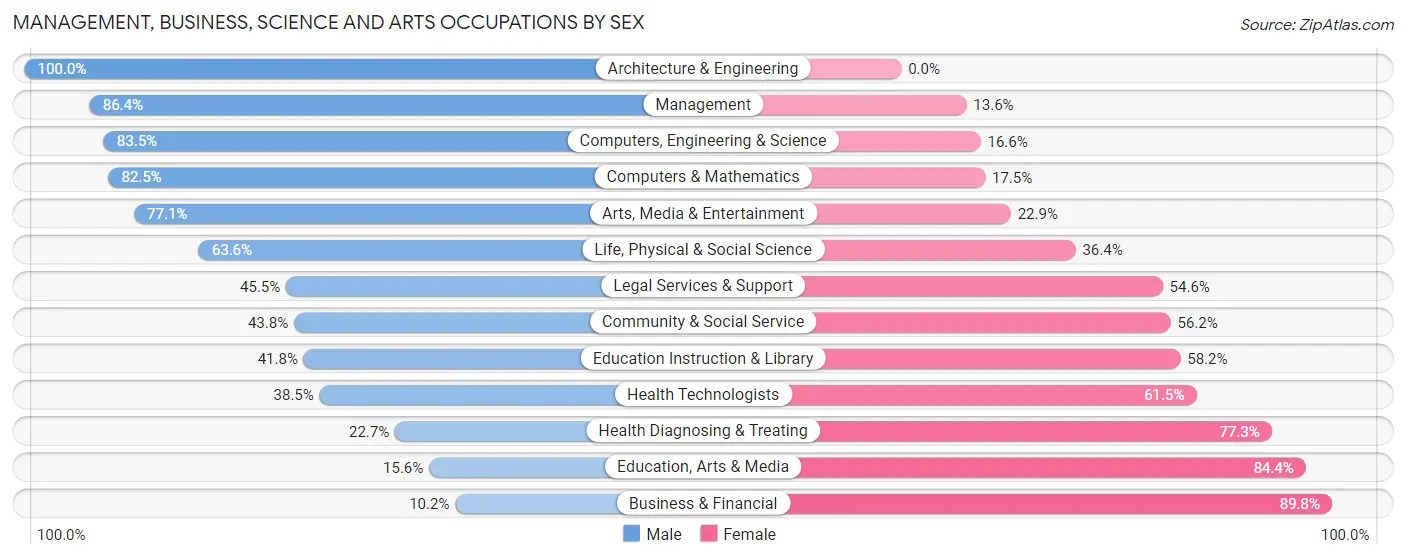
| Occupation | Male | Female |
| Management | 273 (86.4%) | 43 (13.6%) |
| Business & Financial | 6 (10.2%) | 53 (89.8%) |
| Computers, Engineering & Science | 116 (83.5%) | 23 (16.6%) |
| Computers & Mathematics | 33 (82.5%) | 7 (17.5%) |
| Architecture & Engineering | 55 (100.0%) | 0 (0.0%) |
| Life, Physical & Social Science | 28 (63.6%) | 16 (36.4%) |
| Community & Social Service | 113 (43.8%) | 145 (56.2%) |
| Education, Arts & Media | 5 (15.6%) | 27 (84.4%) |
| Legal Services & Support | 15 (45.5%) | 18 (54.5%) |
| Education Instruction & Library | 66 (41.8%) | 92 (58.2%) |
| Arts, Media & Entertainment | 27 (77.1%) | 8 (22.9%) |
| Health Diagnosing & Treating | 25 (22.7%) | 85 (77.3%) |
| Health Technologists | 25 (38.5%) | 40 (61.5%) |
| Total (Category) | 533 (60.4%) | 349 (39.6%) |
| Total (Overall) | 714 (51.0%) | 686 (49.0%) |
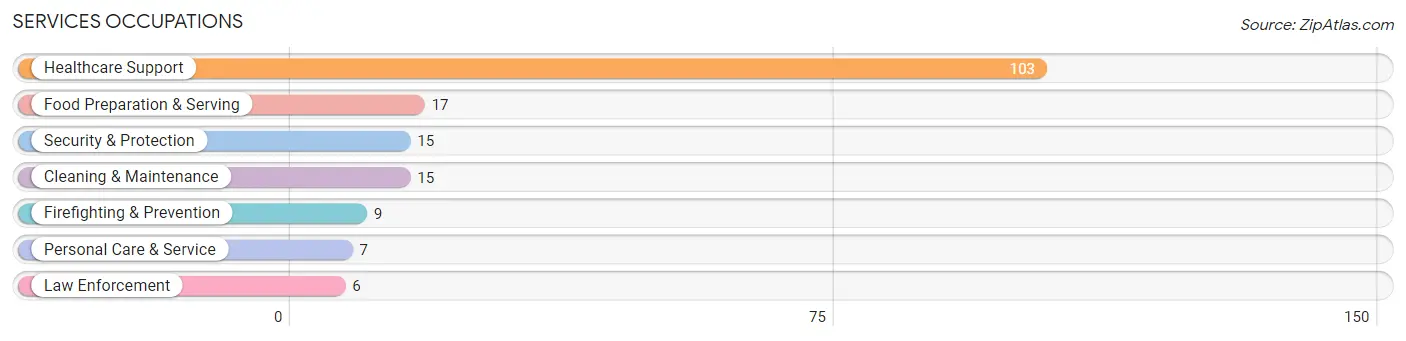
Services Occupations
The most common Services occupations in Guilford Center are Healthcare Support (103 | 7.4%), Food Preparation & Serving (17 | 1.2%), Security & Protection (15 | 1.1%), Cleaning & Maintenance (15 | 1.1%), and Firefighting & Prevention (9 | 0.6%).
Services Occupations by Sex
Within the Services occupations in Guilford Center, the most male-oriented occupations are Security & Protection (100.0%), Firefighting & Prevention (100.0%), and Law Enforcement (100.0%), while the most female-oriented occupations are Healthcare Support (100.0%), Cleaning & Maintenance (100.0%), and Personal Care & Service (100.0%).
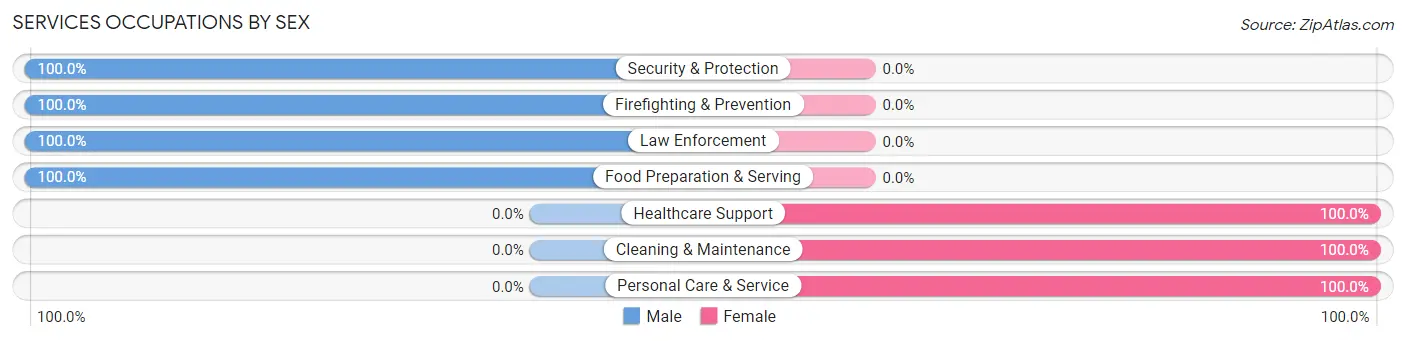
| Occupation | Male | Female |
| Healthcare Support | 0 (0.0%) | 103 (100.0%) |
| Security & Protection | 15 (100.0%) | 0 (0.0%) |
| Firefighting & Prevention | 9 (100.0%) | 0 (0.0%) |
| Law Enforcement | 6 (100.0%) | 0 (0.0%) |
| Food Preparation & Serving | 17 (100.0%) | 0 (0.0%) |
| Cleaning & Maintenance | 0 (0.0%) | 15 (100.0%) |
| Personal Care & Service | 0 (0.0%) | 7 (100.0%) |
| Total (Category) | 32 (20.4%) | 125 (79.6%) |
| Total (Overall) | 714 (51.0%) | 686 (49.0%) |
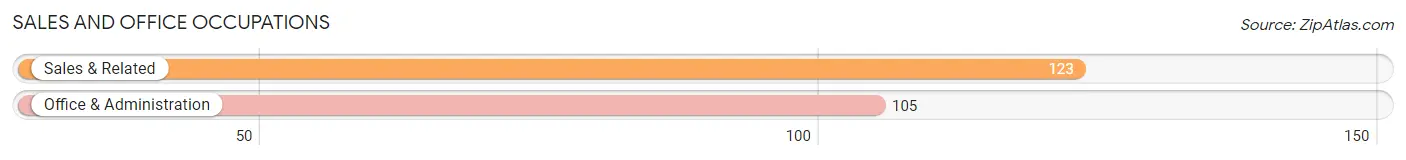
Sales and Office Occupations
The most common Sales and Office occupations in Guilford Center are Sales & Related (123 | 8.8%), and Office & Administration (105 | 7.5%).
Sales and Office Occupations by Sex
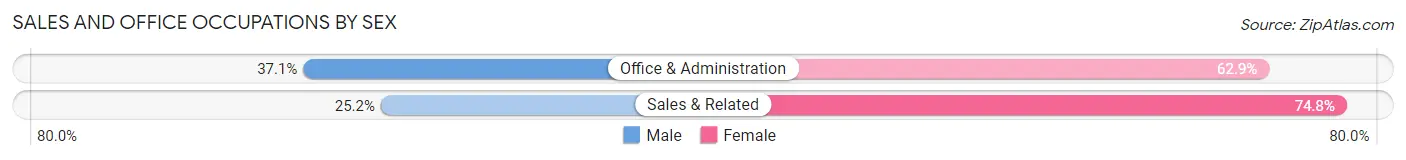
| Occupation | Male | Female |
| Sales & Related | 31 (25.2%) | 92 (74.8%) |
| Office & Administration | 39 (37.1%) | 66 (62.9%) |
| Total (Category) | 70 (30.7%) | 158 (69.3%) |
| Total (Overall) | 714 (51.0%) | 686 (49.0%) |
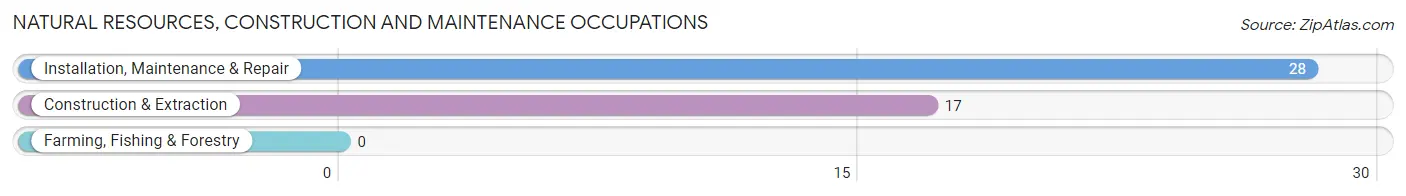
Natural Resources, Construction and Maintenance Occupations
The most common Natural Resources, Construction and Maintenance occupations in Guilford Center are Installation, Maintenance & Repair (28 | 2.0%), and Construction & Extraction (17 | 1.2%).
Natural Resources, Construction and Maintenance Occupations by Sex
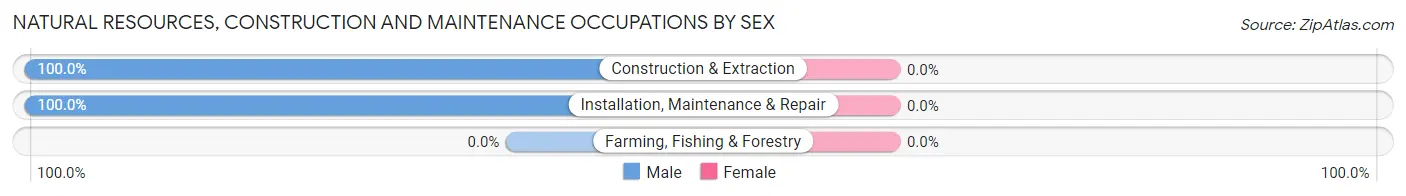
| Occupation | Male | Female |
| Farming, Fishing & Forestry | 0 (0.0%) | 0 (0.0%) |
| Construction & Extraction | 17 (100.0%) | 0 (0.0%) |
| Installation, Maintenance & Repair | 28 (100.0%) | 0 (0.0%) |
| Total (Category) | 45 (100.0%) | 0 (0.0%) |
| Total (Overall) | 714 (51.0%) | 686 (49.0%) |
Production, Transportation and Moving Occupations
The most common Production, Transportation and Moving occupations in Guilford Center are Transportation (51 | 3.6%), Material Moving (26 | 1.9%), and Production (11 | 0.8%).
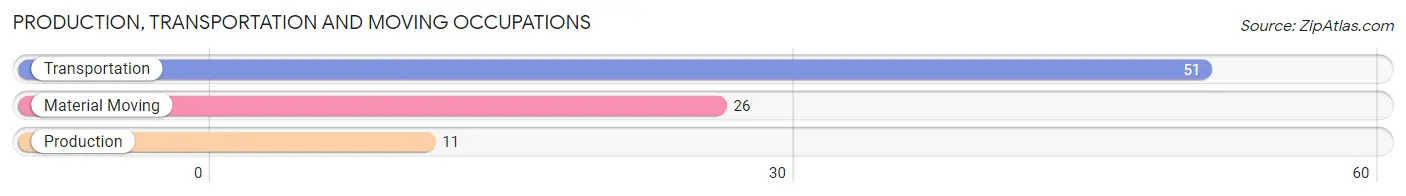
Production, Transportation and Moving Occupations by Sex
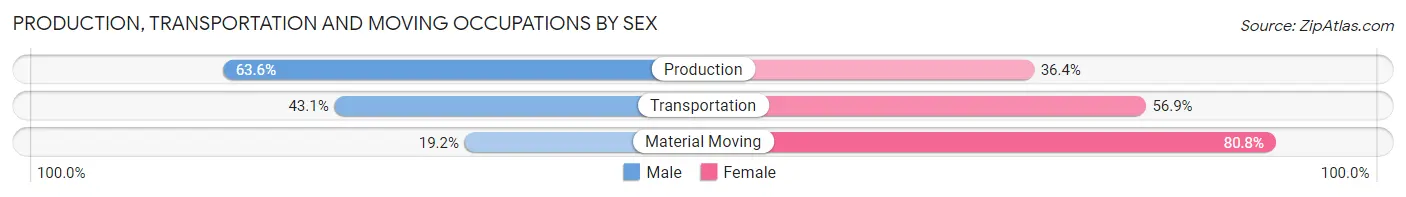
| Occupation | Male | Female |
| Production | 7 (63.6%) | 4 (36.4%) |
| Transportation | 22 (43.1%) | 29 (56.9%) |
| Material Moving | 5 (19.2%) | 21 (80.8%) |
| Total (Category) | 34 (38.6%) | 54 (61.4%) |
| Total (Overall) | 714 (51.0%) | 686 (49.0%) |
Employment Industries by Sex in Guilford Center
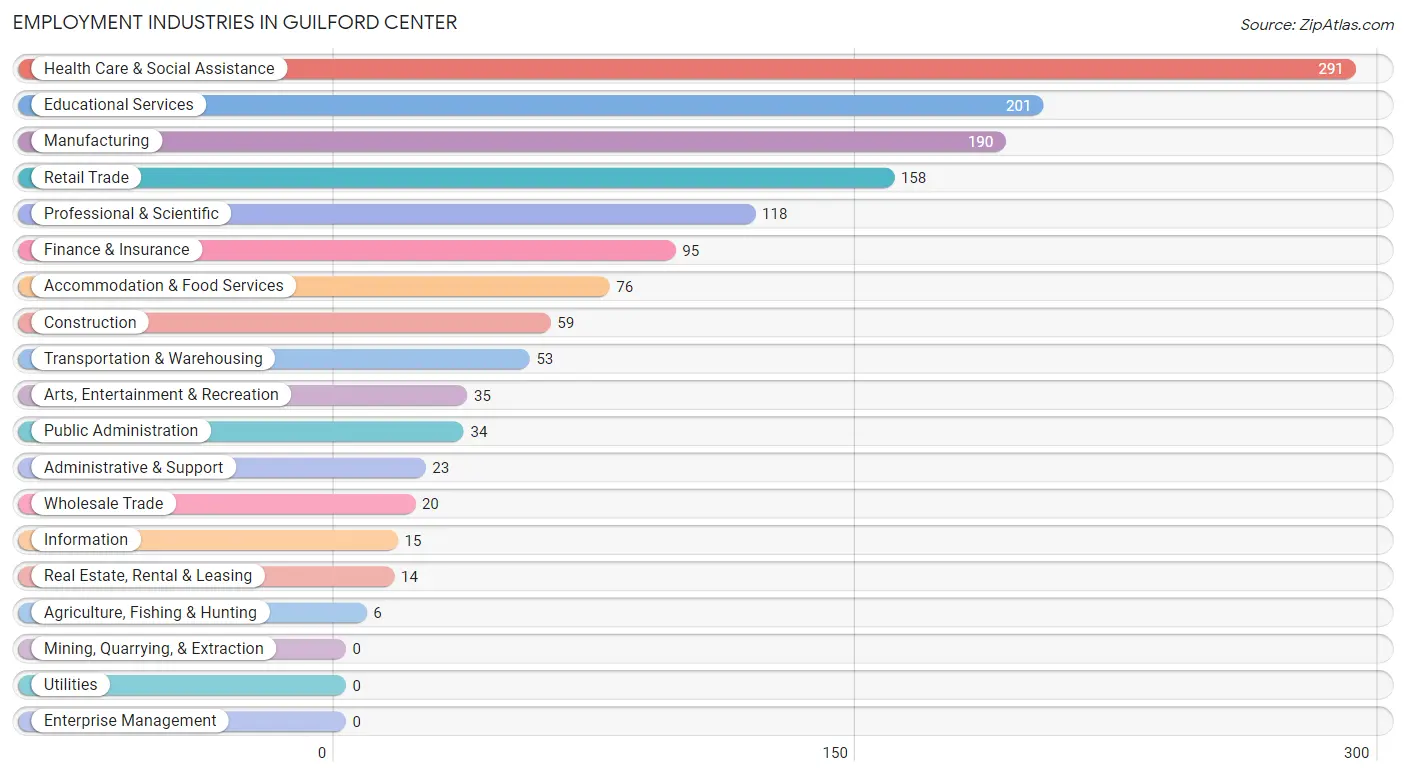
Employment Industries in Guilford Center
The major employment industries in Guilford Center include Health Care & Social Assistance (291 | 20.8%), Educational Services (201 | 14.4%), Manufacturing (190 | 13.6%), Retail Trade (158 | 11.3%), and Professional & Scientific (118 | 8.4%).
Employment Industries by Sex in Guilford Center
The Guilford Center industries that see more men than women are Agriculture, Fishing & Hunting (100.0%), Public Administration (100.0%), and Construction (89.8%), whereas the industries that tend to have a higher number of women are Wholesale Trade (100.0%), Administrative & Support (100.0%), and Health Care & Social Assistance (81.1%).
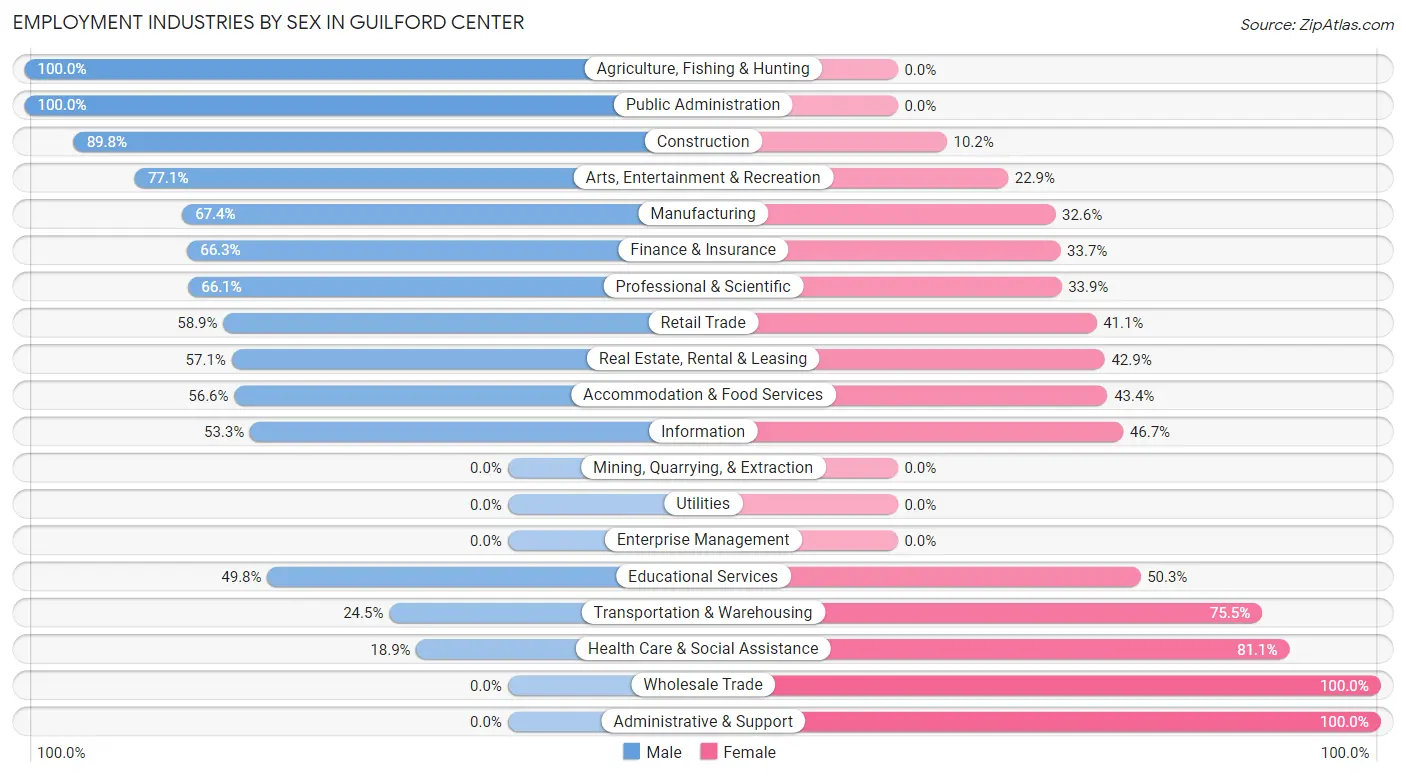
| Industry | Male | Female |
| Agriculture, Fishing & Hunting | 6 (100.0%) | 0 (0.0%) |
| Mining, Quarrying, & Extraction | 0 (0.0%) | 0 (0.0%) |
| Construction | 53 (89.8%) | 6 (10.2%) |
| Manufacturing | 128 (67.4%) | 62 (32.6%) |
| Wholesale Trade | 0 (0.0%) | 20 (100.0%) |
| Retail Trade | 93 (58.9%) | 65 (41.1%) |
| Transportation & Warehousing | 13 (24.5%) | 40 (75.5%) |
| Utilities | 0 (0.0%) | 0 (0.0%) |
| Information | 8 (53.3%) | 7 (46.7%) |
| Finance & Insurance | 63 (66.3%) | 32 (33.7%) |
| Real Estate, Rental & Leasing | 8 (57.1%) | 6 (42.9%) |
| Professional & Scientific | 78 (66.1%) | 40 (33.9%) |
| Enterprise Management | 0 (0.0%) | 0 (0.0%) |
| Administrative & Support | 0 (0.0%) | 23 (100.0%) |
| Educational Services | 100 (49.7%) | 101 (50.2%) |
| Health Care & Social Assistance | 55 (18.9%) | 236 (81.1%) |
| Arts, Entertainment & Recreation | 27 (77.1%) | 8 (22.9%) |
| Accommodation & Food Services | 43 (56.6%) | 33 (43.4%) |
| Public Administration | 34 (100.0%) | 0 (0.0%) |
| Total | 714 (51.0%) | 686 (49.0%) |
Education in Guilford Center
School Enrollment in Guilford Center
The most common levels of schooling among the 531 students in Guilford Center are high school (179 | 33.7%), college / undergraduate (111 | 20.9%), and elementary school (109 | 20.5%).
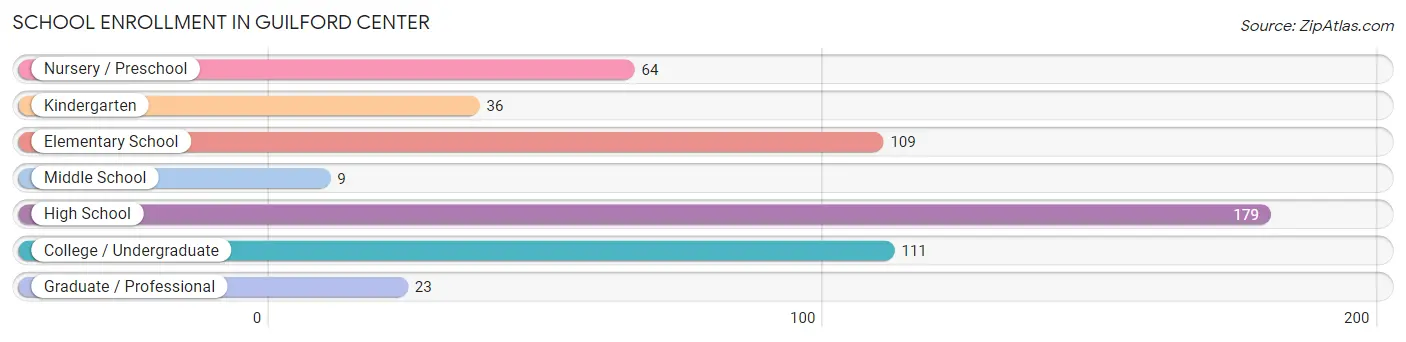
| School Level | # Students | % Students |
| Nursery / Preschool | 64 | 12.0% |
| Kindergarten | 36 | 6.8% |
| Elementary School | 109 | 20.5% |
| Middle School | 9 | 1.7% |
| High School | 179 | 33.7% |
| College / Undergraduate | 111 | 20.9% |
| Graduate / Professional | 23 | 4.3% |
| Total | 531 | 100.0% |
School Enrollment by Age by Funding Source in Guilford Center
Out of a total of 531 students who are enrolled in schools in Guilford Center, 120 (22.6%) attend a private institution, while the remaining 411 (77.4%) are enrolled in public schools. The age group of 25 to 34 year olds has the highest likelihood of being enrolled in private schools, with 35 (66.0% in the age bracket) enrolled. Conversely, the age group of 5 to 9 year old has the lowest likelihood of being enrolled in a private school, with 133 (100.0% in the age bracket) attending a public institution.
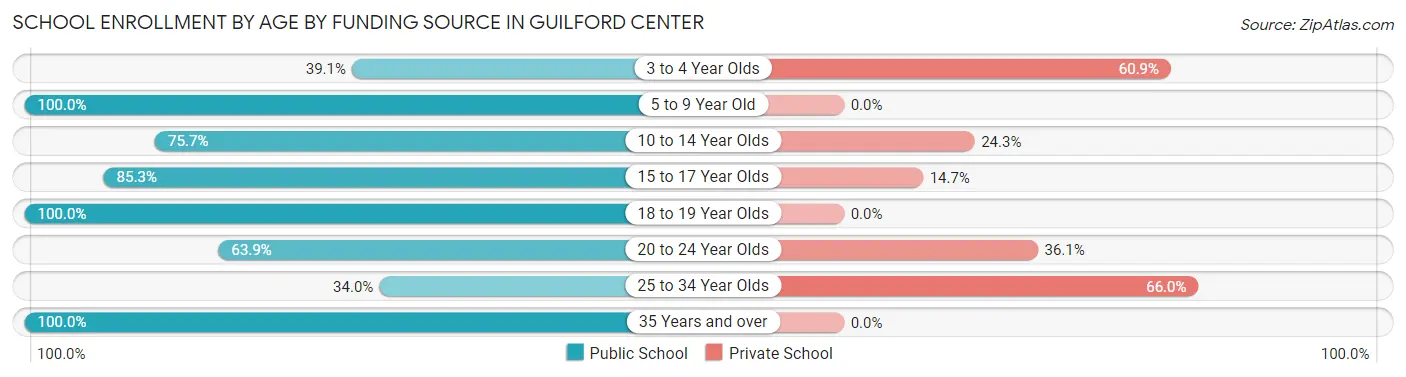
| Age Bracket | Public School | Private School |
| 3 to 4 Year Olds | 25 (39.1%) | 39 (60.9%) |
| 5 to 9 Year Old | 133 (100.0%) | 0 (0.0%) |
| 10 to 14 Year Olds | 28 (75.7%) | 9 (24.3%) |
| 15 to 17 Year Olds | 139 (85.3%) | 24 (14.7%) |
| 18 to 19 Year Olds | 12 (100.0%) | 0 (0.0%) |
| 20 to 24 Year Olds | 23 (63.9%) | 13 (36.1%) |
| 25 to 34 Year Olds | 18 (34.0%) | 35 (66.0%) |
| 35 Years and over | 33 (100.0%) | 0 (0.0%) |
| Total | 411 (77.4%) | 120 (22.6%) |
Educational Attainment by Field of Study in Guilford Center
Education (154 | 12.9%), business (137 | 11.5%), social sciences (123 | 10.3%), computers & mathematics (109 | 9.1%), and visual & performing arts (100 | 8.4%) are the most common fields of study among 1,191 individuals in Guilford Center who have obtained a bachelor's degree or higher.
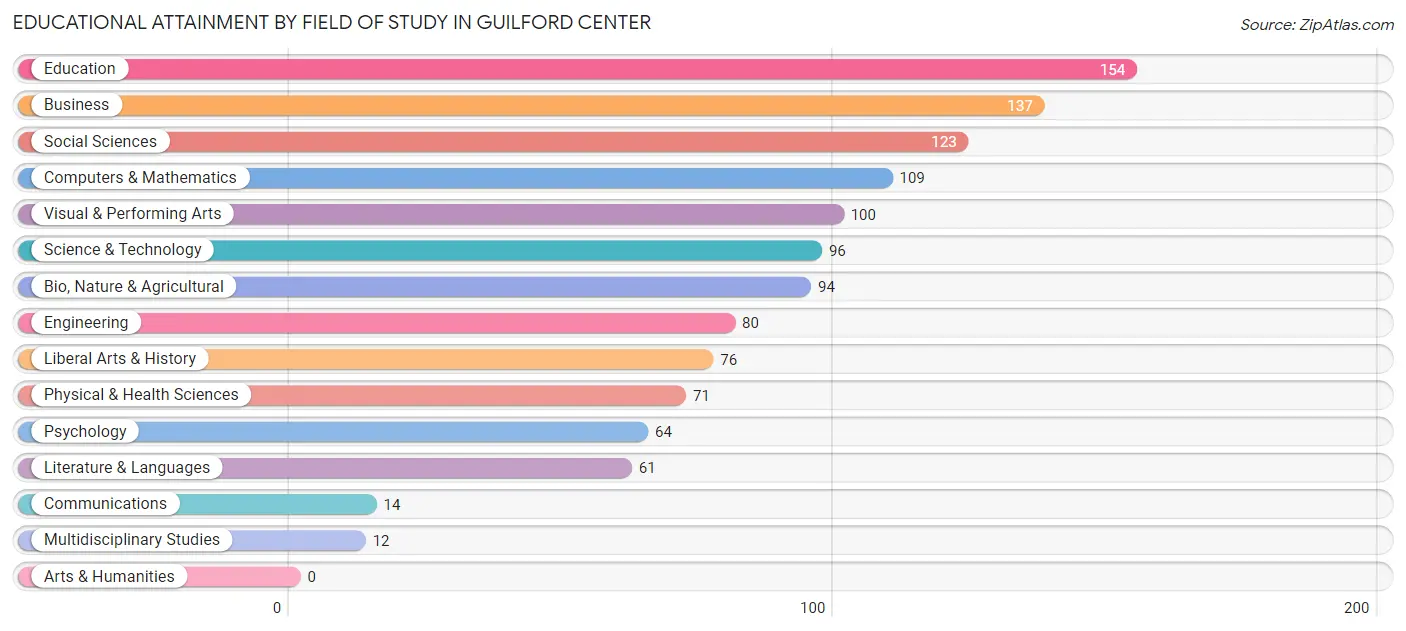
| Field of Study | # Graduates | % Graduates |
| Computers & Mathematics | 109 | 9.1% |
| Bio, Nature & Agricultural | 94 | 7.9% |
| Physical & Health Sciences | 71 | 6.0% |
| Psychology | 64 | 5.4% |
| Social Sciences | 123 | 10.3% |
| Engineering | 80 | 6.7% |
| Multidisciplinary Studies | 12 | 1.0% |
| Science & Technology | 96 | 8.1% |
| Business | 137 | 11.5% |
| Education | 154 | 12.9% |
| Literature & Languages | 61 | 5.1% |
| Liberal Arts & History | 76 | 6.4% |
| Visual & Performing Arts | 100 | 8.4% |
| Communications | 14 | 1.2% |
| Arts & Humanities | 0 | 0.0% |
| Total | 1,191 | 100.0% |
Transportation & Commute in Guilford Center
Vehicle Availability by Sex in Guilford Center
The most prevalent vehicle ownership categories in Guilford Center are males with 2 vehicles (444, accounting for 62.2%) and females with 2 vehicles (331, making up 66.0%).
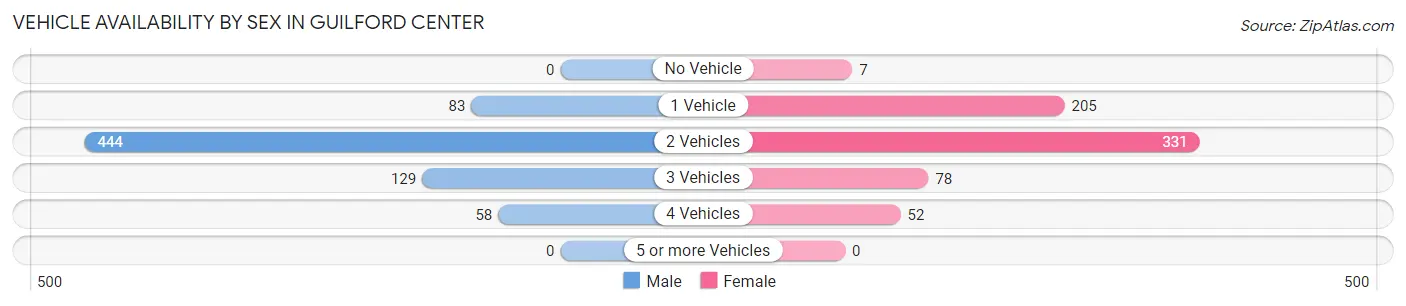
| Vehicles Available | Male | Female |
| No Vehicle | 0 (0.0%) | 7 (1.0%) |
| 1 Vehicle | 83 (11.6%) | 205 (30.5%) |
| 2 Vehicles | 444 (62.2%) | 331 (49.2%) |
| 3 Vehicles | 129 (18.1%) | 78 (11.6%) |
| 4 Vehicles | 58 (8.1%) | 52 (7.7%) |
| 5 or more Vehicles | 0 (0.0%) | 0 (0.0%) |
| Total | 714 (100.0%) | 673 (100.0%) |
Commute Time in Guilford Center
The most frequently occuring commute durations in Guilford Center are 20 to 24 minutes (230 commuters, 18.9%), 30 to 34 minutes (185 commuters, 15.2%), and 5 to 9 minutes (179 commuters, 14.7%).
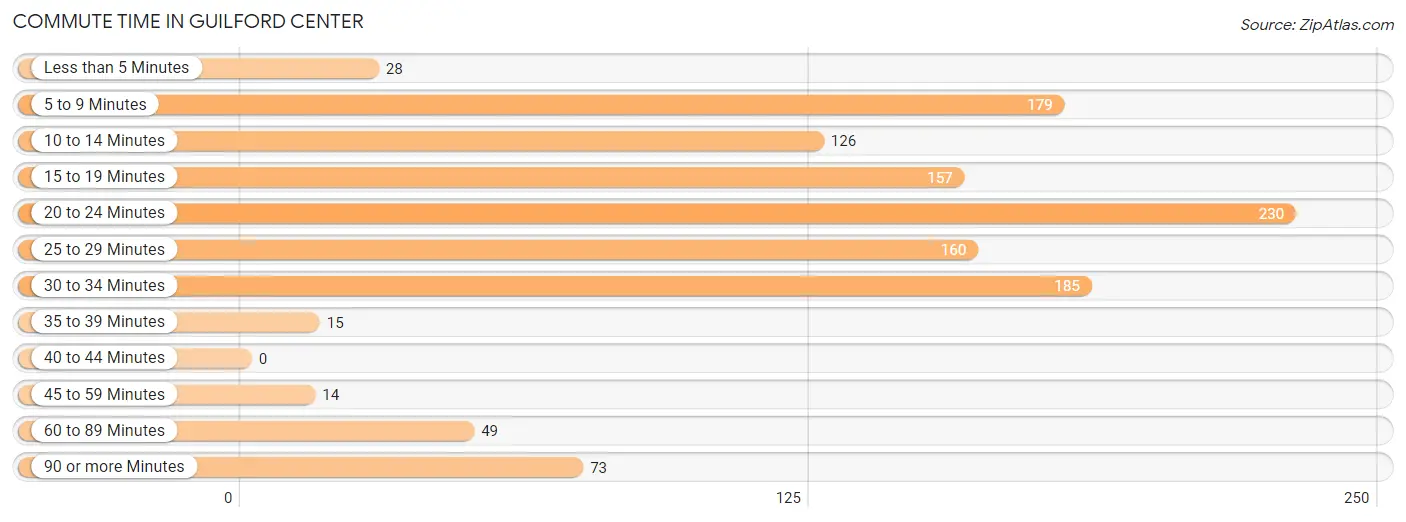
| Commute Time | # Commuters | % Commuters |
| Less than 5 Minutes | 28 | 2.3% |
| 5 to 9 Minutes | 179 | 14.7% |
| 10 to 14 Minutes | 126 | 10.4% |
| 15 to 19 Minutes | 157 | 12.9% |
| 20 to 24 Minutes | 230 | 18.9% |
| 25 to 29 Minutes | 160 | 13.2% |
| 30 to 34 Minutes | 185 | 15.2% |
| 35 to 39 Minutes | 15 | 1.2% |
| 40 to 44 Minutes | 0 | 0.0% |
| 45 to 59 Minutes | 14 | 1.1% |
| 60 to 89 Minutes | 49 | 4.0% |
| 90 or more Minutes | 73 | 6.0% |
Commute Time by Sex in Guilford Center
The most common commute times in Guilford Center are 20 to 24 minutes (104 commuters, 16.5%) for males and 20 to 24 minutes (126 commuters, 21.5%) for females.
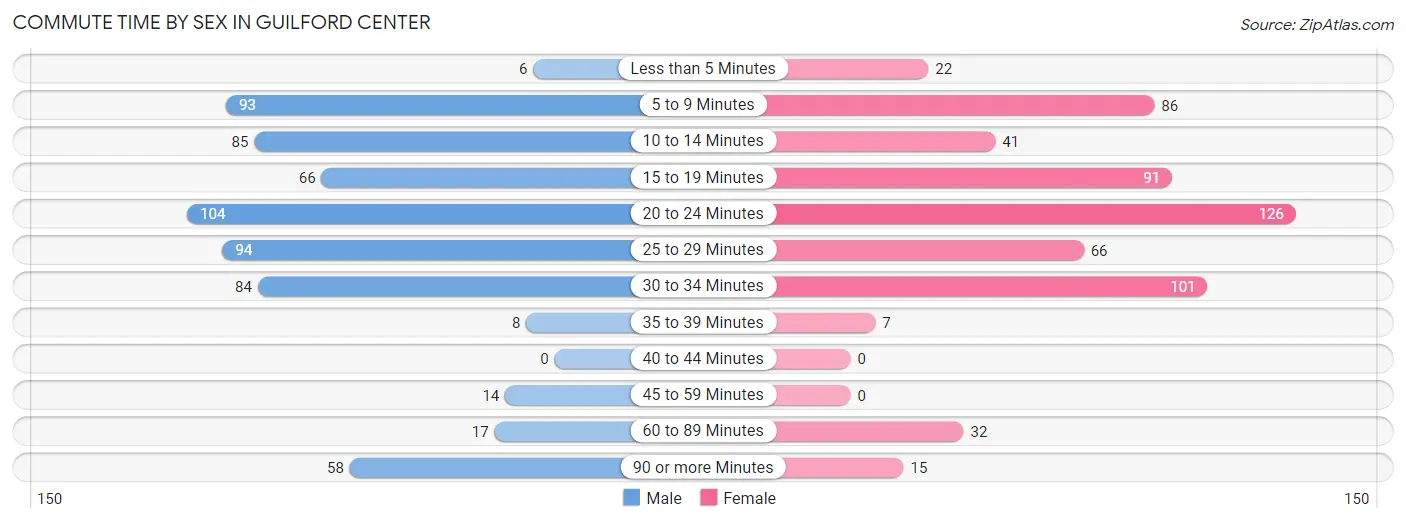
| Commute Time | Male | Female |
| Less than 5 Minutes | 6 (0.9%) | 22 (3.7%) |
| 5 to 9 Minutes | 93 (14.8%) | 86 (14.6%) |
| 10 to 14 Minutes | 85 (13.5%) | 41 (7.0%) |
| 15 to 19 Minutes | 66 (10.5%) | 91 (15.5%) |
| 20 to 24 Minutes | 104 (16.5%) | 126 (21.5%) |
| 25 to 29 Minutes | 94 (14.9%) | 66 (11.2%) |
| 30 to 34 Minutes | 84 (13.4%) | 101 (17.2%) |
| 35 to 39 Minutes | 8 (1.3%) | 7 (1.2%) |
| 40 to 44 Minutes | 0 (0.0%) | 0 (0.0%) |
| 45 to 59 Minutes | 14 (2.2%) | 0 (0.0%) |
| 60 to 89 Minutes | 17 (2.7%) | 32 (5.4%) |
| 90 or more Minutes | 58 (9.2%) | 15 (2.6%) |
Time of Departure to Work by Sex in Guilford Center
The most frequent times of departure to work in Guilford Center are 7:00 AM to 7:29 AM (185, 29.4%) for males and 9:00 AM to 9:59 AM (121, 20.6%) for females.
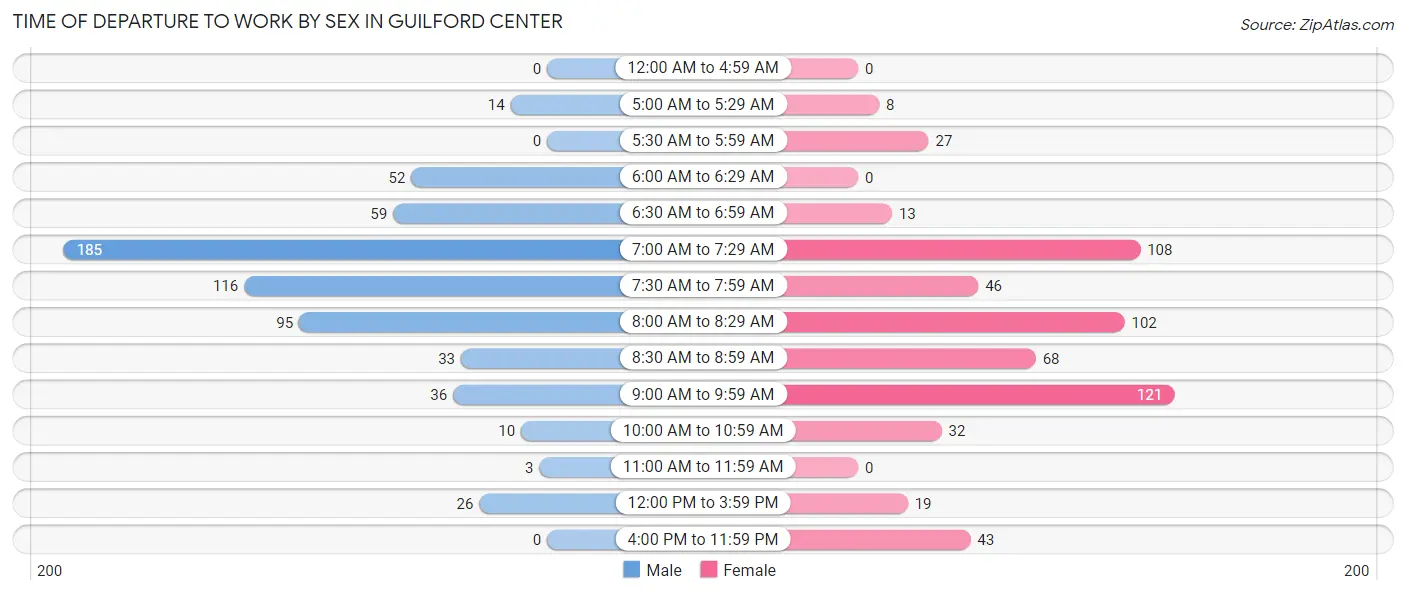
| Time of Departure | Male | Female |
| 12:00 AM to 4:59 AM | 0 (0.0%) | 0 (0.0%) |
| 5:00 AM to 5:29 AM | 14 (2.2%) | 8 (1.4%) |
| 5:30 AM to 5:59 AM | 0 (0.0%) | 27 (4.6%) |
| 6:00 AM to 6:29 AM | 52 (8.3%) | 0 (0.0%) |
| 6:30 AM to 6:59 AM | 59 (9.4%) | 13 (2.2%) |
| 7:00 AM to 7:29 AM | 185 (29.4%) | 108 (18.4%) |
| 7:30 AM to 7:59 AM | 116 (18.4%) | 46 (7.8%) |
| 8:00 AM to 8:29 AM | 95 (15.1%) | 102 (17.4%) |
| 8:30 AM to 8:59 AM | 33 (5.2%) | 68 (11.6%) |
| 9:00 AM to 9:59 AM | 36 (5.7%) | 121 (20.6%) |
| 10:00 AM to 10:59 AM | 10 (1.6%) | 32 (5.4%) |
| 11:00 AM to 11:59 AM | 3 (0.5%) | 0 (0.0%) |
| 12:00 PM to 3:59 PM | 26 (4.1%) | 19 (3.2%) |
| 4:00 PM to 11:59 PM | 0 (0.0%) | 43 (7.3%) |
| Total | 629 (100.0%) | 587 (100.0%) |
Housing Occupancy in Guilford Center
Occupancy by Ownership in Guilford Center
Of the total 1,241 dwellings in Guilford Center, owner-occupied units account for 820 (66.1%), while renter-occupied units make up 421 (33.9%).
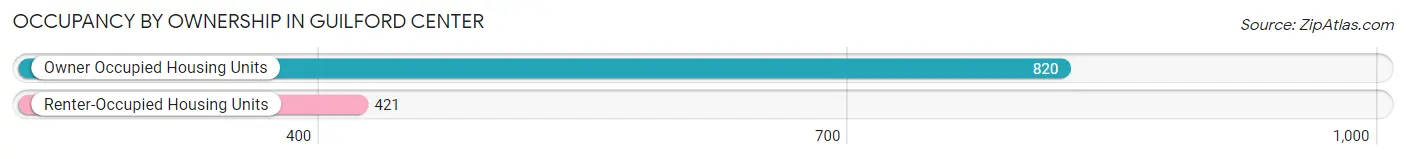
| Occupancy | # Housing Units | % Housing Units |
| Owner Occupied Housing Units | 820 | 66.1% |
| Renter-Occupied Housing Units | 421 | 33.9% |
| Total Occupied Housing Units | 1,241 | 100.0% |
Occupancy by Household Size in Guilford Center
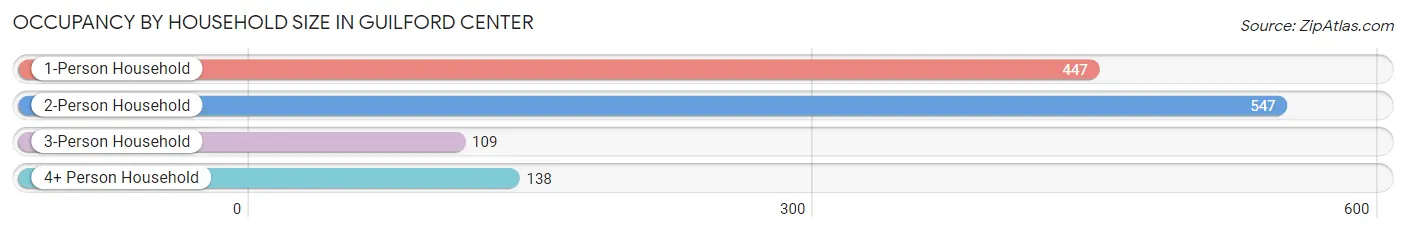
| Household Size | # Housing Units | % Housing Units |
| 1-Person Household | 447 | 36.0% |
| 2-Person Household | 547 | 44.1% |
| 3-Person Household | 109 | 8.8% |
| 4+ Person Household | 138 | 11.1% |
| Total Housing Units | 1,241 | 100.0% |
Occupancy by Ownership by Household Size in Guilford Center
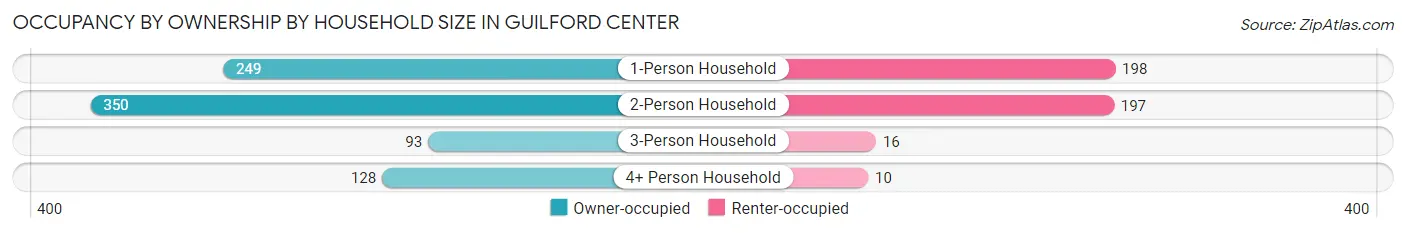
| Household Size | Owner-occupied | Renter-occupied |
| 1-Person Household | 249 (55.7%) | 198 (44.3%) |
| 2-Person Household | 350 (64.0%) | 197 (36.0%) |
| 3-Person Household | 93 (85.3%) | 16 (14.7%) |
| 4+ Person Household | 128 (92.7%) | 10 (7.2%) |
| Total Housing Units | 820 (66.1%) | 421 (33.9%) |
Occupancy by Educational Attainment in Guilford Center
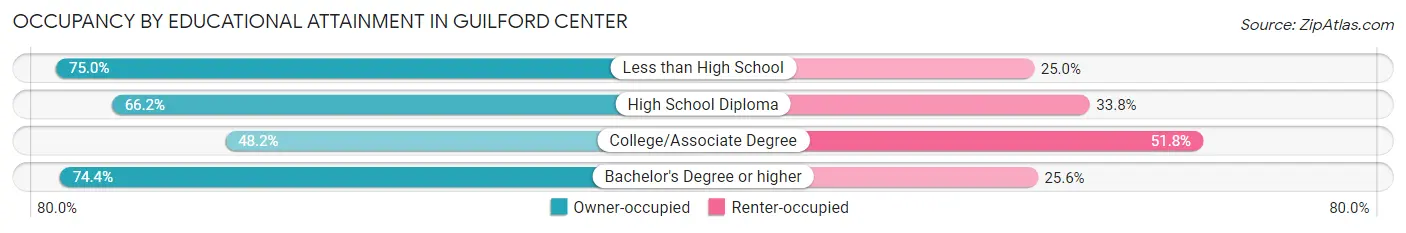
| Household Size | Owner-occupied | Renter-occupied |
| Less than High School | 15 (75.0%) | 5 (25.0%) |
| High School Diploma | 137 (66.2%) | 70 (33.8%) |
| College/Associate Degree | 159 (48.2%) | 171 (51.8%) |
| Bachelor's Degree or higher | 509 (74.4%) | 175 (25.6%) |
Occupancy by Age of Householder in Guilford Center
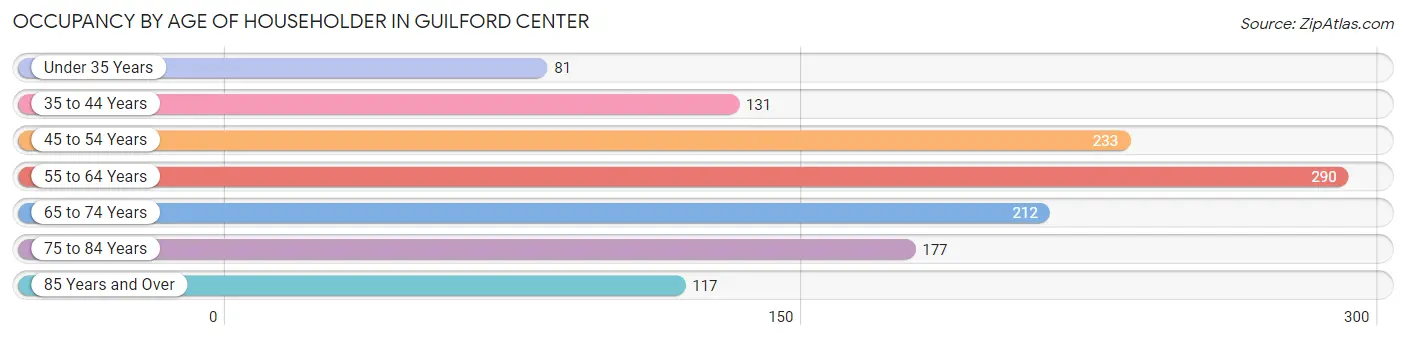
| Age Bracket | # Households | % Households |
| Under 35 Years | 81 | 6.5% |
| 35 to 44 Years | 131 | 10.6% |
| 45 to 54 Years | 233 | 18.8% |
| 55 to 64 Years | 290 | 23.4% |
| 65 to 74 Years | 212 | 17.1% |
| 75 to 84 Years | 177 | 14.3% |
| 85 Years and Over | 117 | 9.4% |
| Total | 1,241 | 100.0% |
Housing Finances in Guilford Center
Median Income by Occupancy in Guilford Center
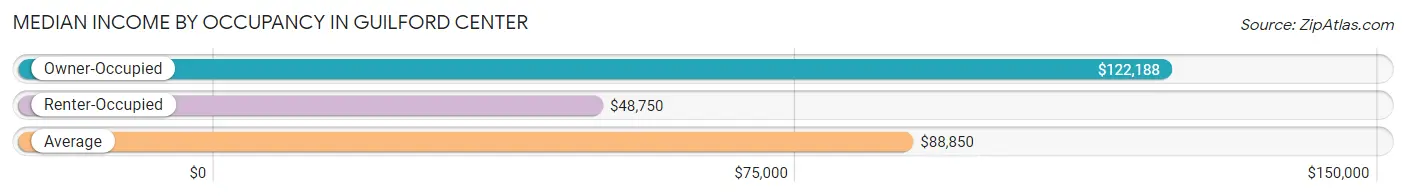
| Occupancy Type | # Households | Median Income |
| Owner-Occupied | 820 (66.1%) | $122,188 |
| Renter-Occupied | 421 (33.9%) | $48,750 |
| Average | 1,241 (100.0%) | $88,850 |
Occupancy by Householder Income Bracket in Guilford Center
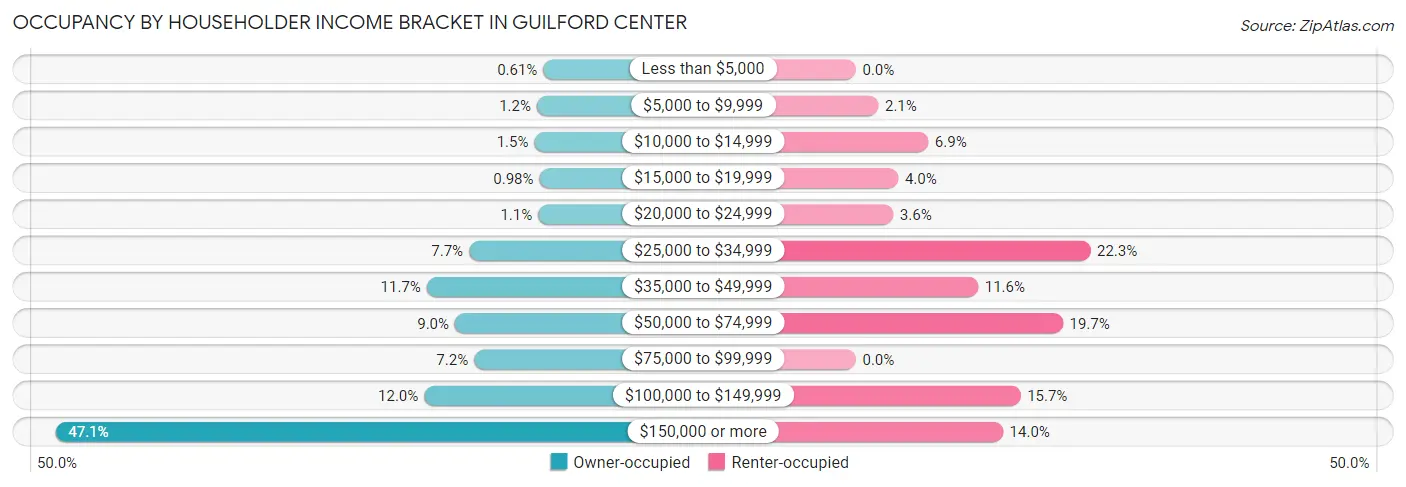
| Income Bracket | Owner-occupied | Renter-occupied |
| Less than $5,000 | 5 (0.6%) | 0 (0.0%) |
| $5,000 to $9,999 | 10 (1.2%) | 9 (2.1%) |
| $10,000 to $14,999 | 12 (1.5%) | 29 (6.9%) |
| $15,000 to $19,999 | 8 (1.0%) | 17 (4.0%) |
| $20,000 to $24,999 | 9 (1.1%) | 15 (3.6%) |
| $25,000 to $34,999 | 63 (7.7%) | 94 (22.3%) |
| $35,000 to $49,999 | 96 (11.7%) | 49 (11.6%) |
| $50,000 to $74,999 | 74 (9.0%) | 83 (19.7%) |
| $75,000 to $99,999 | 59 (7.2%) | 0 (0.0%) |
| $100,000 to $149,999 | 98 (11.9%) | 66 (15.7%) |
| $150,000 or more | 386 (47.1%) | 59 (14.0%) |
| Total | 820 (100.0%) | 421 (100.0%) |
Monthly Housing Cost Tiers in Guilford Center
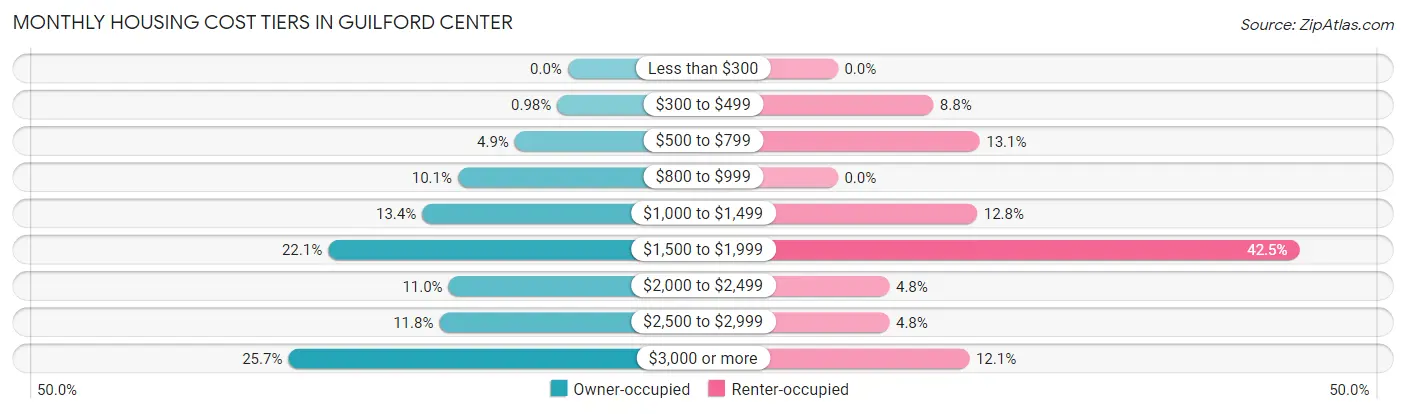
| Monthly Cost | Owner-occupied | Renter-occupied |
| Less than $300 | 0 (0.0%) | 0 (0.0%) |
| $300 to $499 | 8 (1.0%) | 37 (8.8%) |
| $500 to $799 | 40 (4.9%) | 55 (13.1%) |
| $800 to $999 | 83 (10.1%) | 0 (0.0%) |
| $1,000 to $1,499 | 110 (13.4%) | 54 (12.8%) |
| $1,500 to $1,999 | 181 (22.1%) | 179 (42.5%) |
| $2,000 to $2,499 | 90 (11.0%) | 20 (4.8%) |
| $2,500 to $2,999 | 97 (11.8%) | 20 (4.8%) |
| $3,000 or more | 211 (25.7%) | 51 (12.1%) |
| Total | 820 (100.0%) | 421 (100.0%) |
Physical Housing Characteristics in Guilford Center
Housing Structures in Guilford Center
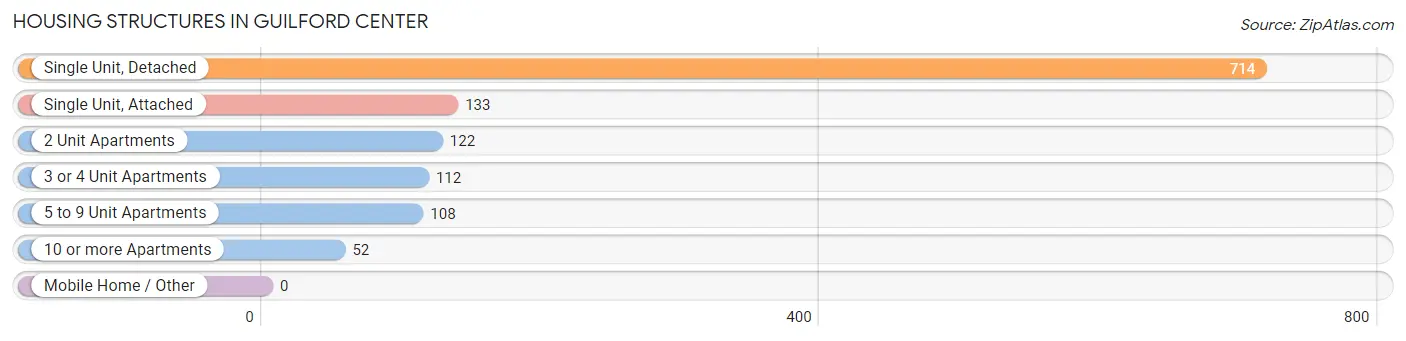
| Structure Type | # Housing Units | % Housing Units |
| Single Unit, Detached | 714 | 57.5% |
| Single Unit, Attached | 133 | 10.7% |
| 2 Unit Apartments | 122 | 9.8% |
| 3 or 4 Unit Apartments | 112 | 9.0% |
| 5 to 9 Unit Apartments | 108 | 8.7% |
| 10 or more Apartments | 52 | 4.2% |
| Mobile Home / Other | 0 | 0.0% |
| Total | 1,241 | 100.0% |
Housing Structures by Occupancy in Guilford Center
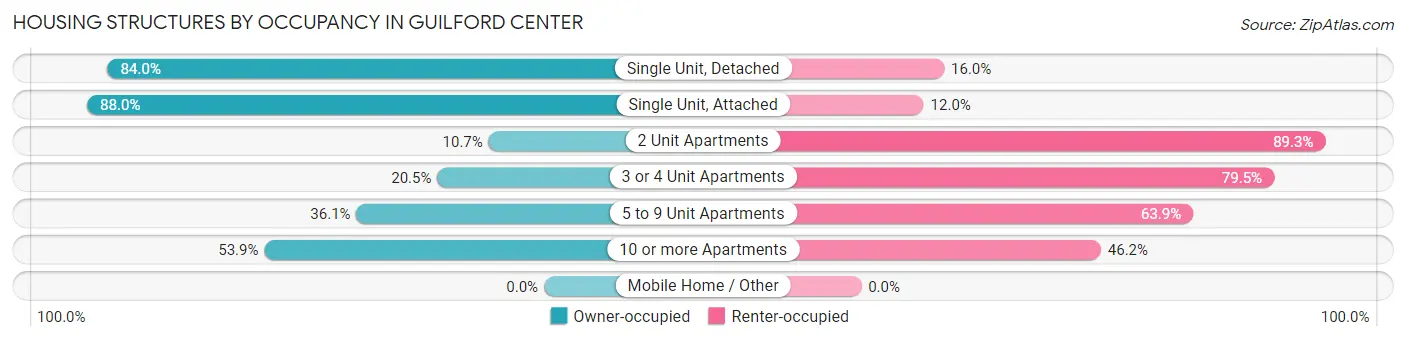
| Structure Type | Owner-occupied | Renter-occupied |
| Single Unit, Detached | 600 (84.0%) | 114 (16.0%) |
| Single Unit, Attached | 117 (88.0%) | 16 (12.0%) |
| 2 Unit Apartments | 13 (10.7%) | 109 (89.3%) |
| 3 or 4 Unit Apartments | 23 (20.5%) | 89 (79.5%) |
| 5 to 9 Unit Apartments | 39 (36.1%) | 69 (63.9%) |
| 10 or more Apartments | 28 (53.8%) | 24 (46.2%) |
| Mobile Home / Other | 0 (0.0%) | 0 (0.0%) |
| Total | 820 (66.1%) | 421 (33.9%) |
Housing Structures by Number of Rooms in Guilford Center
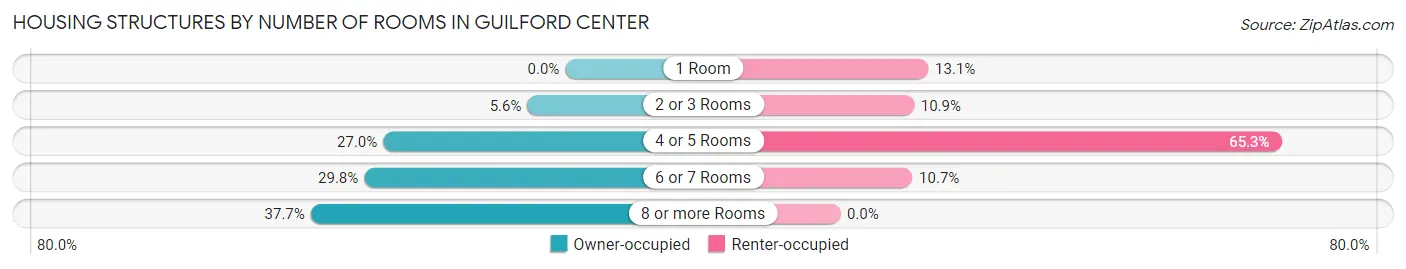
| Number of Rooms | Owner-occupied | Renter-occupied |
| 1 Room | 0 (0.0%) | 55 (13.1%) |
| 2 or 3 Rooms | 46 (5.6%) | 46 (10.9%) |
| 4 or 5 Rooms | 221 (27.0%) | 275 (65.3%) |
| 6 or 7 Rooms | 244 (29.8%) | 45 (10.7%) |
| 8 or more Rooms | 309 (37.7%) | 0 (0.0%) |
| Total | 820 (100.0%) | 421 (100.0%) |
Housing Structure by Heating Type in Guilford Center
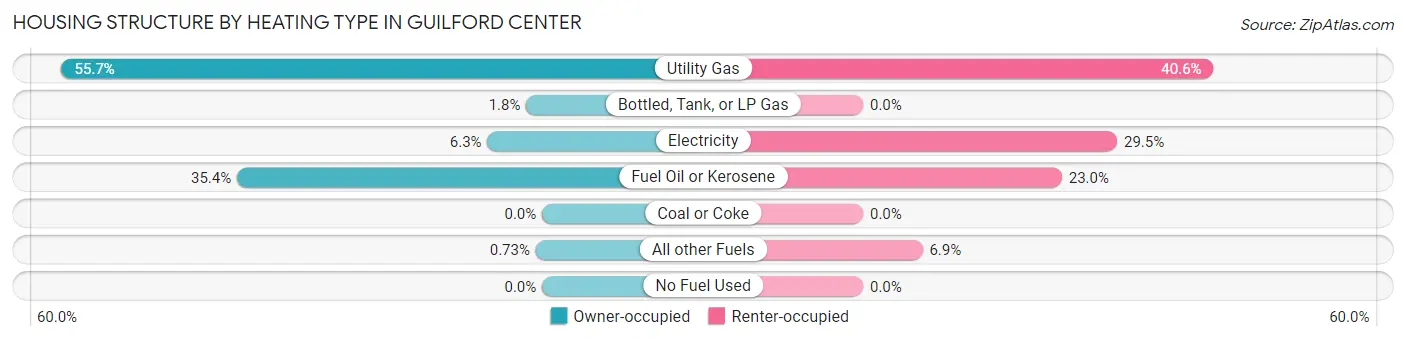
| Heating Type | Owner-occupied | Renter-occupied |
| Utility Gas | 457 (55.7%) | 171 (40.6%) |
| Bottled, Tank, or LP Gas | 15 (1.8%) | 0 (0.0%) |
| Electricity | 52 (6.3%) | 124 (29.4%) |
| Fuel Oil or Kerosene | 290 (35.4%) | 97 (23.0%) |
| Coal or Coke | 0 (0.0%) | 0 (0.0%) |
| All other Fuels | 6 (0.7%) | 29 (6.9%) |
| No Fuel Used | 0 (0.0%) | 0 (0.0%) |
| Total | 820 (100.0%) | 421 (100.0%) |
Household Vehicle Usage in Guilford Center
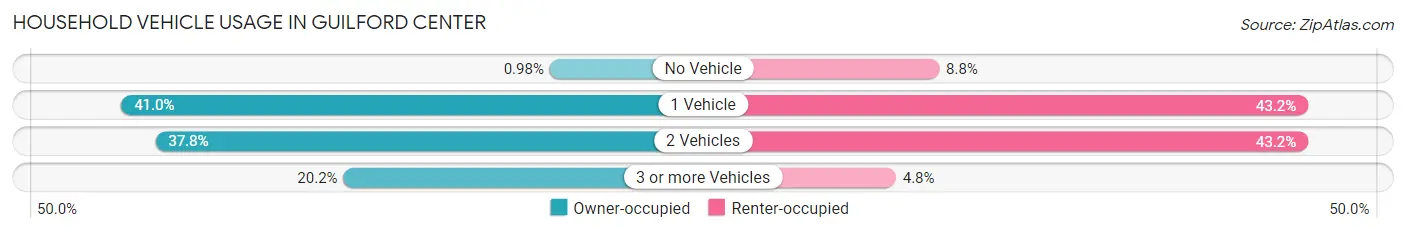
| Vehicles per Household | Owner-occupied | Renter-occupied |
| No Vehicle | 8 (1.0%) | 37 (8.8%) |
| 1 Vehicle | 336 (41.0%) | 182 (43.2%) |
| 2 Vehicles | 310 (37.8%) | 182 (43.2%) |
| 3 or more Vehicles | 166 (20.2%) | 20 (4.8%) |
| Total | 820 (100.0%) | 421 (100.0%) |
Real Estate & Mortgages in Guilford Center
Real Estate and Mortgage Overview in Guilford Center
| Characteristic | Without Mortgage | With Mortgage |
| Housing Units | 394 | 426 |
| Median Property Value | $488,200 | $638,600 |
| Median Household Income | $147,500 | $189 |
| Monthly Housing Costs | $1,329 | $206 |
| Real Estate Taxes | $9,183 | $20 |
Property Value by Mortgage Status in Guilford Center
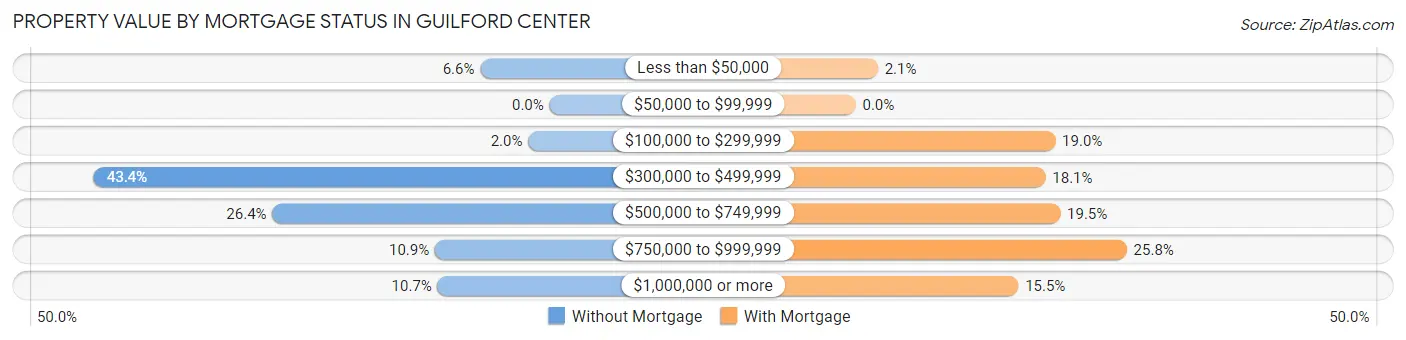
| Property Value | Without Mortgage | With Mortgage |
| Less than $50,000 | 26 (6.6%) | 9 (2.1%) |
| $50,000 to $99,999 | 0 (0.0%) | 0 (0.0%) |
| $100,000 to $299,999 | 8 (2.0%) | 81 (19.0%) |
| $300,000 to $499,999 | 171 (43.4%) | 77 (18.1%) |
| $500,000 to $749,999 | 104 (26.4%) | 83 (19.5%) |
| $750,000 to $999,999 | 43 (10.9%) | 110 (25.8%) |
| $1,000,000 or more | 42 (10.7%) | 66 (15.5%) |
| Total | 394 (100.0%) | 426 (100.0%) |
Household Income by Mortgage Status in Guilford Center
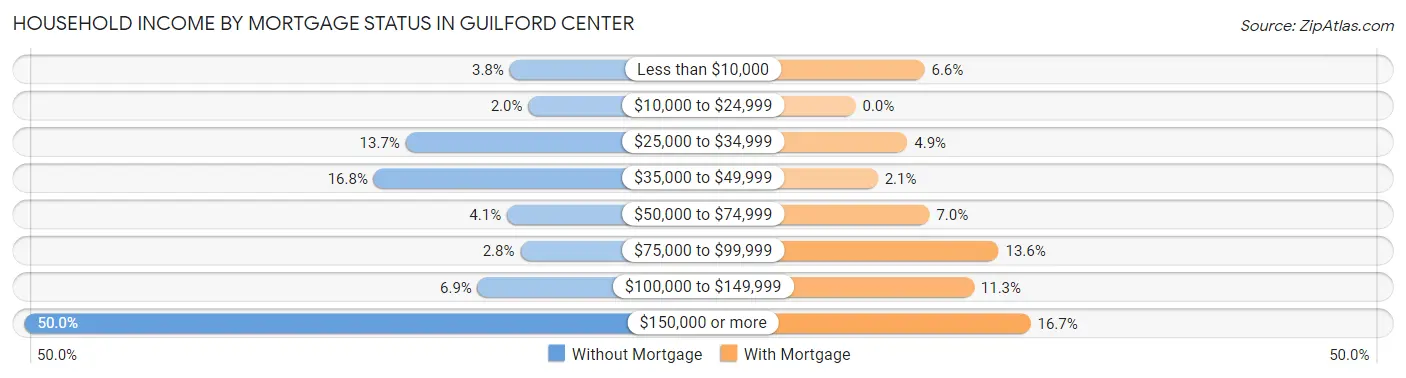
| Household Income | Without Mortgage | With Mortgage |
| Less than $10,000 | 15 (3.8%) | 28 (6.6%) |
| $10,000 to $24,999 | 8 (2.0%) | 0 (0.0%) |
| $25,000 to $34,999 | 54 (13.7%) | 21 (4.9%) |
| $35,000 to $49,999 | 66 (16.8%) | 9 (2.1%) |
| $50,000 to $74,999 | 16 (4.1%) | 30 (7.0%) |
| $75,000 to $99,999 | 11 (2.8%) | 58 (13.6%) |
| $100,000 to $149,999 | 27 (6.9%) | 48 (11.3%) |
| $150,000 or more | 197 (50.0%) | 71 (16.7%) |
| Total | 394 (100.0%) | 426 (100.0%) |
Property Value to Household Income Ratio in Guilford Center
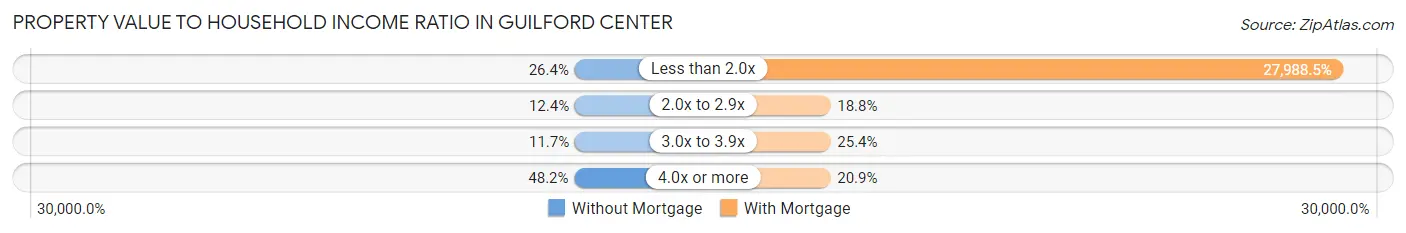
| Value-to-Income Ratio | Without Mortgage | With Mortgage |
| Less than 2.0x | 104 (26.4%) | 119,231 (27,988.5%) |
| 2.0x to 2.9x | 49 (12.4%) | 80 (18.8%) |
| 3.0x to 3.9x | 46 (11.7%) | 108 (25.4%) |
| 4.0x or more | 190 (48.2%) | 89 (20.9%) |
| Total | 394 (100.0%) | 426 (100.0%) |
Real Estate Taxes by Mortgage Status in Guilford Center
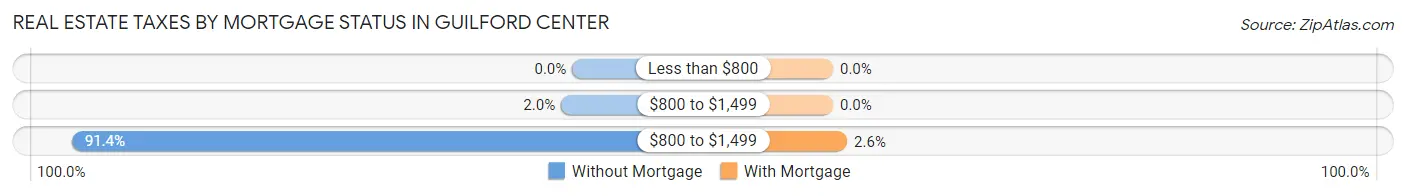
| Property Taxes | Without Mortgage | With Mortgage |
| Less than $800 | 0 (0.0%) | 0 (0.0%) |
| $800 to $1,499 | 8 (2.0%) | 0 (0.0%) |
| $800 to $1,499 | 360 (91.4%) | 11 (2.6%) |
| Total | 394 (100.0%) | 426 (100.0%) |
Health & Disability in Guilford Center
Health Insurance Coverage by Age in Guilford Center
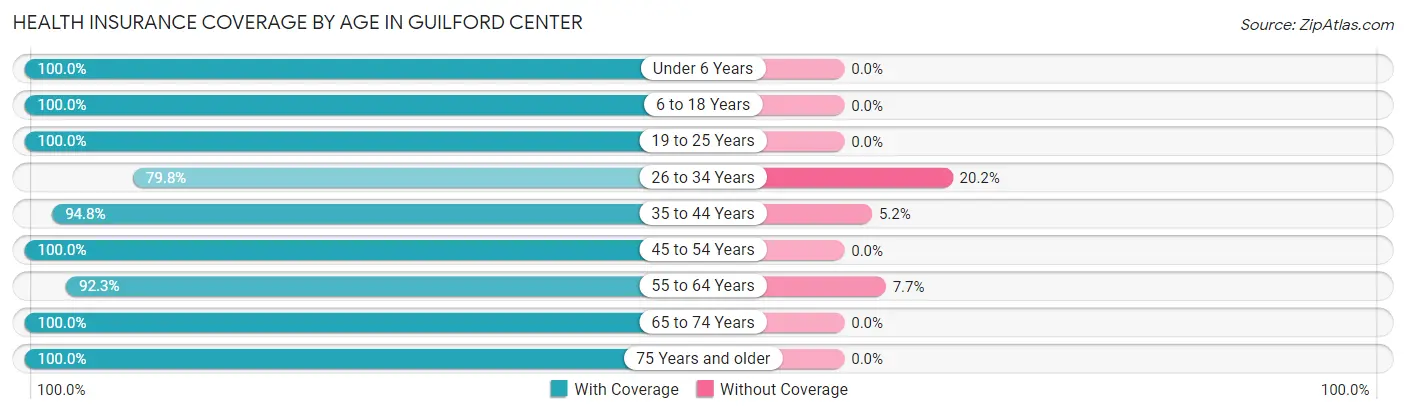
| Age Bracket | With Coverage | Without Coverage |
| Under 6 Years | 119 (100.0%) | 0 (0.0%) |
| 6 to 18 Years | 323 (100.0%) | 0 (0.0%) |
| 19 to 25 Years | 125 (100.0%) | 0 (0.0%) |
| 26 to 34 Years | 158 (79.8%) | 40 (20.2%) |
| 35 to 44 Years | 202 (94.8%) | 11 (5.2%) |
| 45 to 54 Years | 381 (100.0%) | 0 (0.0%) |
| 55 to 64 Years | 418 (92.3%) | 35 (7.7%) |
| 65 to 74 Years | 314 (100.0%) | 0 (0.0%) |
| 75 Years and older | 414 (100.0%) | 0 (0.0%) |
| Total | 2,454 (96.6%) | 86 (3.4%) |
Health Insurance Coverage by Citizenship Status in Guilford Center
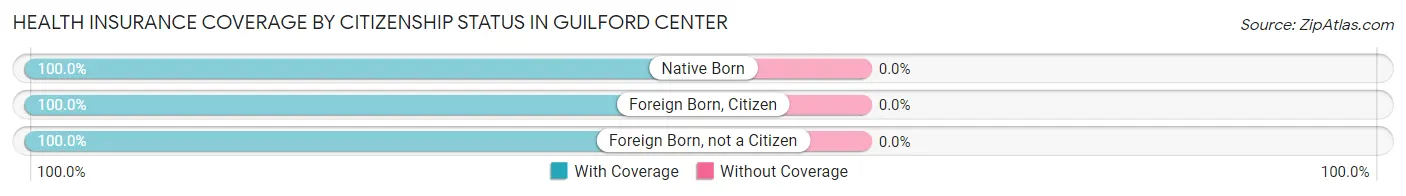
| Citizenship Status | With Coverage | Without Coverage |
| Native Born | 119 (100.0%) | 0 (0.0%) |
| Foreign Born, Citizen | 323 (100.0%) | 0 (0.0%) |
| Foreign Born, not a Citizen | 125 (100.0%) | 0 (0.0%) |
Health Insurance Coverage by Household Income in Guilford Center
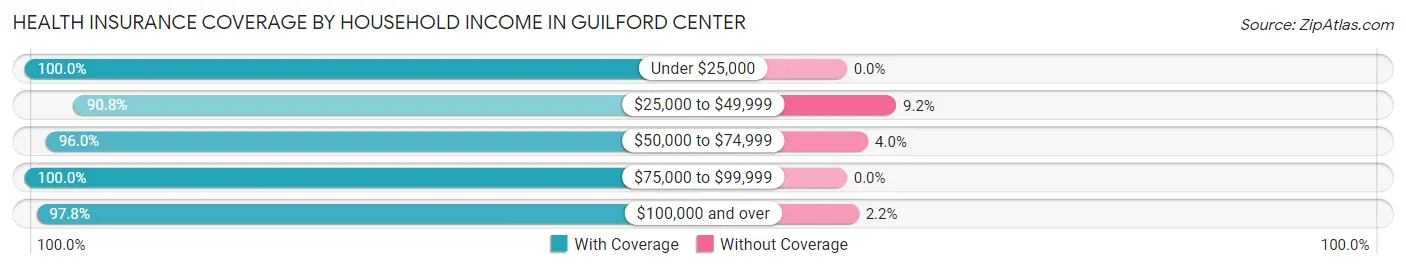
| Household Income | With Coverage | Without Coverage |
| Under $25,000 | 127 (100.0%) | 0 (0.0%) |
| $25,000 to $49,999 | 393 (90.8%) | 40 (9.2%) |
| $50,000 to $74,999 | 264 (96.0%) | 11 (4.0%) |
| $75,000 to $99,999 | 109 (100.0%) | 0 (0.0%) |
| $100,000 and over | 1,531 (97.8%) | 35 (2.2%) |
Public vs Private Health Insurance Coverage by Age in Guilford Center
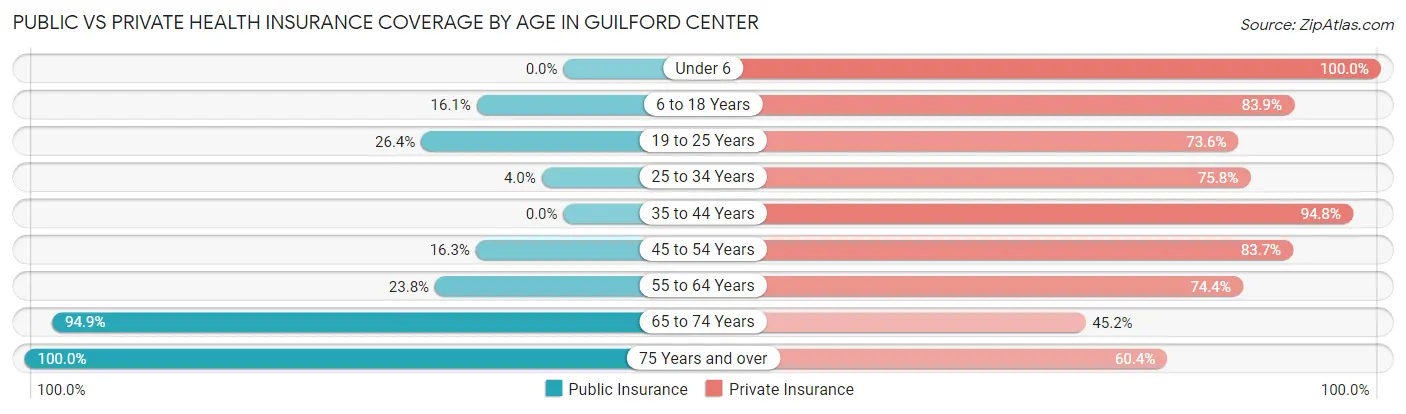
| Age Bracket | Public Insurance | Private Insurance |
| Under 6 | 0 (0.0%) | 119 (100.0%) |
| 6 to 18 Years | 52 (16.1%) | 271 (83.9%) |
| 19 to 25 Years | 33 (26.4%) | 92 (73.6%) |
| 25 to 34 Years | 8 (4.0%) | 150 (75.8%) |
| 35 to 44 Years | 0 (0.0%) | 202 (94.8%) |
| 45 to 54 Years | 62 (16.3%) | 319 (83.7%) |
| 55 to 64 Years | 108 (23.8%) | 337 (74.4%) |
| 65 to 74 Years | 298 (94.9%) | 142 (45.2%) |
| 75 Years and over | 414 (100.0%) | 250 (60.4%) |
| Total | 975 (38.4%) | 1,882 (74.1%) |
Disability Status by Sex by Age in Guilford Center
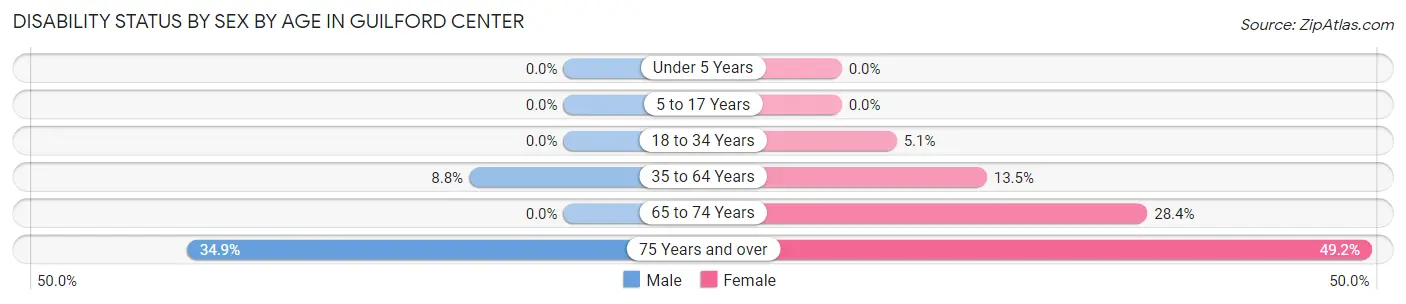
| Age Bracket | Male | Female |
| Under 5 Years | 0 (0.0%) | 0 (0.0%) |
| 5 to 17 Years | 0 (0.0%) | 0 (0.0%) |
| 18 to 34 Years | 0 (0.0%) | 8 (5.1%) |
| 35 to 64 Years | 39 (8.8%) | 81 (13.5%) |
| 65 to 74 Years | 0 (0.0%) | 55 (28.3%) |
| 75 Years and over | 58 (34.9%) | 122 (49.2%) |
Disability Class by Sex by Age in Guilford Center
Disability Class: Hearing Difficulty
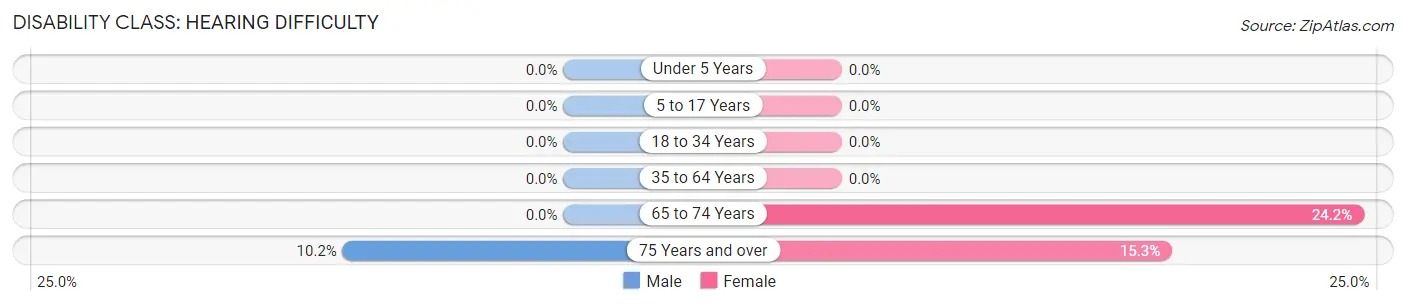
| Age Bracket | Male | Female |
| Under 5 Years | 0 (0.0%) | 0 (0.0%) |
| 5 to 17 Years | 0 (0.0%) | 0 (0.0%) |
| 18 to 34 Years | 0 (0.0%) | 0 (0.0%) |
| 35 to 64 Years | 0 (0.0%) | 0 (0.0%) |
| 65 to 74 Years | 0 (0.0%) | 47 (24.2%) |
| 75 Years and over | 17 (10.2%) | 38 (15.3%) |
Disability Class: Vision Difficulty
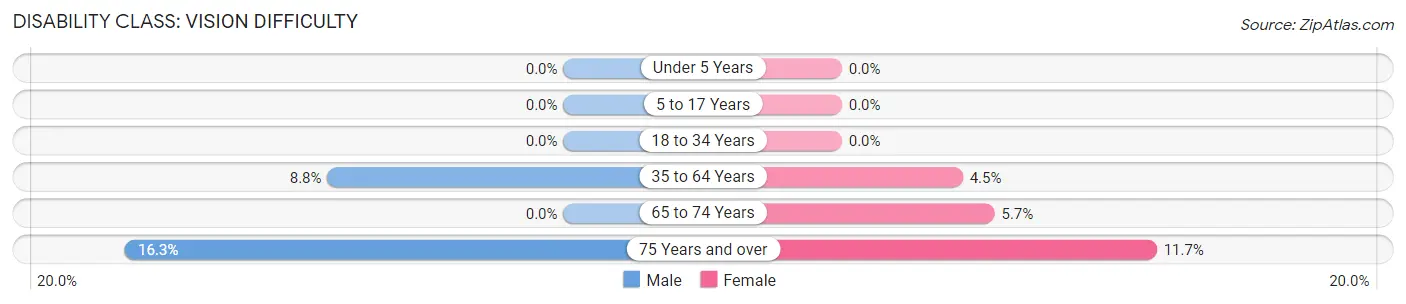
| Age Bracket | Male | Female |
| Under 5 Years | 0 (0.0%) | 0 (0.0%) |
| 5 to 17 Years | 0 (0.0%) | 0 (0.0%) |
| 18 to 34 Years | 0 (0.0%) | 0 (0.0%) |
| 35 to 64 Years | 39 (8.8%) | 27 (4.5%) |
| 65 to 74 Years | 0 (0.0%) | 11 (5.7%) |
| 75 Years and over | 27 (16.3%) | 29 (11.7%) |
Disability Class: Cognitive Difficulty

| Age Bracket | Male | Female |
| 5 to 17 Years | 0 (0.0%) | 0 (0.0%) |
| 18 to 34 Years | 0 (0.0%) | 8 (5.1%) |
| 35 to 64 Years | 0 (0.0%) | 34 (5.7%) |
| 65 to 74 Years | 0 (0.0%) | 0 (0.0%) |
| 75 Years and over | 25 (15.1%) | 0 (0.0%) |
Disability Class: Ambulatory Difficulty
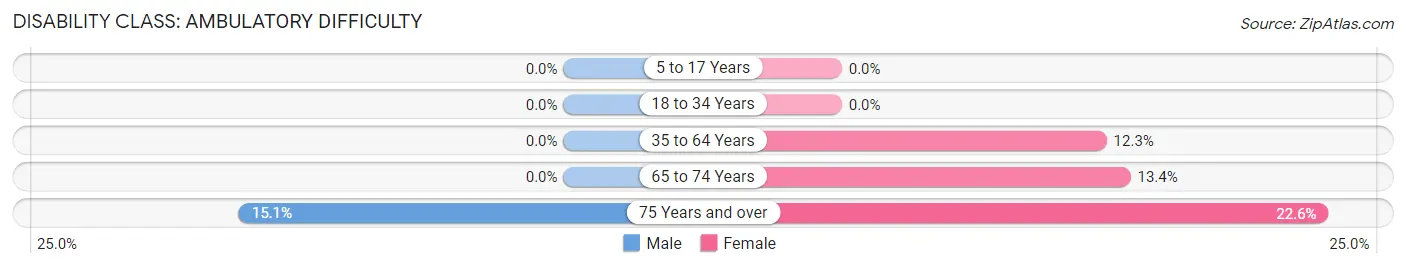
| Age Bracket | Male | Female |
| 5 to 17 Years | 0 (0.0%) | 0 (0.0%) |
| 18 to 34 Years | 0 (0.0%) | 0 (0.0%) |
| 35 to 64 Years | 0 (0.0%) | 74 (12.3%) |
| 65 to 74 Years | 0 (0.0%) | 26 (13.4%) |
| 75 Years and over | 25 (15.1%) | 56 (22.6%) |
Disability Class: Self-Care Difficulty
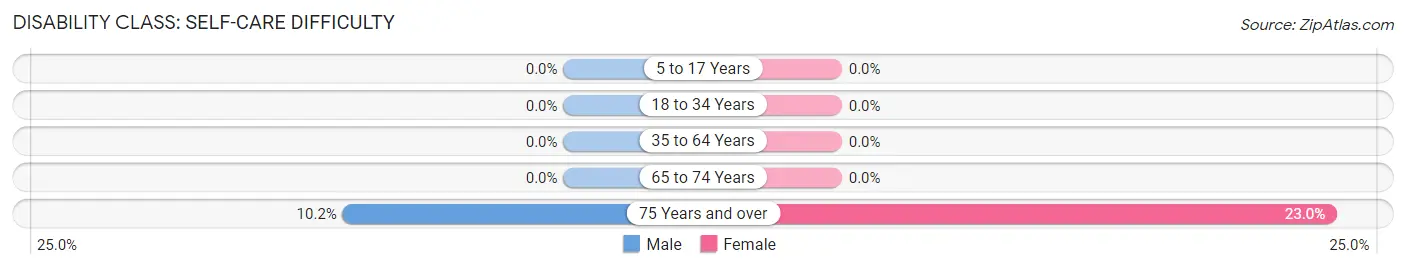
| Age Bracket | Male | Female |
| 5 to 17 Years | 0 (0.0%) | 0 (0.0%) |
| 18 to 34 Years | 0 (0.0%) | 0 (0.0%) |
| 35 to 64 Years | 0 (0.0%) | 0 (0.0%) |
| 65 to 74 Years | 0 (0.0%) | 0 (0.0%) |
| 75 Years and over | 17 (10.2%) | 57 (23.0%) |
Technology Access in Guilford Center
Computing Device Access in Guilford Center
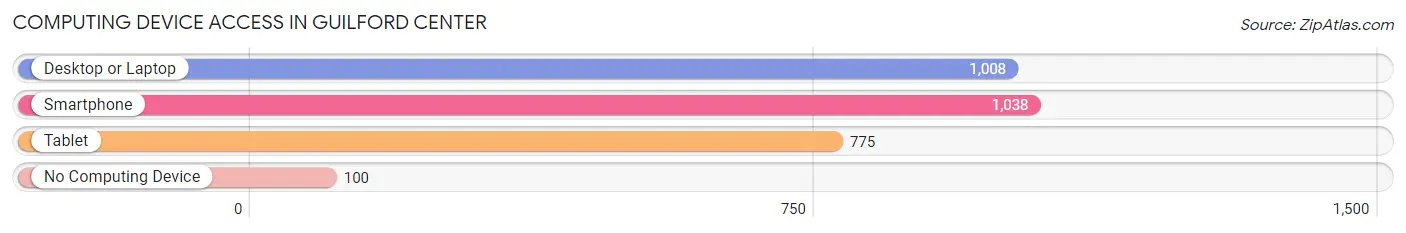
| Device Type | # Households | % Households |
| Desktop or Laptop | 1,008 | 81.2% |
| Smartphone | 1,038 | 83.6% |
| Tablet | 775 | 62.5% |
| No Computing Device | 100 | 8.1% |
| Total | 1,241 | 100.0% |
Internet Access in Guilford Center
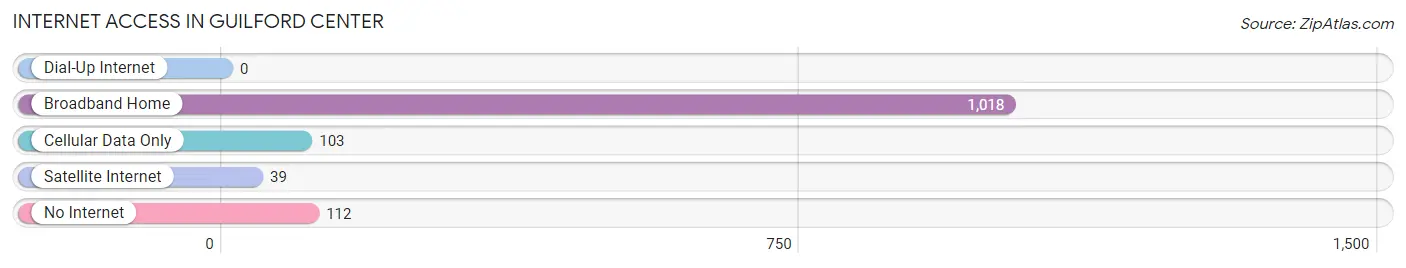
| Internet Type | # Households | % Households |
| Dial-Up Internet | 0 | 0.0% |
| Broadband Home | 1,018 | 82.0% |
| Cellular Data Only | 103 | 8.3% |
| Satellite Internet | 39 | 3.1% |
| No Internet | 112 | 9.0% |
| Total | 1,241 | 100.0% |
Guilford Center Summary
Guilford Center is a small town located in New Haven County, Connecticut. It is situated on the east side of the Connecticut River, about 10 miles south of New Haven. The town was originally part of the town of Guilford, but was incorporated as its own town in 1802. The town has a population of approximately 2,500 people and covers an area of about 4.5 square miles.
Geography
Guilford Center is located in the southeastern part of Connecticut, in New Haven County. It is situated on the east side of the Connecticut River, about 10 miles south of New Haven. The town is bordered by the towns of Madison to the east, Branford to the south, and Guilford to the west. The town is mostly rural, with a few small residential neighborhoods. The terrain is mostly flat, with some rolling hills in the northern part of town.
Climate
Guilford Center has a humid continental climate, with warm summers and cold winters. The average temperature in the summer is around 75 degrees Fahrenheit, and the average temperature in the winter is around 25 degrees Fahrenheit. The town receives an average of 45 inches of precipitation per year, with most of it falling in the spring and summer months.
Demographics
As of the 2010 census, the population of Guilford Center was 2,521. The racial makeup of the town was 94.3% White, 1.7% African American, 0.3% Native American, 1.2% Asian, 0.1% Pacific Islander, 1.2% from other races, and 1.4% from two or more races. Hispanic or Latino of any race were 3.2% of the population.
Economy
Guilford Center is a small, rural town with a limited economy. The town is home to several small businesses, including a few restaurants, a grocery store, and a few retail stores. The town also has a few small manufacturing companies, as well as a few farms. The town is also home to a few small technology companies, as well as a few medical offices.
The town is served by the Guilford Center Post Office, as well as the Guilford Center Fire Department. The town is also home to a few churches, including the First Congregational Church of Guilford Center.
Conclusion
Guilford Center is a small town located in New Haven County, Connecticut. It is situated on the east side of the Connecticut River, about 10 miles south of New Haven. The town has a population of approximately 2,500 people and covers an area of about 4.5 square miles. The town has a humid continental climate, with warm summers and cold winters. The town is mostly rural, with a few small residential neighborhoods. The town is home to several small businesses, including a few restaurants, a grocery store, and a few retail stores. The town is also home to a few small technology companies, as well as a few medical offices. The town is served by the Guilford Center Post Office, as well as the Guilford Center Fire Department. The town is also home to a few churches, including the First Congregational Church of Guilford Center.
Common Questions
What is Per Capita Income in Guilford Center?
Per Capita income in Guilford Center is $102,205.
What is the Median Family Income in Guilford Center?
Median Family Income in Guilford Center is $133,884.
What is the Median Household income in Guilford Center?
Median Household Income in Guilford Center is $88,850.
What is Income or Wage Gap in Guilford Center?
Income or Wage Gap in Guilford Center is 50.1%.
Women in Guilford Center earn 49.9 cents for every dollar earned by a man.
What is Inequality or Gini Index in Guilford Center?
Inequality or Gini Index in Guilford Center is 0.62.
What is the Total Population of Guilford Center?
Total Population of Guilford Center is 2,541.
What is the Total Male Population of Guilford Center?
Total Male Population of Guilford Center is 1,183.
What is the Total Female Population of Guilford Center?
Total Female Population of Guilford Center is 1,358.
What is the Ratio of Males per 100 Females in Guilford Center?
There are 87.11 Males per 100 Females in Guilford Center.
What is the Ratio of Females per 100 Males in Guilford Center?
There are 114.79 Females per 100 Males in Guilford Center.
What is the Median Population Age in Guilford Center?
Median Population Age in Guilford Center is 52.6 Years.
What is the Average Family Size in Guilford Center
Average Family Size in Guilford Center is 2.6 People.
What is the Average Household Size in Guilford Center
Average Household Size in Guilford Center is 2.0 People.
How Large is the Labor Force in Guilford Center?
There are 1,409 People in the Labor Forcein in Guilford Center.
What is the Percentage of People in the Labor Force in Guilford Center?
62.8% of People are in the Labor Force in Guilford Center.
What is the Unemployment Rate in Guilford Center?
Unemployment Rate in Guilford Center is 0.6%.