New Milford, CT Map & Demographics
New Milford Map
New Milford Overview
$36,334
PER CAPITA INCOME
$81,828
AVG FAMILY INCOME
$70,625
AVG HOUSEHOLD INCOME
40.1%
WAGE / INCOME GAP [ % ]
59.9¢/ $1
WAGE / INCOME GAP [ $ ]
0.39
INEQUALITY / GINI INDEX
7,095
TOTAL POPULATION
3,170
MALE POPULATION
3,925
FEMALE POPULATION
80.76
MALES / 100 FEMALES
123.82
FEMALES / 100 MALES
41.0
MEDIAN AGE
3.2
AVG FAMILY SIZE
2.5
AVG HOUSEHOLD SIZE
3,980
LABOR FORCE [ PEOPLE ]
69.9%
PERCENT IN LABOR FORCE
4.1%
UNEMPLOYMENT RATE
New Milford Zip Codes
New Milford Area Codes
Income in New Milford
Income Overview in New Milford
Per Capita Income in New Milford is $36,334, while median incomes of families and households are $81,828 and $70,625 respectively.
| Characteristic | Number | Measure |
| Per Capita Income | 7,095 | $36,334 |
| Median Family Income | 1,731 | $81,828 |
| Mean Family Income | 1,731 | $104,383 |
| Median Household Income | 2,764 | $70,625 |
| Mean Household Income | 2,764 | $90,095 |
| Income Deficit | 1,731 | $0 |
| Wage / Income Gap (%) | 7,095 | 40.06% |
| Wage / Income Gap ($) | 7,095 | 59.94¢ per $1 |
| Gini / Inequality Index | 7,095 | 0.39 |
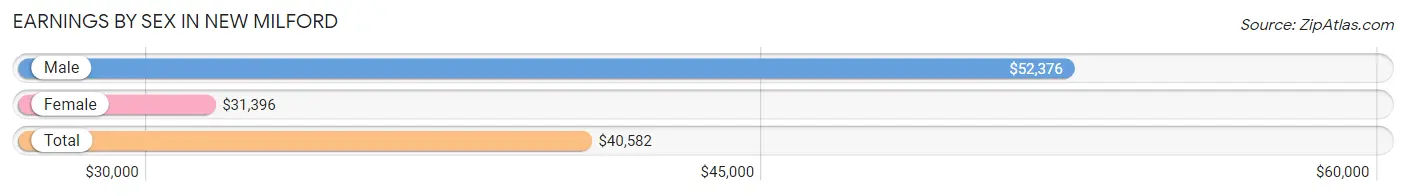
Earnings by Sex in New Milford
Average Earnings in New Milford are $40,582, $52,376 for men and $31,396 for women, a difference of 40.1%.
| Sex | Number | Average Earnings |
| Male | 2,078 (51.3%) | $52,376 |
| Female | 1,971 (48.7%) | $31,396 |
| Total | 4,049 (100.0%) | $40,582 |
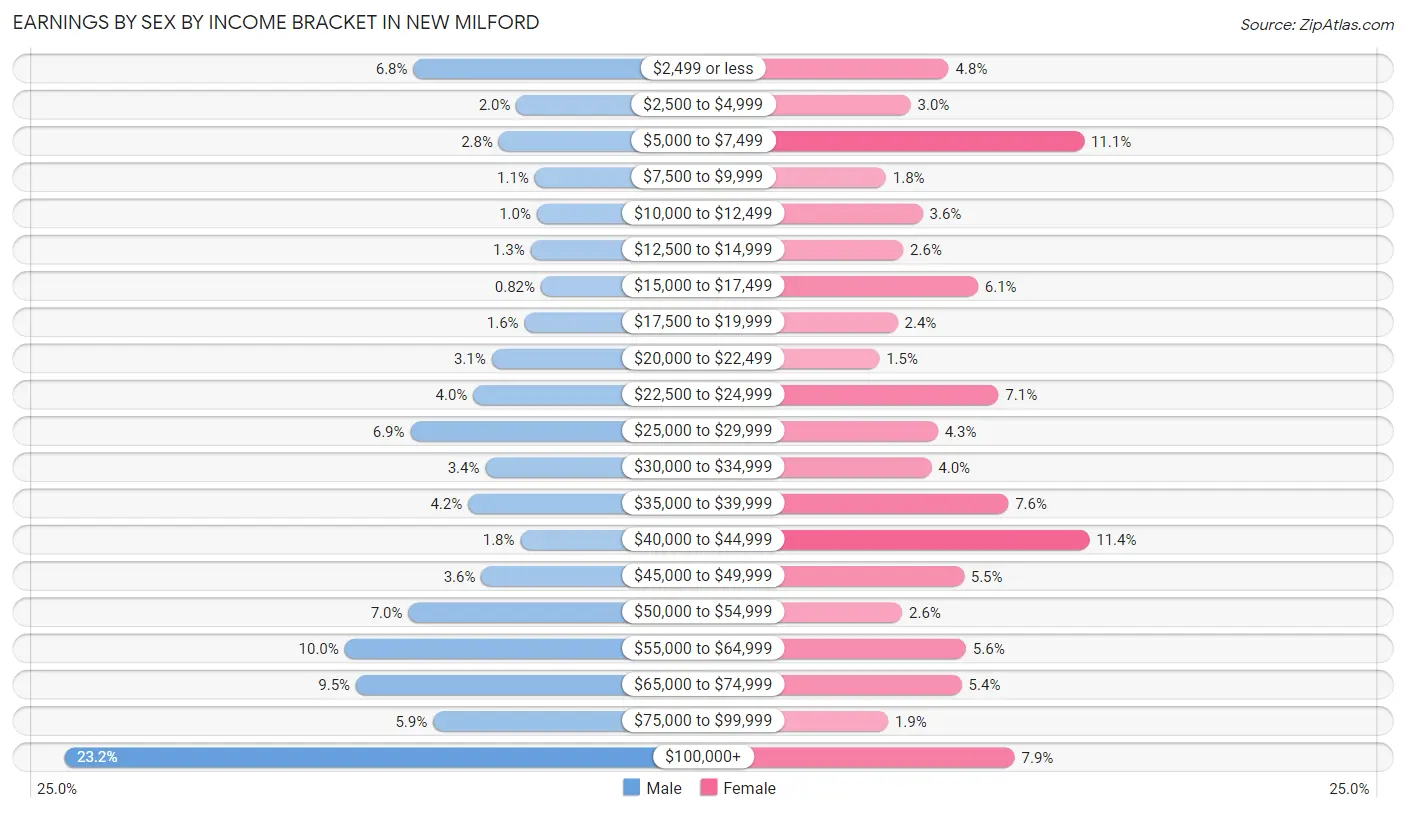
Earnings by Sex by Income Bracket in New Milford
The most common earnings brackets in New Milford are $100,000+ for men (481 | 23.2%) and $40,000 to $44,999 for women (224 | 11.4%).
| Income | Male | Female |
| $2,499 or less | 141 (6.8%) | 94 (4.8%) |
| $2,500 to $4,999 | 41 (2.0%) | 59 (3.0%) |
| $5,000 to $7,499 | 58 (2.8%) | 219 (11.1%) |
| $7,500 to $9,999 | 23 (1.1%) | 36 (1.8%) |
| $10,000 to $12,499 | 21 (1.0%) | 70 (3.5%) |
| $12,500 to $14,999 | 27 (1.3%) | 52 (2.6%) |
| $15,000 to $17,499 | 17 (0.8%) | 121 (6.1%) |
| $17,500 to $19,999 | 33 (1.6%) | 47 (2.4%) |
| $20,000 to $22,499 | 65 (3.1%) | 30 (1.5%) |
| $22,500 to $24,999 | 83 (4.0%) | 140 (7.1%) |
| $25,000 to $29,999 | 144 (6.9%) | 84 (4.3%) |
| $30,000 to $34,999 | 71 (3.4%) | 78 (4.0%) |
| $35,000 to $39,999 | 88 (4.2%) | 149 (7.6%) |
| $40,000 to $44,999 | 37 (1.8%) | 224 (11.4%) |
| $45,000 to $49,999 | 75 (3.6%) | 108 (5.5%) |
| $50,000 to $54,999 | 146 (7.0%) | 51 (2.6%) |
| $55,000 to $64,999 | 208 (10.0%) | 110 (5.6%) |
| $65,000 to $74,999 | 197 (9.5%) | 106 (5.4%) |
| $75,000 to $99,999 | 122 (5.9%) | 38 (1.9%) |
| $100,000+ | 481 (23.2%) | 155 (7.9%) |
| Total | 2,078 (100.0%) | 1,971 (100.0%) |
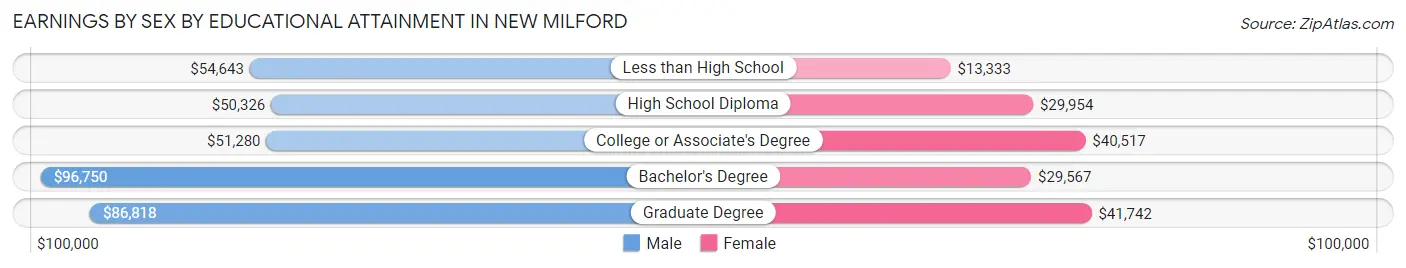
Earnings by Sex by Educational Attainment in New Milford
Average earnings in New Milford are $57,350 for men and $35,580 for women, a difference of 38.0%. Men with an educational attainment of bachelor's degree enjoy the highest average annual earnings of $96,750, while those with high school diploma education earn the least with $50,326. Women with an educational attainment of graduate degree earn the most with the average annual earnings of $41,742, while those with less than high school education have the smallest earnings of $13,333.
| Educational Attainment | Male Income | Female Income |
| Less than High School | $54,643 | $13,333 |
| High School Diploma | $50,326 | $29,954 |
| College or Associate's Degree | $51,280 | $40,517 |
| Bachelor's Degree | $96,750 | $29,567 |
| Graduate Degree | $86,818 | $41,742 |
| Total | $57,350 | $35,580 |
Family Income in New Milford
Family Income Brackets in New Milford
According to the New Milford family income data, there are 405 families falling into the $50,000 to $74,999 income range, which is the most common income bracket and makes up 23.4% of all families. Conversely, the $10,000 to $14,999 income bracket is the least frequent group with only 23 families (1.3%) belonging to this category.
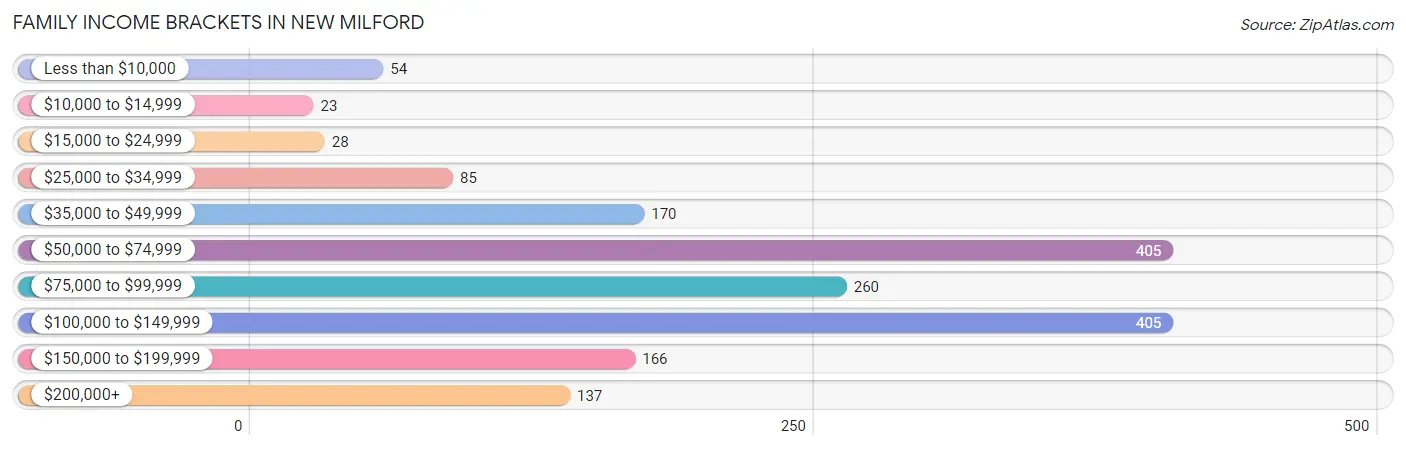
| Income Bracket | # Families | % Families |
| Less than $10,000 | 54 | 3.1% |
| $10,000 to $14,999 | 23 | 1.3% |
| $15,000 to $24,999 | 28 | 1.6% |
| $25,000 to $34,999 | 85 | 4.9% |
| $35,000 to $49,999 | 170 | 9.8% |
| $50,000 to $74,999 | 405 | 23.4% |
| $75,000 to $99,999 | 260 | 15.0% |
| $100,000 to $149,999 | 405 | 23.4% |
| $150,000 to $199,999 | 166 | 9.6% |
| $200,000+ | 137 | 7.9% |
Family Income by Famaliy Size in New Milford
4-person families (401 | 23.2%) account for the highest median family income in New Milford with $126,366 per family, while 2-person families (673 | 38.9%) have the highest median income of $38,932 per family member.
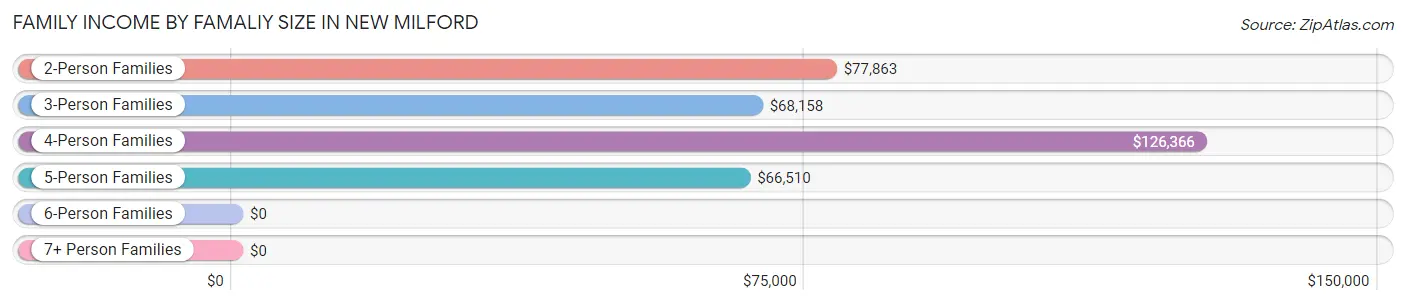
| Income Bracket | # Families | Median Income |
| 2-Person Families | 673 (38.9%) | $77,863 |
| 3-Person Families | 458 (26.5%) | $68,158 |
| 4-Person Families | 401 (23.2%) | $126,366 |
| 5-Person Families | 151 (8.7%) | $66,510 |
| 6-Person Families | 39 (2.2%) | $0 |
| 7+ Person Families | 9 (0.5%) | $0 |
| Total | 1,731 (100.0%) | $81,828 |
Family Income by Number of Earners in New Milford
The median family income in New Milford is $81,828, with families comprising 3+ earners (175) having the highest median family income of $145,433, while families with no earners (181) have the lowest median family income of $36,146, accounting for 10.1% and 10.5% of families, respectively.
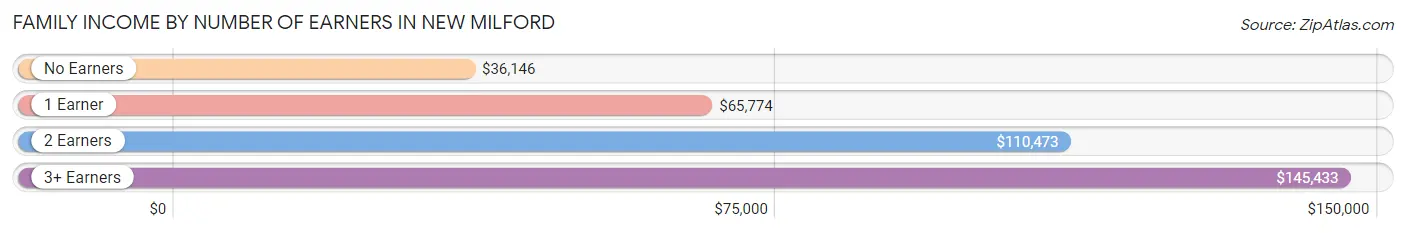
| Number of Earners | # Families | Median Income |
| No Earners | 181 (10.5%) | $36,146 |
| 1 Earner | 475 (27.4%) | $65,774 |
| 2 Earners | 900 (52.0%) | $110,473 |
| 3+ Earners | 175 (10.1%) | $145,433 |
| Total | 1,731 (100.0%) | $81,828 |
Household Income in New Milford
Household Income Brackets in New Milford
With 666 households falling in the category, the $50,000 to $74,999 income range is the most frequent in New Milford, accounting for 24.1% of all households. In contrast, only 88 households (3.2%) fall into the less than $10,000 income bracket, making it the least populous group.
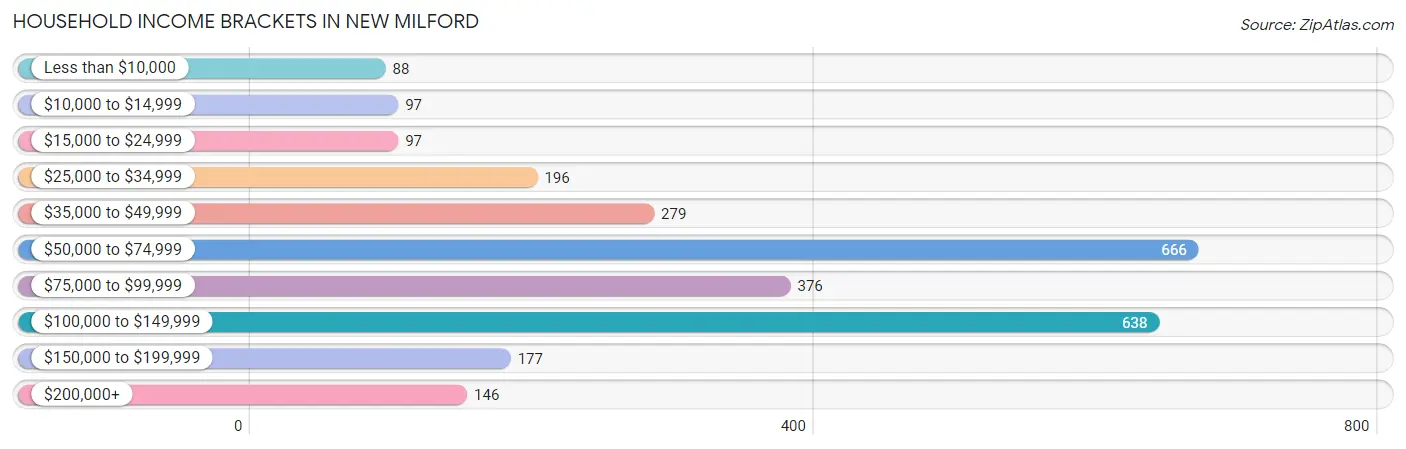
| Income Bracket | # Households | % Households |
| Less than $10,000 | 88 | 3.2% |
| $10,000 to $14,999 | 97 | 3.5% |
| $15,000 to $24,999 | 97 | 3.5% |
| $25,000 to $34,999 | 196 | 7.1% |
| $35,000 to $49,999 | 279 | 10.1% |
| $50,000 to $74,999 | 666 | 24.1% |
| $75,000 to $99,999 | 376 | 13.6% |
| $100,000 to $149,999 | 638 | 23.1% |
| $150,000 to $199,999 | 177 | 6.4% |
| $200,000+ | 146 | 5.3% |
Household Income by Householder Age in New Milford
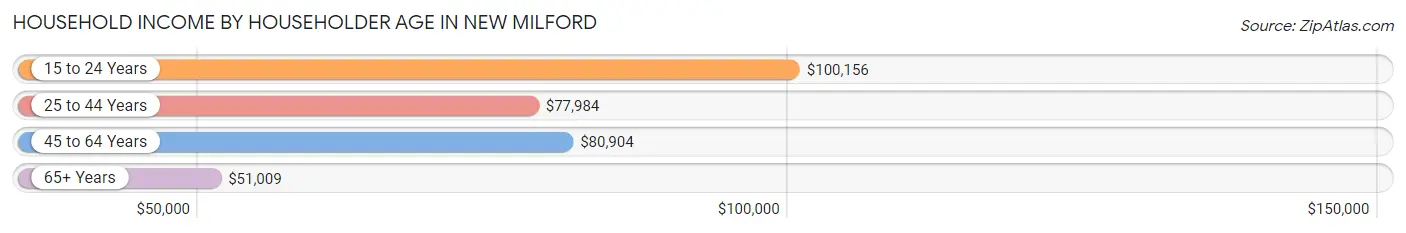
The median household income in New Milford is $70,625, with the highest median household income of $100,156 found in the 15 to 24 years age bracket for the primary householder. A total of 42 households (1.5%) fall into this category. Meanwhile, the 65+ years age bracket for the primary householder has the lowest median household income of $51,009, with 649 households (23.5%) in this group.
| Income Bracket | # Households | Median Income |
| 15 to 24 Years | 42 (1.5%) | $100,156 |
| 25 to 44 Years | 996 (36.0%) | $77,984 |
| 45 to 64 Years | 1,077 (39.0%) | $80,904 |
| 65+ Years | 649 (23.5%) | $51,009 |
| Total | 2,764 (100.0%) | $70,625 |
Poverty in New Milford
Income Below Poverty by Sex and Age in New Milford
With 5.2% poverty level for males and 6.7% for females among the residents of New Milford, 6 to 11 year old males and 65 to 74 year old females are the most vulnerable to poverty, with 21 males (11.2%) and 48 females (15.6%) in their respective age groups living below the poverty level.
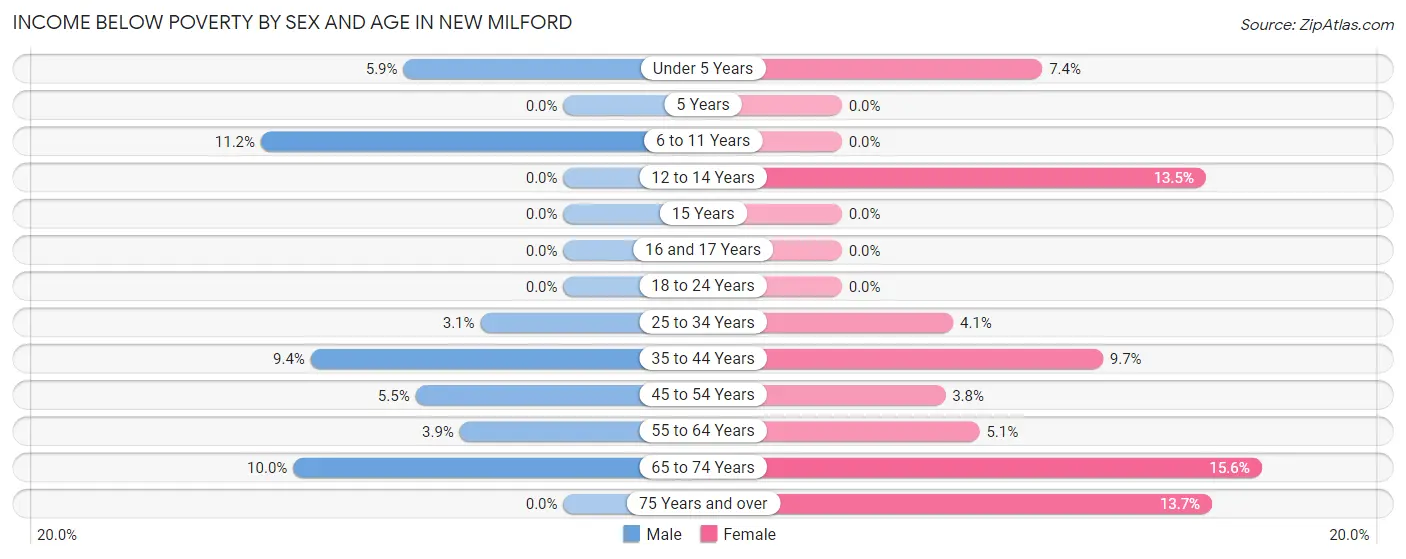
| Age Bracket | Male | Female |
| Under 5 Years | 6 (5.9%) | 32 (7.4%) |
| 5 Years | 0 (0.0%) | 0 (0.0%) |
| 6 to 11 Years | 21 (11.2%) | 0 (0.0%) |
| 12 to 14 Years | 0 (0.0%) | 25 (13.5%) |
| 15 Years | 0 (0.0%) | 0 (0.0%) |
| 16 and 17 Years | 0 (0.0%) | 0 (0.0%) |
| 18 to 24 Years | 0 (0.0%) | 0 (0.0%) |
| 25 to 34 Years | 12 (3.1%) | 13 (4.1%) |
| 35 to 44 Years | 44 (9.4%) | 57 (9.7%) |
| 45 to 54 Years | 27 (5.5%) | 19 (3.8%) |
| 55 to 64 Years | 14 (3.8%) | 31 (5.1%) |
| 65 to 74 Years | 38 (10.0%) | 48 (15.6%) |
| 75 Years and over | 0 (0.0%) | 29 (13.7%) |
| Total | 162 (5.2%) | 254 (6.7%) |
Income Above Poverty by Sex and Age in New Milford
According to the poverty statistics in New Milford, males aged 5 years and females aged 5 years are the age groups that are most secure financially, with 100.0% of males and 100.0% of females in these age groups living above the poverty line.
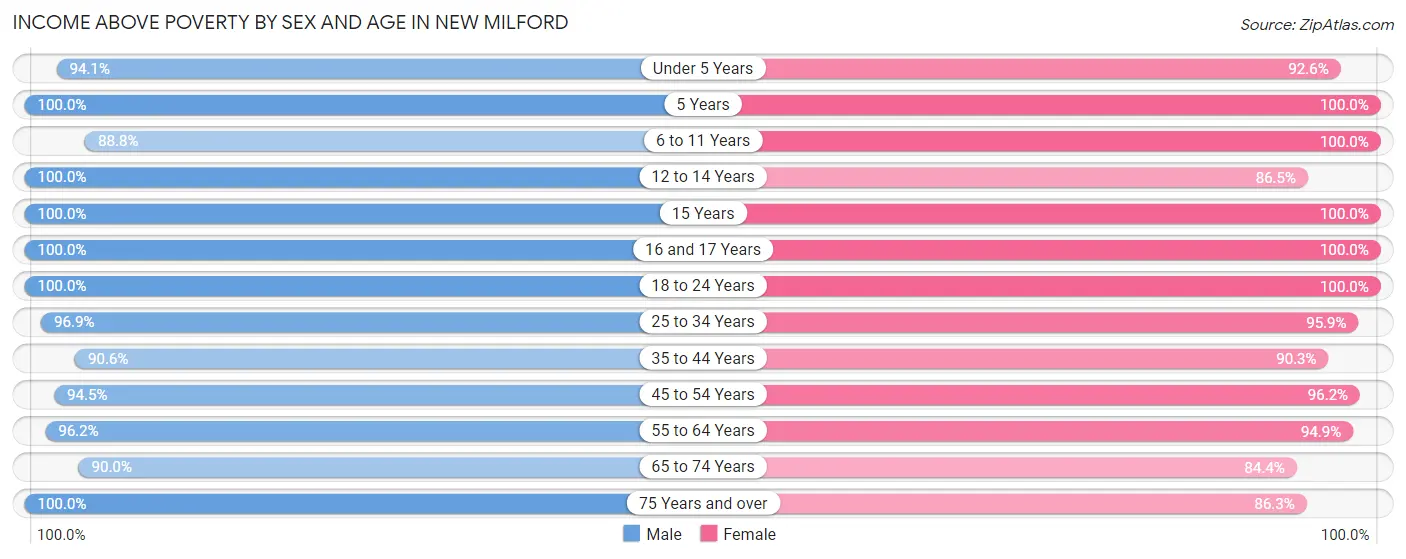
| Age Bracket | Male | Female |
| Under 5 Years | 95 (94.1%) | 398 (92.6%) |
| 5 Years | 35 (100.0%) | 8 (100.0%) |
| 6 to 11 Years | 166 (88.8%) | 320 (100.0%) |
| 12 to 14 Years | 74 (100.0%) | 160 (86.5%) |
| 15 Years | 49 (100.0%) | 12 (100.0%) |
| 16 and 17 Years | 221 (100.0%) | 95 (100.0%) |
| 18 to 24 Years | 292 (100.0%) | 192 (100.0%) |
| 25 to 34 Years | 377 (96.9%) | 302 (95.9%) |
| 35 to 44 Years | 425 (90.6%) | 531 (90.3%) |
| 45 to 54 Years | 465 (94.5%) | 476 (96.2%) |
| 55 to 64 Years | 350 (96.2%) | 576 (94.9%) |
| 65 to 74 Years | 341 (90.0%) | 260 (84.4%) |
| 75 Years and over | 67 (100.0%) | 182 (86.3%) |
| Total | 2,957 (94.8%) | 3,512 (93.3%) |
Income Below Poverty Among Married-Couple Families in New Milford
The poverty statistics for married-couple families in New Milford show that 7.2% or 94 of the total 1,297 families live below the poverty line. Families with 1 or 2 children have the highest poverty rate of 10.6%, comprising of 62 families. On the other hand, families with 3 or 4 children have the lowest poverty rate of 0.0%, which includes 0 families.
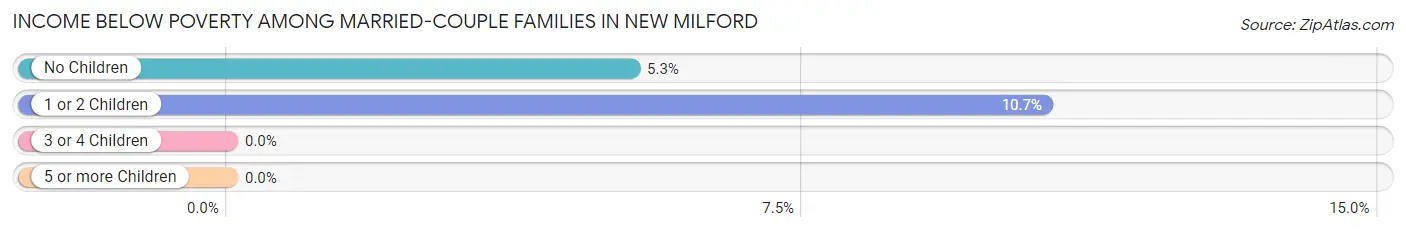
| Children | Above Poverty | Below Poverty |
| No Children | 578 (94.8%) | 32 (5.2%) |
| 1 or 2 Children | 520 (89.3%) | 62 (10.6%) |
| 3 or 4 Children | 105 (100.0%) | 0 (0.0%) |
| 5 or more Children | 0 (0.0%) | 0 (0.0%) |
| Total | 1,203 (92.7%) | 94 (7.2%) |
Income Below Poverty Among Single-Parent Households in New Milford
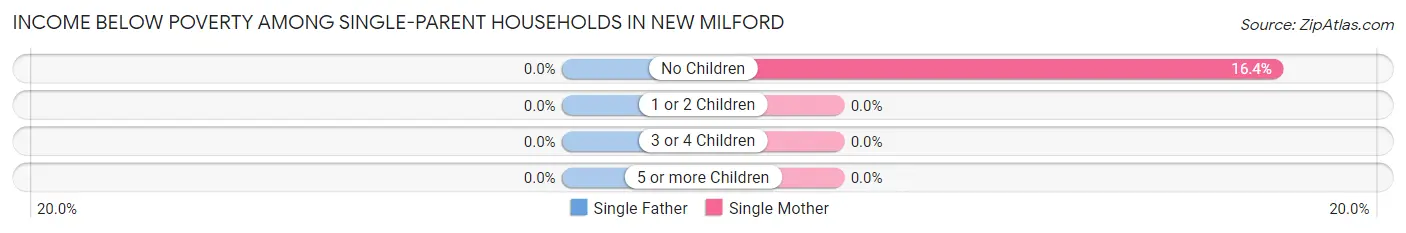
| Children | Single Father | Single Mother |
| No Children | 0 (0.0%) | 10 (16.4%) |
| 1 or 2 Children | 0 (0.0%) | 0 (0.0%) |
| 3 or 4 Children | 0 (0.0%) | 0 (0.0%) |
| 5 or more Children | 0 (0.0%) | 0 (0.0%) |
| Total | 0 (0.0%) | 10 (4.4%) |
Income Below Poverty Among Married-Couple vs Single-Parent Households in New Milford
The poverty data for New Milford shows that 94 of the married-couple family households (7.2%) and 10 of the single-parent households (2.3%) are living below the poverty level. Within the married-couple family households, those with 1 or 2 children have the highest poverty rate, with 62 households (10.6%) falling below the poverty line. Among the single-parent households, those with no children have the highest poverty rate, with 10 household (7.0%) living below poverty.
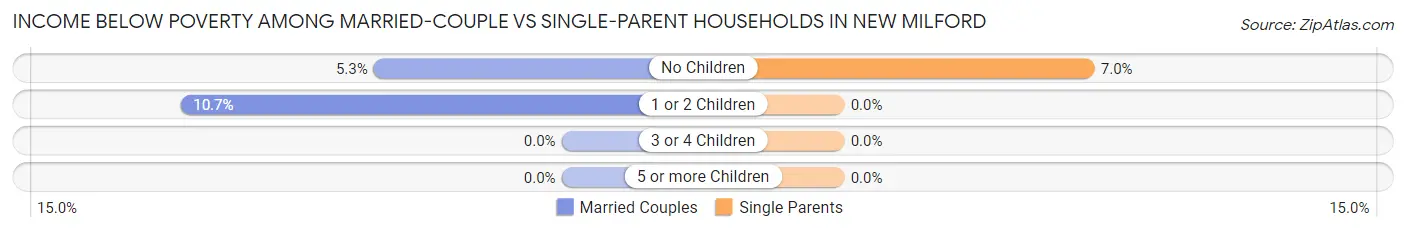
| Children | Married-Couple Families | Single-Parent Households |
| No Children | 32 (5.2%) | 10 (7.0%) |
| 1 or 2 Children | 62 (10.6%) | 0 (0.0%) |
| 3 or 4 Children | 0 (0.0%) | 0 (0.0%) |
| 5 or more Children | 0 (0.0%) | 0 (0.0%) |
| Total | 94 (7.2%) | 10 (2.3%) |
Race in New Milford
The most populous races in New Milford are White / Caucasian (5,942 | 83.8%), Hispanic or Latino (682 | 9.6%), and Two or more Races (423 | 6.0%).
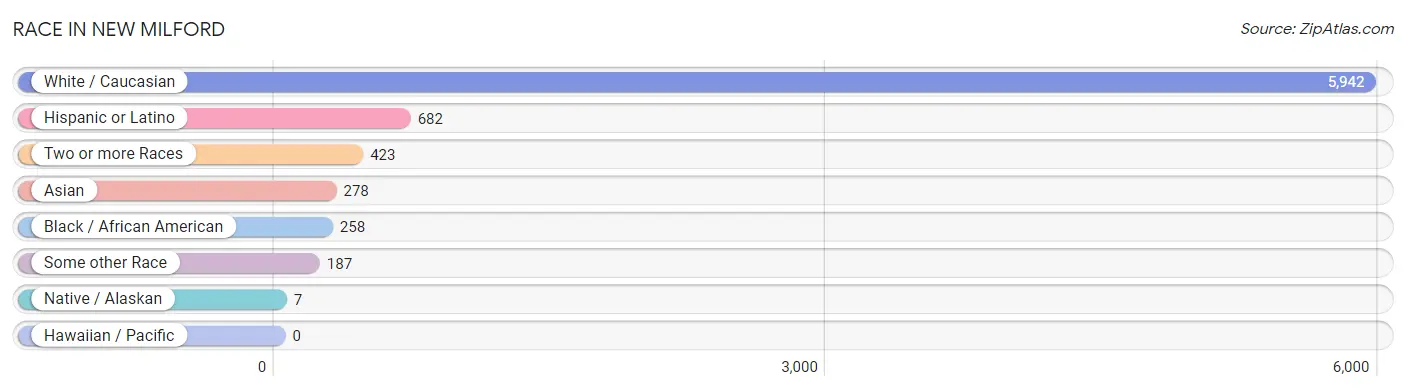
| Race | # Population | % Population |
| Asian | 278 | 3.9% |
| Black / African American | 258 | 3.6% |
| Hawaiian / Pacific | 0 | 0.0% |
| Hispanic or Latino | 682 | 9.6% |
| Native / Alaskan | 7 | 0.1% |
| White / Caucasian | 5,942 | 83.8% |
| Two or more Races | 423 | 6.0% |
| Some other Race | 187 | 2.6% |
| Total | 7,095 | 100.0% |
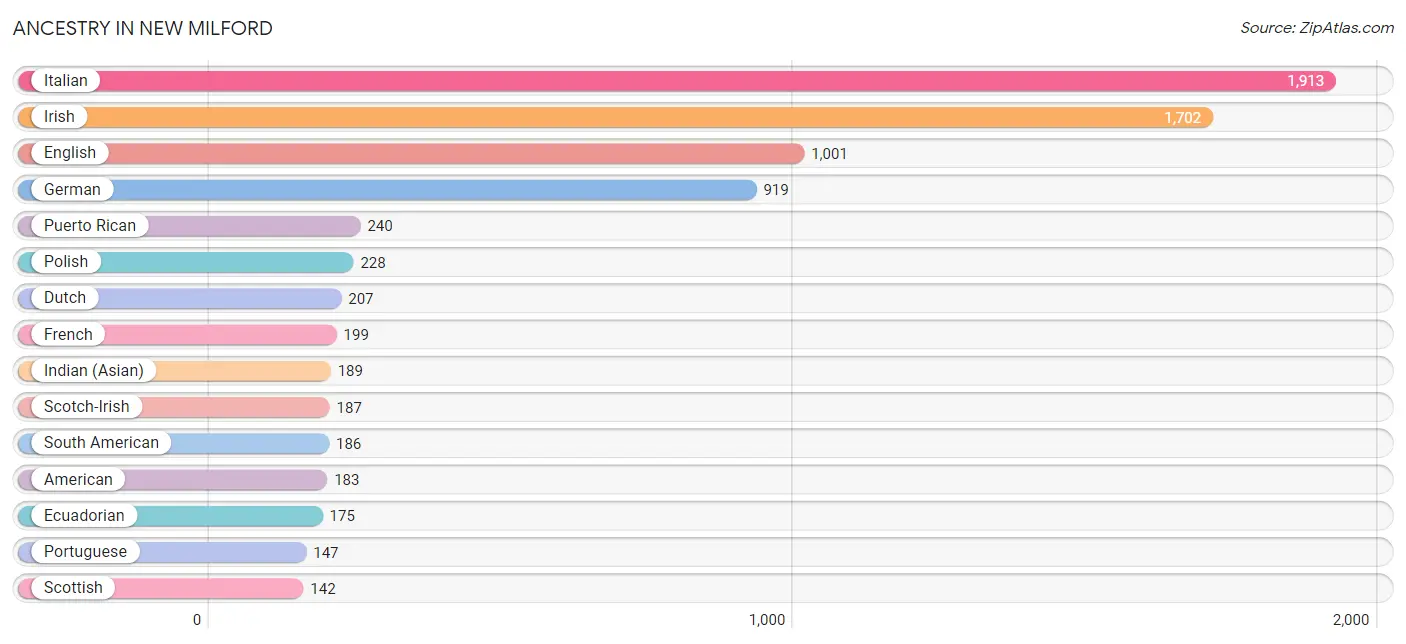
Ancestry in New Milford
The most populous ancestries reported in New Milford are Italian (1,913 | 27.0%), Irish (1,702 | 24.0%), English (1,001 | 14.1%), German (919 | 13.0%), and Puerto Rican (240 | 3.4%), together accounting for 81.4% of all New Milford residents.
| Ancestry | # Population | % Population |
| American | 183 | 2.6% |
| Austrian | 33 | 0.5% |
| Blackfeet | 43 | 0.6% |
| Brazilian | 98 | 1.4% |
| British | 29 | 0.4% |
| Burmese | 2 | 0.0% |
| Cambodian | 29 | 0.4% |
| Carpatho Rusyn | 19 | 0.3% |
| Central American | 75 | 1.1% |
| Choctaw | 30 | 0.4% |
| Danish | 12 | 0.2% |
| Dominican | 65 | 0.9% |
| Dutch | 207 | 2.9% |
| Eastern European | 12 | 0.2% |
| Ecuadorian | 175 | 2.5% |
| English | 1,001 | 14.1% |
| European | 62 | 0.9% |
| Finnish | 32 | 0.4% |
| French | 199 | 2.8% |
| French Canadian | 70 | 1.0% |
| German | 919 | 13.0% |
| Ghanaian | 19 | 0.3% |
| Greek | 46 | 0.6% |
| Guatemalan | 25 | 0.4% |
| Honduran | 50 | 0.7% |
| Hungarian | 88 | 1.2% |
| Indian (Asian) | 189 | 2.7% |
| Irish | 1,702 | 24.0% |
| Italian | 1,913 | 27.0% |
| Jamaican | 6 | 0.1% |
| Japanese | 20 | 0.3% |
| Korean | 71 | 1.0% |
| Mexican | 44 | 0.6% |
| Northern European | 24 | 0.3% |
| Norwegian | 58 | 0.8% |
| Polish | 228 | 3.2% |
| Portuguese | 147 | 2.1% |
| Puerto Rican | 240 | 3.4% |
| Russian | 66 | 0.9% |
| Scotch-Irish | 187 | 2.6% |
| Scottish | 142 | 2.0% |
| Slovak | 73 | 1.0% |
| South American | 186 | 2.6% |
| Spaniard | 59 | 0.8% |
| Spanish | 13 | 0.2% |
| Subsaharan African | 19 | 0.3% |
| Swedish | 97 | 1.4% |
| Thai | 29 | 0.4% |
| Ukrainian | 12 | 0.2% |
| Venezuelan | 11 | 0.2% |
| Welsh | 124 | 1.8% | View All 51 Rows |
Immigrants in New Milford
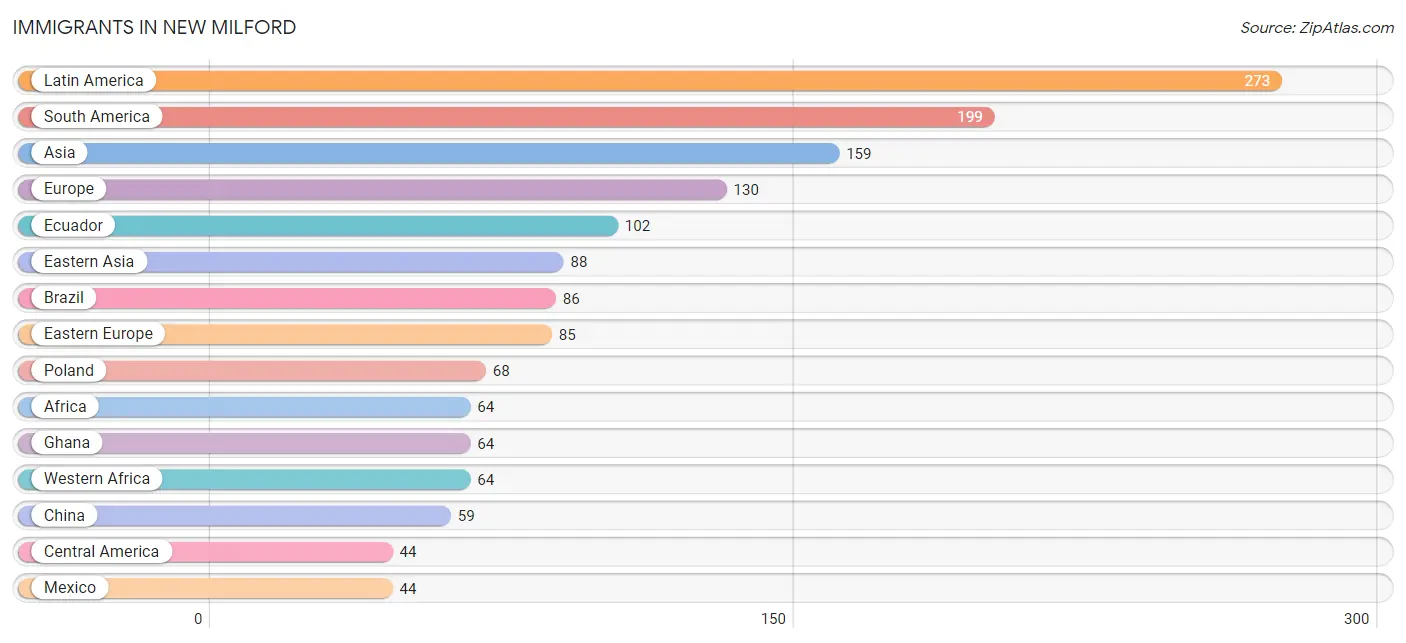
The most numerous immigrant groups reported in New Milford came from Latin America (273 | 3.8%), South America (199 | 2.8%), Asia (159 | 2.2%), Europe (130 | 1.8%), and Ecuador (102 | 1.4%), together accounting for 12.2% of all New Milford residents.
| Immigration Origin | # Population | % Population |
| Africa | 64 | 0.9% |
| Asia | 159 | 2.2% |
| Australia | 11 | 0.2% |
| Brazil | 86 | 1.2% |
| Cambodia | 10 | 0.1% |
| Caribbean | 30 | 0.4% |
| Central America | 44 | 0.6% |
| China | 59 | 0.8% |
| Croatia | 8 | 0.1% |
| Dominican Republic | 26 | 0.4% |
| Eastern Asia | 88 | 1.2% |
| Eastern Europe | 85 | 1.2% |
| Ecuador | 102 | 1.4% |
| England | 18 | 0.3% |
| Europe | 130 | 1.8% |
| Germany | 20 | 0.3% |
| Ghana | 64 | 0.9% |
| Hungary | 9 | 0.1% |
| India | 14 | 0.2% |
| Jamaica | 4 | 0.1% |
| Latin America | 273 | 3.8% |
| Mexico | 44 | 0.6% |
| Northern Europe | 25 | 0.4% |
| Oceania | 11 | 0.2% |
| Philippines | 18 | 0.3% |
| Poland | 68 | 1.0% |
| Saudi Arabia | 29 | 0.4% |
| Scotland | 7 | 0.1% |
| South America | 199 | 2.8% |
| South Central Asia | 14 | 0.2% |
| South Eastern Asia | 28 | 0.4% |
| Venezuela | 11 | 0.2% |
| Western Africa | 64 | 0.9% |
| Western Asia | 29 | 0.4% |
| Western Europe | 20 | 0.3% | View All 35 Rows |
Sex and Age in New Milford
Sex and Age in New Milford
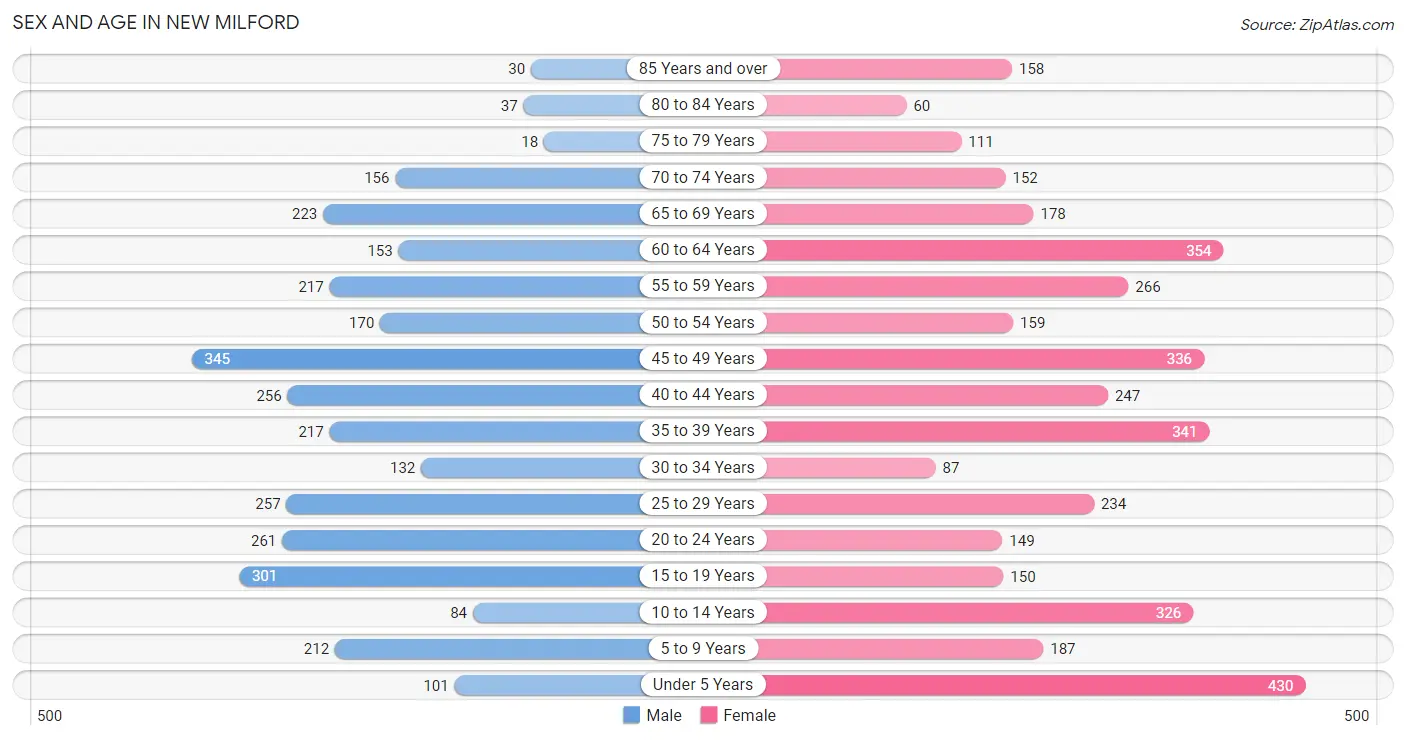
The most populous age groups in New Milford are 45 to 49 Years (345 | 10.9%) for men and Under 5 Years (430 | 11.0%) for women.
| Age Bracket | Male | Female |
| Under 5 Years | 101 (3.2%) | 430 (11.0%) |
| 5 to 9 Years | 212 (6.7%) | 187 (4.8%) |
| 10 to 14 Years | 84 (2.6%) | 326 (8.3%) |
| 15 to 19 Years | 301 (9.5%) | 150 (3.8%) |
| 20 to 24 Years | 261 (8.2%) | 149 (3.8%) |
| 25 to 29 Years | 257 (8.1%) | 234 (6.0%) |
| 30 to 34 Years | 132 (4.2%) | 87 (2.2%) |
| 35 to 39 Years | 217 (6.9%) | 341 (8.7%) |
| 40 to 44 Years | 256 (8.1%) | 247 (6.3%) |
| 45 to 49 Years | 345 (10.9%) | 336 (8.6%) |
| 50 to 54 Years | 170 (5.4%) | 159 (4.1%) |
| 55 to 59 Years | 217 (6.9%) | 266 (6.8%) |
| 60 to 64 Years | 153 (4.8%) | 354 (9.0%) |
| 65 to 69 Years | 223 (7.0%) | 178 (4.5%) |
| 70 to 74 Years | 156 (4.9%) | 152 (3.9%) |
| 75 to 79 Years | 18 (0.6%) | 111 (2.8%) |
| 80 to 84 Years | 37 (1.2%) | 60 (1.5%) |
| 85 Years and over | 30 (0.9%) | 158 (4.0%) |
| Total | 3,170 (100.0%) | 3,925 (100.0%) |
Families and Households in New Milford
Median Family Size in New Milford
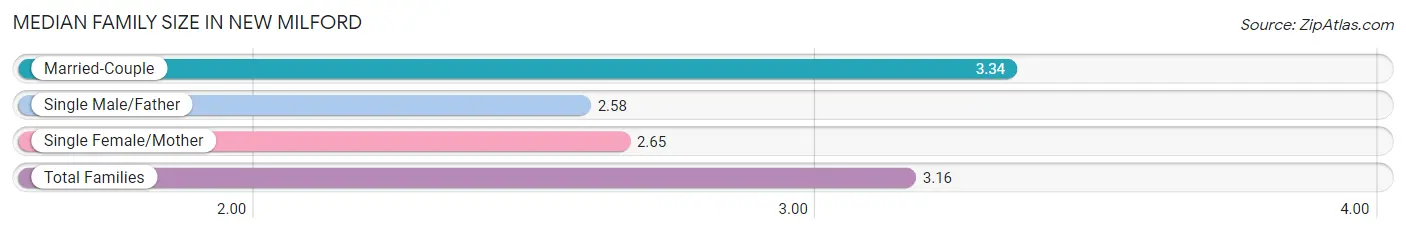
The median family size in New Milford is 3.16 persons per family, with married-couple families (1,297 | 74.9%) accounting for the largest median family size of 3.34 persons per family. On the other hand, single male/father families (205 | 11.8%) represent the smallest median family size with 2.58 persons per family.
| Family Type | # Families | Family Size |
| Married-Couple | 1,297 (74.9%) | 3.34 |
| Single Male/Father | 205 (11.8%) | 2.58 |
| Single Female/Mother | 229 (13.2%) | 2.65 |
| Total Families | 1,731 (100.0%) | 3.16 |
Median Household Size in New Milford
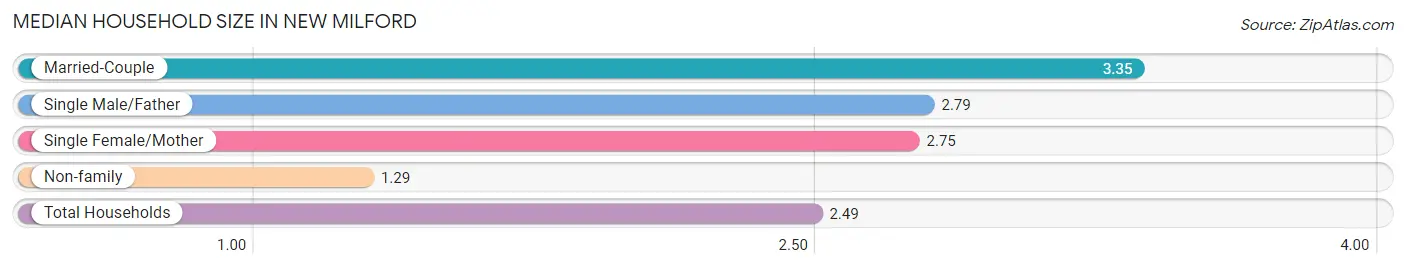
The median household size in New Milford is 2.49 persons per household, with married-couple households (1,297 | 46.9%) accounting for the largest median household size of 3.35 persons per household. non-family households (1,033 | 37.4%) represent the smallest median household size with 1.29 persons per household.
| Household Type | # Households | Household Size |
| Married-Couple | 1,297 (46.9%) | 3.35 |
| Single Male/Father | 205 (7.4%) | 2.79 |
| Single Female/Mother | 229 (8.3%) | 2.75 |
| Non-family | 1,033 (37.4%) | 1.29 |
| Total Households | 2,764 (100.0%) | 2.49 |
Household Size by Marriage Status in New Milford
Out of a total of 2,764 households in New Milford, 1,731 (62.6%) are family households, while 1,033 (37.4%) are nonfamily households. The most numerous type of family households are 2-person households, comprising 616, and the most common type of nonfamily households are 1-person households, comprising 799.
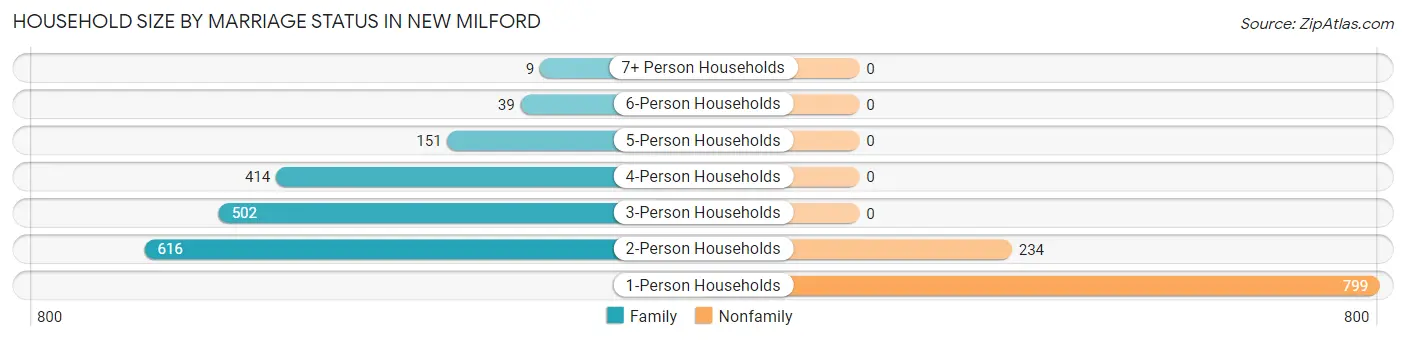
| Household Size | Family Households | Nonfamily Households |
| 1-Person Households | - | 799 (28.9%) |
| 2-Person Households | 616 (22.3%) | 234 (8.5%) |
| 3-Person Households | 502 (18.2%) | 0 (0.0%) |
| 4-Person Households | 414 (15.0%) | 0 (0.0%) |
| 5-Person Households | 151 (5.5%) | 0 (0.0%) |
| 6-Person Households | 39 (1.4%) | 0 (0.0%) |
| 7+ Person Households | 9 (0.3%) | 0 (0.0%) |
| Total | 1,731 (62.6%) | 1,033 (37.4%) |
Female Fertility in New Milford
Fertility by Age in New Milford
Average fertility rate in New Milford is 2.0 births per 1,000 women. Women in the age bracket of 20 to 34 years have the highest fertility rate with 6.0 births per 1,000 women. Women in the age bracket of 20 to 34 years acount for 100.0% of all women with births.
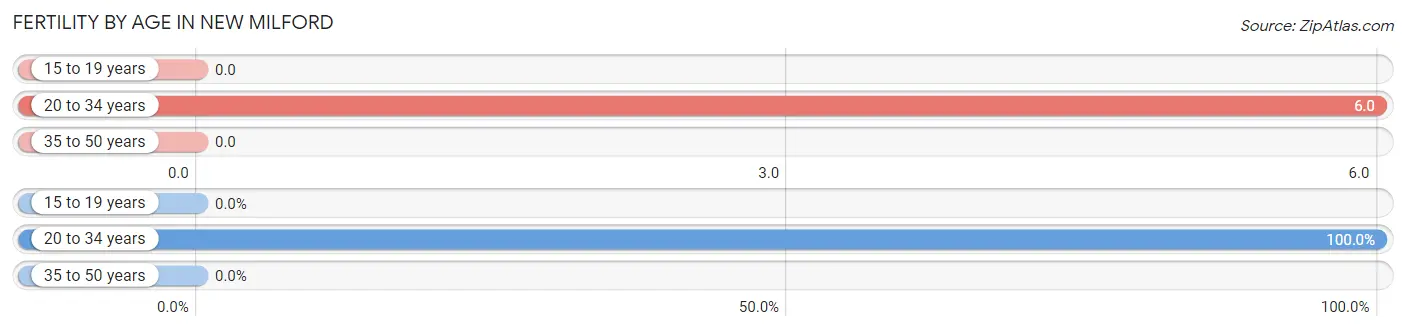
| Age Bracket | Women with Births | Births / 1,000 Women |
| 15 to 19 years | 0 (0.0%) | 0.0 |
| 20 to 34 years | 3 (100.0%) | 6.0 |
| 35 to 50 years | 0 (0.0%) | 0.0 |
| Total | 3 (100.0%) | 2.0 |
Fertility by Age by Marriage Status in New Milford
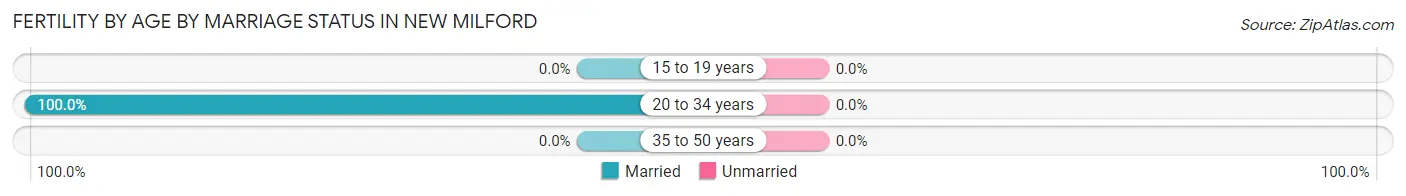
| Age Bracket | Married | Unmarried |
| 15 to 19 years | 0 (0.0%) | 0 (0.0%) |
| 20 to 34 years | 3 (100.0%) | 0 (0.0%) |
| 35 to 50 years | 0 (0.0%) | 0 (0.0%) |
| Total | 3 (100.0%) | 0 (0.0%) |
Fertility by Education in New Milford
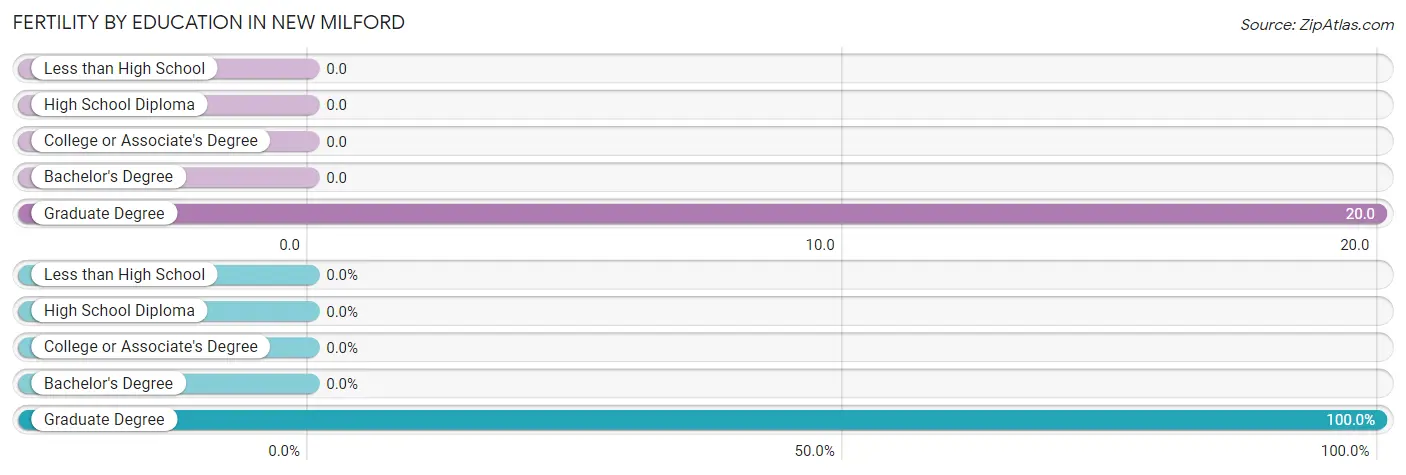
| Educational Attainment | Women with Births | Births / 1,000 Women |
| Less than High School | 0 (0.0%) | 0.0 |
| High School Diploma | 0 (0.0%) | 0.0 |
| College or Associate's Degree | 0 (0.0%) | 0.0 |
| Bachelor's Degree | 0 (0.0%) | 0.0 |
| Graduate Degree | 3 (100.0%) | 20.0 |
| Total | 3 (100.0%) | 2.0 |
Fertility by Education by Marriage Status in New Milford
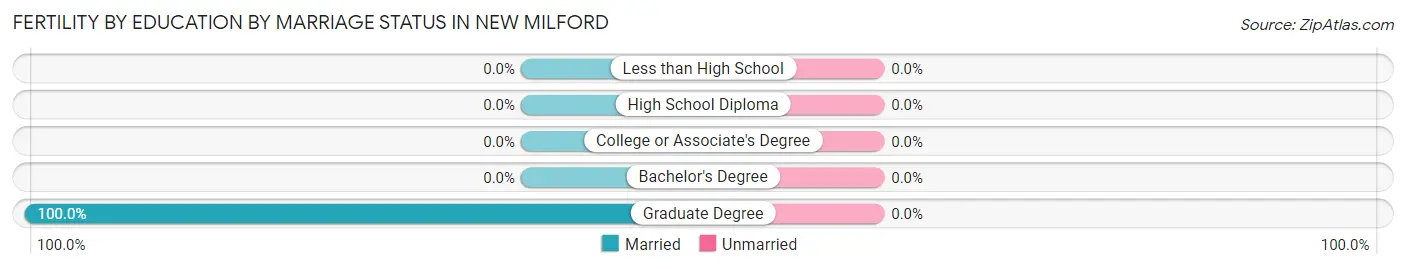
| Educational Attainment | Married | Unmarried |
| Less than High School | 0 (0.0%) | 0 (0.0%) |
| High School Diploma | 0 (0.0%) | 0 (0.0%) |
| College or Associate's Degree | 0 (0.0%) | 0 (0.0%) |
| Bachelor's Degree | 0 (0.0%) | 0 (0.0%) |
| Graduate Degree | 3 (100.0%) | 0 (0.0%) |
| Total | 3 (100.0%) | 0 (0.0%) |
Employment Characteristics in New Milford
Employment by Class of Employer in New Milford
Among the 3,760 employed individuals in New Milford, private company employees (2,298 | 61.1%), not-for-profit organizations (389 | 10.3%), and self-employed (not incorporated) (359 | 9.6%) make up the most common classes of employment.
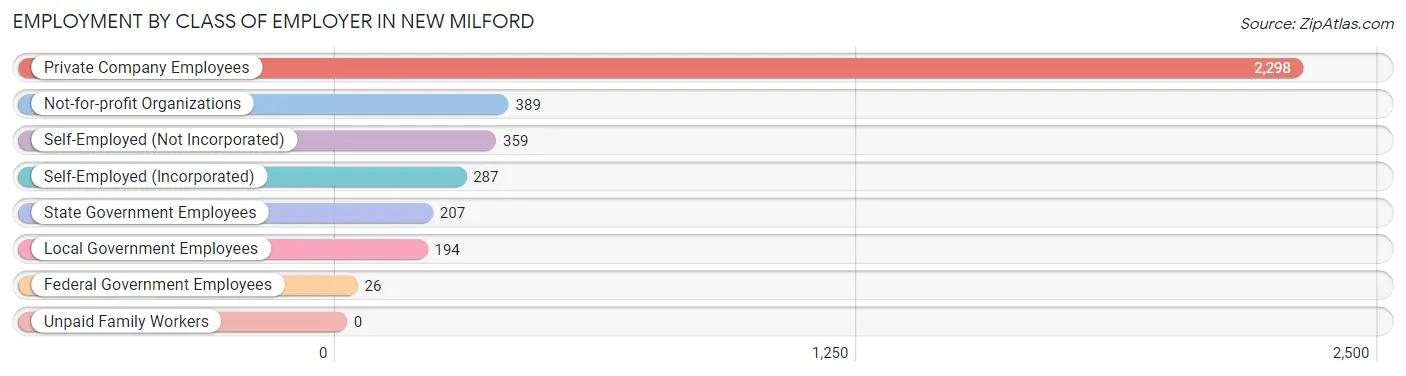
| Employer Class | # Employees | % Employees |
| Private Company Employees | 2,298 | 61.1% |
| Self-Employed (Incorporated) | 287 | 7.6% |
| Self-Employed (Not Incorporated) | 359 | 9.6% |
| Not-for-profit Organizations | 389 | 10.3% |
| Local Government Employees | 194 | 5.2% |
| State Government Employees | 207 | 5.5% |
| Federal Government Employees | 26 | 0.7% |
| Unpaid Family Workers | 0 | 0.0% |
| Total | 3,760 | 100.0% |
Employment Status by Age in New Milford
According to the labor force statistics for New Milford, out of the total population over 16 years of age (5,694), 69.9% or 3,980 individuals are in the labor force, with 4.1% or 163 of them unemployed. The age group with the highest labor force participation rate is 35 to 44 years, with 96.2% or 1,021 individuals in the labor force. Within the labor force, the 55 to 59 years age range has the highest percentage of unemployed individuals, with 13.0% or 55 of them being unemployed.
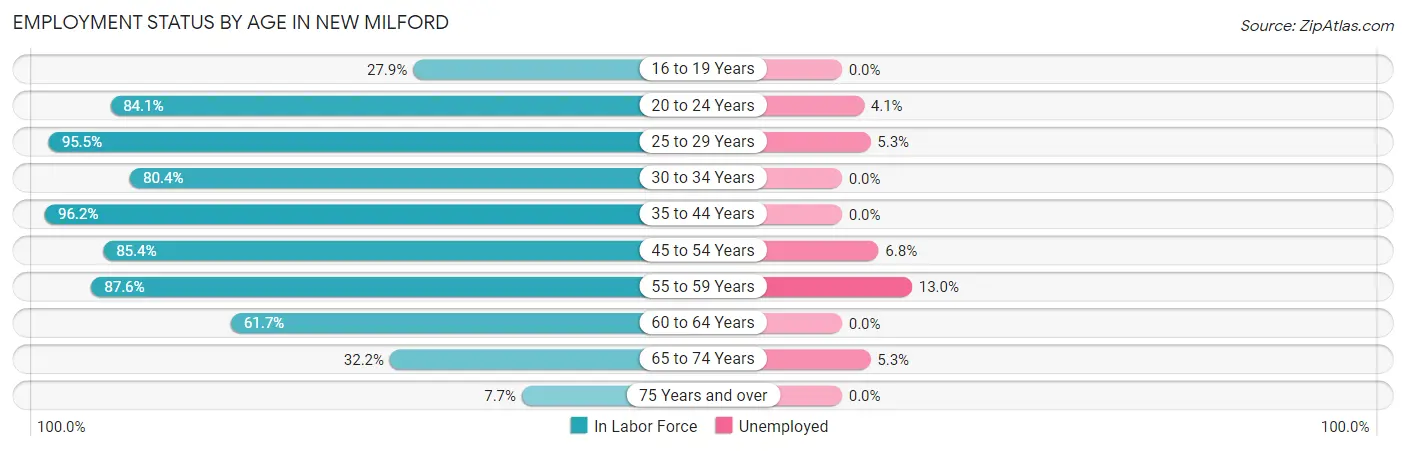
| Age Bracket | In Labor Force | Unemployed |
| 16 to 19 Years | 109 (27.9%) | 0 (0.0%) |
| 20 to 24 Years | 345 (84.1%) | 14 (4.1%) |
| 25 to 29 Years | 469 (95.5%) | 25 (5.3%) |
| 30 to 34 Years | 176 (80.4%) | 0 (0.0%) |
| 35 to 44 Years | 1,021 (96.2%) | 0 (0.0%) |
| 45 to 54 Years | 863 (85.4%) | 59 (6.8%) |
| 55 to 59 Years | 423 (87.6%) | 55 (13.0%) |
| 60 to 64 Years | 313 (61.7%) | 0 (0.0%) |
| 65 to 74 Years | 228 (32.2%) | 12 (5.3%) |
| 75 Years and over | 32 (7.7%) | 0 (0.0%) |
| Total | 3,980 (69.9%) | 163 (4.1%) |
Employment Status by Educational Attainment in New Milford
According to labor force statistics for New Milford, 86.6% of individuals (3,266) out of the total population between 25 and 64 years of age (3,771) are in the labor force, with 4.3% or 140 of them being unemployed. The group with the highest labor force participation rate are those with the educational attainment of bachelor's degree or higher, with 94.0% or 1,274 individuals in the labor force. Within the labor force, individuals with less than high school education have the highest percentage of unemployment, with 10.4% or 12 of them being unemployed.
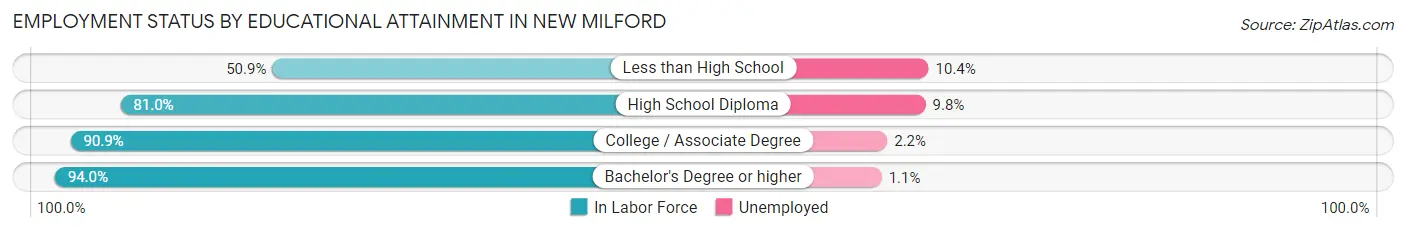
| Educational Attainment | In Labor Force | Unemployed |
| Less than High School | 115 (50.9%) | 24 (10.4%) |
| High School Diploma | 936 (81.0%) | 113 (9.8%) |
| College / Associate Degree | 940 (90.9%) | 23 (2.2%) |
| Bachelor's Degree or higher | 1,274 (94.0%) | 15 (1.1%) |
| Total | 3,266 (86.6%) | 162 (4.3%) |
Employment Occupations by Sex in New Milford
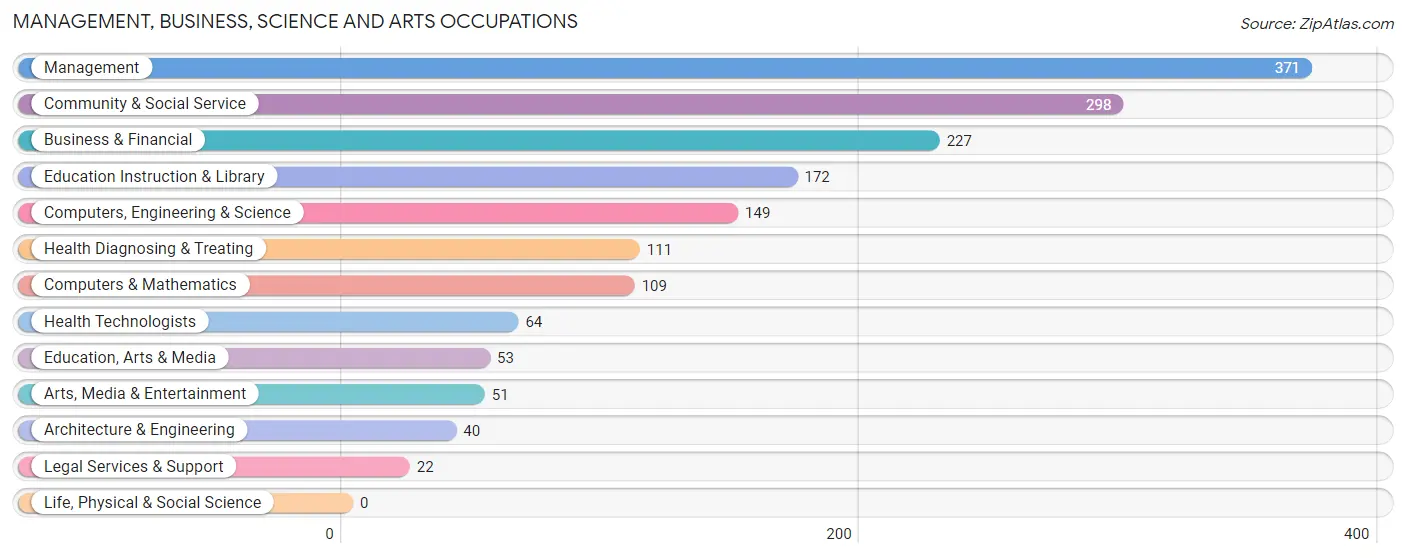
Management, Business, Science and Arts Occupations
The most common Management, Business, Science and Arts occupations in New Milford are Management (371 | 9.7%), Community & Social Service (298 | 7.8%), Business & Financial (227 | 5.9%), Education Instruction & Library (172 | 4.5%), and Computers, Engineering & Science (149 | 3.9%).
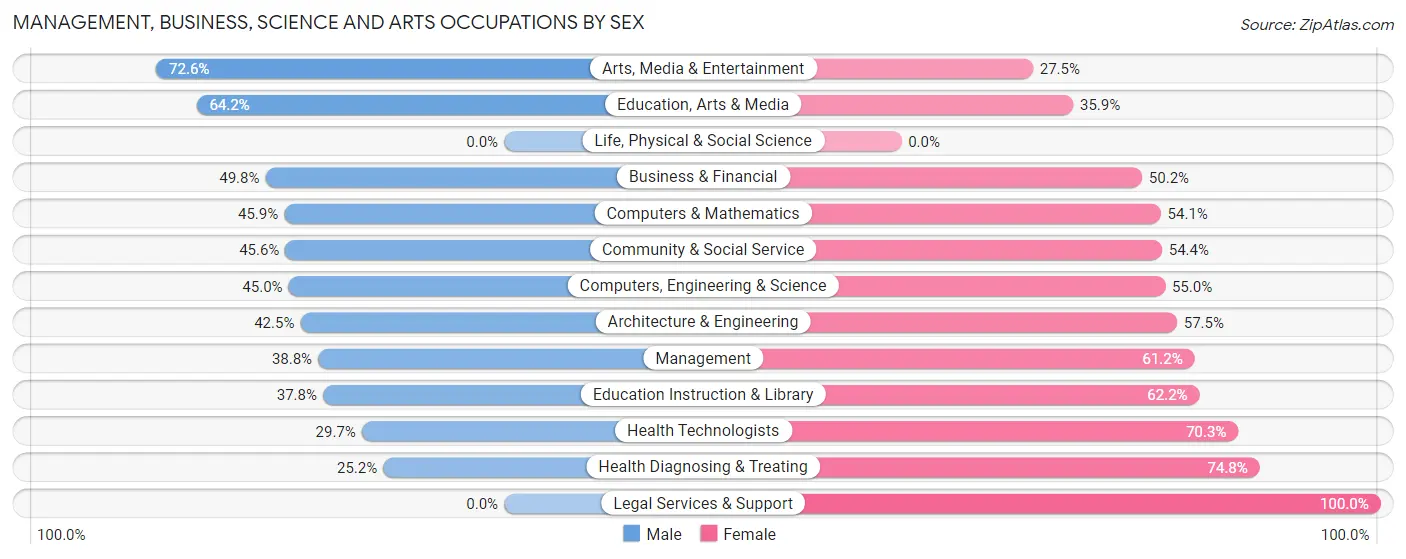
Management, Business, Science and Arts Occupations by Sex
Within the Management, Business, Science and Arts occupations in New Milford, the most male-oriented occupations are Arts, Media & Entertainment (72.6%), Education, Arts & Media (64.1%), and Business & Financial (49.8%), while the most female-oriented occupations are Legal Services & Support (100.0%), Health Diagnosing & Treating (74.8%), and Health Technologists (70.3%).
| Occupation | Male | Female |
| Management | 144 (38.8%) | 227 (61.2%) |
| Business & Financial | 113 (49.8%) | 114 (50.2%) |
| Computers, Engineering & Science | 67 (45.0%) | 82 (55.0%) |
| Computers & Mathematics | 50 (45.9%) | 59 (54.1%) |
| Architecture & Engineering | 17 (42.5%) | 23 (57.5%) |
| Life, Physical & Social Science | 0 (0.0%) | 0 (0.0%) |
| Community & Social Service | 136 (45.6%) | 162 (54.4%) |
| Education, Arts & Media | 34 (64.1%) | 19 (35.8%) |
| Legal Services & Support | 0 (0.0%) | 22 (100.0%) |
| Education Instruction & Library | 65 (37.8%) | 107 (62.2%) |
| Arts, Media & Entertainment | 37 (72.6%) | 14 (27.5%) |
| Health Diagnosing & Treating | 28 (25.2%) | 83 (74.8%) |
| Health Technologists | 19 (29.7%) | 45 (70.3%) |
| Total (Category) | 488 (42.2%) | 668 (57.8%) |
| Total (Overall) | 1,938 (50.8%) | 1,876 (49.2%) |
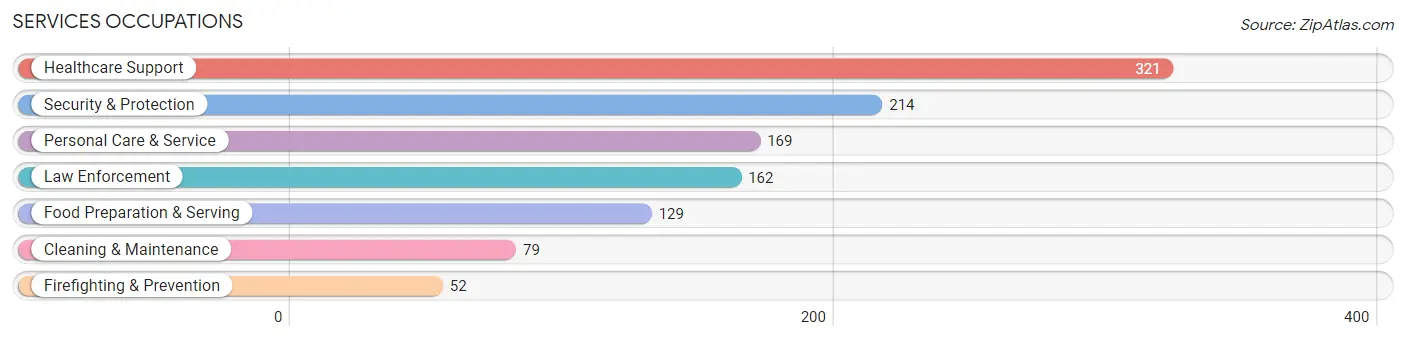
Services Occupations
The most common Services occupations in New Milford are Healthcare Support (321 | 8.4%), Security & Protection (214 | 5.6%), Personal Care & Service (169 | 4.4%), Law Enforcement (162 | 4.3%), and Food Preparation & Serving (129 | 3.4%).
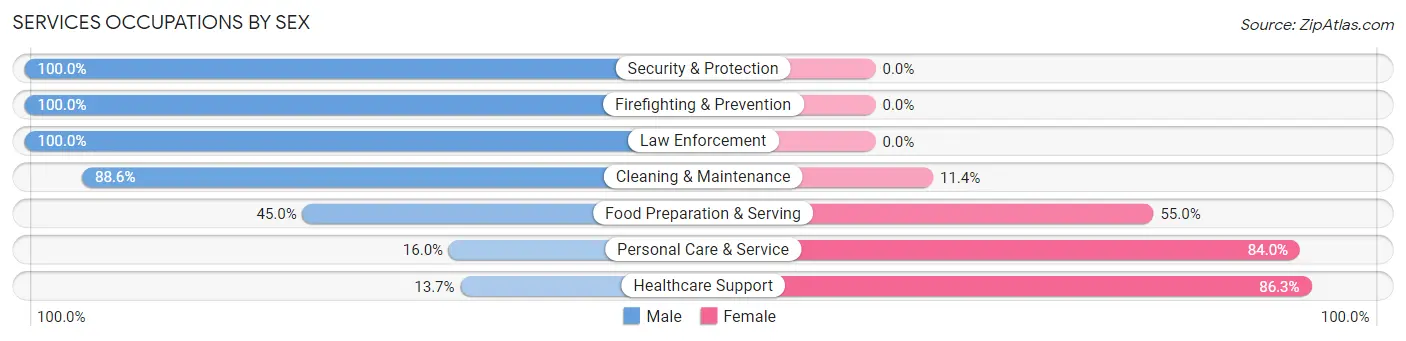
Services Occupations by Sex
Within the Services occupations in New Milford, the most male-oriented occupations are Security & Protection (100.0%), Firefighting & Prevention (100.0%), and Law Enforcement (100.0%), while the most female-oriented occupations are Healthcare Support (86.3%), Personal Care & Service (84.0%), and Food Preparation & Serving (55.0%).
| Occupation | Male | Female |
| Healthcare Support | 44 (13.7%) | 277 (86.3%) |
| Security & Protection | 214 (100.0%) | 0 (0.0%) |
| Firefighting & Prevention | 52 (100.0%) | 0 (0.0%) |
| Law Enforcement | 162 (100.0%) | 0 (0.0%) |
| Food Preparation & Serving | 58 (45.0%) | 71 (55.0%) |
| Cleaning & Maintenance | 70 (88.6%) | 9 (11.4%) |
| Personal Care & Service | 27 (16.0%) | 142 (84.0%) |
| Total (Category) | 413 (45.3%) | 499 (54.7%) |
| Total (Overall) | 1,938 (50.8%) | 1,876 (49.2%) |
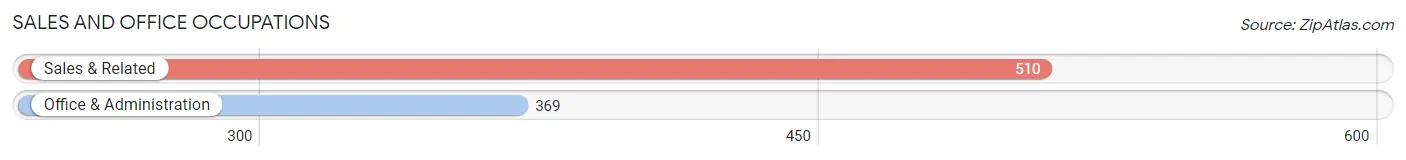
Sales and Office Occupations
The most common Sales and Office occupations in New Milford are Sales & Related (510 | 13.4%), and Office & Administration (369 | 9.7%).
Sales and Office Occupations by Sex

| Occupation | Male | Female |
| Sales & Related | 231 (45.3%) | 279 (54.7%) |
| Office & Administration | 71 (19.2%) | 298 (80.8%) |
| Total (Category) | 302 (34.4%) | 577 (65.6%) |
| Total (Overall) | 1,938 (50.8%) | 1,876 (49.2%) |
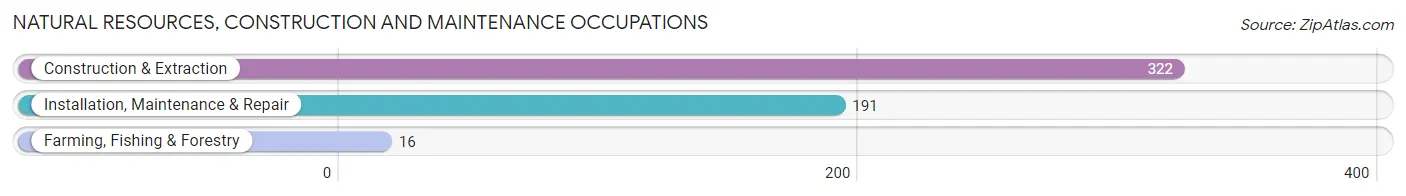
Natural Resources, Construction and Maintenance Occupations
The most common Natural Resources, Construction and Maintenance occupations in New Milford are Construction & Extraction (322 | 8.4%), Installation, Maintenance & Repair (191 | 5.0%), and Farming, Fishing & Forestry (16 | 0.4%).
Natural Resources, Construction and Maintenance Occupations by Sex
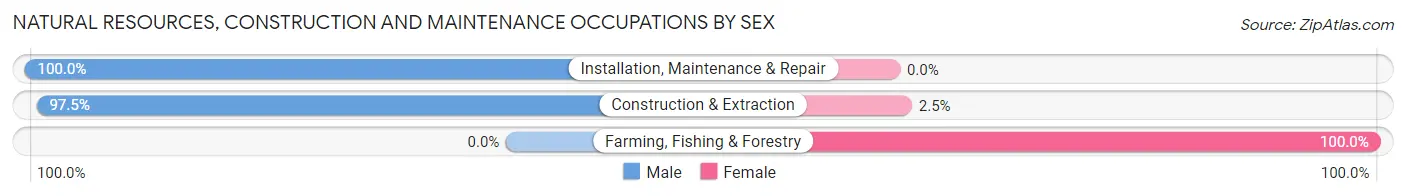
| Occupation | Male | Female |
| Farming, Fishing & Forestry | 0 (0.0%) | 16 (100.0%) |
| Construction & Extraction | 314 (97.5%) | 8 (2.5%) |
| Installation, Maintenance & Repair | 191 (100.0%) | 0 (0.0%) |
| Total (Category) | 505 (95.5%) | 24 (4.5%) |
| Total (Overall) | 1,938 (50.8%) | 1,876 (49.2%) |
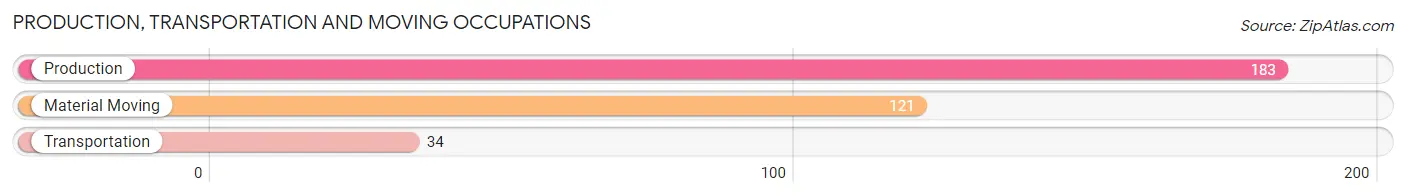
Production, Transportation and Moving Occupations
The most common Production, Transportation and Moving occupations in New Milford are Production (183 | 4.8%), Material Moving (121 | 3.2%), and Transportation (34 | 0.9%).
Production, Transportation and Moving Occupations by Sex
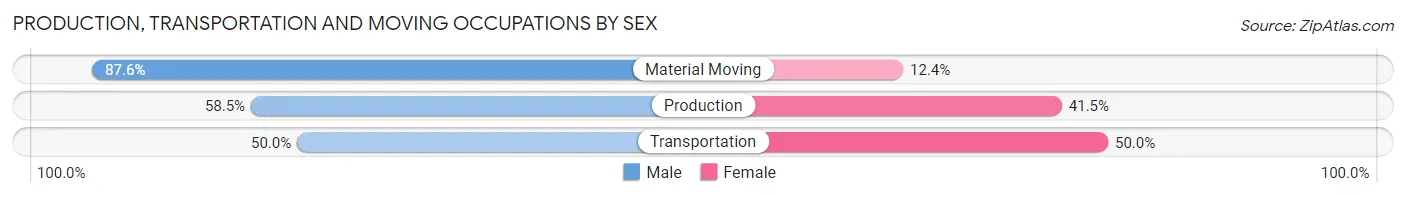
| Occupation | Male | Female |
| Production | 107 (58.5%) | 76 (41.5%) |
| Transportation | 17 (50.0%) | 17 (50.0%) |
| Material Moving | 106 (87.6%) | 15 (12.4%) |
| Total (Category) | 230 (68.0%) | 108 (32.0%) |
| Total (Overall) | 1,938 (50.8%) | 1,876 (49.2%) |
Employment Industries by Sex in New Milford
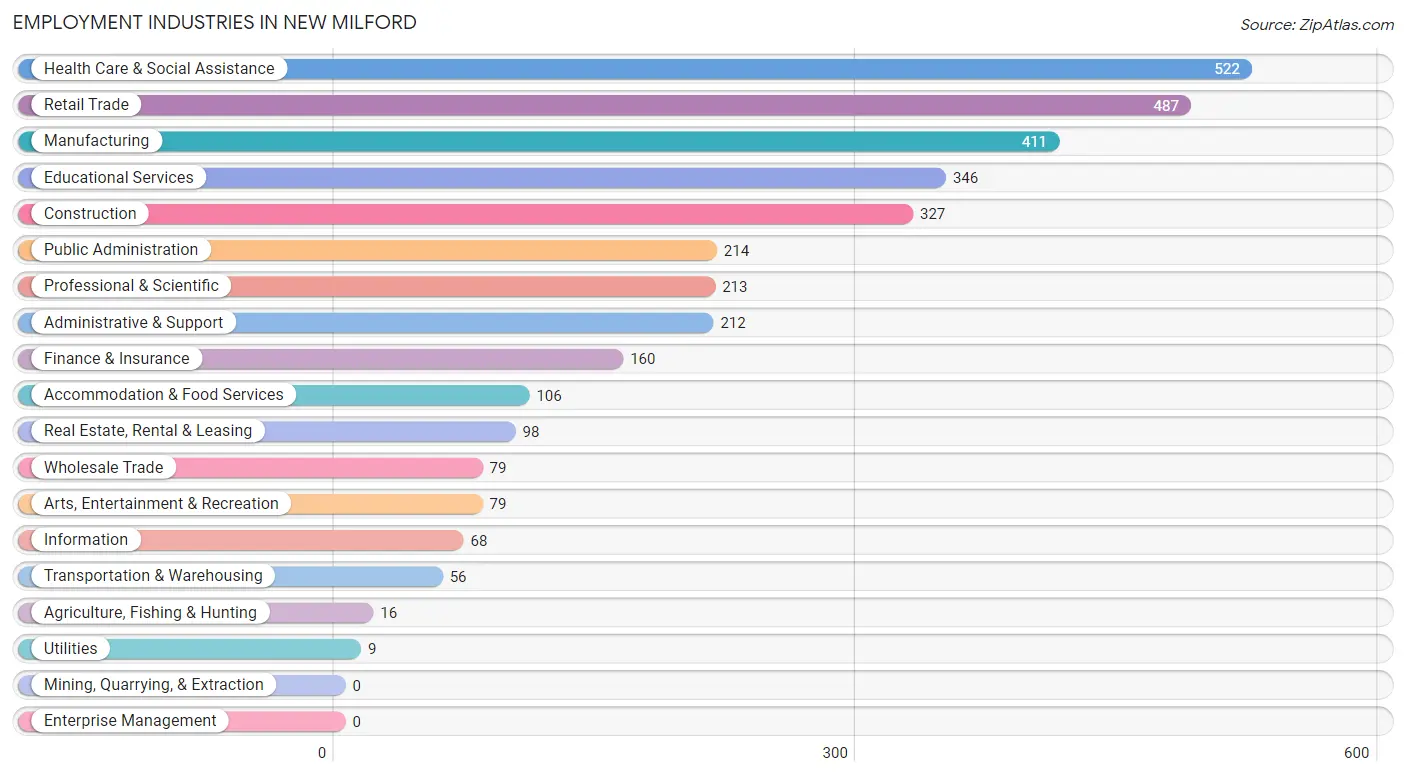
Employment Industries in New Milford
The major employment industries in New Milford include Health Care & Social Assistance (522 | 13.7%), Retail Trade (487 | 12.8%), Manufacturing (411 | 10.8%), Educational Services (346 | 9.1%), and Construction (327 | 8.6%).
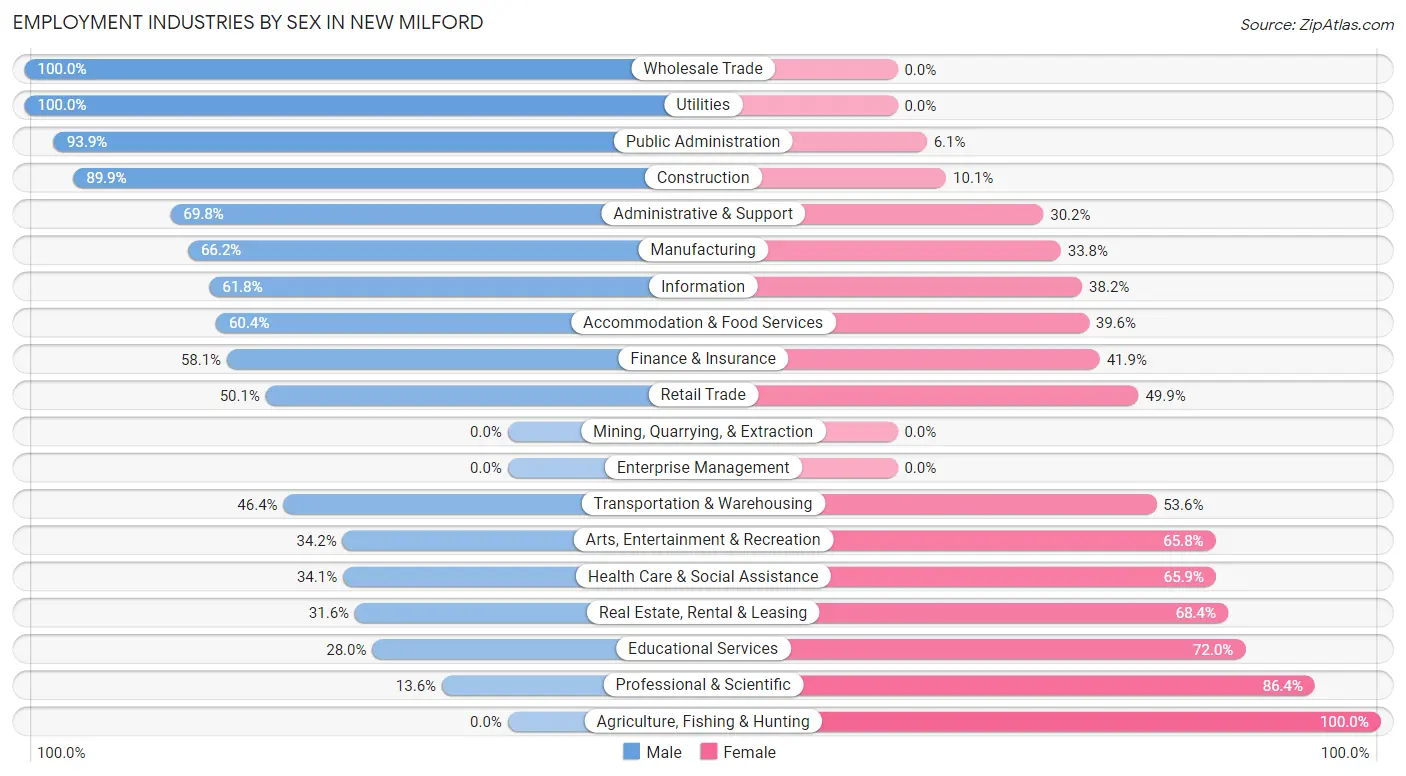
Employment Industries by Sex in New Milford
The New Milford industries that see more men than women are Wholesale Trade (100.0%), Utilities (100.0%), and Public Administration (93.9%), whereas the industries that tend to have a higher number of women are Agriculture, Fishing & Hunting (100.0%), Professional & Scientific (86.4%), and Educational Services (72.0%).
| Industry | Male | Female |
| Agriculture, Fishing & Hunting | 0 (0.0%) | 16 (100.0%) |
| Mining, Quarrying, & Extraction | 0 (0.0%) | 0 (0.0%) |
| Construction | 294 (89.9%) | 33 (10.1%) |
| Manufacturing | 272 (66.2%) | 139 (33.8%) |
| Wholesale Trade | 79 (100.0%) | 0 (0.0%) |
| Retail Trade | 244 (50.1%) | 243 (49.9%) |
| Transportation & Warehousing | 26 (46.4%) | 30 (53.6%) |
| Utilities | 9 (100.0%) | 0 (0.0%) |
| Information | 42 (61.8%) | 26 (38.2%) |
| Finance & Insurance | 93 (58.1%) | 67 (41.9%) |
| Real Estate, Rental & Leasing | 31 (31.6%) | 67 (68.4%) |
| Professional & Scientific | 29 (13.6%) | 184 (86.4%) |
| Enterprise Management | 0 (0.0%) | 0 (0.0%) |
| Administrative & Support | 148 (69.8%) | 64 (30.2%) |
| Educational Services | 97 (28.0%) | 249 (72.0%) |
| Health Care & Social Assistance | 178 (34.1%) | 344 (65.9%) |
| Arts, Entertainment & Recreation | 27 (34.2%) | 52 (65.8%) |
| Accommodation & Food Services | 64 (60.4%) | 42 (39.6%) |
| Public Administration | 201 (93.9%) | 13 (6.1%) |
| Total | 1,938 (50.8%) | 1,876 (49.2%) |
Education in New Milford
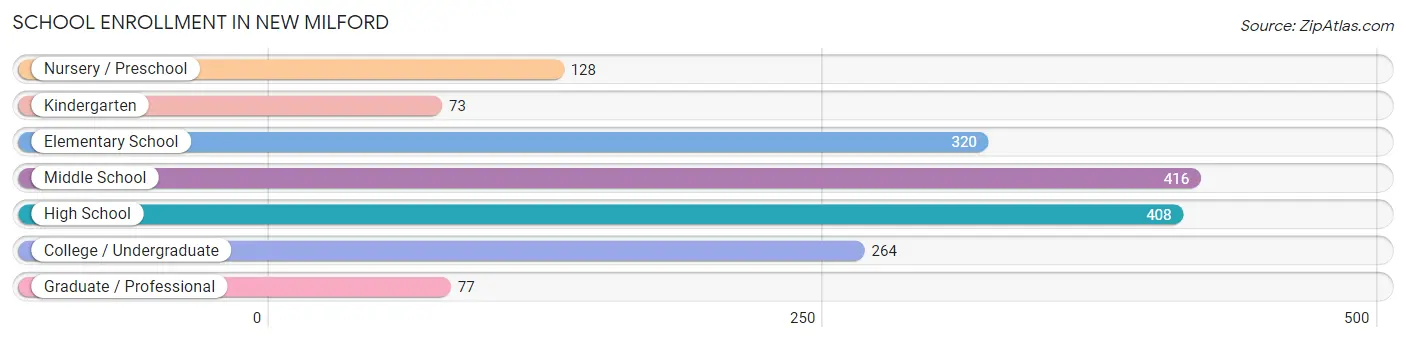
School Enrollment in New Milford
The most common levels of schooling among the 1,686 students in New Milford are middle school (416 | 24.7%), high school (408 | 24.2%), and elementary school (320 | 19.0%).
| School Level | # Students | % Students |
| Nursery / Preschool | 128 | 7.6% |
| Kindergarten | 73 | 4.3% |
| Elementary School | 320 | 19.0% |
| Middle School | 416 | 24.7% |
| High School | 408 | 24.2% |
| College / Undergraduate | 264 | 15.7% |
| Graduate / Professional | 77 | 4.6% |
| Total | 1,686 | 100.0% |
School Enrollment by Age by Funding Source in New Milford
Out of a total of 1,686 students who are enrolled in schools in New Milford, 256 (15.2%) attend a private institution, while the remaining 1,430 (84.8%) are enrolled in public schools. The age group of 18 to 19 year olds has the highest likelihood of being enrolled in private schools, with 30 (61.2% in the age bracket) enrolled. Conversely, the age group of 5 to 9 year old has the lowest likelihood of being enrolled in a private school, with 399 (100.0% in the age bracket) attending a public institution.
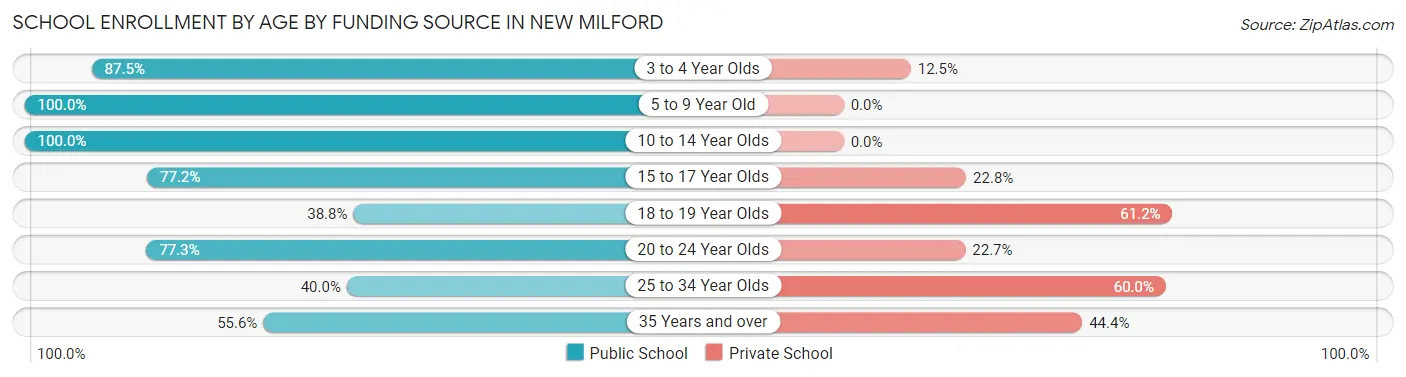
| Age Bracket | Public School | Private School |
| 3 to 4 Year Olds | 112 (87.5%) | 16 (12.5%) |
| 5 to 9 Year Old | 399 (100.0%) | 0 (0.0%) |
| 10 to 14 Year Olds | 410 (100.0%) | 0 (0.0%) |
| 15 to 17 Year Olds | 291 (77.2%) | 86 (22.8%) |
| 18 to 19 Year Olds | 19 (38.8%) | 30 (61.2%) |
| 20 to 24 Year Olds | 133 (77.3%) | 39 (22.7%) |
| 25 to 34 Year Olds | 46 (40.0%) | 69 (60.0%) |
| 35 Years and over | 20 (55.6%) | 16 (44.4%) |
| Total | 1,430 (84.8%) | 256 (15.2%) |
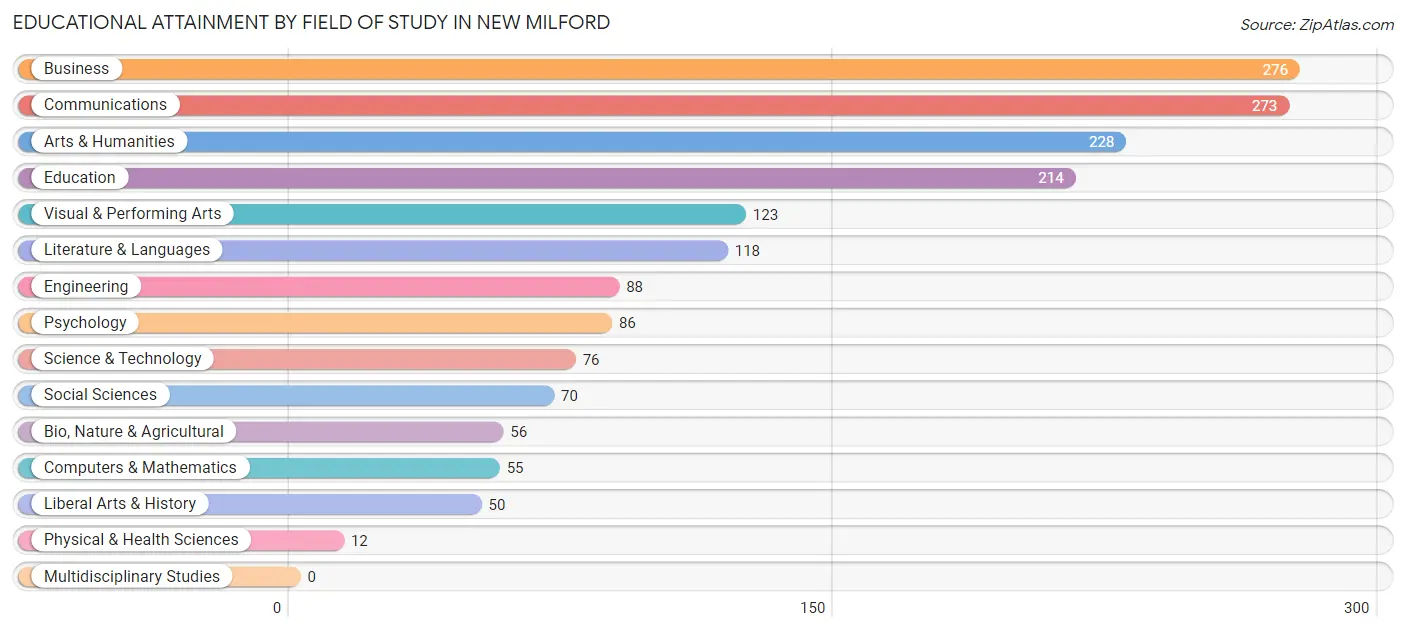
Educational Attainment by Field of Study in New Milford
Business (276 | 16.0%), communications (273 | 15.8%), arts & humanities (228 | 13.2%), education (214 | 12.4%), and visual & performing arts (123 | 7.1%) are the most common fields of study among 1,725 individuals in New Milford who have obtained a bachelor's degree or higher.
| Field of Study | # Graduates | % Graduates |
| Computers & Mathematics | 55 | 3.2% |
| Bio, Nature & Agricultural | 56 | 3.3% |
| Physical & Health Sciences | 12 | 0.7% |
| Psychology | 86 | 5.0% |
| Social Sciences | 70 | 4.1% |
| Engineering | 88 | 5.1% |
| Multidisciplinary Studies | 0 | 0.0% |
| Science & Technology | 76 | 4.4% |
| Business | 276 | 16.0% |
| Education | 214 | 12.4% |
| Literature & Languages | 118 | 6.8% |
| Liberal Arts & History | 50 | 2.9% |
| Visual & Performing Arts | 123 | 7.1% |
| Communications | 273 | 15.8% |
| Arts & Humanities | 228 | 13.2% |
| Total | 1,725 | 100.0% |
Transportation & Commute in New Milford
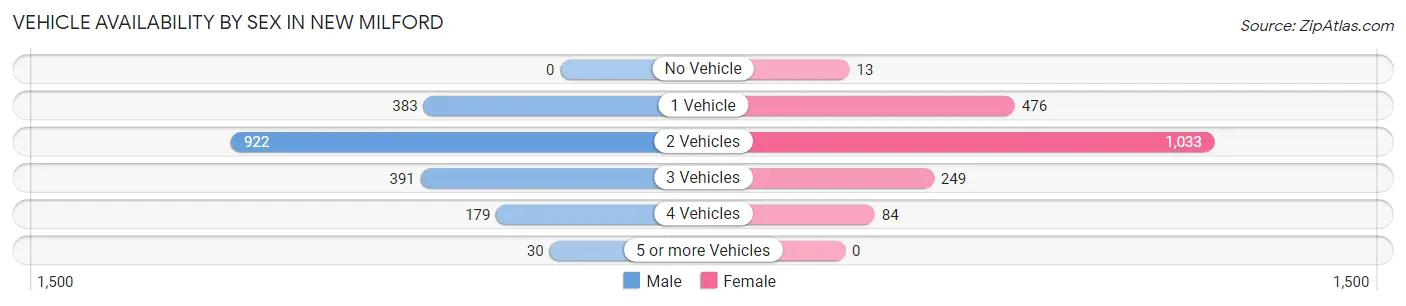
Vehicle Availability by Sex in New Milford
The most prevalent vehicle ownership categories in New Milford are males with 2 vehicles (922, accounting for 48.4%) and females with 2 vehicles (1,033, making up 49.7%).
| Vehicles Available | Male | Female |
| No Vehicle | 0 (0.0%) | 13 (0.7%) |
| 1 Vehicle | 383 (20.1%) | 476 (25.7%) |
| 2 Vehicles | 922 (48.4%) | 1,033 (55.7%) |
| 3 Vehicles | 391 (20.5%) | 249 (13.4%) |
| 4 Vehicles | 179 (9.4%) | 84 (4.5%) |
| 5 or more Vehicles | 30 (1.6%) | 0 (0.0%) |
| Total | 1,905 (100.0%) | 1,855 (100.0%) |
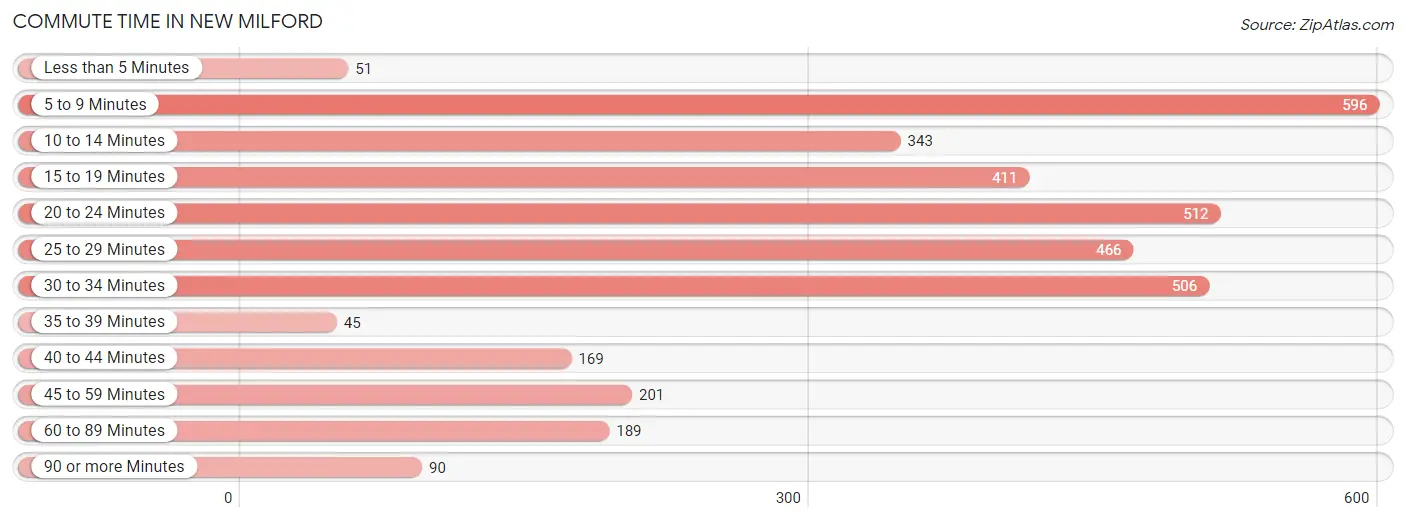
Commute Time in New Milford
The most frequently occuring commute durations in New Milford are 5 to 9 minutes (596 commuters, 16.7%), 20 to 24 minutes (512 commuters, 14.3%), and 30 to 34 minutes (506 commuters, 14.1%).
| Commute Time | # Commuters | % Commuters |
| Less than 5 Minutes | 51 | 1.4% |
| 5 to 9 Minutes | 596 | 16.7% |
| 10 to 14 Minutes | 343 | 9.6% |
| 15 to 19 Minutes | 411 | 11.5% |
| 20 to 24 Minutes | 512 | 14.3% |
| 25 to 29 Minutes | 466 | 13.0% |
| 30 to 34 Minutes | 506 | 14.1% |
| 35 to 39 Minutes | 45 | 1.3% |
| 40 to 44 Minutes | 169 | 4.7% |
| 45 to 59 Minutes | 201 | 5.6% |
| 60 to 89 Minutes | 189 | 5.3% |
| 90 or more Minutes | 90 | 2.5% |
Commute Time by Sex in New Milford
The most common commute times in New Milford are 20 to 24 minutes (294 commuters, 15.7%) for males and 5 to 9 minutes (369 commuters, 21.6%) for females.
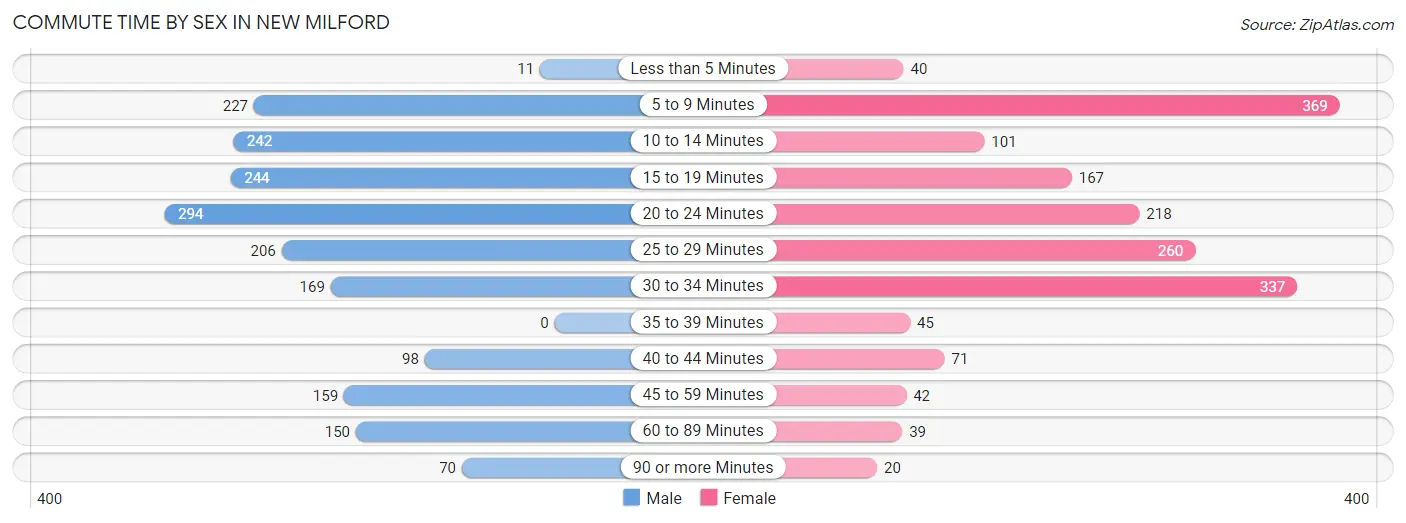
| Commute Time | Male | Female |
| Less than 5 Minutes | 11 (0.6%) | 40 (2.3%) |
| 5 to 9 Minutes | 227 (12.1%) | 369 (21.6%) |
| 10 to 14 Minutes | 242 (12.9%) | 101 (5.9%) |
| 15 to 19 Minutes | 244 (13.1%) | 167 (9.8%) |
| 20 to 24 Minutes | 294 (15.7%) | 218 (12.8%) |
| 25 to 29 Minutes | 206 (11.0%) | 260 (15.2%) |
| 30 to 34 Minutes | 169 (9.0%) | 337 (19.7%) |
| 35 to 39 Minutes | 0 (0.0%) | 45 (2.6%) |
| 40 to 44 Minutes | 98 (5.2%) | 71 (4.2%) |
| 45 to 59 Minutes | 159 (8.5%) | 42 (2.5%) |
| 60 to 89 Minutes | 150 (8.0%) | 39 (2.3%) |
| 90 or more Minutes | 70 (3.7%) | 20 (1.2%) |
Time of Departure to Work by Sex in New Milford
The most frequent times of departure to work in New Milford are 7:00 AM to 7:29 AM (445, 23.8%) for males and 8:00 AM to 8:29 AM (246, 14.4%) for females.
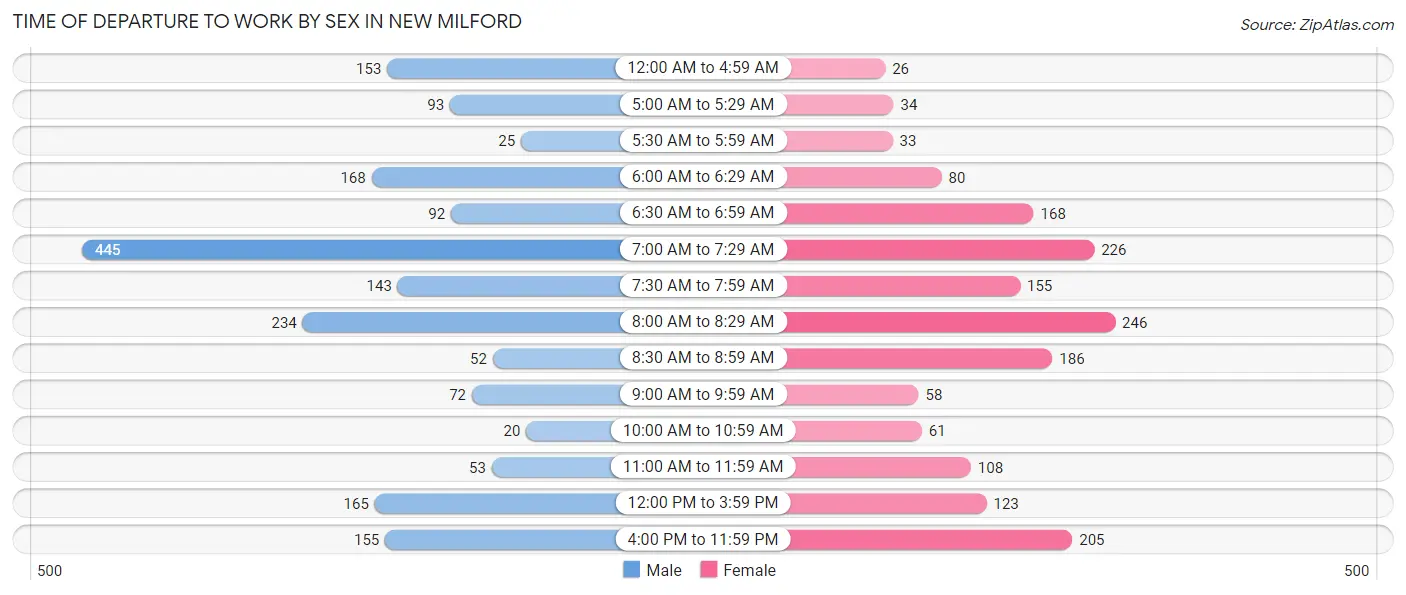
| Time of Departure | Male | Female |
| 12:00 AM to 4:59 AM | 153 (8.2%) | 26 (1.5%) |
| 5:00 AM to 5:29 AM | 93 (5.0%) | 34 (2.0%) |
| 5:30 AM to 5:59 AM | 25 (1.3%) | 33 (1.9%) |
| 6:00 AM to 6:29 AM | 168 (9.0%) | 80 (4.7%) |
| 6:30 AM to 6:59 AM | 92 (4.9%) | 168 (9.8%) |
| 7:00 AM to 7:29 AM | 445 (23.8%) | 226 (13.2%) |
| 7:30 AM to 7:59 AM | 143 (7.6%) | 155 (9.1%) |
| 8:00 AM to 8:29 AM | 234 (12.5%) | 246 (14.4%) |
| 8:30 AM to 8:59 AM | 52 (2.8%) | 186 (10.9%) |
| 9:00 AM to 9:59 AM | 72 (3.8%) | 58 (3.4%) |
| 10:00 AM to 10:59 AM | 20 (1.1%) | 61 (3.6%) |
| 11:00 AM to 11:59 AM | 53 (2.8%) | 108 (6.3%) |
| 12:00 PM to 3:59 PM | 165 (8.8%) | 123 (7.2%) |
| 4:00 PM to 11:59 PM | 155 (8.3%) | 205 (12.0%) |
| Total | 1,870 (100.0%) | 1,709 (100.0%) |
Housing Occupancy in New Milford
Occupancy by Ownership in New Milford
Of the total 2,764 dwellings in New Milford, owner-occupied units account for 1,640 (59.3%), while renter-occupied units make up 1,124 (40.7%).
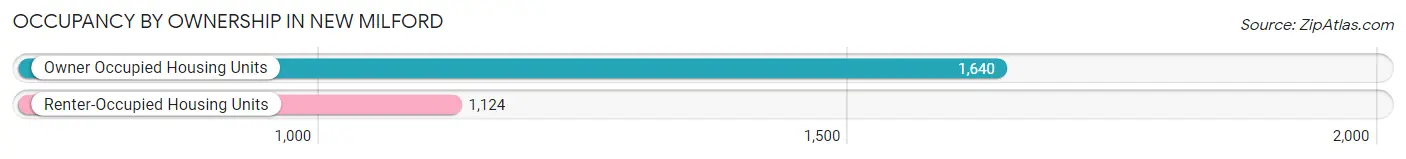
| Occupancy | # Housing Units | % Housing Units |
| Owner Occupied Housing Units | 1,640 | 59.3% |
| Renter-Occupied Housing Units | 1,124 | 40.7% |
| Total Occupied Housing Units | 2,764 | 100.0% |
Occupancy by Household Size in New Milford
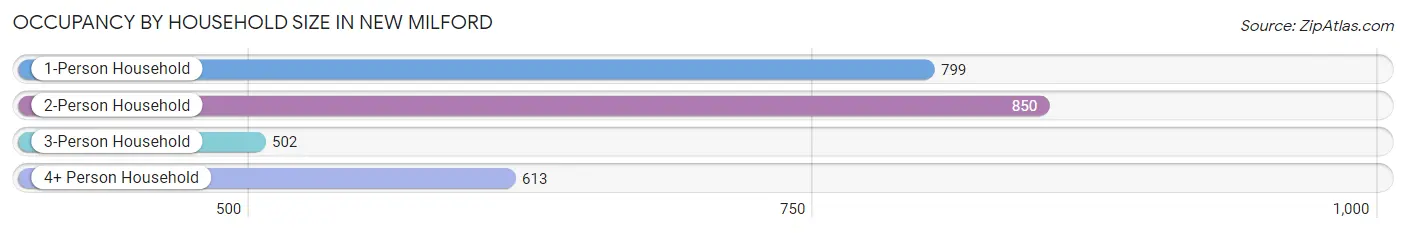
| Household Size | # Housing Units | % Housing Units |
| 1-Person Household | 799 | 28.9% |
| 2-Person Household | 850 | 30.7% |
| 3-Person Household | 502 | 18.2% |
| 4+ Person Household | 613 | 22.2% |
| Total Housing Units | 2,764 | 100.0% |
Occupancy by Ownership by Household Size in New Milford
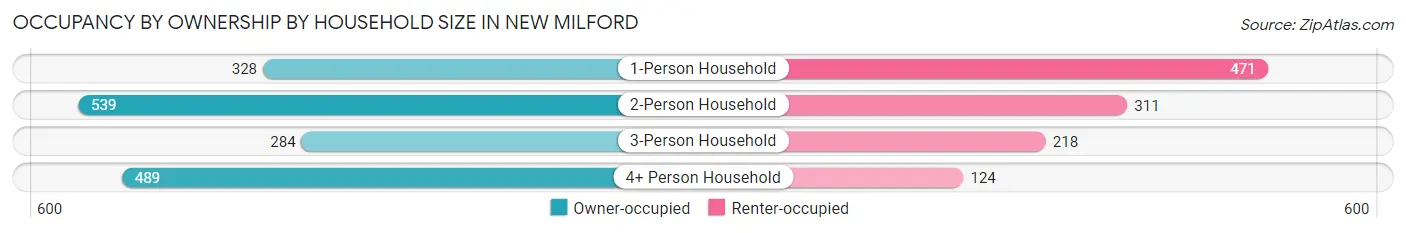
| Household Size | Owner-occupied | Renter-occupied |
| 1-Person Household | 328 (41.0%) | 471 (59.0%) |
| 2-Person Household | 539 (63.4%) | 311 (36.6%) |
| 3-Person Household | 284 (56.6%) | 218 (43.4%) |
| 4+ Person Household | 489 (79.8%) | 124 (20.2%) |
| Total Housing Units | 1,640 (59.3%) | 1,124 (40.7%) |
Occupancy by Educational Attainment in New Milford
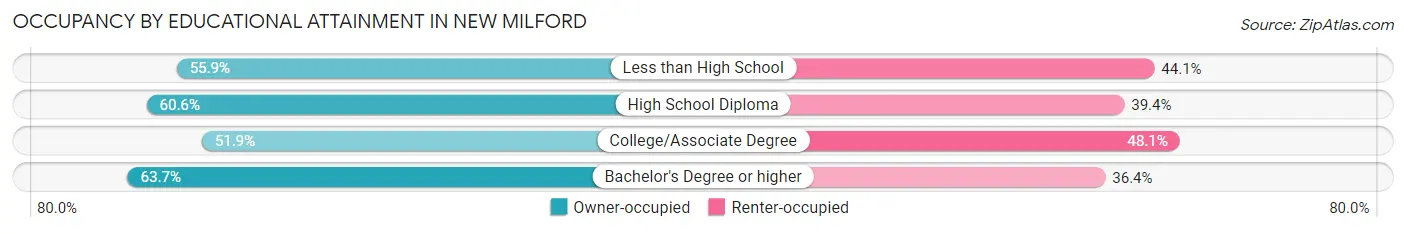
| Household Size | Owner-occupied | Renter-occupied |
| Less than High School | 100 (55.9%) | 79 (44.1%) |
| High School Diploma | 604 (60.6%) | 392 (39.4%) |
| College/Associate Degree | 332 (51.9%) | 308 (48.1%) |
| Bachelor's Degree or higher | 604 (63.6%) | 345 (36.3%) |
Occupancy by Age of Householder in New Milford
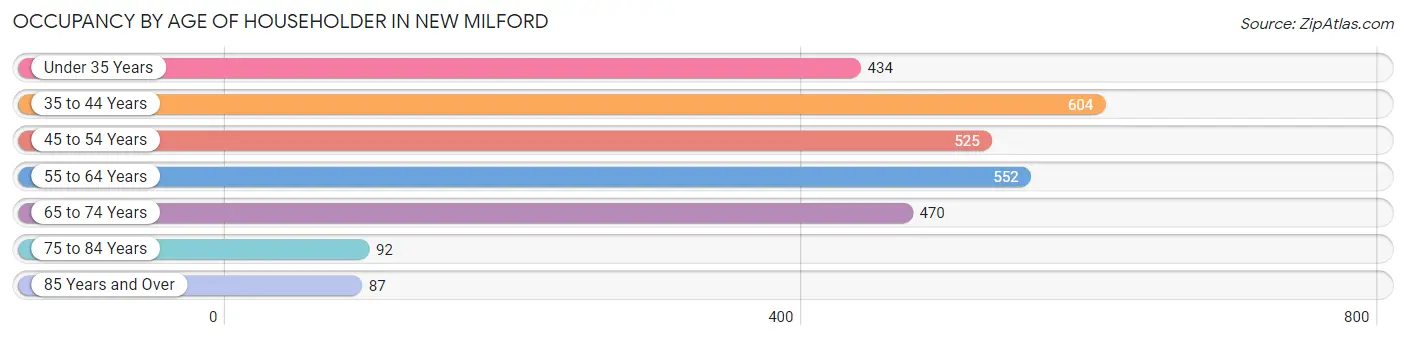
| Age Bracket | # Households | % Households |
| Under 35 Years | 434 | 15.7% |
| 35 to 44 Years | 604 | 21.8% |
| 45 to 54 Years | 525 | 19.0% |
| 55 to 64 Years | 552 | 20.0% |
| 65 to 74 Years | 470 | 17.0% |
| 75 to 84 Years | 92 | 3.3% |
| 85 Years and Over | 87 | 3.2% |
| Total | 2,764 | 100.0% |
Housing Finances in New Milford
Median Income by Occupancy in New Milford
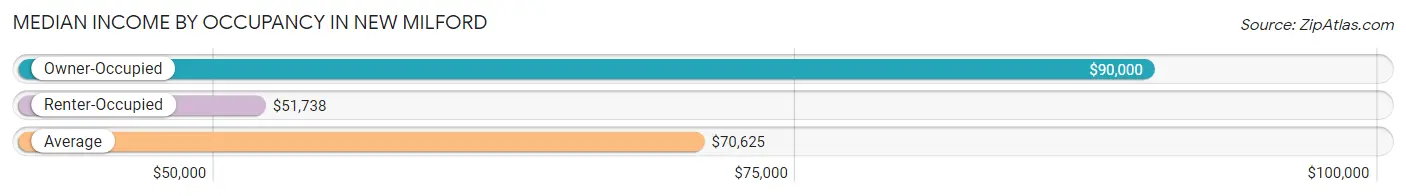
| Occupancy Type | # Households | Median Income |
| Owner-Occupied | 1,640 (59.3%) | $90,000 |
| Renter-Occupied | 1,124 (40.7%) | $51,738 |
| Average | 2,764 (100.0%) | $70,625 |
Occupancy by Householder Income Bracket in New Milford
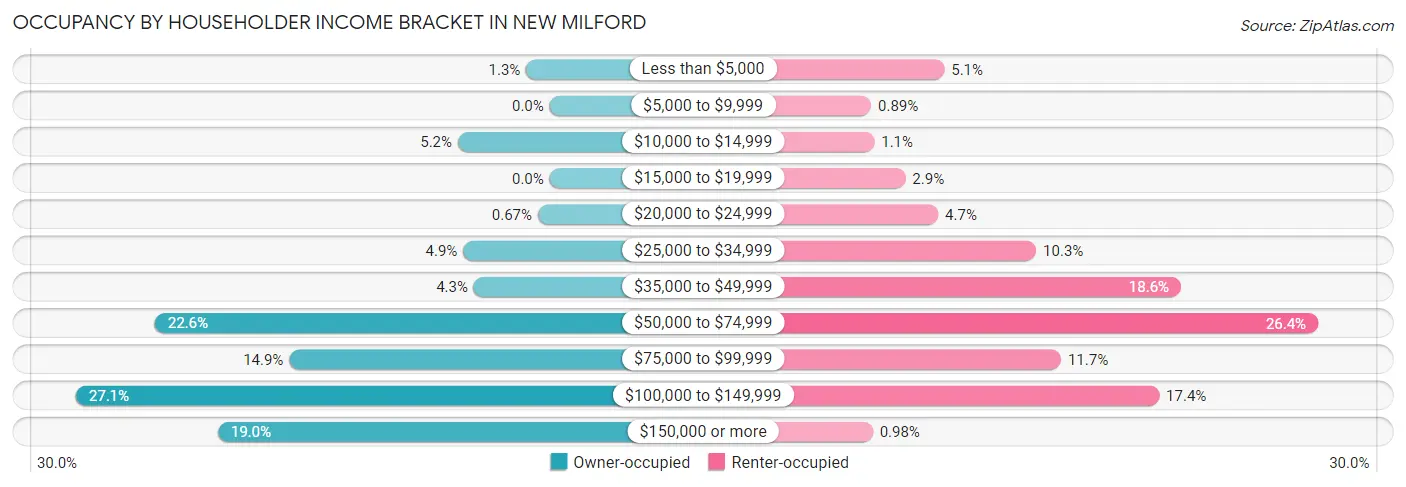
| Income Bracket | Owner-occupied | Renter-occupied |
| Less than $5,000 | 22 (1.3%) | 57 (5.1%) |
| $5,000 to $9,999 | 0 (0.0%) | 10 (0.9%) |
| $10,000 to $14,999 | 86 (5.2%) | 12 (1.1%) |
| $15,000 to $19,999 | 0 (0.0%) | 32 (2.9%) |
| $20,000 to $24,999 | 11 (0.7%) | 53 (4.7%) |
| $25,000 to $34,999 | 81 (4.9%) | 116 (10.3%) |
| $35,000 to $49,999 | 71 (4.3%) | 209 (18.6%) |
| $50,000 to $74,999 | 370 (22.6%) | 297 (26.4%) |
| $75,000 to $99,999 | 244 (14.9%) | 132 (11.7%) |
| $100,000 to $149,999 | 444 (27.1%) | 195 (17.3%) |
| $150,000 or more | 311 (19.0%) | 11 (1.0%) |
| Total | 1,640 (100.0%) | 1,124 (100.0%) |
Monthly Housing Cost Tiers in New Milford
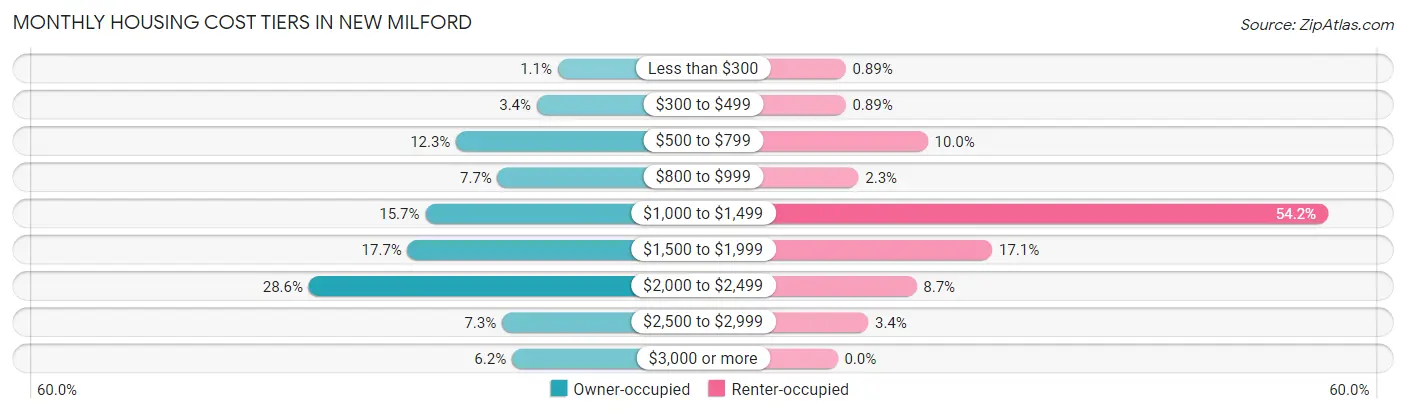
| Monthly Cost | Owner-occupied | Renter-occupied |
| Less than $300 | 18 (1.1%) | 10 (0.9%) |
| $300 to $499 | 56 (3.4%) | 10 (0.9%) |
| $500 to $799 | 202 (12.3%) | 112 (10.0%) |
| $800 to $999 | 127 (7.7%) | 26 (2.3%) |
| $1,000 to $1,499 | 258 (15.7%) | 609 (54.2%) |
| $1,500 to $1,999 | 290 (17.7%) | 192 (17.1%) |
| $2,000 to $2,499 | 469 (28.6%) | 98 (8.7%) |
| $2,500 to $2,999 | 119 (7.3%) | 38 (3.4%) |
| $3,000 or more | 101 (6.2%) | 0 (0.0%) |
| Total | 1,640 (100.0%) | 1,124 (100.0%) |
Physical Housing Characteristics in New Milford
Housing Structures in New Milford
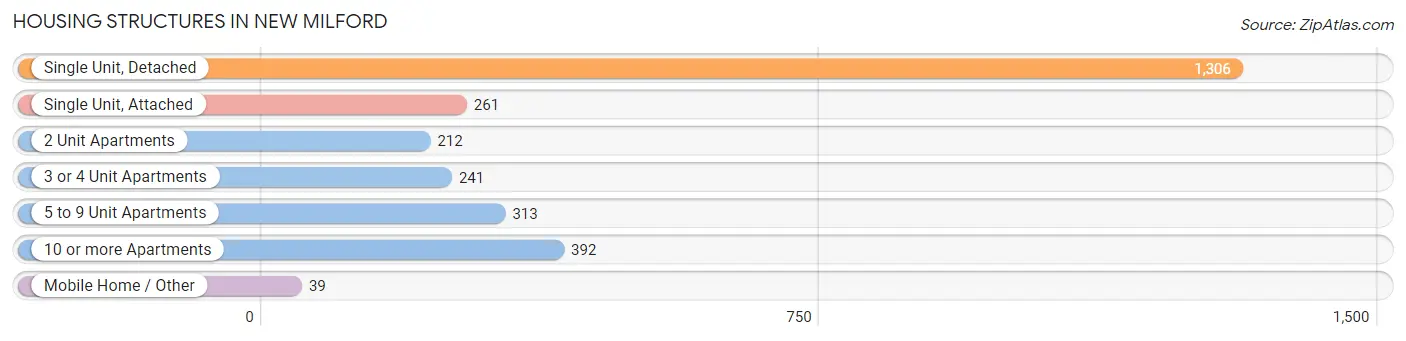
| Structure Type | # Housing Units | % Housing Units |
| Single Unit, Detached | 1,306 | 47.2% |
| Single Unit, Attached | 261 | 9.4% |
| 2 Unit Apartments | 212 | 7.7% |
| 3 or 4 Unit Apartments | 241 | 8.7% |
| 5 to 9 Unit Apartments | 313 | 11.3% |
| 10 or more Apartments | 392 | 14.2% |
| Mobile Home / Other | 39 | 1.4% |
| Total | 2,764 | 100.0% |
Housing Structures by Occupancy in New Milford
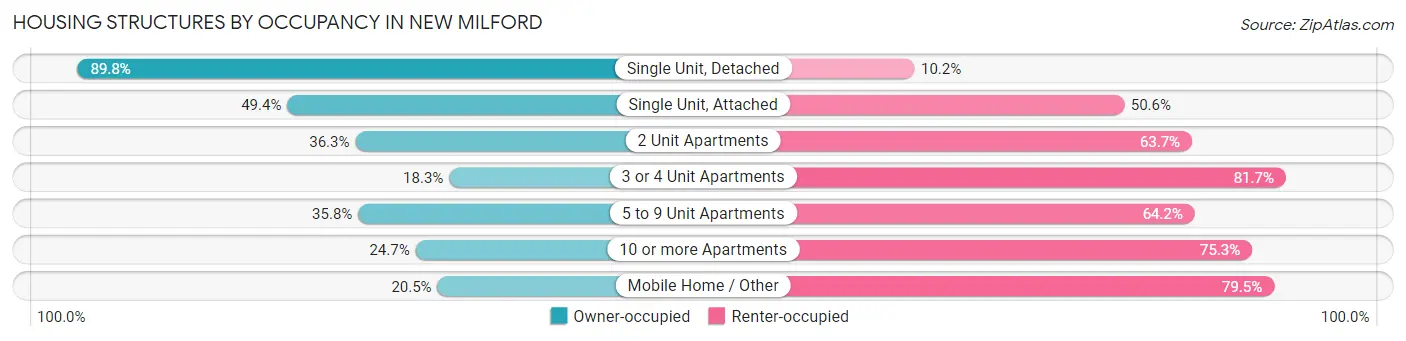
| Structure Type | Owner-occupied | Renter-occupied |
| Single Unit, Detached | 1,173 (89.8%) | 133 (10.2%) |
| Single Unit, Attached | 129 (49.4%) | 132 (50.6%) |
| 2 Unit Apartments | 77 (36.3%) | 135 (63.7%) |
| 3 or 4 Unit Apartments | 44 (18.3%) | 197 (81.7%) |
| 5 to 9 Unit Apartments | 112 (35.8%) | 201 (64.2%) |
| 10 or more Apartments | 97 (24.7%) | 295 (75.3%) |
| Mobile Home / Other | 8 (20.5%) | 31 (79.5%) |
| Total | 1,640 (59.3%) | 1,124 (40.7%) |
Housing Structures by Number of Rooms in New Milford
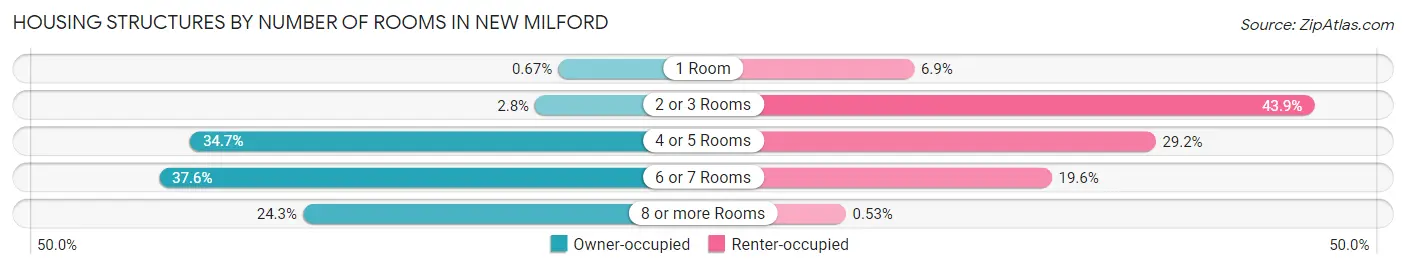
| Number of Rooms | Owner-occupied | Renter-occupied |
| 1 Room | 11 (0.7%) | 77 (6.9%) |
| 2 or 3 Rooms | 46 (2.8%) | 493 (43.9%) |
| 4 or 5 Rooms | 569 (34.7%) | 328 (29.2%) |
| 6 or 7 Rooms | 616 (37.6%) | 220 (19.6%) |
| 8 or more Rooms | 398 (24.3%) | 6 (0.5%) |
| Total | 1,640 (100.0%) | 1,124 (100.0%) |
Housing Structure by Heating Type in New Milford
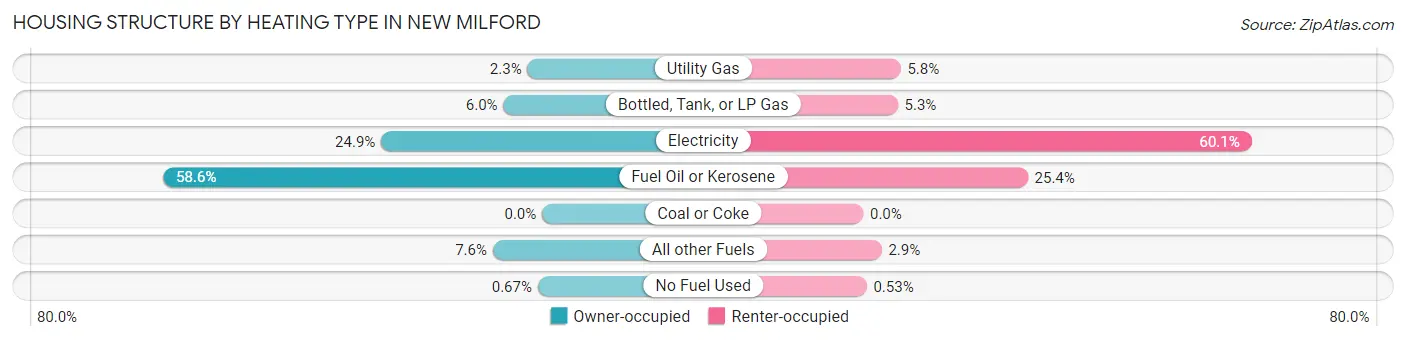
| Heating Type | Owner-occupied | Renter-occupied |
| Utility Gas | 37 (2.3%) | 65 (5.8%) |
| Bottled, Tank, or LP Gas | 98 (6.0%) | 60 (5.3%) |
| Electricity | 408 (24.9%) | 675 (60.1%) |
| Fuel Oil or Kerosene | 961 (58.6%) | 286 (25.4%) |
| Coal or Coke | 0 (0.0%) | 0 (0.0%) |
| All other Fuels | 125 (7.6%) | 32 (2.9%) |
| No Fuel Used | 11 (0.7%) | 6 (0.5%) |
| Total | 1,640 (100.0%) | 1,124 (100.0%) |
Household Vehicle Usage in New Milford
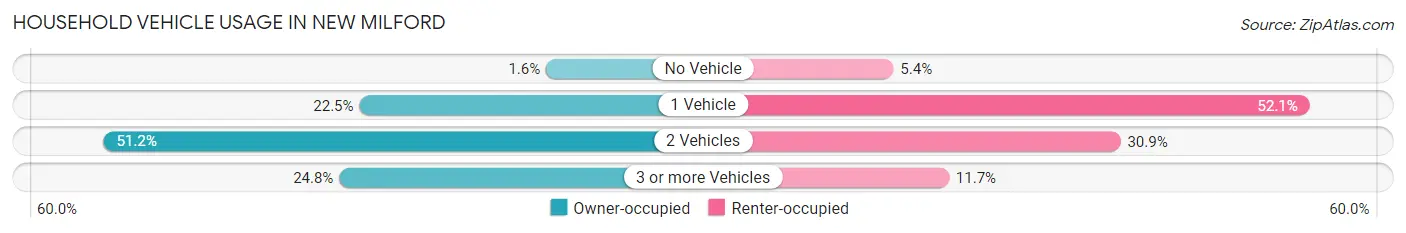
| Vehicles per Household | Owner-occupied | Renter-occupied |
| No Vehicle | 26 (1.6%) | 61 (5.4%) |
| 1 Vehicle | 369 (22.5%) | 585 (52.0%) |
| 2 Vehicles | 839 (51.2%) | 347 (30.9%) |
| 3 or more Vehicles | 406 (24.8%) | 131 (11.7%) |
| Total | 1,640 (100.0%) | 1,124 (100.0%) |
Real Estate & Mortgages in New Milford
Real Estate and Mortgage Overview in New Milford
| Characteristic | Without Mortgage | With Mortgage |
| Housing Units | 569 | 1,071 |
| Median Property Value | $333,200 | $278,300 |
| Median Household Income | $66,940 | $218 |
| Monthly Housing Costs | $843 | $101 |
| Real Estate Taxes | $4,679 | $12 |
Property Value by Mortgage Status in New Milford
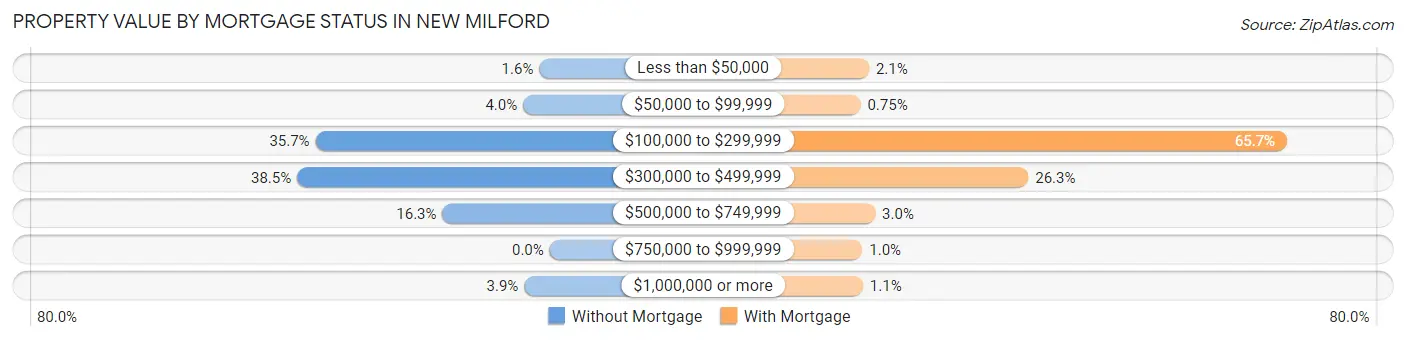
| Property Value | Without Mortgage | With Mortgage |
| Less than $50,000 | 9 (1.6%) | 22 (2.1%) |
| $50,000 to $99,999 | 23 (4.0%) | 8 (0.7%) |
| $100,000 to $299,999 | 203 (35.7%) | 704 (65.7%) |
| $300,000 to $499,999 | 219 (38.5%) | 282 (26.3%) |
| $500,000 to $749,999 | 93 (16.3%) | 32 (3.0%) |
| $750,000 to $999,999 | 0 (0.0%) | 11 (1.0%) |
| $1,000,000 or more | 22 (3.9%) | 12 (1.1%) |
| Total | 569 (100.0%) | 1,071 (100.0%) |
Household Income by Mortgage Status in New Milford
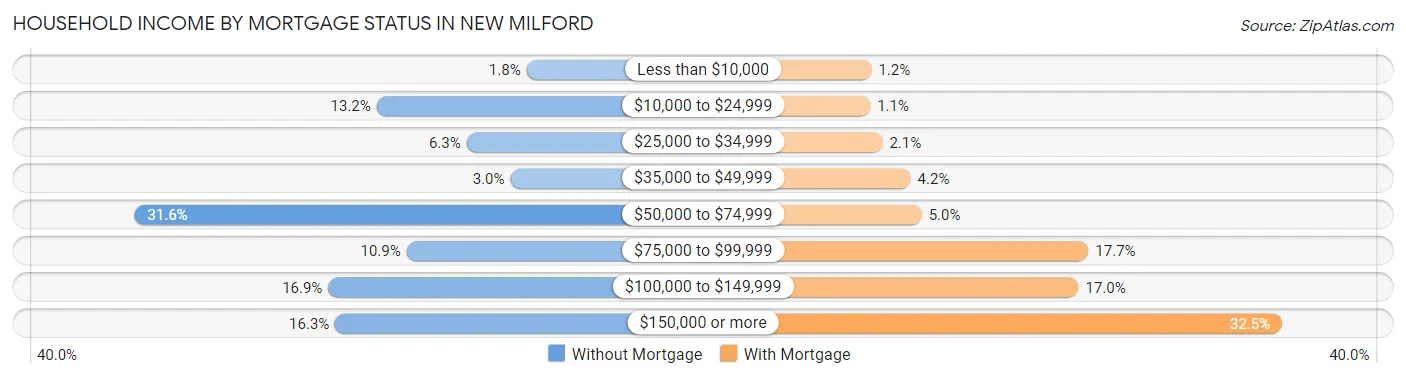
| Household Income | Without Mortgage | With Mortgage |
| Less than $10,000 | 10 (1.8%) | 13 (1.2%) |
| $10,000 to $24,999 | 75 (13.2%) | 12 (1.1%) |
| $25,000 to $34,999 | 36 (6.3%) | 22 (2.1%) |
| $35,000 to $49,999 | 17 (3.0%) | 45 (4.2%) |
| $50,000 to $74,999 | 180 (31.6%) | 54 (5.0%) |
| $75,000 to $99,999 | 62 (10.9%) | 190 (17.7%) |
| $100,000 to $149,999 | 96 (16.9%) | 182 (17.0%) |
| $150,000 or more | 93 (16.3%) | 348 (32.5%) |
| Total | 569 (100.0%) | 1,071 (100.0%) |
Property Value to Household Income Ratio in New Milford
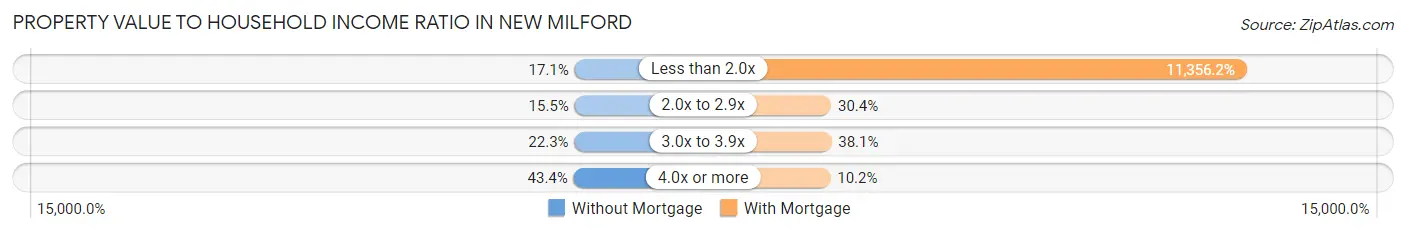
| Value-to-Income Ratio | Without Mortgage | With Mortgage |
| Less than 2.0x | 97 (17.1%) | 121,625 (11,356.2%) |
| 2.0x to 2.9x | 88 (15.5%) | 326 (30.4%) |
| 3.0x to 3.9x | 127 (22.3%) | 408 (38.1%) |
| 4.0x or more | 247 (43.4%) | 109 (10.2%) |
| Total | 569 (100.0%) | 1,071 (100.0%) |
Real Estate Taxes by Mortgage Status in New Milford
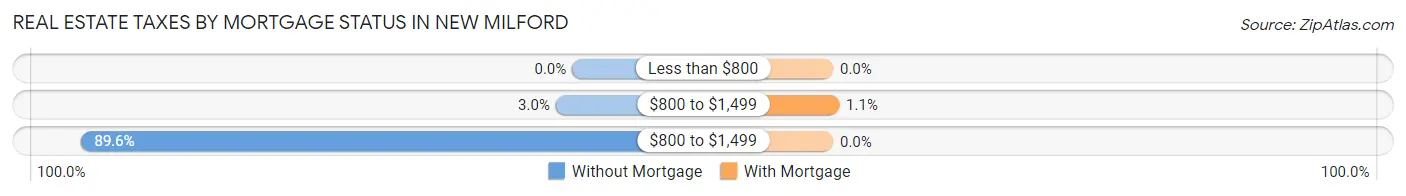
| Property Taxes | Without Mortgage | With Mortgage |
| Less than $800 | 0 (0.0%) | 0 (0.0%) |
| $800 to $1,499 | 17 (3.0%) | 12 (1.1%) |
| $800 to $1,499 | 510 (89.6%) | 0 (0.0%) |
| Total | 569 (100.0%) | 1,071 (100.0%) |
Health & Disability in New Milford
Health Insurance Coverage by Age in New Milford
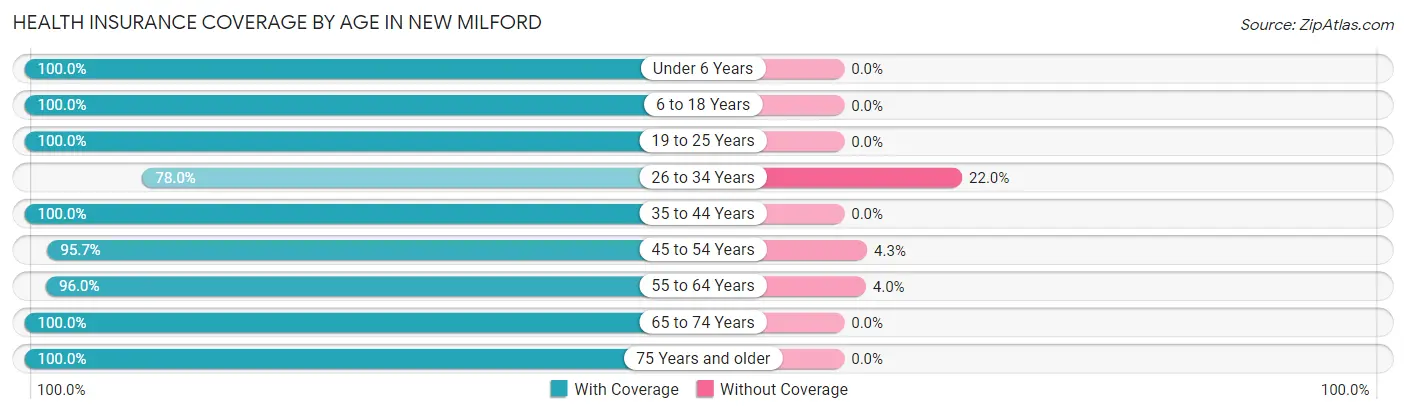
| Age Bracket | With Coverage | Without Coverage |
| Under 6 Years | 574 (100.0%) | 0 (0.0%) |
| 6 to 18 Years | 1,174 (100.0%) | 0 (0.0%) |
| 19 to 25 Years | 529 (100.0%) | 0 (0.0%) |
| 26 to 34 Years | 490 (78.0%) | 138 (22.0%) |
| 35 to 44 Years | 1,057 (100.0%) | 0 (0.0%) |
| 45 to 54 Years | 945 (95.7%) | 42 (4.3%) |
| 55 to 64 Years | 932 (96.0%) | 39 (4.0%) |
| 65 to 74 Years | 687 (100.0%) | 0 (0.0%) |
| 75 Years and older | 278 (100.0%) | 0 (0.0%) |
| Total | 6,666 (96.8%) | 219 (3.2%) |
Health Insurance Coverage by Citizenship Status in New Milford
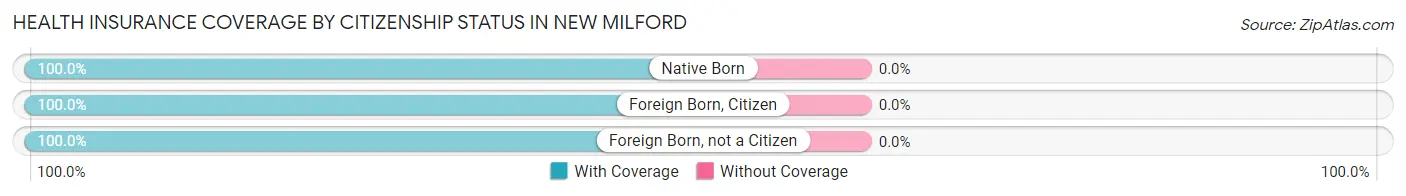
| Citizenship Status | With Coverage | Without Coverage |
| Native Born | 574 (100.0%) | 0 (0.0%) |
| Foreign Born, Citizen | 1,174 (100.0%) | 0 (0.0%) |
| Foreign Born, not a Citizen | 529 (100.0%) | 0 (0.0%) |
Health Insurance Coverage by Household Income in New Milford
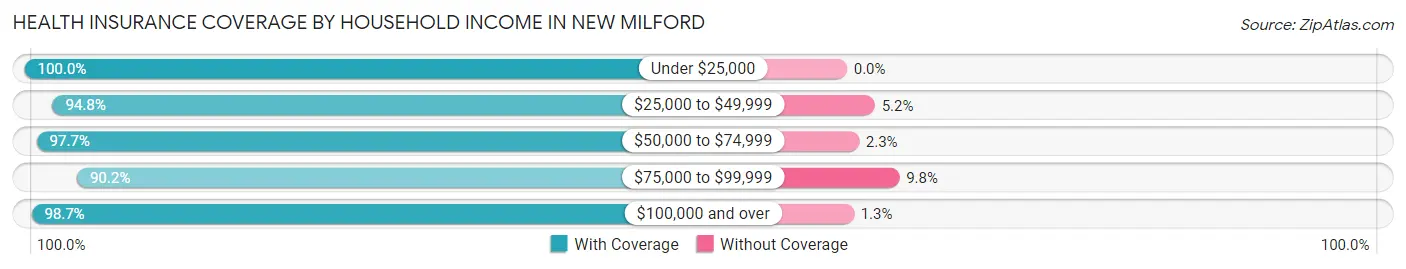
| Household Income | With Coverage | Without Coverage |
| Under $25,000 | 478 (100.0%) | 0 (0.0%) |
| $25,000 to $49,999 | 814 (94.8%) | 45 (5.2%) |
| $50,000 to $74,999 | 1,640 (97.7%) | 38 (2.3%) |
| $75,000 to $99,999 | 909 (90.2%) | 99 (9.8%) |
| $100,000 and over | 2,825 (98.7%) | 37 (1.3%) |
Public vs Private Health Insurance Coverage by Age in New Milford
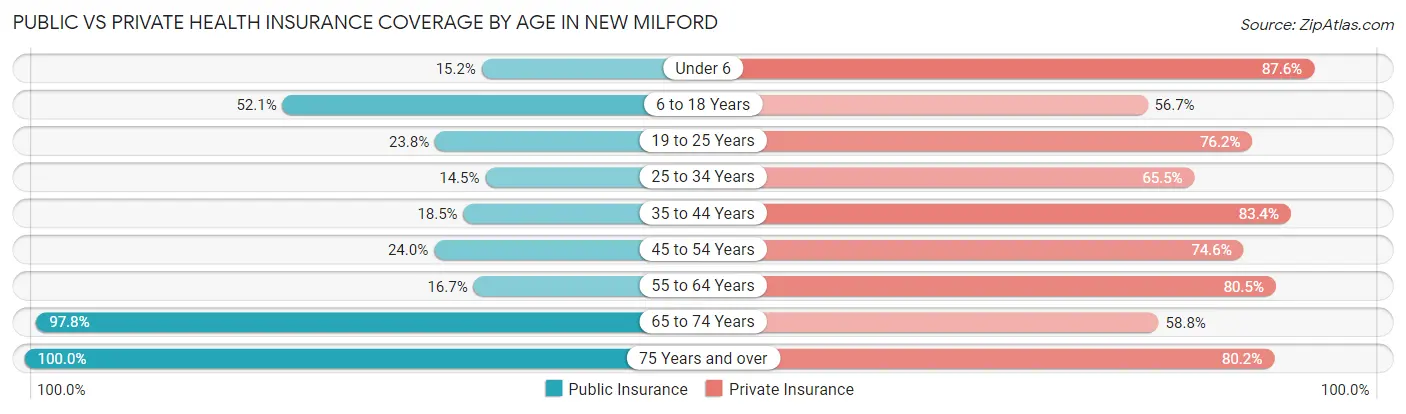
| Age Bracket | Public Insurance | Private Insurance |
| Under 6 | 87 (15.2%) | 503 (87.6%) |
| 6 to 18 Years | 612 (52.1%) | 666 (56.7%) |
| 19 to 25 Years | 126 (23.8%) | 403 (76.2%) |
| 25 to 34 Years | 91 (14.5%) | 411 (65.4%) |
| 35 to 44 Years | 196 (18.5%) | 881 (83.4%) |
| 45 to 54 Years | 237 (24.0%) | 736 (74.6%) |
| 55 to 64 Years | 162 (16.7%) | 782 (80.5%) |
| 65 to 74 Years | 672 (97.8%) | 404 (58.8%) |
| 75 Years and over | 278 (100.0%) | 223 (80.2%) |
| Total | 2,461 (35.7%) | 5,009 (72.8%) |
Disability Status by Sex by Age in New Milford
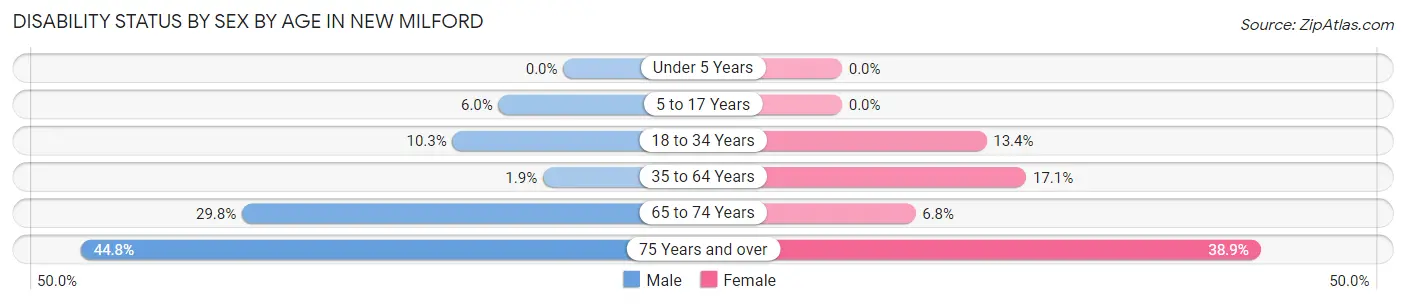
| Age Bracket | Male | Female |
| Under 5 Years | 0 (0.0%) | 0 (0.0%) |
| 5 to 17 Years | 34 (6.0%) | 0 (0.0%) |
| 18 to 34 Years | 70 (10.3%) | 68 (13.4%) |
| 35 to 64 Years | 25 (1.9%) | 289 (17.1%) |
| 65 to 74 Years | 113 (29.8%) | 21 (6.8%) |
| 75 Years and over | 30 (44.8%) | 82 (38.9%) |
Disability Class by Sex by Age in New Milford
Disability Class: Hearing Difficulty
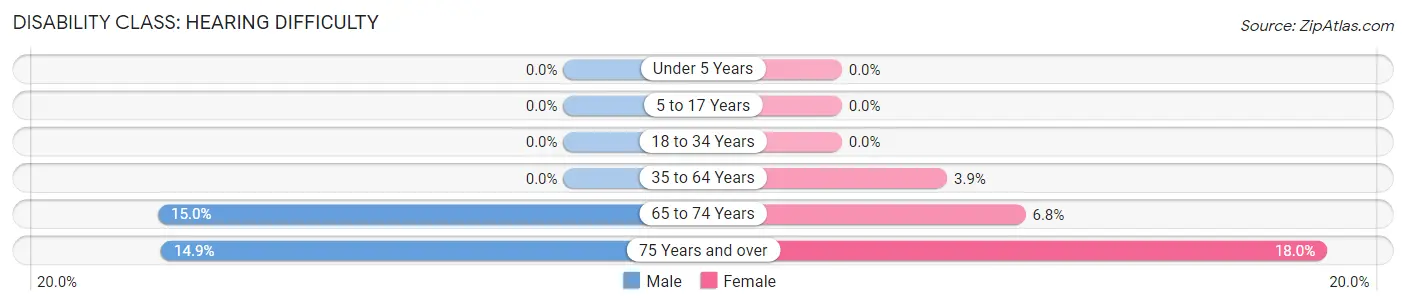
| Age Bracket | Male | Female |
| Under 5 Years | 0 (0.0%) | 0 (0.0%) |
| 5 to 17 Years | 0 (0.0%) | 0 (0.0%) |
| 18 to 34 Years | 0 (0.0%) | 0 (0.0%) |
| 35 to 64 Years | 0 (0.0%) | 66 (3.9%) |
| 65 to 74 Years | 57 (15.0%) | 21 (6.8%) |
| 75 Years and over | 10 (14.9%) | 38 (18.0%) |
Disability Class: Vision Difficulty
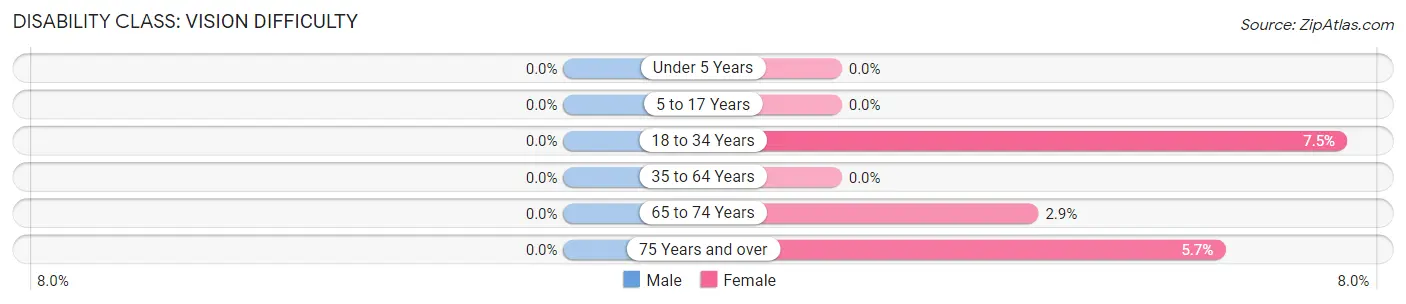
| Age Bracket | Male | Female |
| Under 5 Years | 0 (0.0%) | 0 (0.0%) |
| 5 to 17 Years | 0 (0.0%) | 0 (0.0%) |
| 18 to 34 Years | 0 (0.0%) | 38 (7.5%) |
| 35 to 64 Years | 0 (0.0%) | 0 (0.0%) |
| 65 to 74 Years | 0 (0.0%) | 9 (2.9%) |
| 75 Years and over | 0 (0.0%) | 12 (5.7%) |
Disability Class: Cognitive Difficulty
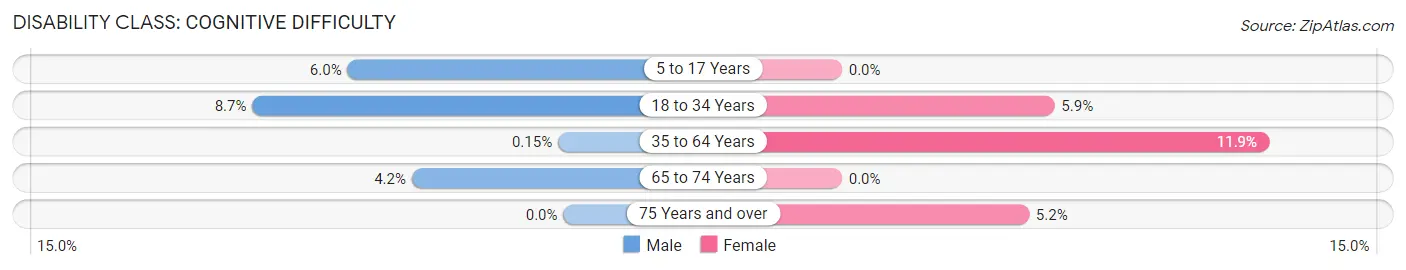
| Age Bracket | Male | Female |
| 5 to 17 Years | 34 (6.0%) | 0 (0.0%) |
| 18 to 34 Years | 59 (8.7%) | 30 (5.9%) |
| 35 to 64 Years | 2 (0.2%) | 201 (11.9%) |
| 65 to 74 Years | 16 (4.2%) | 0 (0.0%) |
| 75 Years and over | 0 (0.0%) | 11 (5.2%) |
Disability Class: Ambulatory Difficulty
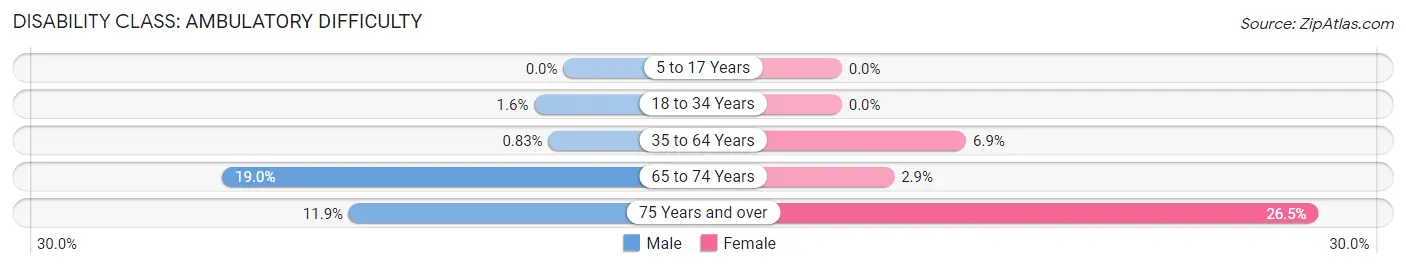
| Age Bracket | Male | Female |
| 5 to 17 Years | 0 (0.0%) | 0 (0.0%) |
| 18 to 34 Years | 11 (1.6%) | 0 (0.0%) |
| 35 to 64 Years | 11 (0.8%) | 117 (6.9%) |
| 65 to 74 Years | 72 (19.0%) | 9 (2.9%) |
| 75 Years and over | 8 (11.9%) | 56 (26.5%) |
Disability Class: Self-Care Difficulty
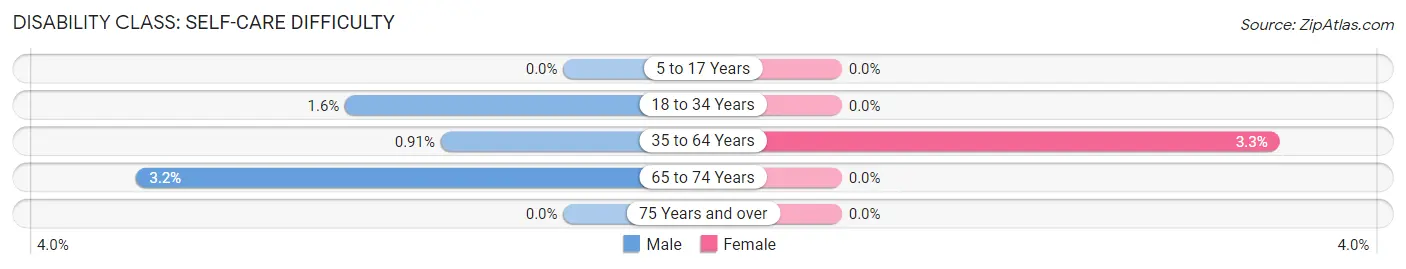
| Age Bracket | Male | Female |
| 5 to 17 Years | 0 (0.0%) | 0 (0.0%) |
| 18 to 34 Years | 11 (1.6%) | 0 (0.0%) |
| 35 to 64 Years | 12 (0.9%) | 55 (3.3%) |
| 65 to 74 Years | 12 (3.2%) | 0 (0.0%) |
| 75 Years and over | 0 (0.0%) | 0 (0.0%) |
Technology Access in New Milford
Computing Device Access in New Milford
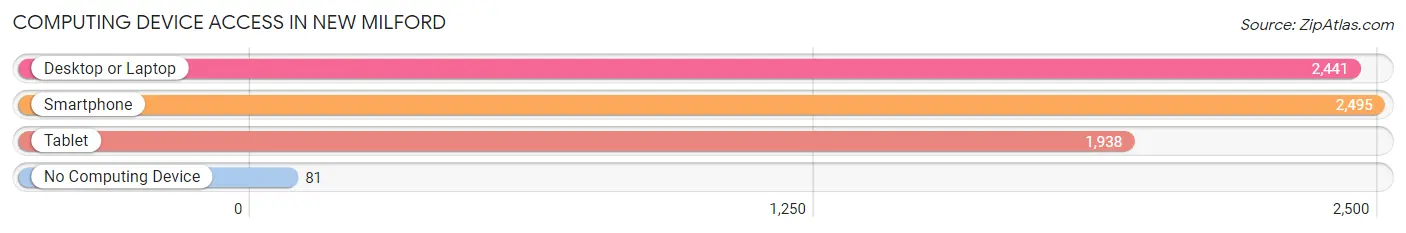
| Device Type | # Households | % Households |
| Desktop or Laptop | 2,441 | 88.3% |
| Smartphone | 2,495 | 90.3% |
| Tablet | 1,938 | 70.1% |
| No Computing Device | 81 | 2.9% |
| Total | 2,764 | 100.0% |
Internet Access in New Milford
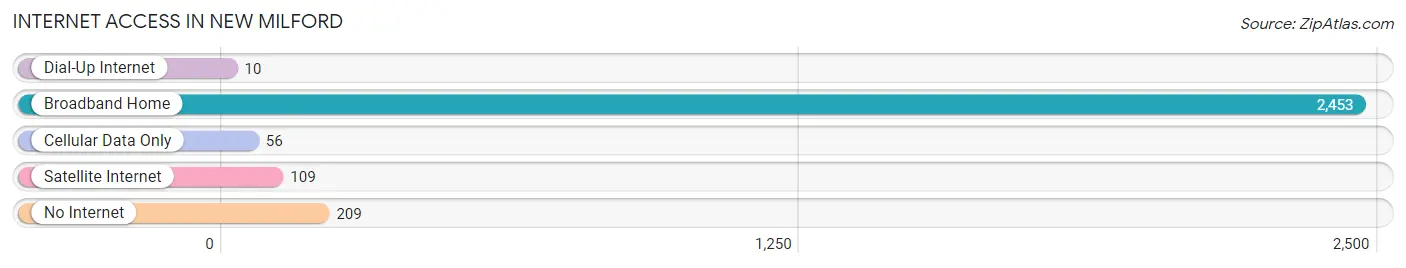
| Internet Type | # Households | % Households |
| Dial-Up Internet | 10 | 0.4% |
| Broadband Home | 2,453 | 88.7% |
| Cellular Data Only | 56 | 2.0% |
| Satellite Internet | 109 | 3.9% |
| No Internet | 209 | 7.6% |
| Total | 2,764 | 100.0% |
New Milford Summary
New Milford, Connecticut is a town located in Litchfield County, Connecticut. It is situated in the foothills of the Berkshire Mountains, and is bordered by the towns of Bridgewater, Roxbury, Washington, Kent, and Sherman. The town has a population of 28,061, according to the 2010 census, and is the largest town in Litchfield County.
History
New Milford was first settled in 1707 by a group of settlers from Milford, Connecticut. The town was incorporated in 1712, and was named after the original settlement. The town was an agricultural community, and was known for its production of tobacco, corn, and dairy products.
In the 19th century, the town began to industrialize, and the first cotton mill was built in 1810. The town also had several sawmills, gristmills, and tanneries. The town was also home to several factories, including a paper mill, a hat factory, and a woolen mill.
In the 20th century, the town continued to grow and develop. The town was home to several large companies, including the New Milford Foundry and Machine Company, the New Milford Manufacturing Company, and the New Milford Electric Company.
Geography
New Milford is located in the foothills of the Berkshire Mountains, and is bordered by the towns of Bridgewater, Roxbury, Washington, Kent, and Sherman. The town has a total area of 39.3 square miles, of which 37.7 square miles is land and 1.6 square miles is water. The town is located in the Housatonic River Valley, and is home to several lakes, including Lake Lillinonah, Lake Waramaug, and Lake Candlewood.
Economy
New Milford’s economy is largely based on manufacturing and tourism. The town is home to several large companies, including the New Milford Foundry and Machine Company, the New Milford Manufacturing Company, and the New Milford Electric Company. The town is also home to several small businesses, including restaurants, retail stores, and professional services.
The town is also a popular tourist destination, and is home to several attractions, including the New Milford Historical Society, the New Milford Museum, and the New Milford Green. The town is also home to several parks, including the New Milford Town Park, the New Milford River Park, and the New Milford Nature Center.
Demographics
According to the 2010 census, the town has a population of 28,061. The population is made up of 11,845 households, and the median household income is $68,945. The town is predominantly white, with 87.3% of the population identifying as white. The town also has a large Hispanic population, with 8.3% of the population identifying as Hispanic or Latino. The town also has a small African American population, with 1.3% of the population identifying as African American.
Common Questions
What is Per Capita Income in New Milford?
Per Capita income in New Milford is $36,334.
What is the Median Family Income in New Milford?
Median Family Income in New Milford is $81,828.
What is the Median Household income in New Milford?
Median Household Income in New Milford is $70,625.
What is Income or Wage Gap in New Milford?
Income or Wage Gap in New Milford is 40.1%.
Women in New Milford earn 59.9 cents for every dollar earned by a man.
What is Inequality or Gini Index in New Milford?
Inequality or Gini Index in New Milford is 0.39.
What is the Total Population of New Milford?
Total Population of New Milford is 7,095.
What is the Total Male Population of New Milford?
Total Male Population of New Milford is 3,170.
What is the Total Female Population of New Milford?
Total Female Population of New Milford is 3,925.
What is the Ratio of Males per 100 Females in New Milford?
There are 80.76 Males per 100 Females in New Milford.
What is the Ratio of Females per 100 Males in New Milford?
There are 123.82 Females per 100 Males in New Milford.
What is the Median Population Age in New Milford?
Median Population Age in New Milford is 41.0 Years.
What is the Average Family Size in New Milford
Average Family Size in New Milford is 3.2 People.
What is the Average Household Size in New Milford
Average Household Size in New Milford is 2.5 People.
How Large is the Labor Force in New Milford?
There are 3,980 People in the Labor Forcein in New Milford.
What is the Percentage of People in the Labor Force in New Milford?
69.9% of People are in the Labor Force in New Milford.
What is the Unemployment Rate in New Milford?
Unemployment Rate in New Milford is 4.1%.