North Granby, CT Map & Demographics
North Granby Map
North Granby Overview
$65,549
PER CAPITA INCOME
$137,411
AVG FAMILY INCOME
$114,519
AVG HOUSEHOLD INCOME
41.9%
WAGE / INCOME GAP [ % ]
58.1¢/ $1
WAGE / INCOME GAP [ $ ]
0.39
INEQUALITY / GINI INDEX
1,556
TOTAL POPULATION
833
MALE POPULATION
723
FEMALE POPULATION
115.21
MALES / 100 FEMALES
86.79
FEMALES / 100 MALES
52.3
MEDIAN AGE
2.8
AVG FAMILY SIZE
2.6
AVG HOUSEHOLD SIZE
894
LABOR FORCE [ PEOPLE ]
73.8%
PERCENT IN LABOR FORCE
North Granby Zip Codes
North Granby Area Codes
Income in North Granby
Income Overview in North Granby
Per Capita Income in North Granby is $65,549, while median incomes of families and households are $137,411 and $114,519 respectively.
| Characteristic | Number | Measure |
| Per Capita Income | 1,556 | $65,549 |
| Median Family Income | 497 | $137,411 |
| Mean Family Income | 497 | $189,212 |
| Median Household Income | 606 | $114,519 |
| Mean Household Income | 606 | $165,090 |
| Income Deficit | 497 | $0 |
| Wage / Income Gap (%) | 1,556 | 41.86% |
| Wage / Income Gap ($) | 1,556 | 58.14¢ per $1 |
| Gini / Inequality Index | 1,556 | 0.39 |
Earnings by Sex in North Granby
Average Earnings in North Granby are $73,630, $78,581 for men and $45,685 for women, a difference of 41.9%.
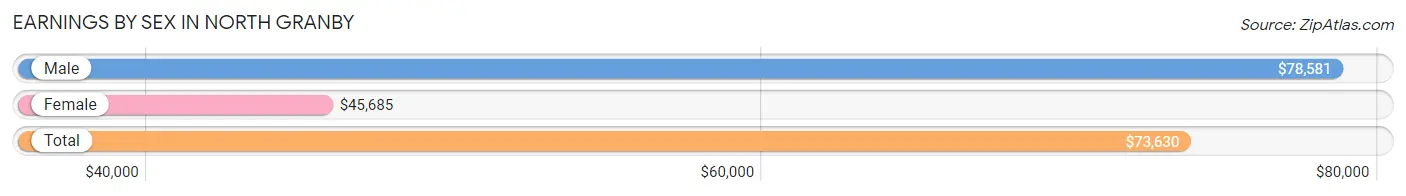
| Sex | Number | Average Earnings |
| Male | 506 (54.9%) | $78,581 |
| Female | 415 (45.1%) | $45,685 |
| Total | 921 (100.0%) | $73,630 |
Earnings by Sex by Income Bracket in North Granby
The most common earnings brackets in North Granby are $100,000+ for men (155 | 30.6%) and $100,000+ for women (114 | 27.5%).
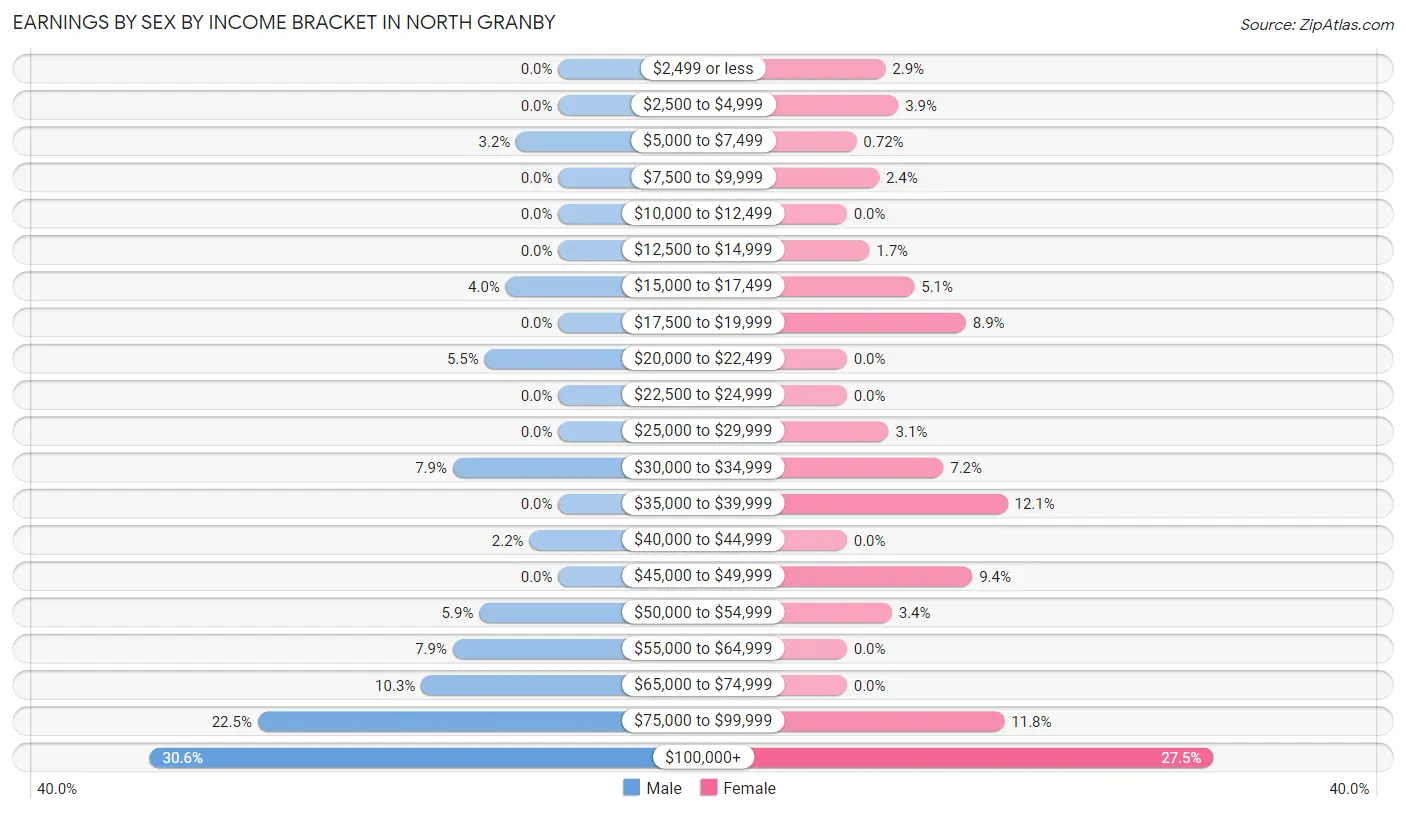
| Income | Male | Female |
| $2,499 or less | 0 (0.0%) | 12 (2.9%) |
| $2,500 to $4,999 | 0 (0.0%) | 16 (3.9%) |
| $5,000 to $7,499 | 16 (3.2%) | 3 (0.7%) |
| $7,500 to $9,999 | 0 (0.0%) | 10 (2.4%) |
| $10,000 to $12,499 | 0 (0.0%) | 0 (0.0%) |
| $12,500 to $14,999 | 0 (0.0%) | 7 (1.7%) |
| $15,000 to $17,499 | 20 (4.0%) | 21 (5.1%) |
| $17,500 to $19,999 | 0 (0.0%) | 37 (8.9%) |
| $20,000 to $22,499 | 28 (5.5%) | 0 (0.0%) |
| $22,500 to $24,999 | 0 (0.0%) | 0 (0.0%) |
| $25,000 to $29,999 | 0 (0.0%) | 13 (3.1%) |
| $30,000 to $34,999 | 40 (7.9%) | 30 (7.2%) |
| $35,000 to $39,999 | 0 (0.0%) | 50 (12.0%) |
| $40,000 to $44,999 | 11 (2.2%) | 0 (0.0%) |
| $45,000 to $49,999 | 0 (0.0%) | 39 (9.4%) |
| $50,000 to $54,999 | 30 (5.9%) | 14 (3.4%) |
| $55,000 to $64,999 | 40 (7.9%) | 0 (0.0%) |
| $65,000 to $74,999 | 52 (10.3%) | 0 (0.0%) |
| $75,000 to $99,999 | 114 (22.5%) | 49 (11.8%) |
| $100,000+ | 155 (30.6%) | 114 (27.5%) |
| Total | 506 (100.0%) | 415 (100.0%) |
Earnings by Sex by Educational Attainment in North Granby
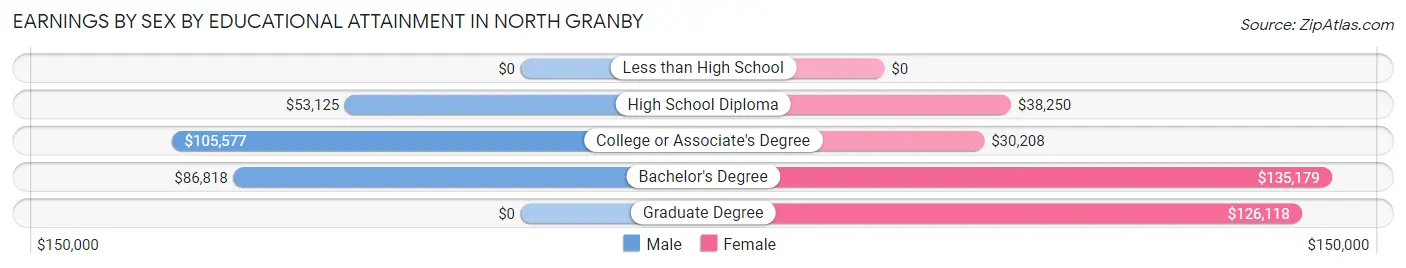
| Educational Attainment | Male Income | Female Income |
| Less than High School | - | - |
| High School Diploma | $53,125 | $38,250 |
| College or Associate's Degree | $105,577 | $30,208 |
| Bachelor's Degree | $86,818 | $135,179 |
| Graduate Degree | - | - |
| Total | $79,122 | $0 |
Family Income in North Granby
Family Income Brackets in North Granby
According to the North Granby family income data, there are 158 families falling into the $200,000+ income range, which is the most common income bracket and makes up 31.8% of all families.
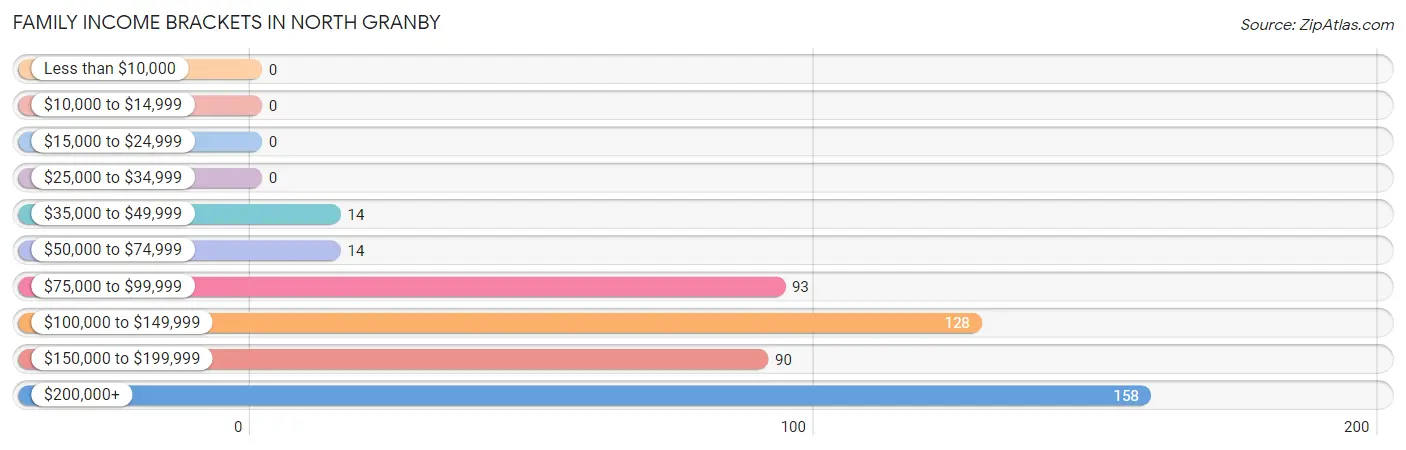
| Income Bracket | # Families | % Families |
| Less than $10,000 | 0 | 0.0% |
| $10,000 to $14,999 | 0 | 0.0% |
| $15,000 to $24,999 | 0 | 0.0% |
| $25,000 to $34,999 | 0 | 0.0% |
| $35,000 to $49,999 | 14 | 2.8% |
| $50,000 to $74,999 | 14 | 2.8% |
| $75,000 to $99,999 | 93 | 18.7% |
| $100,000 to $149,999 | 128 | 25.8% |
| $150,000 to $199,999 | 90 | 18.1% |
| $200,000+ | 158 | 31.8% |
Family Income by Famaliy Size in North Granby
4-person families (145 | 29.2%) account for the highest median family income in North Granby with $186,281 per family, while 2-person families (257 | 51.7%) have the highest median income of $58,282 per family member.
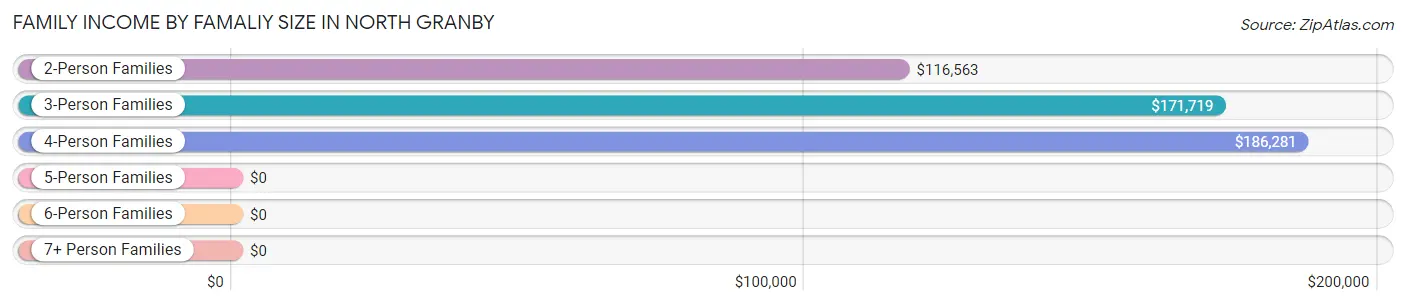
| Income Bracket | # Families | Median Income |
| 2-Person Families | 257 (51.7%) | $116,563 |
| 3-Person Families | 87 (17.5%) | $171,719 |
| 4-Person Families | 145 (29.2%) | $186,281 |
| 5-Person Families | 8 (1.6%) | $0 |
| 6-Person Families | 0 (0.0%) | $0 |
| 7+ Person Families | 0 (0.0%) | $0 |
| Total | 497 (100.0%) | $137,411 |
Family Income by Number of Earners in North Granby
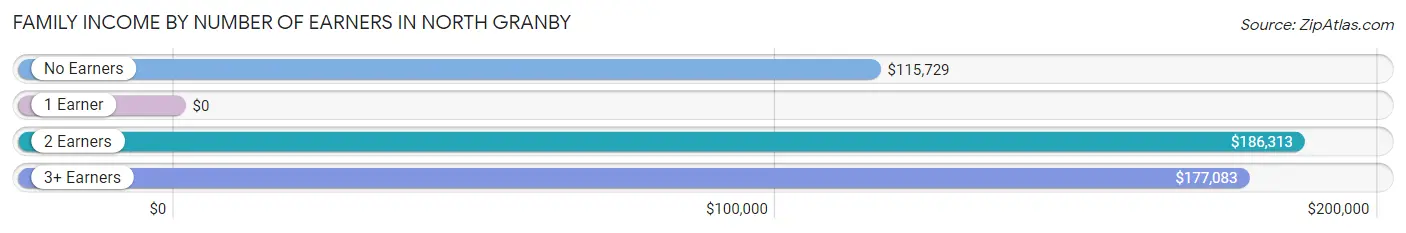
| Number of Earners | # Families | Median Income |
| No Earners | 91 (18.3%) | $115,729 |
| 1 Earner | 74 (14.9%) | $0 |
| 2 Earners | 280 (56.3%) | $186,313 |
| 3+ Earners | 52 (10.5%) | $177,083 |
| Total | 497 (100.0%) | $137,411 |
Household Income in North Granby
Household Income Brackets in North Granby
With 158 households falling in the category, the $200,000+ income range is the most frequent in North Granby, accounting for 26.1% of all households.
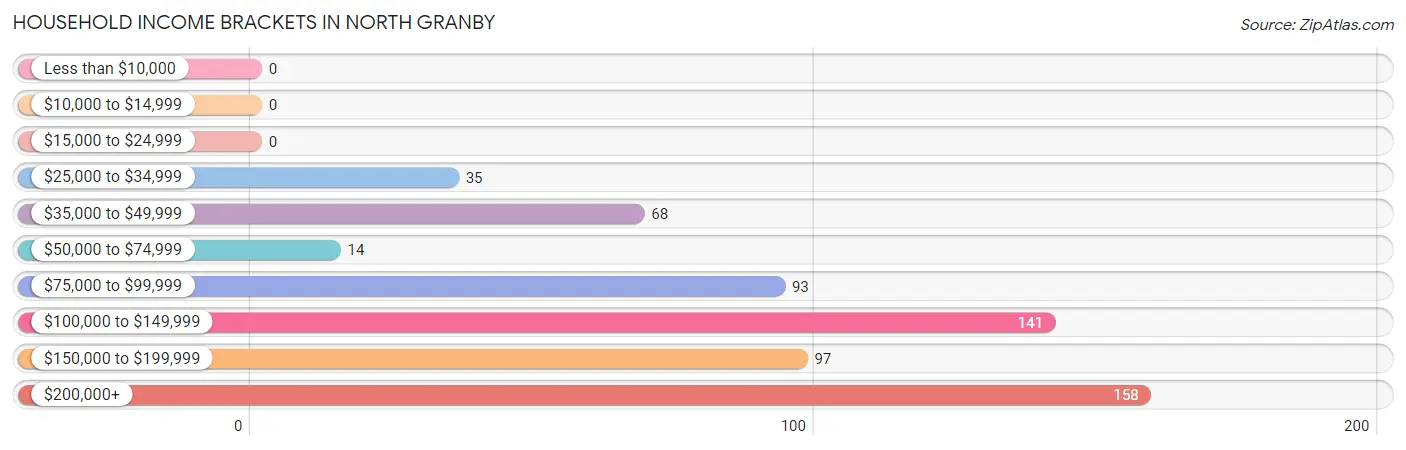
| Income Bracket | # Households | % Households |
| Less than $10,000 | 0 | 0.0% |
| $10,000 to $14,999 | 0 | 0.0% |
| $15,000 to $24,999 | 0 | 0.0% |
| $25,000 to $34,999 | 35 | 5.8% |
| $35,000 to $49,999 | 68 | 11.2% |
| $50,000 to $74,999 | 14 | 2.3% |
| $75,000 to $99,999 | 93 | 15.3% |
| $100,000 to $149,999 | 141 | 23.3% |
| $150,000 to $199,999 | 97 | 16.0% |
| $200,000+ | 158 | 26.1% |
Household Income by Householder Age in North Granby
The median household income in North Granby is $114,519, with the highest median household income of $185,938 found in the 45 to 64 years age bracket for the primary householder. A total of 204 households (33.7%) fall into this category.
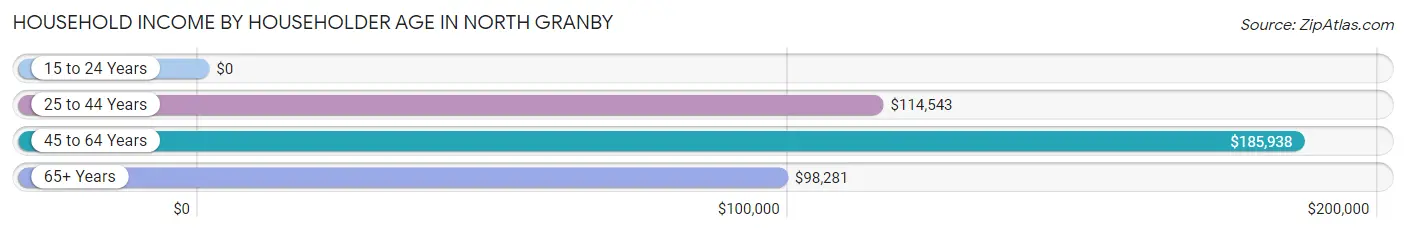
| Income Bracket | # Households | Median Income |
| 15 to 24 Years | 0 (0.0%) | $0 |
| 25 to 44 Years | 129 (21.3%) | $114,543 |
| 45 to 64 Years | 204 (33.7%) | $185,938 |
| 65+ Years | 273 (45.1%) | $98,281 |
| Total | 606 (100.0%) | $114,519 |
Poverty in North Granby
Income Below Poverty by Sex and Age in North Granby
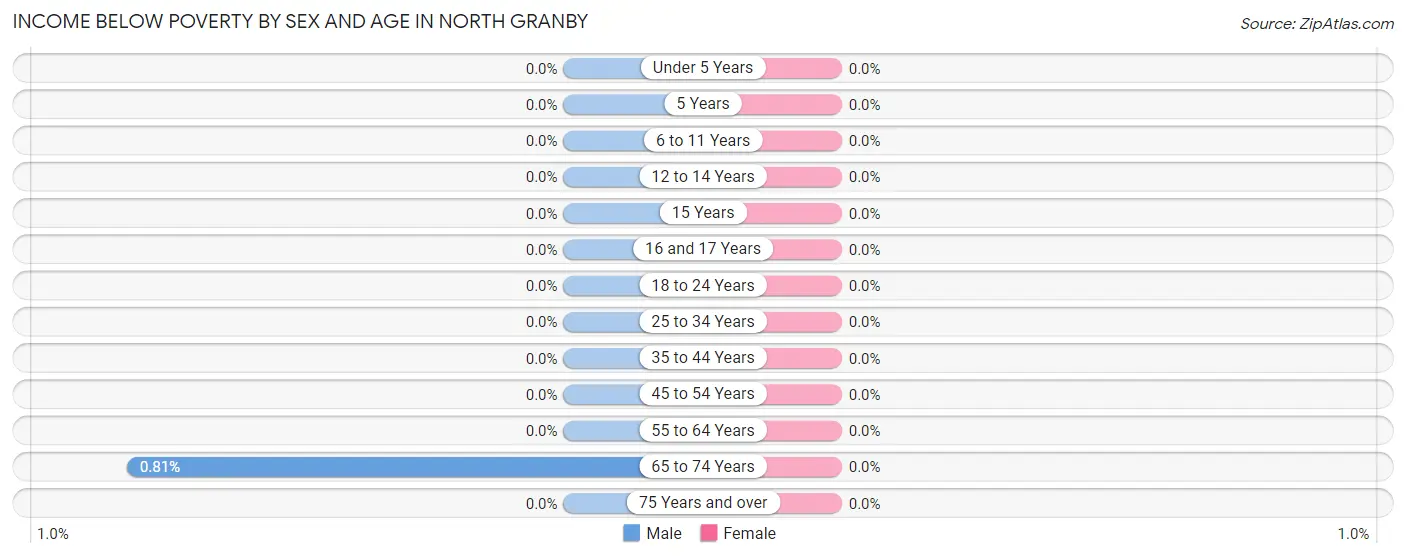
| Age Bracket | Male | Female |
| Under 5 Years | 0 (0.0%) | 0 (0.0%) |
| 5 Years | 0 (0.0%) | 0 (0.0%) |
| 6 to 11 Years | 0 (0.0%) | 0 (0.0%) |
| 12 to 14 Years | 0 (0.0%) | 0 (0.0%) |
| 15 Years | 0 (0.0%) | 0 (0.0%) |
| 16 and 17 Years | 0 (0.0%) | 0 (0.0%) |
| 18 to 24 Years | 0 (0.0%) | 0 (0.0%) |
| 25 to 34 Years | 0 (0.0%) | 0 (0.0%) |
| 35 to 44 Years | 0 (0.0%) | 0 (0.0%) |
| 45 to 54 Years | 0 (0.0%) | 0 (0.0%) |
| 55 to 64 Years | 0 (0.0%) | 0 (0.0%) |
| 65 to 74 Years | 2 (0.8%) | 0 (0.0%) |
| 75 Years and over | 0 (0.0%) | 0 (0.0%) |
| Total | 2 (0.3%) | 0 (0.0%) |
Income Above Poverty by Sex and Age in North Granby
According to the poverty statistics in North Granby, males aged under 5 years and females aged under 5 years are the age groups that are most secure financially, with 100.0% of males and 100.0% of females in these age groups living above the poverty line.
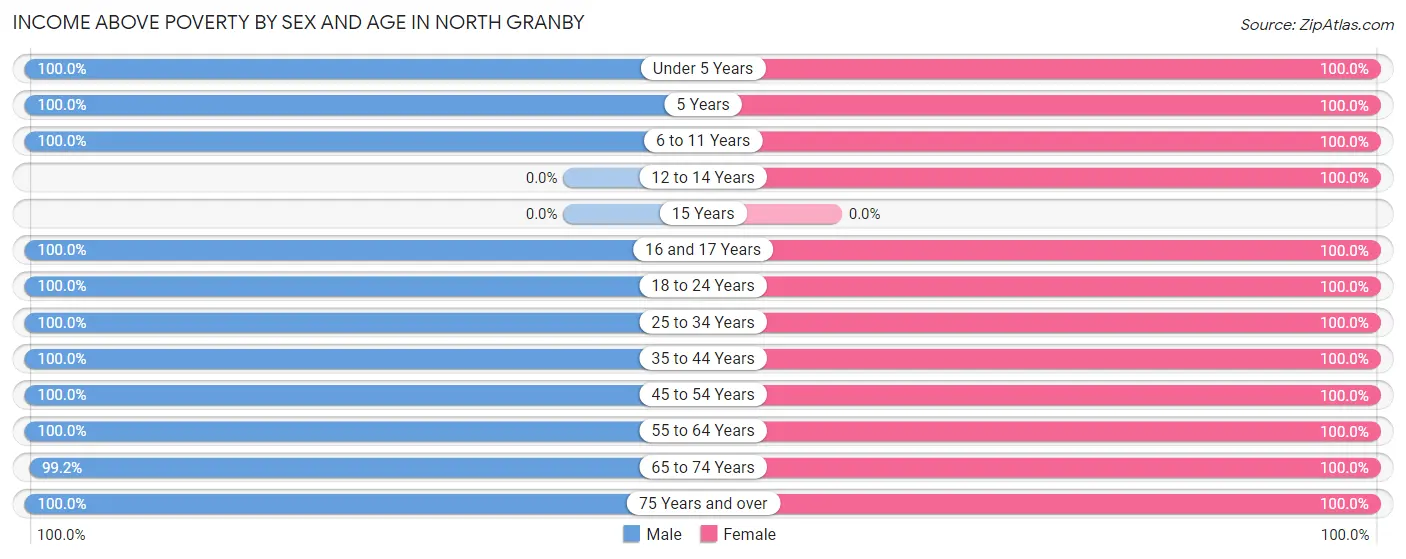
| Age Bracket | Male | Female |
| Under 5 Years | 45 (100.0%) | 47 (100.0%) |
| 5 Years | 63 (100.0%) | 15 (100.0%) |
| 6 to 11 Years | 53 (100.0%) | 77 (100.0%) |
| 12 to 14 Years | 0 (0.0%) | 21 (100.0%) |
| 15 Years | 0 (0.0%) | 0 (0.0%) |
| 16 and 17 Years | 13 (100.0%) | 12 (100.0%) |
| 18 to 24 Years | 16 (100.0%) | 19 (100.0%) |
| 25 to 34 Years | 25 (100.0%) | 40 (100.0%) |
| 35 to 44 Years | 96 (100.0%) | 135 (100.0%) |
| 45 to 54 Years | 104 (100.0%) | 65 (100.0%) |
| 55 to 64 Years | 125 (100.0%) | 96 (100.0%) |
| 65 to 74 Years | 246 (99.2%) | 175 (100.0%) |
| 75 Years and over | 21 (100.0%) | 21 (100.0%) |
| Total | 807 (99.8%) | 723 (100.0%) |
Income Below Poverty Among Married-Couple Families in North Granby
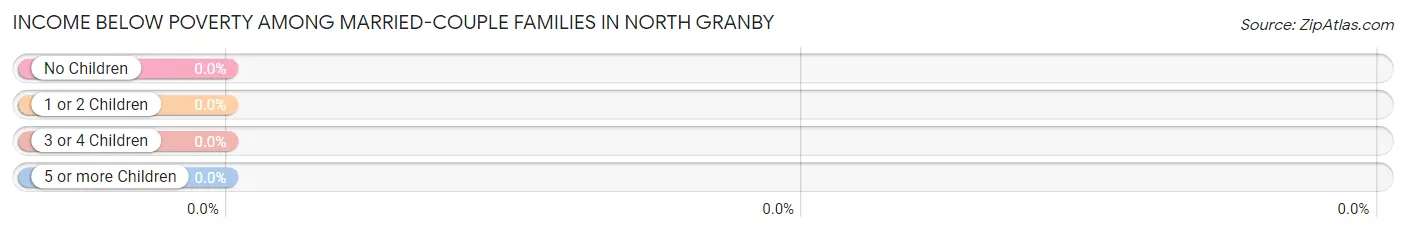
| Children | Above Poverty | Below Poverty |
| No Children | 275 (100.0%) | 0 (0.0%) |
| 1 or 2 Children | 160 (100.0%) | 0 (0.0%) |
| 3 or 4 Children | 0 (0.0%) | 0 (0.0%) |
| 5 or more Children | 0 (0.0%) | 0 (0.0%) |
| Total | 435 (100.0%) | 0 (0.0%) |
Income Below Poverty Among Single-Parent Households in North Granby
| Children | Single Father | Single Mother |
| No Children | 0 (0.0%) | 0 (0.0%) |
| 1 or 2 Children | 0 (0.0%) | 0 (0.0%) |
| 3 or 4 Children | 0 (0.0%) | 0 (0.0%) |
| 5 or more Children | 0 (0.0%) | 0 (0.0%) |
| Total | 0 (0.0%) | 0 (0.0%) |
Income Below Poverty Among Married-Couple vs Single-Parent Households in North Granby
| Children | Married-Couple Families | Single-Parent Households |
| No Children | 0 (0.0%) | 0 (0.0%) |
| 1 or 2 Children | 0 (0.0%) | 0 (0.0%) |
| 3 or 4 Children | 0 (0.0%) | 0 (0.0%) |
| 5 or more Children | 0 (0.0%) | 0 (0.0%) |
| Total | 0 (0.0%) | 0 (0.0%) |
Race in North Granby
The most populous races in North Granby are White / Caucasian (1,495 | 96.1%), Two or more Races (21 | 1.3%), and Black / African American (15 | 1.0%).
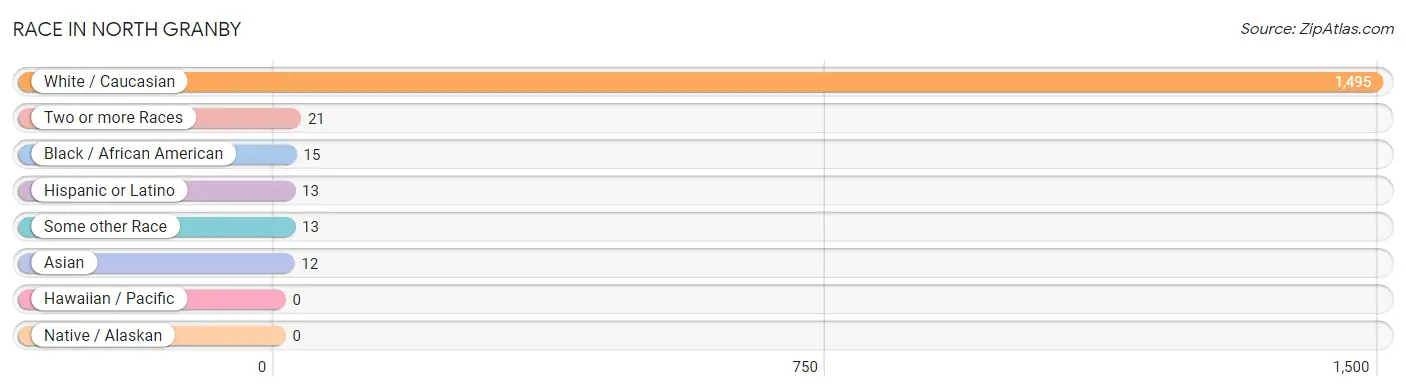
| Race | # Population | % Population |
| Asian | 12 | 0.8% |
| Black / African American | 15 | 1.0% |
| Hawaiian / Pacific | 0 | 0.0% |
| Hispanic or Latino | 13 | 0.8% |
| Native / Alaskan | 0 | 0.0% |
| White / Caucasian | 1,495 | 96.1% |
| Two or more Races | 21 | 1.3% |
| Some other Race | 13 | 0.8% |
| Total | 1,556 | 100.0% |
Ancestry in North Granby
The most populous ancestries reported in North Granby are German (410 | 26.4%), Italian (240 | 15.4%), English (228 | 14.6%), French Canadian (219 | 14.1%), and Irish (159 | 10.2%), together accounting for 80.7% of all North Granby residents.
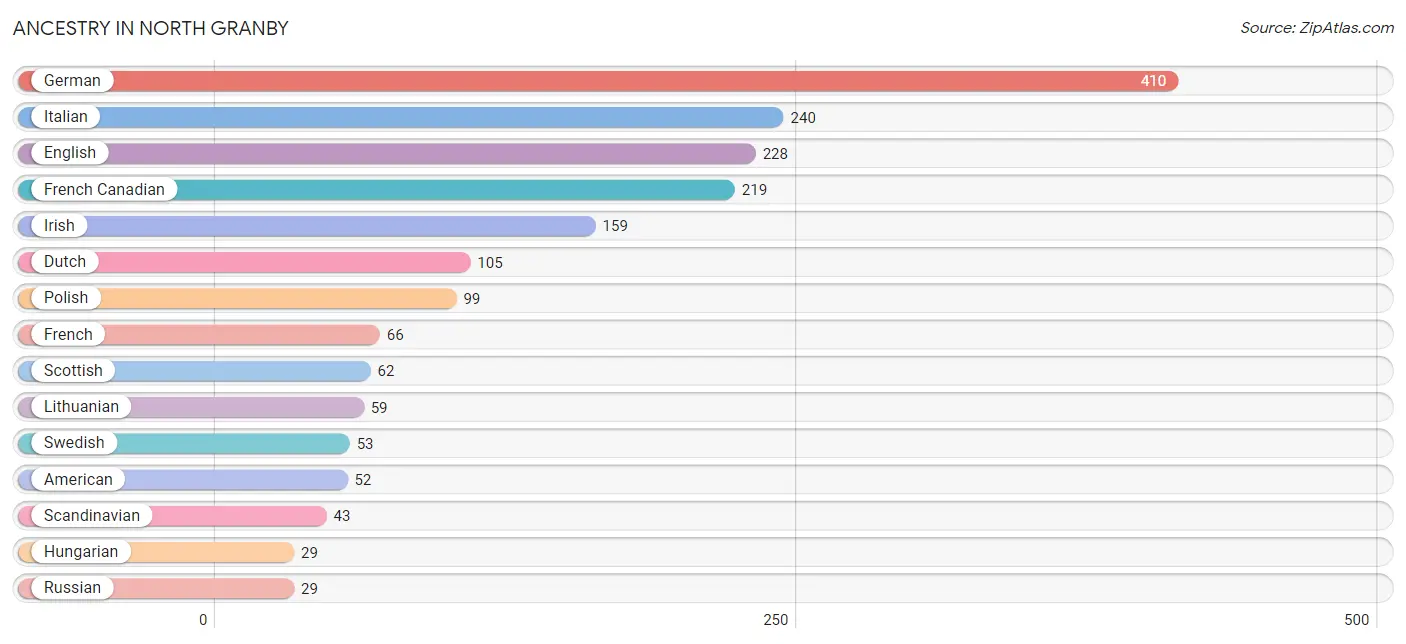
| Ancestry | # Population | % Population |
| American | 52 | 3.3% |
| Armenian | 15 | 1.0% |
| Canadian | 14 | 0.9% |
| Czech | 12 | 0.8% |
| Dutch | 105 | 6.8% |
| English | 228 | 14.6% |
| Finnish | 11 | 0.7% |
| French | 66 | 4.2% |
| French Canadian | 219 | 14.1% |
| German | 410 | 26.4% |
| Hungarian | 29 | 1.9% |
| Irish | 159 | 10.2% |
| Italian | 240 | 15.4% |
| Japanese | 12 | 0.8% |
| Lithuanian | 59 | 3.8% |
| Norwegian | 11 | 0.7% |
| Polish | 99 | 6.4% |
| Russian | 29 | 1.9% |
| Scandinavian | 43 | 2.8% |
| Scotch-Irish | 29 | 1.9% |
| Scottish | 62 | 4.0% |
| Swedish | 53 | 3.4% |
| Welsh | 14 | 0.9% | View All 23 Rows |
Immigrants in North Granby
The most numerous immigrant groups reported in North Granby came from Europe (18 | 1.2%), Asia (12 | 0.8%), Cambodia (12 | 0.8%), South Eastern Asia (12 | 0.8%), and Eastern Europe (11 | 0.7%), together accounting for 4.2% of all North Granby residents.
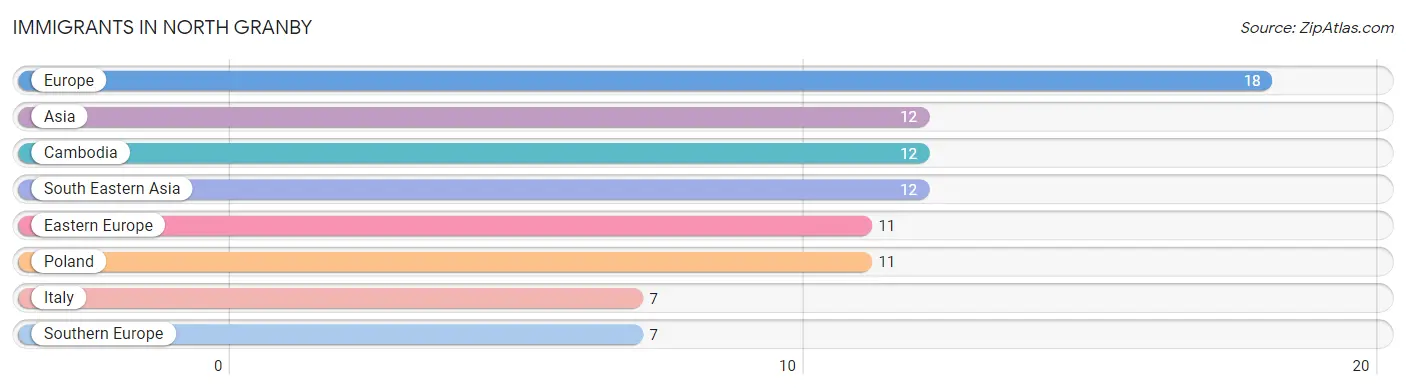
| Immigration Origin | # Population | % Population |
| Asia | 12 | 0.8% |
| Cambodia | 12 | 0.8% |
| Eastern Europe | 11 | 0.7% |
| Europe | 18 | 1.2% |
| Italy | 7 | 0.4% |
| Poland | 11 | 0.7% |
| South Eastern Asia | 12 | 0.8% |
| Southern Europe | 7 | 0.4% | View All 8 Rows |
Sex and Age in North Granby
Sex and Age in North Granby
The most populous age groups in North Granby are 65 to 69 Years (187 | 22.5%) for men and 35 to 39 Years (97 | 13.4%) for women.
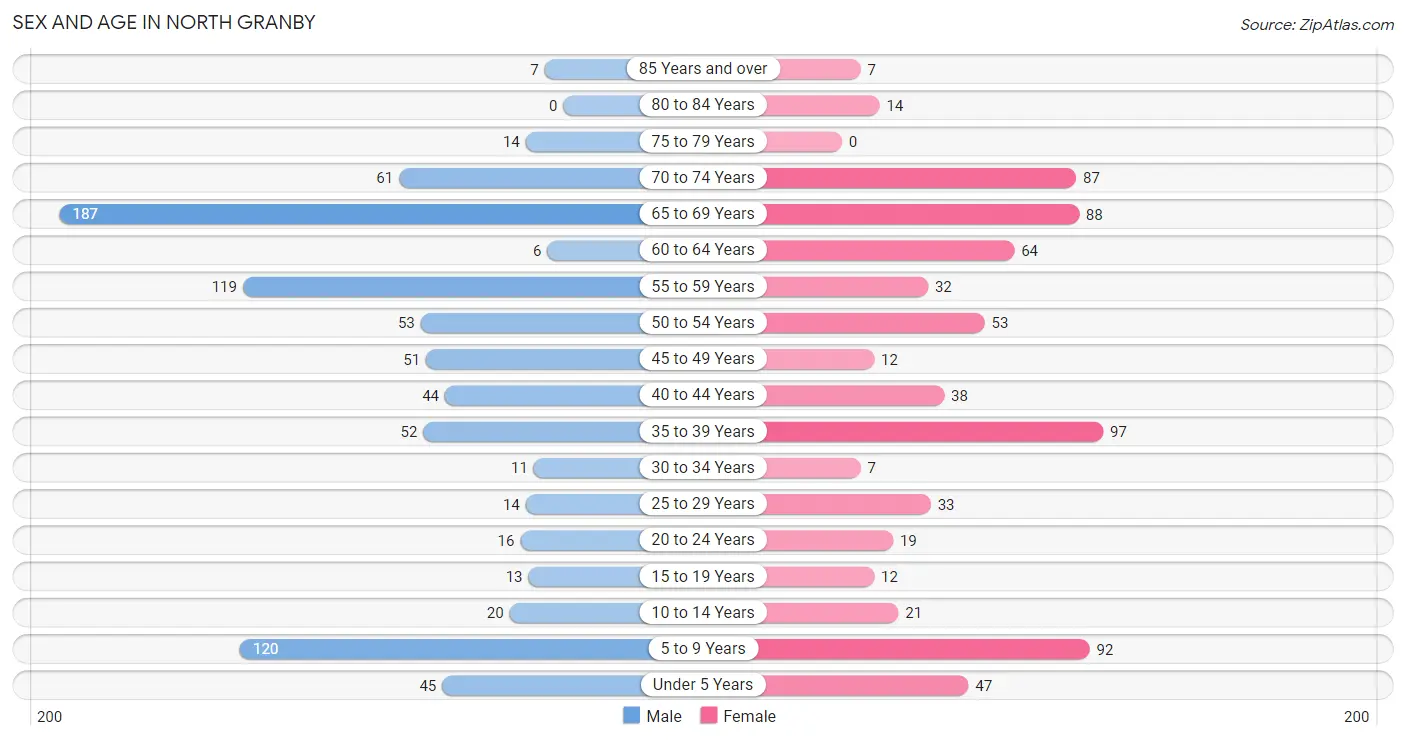
| Age Bracket | Male | Female |
| Under 5 Years | 45 (5.4%) | 47 (6.5%) |
| 5 to 9 Years | 120 (14.4%) | 92 (12.7%) |
| 10 to 14 Years | 20 (2.4%) | 21 (2.9%) |
| 15 to 19 Years | 13 (1.6%) | 12 (1.7%) |
| 20 to 24 Years | 16 (1.9%) | 19 (2.6%) |
| 25 to 29 Years | 14 (1.7%) | 33 (4.6%) |
| 30 to 34 Years | 11 (1.3%) | 7 (1.0%) |
| 35 to 39 Years | 52 (6.2%) | 97 (13.4%) |
| 40 to 44 Years | 44 (5.3%) | 38 (5.3%) |
| 45 to 49 Years | 51 (6.1%) | 12 (1.7%) |
| 50 to 54 Years | 53 (6.4%) | 53 (7.3%) |
| 55 to 59 Years | 119 (14.3%) | 32 (4.4%) |
| 60 to 64 Years | 6 (0.7%) | 64 (8.8%) |
| 65 to 69 Years | 187 (22.5%) | 88 (12.2%) |
| 70 to 74 Years | 61 (7.3%) | 87 (12.0%) |
| 75 to 79 Years | 14 (1.7%) | 0 (0.0%) |
| 80 to 84 Years | 0 (0.0%) | 14 (1.9%) |
| 85 Years and over | 7 (0.8%) | 7 (1.0%) |
| Total | 833 (100.0%) | 723 (100.0%) |
Families and Households in North Granby
Median Family Size in North Granby
The median family size in North Granby is 2.79 persons per family, with married-couple families (435 | 87.5%) accounting for the largest median family size of 2.88 persons per family. On the other hand, single female/mother families (14 | 2.8%) represent the smallest median family size with 2.07 persons per family.
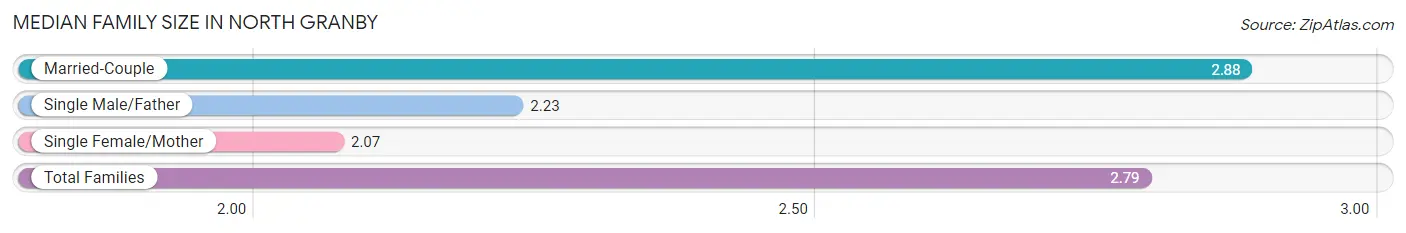
| Family Type | # Families | Family Size |
| Married-Couple | 435 (87.5%) | 2.88 |
| Single Male/Father | 48 (9.7%) | 2.23 |
| Single Female/Mother | 14 (2.8%) | 2.07 |
| Total Families | 497 (100.0%) | 2.79 |
Median Household Size in North Granby
The median household size in North Granby is 2.56 persons per household, with married-couple households (435 | 71.8%) accounting for the largest median household size of 2.93 persons per household. non-family households (109 | 18.0%) represent the smallest median household size with 1.29 persons per household.
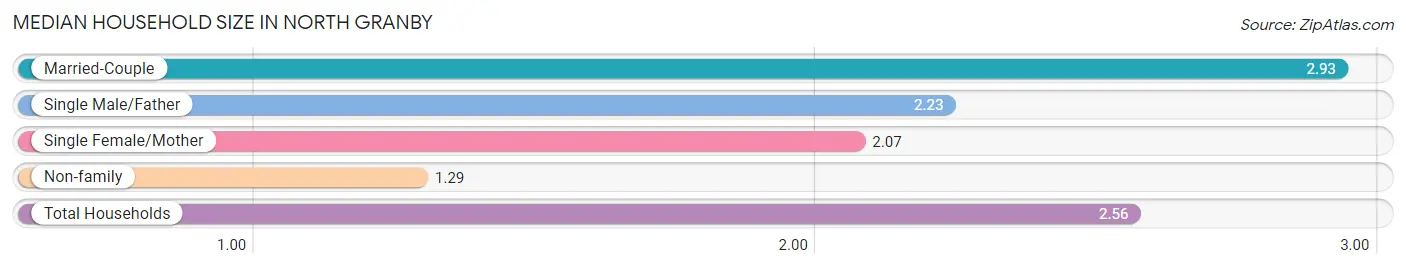
| Household Type | # Households | Household Size |
| Married-Couple | 435 (71.8%) | 2.93 |
| Single Male/Father | 48 (7.9%) | 2.23 |
| Single Female/Mother | 14 (2.3%) | 2.07 |
| Non-family | 109 (18.0%) | 1.29 |
| Total Households | 606 (100.0%) | 2.56 |
Household Size by Marriage Status in North Granby
Out of a total of 606 households in North Granby, 497 (82.0%) are family households, while 109 (18.0%) are nonfamily households. The most numerous type of family households are 2-person households, comprising 257, and the most common type of nonfamily households are 1-person households, comprising 82.
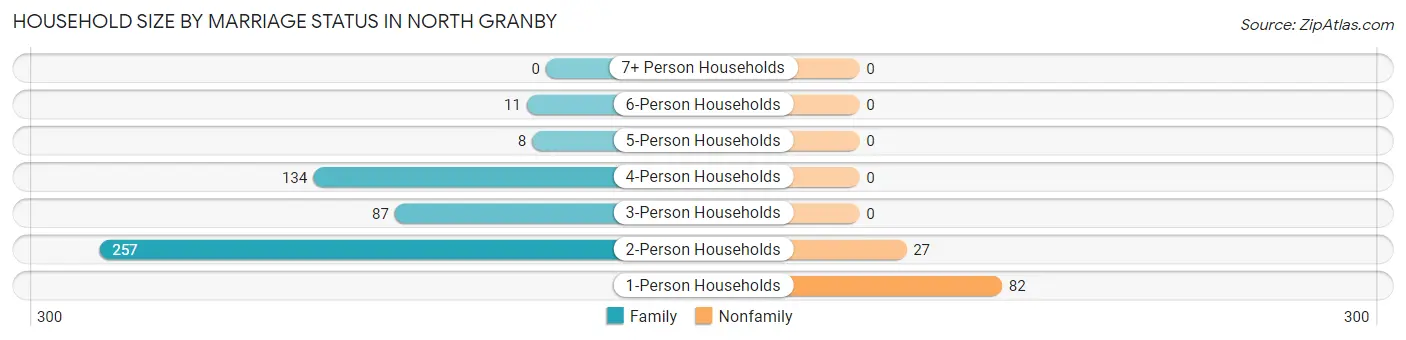
| Household Size | Family Households | Nonfamily Households |
| 1-Person Households | - | 82 (13.5%) |
| 2-Person Households | 257 (42.4%) | 27 (4.5%) |
| 3-Person Households | 87 (14.4%) | 0 (0.0%) |
| 4-Person Households | 134 (22.1%) | 0 (0.0%) |
| 5-Person Households | 8 (1.3%) | 0 (0.0%) |
| 6-Person Households | 11 (1.8%) | 0 (0.0%) |
| 7+ Person Households | 0 (0.0%) | 0 (0.0%) |
| Total | 497 (82.0%) | 109 (18.0%) |
Female Fertility in North Granby
Fertility by Age in North Granby
| Age Bracket | Women with Births | Births / 1,000 Women |
| 15 to 19 years | 0 (0.0%) | 0.0 |
| 20 to 34 years | 0 (0.0%) | 0.0 |
| 35 to 50 years | 0 (0.0%) | 0.0 |
| Total | 0 (0.0%) | 0.0 |
Fertility by Age by Marriage Status in North Granby
| Age Bracket | Married | Unmarried |
| 15 to 19 years | 0 (0.0%) | 0 (0.0%) |
| 20 to 34 years | 0 (0.0%) | 0 (0.0%) |
| 35 to 50 years | 0 (0.0%) | 0 (0.0%) |
| Total | 0 (0.0%) | 0 (0.0%) |
Fertility by Education in North Granby
| Educational Attainment | Women with Births | Births / 1,000 Women |
| Less than High School | 0 (0.0%) | 0.0 |
| High School Diploma | 0 (0.0%) | 0.0 |
| College or Associate's Degree | 0 (0.0%) | 0.0 |
| Bachelor's Degree | 0 (0.0%) | 0.0 |
| Graduate Degree | 0 (0.0%) | 0.0 |
| Total | 0 (0.0%) | 0.0 |
Fertility by Education by Marriage Status in North Granby
| Educational Attainment | Married | Unmarried |
| Less than High School | 0 (0.0%) | 0 (0.0%) |
| High School Diploma | 0 (0.0%) | 0 (0.0%) |
| College or Associate's Degree | 0 (0.0%) | 0 (0.0%) |
| Bachelor's Degree | 0 (0.0%) | 0 (0.0%) |
| Graduate Degree | 0 (0.0%) | 0 (0.0%) |
| Total | 0 (0.0%) | 0 (0.0%) |
Employment Characteristics in North Granby
Employment by Class of Employer in North Granby
Among the 894 employed individuals in North Granby, private company employees (479 | 53.6%), self-employed (not incorporated) (124 | 13.9%), and state government employees (99 | 11.1%) make up the most common classes of employment.
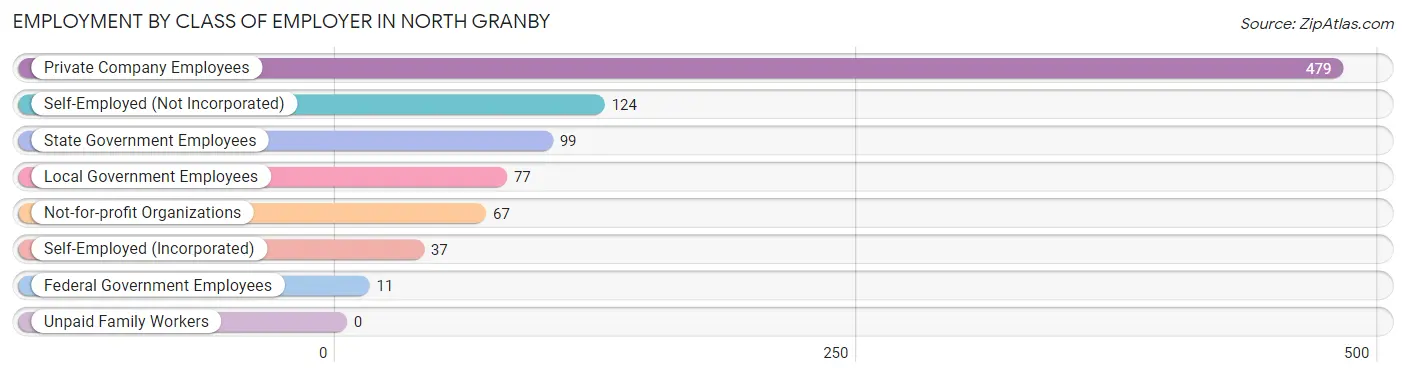
| Employer Class | # Employees | % Employees |
| Private Company Employees | 479 | 53.6% |
| Self-Employed (Incorporated) | 37 | 4.1% |
| Self-Employed (Not Incorporated) | 124 | 13.9% |
| Not-for-profit Organizations | 67 | 7.5% |
| Local Government Employees | 77 | 8.6% |
| State Government Employees | 99 | 11.1% |
| Federal Government Employees | 11 | 1.2% |
| Unpaid Family Workers | 0 | 0.0% |
| Total | 894 | 100.0% |
Employment Status by Age in North Granby
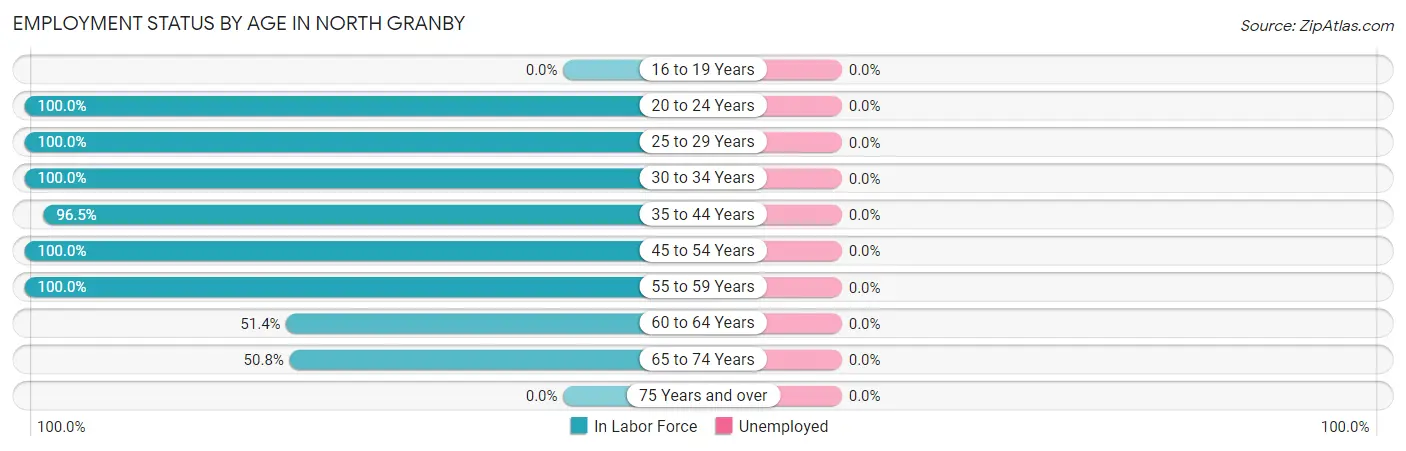
| Age Bracket | In Labor Force | Unemployed |
| 16 to 19 Years | 0 (0.0%) | 0 (0.0%) |
| 20 to 24 Years | 35 (100.0%) | 0 (0.0%) |
| 25 to 29 Years | 47 (100.0%) | 0 (0.0%) |
| 30 to 34 Years | 18 (100.0%) | 0 (0.0%) |
| 35 to 44 Years | 223 (96.5%) | 0 (0.0%) |
| 45 to 54 Years | 169 (100.0%) | 0 (0.0%) |
| 55 to 59 Years | 151 (100.0%) | 0 (0.0%) |
| 60 to 64 Years | 36 (51.4%) | 0 (0.0%) |
| 65 to 74 Years | 215 (50.8%) | 0 (0.0%) |
| 75 Years and over | 0 (0.0%) | 0 (0.0%) |
| Total | 894 (73.8%) | 0 (0.0%) |
Employment Status by Educational Attainment in North Granby
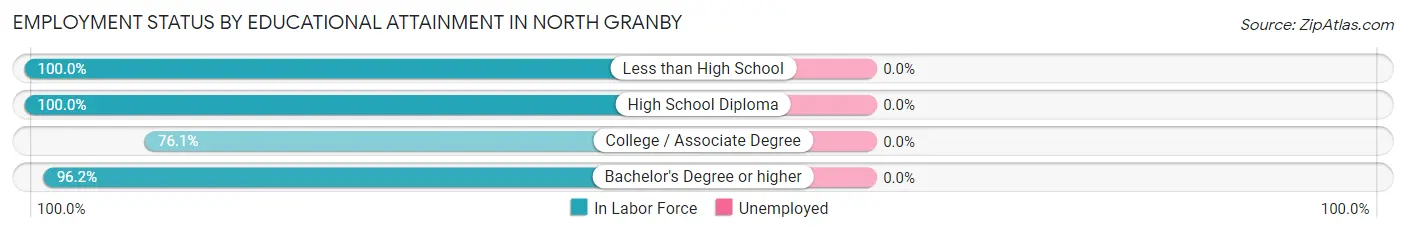
| Educational Attainment | In Labor Force | Unemployed |
| Less than High School | 12 (100.0%) | 0 (0.0%) |
| High School Diploma | 188 (100.0%) | 0 (0.0%) |
| College / Associate Degree | 89 (76.1%) | 0 (0.0%) |
| Bachelor's Degree or higher | 355 (96.2%) | 0 (0.0%) |
| Total | 644 (93.9%) | 0 (0.0%) |
Employment Occupations by Sex in North Granby
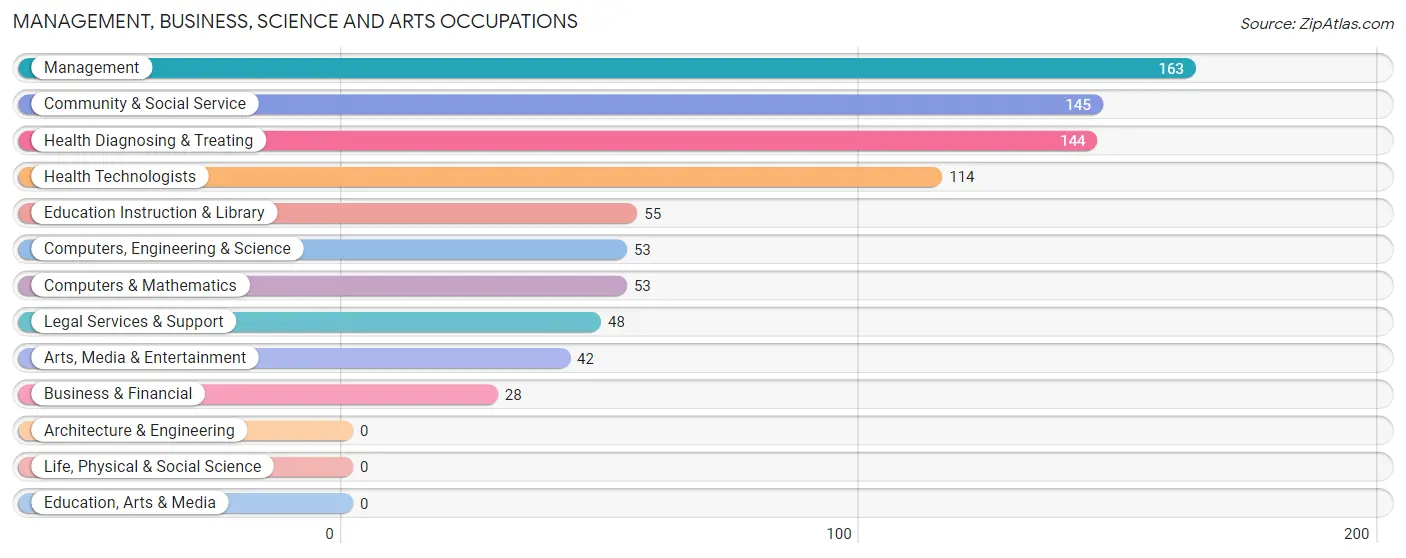
Management, Business, Science and Arts Occupations
The most common Management, Business, Science and Arts occupations in North Granby are Management (163 | 18.2%), Community & Social Service (145 | 16.2%), Health Diagnosing & Treating (144 | 16.1%), Health Technologists (114 | 12.8%), and Education Instruction & Library (55 | 6.1%).
Management, Business, Science and Arts Occupations by Sex
Within the Management, Business, Science and Arts occupations in North Granby, the most male-oriented occupations are Computers, Engineering & Science (100.0%), Computers & Mathematics (100.0%), and Management (75.5%), while the most female-oriented occupations are Education Instruction & Library (100.0%), Business & Financial (71.4%), and Community & Social Service (66.9%).
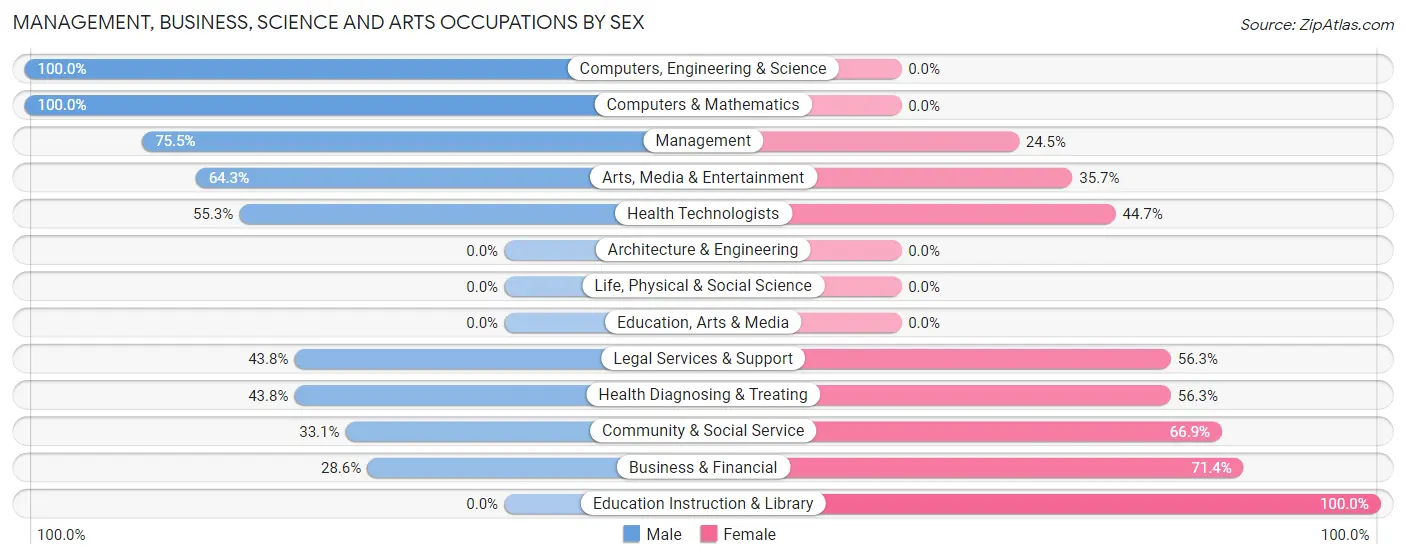
| Occupation | Male | Female |
| Management | 123 (75.5%) | 40 (24.5%) |
| Business & Financial | 8 (28.6%) | 20 (71.4%) |
| Computers, Engineering & Science | 53 (100.0%) | 0 (0.0%) |
| Computers & Mathematics | 53 (100.0%) | 0 (0.0%) |
| Architecture & Engineering | 0 (0.0%) | 0 (0.0%) |
| Life, Physical & Social Science | 0 (0.0%) | 0 (0.0%) |
| Community & Social Service | 48 (33.1%) | 97 (66.9%) |
| Education, Arts & Media | 0 (0.0%) | 0 (0.0%) |
| Legal Services & Support | 21 (43.8%) | 27 (56.2%) |
| Education Instruction & Library | 0 (0.0%) | 55 (100.0%) |
| Arts, Media & Entertainment | 27 (64.3%) | 15 (35.7%) |
| Health Diagnosing & Treating | 63 (43.8%) | 81 (56.2%) |
| Health Technologists | 63 (55.3%) | 51 (44.7%) |
| Total (Category) | 295 (55.3%) | 238 (44.7%) |
| Total (Overall) | 491 (54.9%) | 403 (45.1%) |
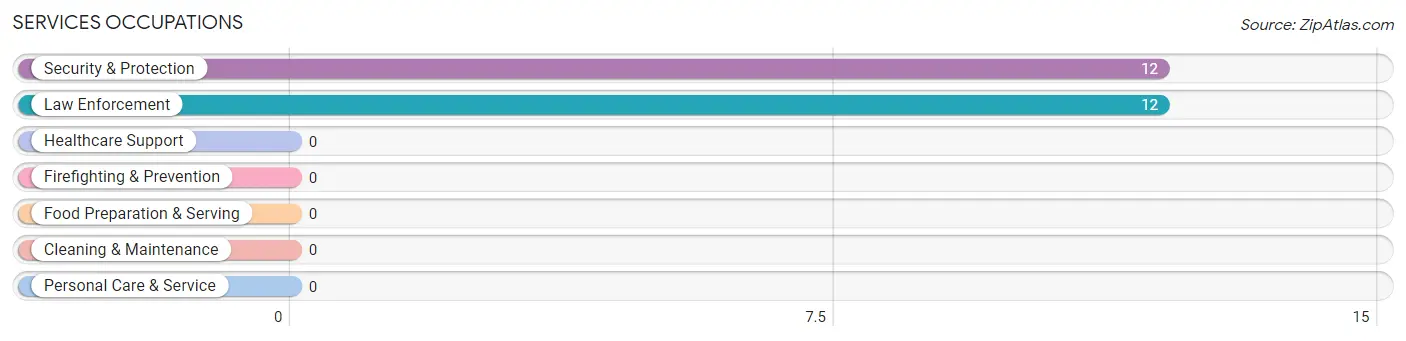
Services Occupations
The most common Services occupations in North Granby are Security & Protection (12 | 1.3%), and Law Enforcement (12 | 1.3%).
Services Occupations by Sex
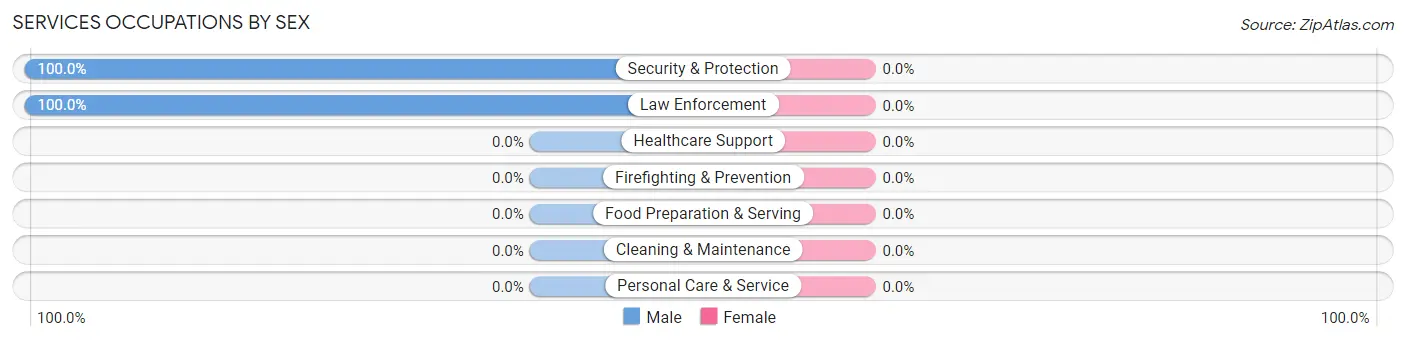
| Occupation | Male | Female |
| Healthcare Support | 0 (0.0%) | 0 (0.0%) |
| Security & Protection | 12 (100.0%) | 0 (0.0%) |
| Firefighting & Prevention | 0 (0.0%) | 0 (0.0%) |
| Law Enforcement | 12 (100.0%) | 0 (0.0%) |
| Food Preparation & Serving | 0 (0.0%) | 0 (0.0%) |
| Cleaning & Maintenance | 0 (0.0%) | 0 (0.0%) |
| Personal Care & Service | 0 (0.0%) | 0 (0.0%) |
| Total (Category) | 12 (100.0%) | 0 (0.0%) |
| Total (Overall) | 491 (54.9%) | 403 (45.1%) |
Sales and Office Occupations
The most common Sales and Office occupations in North Granby are Sales & Related (97 | 10.8%), and Office & Administration (77 | 8.6%).
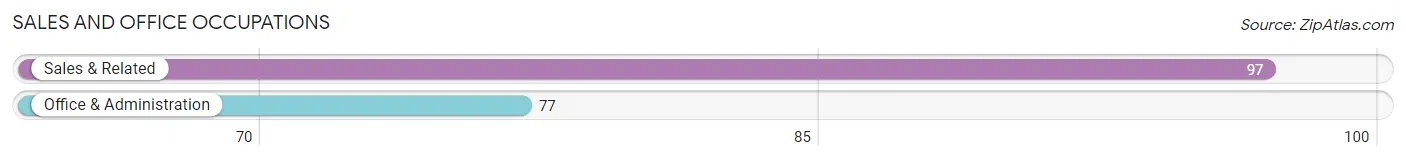
Sales and Office Occupations by Sex
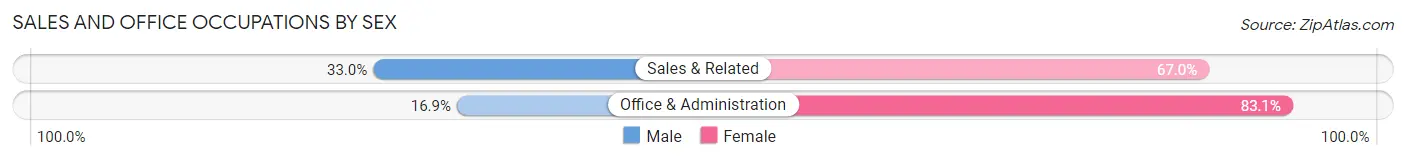
| Occupation | Male | Female |
| Sales & Related | 32 (33.0%) | 65 (67.0%) |
| Office & Administration | 13 (16.9%) | 64 (83.1%) |
| Total (Category) | 45 (25.9%) | 129 (74.1%) |
| Total (Overall) | 491 (54.9%) | 403 (45.1%) |
Natural Resources, Construction and Maintenance Occupations
The most common Natural Resources, Construction and Maintenance occupations in North Granby are Construction & Extraction (55 | 6.1%), and Installation, Maintenance & Repair (16 | 1.8%).
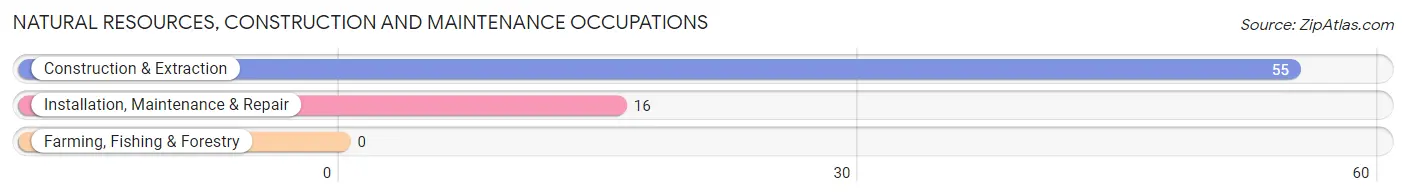
Natural Resources, Construction and Maintenance Occupations by Sex
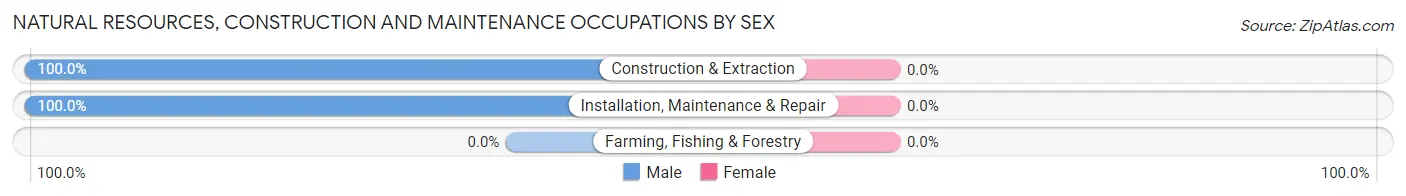
| Occupation | Male | Female |
| Farming, Fishing & Forestry | 0 (0.0%) | 0 (0.0%) |
| Construction & Extraction | 55 (100.0%) | 0 (0.0%) |
| Installation, Maintenance & Repair | 16 (100.0%) | 0 (0.0%) |
| Total (Category) | 71 (100.0%) | 0 (0.0%) |
| Total (Overall) | 491 (54.9%) | 403 (45.1%) |
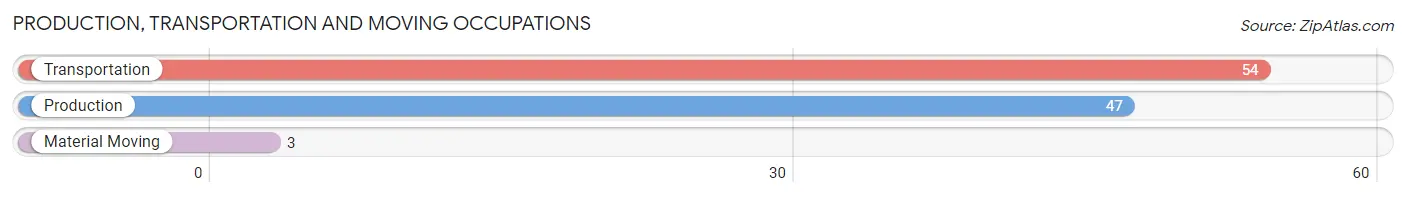
Production, Transportation and Moving Occupations
The most common Production, Transportation and Moving occupations in North Granby are Transportation (54 | 6.0%), Production (47 | 5.3%), and Material Moving (3 | 0.3%).
Production, Transportation and Moving Occupations by Sex
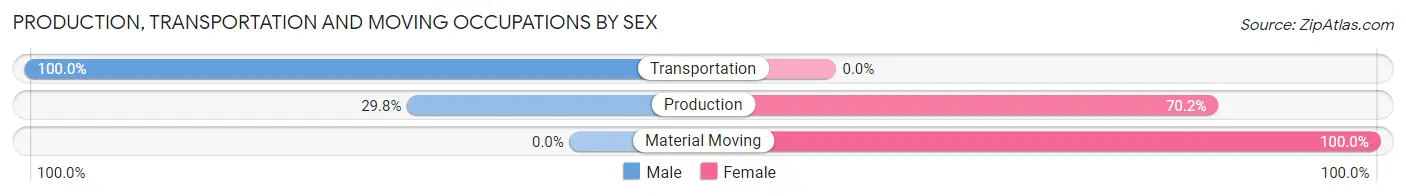
| Occupation | Male | Female |
| Production | 14 (29.8%) | 33 (70.2%) |
| Transportation | 54 (100.0%) | 0 (0.0%) |
| Material Moving | 0 (0.0%) | 3 (100.0%) |
| Total (Category) | 68 (65.4%) | 36 (34.6%) |
| Total (Overall) | 491 (54.9%) | 403 (45.1%) |
Employment Industries by Sex in North Granby
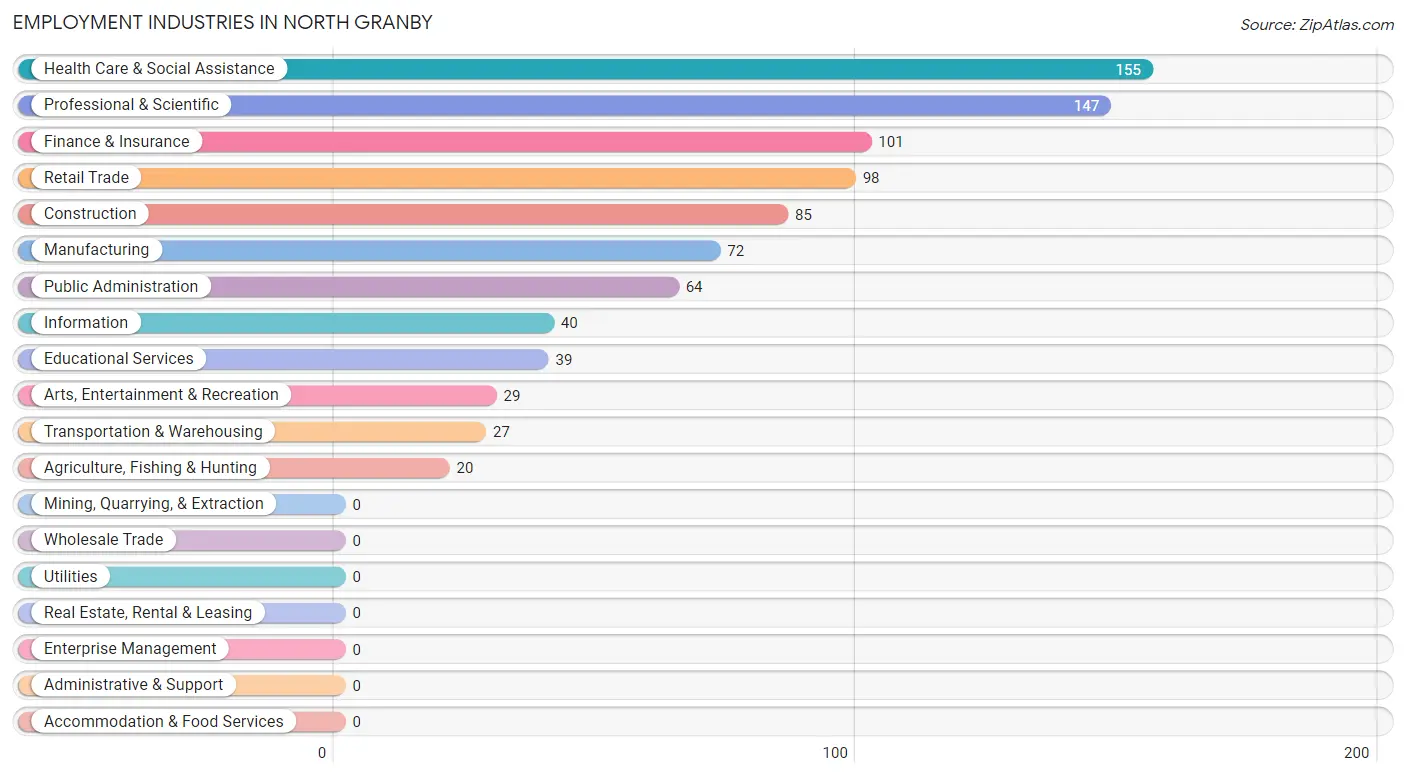
Employment Industries in North Granby
The major employment industries in North Granby include Health Care & Social Assistance (155 | 17.3%), Professional & Scientific (147 | 16.4%), Finance & Insurance (101 | 11.3%), Retail Trade (98 | 11.0%), and Construction (85 | 9.5%).
Employment Industries by Sex in North Granby
The North Granby industries that see more men than women are Agriculture, Fishing & Hunting (100.0%), Construction (100.0%), and Transportation & Warehousing (100.0%), whereas the industries that tend to have a higher number of women are Educational Services (100.0%), Manufacturing (69.4%), and Health Care & Social Assistance (66.4%).
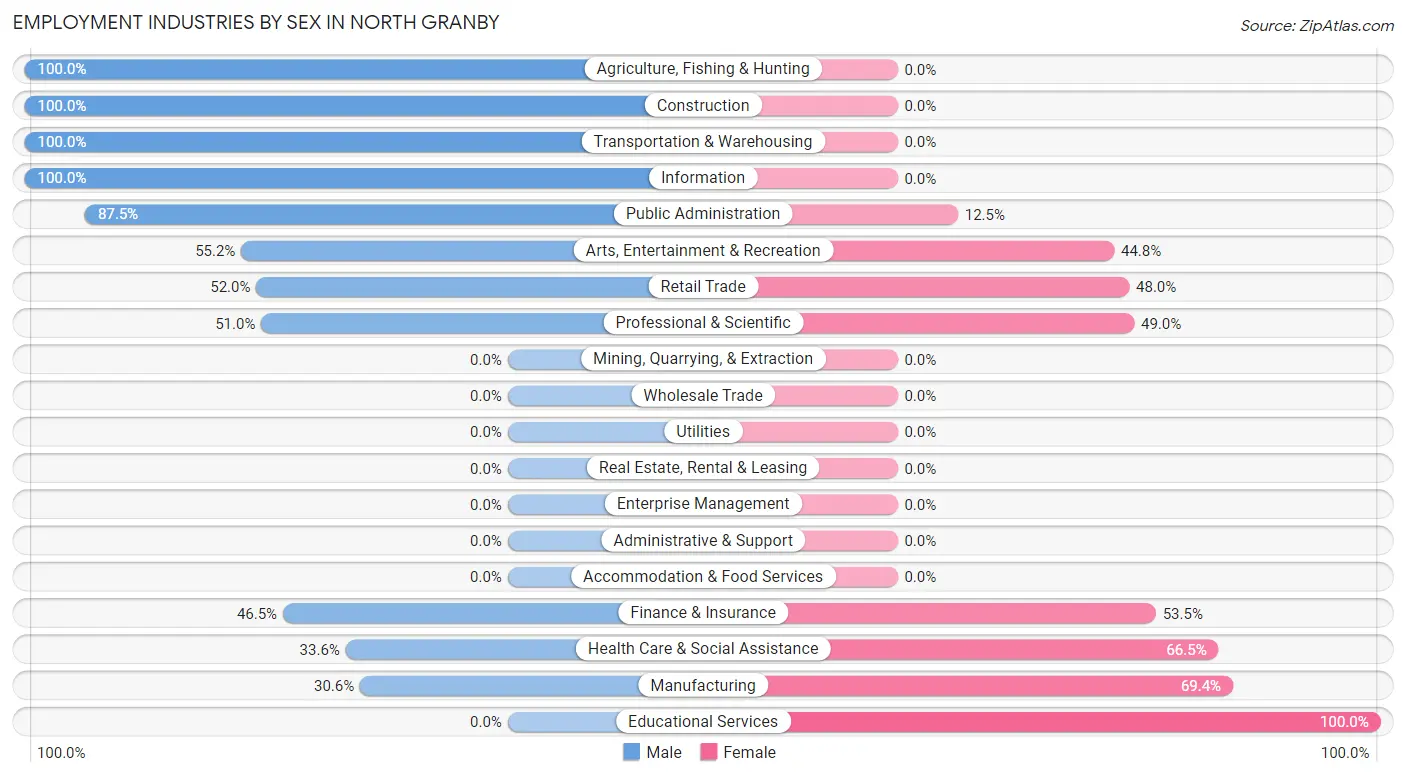
| Industry | Male | Female |
| Agriculture, Fishing & Hunting | 20 (100.0%) | 0 (0.0%) |
| Mining, Quarrying, & Extraction | 0 (0.0%) | 0 (0.0%) |
| Construction | 85 (100.0%) | 0 (0.0%) |
| Manufacturing | 22 (30.6%) | 50 (69.4%) |
| Wholesale Trade | 0 (0.0%) | 0 (0.0%) |
| Retail Trade | 51 (52.0%) | 47 (48.0%) |
| Transportation & Warehousing | 27 (100.0%) | 0 (0.0%) |
| Utilities | 0 (0.0%) | 0 (0.0%) |
| Information | 40 (100.0%) | 0 (0.0%) |
| Finance & Insurance | 47 (46.5%) | 54 (53.5%) |
| Real Estate, Rental & Leasing | 0 (0.0%) | 0 (0.0%) |
| Professional & Scientific | 75 (51.0%) | 72 (49.0%) |
| Enterprise Management | 0 (0.0%) | 0 (0.0%) |
| Administrative & Support | 0 (0.0%) | 0 (0.0%) |
| Educational Services | 0 (0.0%) | 39 (100.0%) |
| Health Care & Social Assistance | 52 (33.6%) | 103 (66.4%) |
| Arts, Entertainment & Recreation | 16 (55.2%) | 13 (44.8%) |
| Accommodation & Food Services | 0 (0.0%) | 0 (0.0%) |
| Public Administration | 56 (87.5%) | 8 (12.5%) |
| Total | 491 (54.9%) | 403 (45.1%) |
Education in North Granby
School Enrollment in North Granby
The most common levels of schooling among the 314 students in North Granby are elementary school (206 | 65.6%), nursery / preschool (36 | 11.5%), and kindergarten (26 | 8.3%).
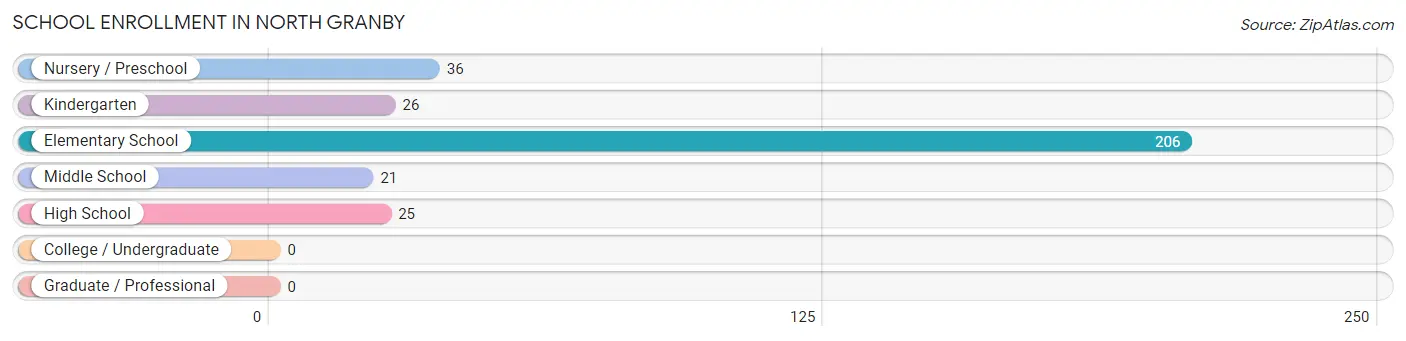
| School Level | # Students | % Students |
| Nursery / Preschool | 36 | 11.5% |
| Kindergarten | 26 | 8.3% |
| Elementary School | 206 | 65.6% |
| Middle School | 21 | 6.7% |
| High School | 25 | 8.0% |
| College / Undergraduate | 0 | 0.0% |
| Graduate / Professional | 0 | 0.0% |
| Total | 314 | 100.0% |
School Enrollment by Age by Funding Source in North Granby
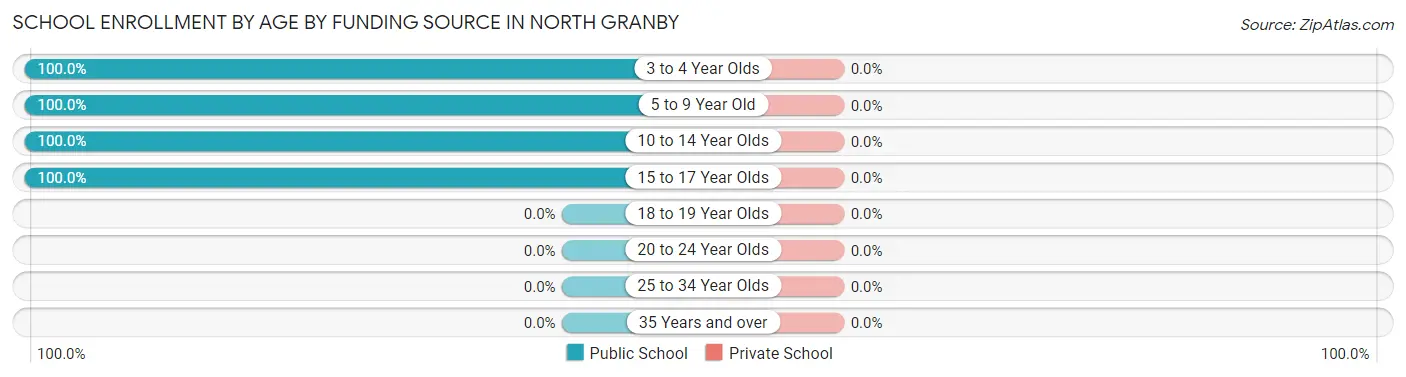
| Age Bracket | Public School | Private School |
| 3 to 4 Year Olds | 36 (100.0%) | 0 (0.0%) |
| 5 to 9 Year Old | 212 (100.0%) | 0 (0.0%) |
| 10 to 14 Year Olds | 41 (100.0%) | 0 (0.0%) |
| 15 to 17 Year Olds | 25 (100.0%) | 0 (0.0%) |
| 18 to 19 Year Olds | 0 (0.0%) | 0 (0.0%) |
| 20 to 24 Year Olds | 0 (0.0%) | 0 (0.0%) |
| 25 to 34 Year Olds | 0 (0.0%) | 0 (0.0%) |
| 35 Years and over | 0 (0.0%) | 0 (0.0%) |
| Total | 314 (100.0%) | 0 (0.0%) |
Educational Attainment by Field of Study in North Granby
Science & technology (132 | 20.2%), business (108 | 16.5%), computers & mathematics (74 | 11.3%), social sciences (64 | 9.8%), and bio, nature & agricultural (53 | 8.1%) are the most common fields of study among 653 individuals in North Granby who have obtained a bachelor's degree or higher.
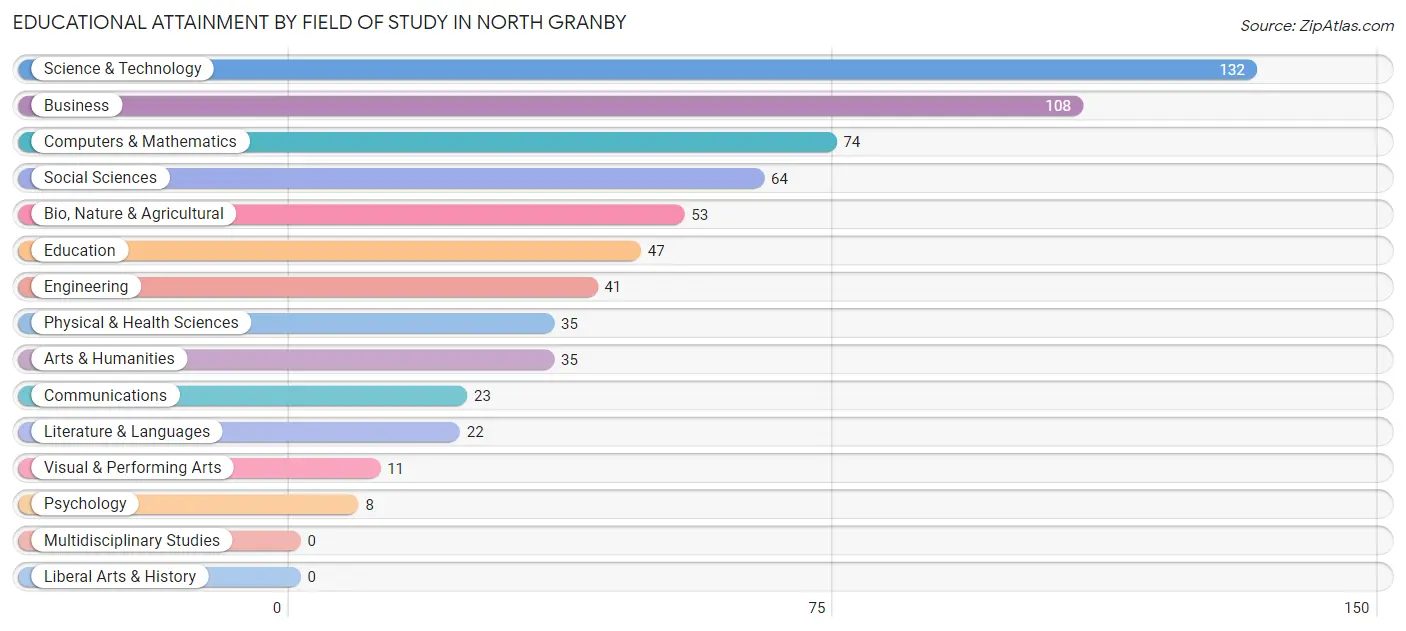
| Field of Study | # Graduates | % Graduates |
| Computers & Mathematics | 74 | 11.3% |
| Bio, Nature & Agricultural | 53 | 8.1% |
| Physical & Health Sciences | 35 | 5.4% |
| Psychology | 8 | 1.2% |
| Social Sciences | 64 | 9.8% |
| Engineering | 41 | 6.3% |
| Multidisciplinary Studies | 0 | 0.0% |
| Science & Technology | 132 | 20.2% |
| Business | 108 | 16.5% |
| Education | 47 | 7.2% |
| Literature & Languages | 22 | 3.4% |
| Liberal Arts & History | 0 | 0.0% |
| Visual & Performing Arts | 11 | 1.7% |
| Communications | 23 | 3.5% |
| Arts & Humanities | 35 | 5.4% |
| Total | 653 | 100.0% |
Transportation & Commute in North Granby
Vehicle Availability by Sex in North Granby
The most prevalent vehicle ownership categories in North Granby are males with 2 vehicles (276, accounting for 56.2%) and females with 2 vehicles (190, making up 68.5%).
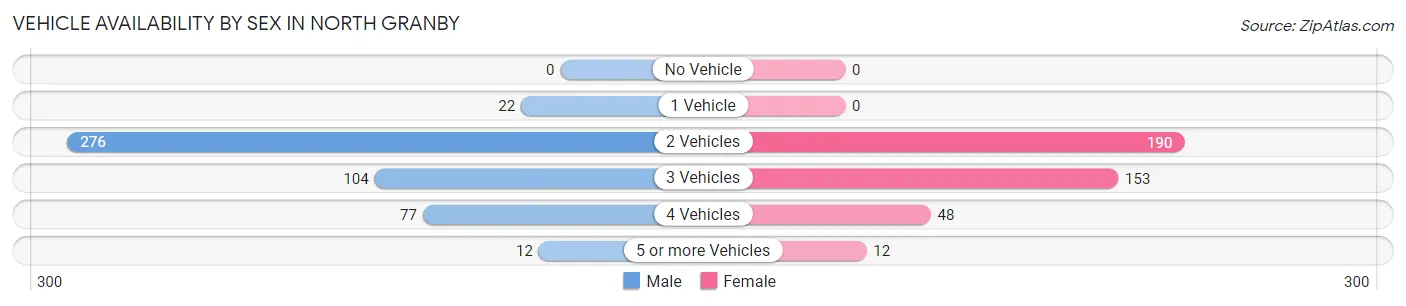
| Vehicles Available | Male | Female |
| No Vehicle | 0 (0.0%) | 0 (0.0%) |
| 1 Vehicle | 22 (4.5%) | 0 (0.0%) |
| 2 Vehicles | 276 (56.2%) | 190 (47.1%) |
| 3 Vehicles | 104 (21.2%) | 153 (38.0%) |
| 4 Vehicles | 77 (15.7%) | 48 (11.9%) |
| 5 or more Vehicles | 12 (2.4%) | 12 (3.0%) |
| Total | 491 (100.0%) | 403 (100.0%) |
Commute Time in North Granby
The most frequently occuring commute durations in North Granby are 30 to 34 minutes (166 commuters, 25.8%), 20 to 24 minutes (99 commuters, 15.4%), and 40 to 44 minutes (82 commuters, 12.8%).
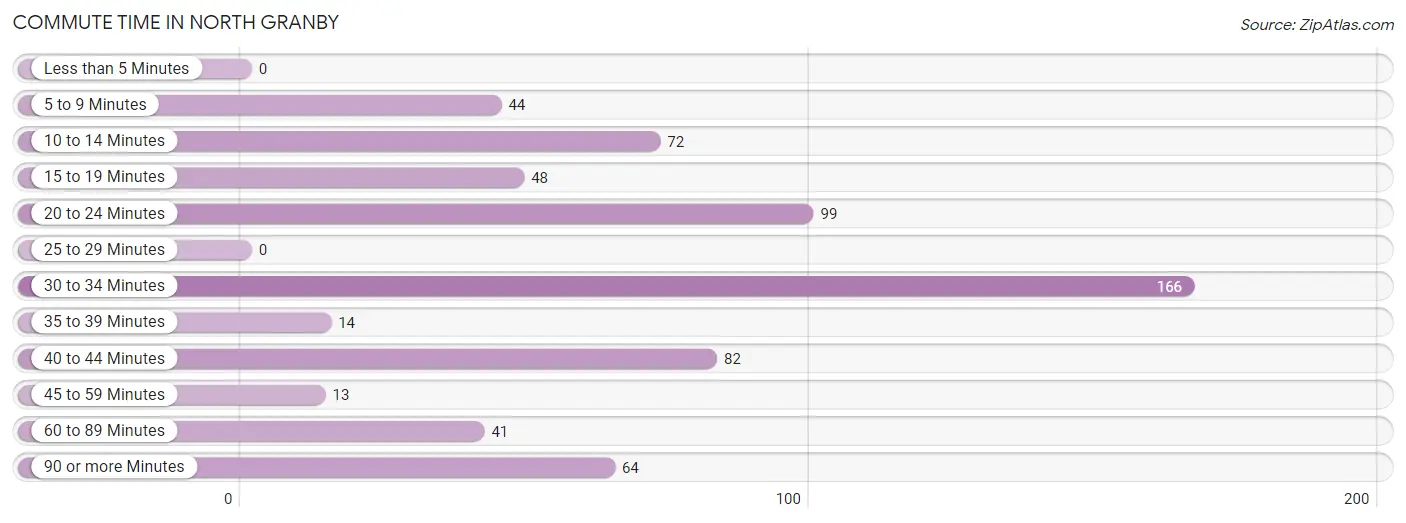
| Commute Time | # Commuters | % Commuters |
| Less than 5 Minutes | 0 | 0.0% |
| 5 to 9 Minutes | 44 | 6.8% |
| 10 to 14 Minutes | 72 | 11.2% |
| 15 to 19 Minutes | 48 | 7.5% |
| 20 to 24 Minutes | 99 | 15.4% |
| 25 to 29 Minutes | 0 | 0.0% |
| 30 to 34 Minutes | 166 | 25.8% |
| 35 to 39 Minutes | 14 | 2.2% |
| 40 to 44 Minutes | 82 | 12.8% |
| 45 to 59 Minutes | 13 | 2.0% |
| 60 to 89 Minutes | 41 | 6.4% |
| 90 or more Minutes | 64 | 10.0% |
Commute Time by Sex in North Granby
The most common commute times in North Granby are 30 to 34 minutes (93 commuters, 29.9%) for males and 20 to 24 minutes (74 commuters, 22.3%) for females.
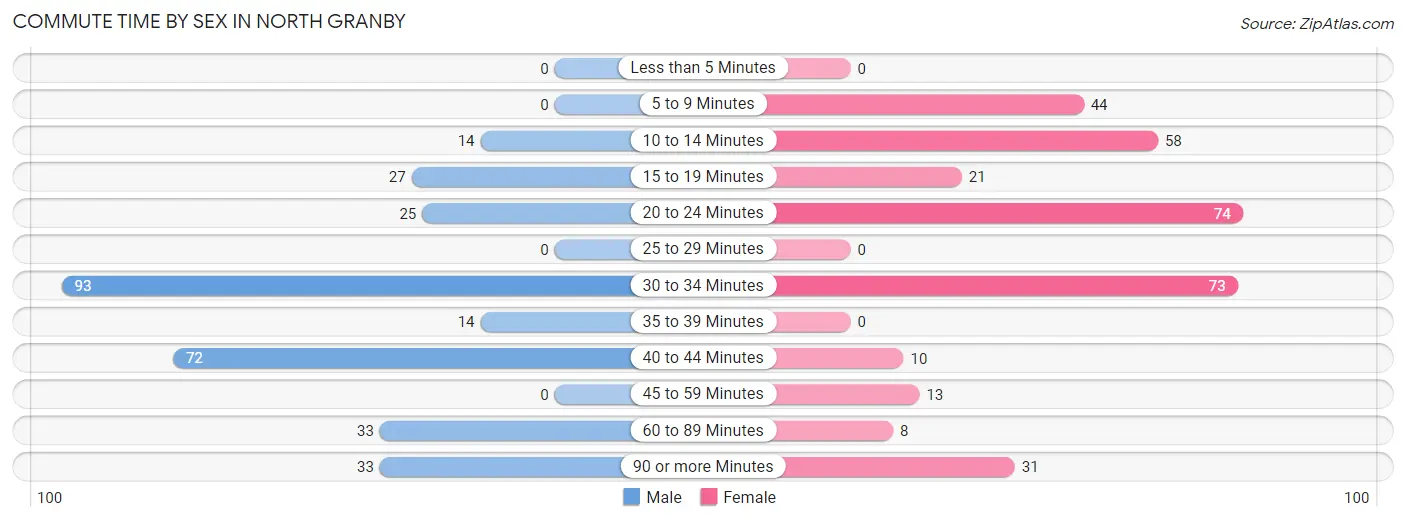
| Commute Time | Male | Female |
| Less than 5 Minutes | 0 (0.0%) | 0 (0.0%) |
| 5 to 9 Minutes | 0 (0.0%) | 44 (13.3%) |
| 10 to 14 Minutes | 14 (4.5%) | 58 (17.5%) |
| 15 to 19 Minutes | 27 (8.7%) | 21 (6.3%) |
| 20 to 24 Minutes | 25 (8.0%) | 74 (22.3%) |
| 25 to 29 Minutes | 0 (0.0%) | 0 (0.0%) |
| 30 to 34 Minutes | 93 (29.9%) | 73 (22.0%) |
| 35 to 39 Minutes | 14 (4.5%) | 0 (0.0%) |
| 40 to 44 Minutes | 72 (23.2%) | 10 (3.0%) |
| 45 to 59 Minutes | 0 (0.0%) | 13 (3.9%) |
| 60 to 89 Minutes | 33 (10.6%) | 8 (2.4%) |
| 90 or more Minutes | 33 (10.6%) | 31 (9.3%) |
Time of Departure to Work by Sex in North Granby
The most frequent times of departure to work in North Granby are 7:00 AM to 7:29 AM (147, 47.3%) for males and 7:30 AM to 7:59 AM (100, 30.1%) for females.
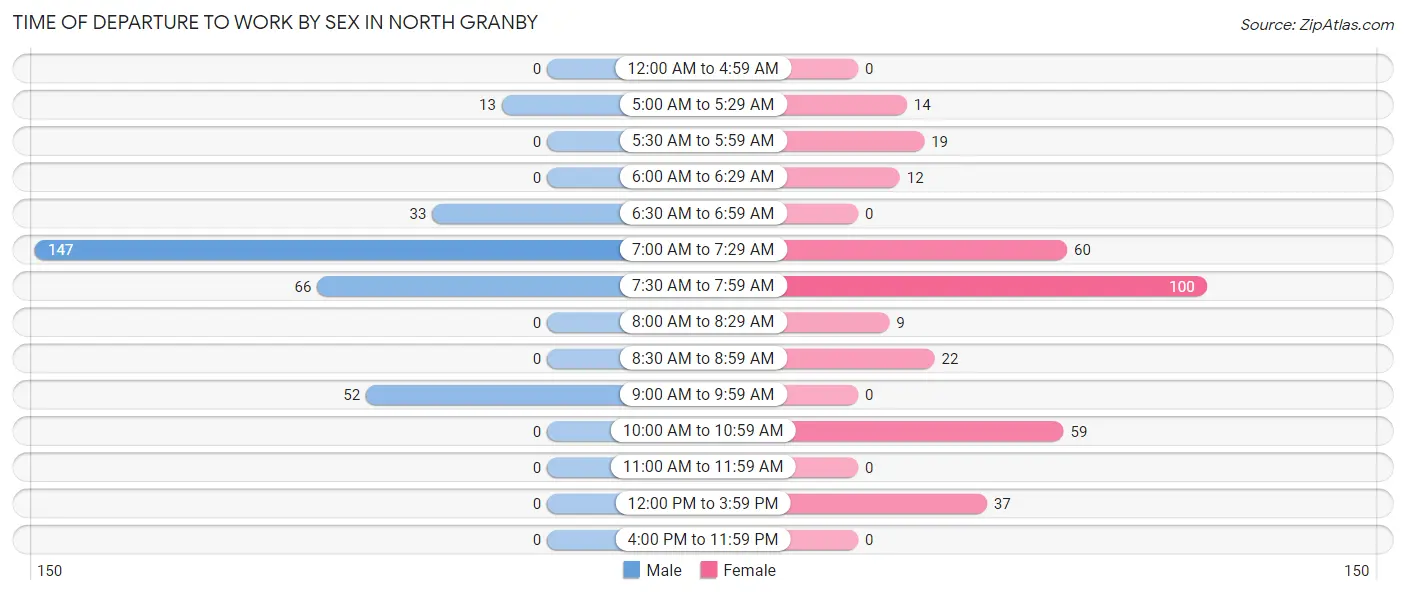
| Time of Departure | Male | Female |
| 12:00 AM to 4:59 AM | 0 (0.0%) | 0 (0.0%) |
| 5:00 AM to 5:29 AM | 13 (4.2%) | 14 (4.2%) |
| 5:30 AM to 5:59 AM | 0 (0.0%) | 19 (5.7%) |
| 6:00 AM to 6:29 AM | 0 (0.0%) | 12 (3.6%) |
| 6:30 AM to 6:59 AM | 33 (10.6%) | 0 (0.0%) |
| 7:00 AM to 7:29 AM | 147 (47.3%) | 60 (18.1%) |
| 7:30 AM to 7:59 AM | 66 (21.2%) | 100 (30.1%) |
| 8:00 AM to 8:29 AM | 0 (0.0%) | 9 (2.7%) |
| 8:30 AM to 8:59 AM | 0 (0.0%) | 22 (6.6%) |
| 9:00 AM to 9:59 AM | 52 (16.7%) | 0 (0.0%) |
| 10:00 AM to 10:59 AM | 0 (0.0%) | 59 (17.8%) |
| 11:00 AM to 11:59 AM | 0 (0.0%) | 0 (0.0%) |
| 12:00 PM to 3:59 PM | 0 (0.0%) | 37 (11.1%) |
| 4:00 PM to 11:59 PM | 0 (0.0%) | 0 (0.0%) |
| Total | 311 (100.0%) | 332 (100.0%) |
Housing Occupancy in North Granby
Occupancy by Ownership in North Granby
Of the total 606 dwellings in North Granby, owner-occupied units account for 606 (100.0%), while renter-occupied units make up 0 (0.0%).
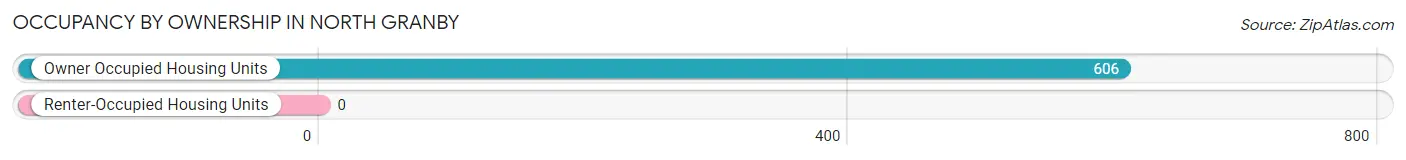
| Occupancy | # Housing Units | % Housing Units |
| Owner Occupied Housing Units | 606 | 100.0% |
| Renter-Occupied Housing Units | 0 | 0.0% |
| Total Occupied Housing Units | 606 | 100.0% |
Occupancy by Household Size in North Granby
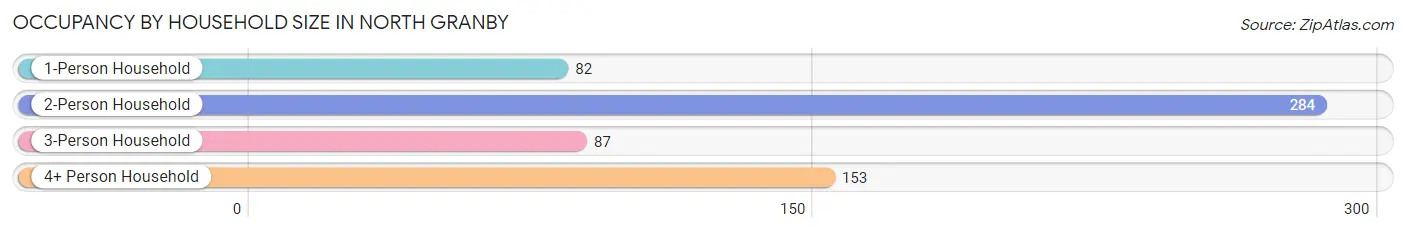
| Household Size | # Housing Units | % Housing Units |
| 1-Person Household | 82 | 13.5% |
| 2-Person Household | 284 | 46.9% |
| 3-Person Household | 87 | 14.4% |
| 4+ Person Household | 153 | 25.3% |
| Total Housing Units | 606 | 100.0% |
Occupancy by Ownership by Household Size in North Granby
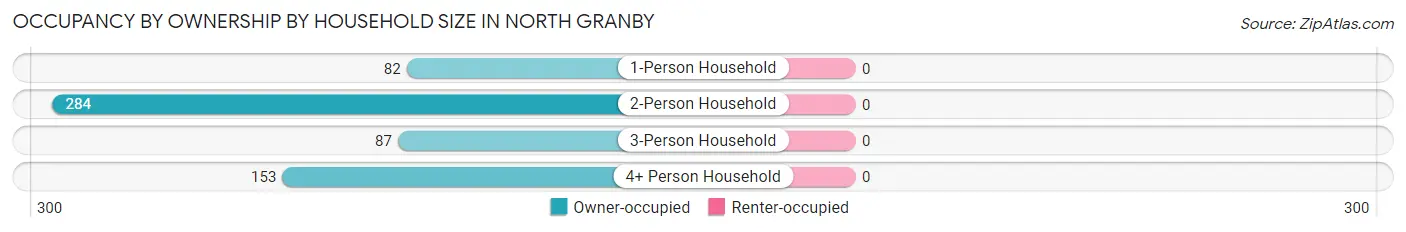
| Household Size | Owner-occupied | Renter-occupied |
| 1-Person Household | 82 (100.0%) | 0 (0.0%) |
| 2-Person Household | 284 (100.0%) | 0 (0.0%) |
| 3-Person Household | 87 (100.0%) | 0 (0.0%) |
| 4+ Person Household | 153 (100.0%) | 0 (0.0%) |
| Total Housing Units | 606 (100.0%) | 0 (0.0%) |
Occupancy by Educational Attainment in North Granby
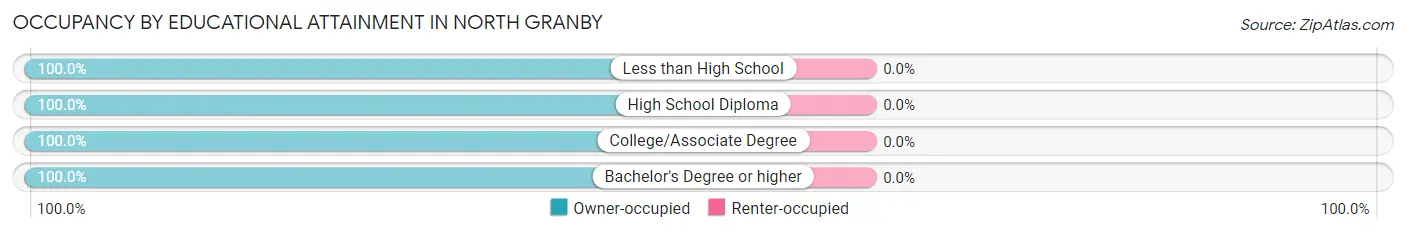
| Household Size | Owner-occupied | Renter-occupied |
| Less than High School | 40 (100.0%) | 0 (0.0%) |
| High School Diploma | 151 (100.0%) | 0 (0.0%) |
| College/Associate Degree | 62 (100.0%) | 0 (0.0%) |
| Bachelor's Degree or higher | 353 (100.0%) | 0 (0.0%) |
Occupancy by Age of Householder in North Granby
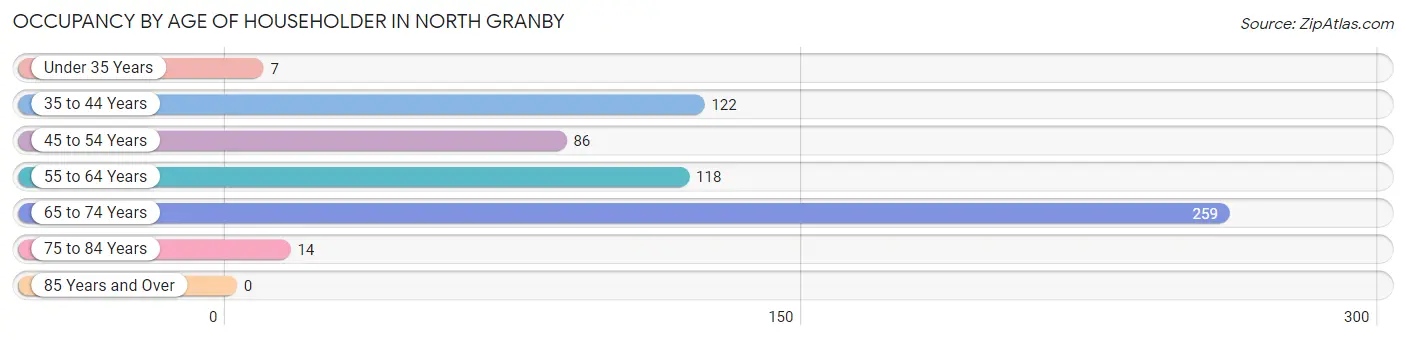
| Age Bracket | # Households | % Households |
| Under 35 Years | 7 | 1.2% |
| 35 to 44 Years | 122 | 20.1% |
| 45 to 54 Years | 86 | 14.2% |
| 55 to 64 Years | 118 | 19.5% |
| 65 to 74 Years | 259 | 42.7% |
| 75 to 84 Years | 14 | 2.3% |
| 85 Years and Over | 0 | 0.0% |
| Total | 606 | 100.0% |
Housing Finances in North Granby
Median Income by Occupancy in North Granby
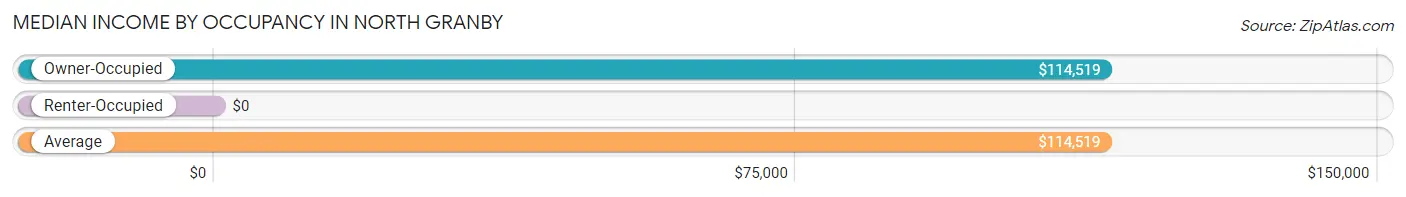
| Occupancy Type | # Households | Median Income |
| Owner-Occupied | 606 (100.0%) | $114,519 |
| Renter-Occupied | 0 (0.0%) | $0 |
| Average | 606 (100.0%) | $114,519 |
Occupancy by Householder Income Bracket in North Granby
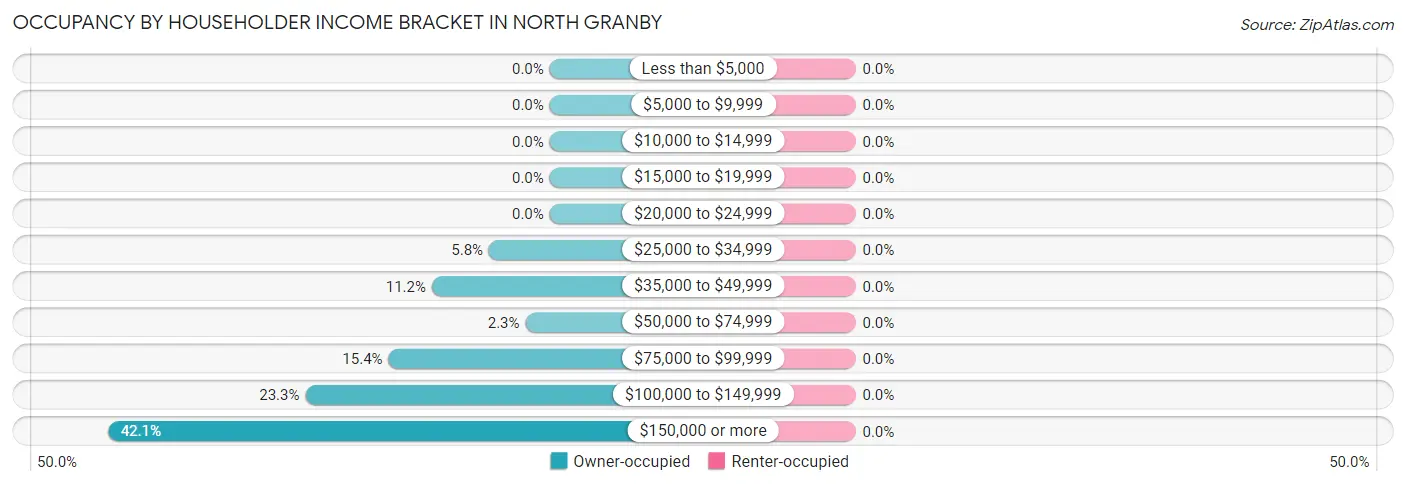
| Income Bracket | Owner-occupied | Renter-occupied |
| Less than $5,000 | 0 (0.0%) | 0 (0.0%) |
| $5,000 to $9,999 | 0 (0.0%) | 0 (0.0%) |
| $10,000 to $14,999 | 0 (0.0%) | 0 (0.0%) |
| $15,000 to $19,999 | 0 (0.0%) | 0 (0.0%) |
| $20,000 to $24,999 | 0 (0.0%) | 0 (0.0%) |
| $25,000 to $34,999 | 35 (5.8%) | 0 (0.0%) |
| $35,000 to $49,999 | 68 (11.2%) | 0 (0.0%) |
| $50,000 to $74,999 | 14 (2.3%) | 0 (0.0%) |
| $75,000 to $99,999 | 93 (15.3%) | 0 (0.0%) |
| $100,000 to $149,999 | 141 (23.3%) | 0 (0.0%) |
| $150,000 or more | 255 (42.1%) | 0 (0.0%) |
| Total | 606 (100.0%) | 0 (0.0%) |
Monthly Housing Cost Tiers in North Granby
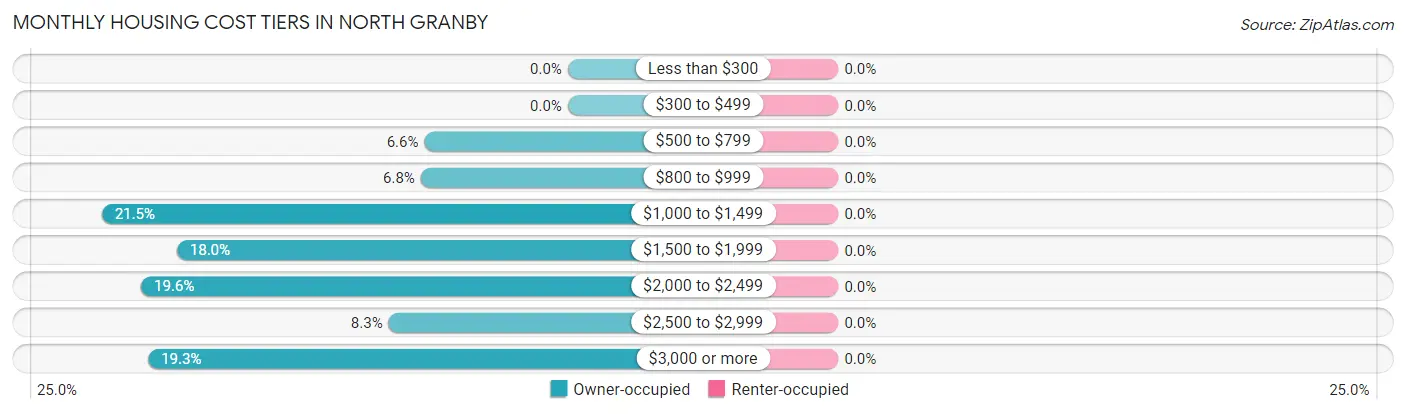
| Monthly Cost | Owner-occupied | Renter-occupied |
| Less than $300 | 0 (0.0%) | 0 (0.0%) |
| $300 to $499 | 0 (0.0%) | 0 (0.0%) |
| $500 to $799 | 40 (6.6%) | 0 (0.0%) |
| $800 to $999 | 41 (6.8%) | 0 (0.0%) |
| $1,000 to $1,499 | 130 (21.4%) | 0 (0.0%) |
| $1,500 to $1,999 | 109 (18.0%) | 0 (0.0%) |
| $2,000 to $2,499 | 119 (19.6%) | 0 (0.0%) |
| $2,500 to $2,999 | 50 (8.3%) | 0 (0.0%) |
| $3,000 or more | 117 (19.3%) | 0 (0.0%) |
| Total | 606 (100.0%) | 0 (0.0%) |
Physical Housing Characteristics in North Granby
Housing Structures in North Granby
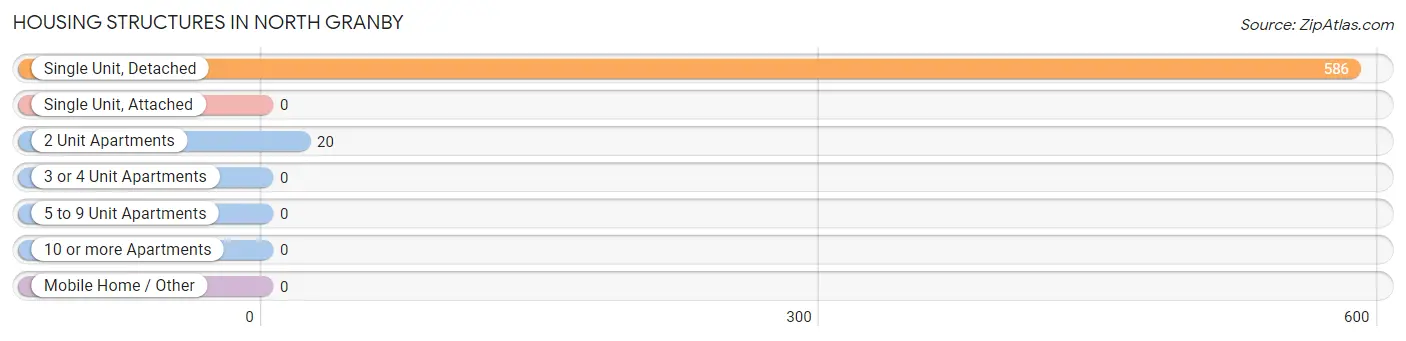
| Structure Type | # Housing Units | % Housing Units |
| Single Unit, Detached | 586 | 96.7% |
| Single Unit, Attached | 0 | 0.0% |
| 2 Unit Apartments | 20 | 3.3% |
| 3 or 4 Unit Apartments | 0 | 0.0% |
| 5 to 9 Unit Apartments | 0 | 0.0% |
| 10 or more Apartments | 0 | 0.0% |
| Mobile Home / Other | 0 | 0.0% |
| Total | 606 | 100.0% |
Housing Structures by Occupancy in North Granby
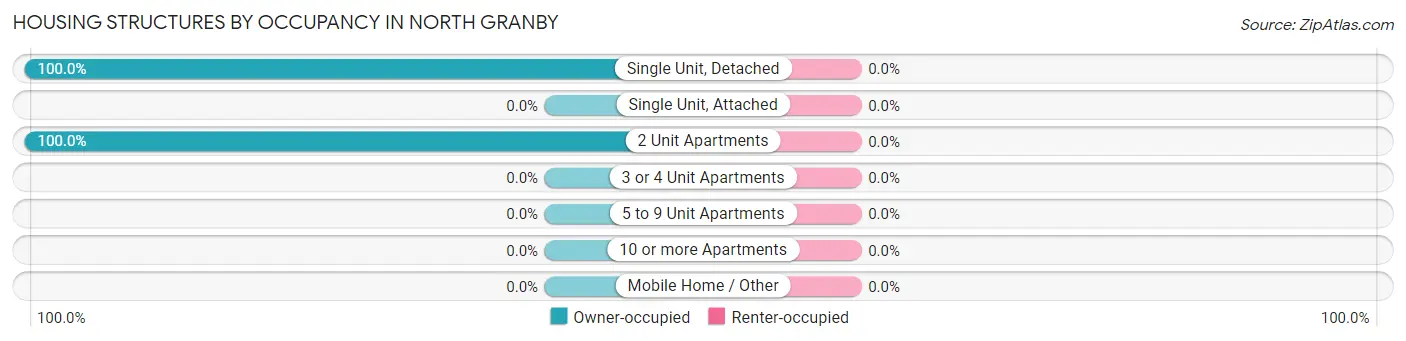
| Structure Type | Owner-occupied | Renter-occupied |
| Single Unit, Detached | 586 (100.0%) | 0 (0.0%) |
| Single Unit, Attached | 0 (0.0%) | 0 (0.0%) |
| 2 Unit Apartments | 20 (100.0%) | 0 (0.0%) |
| 3 or 4 Unit Apartments | 0 (0.0%) | 0 (0.0%) |
| 5 to 9 Unit Apartments | 0 (0.0%) | 0 (0.0%) |
| 10 or more Apartments | 0 (0.0%) | 0 (0.0%) |
| Mobile Home / Other | 0 (0.0%) | 0 (0.0%) |
| Total | 606 (100.0%) | 0 (0.0%) |
Housing Structures by Number of Rooms in North Granby
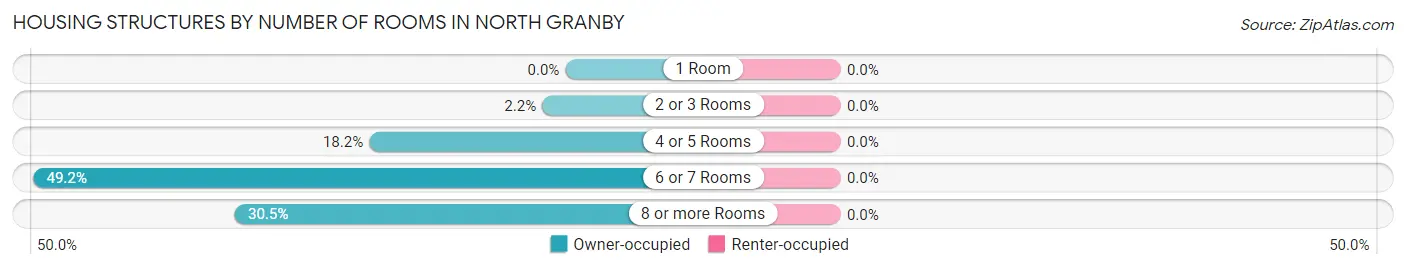
| Number of Rooms | Owner-occupied | Renter-occupied |
| 1 Room | 0 (0.0%) | 0 (0.0%) |
| 2 or 3 Rooms | 13 (2.1%) | 0 (0.0%) |
| 4 or 5 Rooms | 110 (18.1%) | 0 (0.0%) |
| 6 or 7 Rooms | 298 (49.2%) | 0 (0.0%) |
| 8 or more Rooms | 185 (30.5%) | 0 (0.0%) |
| Total | 606 (100.0%) | 0 (0.0%) |
Housing Structure by Heating Type in North Granby
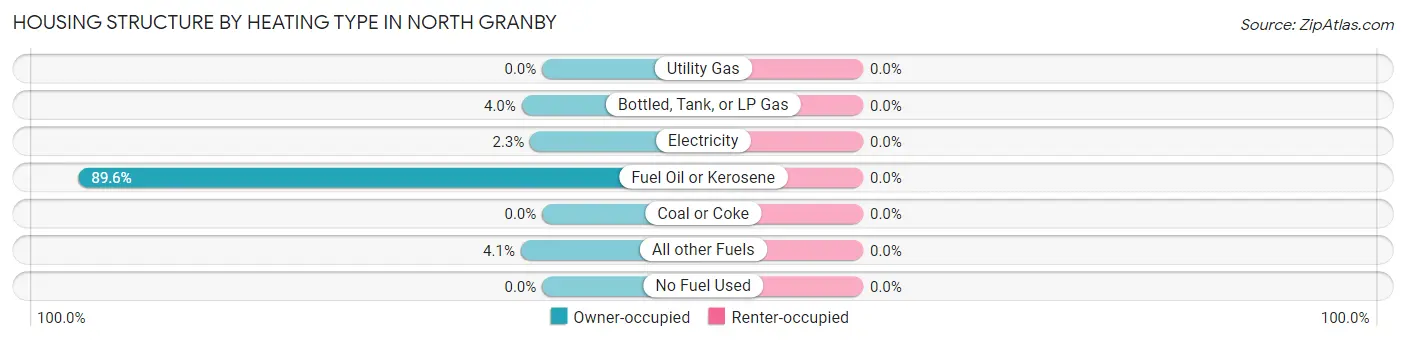
| Heating Type | Owner-occupied | Renter-occupied |
| Utility Gas | 0 (0.0%) | 0 (0.0%) |
| Bottled, Tank, or LP Gas | 24 (4.0%) | 0 (0.0%) |
| Electricity | 14 (2.3%) | 0 (0.0%) |
| Fuel Oil or Kerosene | 543 (89.6%) | 0 (0.0%) |
| Coal or Coke | 0 (0.0%) | 0 (0.0%) |
| All other Fuels | 25 (4.1%) | 0 (0.0%) |
| No Fuel Used | 0 (0.0%) | 0 (0.0%) |
| Total | 606 (100.0%) | 0 (0.0%) |
Household Vehicle Usage in North Granby
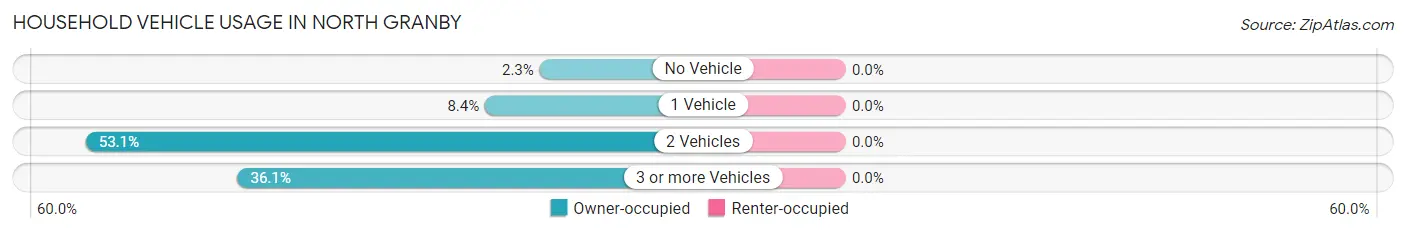
| Vehicles per Household | Owner-occupied | Renter-occupied |
| No Vehicle | 14 (2.3%) | 0 (0.0%) |
| 1 Vehicle | 51 (8.4%) | 0 (0.0%) |
| 2 Vehicles | 322 (53.1%) | 0 (0.0%) |
| 3 or more Vehicles | 219 (36.1%) | 0 (0.0%) |
| Total | 606 (100.0%) | 0 (0.0%) |
Real Estate & Mortgages in North Granby
Real Estate and Mortgage Overview in North Granby
| Characteristic | Without Mortgage | With Mortgage |
| Housing Units | 233 | 373 |
| Median Property Value | $346,000 | $396,200 |
| Median Household Income | $79,911 | $216 |
| Monthly Housing Costs | $1,230 | $117 |
| Real Estate Taxes | $9,980 | $0 |
Property Value by Mortgage Status in North Granby
| Property Value | Without Mortgage | With Mortgage |
| Less than $50,000 | 0 (0.0%) | 0 (0.0%) |
| $50,000 to $99,999 | 0 (0.0%) | 0 (0.0%) |
| $100,000 to $299,999 | 54 (23.2%) | 123 (33.0%) |
| $300,000 to $499,999 | 162 (69.5%) | 166 (44.5%) |
| $500,000 to $749,999 | 6 (2.6%) | 63 (16.9%) |
| $750,000 to $999,999 | 11 (4.7%) | 0 (0.0%) |
| $1,000,000 or more | 0 (0.0%) | 21 (5.6%) |
| Total | 233 (100.0%) | 373 (100.0%) |
Household Income by Mortgage Status in North Granby
| Household Income | Without Mortgage | With Mortgage |
| Less than $10,000 | 0 (0.0%) | 15 (4.0%) |
| $10,000 to $24,999 | 0 (0.0%) | 0 (0.0%) |
| $25,000 to $34,999 | 35 (15.0%) | 0 (0.0%) |
| $35,000 to $49,999 | 68 (29.2%) | 0 (0.0%) |
| $50,000 to $74,999 | 0 (0.0%) | 0 (0.0%) |
| $75,000 to $99,999 | 67 (28.8%) | 14 (3.7%) |
| $100,000 to $149,999 | 24 (10.3%) | 26 (7.0%) |
| $150,000 or more | 39 (16.7%) | 117 (31.4%) |
| Total | 233 (100.0%) | 373 (100.0%) |
Property Value to Household Income Ratio in North Granby
| Value-to-Income Ratio | Without Mortgage | With Mortgage |
| Less than 2.0x | 17 (7.3%) | 175,729 (47,112.3%) |
| 2.0x to 2.9x | 62 (26.6%) | 101 (27.1%) |
| 3.0x to 3.9x | 37 (15.9%) | 173 (46.4%) |
| 4.0x or more | 117 (50.2%) | 61 (16.4%) |
| Total | 233 (100.0%) | 373 (100.0%) |
Real Estate Taxes by Mortgage Status in North Granby
| Property Taxes | Without Mortgage | With Mortgage |
| Less than $800 | 0 (0.0%) | 0 (0.0%) |
| $800 to $1,499 | 0 (0.0%) | 0 (0.0%) |
| $800 to $1,499 | 233 (100.0%) | 0 (0.0%) |
| Total | 233 (100.0%) | 373 (100.0%) |
Health & Disability in North Granby
Health Insurance Coverage by Age in North Granby
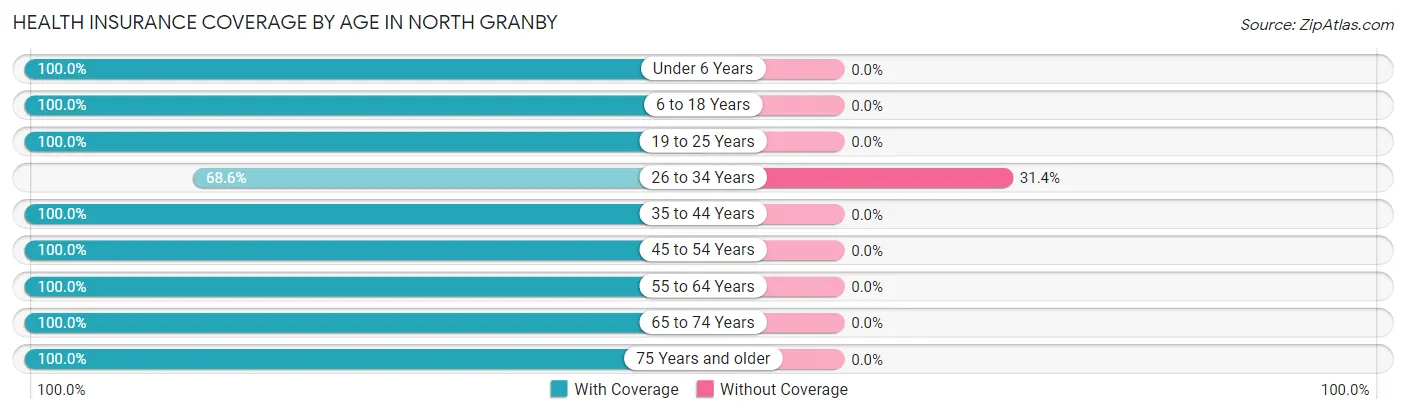
| Age Bracket | With Coverage | Without Coverage |
| Under 6 Years | 170 (100.0%) | 0 (0.0%) |
| 6 to 18 Years | 200 (100.0%) | 0 (0.0%) |
| 19 to 25 Years | 65 (100.0%) | 0 (0.0%) |
| 26 to 34 Years | 24 (68.6%) | 11 (31.4%) |
| 35 to 44 Years | 231 (100.0%) | 0 (0.0%) |
| 45 to 54 Years | 169 (100.0%) | 0 (0.0%) |
| 55 to 64 Years | 221 (100.0%) | 0 (0.0%) |
| 65 to 74 Years | 423 (100.0%) | 0 (0.0%) |
| 75 Years and older | 42 (100.0%) | 0 (0.0%) |
| Total | 1,545 (99.3%) | 11 (0.7%) |
Health Insurance Coverage by Citizenship Status in North Granby
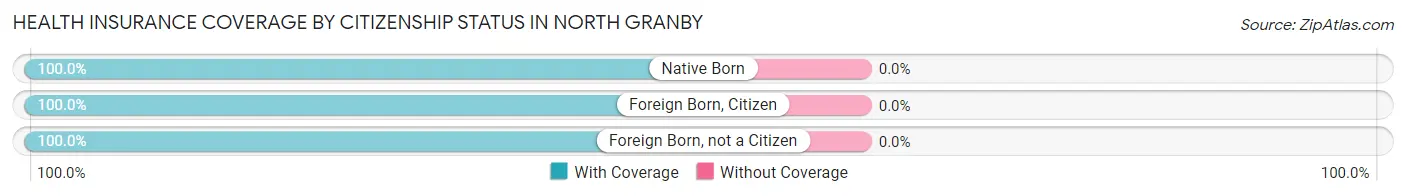
| Citizenship Status | With Coverage | Without Coverage |
| Native Born | 170 (100.0%) | 0 (0.0%) |
| Foreign Born, Citizen | 200 (100.0%) | 0 (0.0%) |
| Foreign Born, not a Citizen | 65 (100.0%) | 0 (0.0%) |
Health Insurance Coverage by Household Income in North Granby
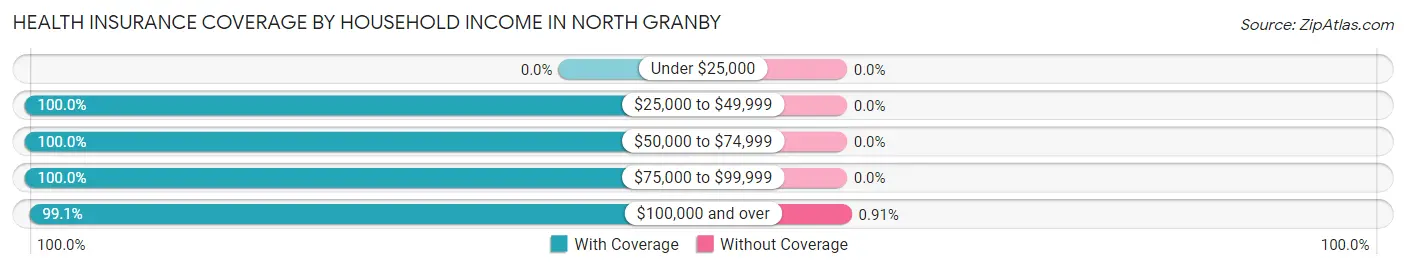
| Household Income | With Coverage | Without Coverage |
| Under $25,000 | 0 (0.0%) | 0 (0.0%) |
| $25,000 to $49,999 | 138 (100.0%) | 0 (0.0%) |
| $50,000 to $74,999 | 28 (100.0%) | 0 (0.0%) |
| $75,000 to $99,999 | 175 (100.0%) | 0 (0.0%) |
| $100,000 and over | 1,200 (99.1%) | 11 (0.9%) |
Public vs Private Health Insurance Coverage by Age in North Granby
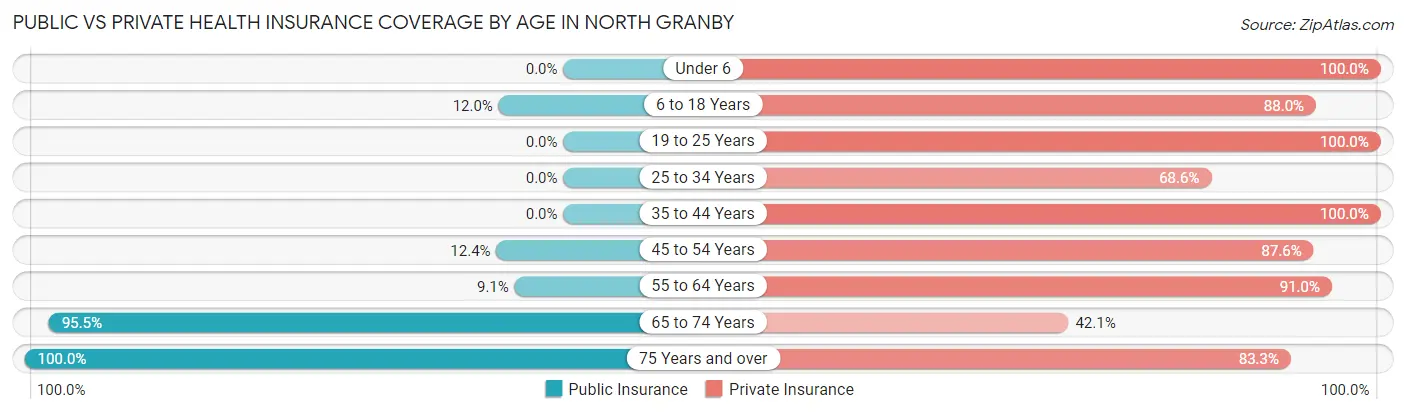
| Age Bracket | Public Insurance | Private Insurance |
| Under 6 | 0 (0.0%) | 170 (100.0%) |
| 6 to 18 Years | 24 (12.0%) | 176 (88.0%) |
| 19 to 25 Years | 0 (0.0%) | 65 (100.0%) |
| 25 to 34 Years | 0 (0.0%) | 24 (68.6%) |
| 35 to 44 Years | 0 (0.0%) | 231 (100.0%) |
| 45 to 54 Years | 21 (12.4%) | 148 (87.6%) |
| 55 to 64 Years | 20 (9.0%) | 201 (90.9%) |
| 65 to 74 Years | 404 (95.5%) | 178 (42.1%) |
| 75 Years and over | 42 (100.0%) | 35 (83.3%) |
| Total | 511 (32.8%) | 1,228 (78.9%) |
Disability Status by Sex by Age in North Granby
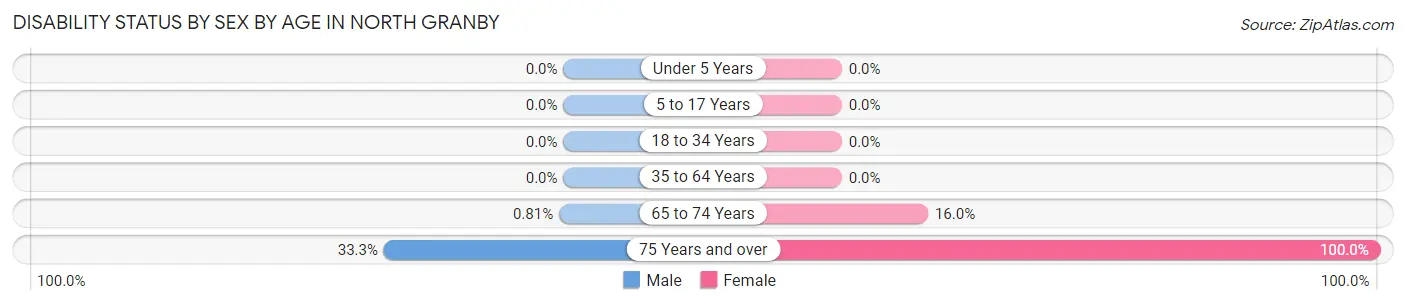
| Age Bracket | Male | Female |
| Under 5 Years | 0 (0.0%) | 0 (0.0%) |
| 5 to 17 Years | 0 (0.0%) | 0 (0.0%) |
| 18 to 34 Years | 0 (0.0%) | 0 (0.0%) |
| 35 to 64 Years | 0 (0.0%) | 0 (0.0%) |
| 65 to 74 Years | 2 (0.8%) | 28 (16.0%) |
| 75 Years and over | 7 (33.3%) | 21 (100.0%) |
Disability Class by Sex by Age in North Granby
Disability Class: Hearing Difficulty
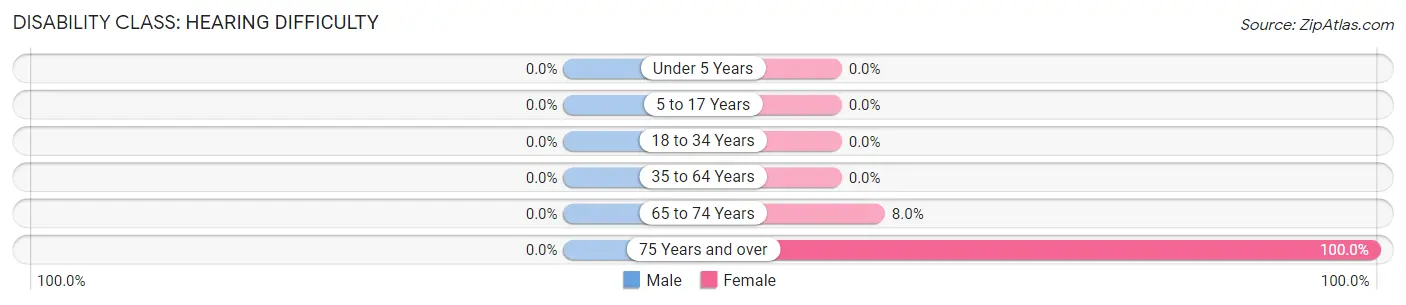
| Age Bracket | Male | Female |
| Under 5 Years | 0 (0.0%) | 0 (0.0%) |
| 5 to 17 Years | 0 (0.0%) | 0 (0.0%) |
| 18 to 34 Years | 0 (0.0%) | 0 (0.0%) |
| 35 to 64 Years | 0 (0.0%) | 0 (0.0%) |
| 65 to 74 Years | 0 (0.0%) | 14 (8.0%) |
| 75 Years and over | 0 (0.0%) | 21 (100.0%) |
Disability Class: Vision Difficulty
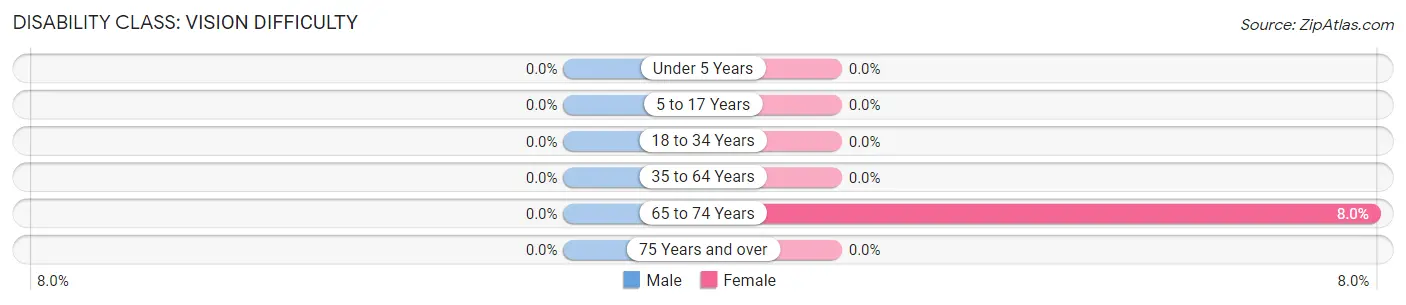
| Age Bracket | Male | Female |
| Under 5 Years | 0 (0.0%) | 0 (0.0%) |
| 5 to 17 Years | 0 (0.0%) | 0 (0.0%) |
| 18 to 34 Years | 0 (0.0%) | 0 (0.0%) |
| 35 to 64 Years | 0 (0.0%) | 0 (0.0%) |
| 65 to 74 Years | 0 (0.0%) | 14 (8.0%) |
| 75 Years and over | 0 (0.0%) | 0 (0.0%) |
Disability Class: Cognitive Difficulty
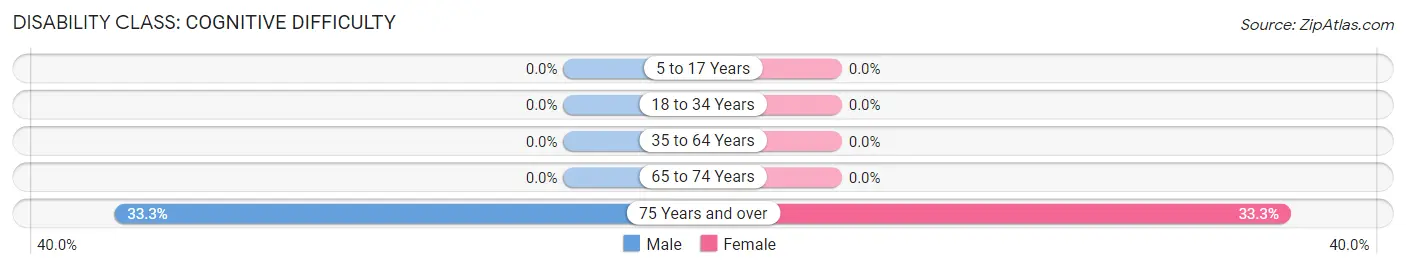
| Age Bracket | Male | Female |
| 5 to 17 Years | 0 (0.0%) | 0 (0.0%) |
| 18 to 34 Years | 0 (0.0%) | 0 (0.0%) |
| 35 to 64 Years | 0 (0.0%) | 0 (0.0%) |
| 65 to 74 Years | 0 (0.0%) | 0 (0.0%) |
| 75 Years and over | 7 (33.3%) | 7 (33.3%) |
Disability Class: Ambulatory Difficulty
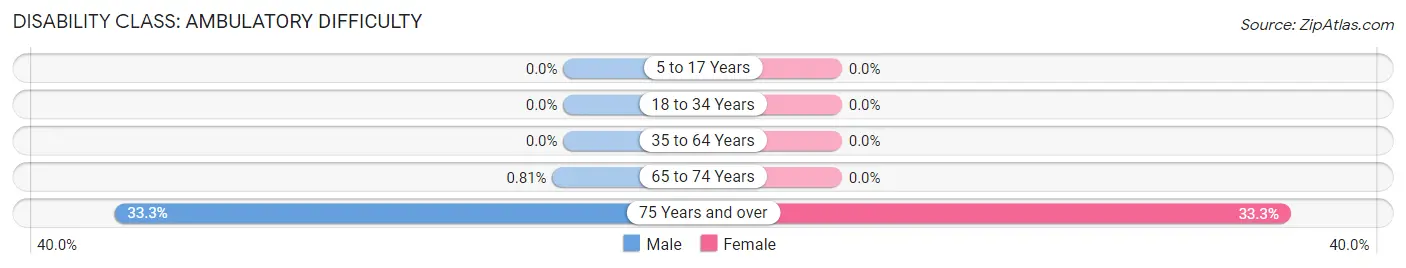
| Age Bracket | Male | Female |
| 5 to 17 Years | 0 (0.0%) | 0 (0.0%) |
| 18 to 34 Years | 0 (0.0%) | 0 (0.0%) |
| 35 to 64 Years | 0 (0.0%) | 0 (0.0%) |
| 65 to 74 Years | 2 (0.8%) | 0 (0.0%) |
| 75 Years and over | 7 (33.3%) | 7 (33.3%) |
Disability Class: Self-Care Difficulty
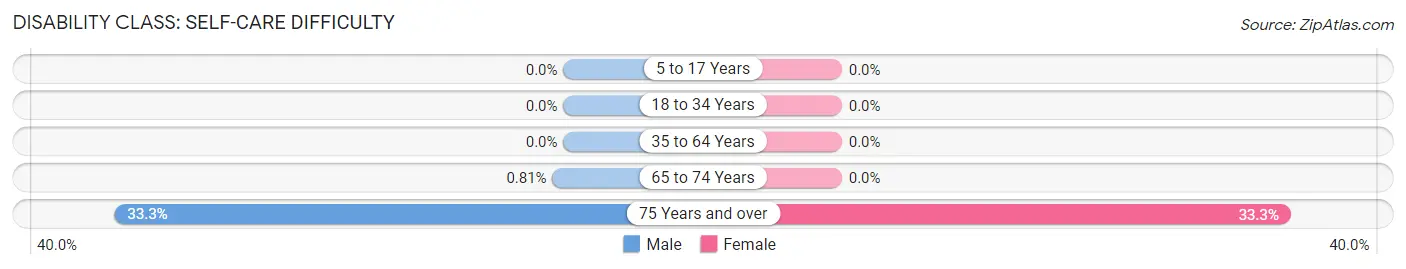
| Age Bracket | Male | Female |
| 5 to 17 Years | 0 (0.0%) | 0 (0.0%) |
| 18 to 34 Years | 0 (0.0%) | 0 (0.0%) |
| 35 to 64 Years | 0 (0.0%) | 0 (0.0%) |
| 65 to 74 Years | 2 (0.8%) | 0 (0.0%) |
| 75 Years and over | 7 (33.3%) | 7 (33.3%) |
Technology Access in North Granby
Computing Device Access in North Granby
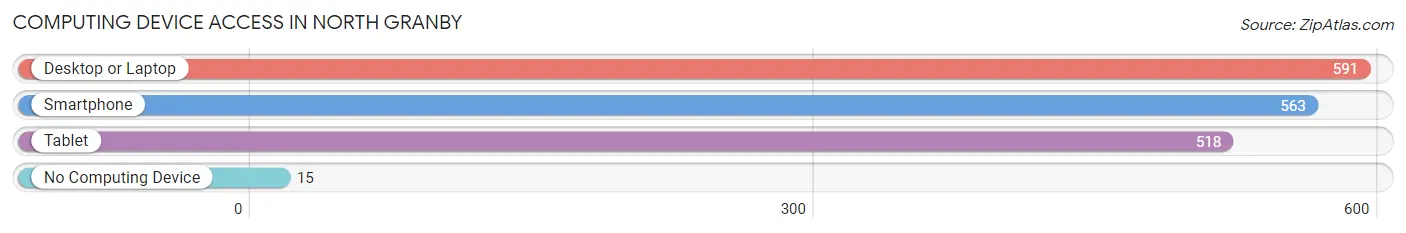
| Device Type | # Households | % Households |
| Desktop or Laptop | 591 | 97.5% |
| Smartphone | 563 | 92.9% |
| Tablet | 518 | 85.5% |
| No Computing Device | 15 | 2.5% |
| Total | 606 | 100.0% |
Internet Access in North Granby
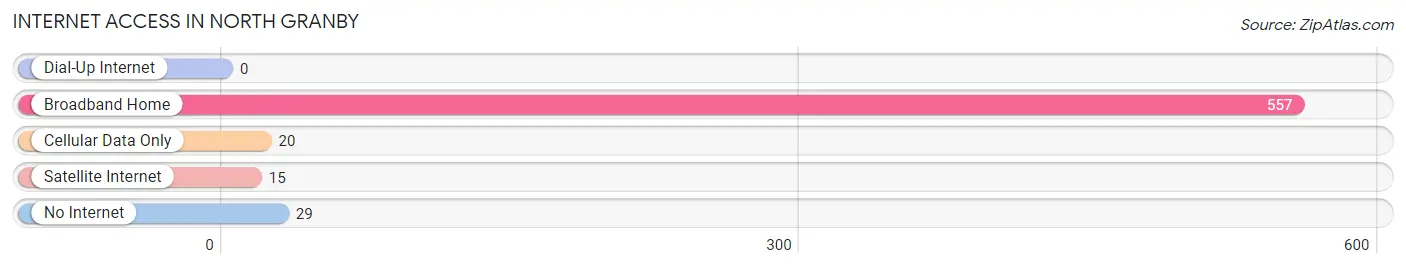
| Internet Type | # Households | % Households |
| Dial-Up Internet | 0 | 0.0% |
| Broadband Home | 557 | 91.9% |
| Cellular Data Only | 20 | 3.3% |
| Satellite Internet | 15 | 2.5% |
| No Internet | 29 | 4.8% |
| Total | 606 | 100.0% |
North Granby Summary
History
North Granby is a small town located in Hartford County, Connecticut. It is part of the town of Granby, which was incorporated in 1786. North Granby was originally part of the town of Simsbury, but was annexed to Granby in 1806. The town was named after Granby, Massachusetts, which was named after John Manners, Marquess of Granby.
North Granby is located in the Farmington River Valley, which is a major agricultural area in Connecticut. The town is home to several small farms, as well as a few larger farms. The town is also home to the Salmon Brook Historical Society, which is dedicated to preserving the history of the town.
Geography
North Granby is located in the Farmington River Valley, which is a major agricultural area in Connecticut. The town is located in the foothills of the Berkshires, and is bordered by the towns of Granby, Simsbury, and East Granby. The town is approximately 10 miles from Hartford, and is accessible by Route 20 and Route 189.
The town is home to several small farms, as well as a few larger farms. The town is also home to the Salmon Brook Historical Society, which is dedicated to preserving the history of the town.
Economy
North Granby is a small town with a population of approximately 2,000 people. The town is primarily a rural community, and the economy is largely based on agriculture. The town is home to several small farms, as well as a few larger farms. The town is also home to the Salmon Brook Historical Society, which is dedicated to preserving the history of the town.
The town is also home to several small businesses, including a few restaurants, a grocery store, and a few other retail stores. The town is also home to a few small manufacturing companies, as well as a few small technology companies.
Demographics
As of the 2010 census, the population of North Granby was 2,062. The racial makeup of the town was 95.3% White, 0.9% African American, 0.3% Native American, 0.9% Asian, 0.1% Pacific Islander, 0.7% from other races, and 1.8% from two or more races. Hispanic or Latino of any race were 2.3% of the population.
The median household income in North Granby was $76,250, and the median family income was $87,500. The per capita income for the town was $35,945. About 4.2% of families and 5.3% of the population were below the poverty line, including 6.2% of those under age 18 and 4.2% of those age 65 or over.
Common Questions
What is Per Capita Income in North Granby?
Per Capita income in North Granby is $65,549.
What is the Median Family Income in North Granby?
Median Family Income in North Granby is $137,411.
What is the Median Household income in North Granby?
Median Household Income in North Granby is $114,519.
What is Income or Wage Gap in North Granby?
Income or Wage Gap in North Granby is 41.9%.
Women in North Granby earn 58.1 cents for every dollar earned by a man.
What is Inequality or Gini Index in North Granby?
Inequality or Gini Index in North Granby is 0.39.
What is the Total Population of North Granby?
Total Population of North Granby is 1,556.
What is the Total Male Population of North Granby?
Total Male Population of North Granby is 833.
What is the Total Female Population of North Granby?
Total Female Population of North Granby is 723.
What is the Ratio of Males per 100 Females in North Granby?
There are 115.21 Males per 100 Females in North Granby.
What is the Ratio of Females per 100 Males in North Granby?
There are 86.79 Females per 100 Males in North Granby.
What is the Median Population Age in North Granby?
Median Population Age in North Granby is 52.3 Years.
What is the Average Family Size in North Granby
Average Family Size in North Granby is 2.8 People.
What is the Average Household Size in North Granby
Average Household Size in North Granby is 2.6 People.
How Large is the Labor Force in North Granby?
There are 894 People in the Labor Forcein in North Granby.
What is the Percentage of People in the Labor Force in North Granby?
73.8% of People are in the Labor Force in North Granby.