Stamford, CT Map & Demographics
Stamford Map
Stamford Overview
$60,109
PER CAPITA INCOME
$115,324
AVG FAMILY INCOME
$100,718
AVG HOUSEHOLD INCOME
19.1%
WAGE / INCOME GAP [ % ]
80.9¢/ $1
WAGE / INCOME GAP [ $ ]
$9,076
FAMILY INCOME DEFICIT
0.51
INEQUALITY / GINI INDEX
135,413
TOTAL POPULATION
66,112
MALE POPULATION
69,301
FEMALE POPULATION
95.40
MALES / 100 FEMALES
104.82
FEMALES / 100 MALES
37.6
MEDIAN AGE
3.1
AVG FAMILY SIZE
2.5
AVG HOUSEHOLD SIZE
80,312
LABOR FORCE [ PEOPLE ]
71.9%
PERCENT IN LABOR FORCE
5.5%
UNEMPLOYMENT RATE
Income in Stamford
Income Overview in Stamford
Per Capita Income in Stamford is $60,109, while median incomes of families and households are $115,324 and $100,718 respectively.
| Characteristic | Number | Measure |
| Per Capita Income | 135,413 | $60,109 |
| Median Family Income | 33,003 | $115,324 |
| Mean Family Income | 33,003 | $170,179 |
| Median Household Income | 53,520 | $100,718 |
| Mean Household Income | 53,520 | $147,572 |
| Income Deficit | 33,003 | $9,076 |
| Wage / Income Gap (%) | 135,413 | 19.12% |
| Wage / Income Gap ($) | 135,413 | 80.88¢ per $1 |
| Gini / Inequality Index | 135,413 | 0.51 |
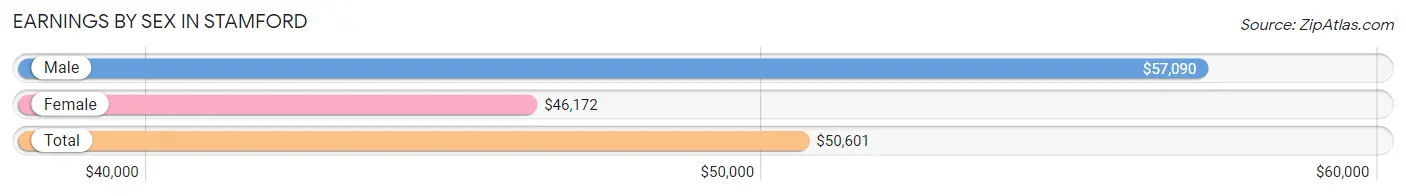
Earnings by Sex in Stamford
Average Earnings in Stamford are $50,601, $57,090 for men and $46,172 for women, a difference of 19.1%.
| Sex | Number | Average Earnings |
| Male | 43,872 (52.7%) | $57,090 |
| Female | 39,410 (47.3%) | $46,172 |
| Total | 83,282 (100.0%) | $50,601 |
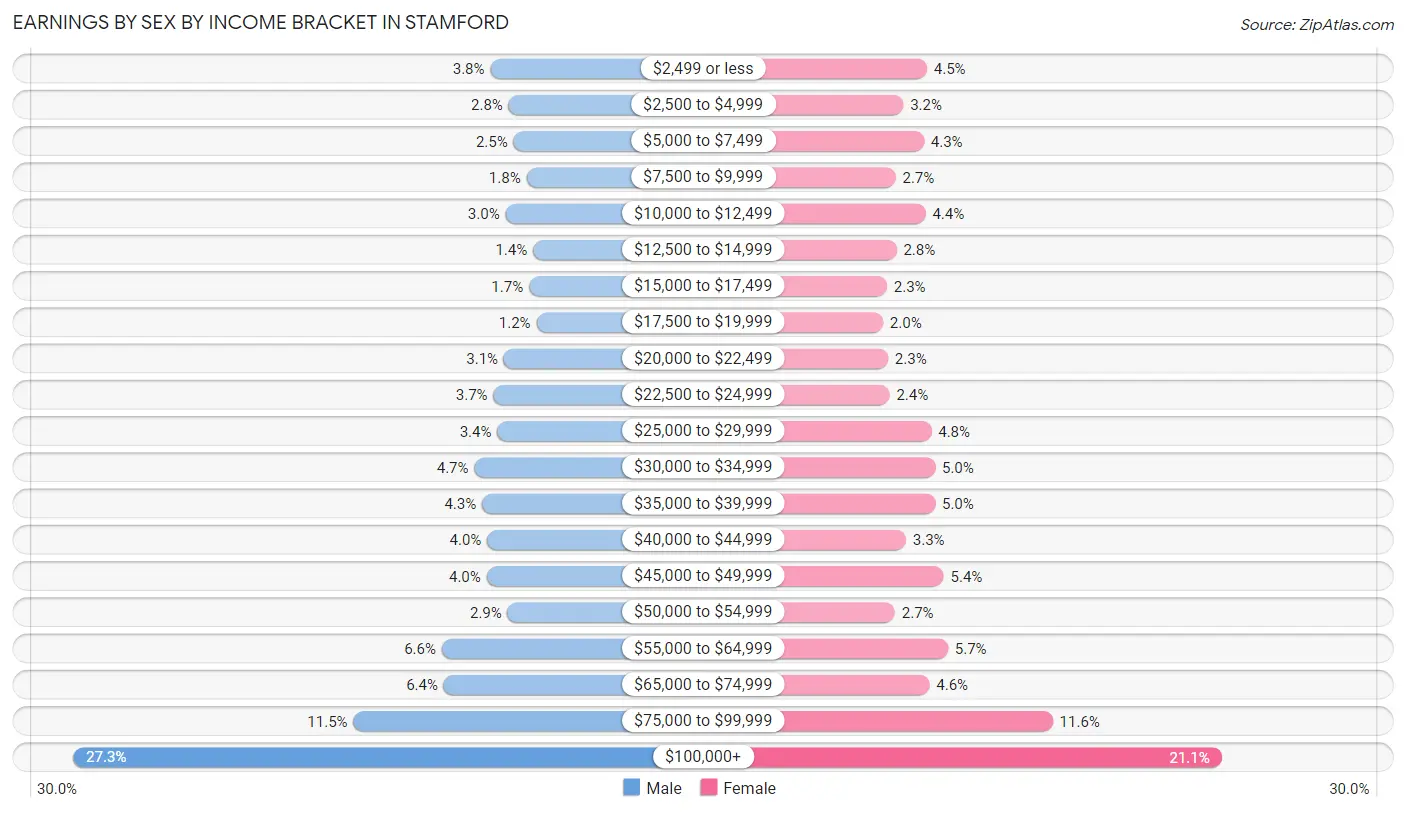
Earnings by Sex by Income Bracket in Stamford
The most common earnings brackets in Stamford are $100,000+ for men (11,963 | 27.3%) and $100,000+ for women (8,298 | 21.1%).
| Income | Male | Female |
| $2,499 or less | 1,675 (3.8%) | 1,773 (4.5%) |
| $2,500 to $4,999 | 1,222 (2.8%) | 1,250 (3.2%) |
| $5,000 to $7,499 | 1,105 (2.5%) | 1,707 (4.3%) |
| $7,500 to $9,999 | 785 (1.8%) | 1,080 (2.7%) |
| $10,000 to $12,499 | 1,303 (3.0%) | 1,740 (4.4%) |
| $12,500 to $14,999 | 624 (1.4%) | 1,098 (2.8%) |
| $15,000 to $17,499 | 726 (1.7%) | 885 (2.2%) |
| $17,500 to $19,999 | 539 (1.2%) | 799 (2.0%) |
| $20,000 to $22,499 | 1,344 (3.1%) | 910 (2.3%) |
| $22,500 to $24,999 | 1,602 (3.6%) | 947 (2.4%) |
| $25,000 to $29,999 | 1,504 (3.4%) | 1,871 (4.8%) |
| $30,000 to $34,999 | 2,069 (4.7%) | 1,953 (5.0%) |
| $35,000 to $39,999 | 1,882 (4.3%) | 1,956 (5.0%) |
| $40,000 to $44,999 | 1,753 (4.0%) | 1,309 (3.3%) |
| $45,000 to $49,999 | 1,769 (4.0%) | 2,145 (5.4%) |
| $50,000 to $54,999 | 1,249 (2.9%) | 1,063 (2.7%) |
| $55,000 to $64,999 | 2,875 (6.6%) | 2,238 (5.7%) |
| $65,000 to $74,999 | 2,827 (6.4%) | 1,830 (4.6%) |
| $75,000 to $99,999 | 5,056 (11.5%) | 4,558 (11.6%) |
| $100,000+ | 11,963 (27.3%) | 8,298 (21.1%) |
| Total | 43,872 (100.0%) | 39,410 (100.0%) |
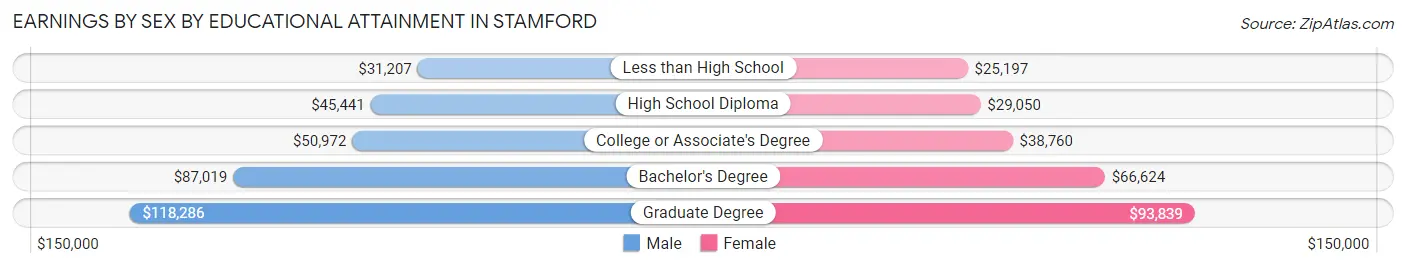
Earnings by Sex by Educational Attainment in Stamford
Average earnings in Stamford are $65,297 for men and $50,229 for women, a difference of 23.1%. Men with an educational attainment of graduate degree enjoy the highest average annual earnings of $118,286, while those with less than high school education earn the least with $31,207. Women with an educational attainment of graduate degree earn the most with the average annual earnings of $93,839, while those with less than high school education have the smallest earnings of $25,197.
| Educational Attainment | Male Income | Female Income |
| Less than High School | $31,207 | $25,197 |
| High School Diploma | $45,441 | $29,050 |
| College or Associate's Degree | $50,972 | $38,760 |
| Bachelor's Degree | $87,019 | $66,624 |
| Graduate Degree | $118,286 | $93,839 |
| Total | $65,297 | $50,229 |
Family Income in Stamford
Family Income Brackets in Stamford
According to the Stamford family income data, there are 9,076 families falling into the $200,000+ income range, which is the most common income bracket and makes up 27.5% of all families. Conversely, the $10,000 to $14,999 income bracket is the least frequent group with only 528 families (1.6%) belonging to this category.
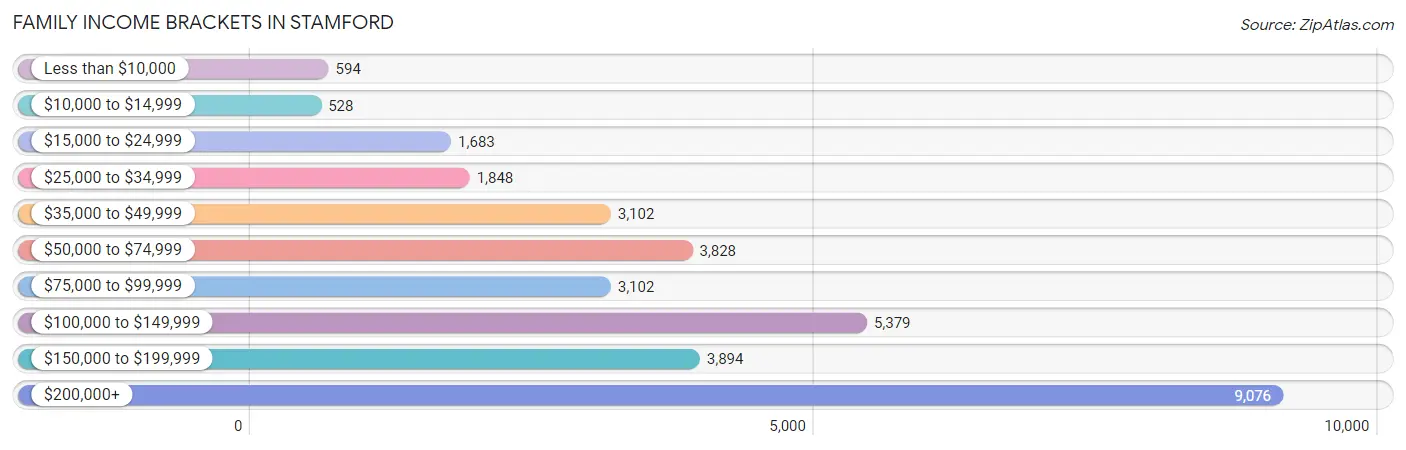
| Income Bracket | # Families | % Families |
| Less than $10,000 | 594 | 1.8% |
| $10,000 to $14,999 | 528 | 1.6% |
| $15,000 to $24,999 | 1,683 | 5.1% |
| $25,000 to $34,999 | 1,848 | 5.6% |
| $35,000 to $49,999 | 3,102 | 9.4% |
| $50,000 to $74,999 | 3,828 | 11.6% |
| $75,000 to $99,999 | 3,102 | 9.4% |
| $100,000 to $149,999 | 5,379 | 16.3% |
| $150,000 to $199,999 | 3,894 | 11.8% |
| $200,000+ | 9,076 | 27.5% |
Family Income by Famaliy Size in Stamford
7+ person families (478 | 1.5%) account for the highest median family income in Stamford with $160,417 per family, while 2-person families (14,497 | 43.9%) have the highest median income of $58,081 per family member.
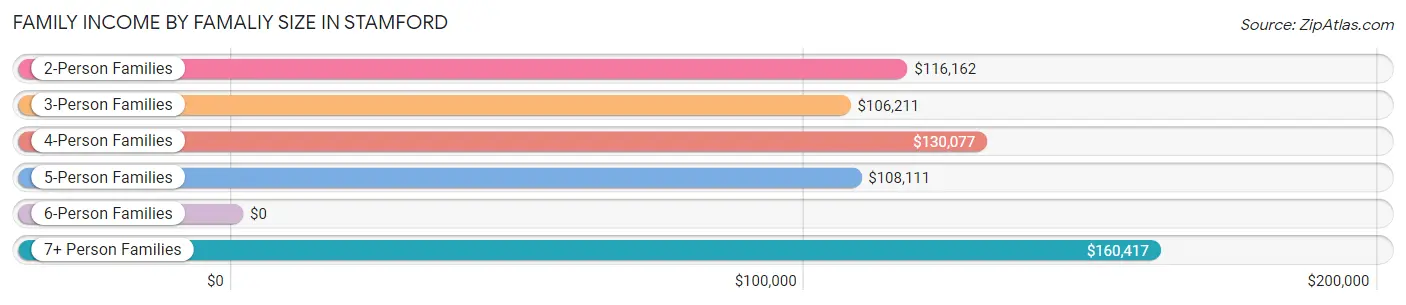
| Income Bracket | # Families | Median Income |
| 2-Person Families | 14,497 (43.9%) | $116,162 |
| 3-Person Families | 8,429 (25.5%) | $106,211 |
| 4-Person Families | 6,087 (18.4%) | $130,077 |
| 5-Person Families | 3,066 (9.3%) | $108,111 |
| 6-Person Families | 446 (1.3%) | $0 |
| 7+ Person Families | 478 (1.5%) | $160,417 |
| Total | 33,003 (100.0%) | $115,324 |
Family Income by Number of Earners in Stamford
The median family income in Stamford is $115,324, with families comprising 2 earners (14,635) having the highest median family income of $161,415, while families with 1 earner (10,123) have the lowest median family income of $64,028, accounting for 44.3% and 30.7% of families, respectively.
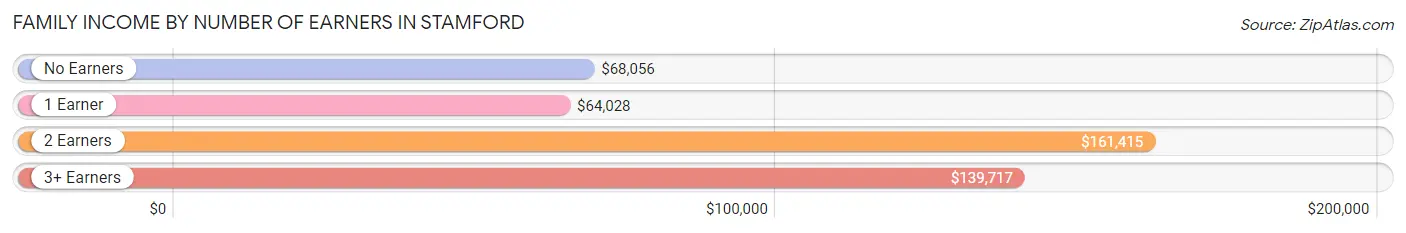
| Number of Earners | # Families | Median Income |
| No Earners | 2,810 (8.5%) | $68,056 |
| 1 Earner | 10,123 (30.7%) | $64,028 |
| 2 Earners | 14,635 (44.3%) | $161,415 |
| 3+ Earners | 5,435 (16.5%) | $139,717 |
| Total | 33,003 (100.0%) | $115,324 |
Household Income in Stamford
Household Income Brackets in Stamford
With 11,507 households falling in the category, the $200,000+ income range is the most frequent in Stamford, accounting for 21.5% of all households. In contrast, only 1,606 households (3.0%) fall into the $10,000 to $14,999 income bracket, making it the least populous group.
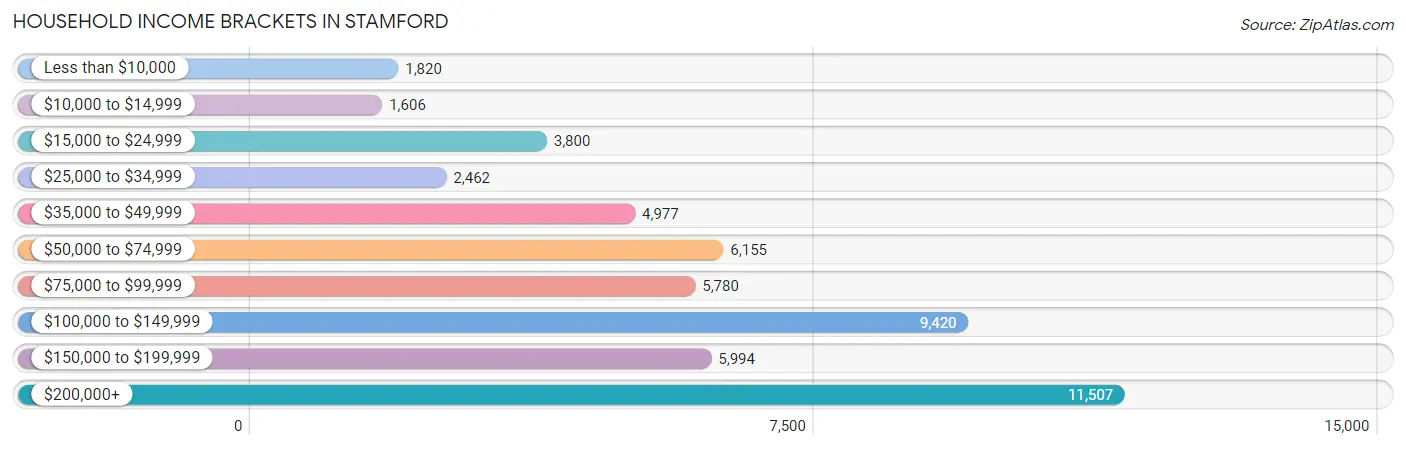
| Income Bracket | # Households | % Households |
| Less than $10,000 | 1,820 | 3.4% |
| $10,000 to $14,999 | 1,606 | 3.0% |
| $15,000 to $24,999 | 3,800 | 7.1% |
| $25,000 to $34,999 | 2,462 | 4.6% |
| $35,000 to $49,999 | 4,977 | 9.3% |
| $50,000 to $74,999 | 6,155 | 11.5% |
| $75,000 to $99,999 | 5,780 | 10.8% |
| $100,000 to $149,999 | 9,420 | 17.6% |
| $150,000 to $199,999 | 5,994 | 11.2% |
| $200,000+ | 11,507 | 21.5% |
Household Income by Householder Age in Stamford
The median household income in Stamford is $100,718, with the highest median household income of $114,503 found in the 45 to 64 years age bracket for the primary householder. A total of 18,351 households (34.3%) fall into this category. Meanwhile, the 65+ years age bracket for the primary householder has the lowest median household income of $69,187, with 12,828 households (24.0%) in this group.
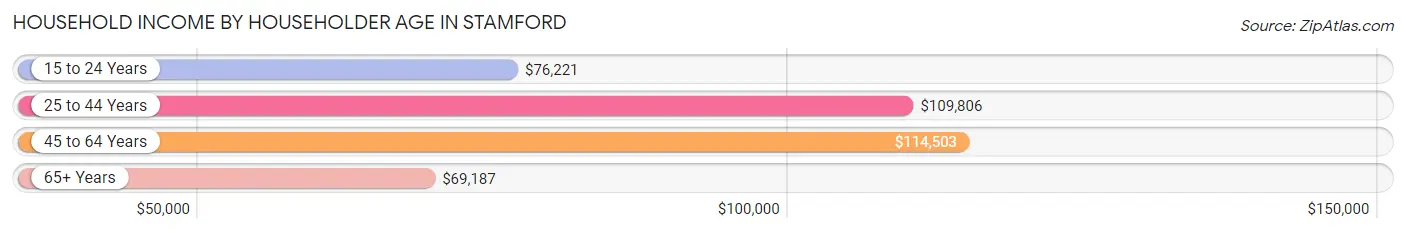
| Income Bracket | # Households | Median Income |
| 15 to 24 Years | 1,835 (3.4%) | $76,221 |
| 25 to 44 Years | 20,506 (38.3%) | $109,806 |
| 45 to 64 Years | 18,351 (34.3%) | $114,503 |
| 65+ Years | 12,828 (24.0%) | $69,187 |
| Total | 53,520 (100.0%) | $100,718 |
Poverty in Stamford
Income Below Poverty by Sex and Age in Stamford
With 9.6% poverty level for males and 10.6% for females among the residents of Stamford, 12 to 14 year old males and 15 year old females are the most vulnerable to poverty, with 559 males (24.6%) and 322 females (40.3%) in their respective age groups living below the poverty level.
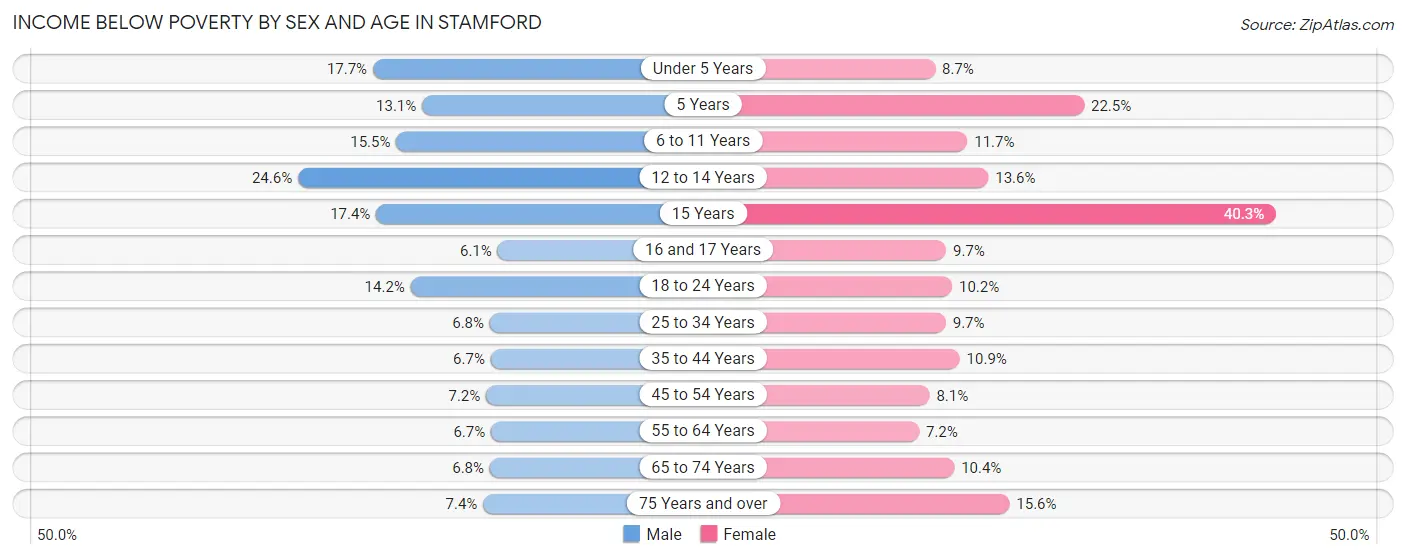
| Age Bracket | Male | Female |
| Under 5 Years | 719 (17.7%) | 281 (8.6%) |
| 5 Years | 113 (13.1%) | 236 (22.5%) |
| 6 to 11 Years | 564 (15.5%) | 457 (11.7%) |
| 12 to 14 Years | 559 (24.6%) | 313 (13.6%) |
| 15 Years | 168 (17.4%) | 322 (40.3%) |
| 16 and 17 Years | 70 (6.1%) | 106 (9.7%) |
| 18 to 24 Years | 898 (14.2%) | 652 (10.2%) |
| 25 to 34 Years | 809 (6.8%) | 1,134 (9.7%) |
| 35 to 44 Years | 611 (6.7%) | 1,060 (10.9%) |
| 45 to 54 Years | 610 (7.2%) | 666 (8.1%) |
| 55 to 64 Years | 526 (6.7%) | 636 (7.2%) |
| 65 to 74 Years | 390 (6.8%) | 651 (10.4%) |
| 75 Years and over | 239 (7.4%) | 771 (15.5%) |
| Total | 6,276 (9.6%) | 7,285 (10.6%) |
Income Above Poverty by Sex and Age in Stamford
According to the poverty statistics in Stamford, males aged 16 and 17 years and females aged 55 to 64 years are the age groups that are most secure financially, with 93.9% of males and 92.8% of females in these age groups living above the poverty line.
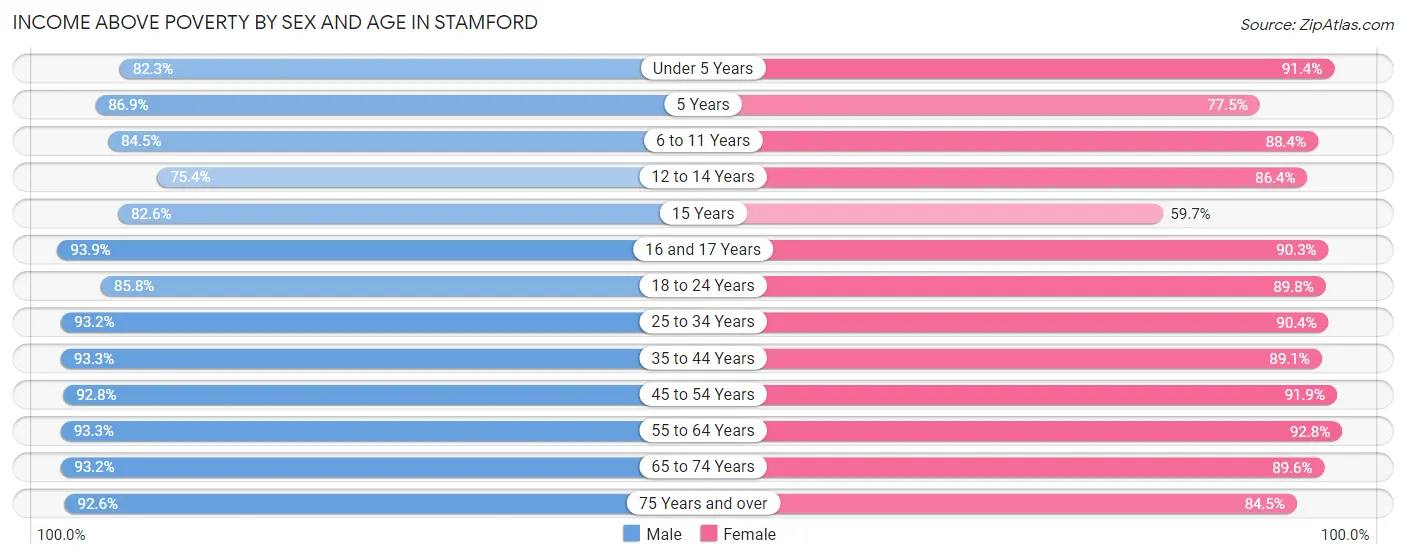
| Age Bracket | Male | Female |
| Under 5 Years | 3,351 (82.3%) | 2,969 (91.3%) |
| 5 Years | 749 (86.9%) | 814 (77.5%) |
| 6 to 11 Years | 3,074 (84.5%) | 3,467 (88.3%) |
| 12 to 14 Years | 1,711 (75.4%) | 1,989 (86.4%) |
| 15 Years | 799 (82.6%) | 477 (59.7%) |
| 16 and 17 Years | 1,078 (93.9%) | 989 (90.3%) |
| 18 to 24 Years | 5,439 (85.8%) | 5,719 (89.8%) |
| 25 to 34 Years | 11,057 (93.2%) | 10,623 (90.3%) |
| 35 to 44 Years | 8,450 (93.3%) | 8,628 (89.1%) |
| 45 to 54 Years | 7,892 (92.8%) | 7,513 (91.9%) |
| 55 to 64 Years | 7,318 (93.3%) | 8,241 (92.8%) |
| 65 to 74 Years | 5,330 (93.2%) | 5,590 (89.6%) |
| 75 Years and over | 2,974 (92.6%) | 4,187 (84.5%) |
| Total | 59,222 (90.4%) | 61,206 (89.4%) |
Income Below Poverty Among Married-Couple Families in Stamford
The poverty statistics for married-couple families in Stamford show that 3.3% or 767 of the total 23,580 families live below the poverty line. Families with 3 or 4 children have the highest poverty rate of 7.0%, comprising of 100 families. On the other hand, families with 5 or more children have the lowest poverty rate of 0.0%, which includes 0 families.
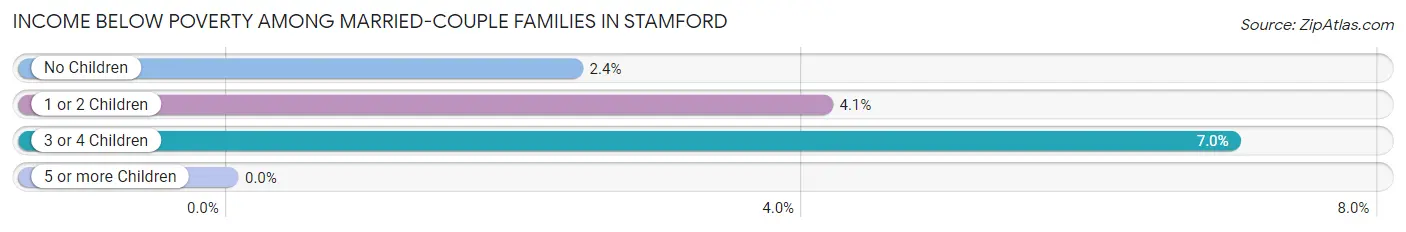
| Children | Above Poverty | Below Poverty |
| No Children | 13,854 (97.6%) | 340 (2.4%) |
| 1 or 2 Children | 7,577 (95.9%) | 327 (4.1%) |
| 3 or 4 Children | 1,332 (93.0%) | 100 (7.0%) |
| 5 or more Children | 50 (100.0%) | 0 (0.0%) |
| Total | 22,813 (96.8%) | 767 (3.3%) |
Income Below Poverty Among Single-Parent Households in Stamford
According to the poverty data in Stamford, 7.3% or 178 single-father households and 21.1% or 1,476 single-mother households are living below the poverty line. Among single-father households, those with 5 or more children have the highest poverty rate, with 22 households (100.0%) experiencing poverty. Likewise, among single-mother households, those with 3 or 4 children have the highest poverty rate, with 320 households (43.5%) falling below the poverty line.
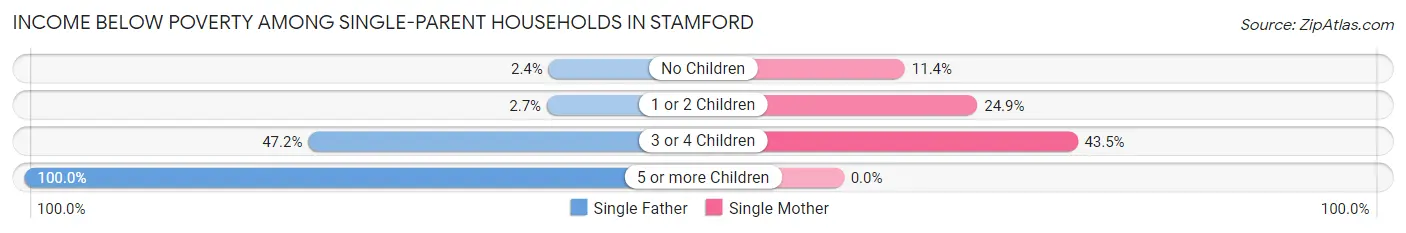
| Children | Single Father | Single Mother |
| No Children | 30 (2.4%) | 330 (11.4%) |
| 1 or 2 Children | 26 (2.7%) | 826 (24.9%) |
| 3 or 4 Children | 100 (47.2%) | 320 (43.5%) |
| 5 or more Children | 22 (100.0%) | 0 (0.0%) |
| Total | 178 (7.3%) | 1,476 (21.1%) |
Income Below Poverty Among Married-Couple vs Single-Parent Households in Stamford
The poverty data for Stamford shows that 767 of the married-couple family households (3.3%) and 1,654 of the single-parent households (17.5%) are living below the poverty level. Within the married-couple family households, those with 3 or 4 children have the highest poverty rate, with 100 households (7.0%) falling below the poverty line. Among the single-parent households, those with 3 or 4 children have the highest poverty rate, with 420 household (44.4%) living below poverty.
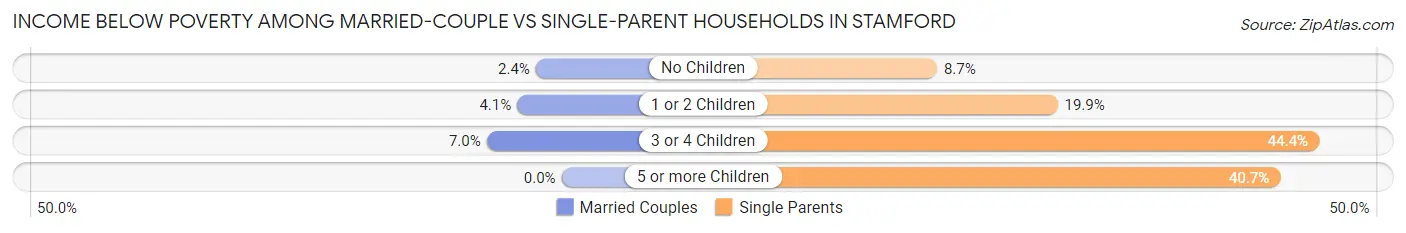
| Children | Married-Couple Families | Single-Parent Households |
| No Children | 340 (2.4%) | 360 (8.7%) |
| 1 or 2 Children | 327 (4.1%) | 852 (19.9%) |
| 3 or 4 Children | 100 (7.0%) | 420 (44.4%) |
| 5 or more Children | 0 (0.0%) | 22 (40.7%) |
| Total | 767 (3.3%) | 1,654 (17.5%) |
Race in Stamford
The most populous races in Stamford are White / Caucasian (70,482 | 52.0%), Hispanic or Latino (40,385 | 29.8%), and Black / African American (25,207 | 18.6%).
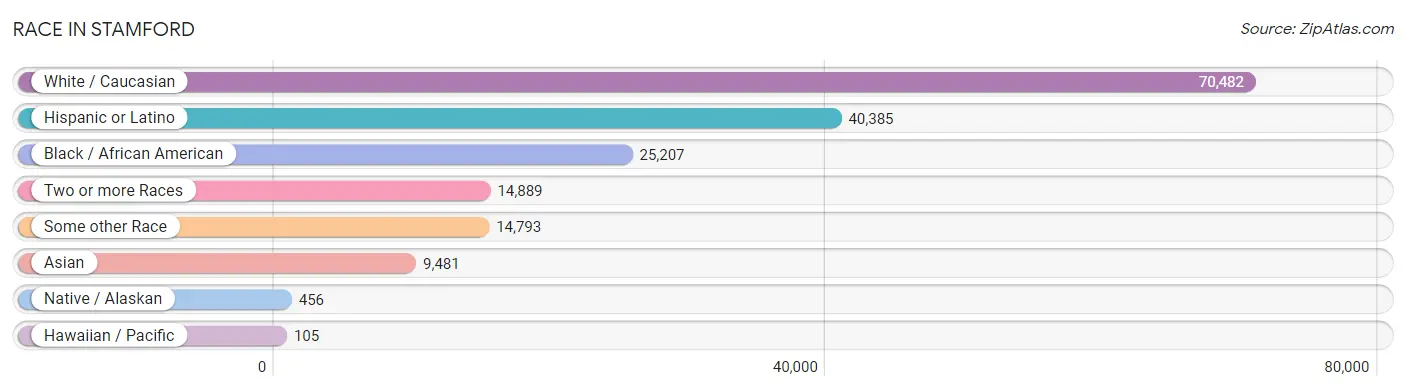
| Race | # Population | % Population |
| Asian | 9,481 | 7.0% |
| Black / African American | 25,207 | 18.6% |
| Hawaiian / Pacific | 105 | 0.1% |
| Hispanic or Latino | 40,385 | 29.8% |
| Native / Alaskan | 456 | 0.3% |
| White / Caucasian | 70,482 | 52.0% |
| Two or more Races | 14,889 | 11.0% |
| Some other Race | 14,793 | 10.9% |
| Total | 135,413 | 100.0% |
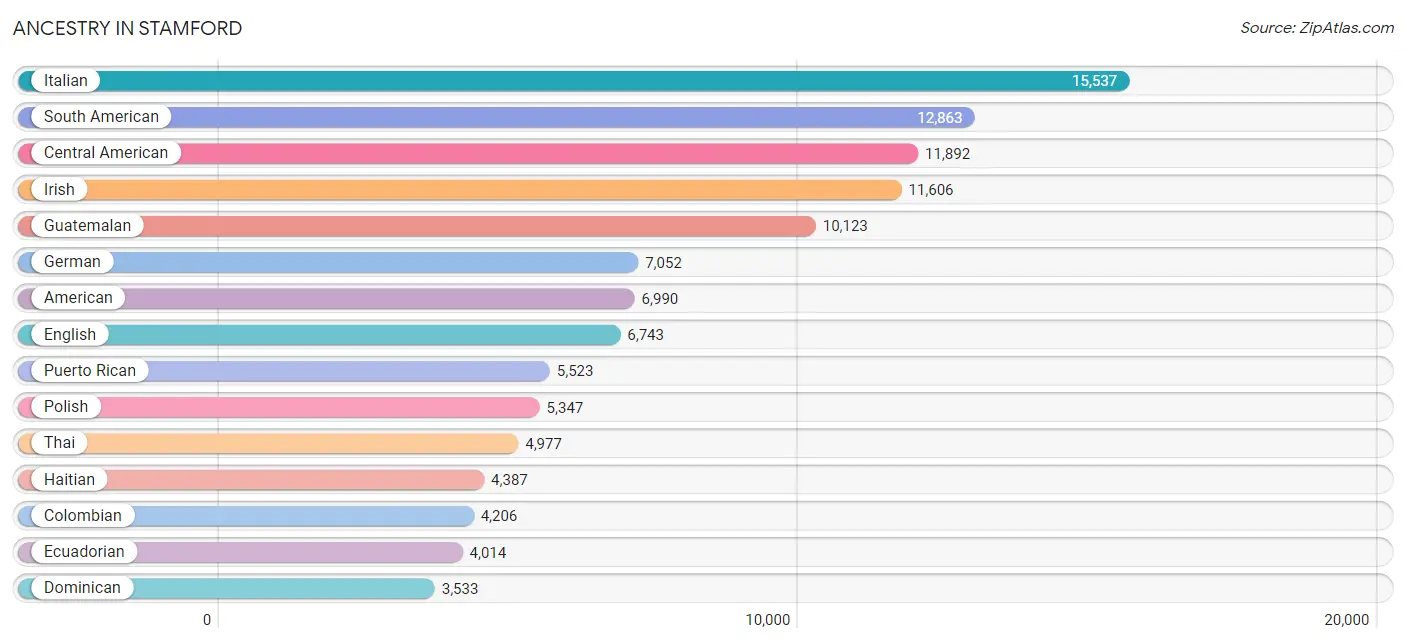
Ancestry in Stamford
The most populous ancestries reported in Stamford are Italian (15,537 | 11.5%), South American (12,863 | 9.5%), Central American (11,892 | 8.8%), Irish (11,606 | 8.6%), and Guatemalan (10,123 | 7.5%), together accounting for 45.8% of all Stamford residents.
| Ancestry | # Population | % Population |
| African | 664 | 0.5% |
| Albanian | 416 | 0.3% |
| Alsatian | 4 | 0.0% |
| American | 6,990 | 5.2% |
| Arab | 909 | 0.7% |
| Argentinean | 500 | 0.4% |
| Armenian | 116 | 0.1% |
| Australian | 44 | 0.0% |
| Austrian | 461 | 0.3% |
| Bahamian | 11 | 0.0% |
| Barbadian | 440 | 0.3% |
| Belgian | 42 | 0.0% |
| Belizean | 27 | 0.0% |
| Bhutanese | 226 | 0.2% |
| Blackfeet | 14 | 0.0% |
| Bolivian | 290 | 0.2% |
| Brazilian | 559 | 0.4% |
| British | 917 | 0.7% |
| British West Indian | 101 | 0.1% |
| Bulgarian | 288 | 0.2% |
| Burmese | 624 | 0.5% |
| Canadian | 192 | 0.1% |
| Cape Verdean | 111 | 0.1% |
| Central American | 11,892 | 8.8% |
| Central American Indian | 299 | 0.2% |
| Cherokee | 356 | 0.3% |
| Cheyenne | 15 | 0.0% |
| Chilean | 184 | 0.1% |
| Choctaw | 16 | 0.0% |
| Colombian | 4,206 | 3.1% |
| Costa Rican | 158 | 0.1% |
| Creek | 4 | 0.0% |
| Croatian | 128 | 0.1% |
| Cuban | 762 | 0.6% |
| Czech | 534 | 0.4% |
| Czechoslovakian | 25 | 0.0% |
| Danish | 312 | 0.2% |
| Dominican | 3,533 | 2.6% |
| Dutch | 659 | 0.5% |
| Eastern European | 1,322 | 1.0% |
| Ecuadorian | 4,014 | 3.0% |
| Egyptian | 167 | 0.1% |
| English | 6,743 | 5.0% |
| European | 1,140 | 0.8% |
| Fijian | 22 | 0.0% |
| Filipino | 92 | 0.1% |
| Finnish | 58 | 0.0% |
| French | 1,960 | 1.5% |
| French Canadian | 590 | 0.4% |
| German | 7,052 | 5.2% |
| Ghanaian | 913 | 0.7% |
| Greek | 1,644 | 1.2% |
| Guamanian / Chamorro | 21 | 0.0% |
| Guatemalan | 10,123 | 7.5% |
| Guyanese | 125 | 0.1% |
| Haitian | 4,387 | 3.2% |
| Honduran | 943 | 0.7% |
| Hungarian | 873 | 0.6% |
| Indian (Asian) | 3,033 | 2.2% |
| Iranian | 221 | 0.2% |
| Iraqi | 28 | 0.0% |
| Irish | 11,606 | 8.6% |
| Israeli | 125 | 0.1% |
| Italian | 15,537 | 11.5% |
| Jamaican | 2,701 | 2.0% |
| Japanese | 23 | 0.0% |
| Jordanian | 12 | 0.0% |
| Korean | 797 | 0.6% |
| Laotian | 50 | 0.0% |
| Latvian | 108 | 0.1% |
| Lebanese | 85 | 0.1% |
| Lithuanian | 478 | 0.4% |
| Maltese | 21 | 0.0% |
| Mexican | 2,959 | 2.2% |
| Mexican American Indian | 131 | 0.1% |
| Mongolian | 34 | 0.0% |
| Moroccan | 204 | 0.2% |
| Nicaraguan | 65 | 0.1% |
| Nigerian | 332 | 0.3% |
| Northern European | 43 | 0.0% |
| Norwegian | 496 | 0.4% |
| Okinawan | 7 | 0.0% |
| Pakistani | 54 | 0.0% |
| Palestinian | 102 | 0.1% |
| Paraguayan | 49 | 0.0% |
| Pennsylvania German | 7 | 0.0% |
| Peruvian | 2,682 | 2.0% |
| Polish | 5,347 | 4.0% |
| Portuguese | 590 | 0.4% |
| Puerto Rican | 5,523 | 4.1% |
| Romanian | 374 | 0.3% |
| Russian | 2,351 | 1.7% |
| Salvadoran | 401 | 0.3% |
| Samoan | 8 | 0.0% |
| Scandinavian | 146 | 0.1% |
| Scotch-Irish | 366 | 0.3% |
| Scottish | 1,071 | 0.8% |
| Serbian | 62 | 0.1% |
| Slavic | 24 | 0.0% |
| Slovak | 294 | 0.2% |
| Slovene | 31 | 0.0% |
| South African | 160 | 0.1% |
| South American | 12,863 | 9.5% |
| South American Indian | 73 | 0.1% |
| Spaniard | 369 | 0.3% |
| Spanish | 164 | 0.1% |
| Spanish American | 12 | 0.0% |
| Sri Lankan | 148 | 0.1% |
| Subsaharan African | 2,545 | 1.9% |
| Swedish | 628 | 0.5% |
| Swiss | 173 | 0.1% |
| Syrian | 55 | 0.0% |
| Thai | 4,977 | 3.7% |
| Trinidadian and Tobagonian | 257 | 0.2% |
| Turkish | 52 | 0.0% |
| Ugandan | 22 | 0.0% |
| Ukrainian | 1,329 | 1.0% |
| Uruguayan | 293 | 0.2% |
| Venezuelan | 544 | 0.4% |
| Vietnamese | 250 | 0.2% |
| Welsh | 459 | 0.3% |
| West Indian | 245 | 0.2% |
| Yugoslavian | 30 | 0.0% | View All 123 Rows |
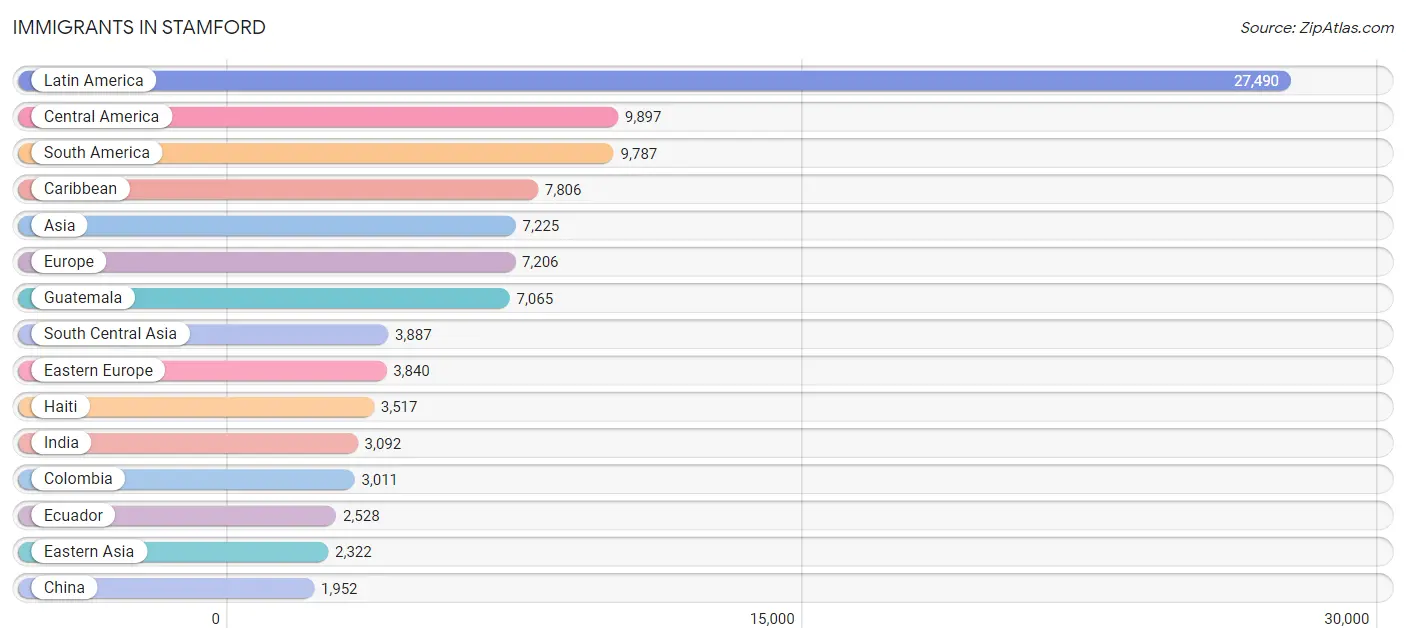
Immigrants in Stamford
The most numerous immigrant groups reported in Stamford came from Latin America (27,490 | 20.3%), Central America (9,897 | 7.3%), South America (9,787 | 7.2%), Caribbean (7,806 | 5.8%), and Asia (7,225 | 5.3%), together accounting for 45.9% of all Stamford residents.
| Immigration Origin | # Population | % Population |
| Afghanistan | 87 | 0.1% |
| Africa | 1,731 | 1.3% |
| Albania | 419 | 0.3% |
| Argentina | 626 | 0.5% |
| Armenia | 59 | 0.0% |
| Asia | 7,225 | 5.3% |
| Australia | 39 | 0.0% |
| Austria | 26 | 0.0% |
| Bangladesh | 424 | 0.3% |
| Barbados | 61 | 0.1% |
| Belarus | 156 | 0.1% |
| Belgium | 9 | 0.0% |
| Bolivia | 144 | 0.1% |
| Bosnia and Herzegovina | 13 | 0.0% |
| Brazil | 641 | 0.5% |
| Bulgaria | 235 | 0.2% |
| Cameroon | 31 | 0.0% |
| Canada | 367 | 0.3% |
| Caribbean | 7,806 | 5.8% |
| Central America | 9,897 | 7.3% |
| Chile | 163 | 0.1% |
| China | 1,952 | 1.4% |
| Colombia | 3,011 | 2.2% |
| Costa Rica | 66 | 0.1% |
| Cuba | 145 | 0.1% |
| Czechoslovakia | 77 | 0.1% |
| Denmark | 91 | 0.1% |
| Dominica | 33 | 0.0% |
| Dominican Republic | 1,861 | 1.4% |
| Eastern Africa | 221 | 0.2% |
| Eastern Asia | 2,322 | 1.7% |
| Eastern Europe | 3,840 | 2.8% |
| Ecuador | 2,528 | 1.9% |
| Egypt | 23 | 0.0% |
| El Salvador | 394 | 0.3% |
| England | 361 | 0.3% |
| Europe | 7,206 | 5.3% |
| France | 222 | 0.2% |
| Germany | 232 | 0.2% |
| Ghana | 641 | 0.5% |
| Greece | 405 | 0.3% |
| Grenada | 53 | 0.0% |
| Guatemala | 7,065 | 5.2% |
| Guyana | 159 | 0.1% |
| Haiti | 3,517 | 2.6% |
| Honduras | 1,007 | 0.7% |
| Hong Kong | 71 | 0.1% |
| Hungary | 9 | 0.0% |
| India | 3,092 | 2.3% |
| Indonesia | 37 | 0.0% |
| Iran | 97 | 0.1% |
| Iraq | 53 | 0.0% |
| Ireland | 76 | 0.1% |
| Israel | 70 | 0.1% |
| Italy | 999 | 0.7% |
| Jamaica | 1,624 | 1.2% |
| Japan | 71 | 0.1% |
| Kazakhstan | 5 | 0.0% |
| Kenya | 5 | 0.0% |
| Korea | 299 | 0.2% |
| Latin America | 27,490 | 20.3% |
| Latvia | 111 | 0.1% |
| Lebanon | 22 | 0.0% |
| Lithuania | 61 | 0.1% |
| Malaysia | 70 | 0.1% |
| Mexico | 1,282 | 0.9% |
| Middle Africa | 58 | 0.0% |
| Moldova | 23 | 0.0% |
| Morocco | 314 | 0.2% |
| Nepal | 53 | 0.0% |
| Netherlands | 35 | 0.0% |
| Nicaragua | 53 | 0.0% |
| Nigeria | 318 | 0.2% |
| Northern Africa | 391 | 0.3% |
| Northern Europe | 1,212 | 0.9% |
| Norway | 8 | 0.0% |
| Oceania | 43 | 0.0% |
| Pakistan | 101 | 0.1% |
| Panama | 30 | 0.0% |
| Peru | 1,827 | 1.3% |
| Philippines | 442 | 0.3% |
| Poland | 983 | 0.7% |
| Portugal | 19 | 0.0% |
| Romania | 127 | 0.1% |
| Russia | 524 | 0.4% |
| Saudi Arabia | 16 | 0.0% |
| Scotland | 99 | 0.1% |
| Serbia | 27 | 0.0% |
| Singapore | 30 | 0.0% |
| South Africa | 102 | 0.1% |
| South America | 9,787 | 7.2% |
| South Central Asia | 3,887 | 2.9% |
| South Eastern Asia | 685 | 0.5% |
| Southern Europe | 1,580 | 1.2% |
| Spain | 147 | 0.1% |
| Sri Lanka | 28 | 0.0% |
| St. Vincent and the Grenadines | 27 | 0.0% |
| Sweden | 21 | 0.0% |
| Switzerland | 38 | 0.0% |
| Syria | 7 | 0.0% |
| Taiwan | 80 | 0.1% |
| Thailand | 38 | 0.0% |
| Trinidad and Tobago | 169 | 0.1% |
| Turkey | 58 | 0.0% |
| Uganda | 22 | 0.0% |
| Ukraine | 900 | 0.7% |
| Uruguay | 213 | 0.2% |
| Venezuela | 403 | 0.3% |
| Vietnam | 68 | 0.1% |
| West Indies | 257 | 0.2% |
| Western Africa | 959 | 0.7% |
| Western Asia | 331 | 0.2% |
| Western Europe | 562 | 0.4% |
| Zaire | 27 | 0.0% | View All 114 Rows |
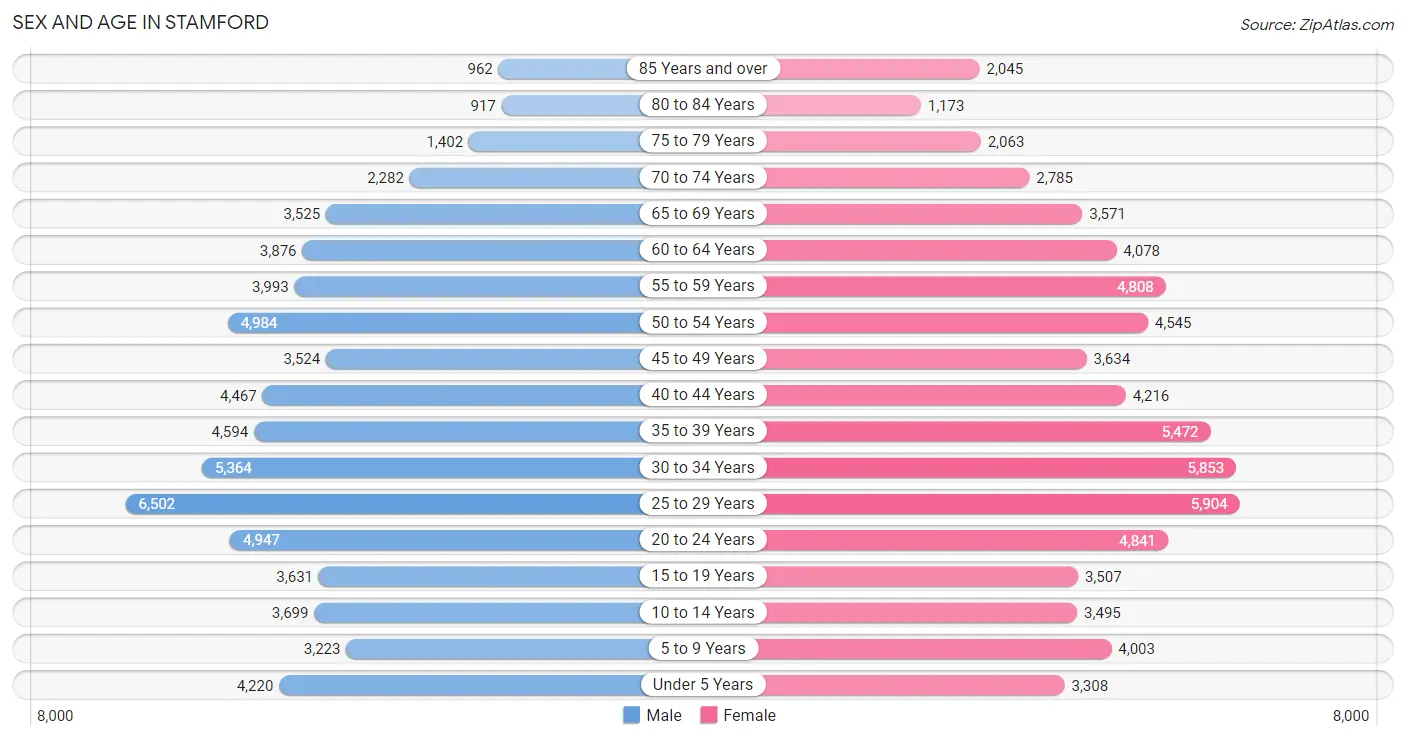
Sex and Age in Stamford
Sex and Age in Stamford
The most populous age groups in Stamford are 25 to 29 Years (6,502 | 9.8%) for men and 25 to 29 Years (5,904 | 8.5%) for women.
| Age Bracket | Male | Female |
| Under 5 Years | 4,220 (6.4%) | 3,308 (4.8%) |
| 5 to 9 Years | 3,223 (4.9%) | 4,003 (5.8%) |
| 10 to 14 Years | 3,699 (5.6%) | 3,495 (5.0%) |
| 15 to 19 Years | 3,631 (5.5%) | 3,507 (5.1%) |
| 20 to 24 Years | 4,947 (7.5%) | 4,841 (7.0%) |
| 25 to 29 Years | 6,502 (9.8%) | 5,904 (8.5%) |
| 30 to 34 Years | 5,364 (8.1%) | 5,853 (8.5%) |
| 35 to 39 Years | 4,594 (7.0%) | 5,472 (7.9%) |
| 40 to 44 Years | 4,467 (6.8%) | 4,216 (6.1%) |
| 45 to 49 Years | 3,524 (5.3%) | 3,634 (5.2%) |
| 50 to 54 Years | 4,984 (7.5%) | 4,545 (6.6%) |
| 55 to 59 Years | 3,993 (6.0%) | 4,808 (6.9%) |
| 60 to 64 Years | 3,876 (5.9%) | 4,078 (5.9%) |
| 65 to 69 Years | 3,525 (5.3%) | 3,571 (5.1%) |
| 70 to 74 Years | 2,282 (3.5%) | 2,785 (4.0%) |
| 75 to 79 Years | 1,402 (2.1%) | 2,063 (3.0%) |
| 80 to 84 Years | 917 (1.4%) | 1,173 (1.7%) |
| 85 Years and over | 962 (1.5%) | 2,045 (2.9%) |
| Total | 66,112 (100.0%) | 69,301 (100.0%) |
Families and Households in Stamford
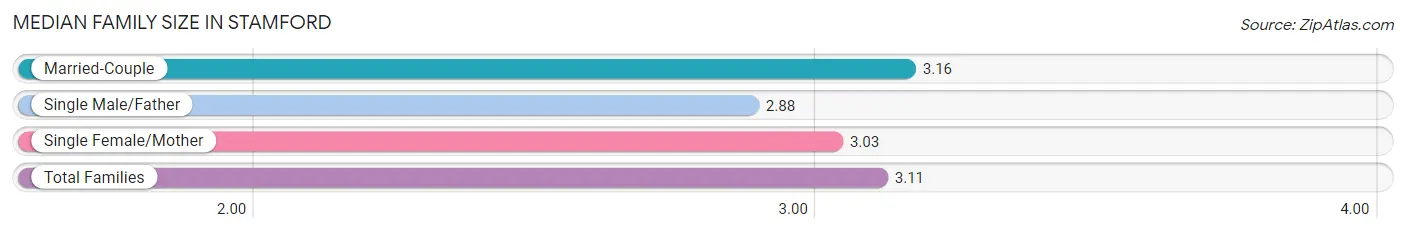
Median Family Size in Stamford
The median family size in Stamford is 3.11 persons per family, with married-couple families (23,580 | 71.5%) accounting for the largest median family size of 3.16 persons per family. On the other hand, single male/father families (2,442 | 7.4%) represent the smallest median family size with 2.88 persons per family.
| Family Type | # Families | Family Size |
| Married-Couple | 23,580 (71.5%) | 3.16 |
| Single Male/Father | 2,442 (7.4%) | 2.88 |
| Single Female/Mother | 6,981 (21.1%) | 3.03 |
| Total Families | 33,003 (100.0%) | 3.11 |
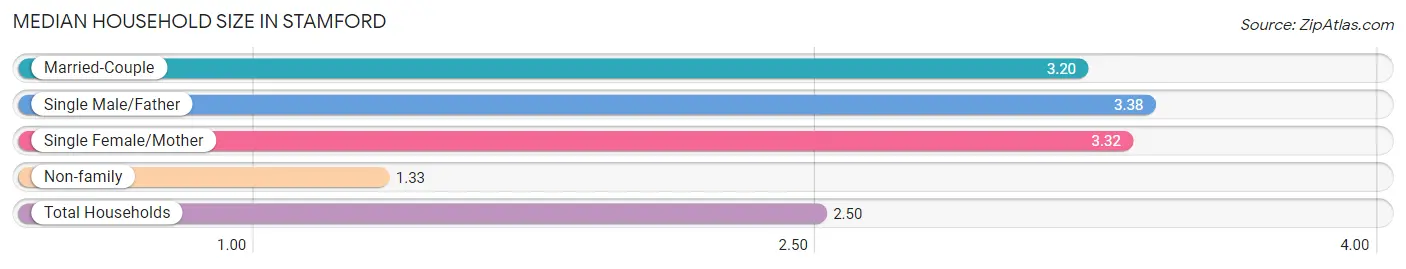
Median Household Size in Stamford
The median household size in Stamford is 2.50 persons per household, with single male/father households (2,442 | 4.6%) accounting for the largest median household size of 3.38 persons per household. non-family households (20,517 | 38.3%) represent the smallest median household size with 1.33 persons per household.
| Household Type | # Households | Household Size |
| Married-Couple | 23,580 (44.1%) | 3.20 |
| Single Male/Father | 2,442 (4.6%) | 3.38 |
| Single Female/Mother | 6,981 (13.0%) | 3.32 |
| Non-family | 20,517 (38.3%) | 1.33 |
| Total Households | 53,520 (100.0%) | 2.50 |
Household Size by Marriage Status in Stamford
Out of a total of 53,520 households in Stamford, 33,003 (61.7%) are family households, while 20,517 (38.3%) are nonfamily households. The most numerous type of family households are 2-person households, comprising 12,960, and the most common type of nonfamily households are 1-person households, comprising 15,958.
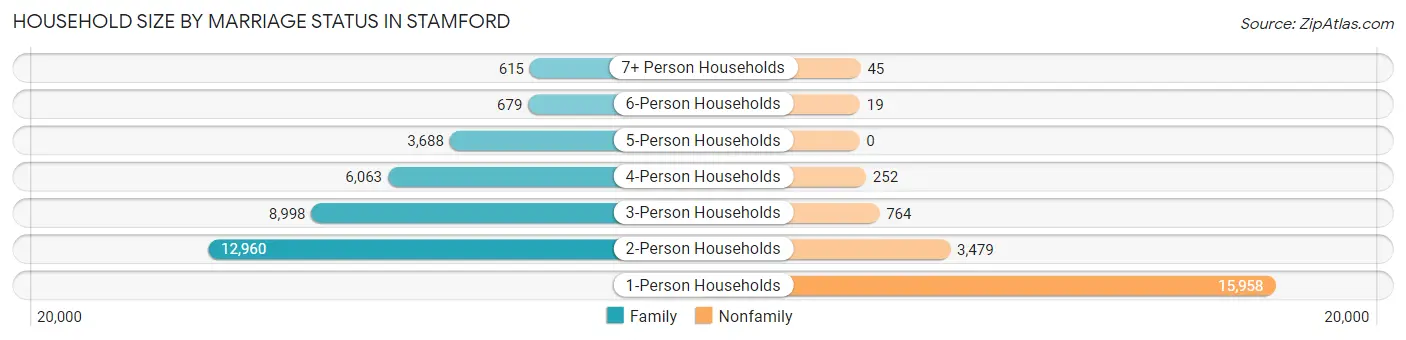
| Household Size | Family Households | Nonfamily Households |
| 1-Person Households | - | 15,958 (29.8%) |
| 2-Person Households | 12,960 (24.2%) | 3,479 (6.5%) |
| 3-Person Households | 8,998 (16.8%) | 764 (1.4%) |
| 4-Person Households | 6,063 (11.3%) | 252 (0.5%) |
| 5-Person Households | 3,688 (6.9%) | 0 (0.0%) |
| 6-Person Households | 679 (1.3%) | 19 (0.0%) |
| 7+ Person Households | 615 (1.1%) | 45 (0.1%) |
| Total | 33,003 (61.7%) | 20,517 (38.3%) |
Female Fertility in Stamford
Fertility by Age in Stamford
Average fertility rate in Stamford is 50.0 births per 1,000 women. Women in the age bracket of 15 to 19 years have the highest fertility rate with 54.0 births per 1,000 women. Women in the age bracket of 20 to 34 years acount for 49.8% of all women with births.
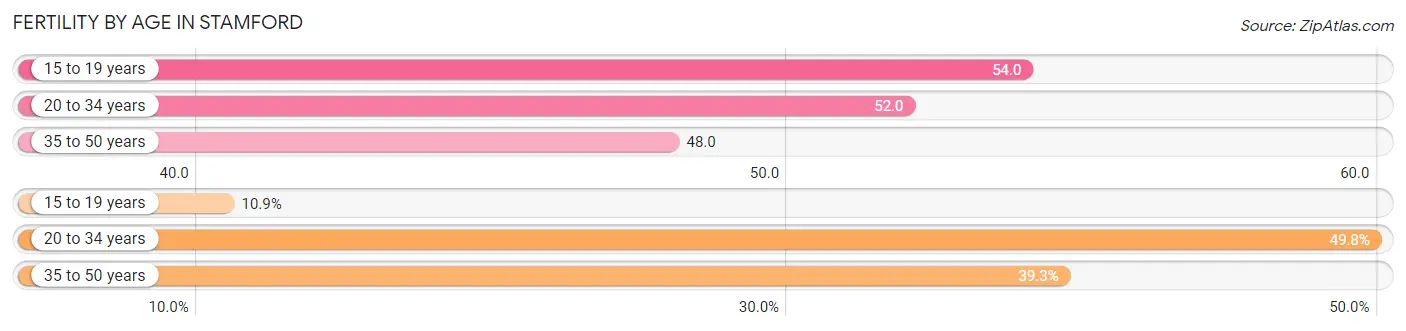
| Age Bracket | Women with Births | Births / 1,000 Women |
| 15 to 19 years | 188 (10.9%) | 54.0 |
| 20 to 34 years | 859 (49.8%) | 52.0 |
| 35 to 50 years | 677 (39.3%) | 48.0 |
| Total | 1,724 (100.0%) | 50.0 |
Fertility by Age by Marriage Status in Stamford
66.7% of women with births (1,724) in Stamford are married. The highest percentage of unmarried women with births falls into 15 to 19 years age bracket with 100.0% of them unmarried at the time of birth, while the lowest percentage of unmarried women with births belong to 35 to 50 years age bracket with 14.6% of them unmarried.
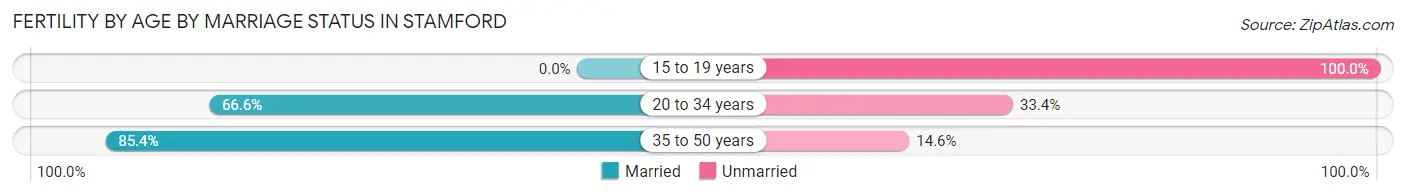
| Age Bracket | Married | Unmarried |
| 15 to 19 years | 0 (0.0%) | 188 (100.0%) |
| 20 to 34 years | 572 (66.6%) | 287 (33.4%) |
| 35 to 50 years | 578 (85.4%) | 99 (14.6%) |
| Total | 1,150 (66.7%) | 574 (33.3%) |
Fertility by Education in Stamford
Average fertility rate in Stamford is 50.0 births per 1,000 women. Women with the education attainment of high school diploma have the highest fertility rate of 63.0 births per 1,000 women, while women with the education attainment of bachelor's degree have the lowest fertility at 41.0 births per 1,000 women. Women with the education attainment of bachelor's degree represent 26.5% of all women with births.
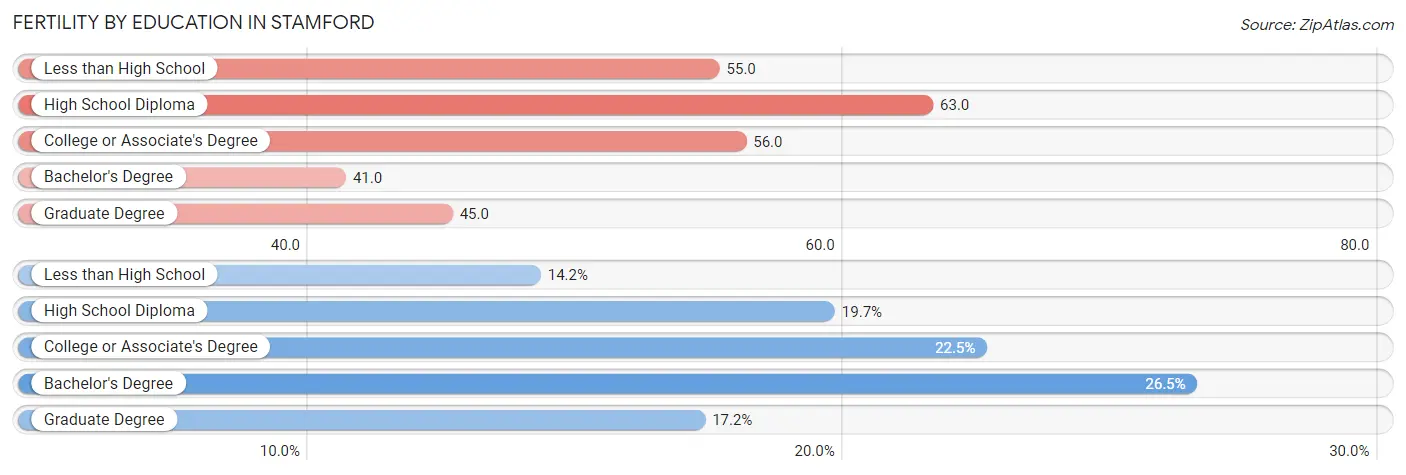
| Educational Attainment | Women with Births | Births / 1,000 Women |
| Less than High School | 244 (14.1%) | 55.0 |
| High School Diploma | 339 (19.7%) | 63.0 |
| College or Associate's Degree | 388 (22.5%) | 56.0 |
| Bachelor's Degree | 456 (26.5%) | 41.0 |
| Graduate Degree | 297 (17.2%) | 45.0 |
| Total | 1,724 (100.0%) | 50.0 |
Fertility by Education by Marriage Status in Stamford
33.3% of women with births in Stamford are unmarried. Women with the educational attainment of graduate degree are most likely to be married with 94.3% of them married at childbirth, while women with the educational attainment of high school diploma are least likely to be married with 70.8% of them unmarried at childbirth.
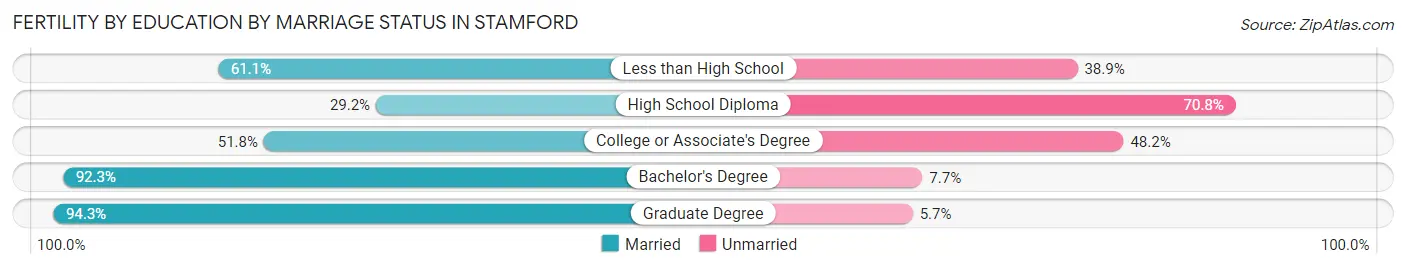
| Educational Attainment | Married | Unmarried |
| Less than High School | 149 (61.1%) | 95 (38.9%) |
| High School Diploma | 99 (29.2%) | 240 (70.8%) |
| College or Associate's Degree | 201 (51.8%) | 187 (48.2%) |
| Bachelor's Degree | 421 (92.3%) | 35 (7.7%) |
| Graduate Degree | 280 (94.3%) | 17 (5.7%) |
| Total | 1,150 (66.7%) | 574 (33.3%) |
Employment Characteristics in Stamford
Employment by Class of Employer in Stamford
Among the 74,194 employed individuals in Stamford, private company employees (52,976 | 71.4%), not-for-profit organizations (7,146 | 9.6%), and self-employed (not incorporated) (4,562 | 6.1%) make up the most common classes of employment.
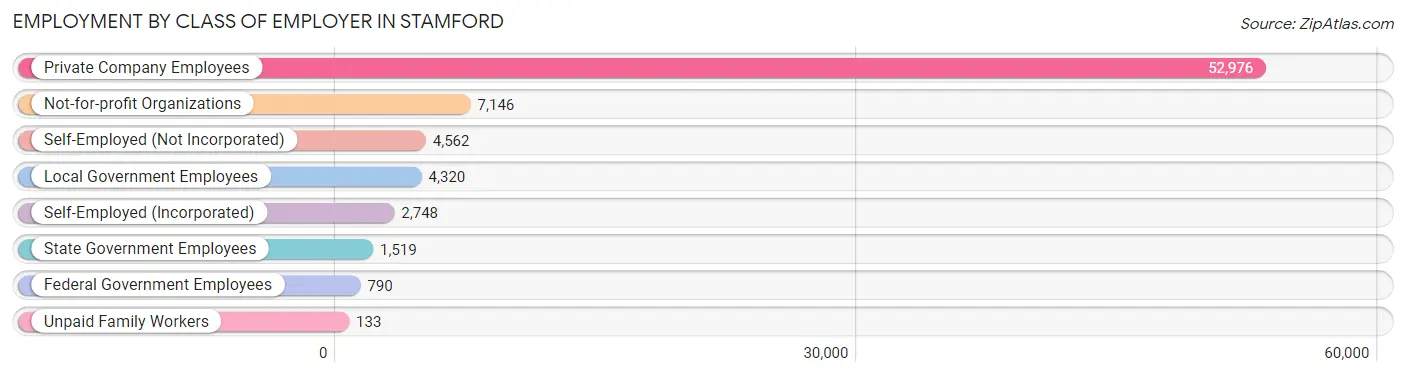
| Employer Class | # Employees | % Employees |
| Private Company Employees | 52,976 | 71.4% |
| Self-Employed (Incorporated) | 2,748 | 3.7% |
| Self-Employed (Not Incorporated) | 4,562 | 6.1% |
| Not-for-profit Organizations | 7,146 | 9.6% |
| Local Government Employees | 4,320 | 5.8% |
| State Government Employees | 1,519 | 2.1% |
| Federal Government Employees | 790 | 1.1% |
| Unpaid Family Workers | 133 | 0.2% |
| Total | 74,194 | 100.0% |
Employment Status by Age in Stamford
According to the labor force statistics for Stamford, out of the total population over 16 years of age (111,699), 71.9% or 80,312 individuals are in the labor force, with 5.5% or 4,417 of them unemployed. The age group with the highest labor force participation rate is 25 to 29 years, with 91.0% or 11,289 individuals in the labor force. Within the labor force, the 16 to 19 years age range has the highest percentage of unemployed individuals, with 19.6% or 393 of them being unemployed.
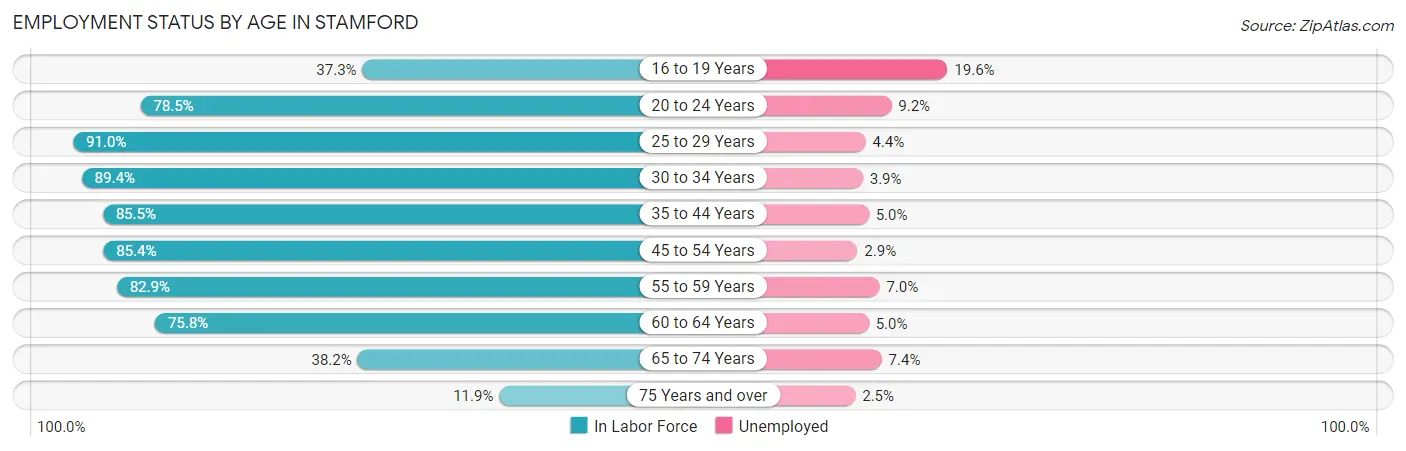
| Age Bracket | In Labor Force | Unemployed |
| 16 to 19 Years | 2,004 (37.3%) | 393 (19.6%) |
| 20 to 24 Years | 7,684 (78.5%) | 707 (9.2%) |
| 25 to 29 Years | 11,289 (91.0%) | 497 (4.4%) |
| 30 to 34 Years | 10,028 (89.4%) | 391 (3.9%) |
| 35 to 44 Years | 16,030 (85.5%) | 802 (5.0%) |
| 45 to 54 Years | 14,251 (85.4%) | 413 (2.9%) |
| 55 to 59 Years | 7,296 (82.9%) | 511 (7.0%) |
| 60 to 64 Years | 6,029 (75.8%) | 301 (5.0%) |
| 65 to 74 Years | 4,646 (38.2%) | 344 (7.4%) |
| 75 Years and over | 1,019 (11.9%) | 25 (2.5%) |
| Total | 80,312 (71.9%) | 4,417 (5.5%) |
Employment Status by Educational Attainment in Stamford
According to labor force statistics for Stamford, 85.6% of individuals (64,897) out of the total population between 25 and 64 years of age (75,814) are in the labor force, with 4.5% or 2,920 of them being unemployed. The group with the highest labor force participation rate are those with the educational attainment of bachelor's degree or higher, with 89.8% or 36,007 individuals in the labor force. Within the labor force, individuals with less than high school education have the highest percentage of unemployment, with 6.4% or 374 of them being unemployed.
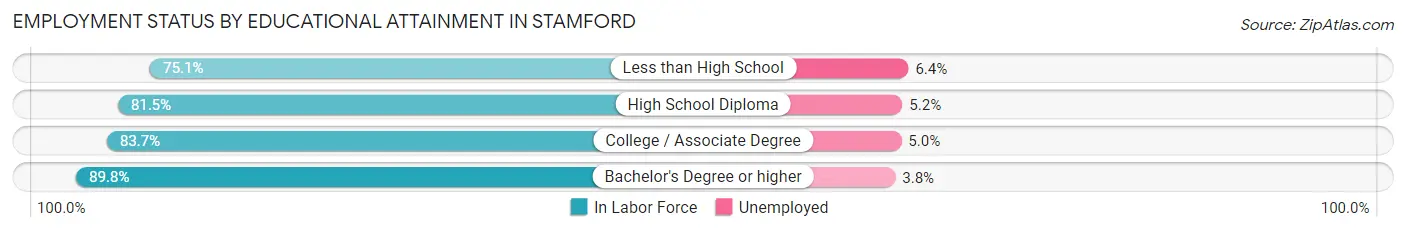
| Educational Attainment | In Labor Force | Unemployed |
| Less than High School | 5,841 (75.1%) | 498 (6.4%) |
| High School Diploma | 10,875 (81.5%) | 694 (5.2%) |
| College / Associate Degree | 12,218 (83.7%) | 730 (5.0%) |
| Bachelor's Degree or higher | 36,007 (89.8%) | 1,524 (3.8%) |
| Total | 64,897 (85.6%) | 3,412 (4.5%) |
Employment Occupations by Sex in Stamford
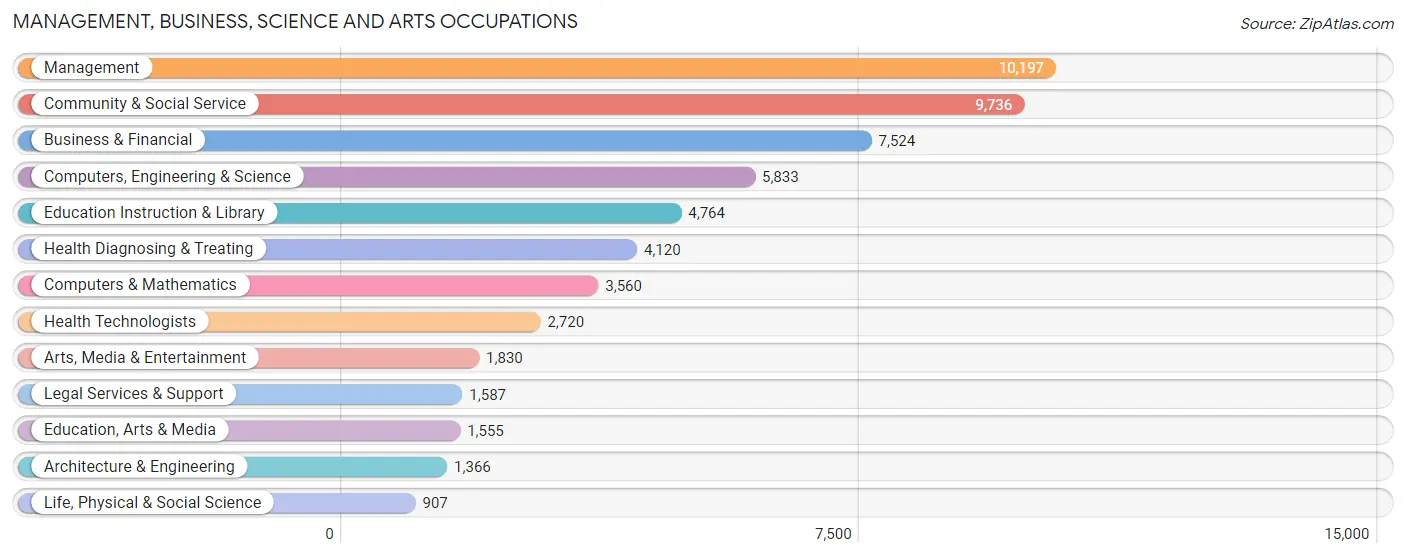
Management, Business, Science and Arts Occupations
The most common Management, Business, Science and Arts occupations in Stamford are Management (10,197 | 13.4%), Community & Social Service (9,736 | 12.8%), Business & Financial (7,524 | 9.9%), Computers, Engineering & Science (5,833 | 7.7%), and Education Instruction & Library (4,764 | 6.3%).
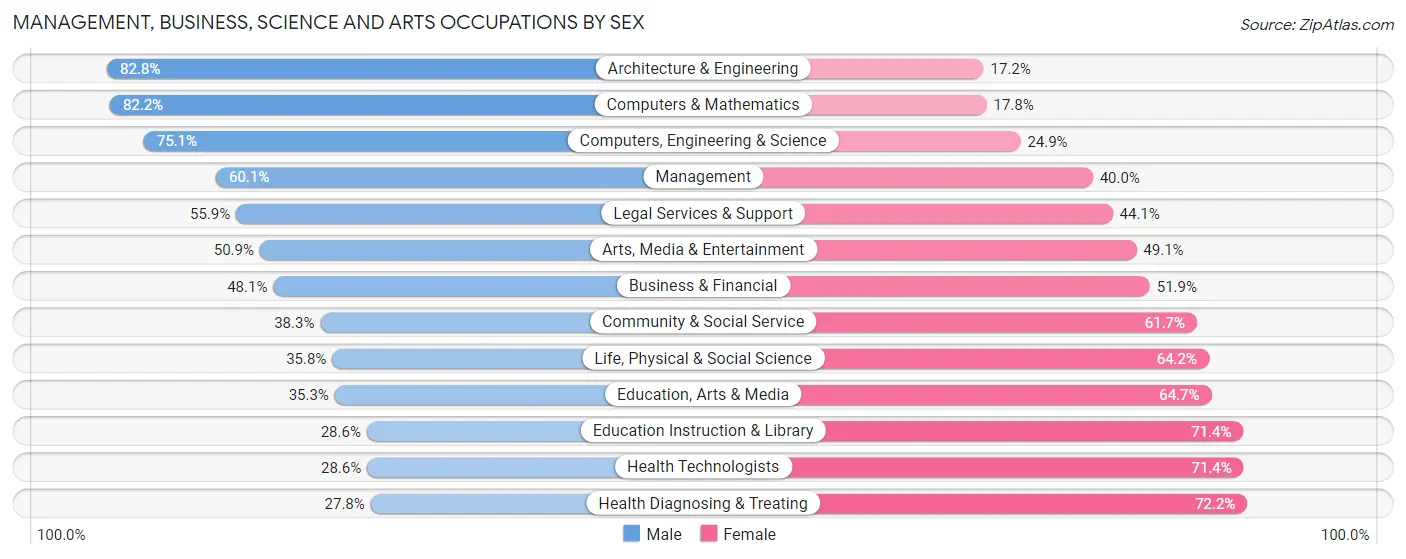
Management, Business, Science and Arts Occupations by Sex
Within the Management, Business, Science and Arts occupations in Stamford, the most male-oriented occupations are Architecture & Engineering (82.8%), Computers & Mathematics (82.2%), and Computers, Engineering & Science (75.1%), while the most female-oriented occupations are Health Diagnosing & Treating (72.2%), Health Technologists (71.4%), and Education Instruction & Library (71.4%).
| Occupation | Male | Female |
| Management | 6,123 (60.1%) | 4,074 (40.0%) |
| Business & Financial | 3,621 (48.1%) | 3,903 (51.9%) |
| Computers, Engineering & Science | 4,382 (75.1%) | 1,451 (24.9%) |
| Computers & Mathematics | 2,926 (82.2%) | 634 (17.8%) |
| Architecture & Engineering | 1,131 (82.8%) | 235 (17.2%) |
| Life, Physical & Social Science | 325 (35.8%) | 582 (64.2%) |
| Community & Social Service | 3,732 (38.3%) | 6,004 (61.7%) |
| Education, Arts & Media | 549 (35.3%) | 1,006 (64.7%) |
| Legal Services & Support | 887 (55.9%) | 700 (44.1%) |
| Education Instruction & Library | 1,364 (28.6%) | 3,400 (71.4%) |
| Arts, Media & Entertainment | 932 (50.9%) | 898 (49.1%) |
| Health Diagnosing & Treating | 1,146 (27.8%) | 2,974 (72.2%) |
| Health Technologists | 777 (28.6%) | 1,943 (71.4%) |
| Total (Category) | 19,004 (50.8%) | 18,406 (49.2%) |
| Total (Overall) | 40,152 (52.9%) | 35,708 (47.1%) |
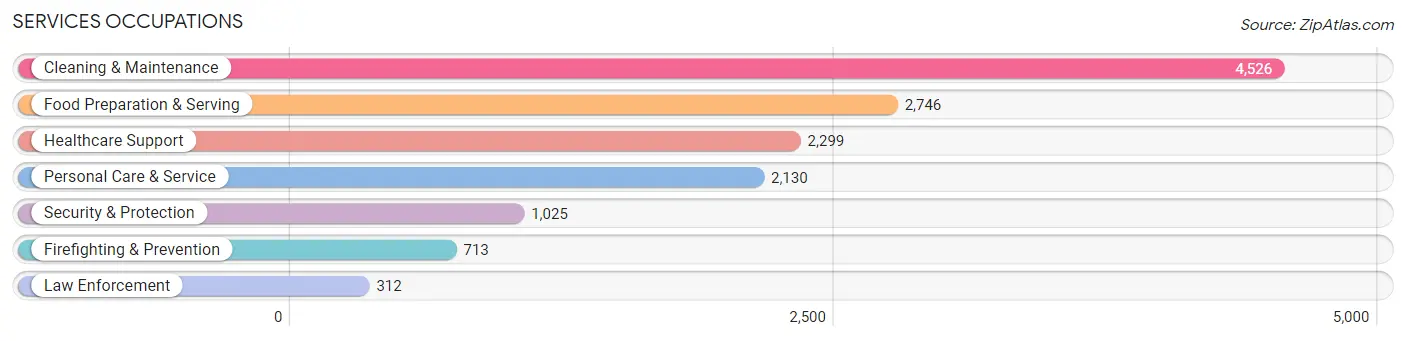
Services Occupations
The most common Services occupations in Stamford are Cleaning & Maintenance (4,526 | 6.0%), Food Preparation & Serving (2,746 | 3.6%), Healthcare Support (2,299 | 3.0%), Personal Care & Service (2,130 | 2.8%), and Security & Protection (1,025 | 1.3%).
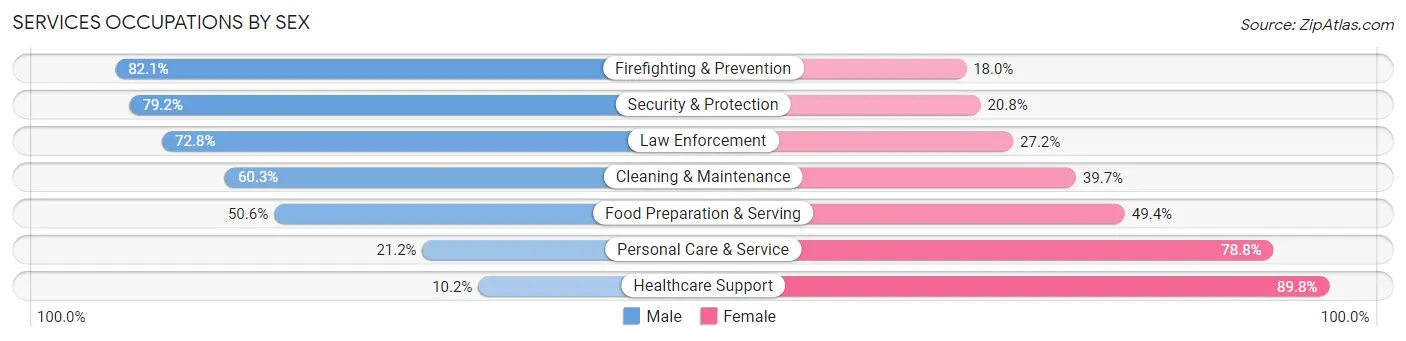
Services Occupations by Sex
Within the Services occupations in Stamford, the most male-oriented occupations are Firefighting & Prevention (82.1%), Security & Protection (79.2%), and Law Enforcement (72.8%), while the most female-oriented occupations are Healthcare Support (89.8%), Personal Care & Service (78.8%), and Food Preparation & Serving (49.4%).
| Occupation | Male | Female |
| Healthcare Support | 234 (10.2%) | 2,065 (89.8%) |
| Security & Protection | 812 (79.2%) | 213 (20.8%) |
| Firefighting & Prevention | 585 (82.1%) | 128 (17.9%) |
| Law Enforcement | 227 (72.8%) | 85 (27.2%) |
| Food Preparation & Serving | 1,390 (50.6%) | 1,356 (49.4%) |
| Cleaning & Maintenance | 2,730 (60.3%) | 1,796 (39.7%) |
| Personal Care & Service | 452 (21.2%) | 1,678 (78.8%) |
| Total (Category) | 5,618 (44.2%) | 7,108 (55.8%) |
| Total (Overall) | 40,152 (52.9%) | 35,708 (47.1%) |
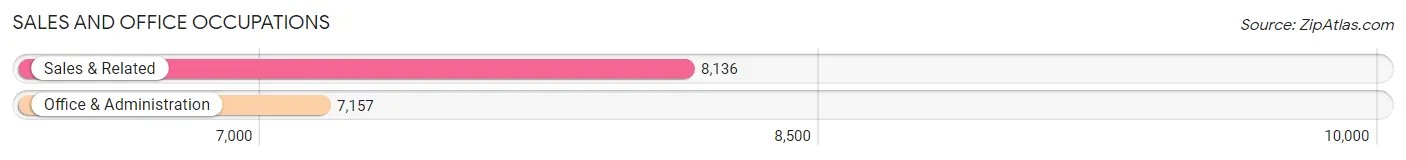
Sales and Office Occupations
The most common Sales and Office occupations in Stamford are Sales & Related (8,136 | 10.7%), and Office & Administration (7,157 | 9.4%).
Sales and Office Occupations by Sex
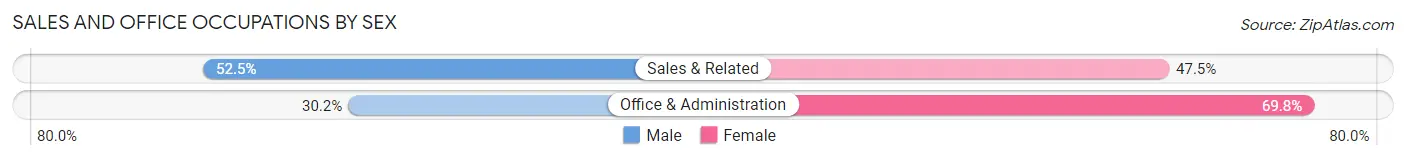
| Occupation | Male | Female |
| Sales & Related | 4,274 (52.5%) | 3,862 (47.5%) |
| Office & Administration | 2,164 (30.2%) | 4,993 (69.8%) |
| Total (Category) | 6,438 (42.1%) | 8,855 (57.9%) |
| Total (Overall) | 40,152 (52.9%) | 35,708 (47.1%) |
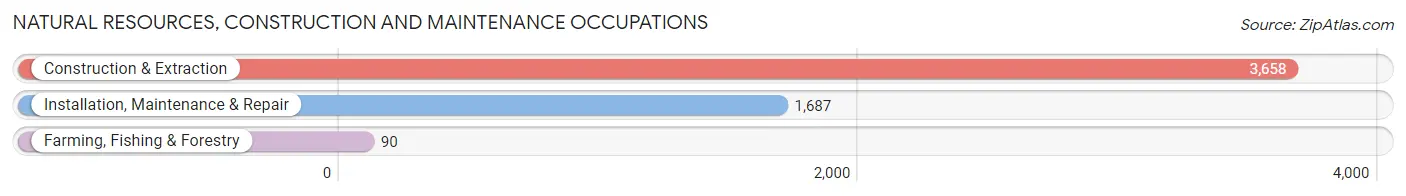
Natural Resources, Construction and Maintenance Occupations
The most common Natural Resources, Construction and Maintenance occupations in Stamford are Construction & Extraction (3,658 | 4.8%), Installation, Maintenance & Repair (1,687 | 2.2%), and Farming, Fishing & Forestry (90 | 0.1%).
Natural Resources, Construction and Maintenance Occupations by Sex
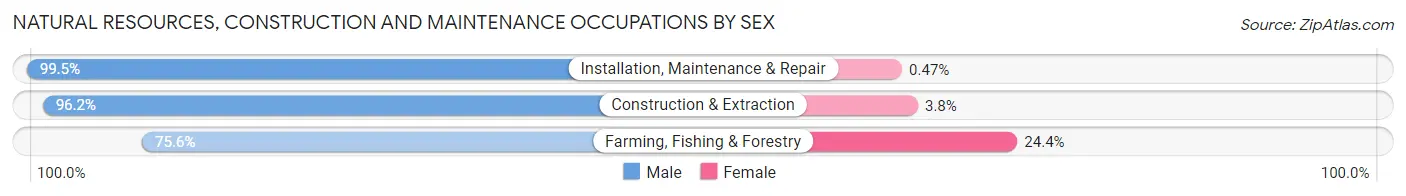
| Occupation | Male | Female |
| Farming, Fishing & Forestry | 68 (75.6%) | 22 (24.4%) |
| Construction & Extraction | 3,520 (96.2%) | 138 (3.8%) |
| Installation, Maintenance & Repair | 1,679 (99.5%) | 8 (0.5%) |
| Total (Category) | 5,267 (96.9%) | 168 (3.1%) |
| Total (Overall) | 40,152 (52.9%) | 35,708 (47.1%) |
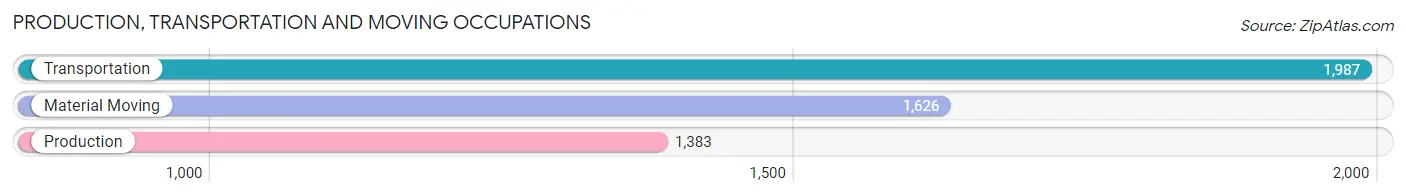
Production, Transportation and Moving Occupations
The most common Production, Transportation and Moving occupations in Stamford are Transportation (1,987 | 2.6%), Material Moving (1,626 | 2.1%), and Production (1,383 | 1.8%).
Production, Transportation and Moving Occupations by Sex
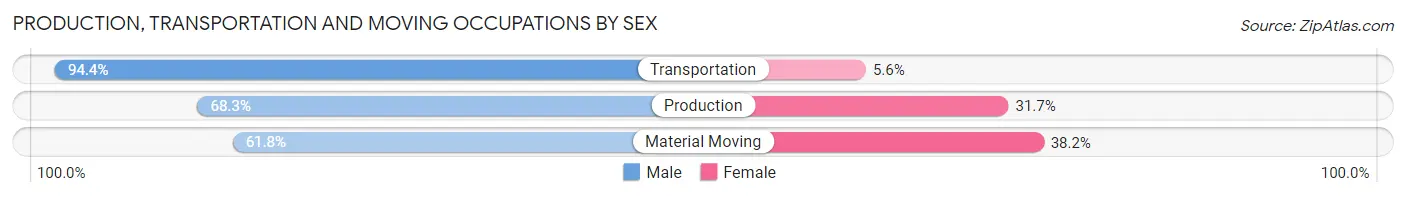
| Occupation | Male | Female |
| Production | 944 (68.3%) | 439 (31.7%) |
| Transportation | 1,876 (94.4%) | 111 (5.6%) |
| Material Moving | 1,005 (61.8%) | 621 (38.2%) |
| Total (Category) | 3,825 (76.6%) | 1,171 (23.4%) |
| Total (Overall) | 40,152 (52.9%) | 35,708 (47.1%) |
Employment Industries by Sex in Stamford
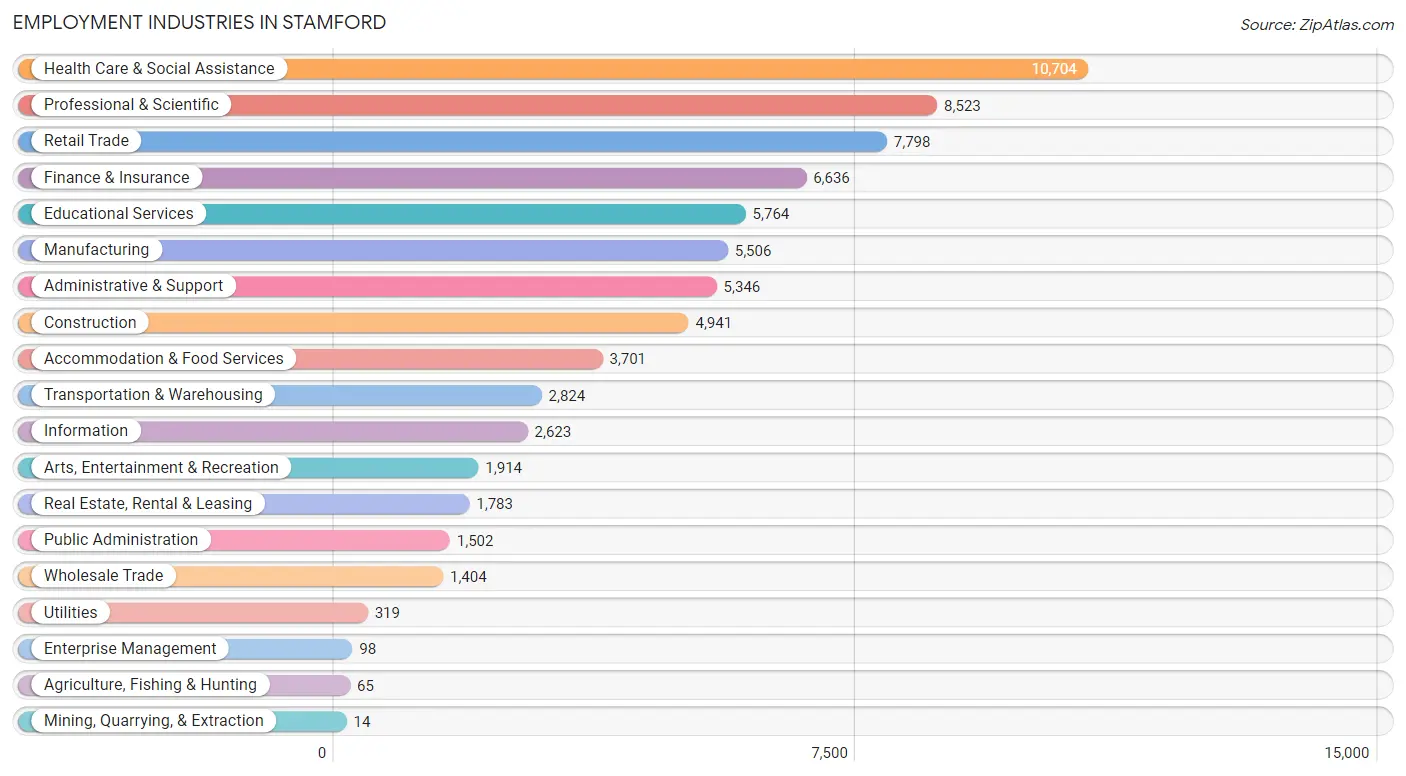
Employment Industries in Stamford
The major employment industries in Stamford include Health Care & Social Assistance (10,704 | 14.1%), Professional & Scientific (8,523 | 11.2%), Retail Trade (7,798 | 10.3%), Finance & Insurance (6,636 | 8.7%), and Educational Services (5,764 | 7.6%).
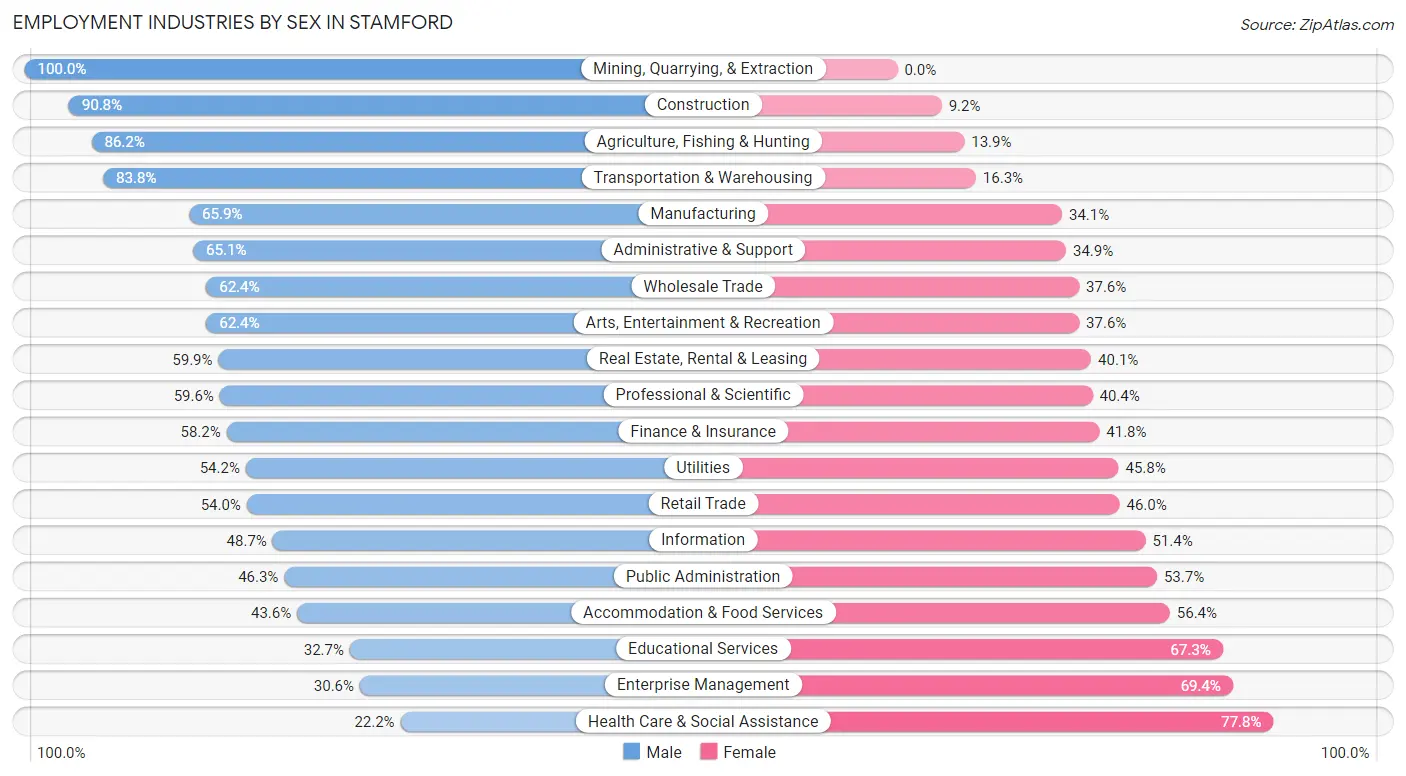
Employment Industries by Sex in Stamford
The Stamford industries that see more men than women are Mining, Quarrying, & Extraction (100.0%), Construction (90.8%), and Agriculture, Fishing & Hunting (86.2%), whereas the industries that tend to have a higher number of women are Health Care & Social Assistance (77.8%), Enterprise Management (69.4%), and Educational Services (67.3%).
| Industry | Male | Female |
| Agriculture, Fishing & Hunting | 56 (86.2%) | 9 (13.9%) |
| Mining, Quarrying, & Extraction | 14 (100.0%) | 0 (0.0%) |
| Construction | 4,488 (90.8%) | 453 (9.2%) |
| Manufacturing | 3,630 (65.9%) | 1,876 (34.1%) |
| Wholesale Trade | 876 (62.4%) | 528 (37.6%) |
| Retail Trade | 4,213 (54.0%) | 3,585 (46.0%) |
| Transportation & Warehousing | 2,365 (83.8%) | 459 (16.3%) |
| Utilities | 173 (54.2%) | 146 (45.8%) |
| Information | 1,276 (48.6%) | 1,347 (51.3%) |
| Finance & Insurance | 3,862 (58.2%) | 2,774 (41.8%) |
| Real Estate, Rental & Leasing | 1,068 (59.9%) | 715 (40.1%) |
| Professional & Scientific | 5,081 (59.6%) | 3,442 (40.4%) |
| Enterprise Management | 30 (30.6%) | 68 (69.4%) |
| Administrative & Support | 3,480 (65.1%) | 1,866 (34.9%) |
| Educational Services | 1,884 (32.7%) | 3,880 (67.3%) |
| Health Care & Social Assistance | 2,377 (22.2%) | 8,327 (77.8%) |
| Arts, Entertainment & Recreation | 1,194 (62.4%) | 720 (37.6%) |
| Accommodation & Food Services | 1,614 (43.6%) | 2,087 (56.4%) |
| Public Administration | 695 (46.3%) | 807 (53.7%) |
| Total | 40,152 (52.9%) | 35,708 (47.1%) |
Education in Stamford
School Enrollment in Stamford
The most common levels of schooling among the 31,172 students in Stamford are college / undergraduate (6,415 | 20.6%), high school (6,132 | 19.7%), and middle school (5,516 | 17.7%).
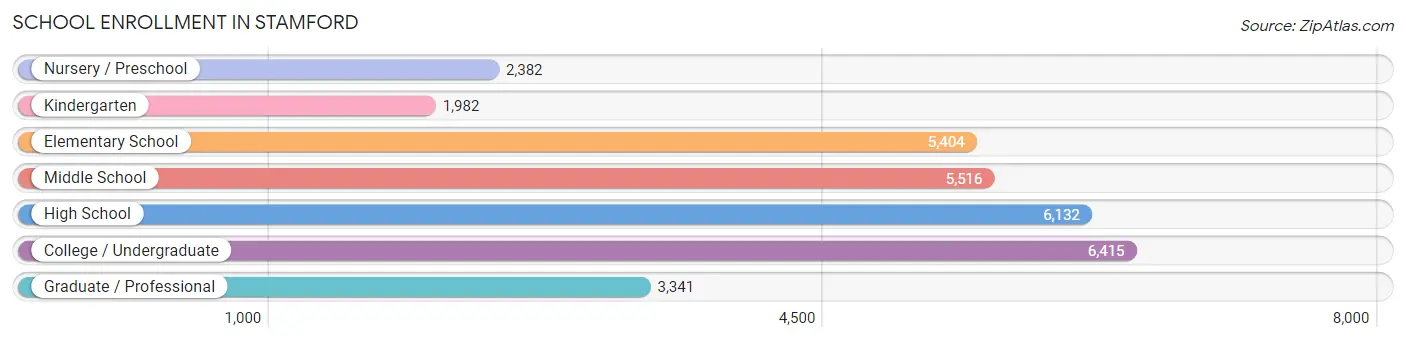
| School Level | # Students | % Students |
| Nursery / Preschool | 2,382 | 7.6% |
| Kindergarten | 1,982 | 6.4% |
| Elementary School | 5,404 | 17.3% |
| Middle School | 5,516 | 17.7% |
| High School | 6,132 | 19.7% |
| College / Undergraduate | 6,415 | 20.6% |
| Graduate / Professional | 3,341 | 10.7% |
| Total | 31,172 | 100.0% |
School Enrollment by Age by Funding Source in Stamford
Out of a total of 31,172 students who are enrolled in schools in Stamford, 7,793 (25.0%) attend a private institution, while the remaining 23,379 (75.0%) are enrolled in public schools. The age group of 35 years and over has the highest likelihood of being enrolled in private schools, with 1,085 (47.7% in the age bracket) enrolled. Conversely, the age group of 15 to 17 year olds has the lowest likelihood of being enrolled in a private school, with 3,402 (87.6% in the age bracket) attending a public institution.
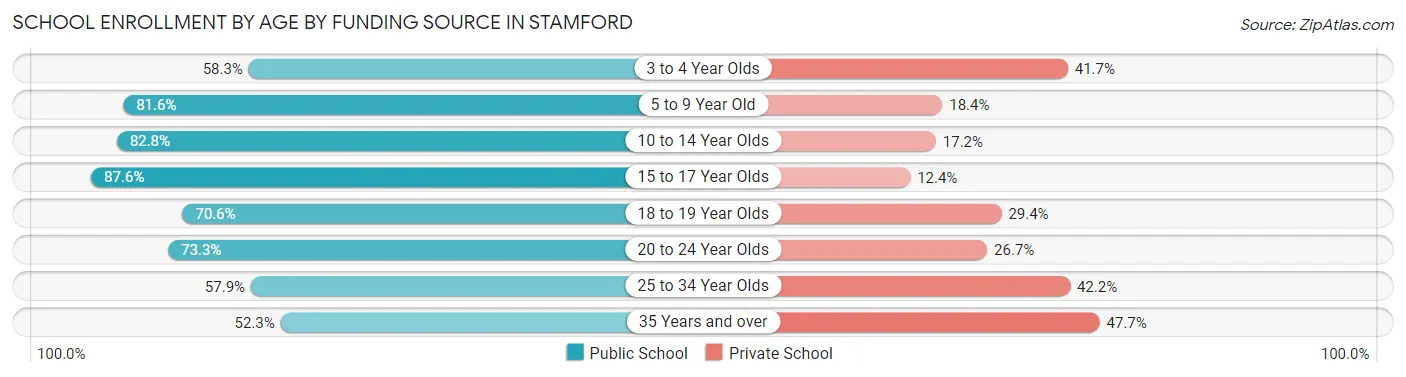
| Age Bracket | Public School | Private School |
| 3 to 4 Year Olds | 1,315 (58.3%) | 942 (41.7%) |
| 5 to 9 Year Old | 5,765 (81.6%) | 1,297 (18.4%) |
| 10 to 14 Year Olds | 5,894 (82.8%) | 1,222 (17.2%) |
| 15 to 17 Year Olds | 3,402 (87.6%) | 481 (12.4%) |
| 18 to 19 Year Olds | 1,583 (70.6%) | 659 (29.4%) |
| 20 to 24 Year Olds | 2,612 (73.3%) | 953 (26.7%) |
| 25 to 34 Year Olds | 1,603 (57.9%) | 1,168 (42.1%) |
| 35 Years and over | 1,191 (52.3%) | 1,085 (47.7%) |
| Total | 23,379 (75.0%) | 7,793 (25.0%) |
Educational Attainment by Field of Study in Stamford
Business (12,626 | 24.1%), social sciences (6,590 | 12.6%), engineering (3,954 | 7.5%), science & technology (3,260 | 6.2%), and education (3,229 | 6.2%) are the most common fields of study among 52,452 individuals in Stamford who have obtained a bachelor's degree or higher.
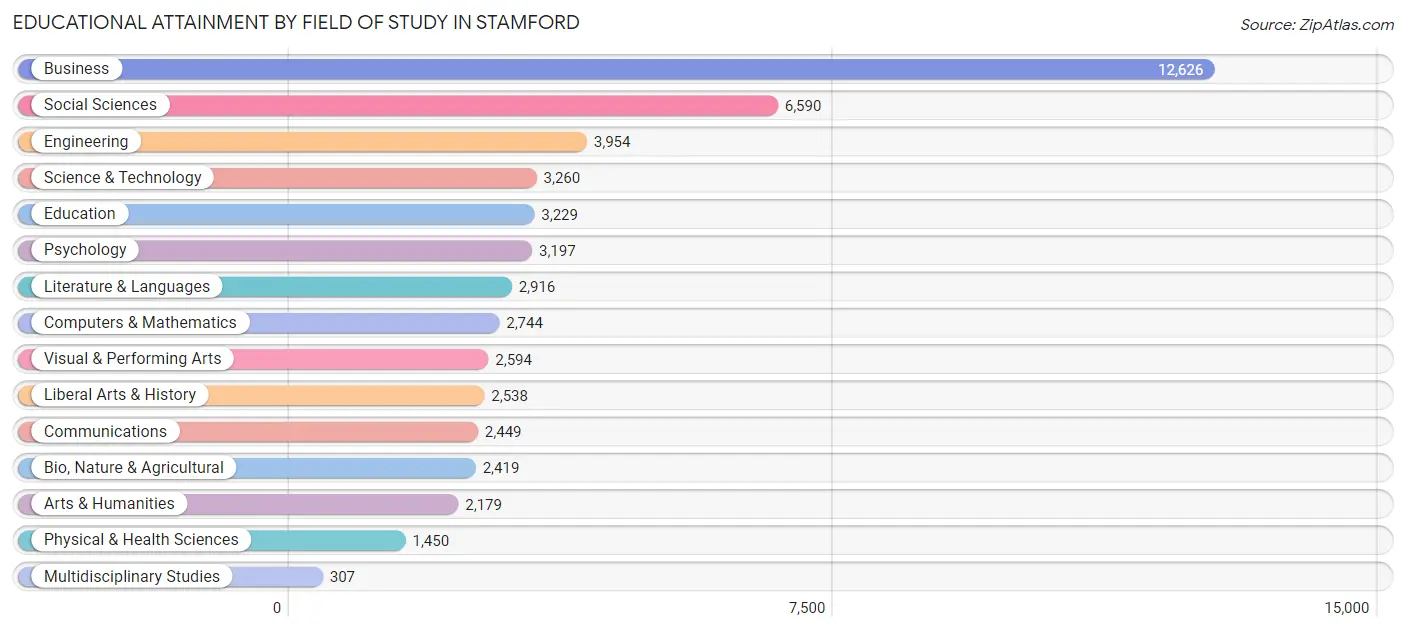
| Field of Study | # Graduates | % Graduates |
| Computers & Mathematics | 2,744 | 5.2% |
| Bio, Nature & Agricultural | 2,419 | 4.6% |
| Physical & Health Sciences | 1,450 | 2.8% |
| Psychology | 3,197 | 6.1% |
| Social Sciences | 6,590 | 12.6% |
| Engineering | 3,954 | 7.5% |
| Multidisciplinary Studies | 307 | 0.6% |
| Science & Technology | 3,260 | 6.2% |
| Business | 12,626 | 24.1% |
| Education | 3,229 | 6.2% |
| Literature & Languages | 2,916 | 5.6% |
| Liberal Arts & History | 2,538 | 4.8% |
| Visual & Performing Arts | 2,594 | 5.0% |
| Communications | 2,449 | 4.7% |
| Arts & Humanities | 2,179 | 4.2% |
| Total | 52,452 | 100.0% |
Transportation & Commute in Stamford
Vehicle Availability by Sex in Stamford
The most prevalent vehicle ownership categories in Stamford are males with 2 vehicles (15,629, accounting for 39.9%) and females with 2 vehicles (13,050, making up 44.9%).
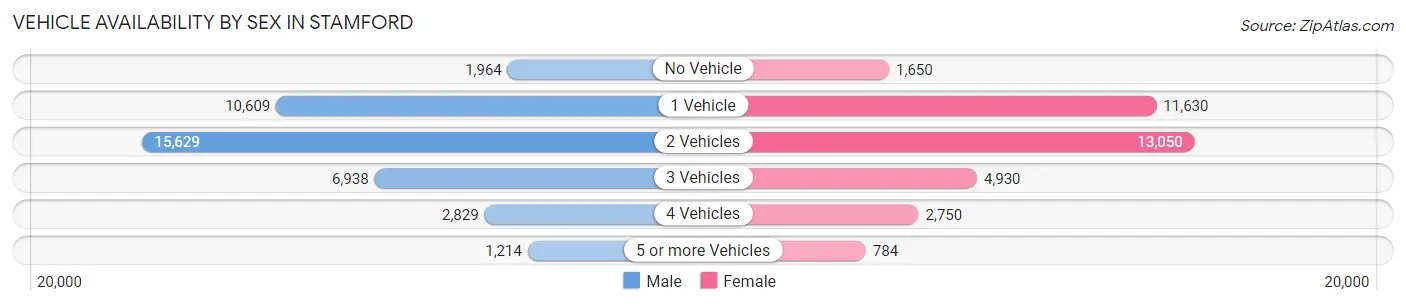
| Vehicles Available | Male | Female |
| No Vehicle | 1,964 (5.0%) | 1,650 (4.7%) |
| 1 Vehicle | 10,609 (27.1%) | 11,630 (33.4%) |
| 2 Vehicles | 15,629 (39.9%) | 13,050 (37.5%) |
| 3 Vehicles | 6,938 (17.7%) | 4,930 (14.2%) |
| 4 Vehicles | 2,829 (7.2%) | 2,750 (7.9%) |
| 5 or more Vehicles | 1,214 (3.1%) | 784 (2.2%) |
| Total | 39,183 (100.0%) | 34,794 (100.0%) |
Commute Time in Stamford
The most frequently occuring commute durations in Stamford are 20 to 24 minutes (10,590 commuters, 16.6%), 15 to 19 minutes (10,164 commuters, 15.9%), and 10 to 14 minutes (9,375 commuters, 14.7%).
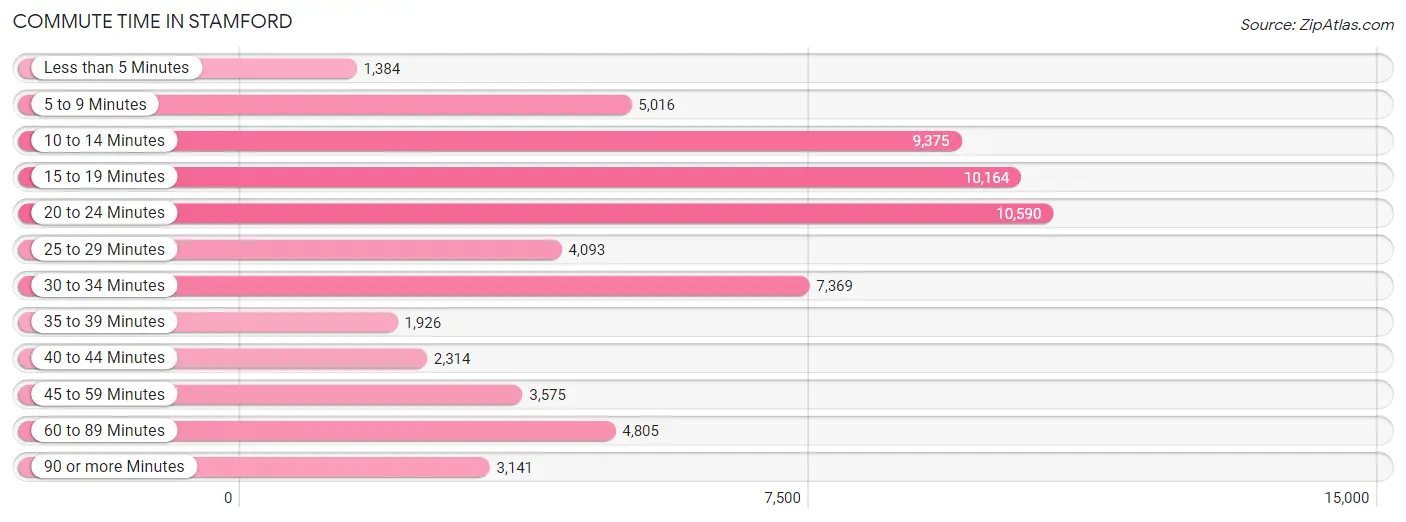
| Commute Time | # Commuters | % Commuters |
| Less than 5 Minutes | 1,384 | 2.2% |
| 5 to 9 Minutes | 5,016 | 7.9% |
| 10 to 14 Minutes | 9,375 | 14.7% |
| 15 to 19 Minutes | 10,164 | 15.9% |
| 20 to 24 Minutes | 10,590 | 16.6% |
| 25 to 29 Minutes | 4,093 | 6.4% |
| 30 to 34 Minutes | 7,369 | 11.6% |
| 35 to 39 Minutes | 1,926 | 3.0% |
| 40 to 44 Minutes | 2,314 | 3.6% |
| 45 to 59 Minutes | 3,575 | 5.6% |
| 60 to 89 Minutes | 4,805 | 7.5% |
| 90 or more Minutes | 3,141 | 4.9% |
Commute Time by Sex in Stamford
The most common commute times in Stamford are 15 to 19 minutes (5,578 commuters, 16.4%) for males and 20 to 24 minutes (5,160 commuters, 17.3%) for females.
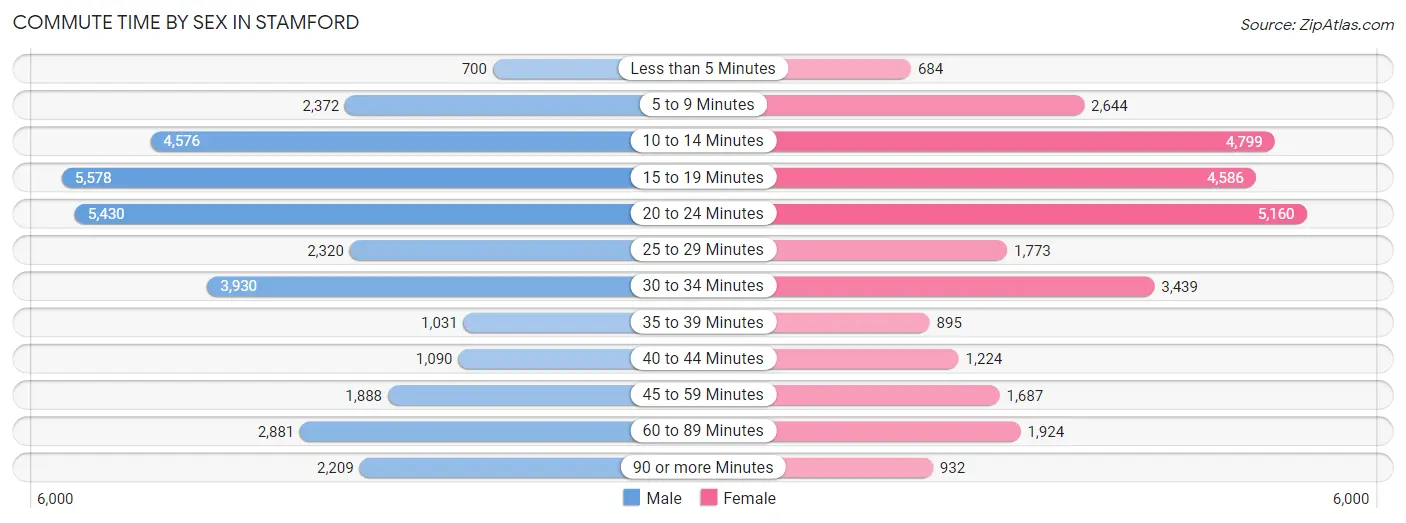
| Commute Time | Male | Female |
| Less than 5 Minutes | 700 (2.1%) | 684 (2.3%) |
| 5 to 9 Minutes | 2,372 (7.0%) | 2,644 (8.9%) |
| 10 to 14 Minutes | 4,576 (13.5%) | 4,799 (16.1%) |
| 15 to 19 Minutes | 5,578 (16.4%) | 4,586 (15.4%) |
| 20 to 24 Minutes | 5,430 (16.0%) | 5,160 (17.3%) |
| 25 to 29 Minutes | 2,320 (6.8%) | 1,773 (6.0%) |
| 30 to 34 Minutes | 3,930 (11.6%) | 3,439 (11.6%) |
| 35 to 39 Minutes | 1,031 (3.0%) | 895 (3.0%) |
| 40 to 44 Minutes | 1,090 (3.2%) | 1,224 (4.1%) |
| 45 to 59 Minutes | 1,888 (5.6%) | 1,687 (5.7%) |
| 60 to 89 Minutes | 2,881 (8.5%) | 1,924 (6.5%) |
| 90 or more Minutes | 2,209 (6.5%) | 932 (3.1%) |
Time of Departure to Work by Sex in Stamford
The most frequent times of departure to work in Stamford are 7:00 AM to 7:29 AM (5,514, 16.2%) for males and 8:00 AM to 8:29 AM (5,312, 17.9%) for females.
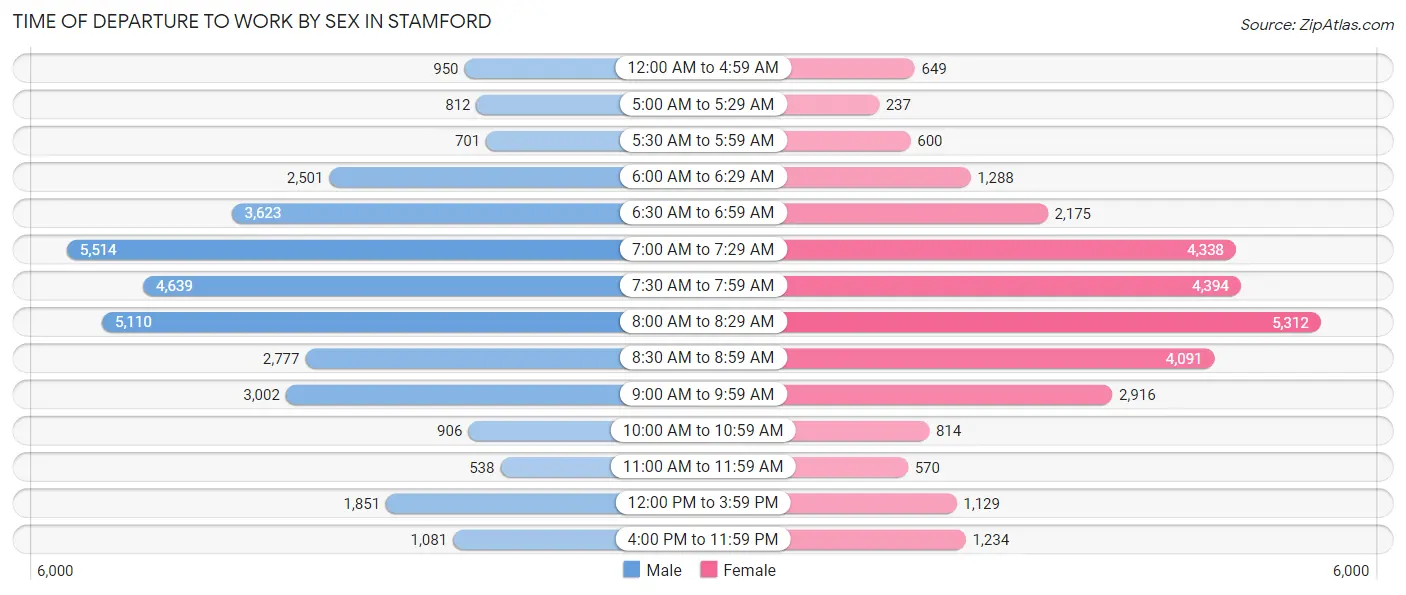
| Time of Departure | Male | Female |
| 12:00 AM to 4:59 AM | 950 (2.8%) | 649 (2.2%) |
| 5:00 AM to 5:29 AM | 812 (2.4%) | 237 (0.8%) |
| 5:30 AM to 5:59 AM | 701 (2.1%) | 600 (2.0%) |
| 6:00 AM to 6:29 AM | 2,501 (7.3%) | 1,288 (4.3%) |
| 6:30 AM to 6:59 AM | 3,623 (10.6%) | 2,175 (7.3%) |
| 7:00 AM to 7:29 AM | 5,514 (16.2%) | 4,338 (14.6%) |
| 7:30 AM to 7:59 AM | 4,639 (13.6%) | 4,394 (14.8%) |
| 8:00 AM to 8:29 AM | 5,110 (15.0%) | 5,312 (17.9%) |
| 8:30 AM to 8:59 AM | 2,777 (8.2%) | 4,091 (13.8%) |
| 9:00 AM to 9:59 AM | 3,002 (8.8%) | 2,916 (9.8%) |
| 10:00 AM to 10:59 AM | 906 (2.7%) | 814 (2.7%) |
| 11:00 AM to 11:59 AM | 538 (1.6%) | 570 (1.9%) |
| 12:00 PM to 3:59 PM | 1,851 (5.4%) | 1,129 (3.8%) |
| 4:00 PM to 11:59 PM | 1,081 (3.2%) | 1,234 (4.2%) |
| Total | 34,005 (100.0%) | 29,747 (100.0%) |
Housing Occupancy in Stamford
Occupancy by Ownership in Stamford
Of the total 53,520 dwellings in Stamford, owner-occupied units account for 24,644 (46.1%), while renter-occupied units make up 28,876 (53.9%).
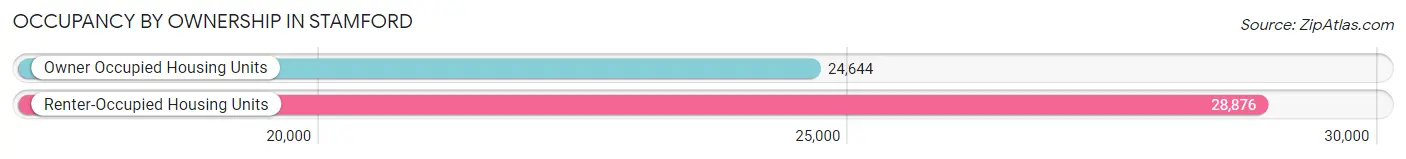
| Occupancy | # Housing Units | % Housing Units |
| Owner Occupied Housing Units | 24,644 | 46.1% |
| Renter-Occupied Housing Units | 28,876 | 53.9% |
| Total Occupied Housing Units | 53,520 | 100.0% |
Occupancy by Household Size in Stamford
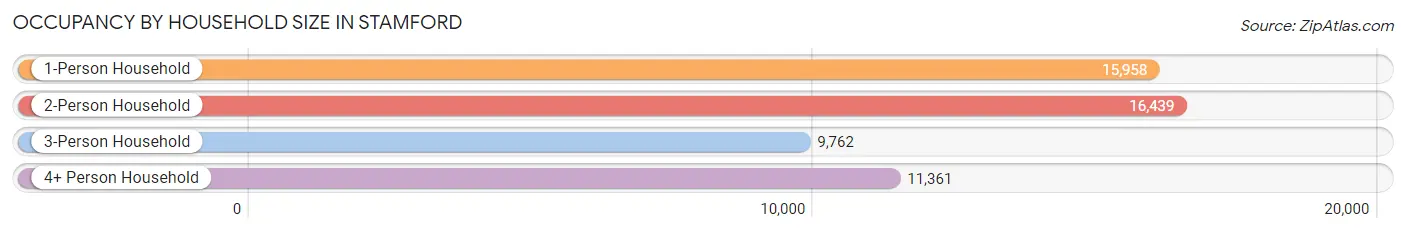
| Household Size | # Housing Units | % Housing Units |
| 1-Person Household | 15,958 | 29.8% |
| 2-Person Household | 16,439 | 30.7% |
| 3-Person Household | 9,762 | 18.2% |
| 4+ Person Household | 11,361 | 21.2% |
| Total Housing Units | 53,520 | 100.0% |
Occupancy by Ownership by Household Size in Stamford
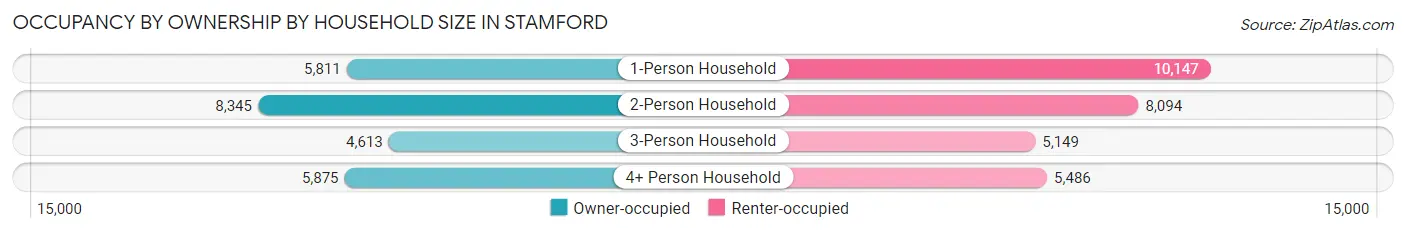
| Household Size | Owner-occupied | Renter-occupied |
| 1-Person Household | 5,811 (36.4%) | 10,147 (63.6%) |
| 2-Person Household | 8,345 (50.8%) | 8,094 (49.2%) |
| 3-Person Household | 4,613 (47.2%) | 5,149 (52.7%) |
| 4+ Person Household | 5,875 (51.7%) | 5,486 (48.3%) |
| Total Housing Units | 24,644 (46.1%) | 28,876 (53.9%) |
Occupancy by Educational Attainment in Stamford
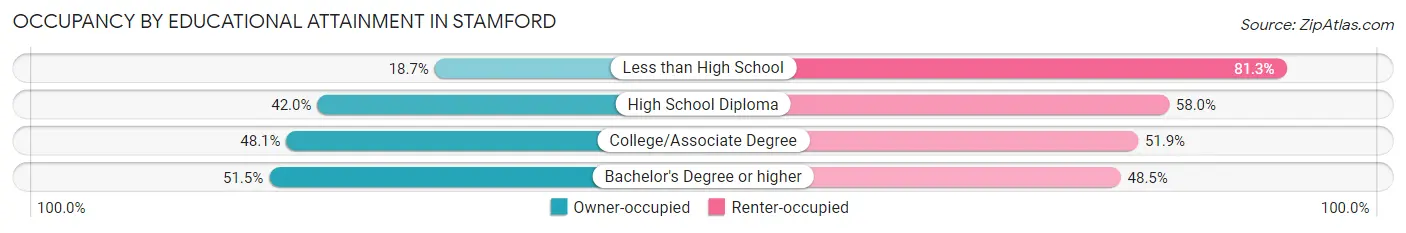
| Household Size | Owner-occupied | Renter-occupied |
| Less than High School | 981 (18.7%) | 4,267 (81.3%) |
| High School Diploma | 3,714 (42.0%) | 5,136 (58.0%) |
| College/Associate Degree | 5,151 (48.1%) | 5,559 (51.9%) |
| Bachelor's Degree or higher | 14,798 (51.5%) | 13,914 (48.5%) |
Occupancy by Age of Householder in Stamford
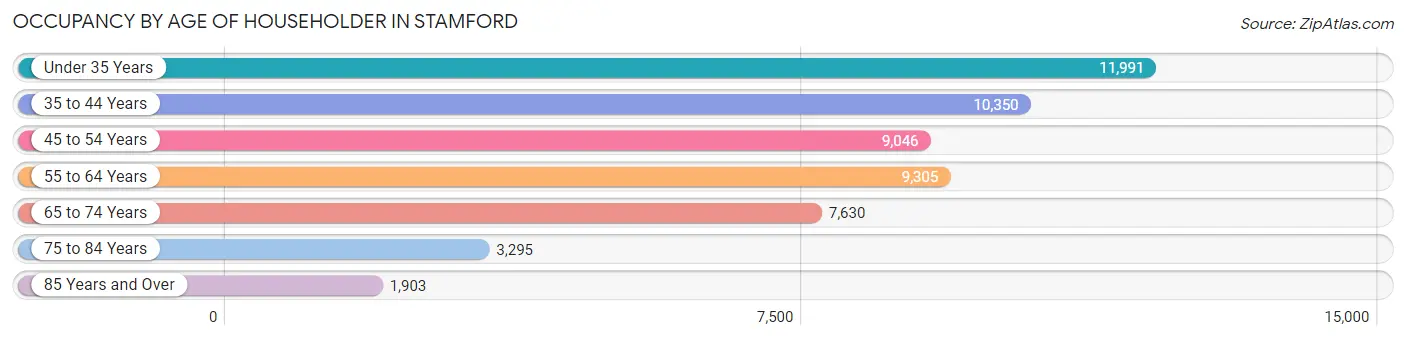
| Age Bracket | # Households | % Households |
| Under 35 Years | 11,991 | 22.4% |
| 35 to 44 Years | 10,350 | 19.3% |
| 45 to 54 Years | 9,046 | 16.9% |
| 55 to 64 Years | 9,305 | 17.4% |
| 65 to 74 Years | 7,630 | 14.3% |
| 75 to 84 Years | 3,295 | 6.2% |
| 85 Years and Over | 1,903 | 3.6% |
| Total | 53,520 | 100.0% |
Housing Finances in Stamford
Median Income by Occupancy in Stamford
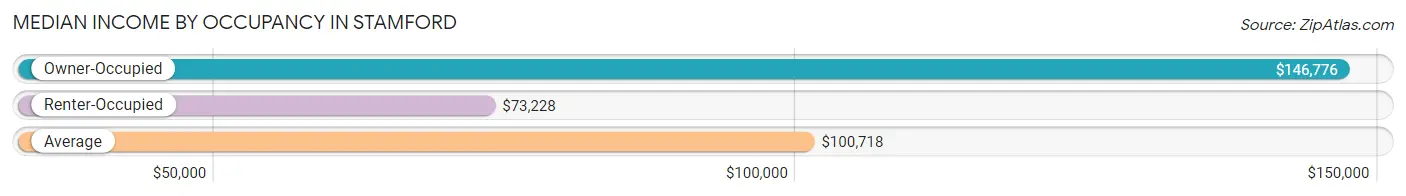
| Occupancy Type | # Households | Median Income |
| Owner-Occupied | 24,644 (46.1%) | $146,776 |
| Renter-Occupied | 28,876 (53.9%) | $73,228 |
| Average | 53,520 (100.0%) | $100,718 |
Occupancy by Householder Income Bracket in Stamford
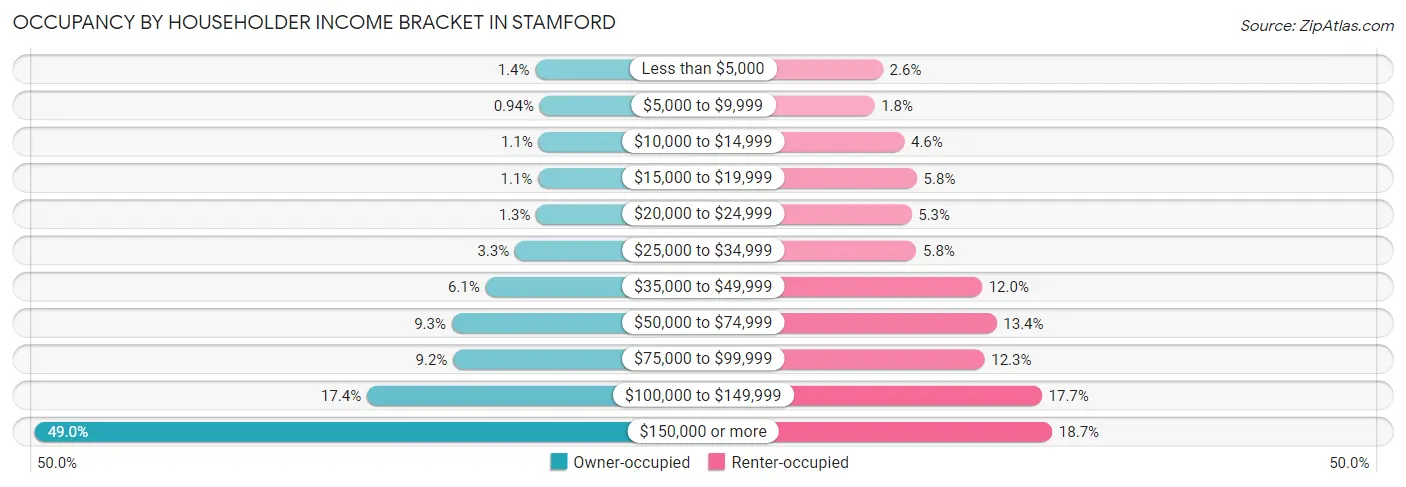
| Income Bracket | Owner-occupied | Renter-occupied |
| Less than $5,000 | 335 (1.4%) | 746 (2.6%) |
| $5,000 to $9,999 | 231 (0.9%) | 513 (1.8%) |
| $10,000 to $14,999 | 259 (1.1%) | 1,335 (4.6%) |
| $15,000 to $19,999 | 269 (1.1%) | 1,682 (5.8%) |
| $20,000 to $24,999 | 310 (1.3%) | 1,533 (5.3%) |
| $25,000 to $34,999 | 810 (3.3%) | 1,665 (5.8%) |
| $35,000 to $49,999 | 1,503 (6.1%) | 3,472 (12.0%) |
| $50,000 to $74,999 | 2,295 (9.3%) | 3,872 (13.4%) |
| $75,000 to $99,999 | 2,263 (9.2%) | 3,540 (12.3%) |
| $100,000 to $149,999 | 4,286 (17.4%) | 5,117 (17.7%) |
| $150,000 or more | 12,083 (49.0%) | 5,401 (18.7%) |
| Total | 24,644 (100.0%) | 28,876 (100.0%) |
Monthly Housing Cost Tiers in Stamford
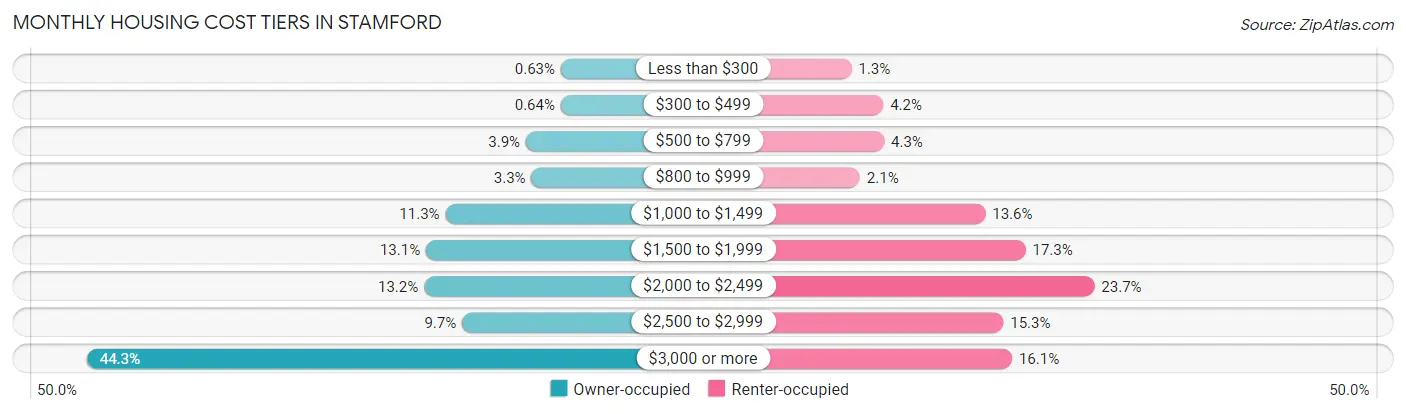
| Monthly Cost | Owner-occupied | Renter-occupied |
| Less than $300 | 156 (0.6%) | 374 (1.3%) |
| $300 to $499 | 158 (0.6%) | 1,220 (4.2%) |
| $500 to $799 | 949 (3.8%) | 1,242 (4.3%) |
| $800 to $999 | 822 (3.3%) | 599 (2.1%) |
| $1,000 to $1,499 | 2,776 (11.3%) | 3,931 (13.6%) |
| $1,500 to $1,999 | 3,215 (13.1%) | 5,001 (17.3%) |
| $2,000 to $2,499 | 3,260 (13.2%) | 6,832 (23.7%) |
| $2,500 to $2,999 | 2,399 (9.7%) | 4,409 (15.3%) |
| $3,000 or more | 10,909 (44.3%) | 4,641 (16.1%) |
| Total | 24,644 (100.0%) | 28,876 (100.0%) |
Physical Housing Characteristics in Stamford
Housing Structures in Stamford
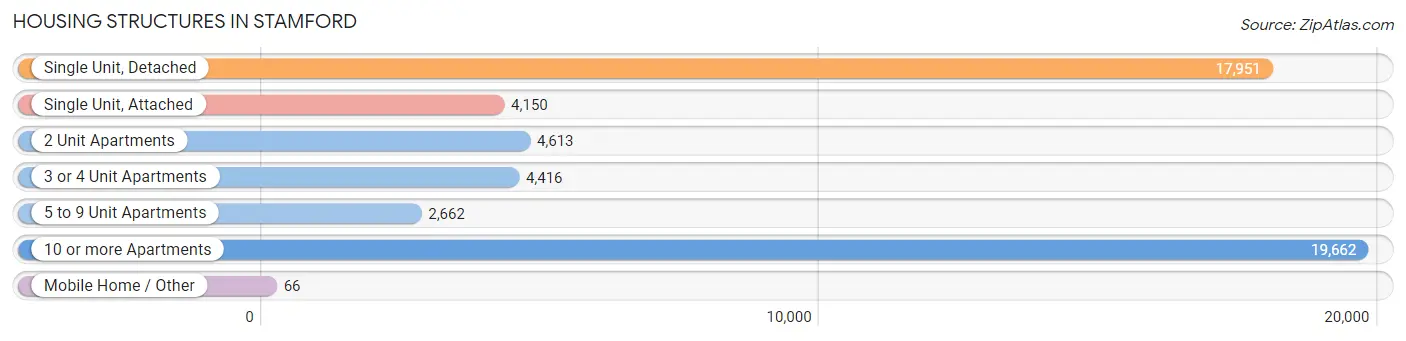
| Structure Type | # Housing Units | % Housing Units |
| Single Unit, Detached | 17,951 | 33.5% |
| Single Unit, Attached | 4,150 | 7.7% |
| 2 Unit Apartments | 4,613 | 8.6% |
| 3 or 4 Unit Apartments | 4,416 | 8.3% |
| 5 to 9 Unit Apartments | 2,662 | 5.0% |
| 10 or more Apartments | 19,662 | 36.7% |
| Mobile Home / Other | 66 | 0.1% |
| Total | 53,520 | 100.0% |
Housing Structures by Occupancy in Stamford
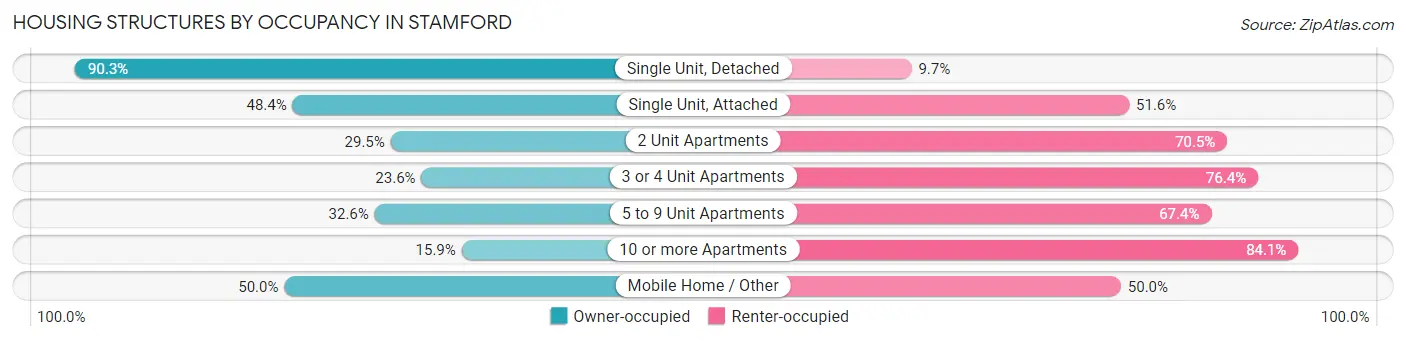
| Structure Type | Owner-occupied | Renter-occupied |
| Single Unit, Detached | 16,211 (90.3%) | 1,740 (9.7%) |
| Single Unit, Attached | 2,009 (48.4%) | 2,141 (51.6%) |
| 2 Unit Apartments | 1,362 (29.5%) | 3,251 (70.5%) |
| 3 or 4 Unit Apartments | 1,042 (23.6%) | 3,374 (76.4%) |
| 5 to 9 Unit Apartments | 868 (32.6%) | 1,794 (67.4%) |
| 10 or more Apartments | 3,119 (15.9%) | 16,543 (84.1%) |
| Mobile Home / Other | 33 (50.0%) | 33 (50.0%) |
| Total | 24,644 (46.1%) | 28,876 (53.9%) |
Housing Structures by Number of Rooms in Stamford
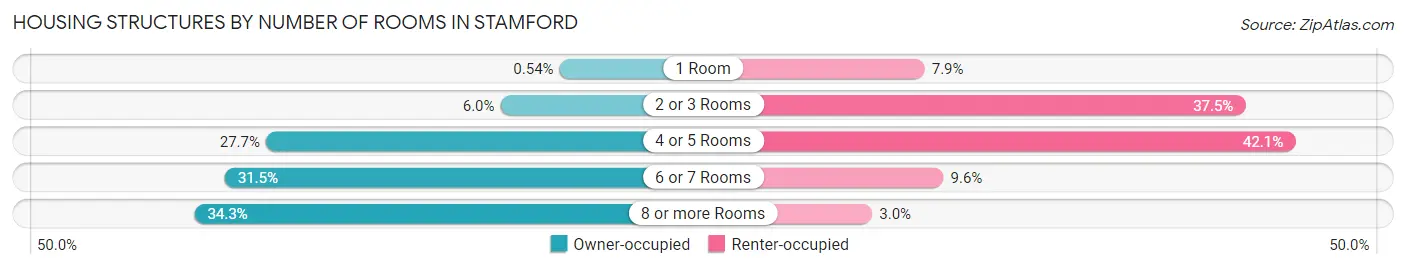
| Number of Rooms | Owner-occupied | Renter-occupied |
| 1 Room | 134 (0.5%) | 2,266 (7.9%) |
| 2 or 3 Rooms | 1,478 (6.0%) | 10,822 (37.5%) |
| 4 or 5 Rooms | 6,825 (27.7%) | 12,154 (42.1%) |
| 6 or 7 Rooms | 7,757 (31.5%) | 2,768 (9.6%) |
| 8 or more Rooms | 8,450 (34.3%) | 866 (3.0%) |
| Total | 24,644 (100.0%) | 28,876 (100.0%) |
Housing Structure by Heating Type in Stamford
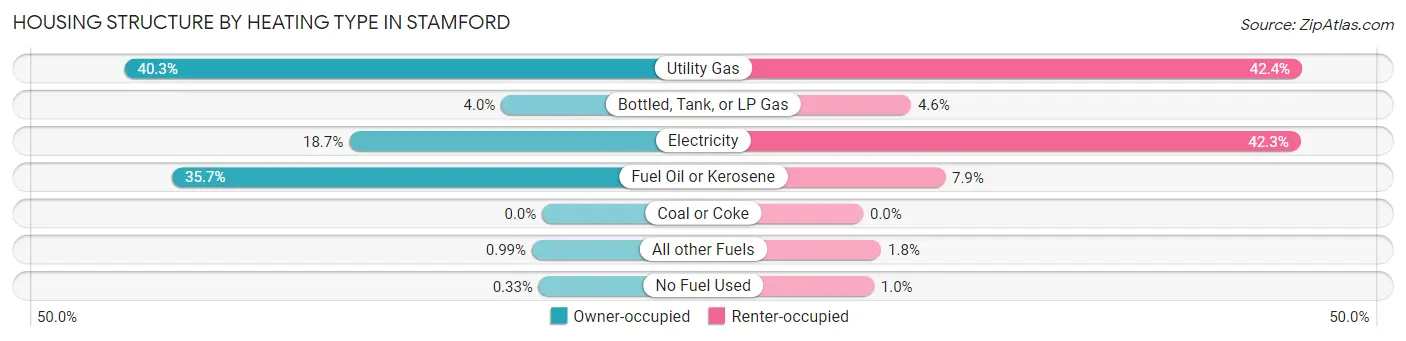
| Heating Type | Owner-occupied | Renter-occupied |
| Utility Gas | 9,941 (40.3%) | 12,242 (42.4%) |
| Bottled, Tank, or LP Gas | 973 (4.0%) | 1,338 (4.6%) |
| Electricity | 4,596 (18.6%) | 12,205 (42.3%) |
| Fuel Oil or Kerosene | 8,808 (35.7%) | 2,286 (7.9%) |
| Coal or Coke | 0 (0.0%) | 0 (0.0%) |
| All other Fuels | 245 (1.0%) | 506 (1.8%) |
| No Fuel Used | 81 (0.3%) | 299 (1.0%) |
| Total | 24,644 (100.0%) | 28,876 (100.0%) |
Household Vehicle Usage in Stamford
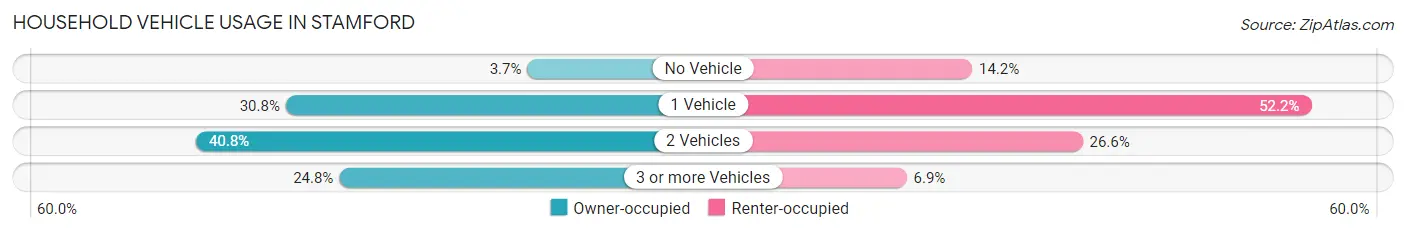
| Vehicles per Household | Owner-occupied | Renter-occupied |
| No Vehicle | 909 (3.7%) | 4,112 (14.2%) |
| 1 Vehicle | 7,578 (30.7%) | 15,083 (52.2%) |
| 2 Vehicles | 10,054 (40.8%) | 7,687 (26.6%) |
| 3 or more Vehicles | 6,103 (24.8%) | 1,994 (6.9%) |
| Total | 24,644 (100.0%) | 28,876 (100.0%) |
Real Estate & Mortgages in Stamford
Real Estate and Mortgage Overview in Stamford
| Characteristic | Without Mortgage | With Mortgage |
| Housing Units | 7,762 | 16,882 |
| Median Property Value | $596,300 | $580,200 |
| Median Household Income | $109,947 | $9,225 |
| Monthly Housing Costs | $1,412 | $10,494 |
| Real Estate Taxes | $9,317 | $182 |
Property Value by Mortgage Status in Stamford
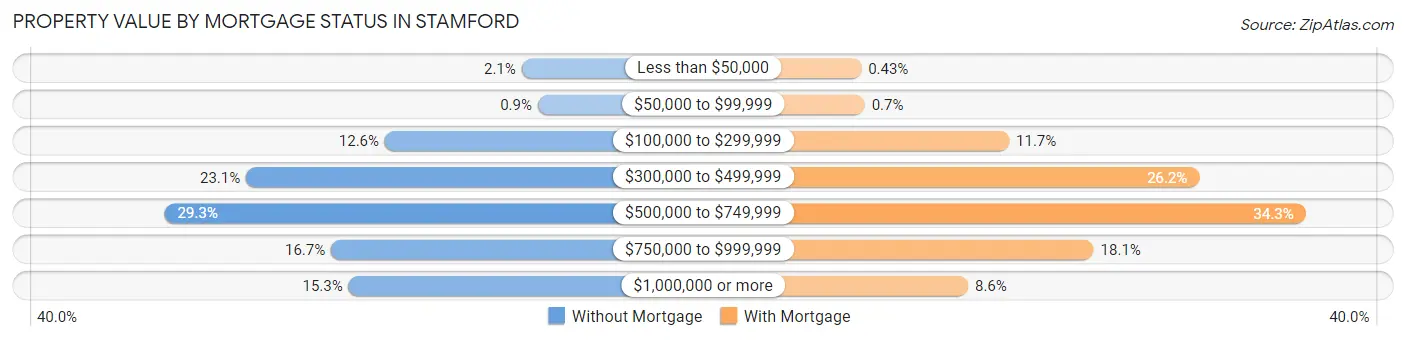
| Property Value | Without Mortgage | With Mortgage |
| Less than $50,000 | 165 (2.1%) | 73 (0.4%) |
| $50,000 to $99,999 | 70 (0.9%) | 118 (0.7%) |
| $100,000 to $299,999 | 974 (12.6%) | 1,975 (11.7%) |
| $300,000 to $499,999 | 1,795 (23.1%) | 4,419 (26.2%) |
| $500,000 to $749,999 | 2,277 (29.3%) | 5,788 (34.3%) |
| $750,000 to $999,999 | 1,292 (16.7%) | 3,062 (18.1%) |
| $1,000,000 or more | 1,189 (15.3%) | 1,447 (8.6%) |
| Total | 7,762 (100.0%) | 16,882 (100.0%) |
Household Income by Mortgage Status in Stamford
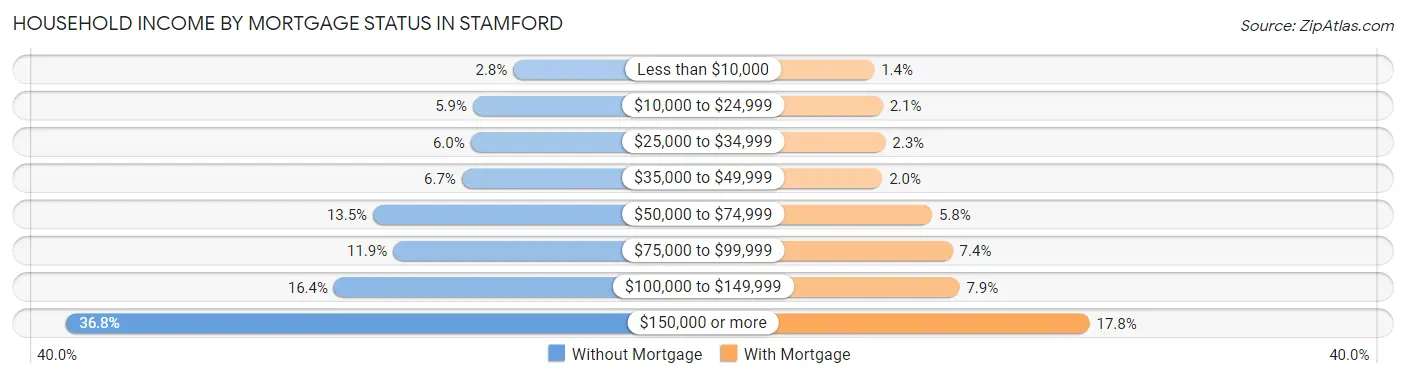
| Household Income | Without Mortgage | With Mortgage |
| Less than $10,000 | 216 (2.8%) | 240 (1.4%) |
| $10,000 to $24,999 | 454 (5.9%) | 350 (2.1%) |
| $25,000 to $34,999 | 467 (6.0%) | 384 (2.3%) |
| $35,000 to $49,999 | 520 (6.7%) | 343 (2.0%) |
| $50,000 to $74,999 | 1,045 (13.5%) | 983 (5.8%) |
| $75,000 to $99,999 | 926 (11.9%) | 1,250 (7.4%) |
| $100,000 to $149,999 | 1,276 (16.4%) | 1,337 (7.9%) |
| $150,000 or more | 2,858 (36.8%) | 3,010 (17.8%) |
| Total | 7,762 (100.0%) | 16,882 (100.0%) |
Property Value to Household Income Ratio in Stamford
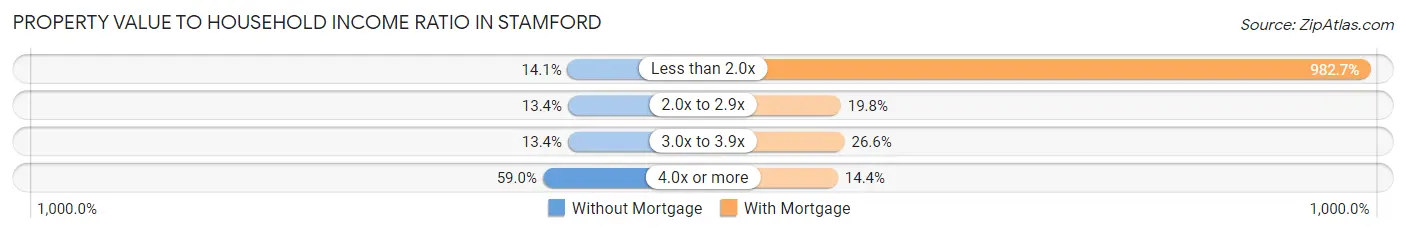
| Value-to-Income Ratio | Without Mortgage | With Mortgage |
| Less than 2.0x | 1,092 (14.1%) | 165,902 (982.7%) |
| 2.0x to 2.9x | 1,040 (13.4%) | 3,344 (19.8%) |
| 3.0x to 3.9x | 1,039 (13.4%) | 4,487 (26.6%) |
| 4.0x or more | 4,582 (59.0%) | 2,436 (14.4%) |
| Total | 7,762 (100.0%) | 16,882 (100.0%) |
Real Estate Taxes by Mortgage Status in Stamford
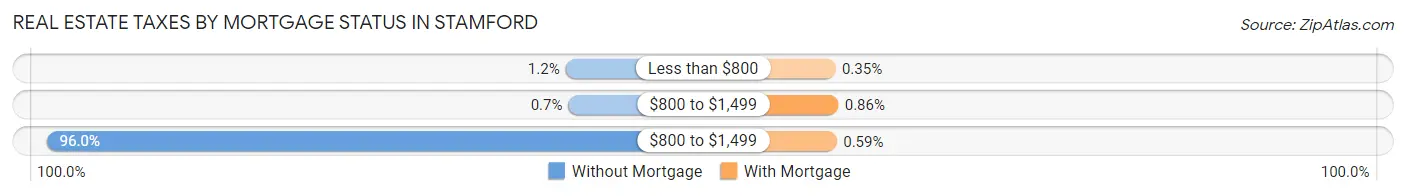
| Property Taxes | Without Mortgage | With Mortgage |
| Less than $800 | 94 (1.2%) | 59 (0.4%) |
| $800 to $1,499 | 54 (0.7%) | 145 (0.9%) |
| $800 to $1,499 | 7,449 (96.0%) | 100 (0.6%) |
| Total | 7,762 (100.0%) | 16,882 (100.0%) |
Health & Disability in Stamford
Health Insurance Coverage by Age in Stamford
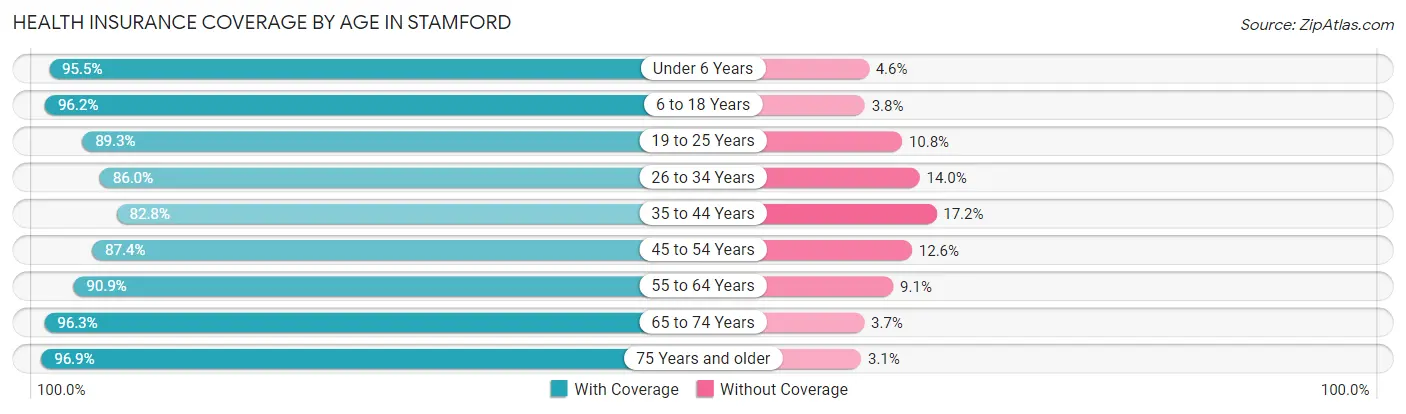
| Age Bracket | With Coverage | Without Coverage |
| Under 6 Years | 9,055 (95.5%) | 432 (4.5%) |
| 6 to 18 Years | 17,301 (96.2%) | 686 (3.8%) |
| 19 to 25 Years | 12,435 (89.2%) | 1,498 (10.7%) |
| 26 to 34 Years | 18,091 (86.0%) | 2,956 (14.0%) |
| 35 to 44 Years | 15,532 (82.8%) | 3,217 (17.2%) |
| 45 to 54 Years | 14,579 (87.4%) | 2,102 (12.6%) |
| 55 to 64 Years | 15,197 (90.9%) | 1,524 (9.1%) |
| 65 to 74 Years | 11,520 (96.3%) | 441 (3.7%) |
| 75 Years and older | 7,916 (96.9%) | 255 (3.1%) |
| Total | 121,626 (90.3%) | 13,111 (9.7%) |
Health Insurance Coverage by Citizenship Status in Stamford
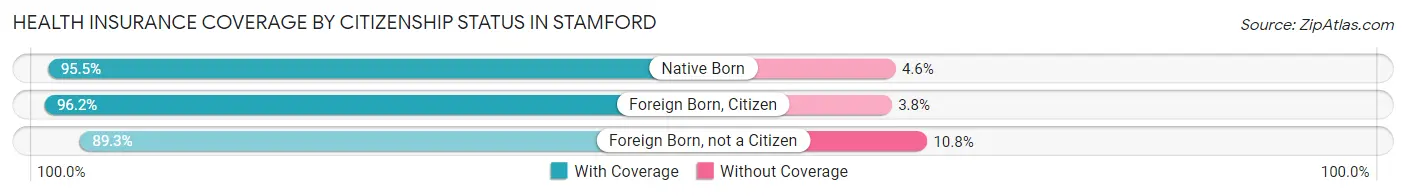
| Citizenship Status | With Coverage | Without Coverage |
| Native Born | 9,055 (95.5%) | 432 (4.5%) |
| Foreign Born, Citizen | 17,301 (96.2%) | 686 (3.8%) |
| Foreign Born, not a Citizen | 12,435 (89.2%) | 1,498 (10.7%) |
Health Insurance Coverage by Household Income in Stamford
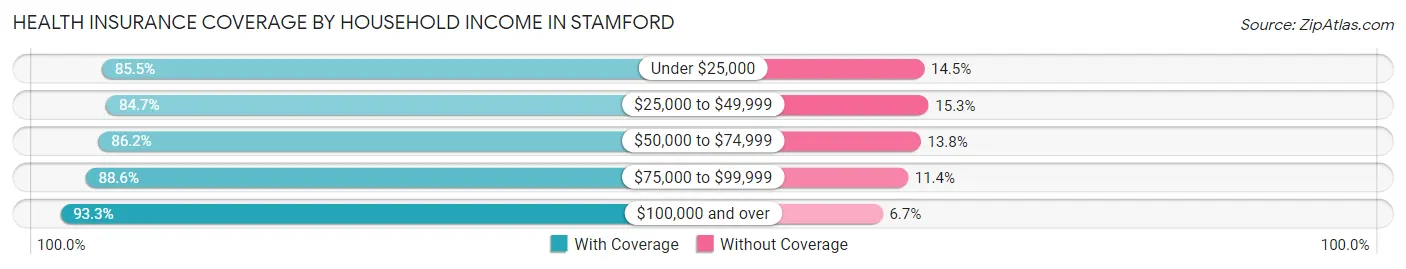
| Household Income | With Coverage | Without Coverage |
| Under $25,000 | 11,066 (85.5%) | 1,872 (14.5%) |
| $25,000 to $49,999 | 13,636 (84.7%) | 2,459 (15.3%) |
| $50,000 to $74,999 | 13,131 (86.2%) | 2,105 (13.8%) |
| $75,000 to $99,999 | 12,486 (88.6%) | 1,612 (11.4%) |
| $100,000 and over | 70,591 (93.3%) | 5,055 (6.7%) |
Public vs Private Health Insurance Coverage by Age in Stamford
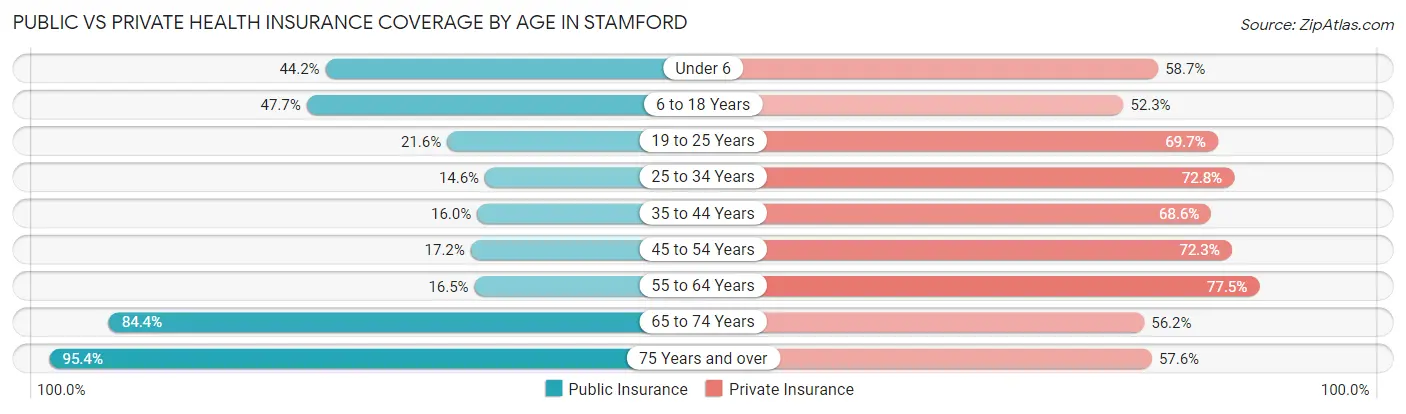
| Age Bracket | Public Insurance | Private Insurance |
| Under 6 | 4,189 (44.2%) | 5,572 (58.7%) |
| 6 to 18 Years | 8,575 (47.7%) | 9,403 (52.3%) |
| 19 to 25 Years | 3,008 (21.6%) | 9,715 (69.7%) |
| 25 to 34 Years | 3,062 (14.5%) | 15,319 (72.8%) |
| 35 to 44 Years | 3,004 (16.0%) | 12,852 (68.5%) |
| 45 to 54 Years | 2,873 (17.2%) | 12,065 (72.3%) |
| 55 to 64 Years | 2,759 (16.5%) | 12,950 (77.4%) |
| 65 to 74 Years | 10,089 (84.4%) | 6,716 (56.1%) |
| 75 Years and over | 7,792 (95.4%) | 4,704 (57.6%) |
| Total | 45,351 (33.7%) | 89,296 (66.3%) |
Disability Status by Sex by Age in Stamford
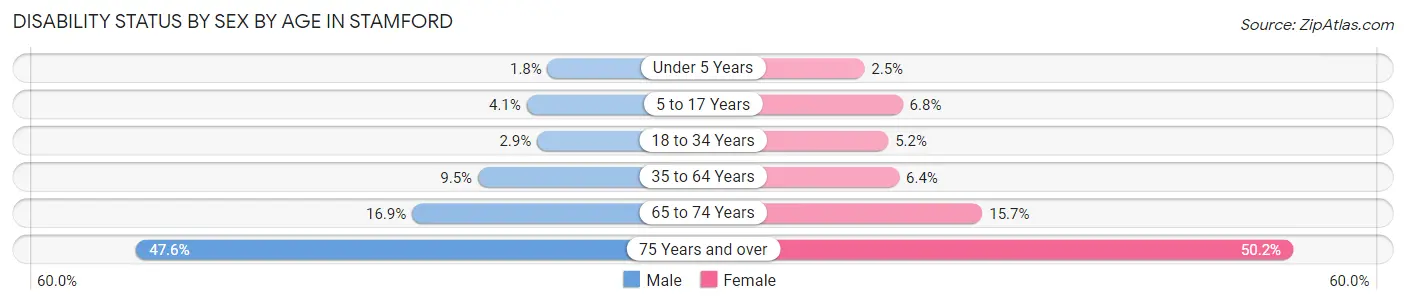
| Age Bracket | Male | Female |
| Under 5 Years | 74 (1.8%) | 83 (2.5%) |
| 5 to 17 Years | 370 (4.1%) | 637 (6.8%) |
| 18 to 34 Years | 536 (2.9%) | 941 (5.2%) |
| 35 to 64 Years | 2,417 (9.5%) | 1,705 (6.4%) |
| 65 to 74 Years | 964 (16.9%) | 977 (15.7%) |
| 75 Years and over | 1,528 (47.6%) | 2,491 (50.2%) |
Disability Class by Sex by Age in Stamford
Disability Class: Hearing Difficulty
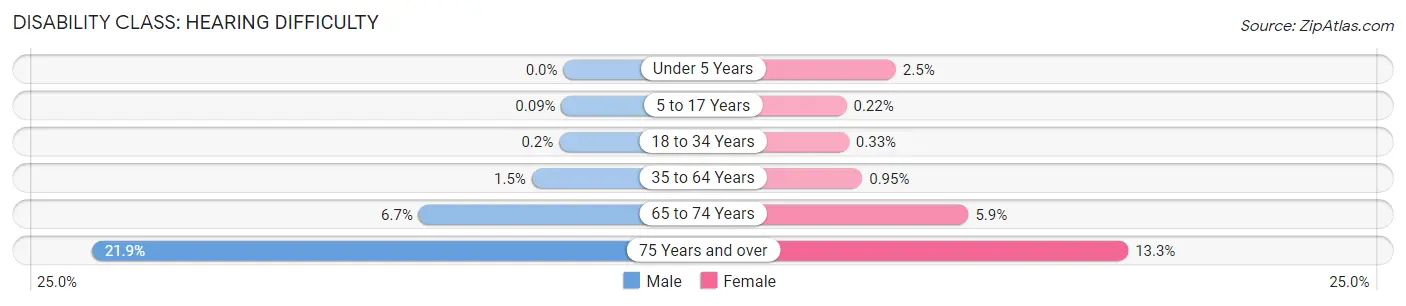
| Age Bracket | Male | Female |
| Under 5 Years | 0 (0.0%) | 83 (2.5%) |
| 5 to 17 Years | 8 (0.1%) | 21 (0.2%) |
| 18 to 34 Years | 36 (0.2%) | 60 (0.3%) |
| 35 to 64 Years | 374 (1.5%) | 253 (0.9%) |
| 65 to 74 Years | 384 (6.7%) | 367 (5.9%) |
| 75 Years and over | 703 (21.9%) | 659 (13.3%) |
Disability Class: Vision Difficulty
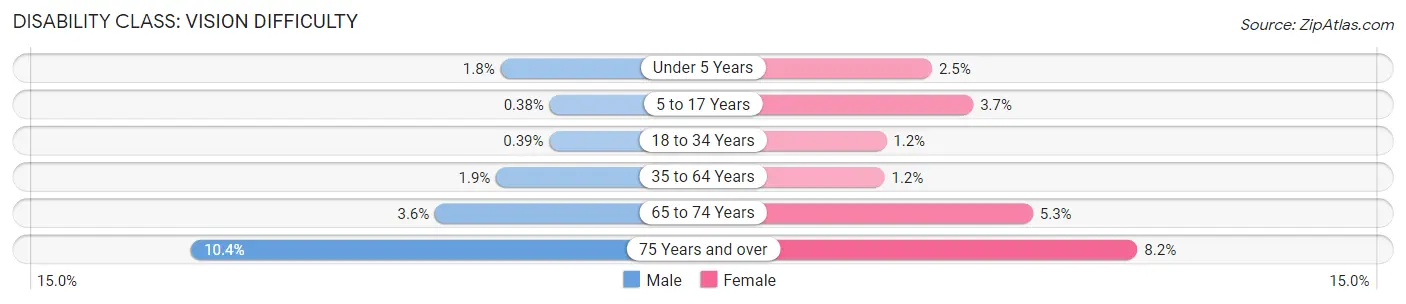
| Age Bracket | Male | Female |
| Under 5 Years | 74 (1.8%) | 83 (2.5%) |
| 5 to 17 Years | 34 (0.4%) | 344 (3.7%) |
| 18 to 34 Years | 71 (0.4%) | 225 (1.2%) |
| 35 to 64 Years | 476 (1.9%) | 319 (1.2%) |
| 65 to 74 Years | 204 (3.6%) | 332 (5.3%) |
| 75 Years and over | 333 (10.4%) | 408 (8.2%) |
Disability Class: Cognitive Difficulty
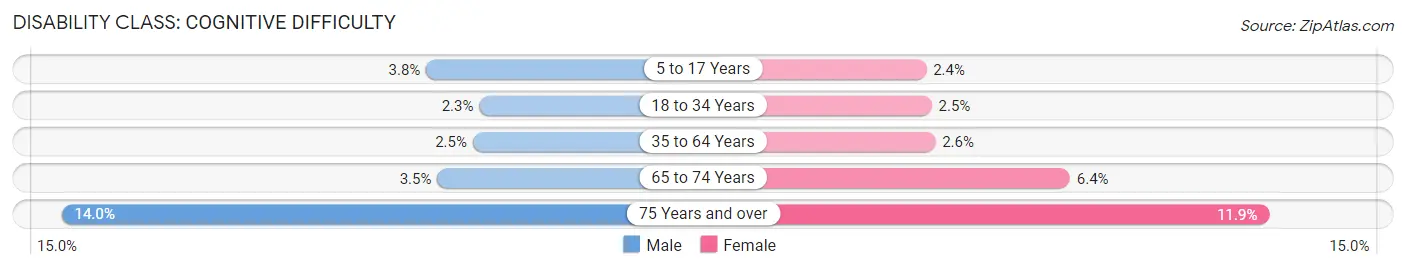
| Age Bracket | Male | Female |
| 5 to 17 Years | 345 (3.8%) | 221 (2.4%) |
| 18 to 34 Years | 428 (2.3%) | 455 (2.5%) |
| 35 to 64 Years | 640 (2.5%) | 695 (2.6%) |
| 65 to 74 Years | 201 (3.5%) | 396 (6.4%) |
| 75 Years and over | 449 (14.0%) | 590 (11.9%) |
Disability Class: Ambulatory Difficulty
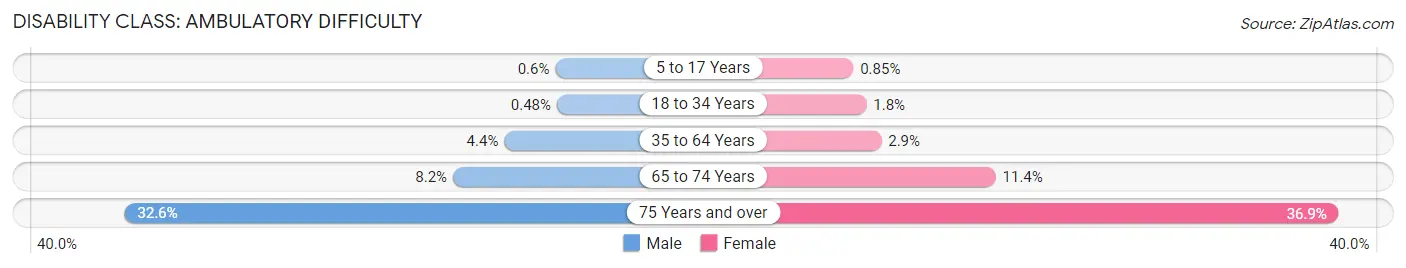
| Age Bracket | Male | Female |
| 5 to 17 Years | 54 (0.6%) | 80 (0.9%) |
| 18 to 34 Years | 88 (0.5%) | 331 (1.8%) |
| 35 to 64 Years | 1,115 (4.4%) | 783 (2.9%) |
| 65 to 74 Years | 469 (8.2%) | 713 (11.4%) |
| 75 Years and over | 1,047 (32.6%) | 1,829 (36.9%) |
Disability Class: Self-Care Difficulty
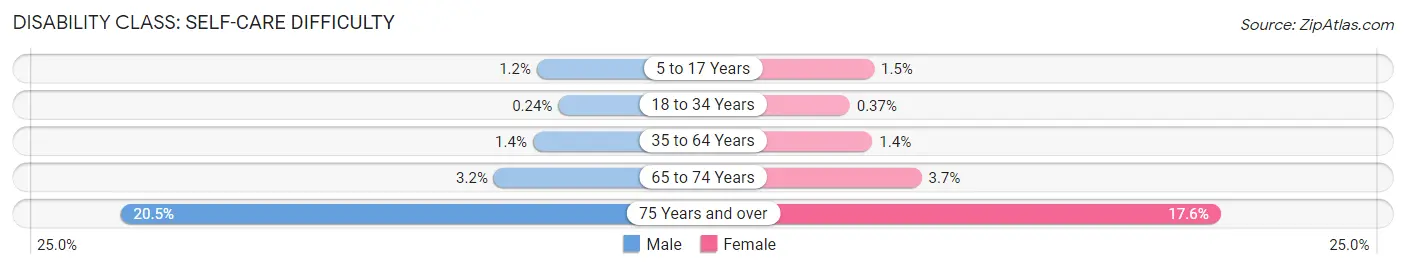
| Age Bracket | Male | Female |
| 5 to 17 Years | 111 (1.2%) | 141 (1.5%) |
| 18 to 34 Years | 44 (0.2%) | 68 (0.4%) |
| 35 to 64 Years | 360 (1.4%) | 381 (1.4%) |
| 65 to 74 Years | 185 (3.2%) | 231 (3.7%) |
| 75 Years and over | 660 (20.5%) | 871 (17.6%) |
Technology Access in Stamford
Computing Device Access in Stamford
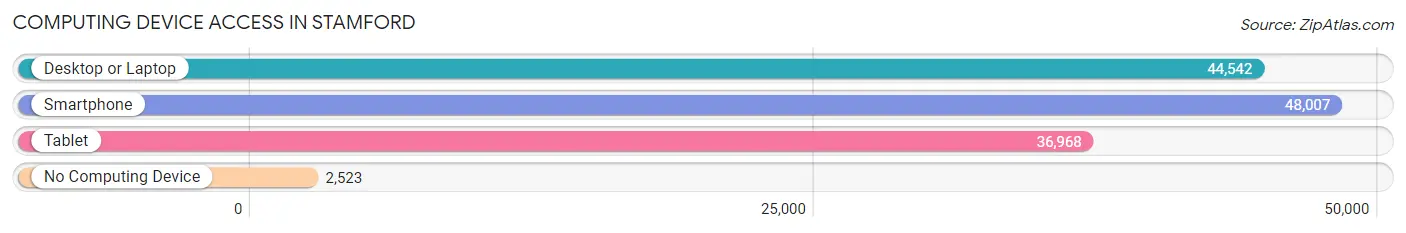
| Device Type | # Households | % Households |
| Desktop or Laptop | 44,542 | 83.2% |
| Smartphone | 48,007 | 89.7% |
| Tablet | 36,968 | 69.1% |
| No Computing Device | 2,523 | 4.7% |
| Total | 53,520 | 100.0% |
Internet Access in Stamford
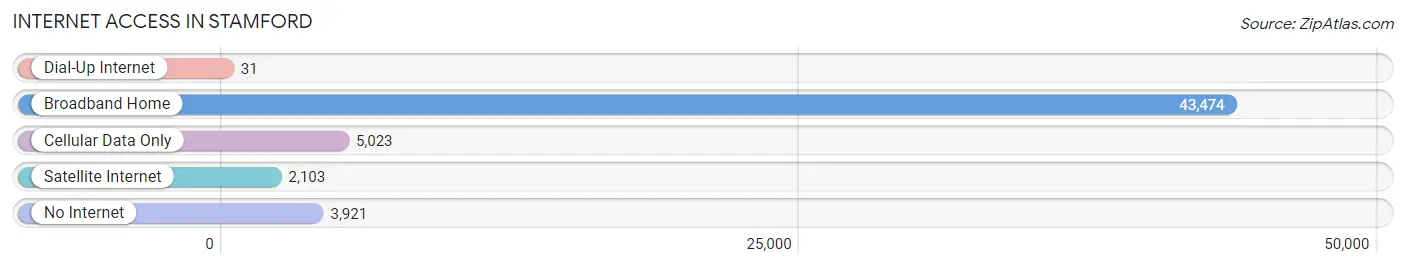
| Internet Type | # Households | % Households |
| Dial-Up Internet | 31 | 0.1% |
| Broadband Home | 43,474 | 81.2% |
| Cellular Data Only | 5,023 | 9.4% |
| Satellite Internet | 2,103 | 3.9% |
| No Internet | 3,921 | 7.3% |
| Total | 53,520 | 100.0% |
Stamford Summary
Stamford, Connecticut is a city located in Fairfield County, Connecticut, United States. It is the third-largest city in the state, with a population of 129,000 as of the 2010 census. Stamford is located in the southwestern corner of Connecticut, on the Long Island Sound, and is part of the New York metropolitan area.
History
Stamford was first settled in 1641 by a group of Puritans from Wethersfield, Connecticut. The town was named after a town in Lincolnshire, England. The town was incorporated in 1642 and was the first town in the Connecticut Colony to be chartered.
In the 19th century, Stamford was a major industrial center, with several factories and mills. The city was also a major transportation hub, with several railroads and a ferry service to New York City.
In the 20th century, Stamford experienced a period of rapid growth, becoming a major financial and corporate center. The city is now home to several Fortune 500 companies, including UBS, Pitney Bowes, and Starwood Hotels & Resorts.
Geography
Stamford is located in southwestern Connecticut, on the Long Island Sound. The city is bordered by the towns of Darien, New Canaan, Greenwich, and Norwalk. The city covers an area of 34.6 square miles, with a population density of 3,717 people per square mile.
The city is divided into several neighborhoods, including Downtown, Glenbrook, Springdale, Turn of River, and Waterside. The city is also home to several parks, including Cove Island Park, Cummings Park, and Scalzi Park.
Economy
Stamford is a major financial and corporate center, with several Fortune 500 companies located in the city. The city is home to UBS, Pitney Bowes, Starwood Hotels & Resorts, and Charter Communications.
The city is also home to several major medical centers, including Stamford Hospital, Stamford Health, and the Stamford Medical Center.
Demographics
As of the 2010 census, the population of Stamford was 129,000, with a population density of 3,717 people per square mile. The racial makeup of the city was 73.3% White, 11.3% African American, 0.3% Native American, 8.2% Asian, and 4.9% from other races.
The median household income in the city was $76,824, and the median family income was $90,917. The per capita income in the city was $41,845.
Stamford is home to a diverse population, with a large Hispanic population, as well as a large Asian population. The city is also home to a large Jewish population, with several synagogues located in the city.
Common Questions
What is Per Capita Income in Stamford?
Per Capita income in Stamford is $60,109.
What is the Median Family Income in Stamford?
Median Family Income in Stamford is $115,324.
What is the Median Household income in Stamford?
Median Household Income in Stamford is $100,718.
What is Income or Wage Gap in Stamford?
Income or Wage Gap in Stamford is 19.1%.
Women in Stamford earn 80.9 cents for every dollar earned by a man.
What is Family Income Deficit in Stamford?
Family Income Deficit in Stamford is $9,076.
Families that are below poverty line in Stamford earn $9,076 less on average than the poverty threshold level.
What is Inequality or Gini Index in Stamford?
Inequality or Gini Index in Stamford is 0.51.
What is the Total Population of Stamford?
Total Population of Stamford is 135,413.
What is the Total Male Population of Stamford?
Total Male Population of Stamford is 66,112.
What is the Total Female Population of Stamford?
Total Female Population of Stamford is 69,301.
What is the Ratio of Males per 100 Females in Stamford?
There are 95.40 Males per 100 Females in Stamford.
What is the Ratio of Females per 100 Males in Stamford?
There are 104.82 Females per 100 Males in Stamford.
What is the Median Population Age in Stamford?
Median Population Age in Stamford is 37.6 Years.
What is the Average Family Size in Stamford
Average Family Size in Stamford is 3.1 People.
What is the Average Household Size in Stamford
Average Household Size in Stamford is 2.5 People.
How Large is the Labor Force in Stamford?
There are 80,312 People in the Labor Forcein in Stamford.
What is the Percentage of People in the Labor Force in Stamford?
71.9% of People are in the Labor Force in Stamford.
What is the Unemployment Rate in Stamford?
Unemployment Rate in Stamford is 5.5%.