Indian Lake borough, PA Map & Demographics
Indian Lake borough Overview
$72,070
PER CAPITA INCOME
$141,750
AVG FAMILY INCOME
$112,917
AVG HOUSEHOLD INCOME
36.4%
WAGE / INCOME GAP [ % ]
63.6¢/ $1
WAGE / INCOME GAP [ $ ]
0.40
INEQUALITY / GINI INDEX
314
TOTAL POPULATION
180
MALE POPULATION
134
FEMALE POPULATION
134.33
MALES / 100 FEMALES
74.44
FEMALES / 100 MALES
60.5
MEDIAN AGE
2.2
AVG FAMILY SIZE
1.9
AVG HOUSEHOLD SIZE
184
LABOR FORCE [ PEOPLE ]
61.7%
PERCENT IN LABOR FORCE
3.3%
UNEMPLOYMENT RATE
Income in Indian Lake borough
Income Overview in Indian Lake borough
Per Capita Income in Indian Lake borough is $72,070, while median incomes of families and households are $141,750 and $112,917 respectively.
| Characteristic | Number | Measure |
| Per Capita Income | 314 | $72,070 |
| Median Family Income | 111 | $141,750 |
| Mean Family Income | 111 | $164,416 |
| Median Household Income | 165 | $112,917 |
| Mean Household Income | 165 | $135,693 |
| Income Deficit | 111 | $0 |
| Wage / Income Gap (%) | 314 | 36.36% |
| Wage / Income Gap ($) | 314 | 63.64¢ per $1 |
| Gini / Inequality Index | 314 | 0.40 |
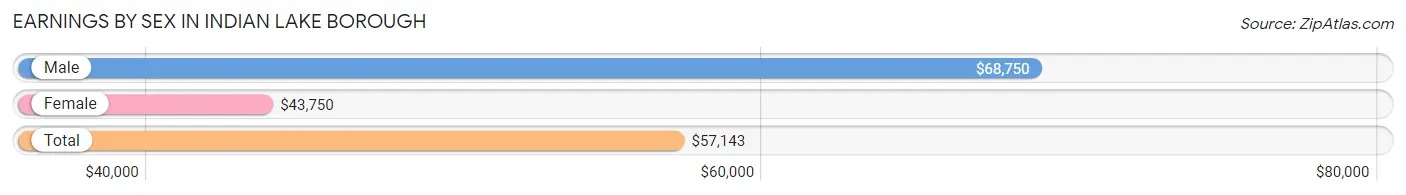
Earnings by Sex in Indian Lake borough
Average Earnings in Indian Lake borough are $57,143, $68,750 for men and $43,750 for women, a difference of 36.4%.
| Sex | Number | Average Earnings |
| Male | 114 (60.6%) | $68,750 |
| Female | 74 (39.4%) | $43,750 |
| Total | 188 (100.0%) | $57,143 |
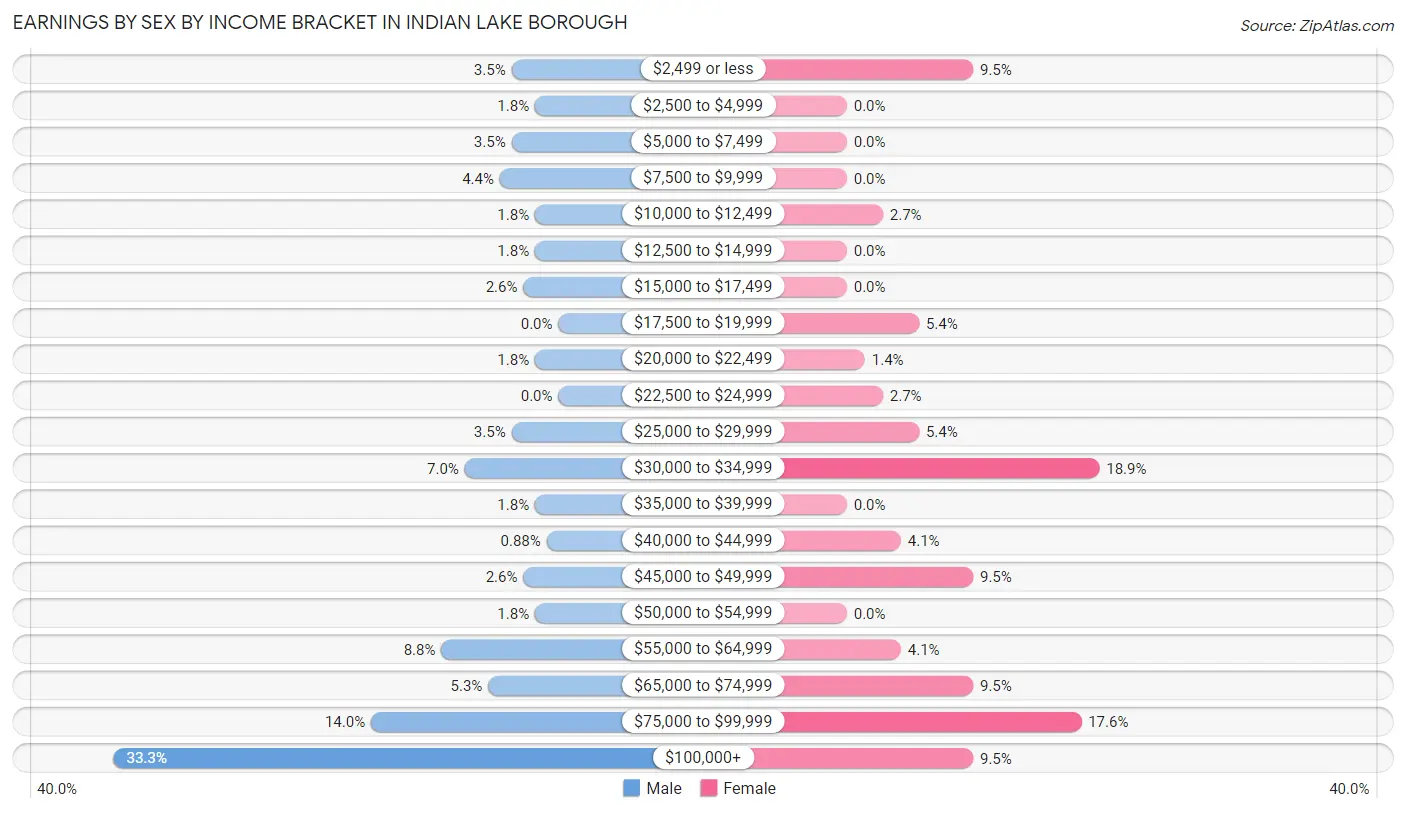
Earnings by Sex by Income Bracket in Indian Lake borough
The most common earnings brackets in Indian Lake borough are $100,000+ for men (38 | 33.3%) and $30,000 to $34,999 for women (14 | 18.9%).
| Income | Male | Female |
| $2,499 or less | 4 (3.5%) | 7 (9.5%) |
| $2,500 to $4,999 | 2 (1.8%) | 0 (0.0%) |
| $5,000 to $7,499 | 4 (3.5%) | 0 (0.0%) |
| $7,500 to $9,999 | 5 (4.4%) | 0 (0.0%) |
| $10,000 to $12,499 | 2 (1.8%) | 2 (2.7%) |
| $12,500 to $14,999 | 2 (1.8%) | 0 (0.0%) |
| $15,000 to $17,499 | 3 (2.6%) | 0 (0.0%) |
| $17,500 to $19,999 | 0 (0.0%) | 4 (5.4%) |
| $20,000 to $22,499 | 2 (1.8%) | 1 (1.3%) |
| $22,500 to $24,999 | 0 (0.0%) | 2 (2.7%) |
| $25,000 to $29,999 | 4 (3.5%) | 4 (5.4%) |
| $30,000 to $34,999 | 8 (7.0%) | 14 (18.9%) |
| $35,000 to $39,999 | 2 (1.8%) | 0 (0.0%) |
| $40,000 to $44,999 | 1 (0.9%) | 3 (4.1%) |
| $45,000 to $49,999 | 3 (2.6%) | 7 (9.5%) |
| $50,000 to $54,999 | 2 (1.8%) | 0 (0.0%) |
| $55,000 to $64,999 | 10 (8.8%) | 3 (4.1%) |
| $65,000 to $74,999 | 6 (5.3%) | 7 (9.5%) |
| $75,000 to $99,999 | 16 (14.0%) | 13 (17.6%) |
| $100,000+ | 38 (33.3%) | 7 (9.5%) |
| Total | 114 (100.0%) | 74 (100.0%) |
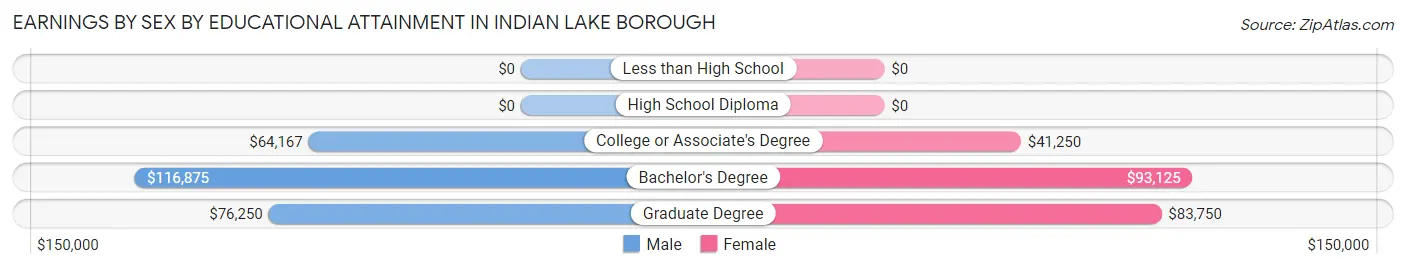
Earnings by Sex by Educational Attainment in Indian Lake borough
Average earnings in Indian Lake borough are $77,500 for men and $47,188 for women, a difference of 39.1%. Men with an educational attainment of bachelor's degree enjoy the highest average annual earnings of $116,875, while those with college or associate's degree education earn the least with $64,167. Women with an educational attainment of bachelor's degree earn the most with the average annual earnings of $93,125, while those with college or associate's degree education have the smallest earnings of $41,250.
| Educational Attainment | Male Income | Female Income |
| Less than High School | - | - |
| High School Diploma | - | - |
| College or Associate's Degree | $64,167 | $41,250 |
| Bachelor's Degree | $116,875 | $93,125 |
| Graduate Degree | $76,250 | $83,750 |
| Total | $77,500 | $47,188 |
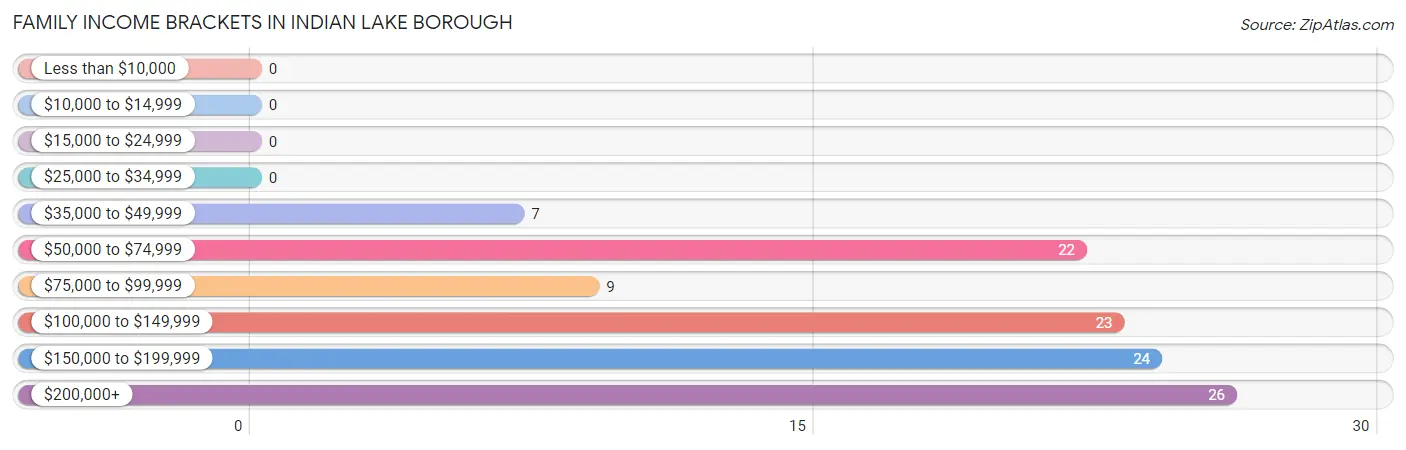
Family Income in Indian Lake borough
Family Income Brackets in Indian Lake borough
According to the Indian Lake borough family income data, there are 26 families falling into the $200,000+ income range, which is the most common income bracket and makes up 23.4% of all families.
| Income Bracket | # Families | % Families |
| Less than $10,000 | 0 | 0.0% |
| $10,000 to $14,999 | 0 | 0.0% |
| $15,000 to $24,999 | 0 | 0.0% |
| $25,000 to $34,999 | 0 | 0.0% |
| $35,000 to $49,999 | 7 | 6.3% |
| $50,000 to $74,999 | 22 | 19.8% |
| $75,000 to $99,999 | 9 | 8.1% |
| $100,000 to $149,999 | 23 | 20.7% |
| $150,000 to $199,999 | 24 | 21.6% |
| $200,000+ | 26 | 23.4% |
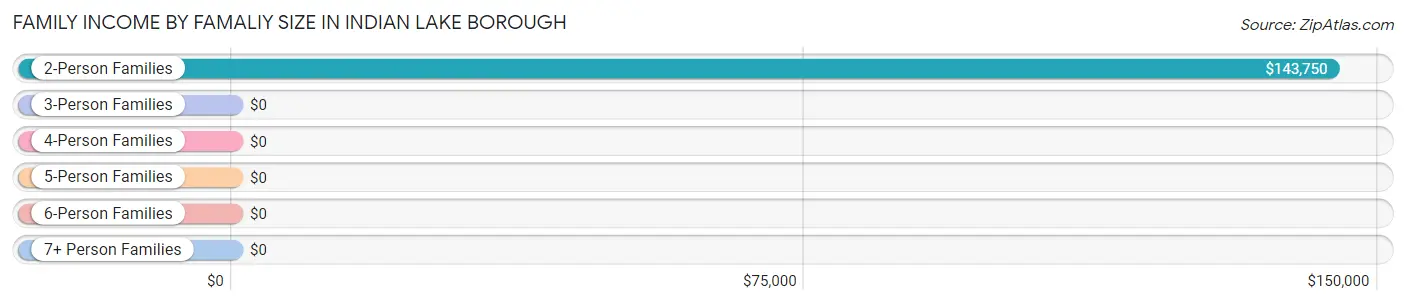
Family Income by Famaliy Size in Indian Lake borough
2-person families (86 | 77.5%) account for the highest median family income in Indian Lake borough with $143,750 per family, while 2-person families (86 | 77.5%) have the highest median income of $71,875 per family member.
| Income Bracket | # Families | Median Income |
| 2-Person Families | 86 (77.5%) | $143,750 |
| 3-Person Families | 23 (20.7%) | $0 |
| 4-Person Families | 2 (1.8%) | $0 |
| 5-Person Families | 0 (0.0%) | $0 |
| 6-Person Families | 0 (0.0%) | $0 |
| 7+ Person Families | 0 (0.0%) | $0 |
| Total | 111 (100.0%) | $141,750 |
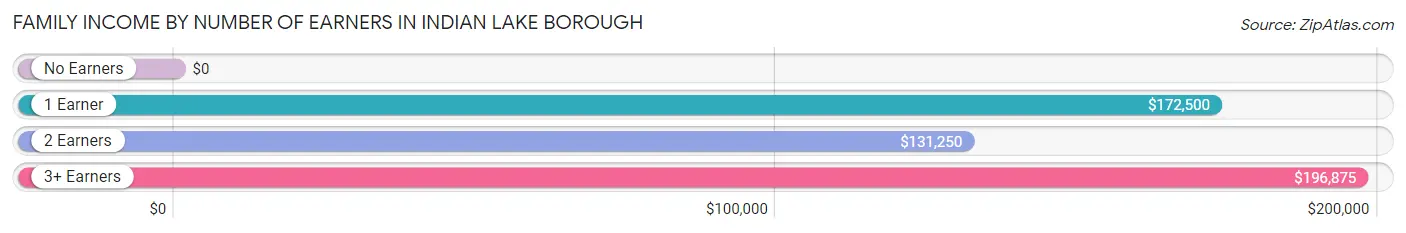
Family Income by Number of Earners in Indian Lake borough
| Number of Earners | # Families | Median Income |
| No Earners | 30 (27.0%) | $0 |
| 1 Earner | 18 (16.2%) | $172,500 |
| 2 Earners | 56 (50.4%) | $131,250 |
| 3+ Earners | 7 (6.3%) | $196,875 |
| Total | 111 (100.0%) | $141,750 |
Household Income in Indian Lake borough
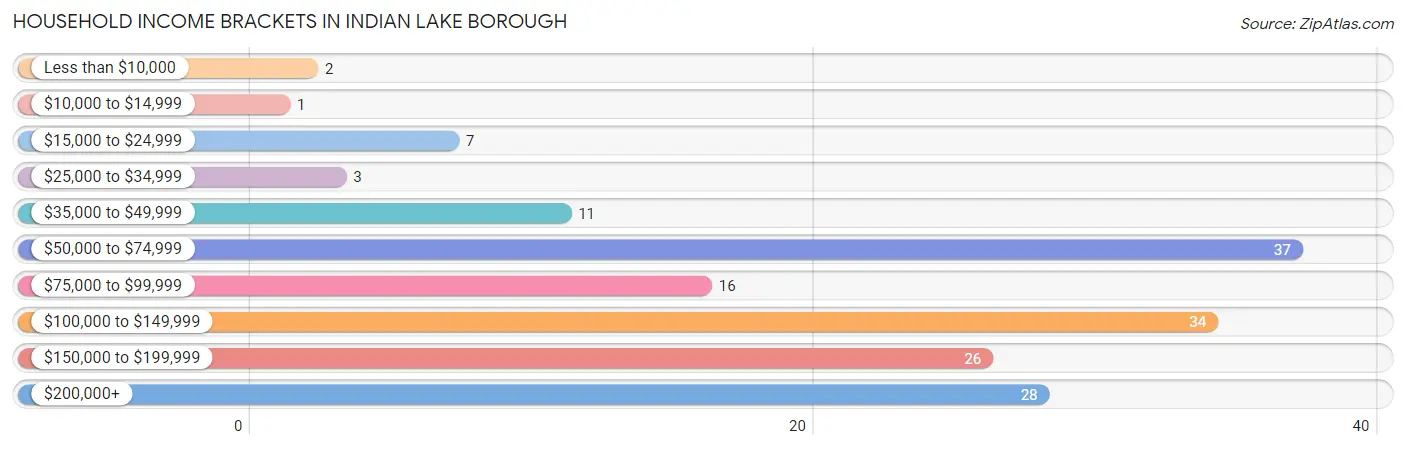
Household Income Brackets in Indian Lake borough
With 37 households falling in the category, the $50,000 to $74,999 income range is the most frequent in Indian Lake borough, accounting for 22.4% of all households. In contrast, only 1 households (0.6%) fall into the $10,000 to $14,999 income bracket, making it the least populous group.
| Income Bracket | # Households | % Households |
| Less than $10,000 | 2 | 1.2% |
| $10,000 to $14,999 | 1 | 0.6% |
| $15,000 to $24,999 | 7 | 4.2% |
| $25,000 to $34,999 | 3 | 1.8% |
| $35,000 to $49,999 | 11 | 6.7% |
| $50,000 to $74,999 | 37 | 22.4% |
| $75,000 to $99,999 | 16 | 9.7% |
| $100,000 to $149,999 | 34 | 20.6% |
| $150,000 to $199,999 | 26 | 15.8% |
| $200,000+ | 28 | 17.0% |
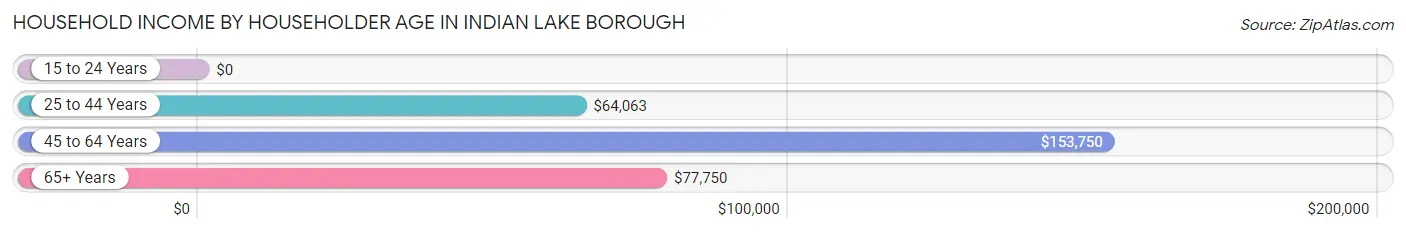
Household Income by Householder Age in Indian Lake borough
The median household income in Indian Lake borough is $112,917, with the highest median household income of $153,750 found in the 45 to 64 years age bracket for the primary householder. A total of 76 households (46.1%) fall into this category. Meanwhile, the 15 to 24 years age bracket for the primary householder has the lowest median household income of $0, with 3 households (1.8%) in this group.
| Income Bracket | # Households | Median Income |
| 15 to 24 Years | 3 (1.8%) | $0 |
| 25 to 44 Years | 19 (11.5%) | $64,063 |
| 45 to 64 Years | 76 (46.1%) | $153,750 |
| 65+ Years | 67 (40.6%) | $77,750 |
| Total | 165 (100.0%) | $112,917 |
Poverty in Indian Lake borough
Income Below Poverty by Sex and Age in Indian Lake borough
With 2.8% poverty level for males and 3.0% for females among the residents of Indian Lake borough, 18 to 24 year old males and 55 to 64 year old females are the most vulnerable to poverty, with 2 males (12.5%) and 4 females (9.1%) in their respective age groups living below the poverty level.
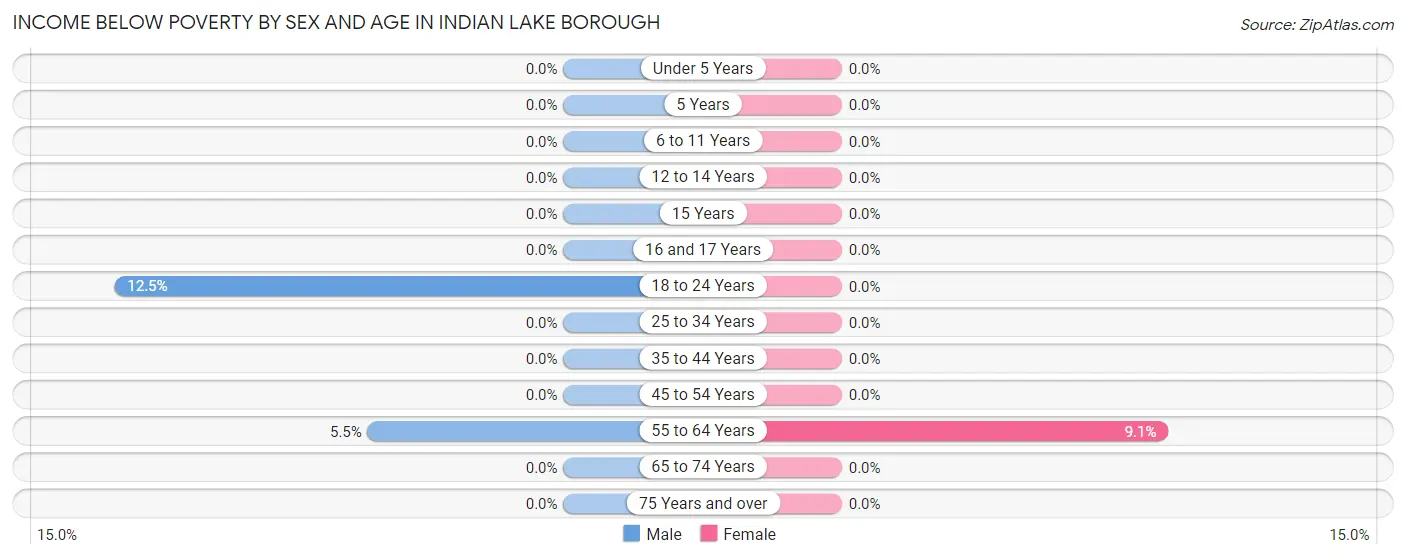
| Age Bracket | Male | Female |
| Under 5 Years | 0 (0.0%) | 0 (0.0%) |
| 5 Years | 0 (0.0%) | 0 (0.0%) |
| 6 to 11 Years | 0 (0.0%) | 0 (0.0%) |
| 12 to 14 Years | 0 (0.0%) | 0 (0.0%) |
| 15 Years | 0 (0.0%) | 0 (0.0%) |
| 16 and 17 Years | 0 (0.0%) | 0 (0.0%) |
| 18 to 24 Years | 2 (12.5%) | 0 (0.0%) |
| 25 to 34 Years | 0 (0.0%) | 0 (0.0%) |
| 35 to 44 Years | 0 (0.0%) | 0 (0.0%) |
| 45 to 54 Years | 0 (0.0%) | 0 (0.0%) |
| 55 to 64 Years | 3 (5.4%) | 4 (9.1%) |
| 65 to 74 Years | 0 (0.0%) | 0 (0.0%) |
| 75 Years and over | 0 (0.0%) | 0 (0.0%) |
| Total | 5 (2.8%) | 4 (3.0%) |
Income Above Poverty by Sex and Age in Indian Lake borough
According to the poverty statistics in Indian Lake borough, males aged under 5 years and females aged 18 to 24 years are the age groups that are most secure financially, with 100.0% of males and 100.0% of females in these age groups living above the poverty line.
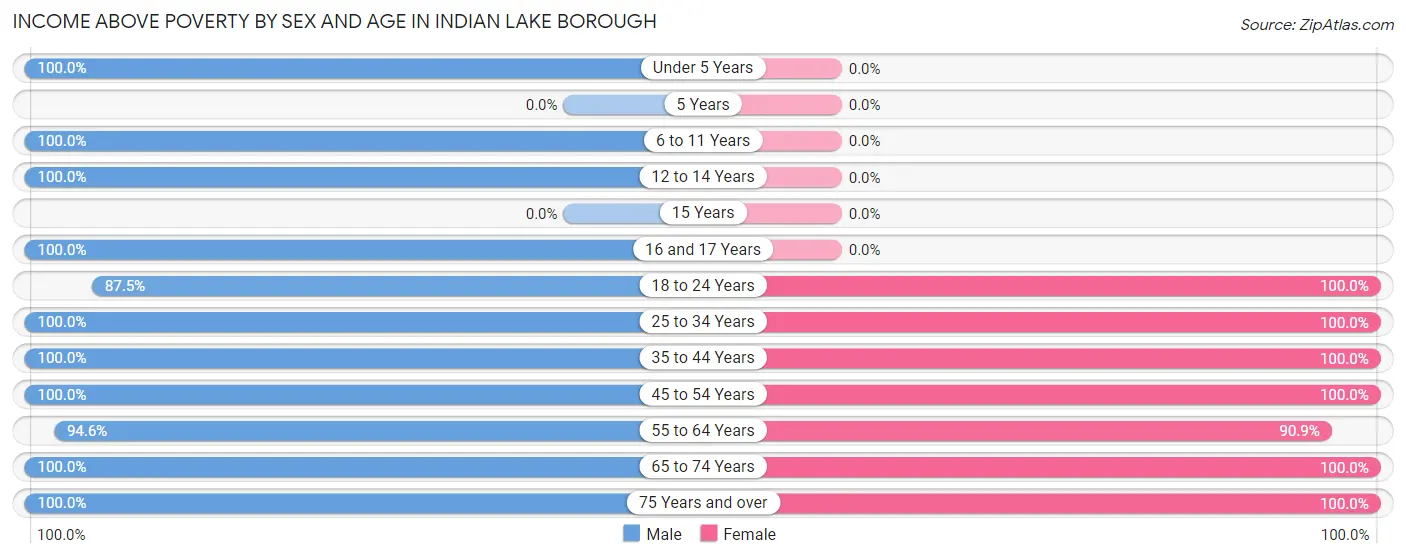
| Age Bracket | Male | Female |
| Under 5 Years | 10 (100.0%) | 0 (0.0%) |
| 5 Years | 0 (0.0%) | 0 (0.0%) |
| 6 to 11 Years | 3 (100.0%) | 0 (0.0%) |
| 12 to 14 Years | 3 (100.0%) | 0 (0.0%) |
| 15 Years | 0 (0.0%) | 0 (0.0%) |
| 16 and 17 Years | 2 (100.0%) | 0 (0.0%) |
| 18 to 24 Years | 14 (87.5%) | 7 (100.0%) |
| 25 to 34 Years | 10 (100.0%) | 14 (100.0%) |
| 35 to 44 Years | 5 (100.0%) | 2 (100.0%) |
| 45 to 54 Years | 16 (100.0%) | 13 (100.0%) |
| 55 to 64 Years | 52 (94.6%) | 40 (90.9%) |
| 65 to 74 Years | 44 (100.0%) | 39 (100.0%) |
| 75 Years and over | 16 (100.0%) | 15 (100.0%) |
| Total | 175 (97.2%) | 130 (97.0%) |
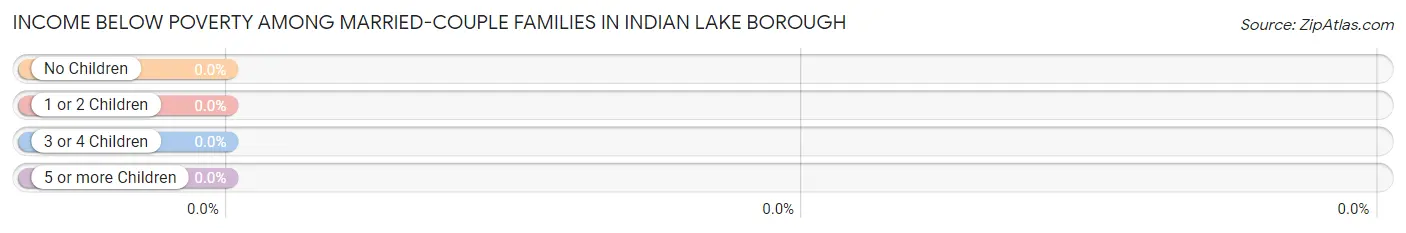
Income Below Poverty Among Married-Couple Families in Indian Lake borough
| Children | Above Poverty | Below Poverty |
| No Children | 88 (100.0%) | 0 (0.0%) |
| 1 or 2 Children | 20 (100.0%) | 0 (0.0%) |
| 3 or 4 Children | 0 (0.0%) | 0 (0.0%) |
| 5 or more Children | 0 (0.0%) | 0 (0.0%) |
| Total | 108 (100.0%) | 0 (0.0%) |
Income Below Poverty Among Single-Parent Households in Indian Lake borough
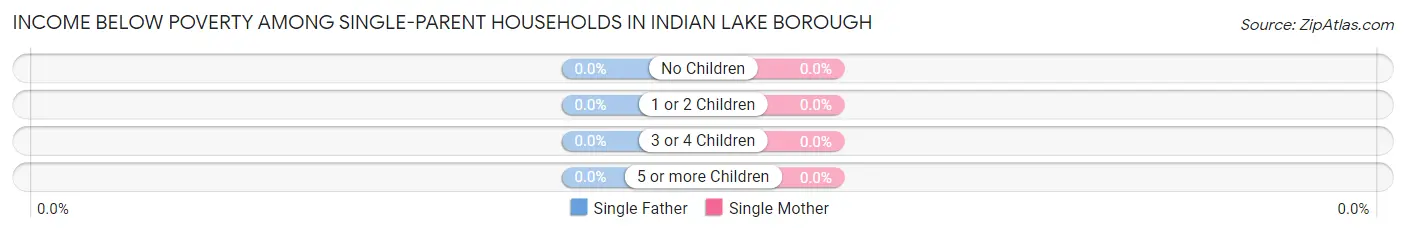
| Children | Single Father | Single Mother |
| No Children | 0 (0.0%) | 0 (0.0%) |
| 1 or 2 Children | 0 (0.0%) | 0 (0.0%) |
| 3 or 4 Children | 0 (0.0%) | 0 (0.0%) |
| 5 or more Children | 0 (0.0%) | 0 (0.0%) |
| Total | 0 (0.0%) | 0 (0.0%) |
Income Below Poverty Among Married-Couple vs Single-Parent Households in Indian Lake borough
| Children | Married-Couple Families | Single-Parent Households |
| No Children | 0 (0.0%) | 0 (0.0%) |
| 1 or 2 Children | 0 (0.0%) | 0 (0.0%) |
| 3 or 4 Children | 0 (0.0%) | 0 (0.0%) |
| 5 or more Children | 0 (0.0%) | 0 (0.0%) |
| Total | 0 (0.0%) | 0 (0.0%) |
Race in Indian Lake borough
The most populous races in Indian Lake borough are White / Caucasian (305 | 97.1%), Some other Race (6 | 1.9%), and Two or more Races (3 | 1.0%).
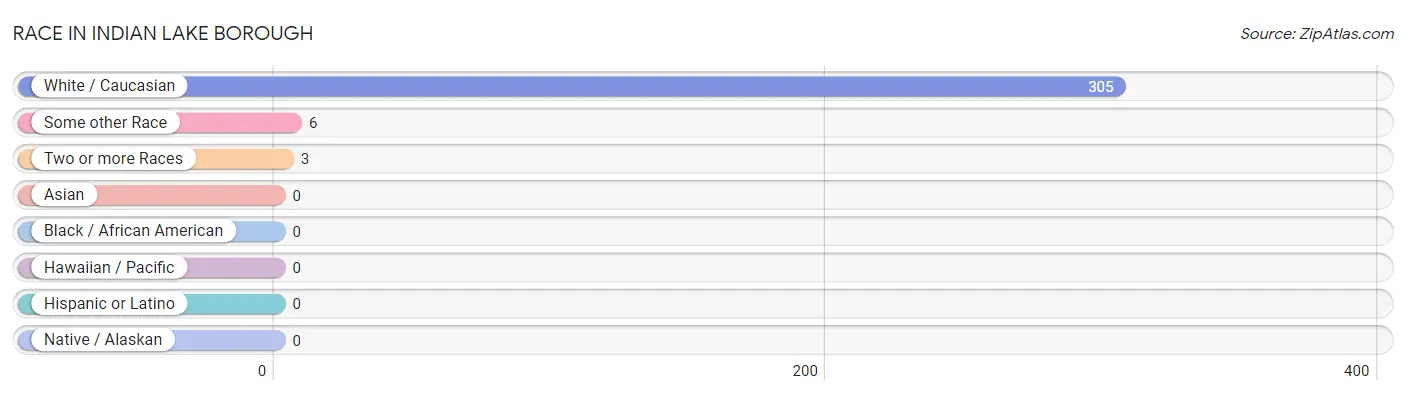
| Race | # Population | % Population |
| Asian | 0 | 0.0% |
| Black / African American | 0 | 0.0% |
| Hawaiian / Pacific | 0 | 0.0% |
| Hispanic or Latino | 0 | 0.0% |
| Native / Alaskan | 0 | 0.0% |
| White / Caucasian | 305 | 97.1% |
| Two or more Races | 3 | 1.0% |
| Some other Race | 6 | 1.9% |
| Total | 314 | 100.0% |
Ancestry in Indian Lake borough
The most populous ancestries reported in Indian Lake borough are German (120 | 38.2%), Irish (46 | 14.6%), English (37 | 11.8%), American (31 | 9.9%), and Italian (15 | 4.8%), together accounting for 79.3% of all Indian Lake borough residents.
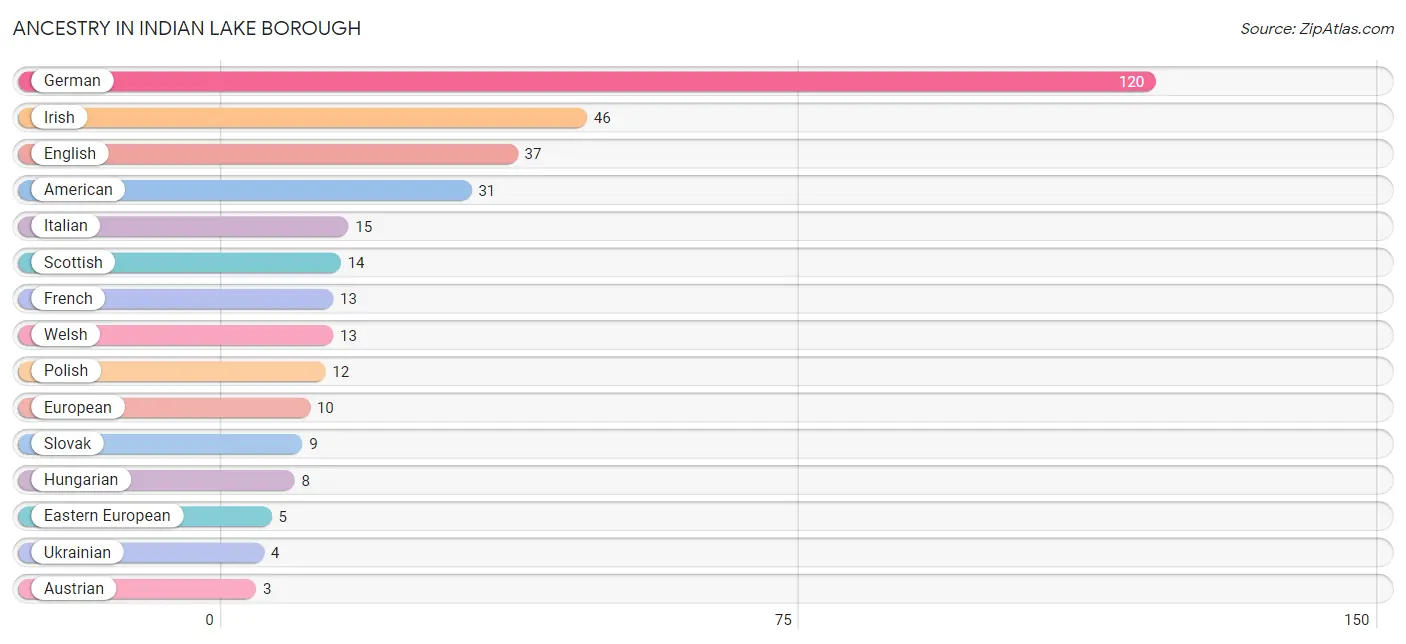
| Ancestry | # Population | % Population |
| American | 31 | 9.9% |
| Austrian | 3 | 1.0% |
| Croatian | 2 | 0.6% |
| Danish | 2 | 0.6% |
| Eastern European | 5 | 1.6% |
| English | 37 | 11.8% |
| European | 10 | 3.2% |
| French | 13 | 4.1% |
| German | 120 | 38.2% |
| Hungarian | 8 | 2.5% |
| Irish | 46 | 14.6% |
| Italian | 15 | 4.8% |
| Norwegian | 3 | 1.0% |
| Pennsylvania German | 2 | 0.6% |
| Polish | 12 | 3.8% |
| Russian | 2 | 0.6% |
| Scotch-Irish | 2 | 0.6% |
| Scottish | 14 | 4.5% |
| Slavic | 2 | 0.6% |
| Slovak | 9 | 2.9% |
| Swedish | 2 | 0.6% |
| Ukrainian | 4 | 1.3% |
| Welsh | 13 | 4.1% | View All 23 Rows |
Immigrants in Indian Lake borough
The most numerous immigrant groups reported in Indian Lake borough came from Canada (2 | 0.6%), Europe (2 | 0.6%), Germany (2 | 0.6%), and Western Europe (2 | 0.6%), together accounting for 2.6% of all Indian Lake borough residents.
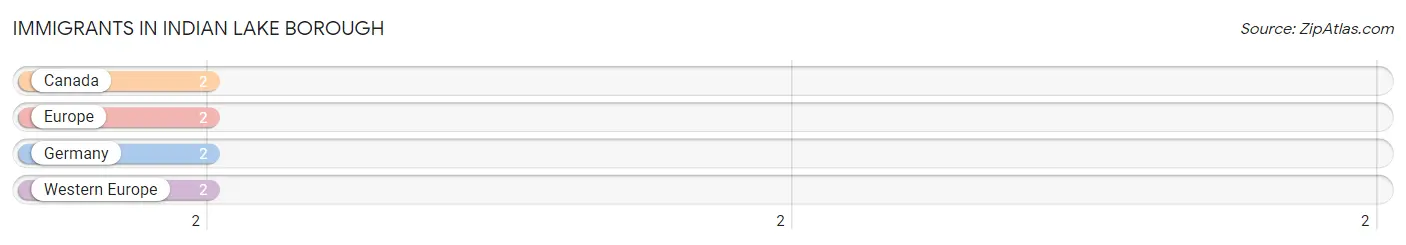
| Immigration Origin | # Population | % Population |
| Canada | 2 | 0.6% |
| Europe | 2 | 0.6% |
| Germany | 2 | 0.6% |
| Western Europe | 2 | 0.6% | View All 4 Rows |
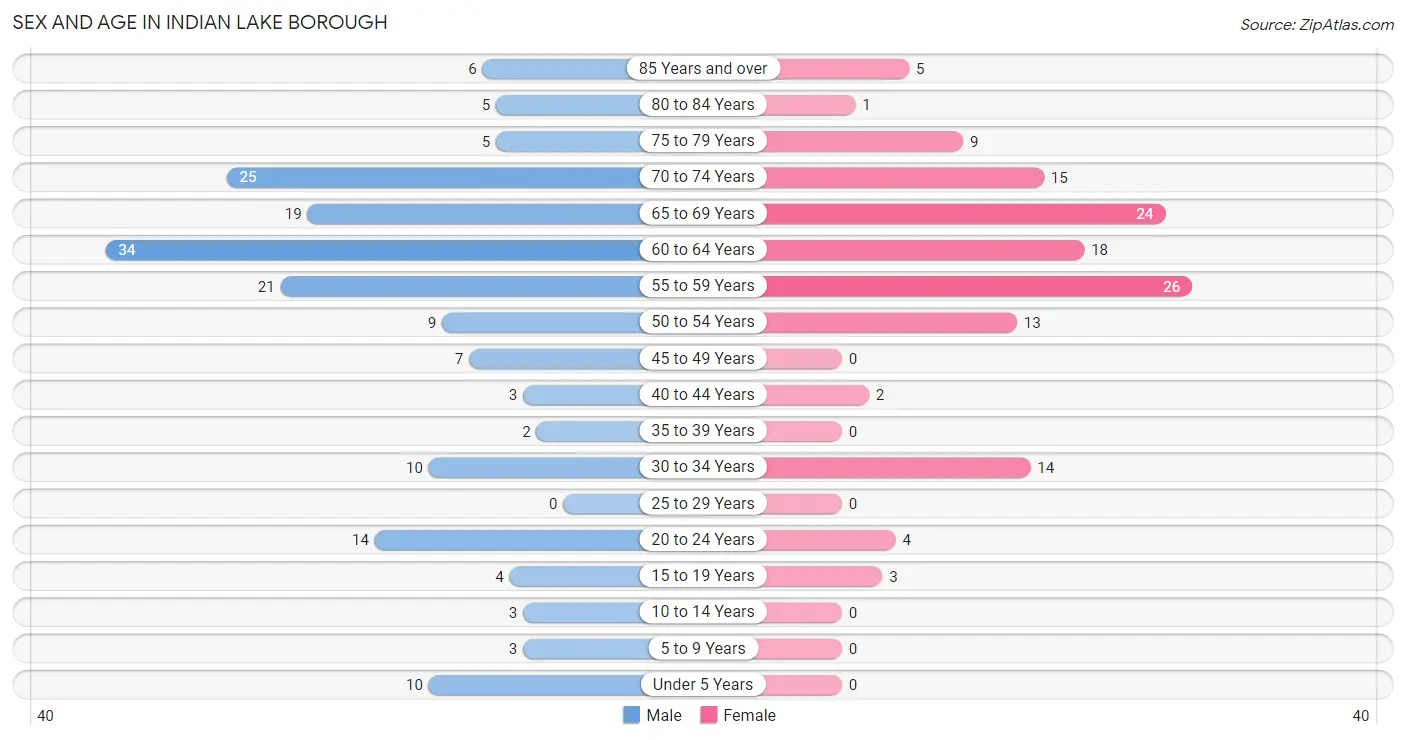
Sex and Age in Indian Lake borough
Sex and Age in Indian Lake borough
The most populous age groups in Indian Lake borough are 60 to 64 Years (34 | 18.9%) for men and 55 to 59 Years (26 | 19.4%) for women.
| Age Bracket | Male | Female |
| Under 5 Years | 10 (5.6%) | 0 (0.0%) |
| 5 to 9 Years | 3 (1.7%) | 0 (0.0%) |
| 10 to 14 Years | 3 (1.7%) | 0 (0.0%) |
| 15 to 19 Years | 4 (2.2%) | 3 (2.2%) |
| 20 to 24 Years | 14 (7.8%) | 4 (3.0%) |
| 25 to 29 Years | 0 (0.0%) | 0 (0.0%) |
| 30 to 34 Years | 10 (5.6%) | 14 (10.4%) |
| 35 to 39 Years | 2 (1.1%) | 0 (0.0%) |
| 40 to 44 Years | 3 (1.7%) | 2 (1.5%) |
| 45 to 49 Years | 7 (3.9%) | 0 (0.0%) |
| 50 to 54 Years | 9 (5.0%) | 13 (9.7%) |
| 55 to 59 Years | 21 (11.7%) | 26 (19.4%) |
| 60 to 64 Years | 34 (18.9%) | 18 (13.4%) |
| 65 to 69 Years | 19 (10.6%) | 24 (17.9%) |
| 70 to 74 Years | 25 (13.9%) | 15 (11.2%) |
| 75 to 79 Years | 5 (2.8%) | 9 (6.7%) |
| 80 to 84 Years | 5 (2.8%) | 1 (0.7%) |
| 85 Years and over | 6 (3.3%) | 5 (3.7%) |
| Total | 180 (100.0%) | 134 (100.0%) |
Families and Households in Indian Lake borough
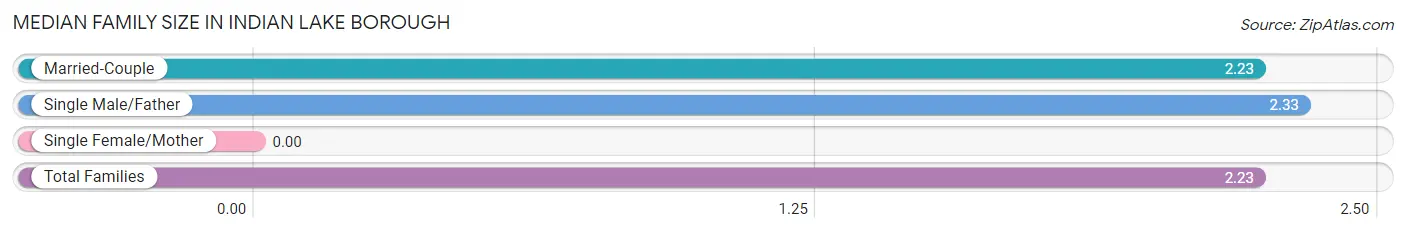
Median Family Size in Indian Lake borough
| Family Type | # Families | Family Size |
| Married-Couple | 108 (97.3%) | 2.23 |
| Single Male/Father | 3 (2.7%) | 2.33 |
| Single Female/Mother | 0 (0.0%) | - |
| Total Families | 111 (100.0%) | 2.23 |
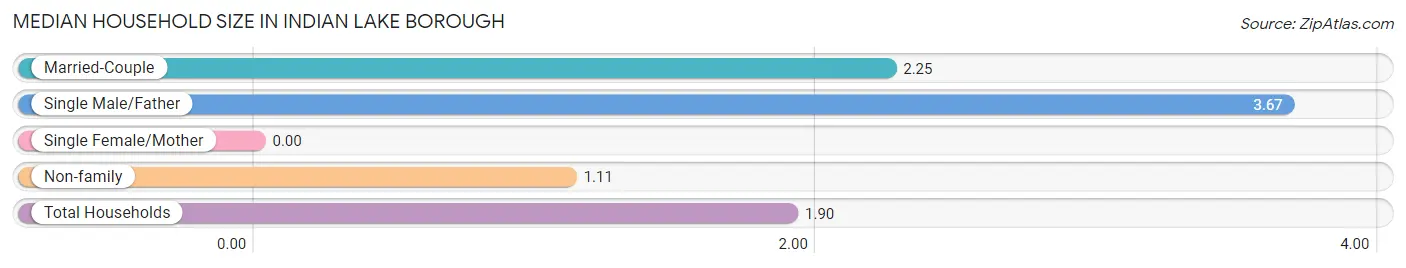
Median Household Size in Indian Lake borough
| Household Type | # Households | Household Size |
| Married-Couple | 108 (65.4%) | 2.25 |
| Single Male/Father | 3 (1.8%) | 3.67 |
| Single Female/Mother | 0 (0.0%) | - |
| Non-family | 54 (32.7%) | 1.11 |
| Total Households | 165 (100.0%) | 1.90 |
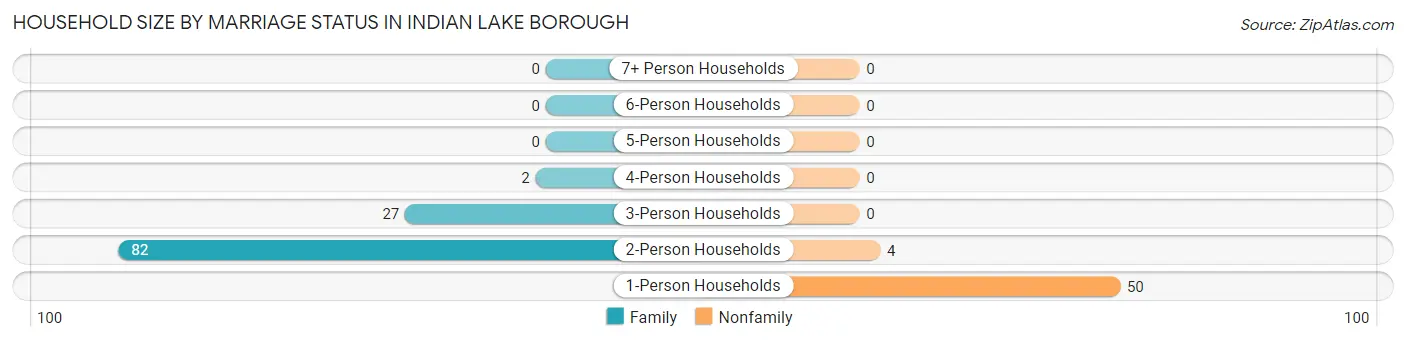
Household Size by Marriage Status in Indian Lake borough
Out of a total of 165 households in Indian Lake borough, 111 (67.3%) are family households, while 54 (32.7%) are nonfamily households. The most numerous type of family households are 2-person households, comprising 82, and the most common type of nonfamily households are 1-person households, comprising 50.
| Household Size | Family Households | Nonfamily Households |
| 1-Person Households | - | 50 (30.3%) |
| 2-Person Households | 82 (49.7%) | 4 (2.4%) |
| 3-Person Households | 27 (16.4%) | 0 (0.0%) |
| 4-Person Households | 2 (1.2%) | 0 (0.0%) |
| 5-Person Households | 0 (0.0%) | 0 (0.0%) |
| 6-Person Households | 0 (0.0%) | 0 (0.0%) |
| 7+ Person Households | 0 (0.0%) | 0 (0.0%) |
| Total | 111 (67.3%) | 54 (32.7%) |
Female Fertility in Indian Lake borough
Fertility by Age in Indian Lake borough
Average fertility rate in Indian Lake borough is 130.0 births per 1,000 women. Women in the age bracket of 15 to 19 years have the highest fertility rate with 1,000.0 births per 1,000 women. Women in the age bracket of 15 to 19 years acount for 100.0% of all women with births.
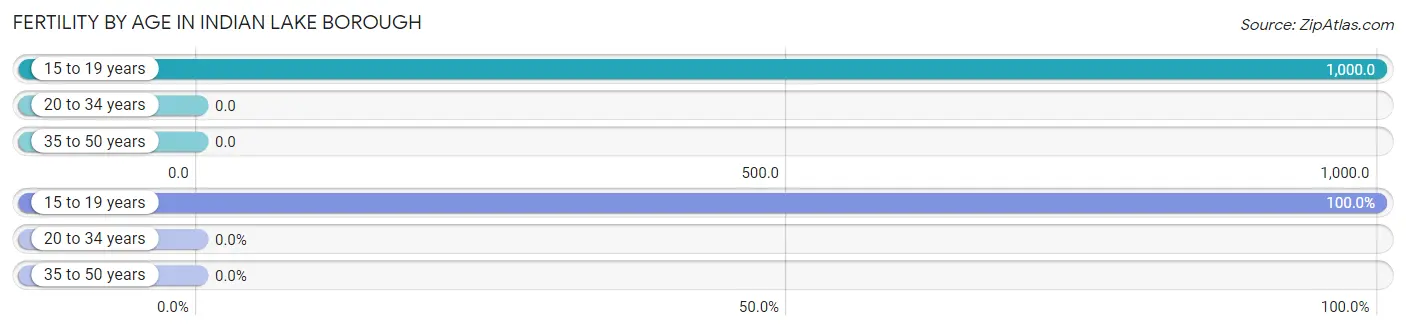
| Age Bracket | Women with Births | Births / 1,000 Women |
| 15 to 19 years | 3 (100.0%) | 1,000.0 |
| 20 to 34 years | 0 (0.0%) | 0.0 |
| 35 to 50 years | 0 (0.0%) | 0.0 |
| Total | 3 (100.0%) | 130.0 |
Fertility by Age by Marriage Status in Indian Lake borough
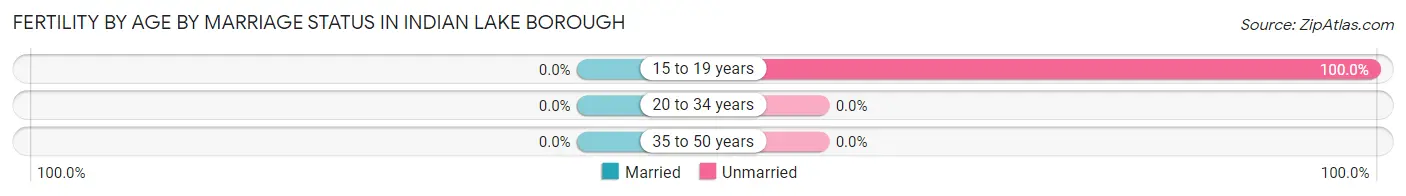
| Age Bracket | Married | Unmarried |
| 15 to 19 years | 0 (0.0%) | 3 (100.0%) |
| 20 to 34 years | 0 (0.0%) | 0 (0.0%) |
| 35 to 50 years | 0 (0.0%) | 0 (0.0%) |
| Total | 0 (0.0%) | 3 (100.0%) |
Fertility by Education in Indian Lake borough
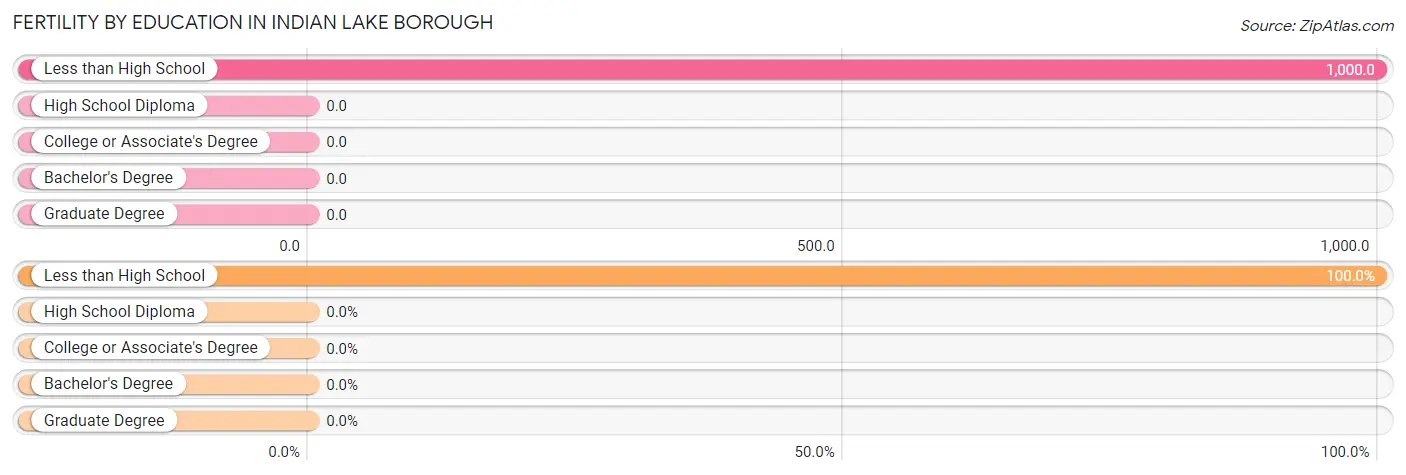
| Educational Attainment | Women with Births | Births / 1,000 Women |
| Less than High School | 3 (100.0%) | 1,000.0 |
| High School Diploma | 0 (0.0%) | 0.0 |
| College or Associate's Degree | 0 (0.0%) | 0.0 |
| Bachelor's Degree | 0 (0.0%) | 0.0 |
| Graduate Degree | 0 (0.0%) | 0.0 |
| Total | 3 (100.0%) | 130.0 |
Fertility by Education by Marriage Status in Indian Lake borough
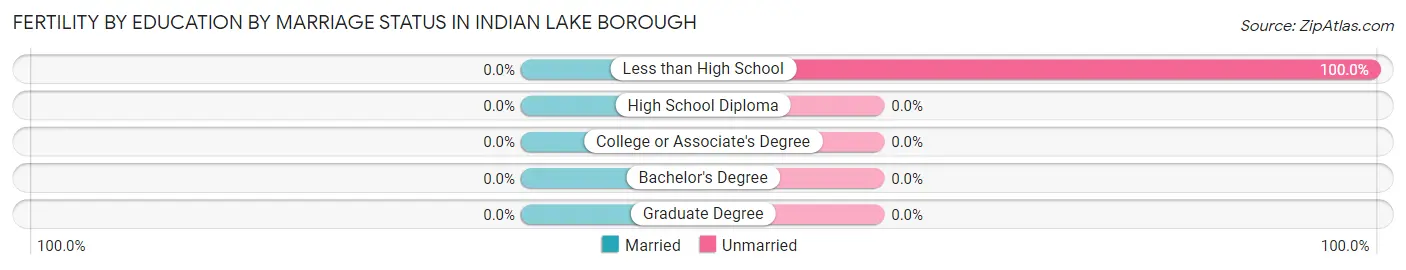
| Educational Attainment | Married | Unmarried |
| Less than High School | 0 (0.0%) | 3 (100.0%) |
| High School Diploma | 0 (0.0%) | 0 (0.0%) |
| College or Associate's Degree | 0 (0.0%) | 0 (0.0%) |
| Bachelor's Degree | 0 (0.0%) | 0 (0.0%) |
| Graduate Degree | 0 (0.0%) | 0 (0.0%) |
| Total | 0 (0.0%) | 3 (100.0%) |
Employment Characteristics in Indian Lake borough
Employment by Class of Employer in Indian Lake borough
Among the 178 employed individuals in Indian Lake borough, private company employees (109 | 61.2%), self-employed (incorporated) (24 | 13.5%), and self-employed (not incorporated) (14 | 7.9%) make up the most common classes of employment.
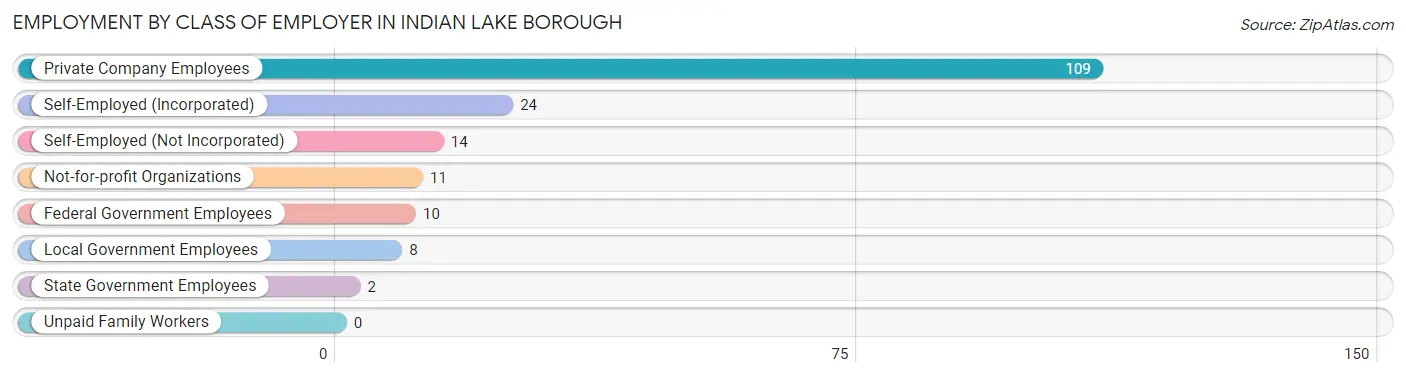
| Employer Class | # Employees | % Employees |
| Private Company Employees | 109 | 61.2% |
| Self-Employed (Incorporated) | 24 | 13.5% |
| Self-Employed (Not Incorporated) | 14 | 7.9% |
| Not-for-profit Organizations | 11 | 6.2% |
| Local Government Employees | 8 | 4.5% |
| State Government Employees | 2 | 1.1% |
| Federal Government Employees | 10 | 5.6% |
| Unpaid Family Workers | 0 | 0.0% |
| Total | 178 | 100.0% |
Employment Status by Age in Indian Lake borough
According to the labor force statistics for Indian Lake borough, out of the total population over 16 years of age (298), 61.7% or 184 individuals are in the labor force, with 3.3% or 6 of them unemployed. The age group with the highest labor force participation rate is 20 to 24 years, with 100.0% or 18 individuals in the labor force. Within the labor force, the 55 to 59 years age range has the highest percentage of unemployed individuals, with 13.2% or 5 of them being unemployed.
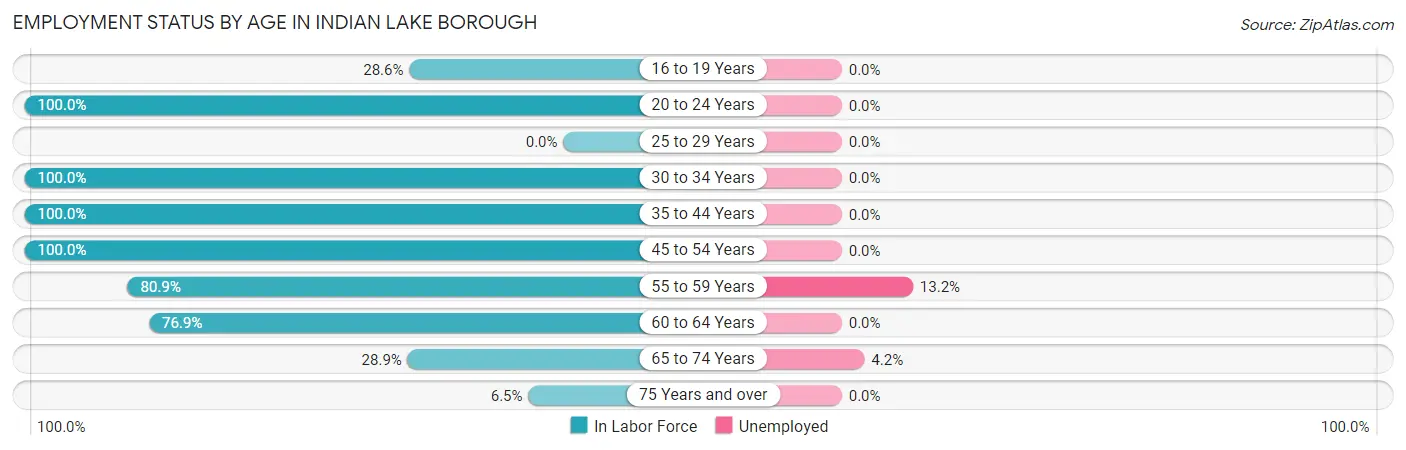
| Age Bracket | In Labor Force | Unemployed |
| 16 to 19 Years | 2 (28.6%) | 0 (0.0%) |
| 20 to 24 Years | 18 (100.0%) | 0 (0.0%) |
| 25 to 29 Years | 0 (0.0%) | 0 (0.0%) |
| 30 to 34 Years | 24 (100.0%) | 0 (0.0%) |
| 35 to 44 Years | 7 (100.0%) | 0 (0.0%) |
| 45 to 54 Years | 29 (100.0%) | 0 (0.0%) |
| 55 to 59 Years | 38 (80.9%) | 5 (13.2%) |
| 60 to 64 Years | 40 (76.9%) | 0 (0.0%) |
| 65 to 74 Years | 24 (28.9%) | 1 (4.2%) |
| 75 Years and over | 2 (6.5%) | 0 (0.0%) |
| Total | 184 (61.7%) | 6 (3.3%) |
Employment Status by Educational Attainment in Indian Lake borough
According to labor force statistics for Indian Lake borough, 86.8% of individuals (138) out of the total population between 25 and 64 years of age (159) are in the labor force, with 3.7% or 5 of them being unemployed. The group with the highest labor force participation rate are those with the educational attainment of less than high school, with 100.0% or 2 individuals in the labor force. Within the labor force, individuals with bachelor's degree or higher education have the highest percentage of unemployment, with 8.9% or 5 of them being unemployed.
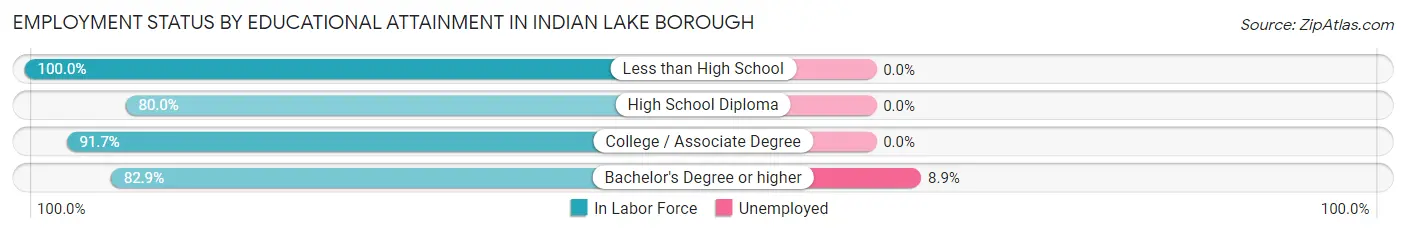
| Educational Attainment | In Labor Force | Unemployed |
| Less than High School | 2 (100.0%) | 0 (0.0%) |
| High School Diploma | 12 (80.0%) | 0 (0.0%) |
| College / Associate Degree | 66 (91.7%) | 0 (0.0%) |
| Bachelor's Degree or higher | 58 (82.9%) | 6 (8.9%) |
| Total | 138 (86.8%) | 6 (3.7%) |
Employment Occupations by Sex in Indian Lake borough
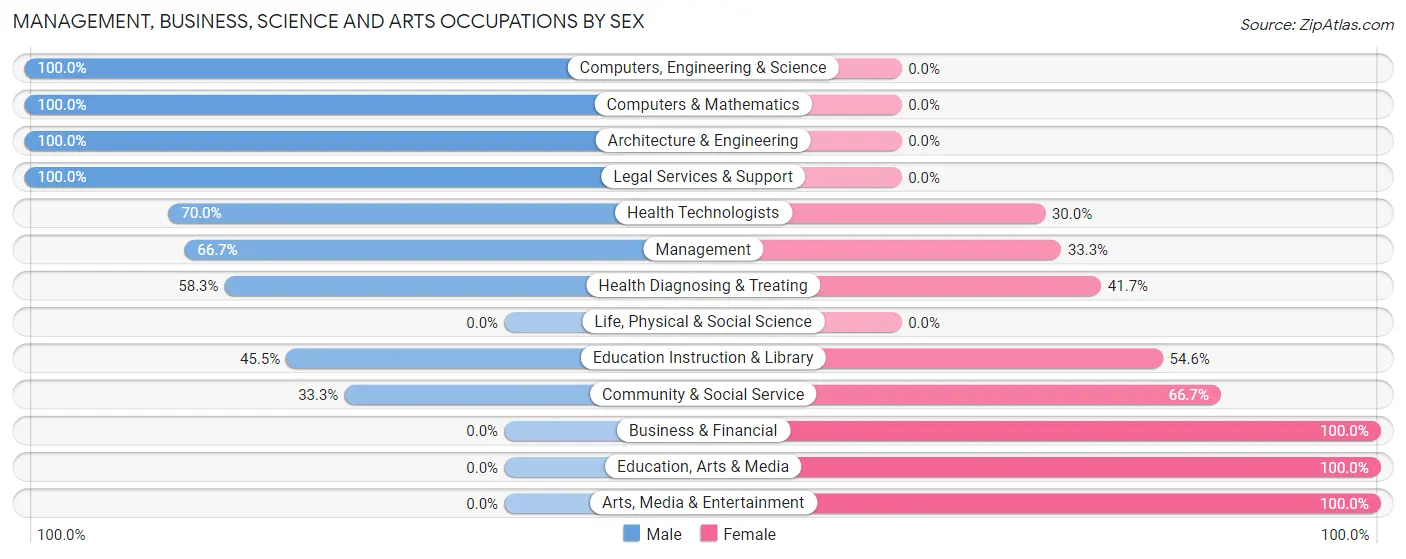
Management, Business, Science and Arts Occupations
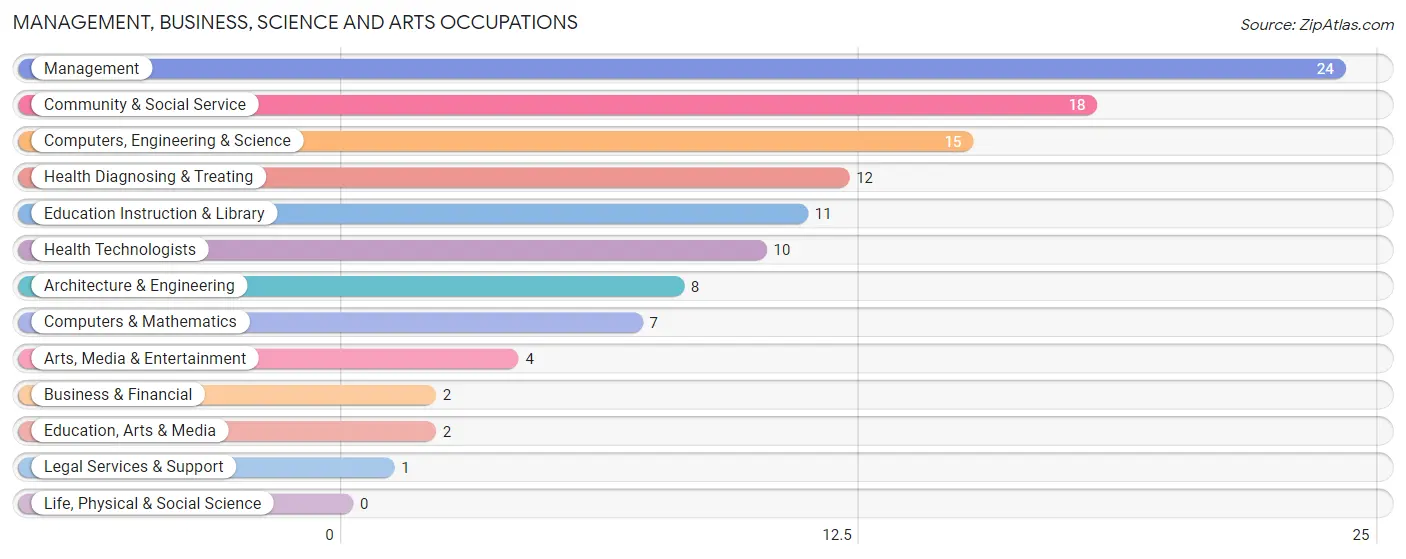
The most common Management, Business, Science and Arts occupations in Indian Lake borough are Management (24 | 13.6%), Community & Social Service (18 | 10.2%), Computers, Engineering & Science (15 | 8.5%), Health Diagnosing & Treating (12 | 6.8%), and Education Instruction & Library (11 | 6.2%).
Management, Business, Science and Arts Occupations by Sex
Within the Management, Business, Science and Arts occupations in Indian Lake borough, the most male-oriented occupations are Computers, Engineering & Science (100.0%), Computers & Mathematics (100.0%), and Architecture & Engineering (100.0%), while the most female-oriented occupations are Business & Financial (100.0%), Education, Arts & Media (100.0%), and Arts, Media & Entertainment (100.0%).
| Occupation | Male | Female |
| Management | 16 (66.7%) | 8 (33.3%) |
| Business & Financial | 0 (0.0%) | 2 (100.0%) |
| Computers, Engineering & Science | 15 (100.0%) | 0 (0.0%) |
| Computers & Mathematics | 7 (100.0%) | 0 (0.0%) |
| Architecture & Engineering | 8 (100.0%) | 0 (0.0%) |
| Life, Physical & Social Science | 0 (0.0%) | 0 (0.0%) |
| Community & Social Service | 6 (33.3%) | 12 (66.7%) |
| Education, Arts & Media | 0 (0.0%) | 2 (100.0%) |
| Legal Services & Support | 1 (100.0%) | 0 (0.0%) |
| Education Instruction & Library | 5 (45.5%) | 6 (54.5%) |
| Arts, Media & Entertainment | 0 (0.0%) | 4 (100.0%) |
| Health Diagnosing & Treating | 7 (58.3%) | 5 (41.7%) |
| Health Technologists | 7 (70.0%) | 3 (30.0%) |
| Total (Category) | 44 (62.0%) | 27 (38.0%) |
| Total (Overall) | 106 (60.2%) | 70 (39.8%) |
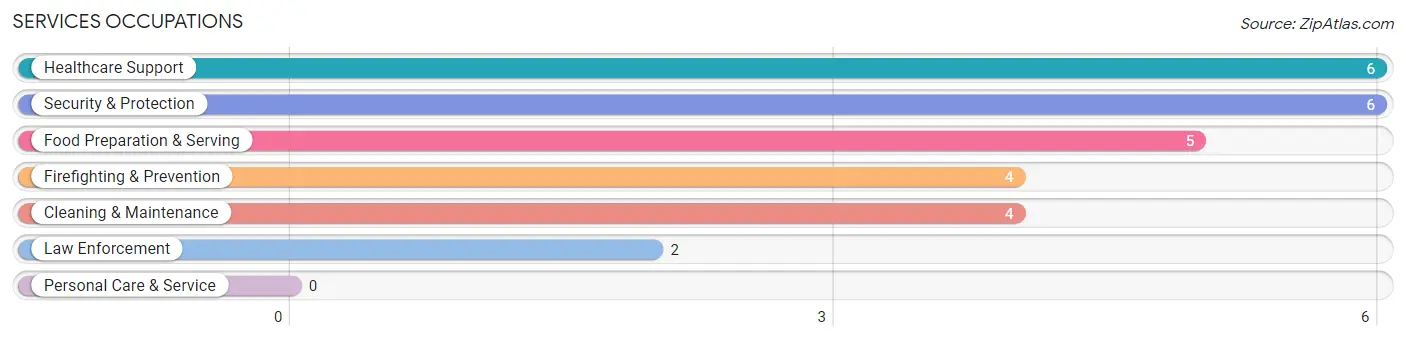
Services Occupations
The most common Services occupations in Indian Lake borough are Healthcare Support (6 | 3.4%), Security & Protection (6 | 3.4%), Food Preparation & Serving (5 | 2.8%), Firefighting & Prevention (4 | 2.3%), and Cleaning & Maintenance (4 | 2.3%).
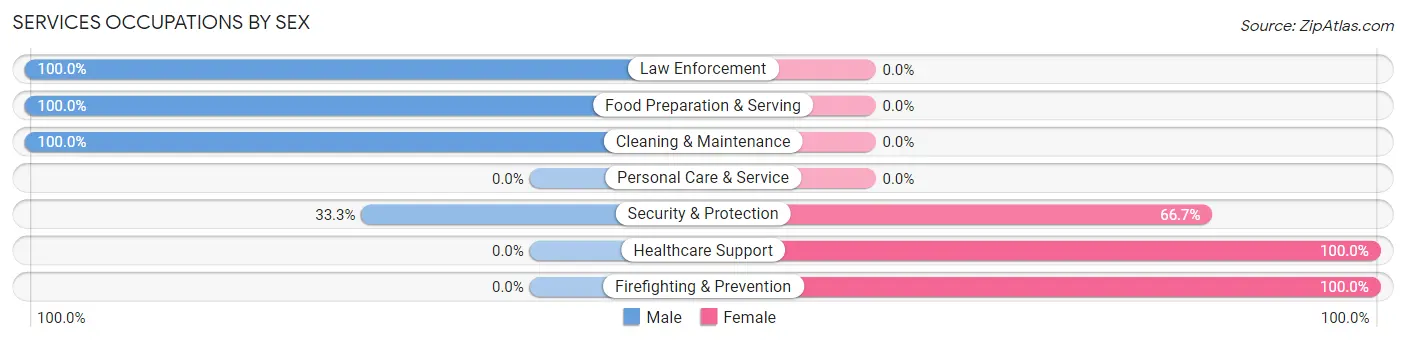
Services Occupations by Sex
Within the Services occupations in Indian Lake borough, the most male-oriented occupations are Law Enforcement (100.0%), Food Preparation & Serving (100.0%), and Cleaning & Maintenance (100.0%), while the most female-oriented occupations are Healthcare Support (100.0%), Firefighting & Prevention (100.0%), and Security & Protection (66.7%).
| Occupation | Male | Female |
| Healthcare Support | 0 (0.0%) | 6 (100.0%) |
| Security & Protection | 2 (33.3%) | 4 (66.7%) |
| Firefighting & Prevention | 0 (0.0%) | 4 (100.0%) |
| Law Enforcement | 2 (100.0%) | 0 (0.0%) |
| Food Preparation & Serving | 5 (100.0%) | 0 (0.0%) |
| Cleaning & Maintenance | 4 (100.0%) | 0 (0.0%) |
| Personal Care & Service | 0 (0.0%) | 0 (0.0%) |
| Total (Category) | 11 (52.4%) | 10 (47.6%) |
| Total (Overall) | 106 (60.2%) | 70 (39.8%) |
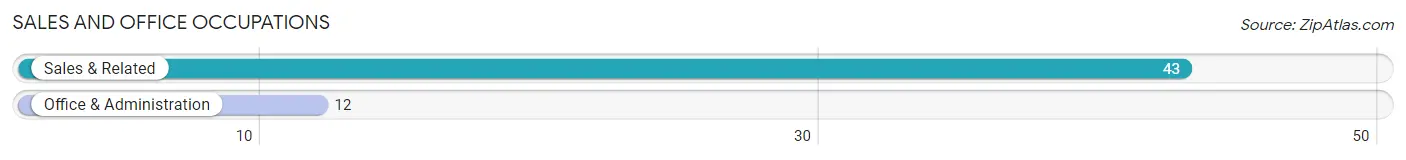
Sales and Office Occupations
The most common Sales and Office occupations in Indian Lake borough are Sales & Related (43 | 24.4%), and Office & Administration (12 | 6.8%).
Sales and Office Occupations by Sex
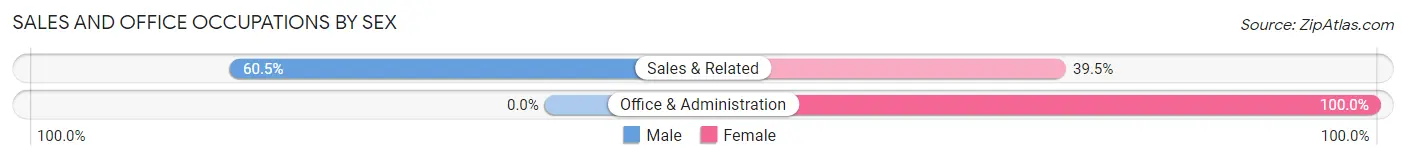
| Occupation | Male | Female |
| Sales & Related | 26 (60.5%) | 17 (39.5%) |
| Office & Administration | 0 (0.0%) | 12 (100.0%) |
| Total (Category) | 26 (47.3%) | 29 (52.7%) |
| Total (Overall) | 106 (60.2%) | 70 (39.8%) |
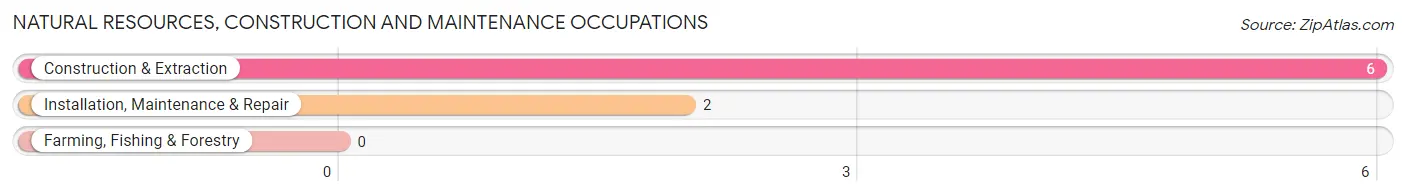
Natural Resources, Construction and Maintenance Occupations
The most common Natural Resources, Construction and Maintenance occupations in Indian Lake borough are Construction & Extraction (6 | 3.4%), and Installation, Maintenance & Repair (2 | 1.1%).
Natural Resources, Construction and Maintenance Occupations by Sex
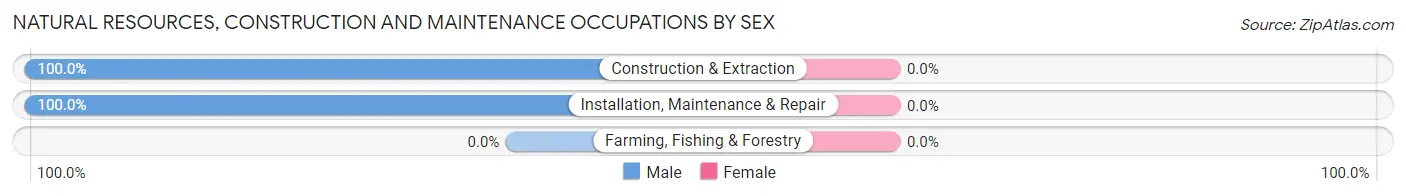
| Occupation | Male | Female |
| Farming, Fishing & Forestry | 0 (0.0%) | 0 (0.0%) |
| Construction & Extraction | 6 (100.0%) | 0 (0.0%) |
| Installation, Maintenance & Repair | 2 (100.0%) | 0 (0.0%) |
| Total (Category) | 8 (100.0%) | 0 (0.0%) |
| Total (Overall) | 106 (60.2%) | 70 (39.8%) |
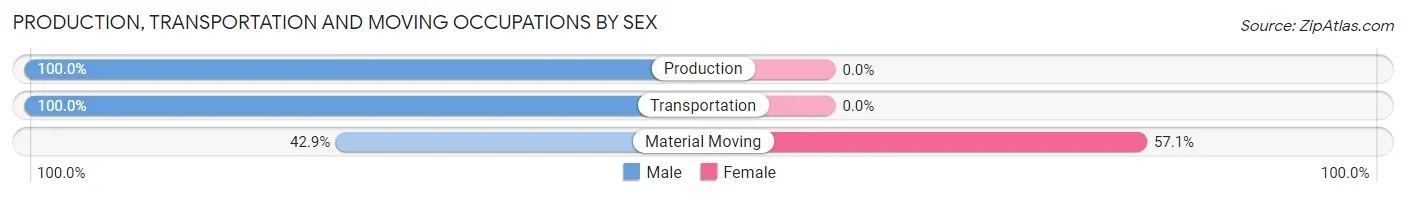
Production, Transportation and Moving Occupations
The most common Production, Transportation and Moving occupations in Indian Lake borough are Transportation (12 | 6.8%), Material Moving (7 | 4.0%), and Production (2 | 1.1%).
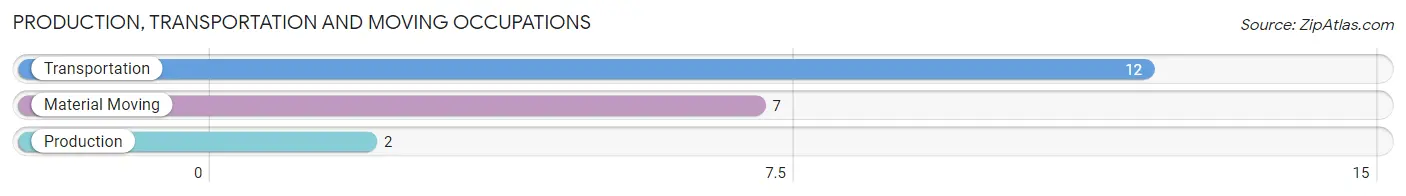
Production, Transportation and Moving Occupations by Sex
| Occupation | Male | Female |
| Production | 2 (100.0%) | 0 (0.0%) |
| Transportation | 12 (100.0%) | 0 (0.0%) |
| Material Moving | 3 (42.9%) | 4 (57.1%) |
| Total (Category) | 17 (80.9%) | 4 (19.1%) |
| Total (Overall) | 106 (60.2%) | 70 (39.8%) |
Employment Industries by Sex in Indian Lake borough
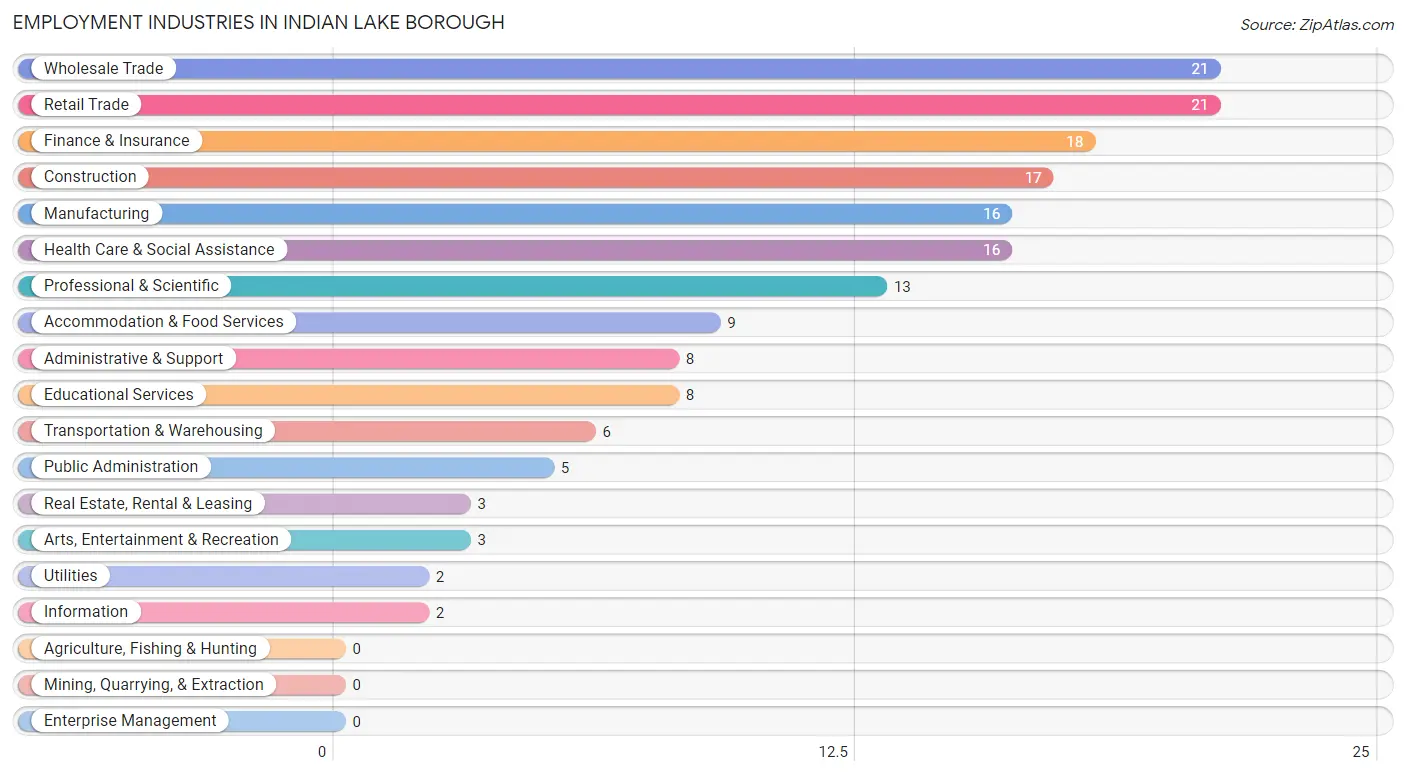
Employment Industries in Indian Lake borough
The major employment industries in Indian Lake borough include Wholesale Trade (21 | 11.9%), Retail Trade (21 | 11.9%), Finance & Insurance (18 | 10.2%), Construction (17 | 9.7%), and Manufacturing (16 | 9.1%).
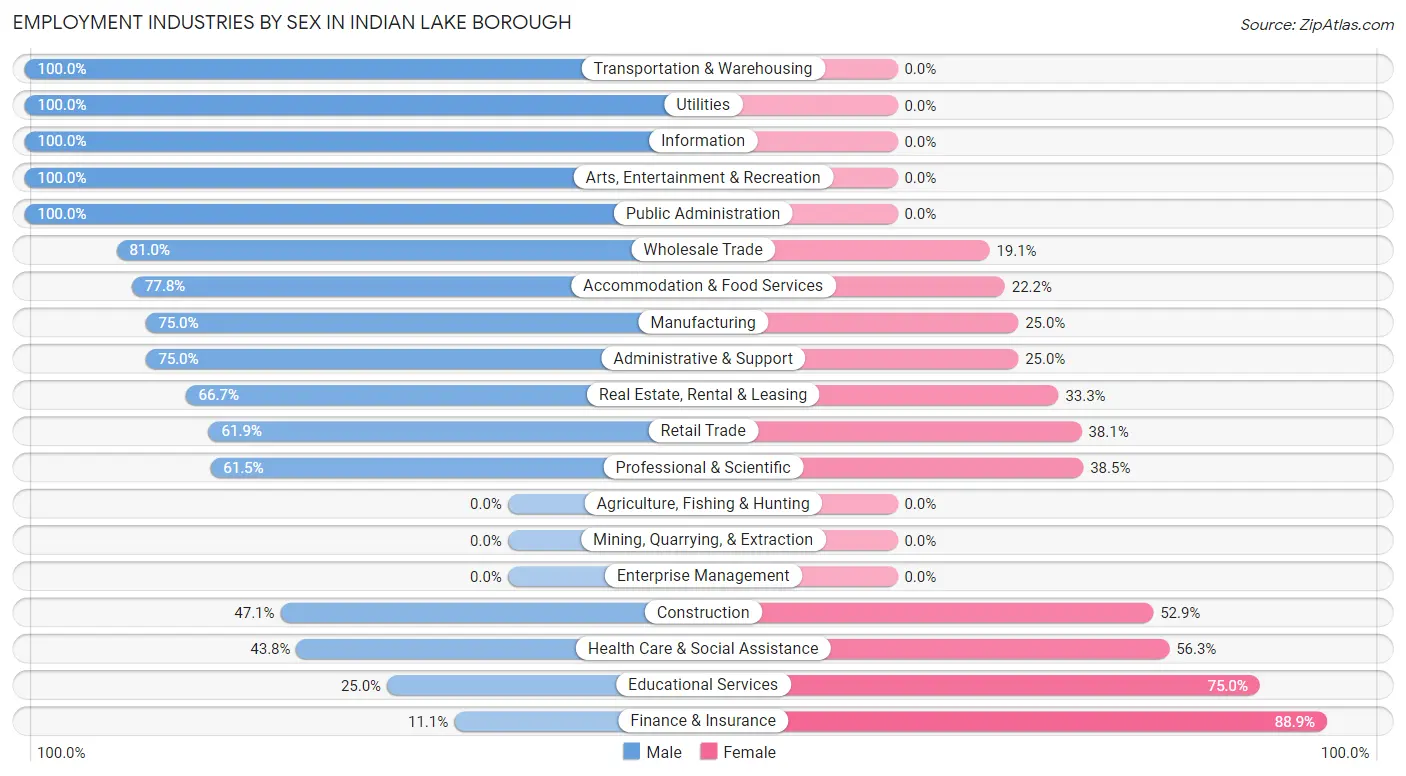
Employment Industries by Sex in Indian Lake borough
The Indian Lake borough industries that see more men than women are Transportation & Warehousing (100.0%), Utilities (100.0%), and Information (100.0%), whereas the industries that tend to have a higher number of women are Finance & Insurance (88.9%), Educational Services (75.0%), and Health Care & Social Assistance (56.2%).
| Industry | Male | Female |
| Agriculture, Fishing & Hunting | 0 (0.0%) | 0 (0.0%) |
| Mining, Quarrying, & Extraction | 0 (0.0%) | 0 (0.0%) |
| Construction | 8 (47.1%) | 9 (52.9%) |
| Manufacturing | 12 (75.0%) | 4 (25.0%) |
| Wholesale Trade | 17 (80.9%) | 4 (19.1%) |
| Retail Trade | 13 (61.9%) | 8 (38.1%) |
| Transportation & Warehousing | 6 (100.0%) | 0 (0.0%) |
| Utilities | 2 (100.0%) | 0 (0.0%) |
| Information | 2 (100.0%) | 0 (0.0%) |
| Finance & Insurance | 2 (11.1%) | 16 (88.9%) |
| Real Estate, Rental & Leasing | 2 (66.7%) | 1 (33.3%) |
| Professional & Scientific | 8 (61.5%) | 5 (38.5%) |
| Enterprise Management | 0 (0.0%) | 0 (0.0%) |
| Administrative & Support | 6 (75.0%) | 2 (25.0%) |
| Educational Services | 2 (25.0%) | 6 (75.0%) |
| Health Care & Social Assistance | 7 (43.8%) | 9 (56.2%) |
| Arts, Entertainment & Recreation | 3 (100.0%) | 0 (0.0%) |
| Accommodation & Food Services | 7 (77.8%) | 2 (22.2%) |
| Public Administration | 5 (100.0%) | 0 (0.0%) |
| Total | 106 (60.2%) | 70 (39.8%) |
Education in Indian Lake borough
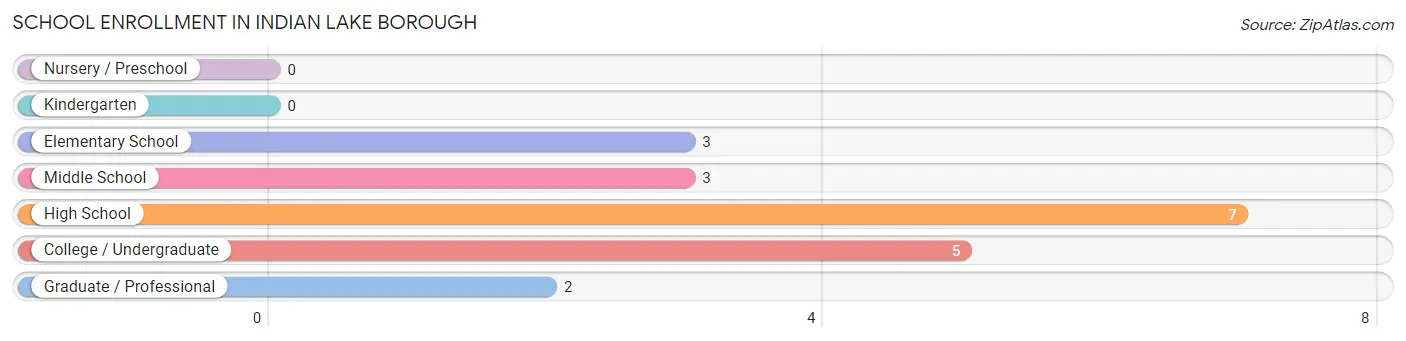
School Enrollment in Indian Lake borough
The most common levels of schooling among the 20 students in Indian Lake borough are high school (7 | 35.0%), college / undergraduate (5 | 25.0%), and elementary school (3 | 15.0%).
| School Level | # Students | % Students |
| Nursery / Preschool | 0 | 0.0% |
| Kindergarten | 0 | 0.0% |
| Elementary School | 3 | 15.0% |
| Middle School | 3 | 15.0% |
| High School | 7 | 35.0% |
| College / Undergraduate | 5 | 25.0% |
| Graduate / Professional | 2 | 10.0% |
| Total | 20 | 100.0% |
School Enrollment by Age by Funding Source in Indian Lake borough
Out of a total of 20 students who are enrolled in schools in Indian Lake borough, 2 (10.0%) attend a private institution, while the remaining 18 (90.0%) are enrolled in public schools. The age group of 15 to 17 year olds has the highest likelihood of being enrolled in private schools, with 2 (100.0% in the age bracket) enrolled. Conversely, the age group of 5 to 9 year old has the lowest likelihood of being enrolled in a private school, with 3 (100.0% in the age bracket) attending a public institution.
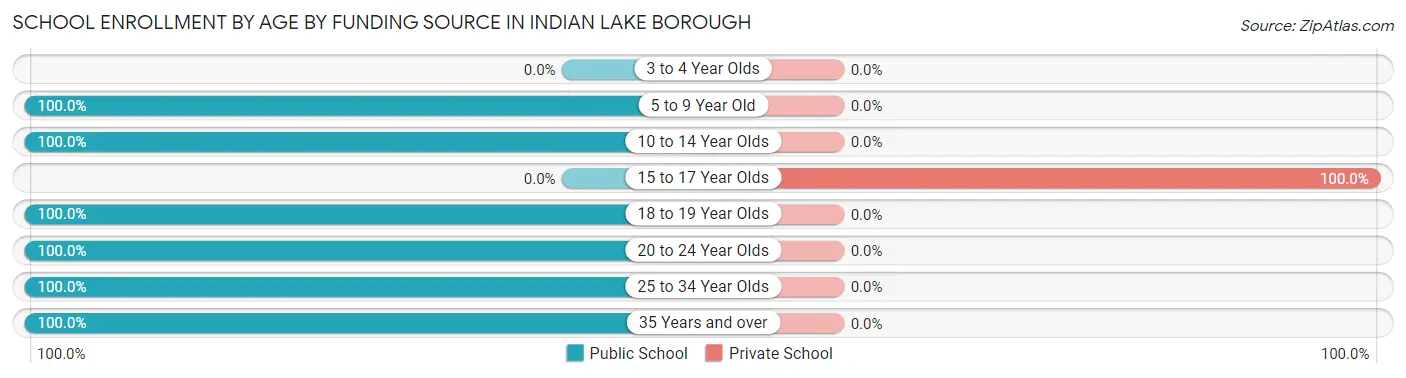
| Age Bracket | Public School | Private School |
| 3 to 4 Year Olds | 0 (0.0%) | 0 (0.0%) |
| 5 to 9 Year Old | 3 (100.0%) | 0 (0.0%) |
| 10 to 14 Year Olds | 3 (100.0%) | 0 (0.0%) |
| 15 to 17 Year Olds | 0 (0.0%) | 2 (100.0%) |
| 18 to 19 Year Olds | 5 (100.0%) | 0 (0.0%) |
| 20 to 24 Year Olds | 3 (100.0%) | 0 (0.0%) |
| 25 to 34 Year Olds | 2 (100.0%) | 0 (0.0%) |
| 35 Years and over | 2 (100.0%) | 0 (0.0%) |
| Total | 18 (90.0%) | 2 (10.0%) |
Educational Attainment by Field of Study in Indian Lake borough
Business (35 | 25.0%), science & technology (20 | 14.3%), engineering (19 | 13.6%), education (19 | 13.6%), and social sciences (15 | 10.7%) are the most common fields of study among 140 individuals in Indian Lake borough who have obtained a bachelor's degree or higher.
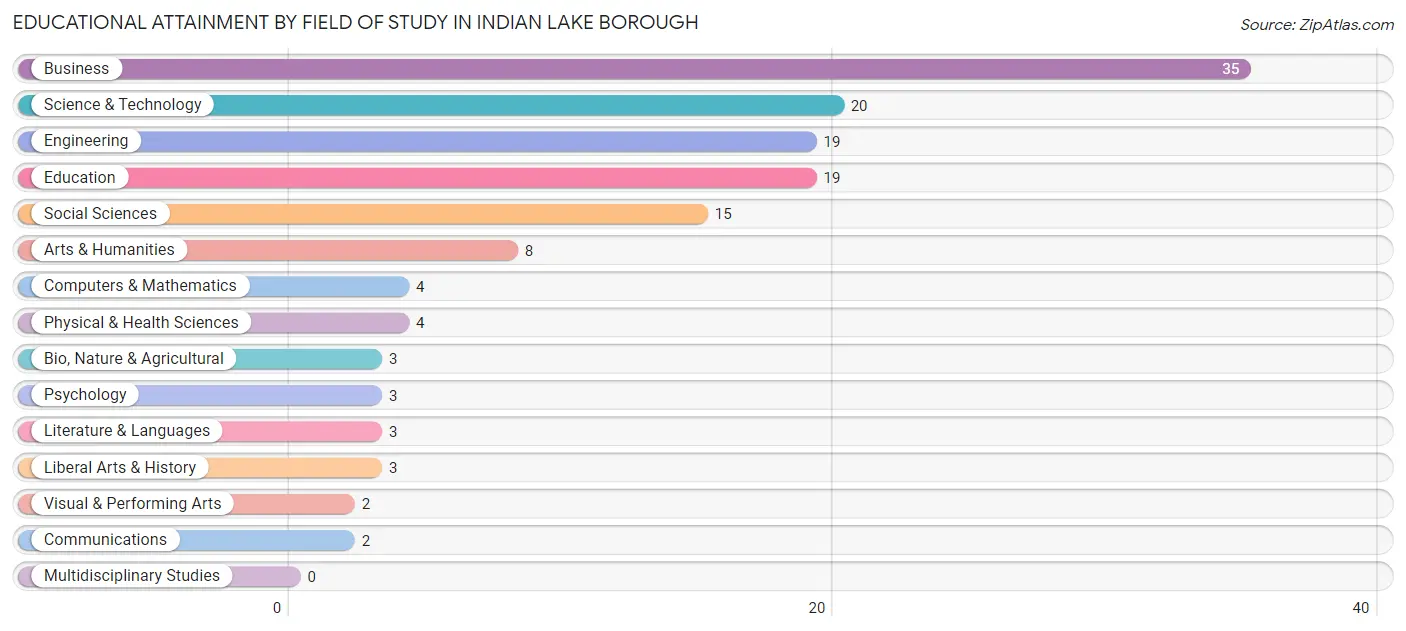
| Field of Study | # Graduates | % Graduates |
| Computers & Mathematics | 4 | 2.9% |
| Bio, Nature & Agricultural | 3 | 2.1% |
| Physical & Health Sciences | 4 | 2.9% |
| Psychology | 3 | 2.1% |
| Social Sciences | 15 | 10.7% |
| Engineering | 19 | 13.6% |
| Multidisciplinary Studies | 0 | 0.0% |
| Science & Technology | 20 | 14.3% |
| Business | 35 | 25.0% |
| Education | 19 | 13.6% |
| Literature & Languages | 3 | 2.1% |
| Liberal Arts & History | 3 | 2.1% |
| Visual & Performing Arts | 2 | 1.4% |
| Communications | 2 | 1.4% |
| Arts & Humanities | 8 | 5.7% |
| Total | 140 | 100.0% |
Transportation & Commute in Indian Lake borough
Vehicle Availability by Sex in Indian Lake borough
The most prevalent vehicle ownership categories in Indian Lake borough are males with 2 vehicles (63, accounting for 58.3%) and females with 2 vehicles (40, making up 90.0%).
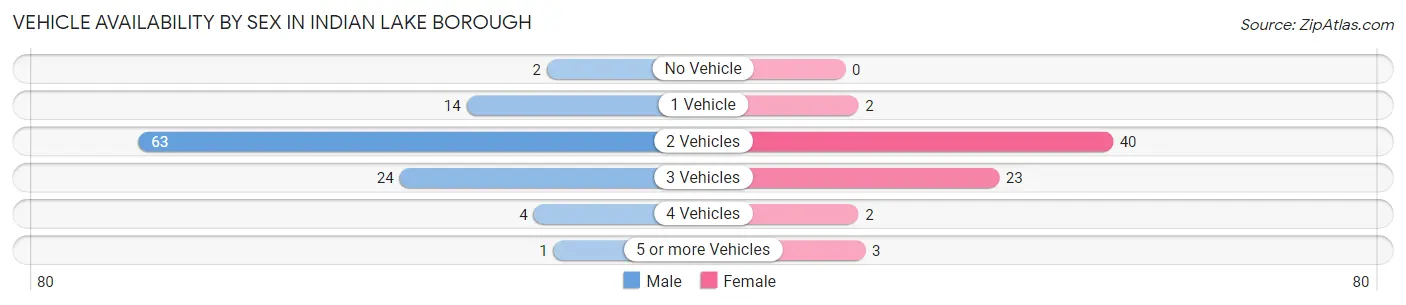
| Vehicles Available | Male | Female |
| No Vehicle | 2 (1.8%) | 0 (0.0%) |
| 1 Vehicle | 14 (13.0%) | 2 (2.9%) |
| 2 Vehicles | 63 (58.3%) | 40 (57.1%) |
| 3 Vehicles | 24 (22.2%) | 23 (32.9%) |
| 4 Vehicles | 4 (3.7%) | 2 (2.9%) |
| 5 or more Vehicles | 1 (0.9%) | 3 (4.3%) |
| Total | 108 (100.0%) | 70 (100.0%) |
Commute Time in Indian Lake borough
The most frequently occuring commute durations in Indian Lake borough are 30 to 34 minutes (24 commuters, 15.9%), 60 to 89 minutes (23 commuters, 15.2%), and 35 to 39 minutes (22 commuters, 14.6%).
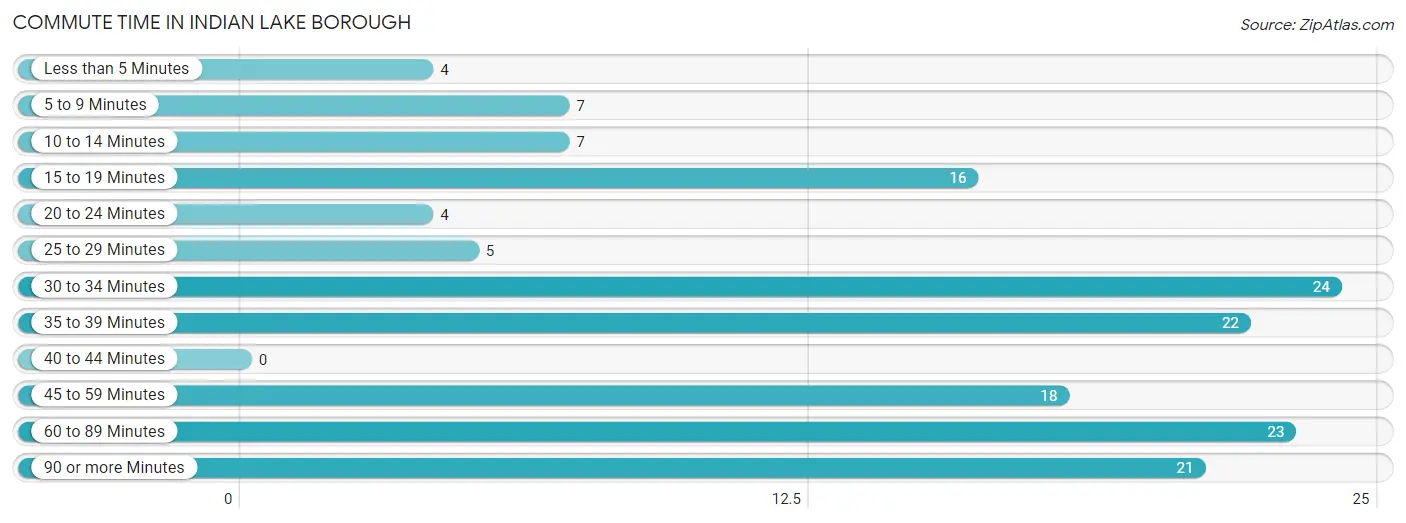
| Commute Time | # Commuters | % Commuters |
| Less than 5 Minutes | 4 | 2.6% |
| 5 to 9 Minutes | 7 | 4.6% |
| 10 to 14 Minutes | 7 | 4.6% |
| 15 to 19 Minutes | 16 | 10.6% |
| 20 to 24 Minutes | 4 | 2.6% |
| 25 to 29 Minutes | 5 | 3.3% |
| 30 to 34 Minutes | 24 | 15.9% |
| 35 to 39 Minutes | 22 | 14.6% |
| 40 to 44 Minutes | 0 | 0.0% |
| 45 to 59 Minutes | 18 | 11.9% |
| 60 to 89 Minutes | 23 | 15.2% |
| 90 or more Minutes | 21 | 13.9% |
Commute Time by Sex in Indian Lake borough
The most common commute times in Indian Lake borough are 30 to 34 minutes (21 commuters, 23.3%) for males and 60 to 89 minutes (16 commuters, 26.2%) for females.
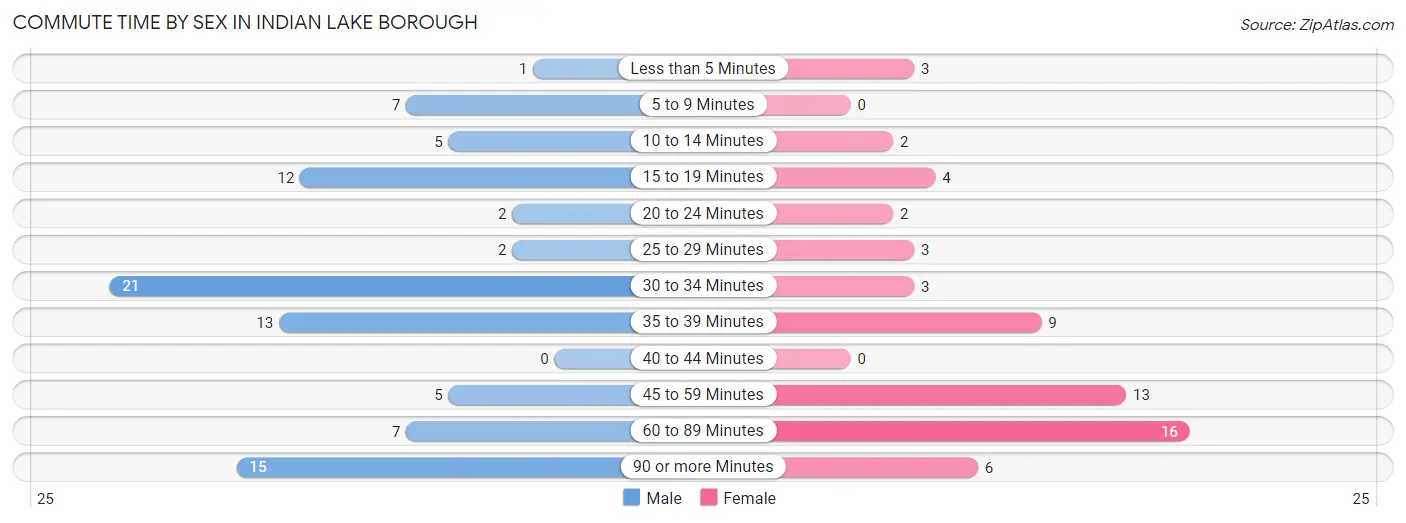
| Commute Time | Male | Female |
| Less than 5 Minutes | 1 (1.1%) | 3 (4.9%) |
| 5 to 9 Minutes | 7 (7.8%) | 0 (0.0%) |
| 10 to 14 Minutes | 5 (5.6%) | 2 (3.3%) |
| 15 to 19 Minutes | 12 (13.3%) | 4 (6.6%) |
| 20 to 24 Minutes | 2 (2.2%) | 2 (3.3%) |
| 25 to 29 Minutes | 2 (2.2%) | 3 (4.9%) |
| 30 to 34 Minutes | 21 (23.3%) | 3 (4.9%) |
| 35 to 39 Minutes | 13 (14.4%) | 9 (14.7%) |
| 40 to 44 Minutes | 0 (0.0%) | 0 (0.0%) |
| 45 to 59 Minutes | 5 (5.6%) | 13 (21.3%) |
| 60 to 89 Minutes | 7 (7.8%) | 16 (26.2%) |
| 90 or more Minutes | 15 (16.7%) | 6 (9.8%) |
Time of Departure to Work by Sex in Indian Lake borough
The most frequent times of departure to work in Indian Lake borough are 12:00 AM to 4:59 AM (26, 28.9%) for males and 6:30 AM to 6:59 AM (13, 21.3%) for females.
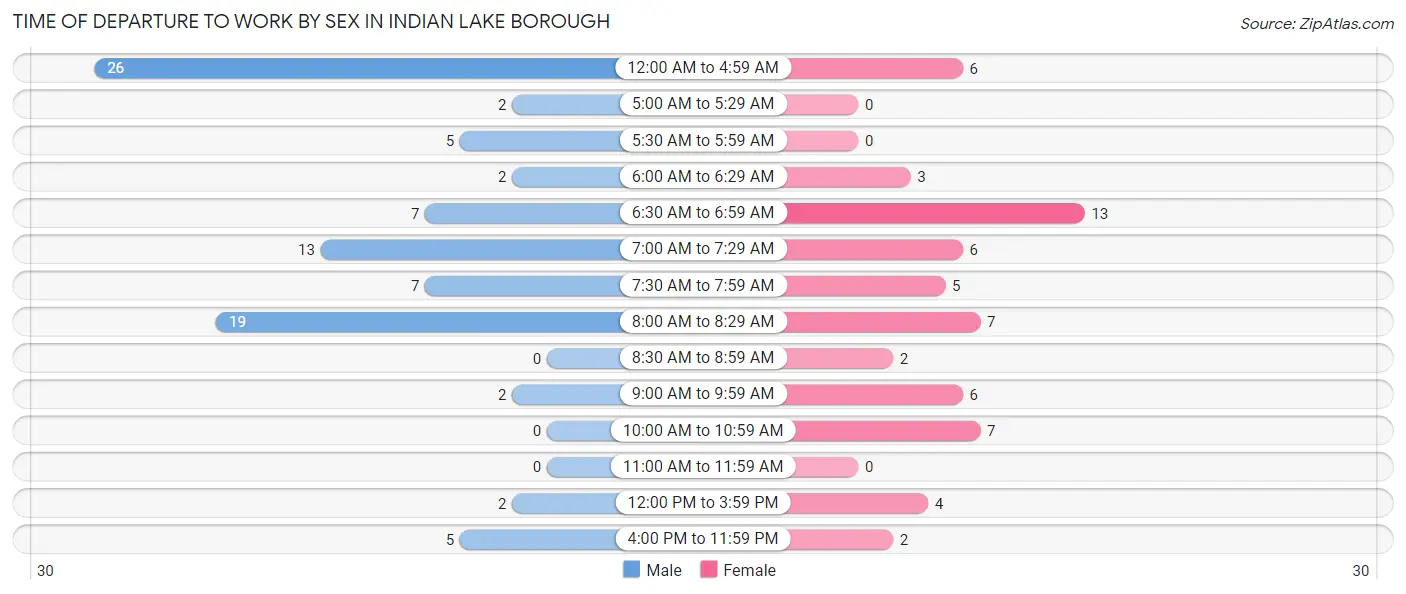
| Time of Departure | Male | Female |
| 12:00 AM to 4:59 AM | 26 (28.9%) | 6 (9.8%) |
| 5:00 AM to 5:29 AM | 2 (2.2%) | 0 (0.0%) |
| 5:30 AM to 5:59 AM | 5 (5.6%) | 0 (0.0%) |
| 6:00 AM to 6:29 AM | 2 (2.2%) | 3 (4.9%) |
| 6:30 AM to 6:59 AM | 7 (7.8%) | 13 (21.3%) |
| 7:00 AM to 7:29 AM | 13 (14.4%) | 6 (9.8%) |
| 7:30 AM to 7:59 AM | 7 (7.8%) | 5 (8.2%) |
| 8:00 AM to 8:29 AM | 19 (21.1%) | 7 (11.5%) |
| 8:30 AM to 8:59 AM | 0 (0.0%) | 2 (3.3%) |
| 9:00 AM to 9:59 AM | 2 (2.2%) | 6 (9.8%) |
| 10:00 AM to 10:59 AM | 0 (0.0%) | 7 (11.5%) |
| 11:00 AM to 11:59 AM | 0 (0.0%) | 0 (0.0%) |
| 12:00 PM to 3:59 PM | 2 (2.2%) | 4 (6.6%) |
| 4:00 PM to 11:59 PM | 5 (5.6%) | 2 (3.3%) |
| Total | 90 (100.0%) | 61 (100.0%) |
Housing Occupancy in Indian Lake borough
Occupancy by Ownership in Indian Lake borough
Of the total 165 dwellings in Indian Lake borough, owner-occupied units account for 148 (89.7%), while renter-occupied units make up 17 (10.3%).
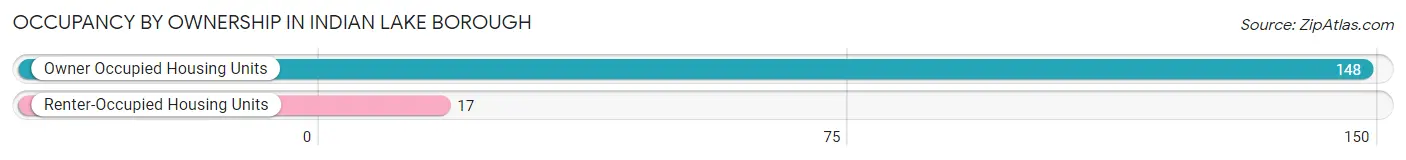
| Occupancy | # Housing Units | % Housing Units |
| Owner Occupied Housing Units | 148 | 89.7% |
| Renter-Occupied Housing Units | 17 | 10.3% |
| Total Occupied Housing Units | 165 | 100.0% |
Occupancy by Household Size in Indian Lake borough
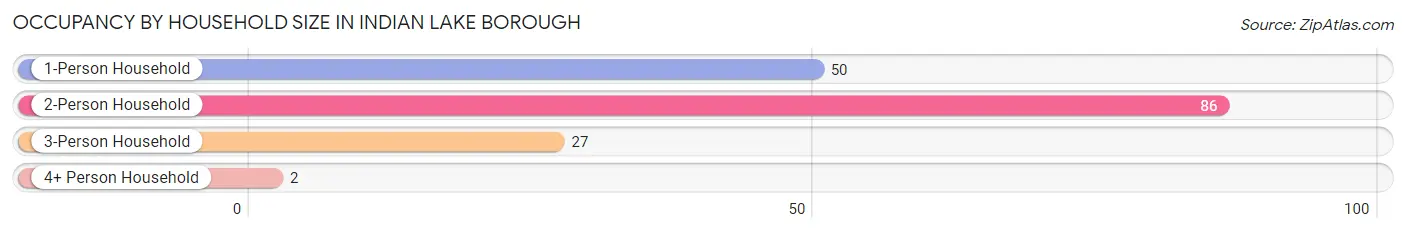
| Household Size | # Housing Units | % Housing Units |
| 1-Person Household | 50 | 30.3% |
| 2-Person Household | 86 | 52.1% |
| 3-Person Household | 27 | 16.4% |
| 4+ Person Household | 2 | 1.2% |
| Total Housing Units | 165 | 100.0% |
Occupancy by Ownership by Household Size in Indian Lake borough
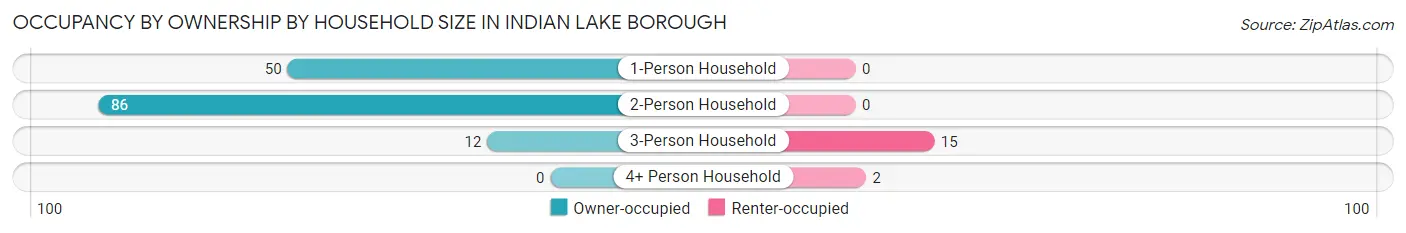
| Household Size | Owner-occupied | Renter-occupied |
| 1-Person Household | 50 (100.0%) | 0 (0.0%) |
| 2-Person Household | 86 (100.0%) | 0 (0.0%) |
| 3-Person Household | 12 (44.4%) | 15 (55.6%) |
| 4+ Person Household | 0 (0.0%) | 2 (100.0%) |
| Total Housing Units | 148 (89.7%) | 17 (10.3%) |
Occupancy by Educational Attainment in Indian Lake borough
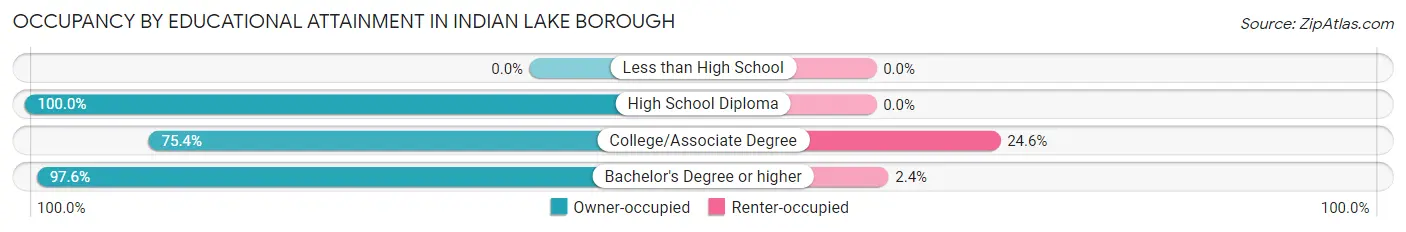
| Household Size | Owner-occupied | Renter-occupied |
| Less than High School | 0 (0.0%) | 0 (0.0%) |
| High School Diploma | 21 (100.0%) | 0 (0.0%) |
| College/Associate Degree | 46 (75.4%) | 15 (24.6%) |
| Bachelor's Degree or higher | 81 (97.6%) | 2 (2.4%) |
Occupancy by Age of Householder in Indian Lake borough
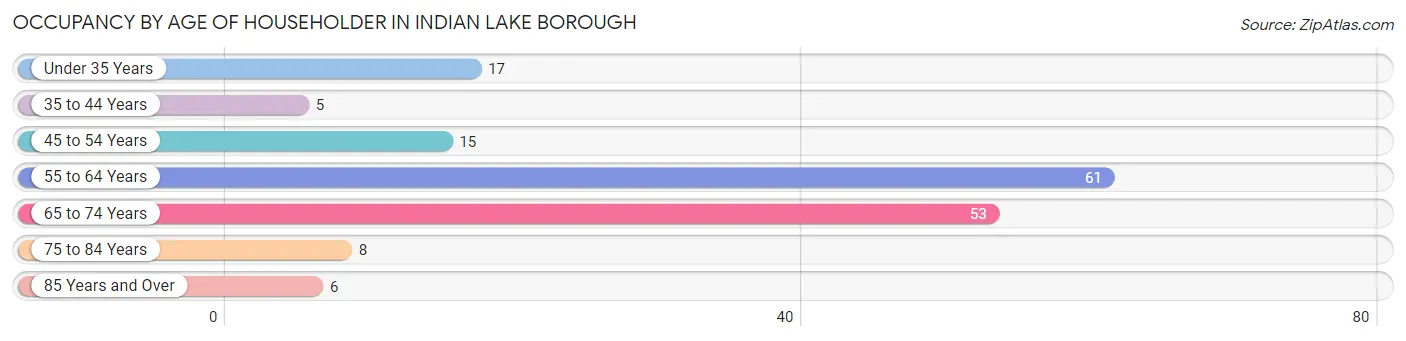
| Age Bracket | # Households | % Households |
| Under 35 Years | 17 | 10.3% |
| 35 to 44 Years | 5 | 3.0% |
| 45 to 54 Years | 15 | 9.1% |
| 55 to 64 Years | 61 | 37.0% |
| 65 to 74 Years | 53 | 32.1% |
| 75 to 84 Years | 8 | 4.9% |
| 85 Years and Over | 6 | 3.6% |
| Total | 165 | 100.0% |
Housing Finances in Indian Lake borough
Median Income by Occupancy in Indian Lake borough
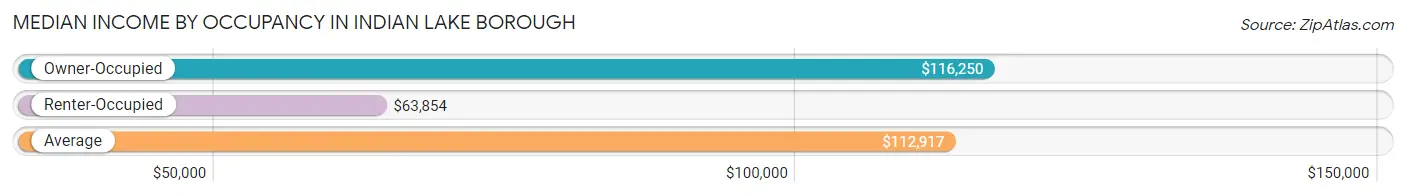
| Occupancy Type | # Households | Median Income |
| Owner-Occupied | 148 (89.7%) | $116,250 |
| Renter-Occupied | 17 (10.3%) | $63,854 |
| Average | 165 (100.0%) | $112,917 |
Occupancy by Householder Income Bracket in Indian Lake borough
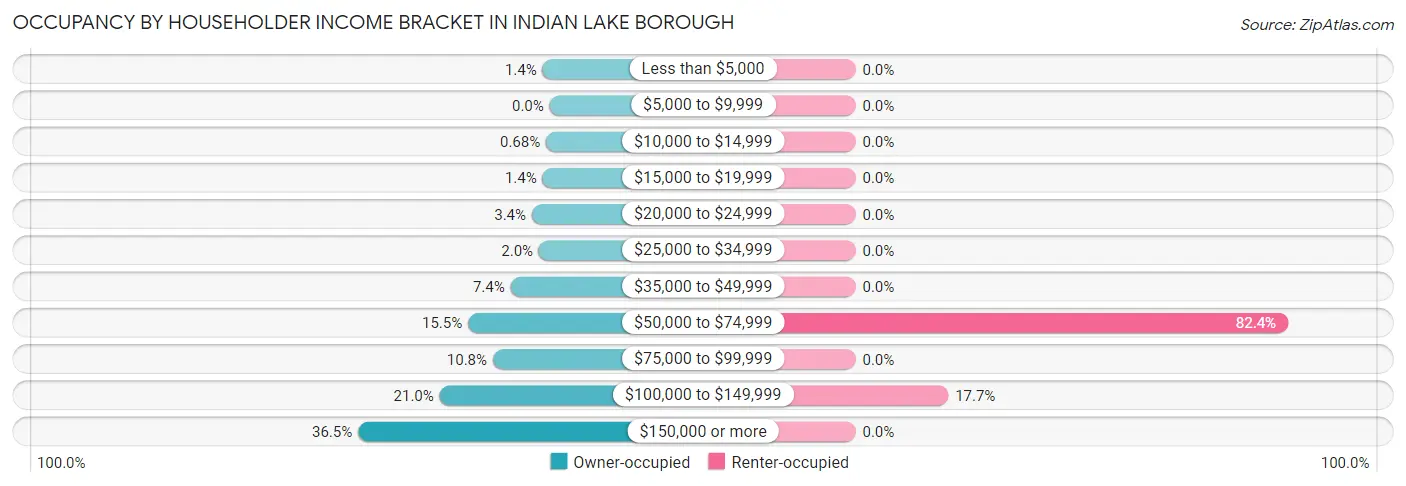
| Income Bracket | Owner-occupied | Renter-occupied |
| Less than $5,000 | 2 (1.3%) | 0 (0.0%) |
| $5,000 to $9,999 | 0 (0.0%) | 0 (0.0%) |
| $10,000 to $14,999 | 1 (0.7%) | 0 (0.0%) |
| $15,000 to $19,999 | 2 (1.3%) | 0 (0.0%) |
| $20,000 to $24,999 | 5 (3.4%) | 0 (0.0%) |
| $25,000 to $34,999 | 3 (2.0%) | 0 (0.0%) |
| $35,000 to $49,999 | 11 (7.4%) | 0 (0.0%) |
| $50,000 to $74,999 | 23 (15.5%) | 14 (82.4%) |
| $75,000 to $99,999 | 16 (10.8%) | 0 (0.0%) |
| $100,000 to $149,999 | 31 (20.9%) | 3 (17.6%) |
| $150,000 or more | 54 (36.5%) | 0 (0.0%) |
| Total | 148 (100.0%) | 17 (100.0%) |
Monthly Housing Cost Tiers in Indian Lake borough
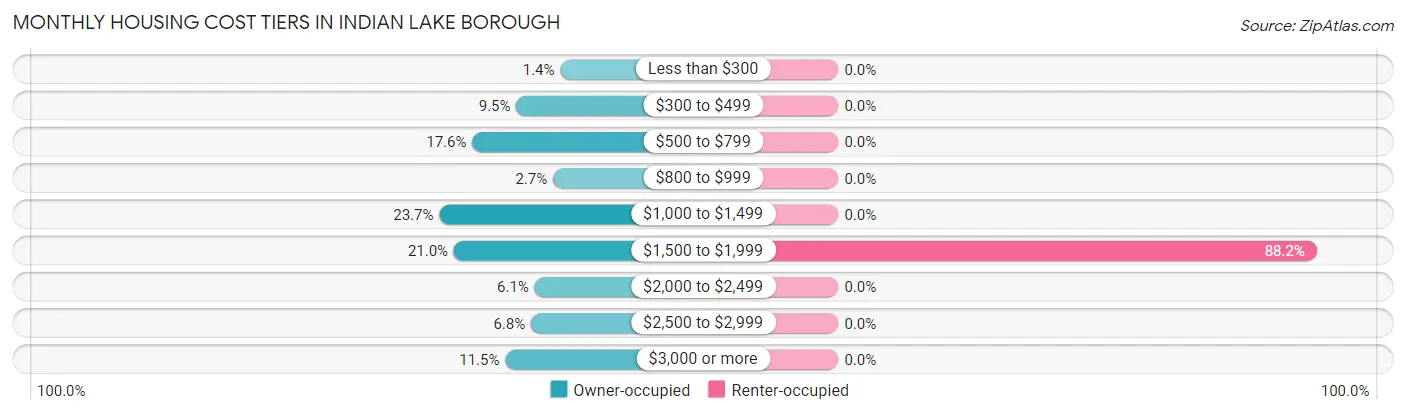
| Monthly Cost | Owner-occupied | Renter-occupied |
| Less than $300 | 2 (1.3%) | 0 (0.0%) |
| $300 to $499 | 14 (9.5%) | 0 (0.0%) |
| $500 to $799 | 26 (17.6%) | 0 (0.0%) |
| $800 to $999 | 4 (2.7%) | 0 (0.0%) |
| $1,000 to $1,499 | 35 (23.6%) | 0 (0.0%) |
| $1,500 to $1,999 | 31 (20.9%) | 15 (88.2%) |
| $2,000 to $2,499 | 9 (6.1%) | 0 (0.0%) |
| $2,500 to $2,999 | 10 (6.8%) | 0 (0.0%) |
| $3,000 or more | 17 (11.5%) | 0 (0.0%) |
| Total | 148 (100.0%) | 17 (100.0%) |
Physical Housing Characteristics in Indian Lake borough
Housing Structures in Indian Lake borough
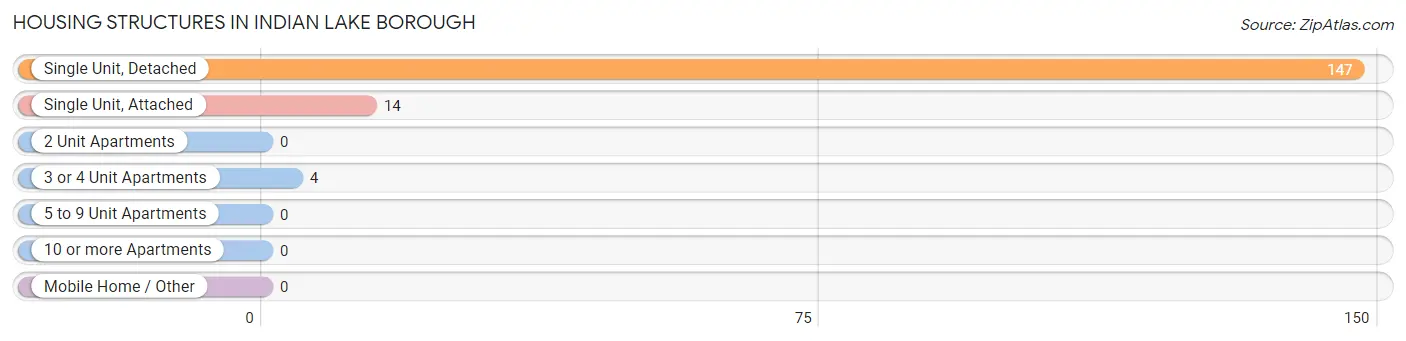
| Structure Type | # Housing Units | % Housing Units |
| Single Unit, Detached | 147 | 89.1% |
| Single Unit, Attached | 14 | 8.5% |
| 2 Unit Apartments | 0 | 0.0% |
| 3 or 4 Unit Apartments | 4 | 2.4% |
| 5 to 9 Unit Apartments | 0 | 0.0% |
| 10 or more Apartments | 0 | 0.0% |
| Mobile Home / Other | 0 | 0.0% |
| Total | 165 | 100.0% |
Housing Structures by Occupancy in Indian Lake borough
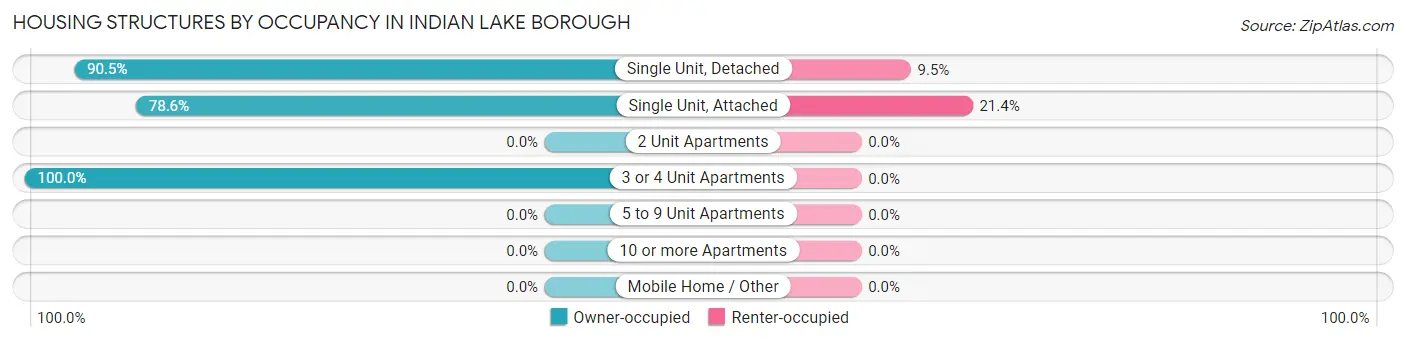
| Structure Type | Owner-occupied | Renter-occupied |
| Single Unit, Detached | 133 (90.5%) | 14 (9.5%) |
| Single Unit, Attached | 11 (78.6%) | 3 (21.4%) |
| 2 Unit Apartments | 0 (0.0%) | 0 (0.0%) |
| 3 or 4 Unit Apartments | 4 (100.0%) | 0 (0.0%) |
| 5 to 9 Unit Apartments | 0 (0.0%) | 0 (0.0%) |
| 10 or more Apartments | 0 (0.0%) | 0 (0.0%) |
| Mobile Home / Other | 0 (0.0%) | 0 (0.0%) |
| Total | 148 (89.7%) | 17 (10.3%) |
Housing Structures by Number of Rooms in Indian Lake borough
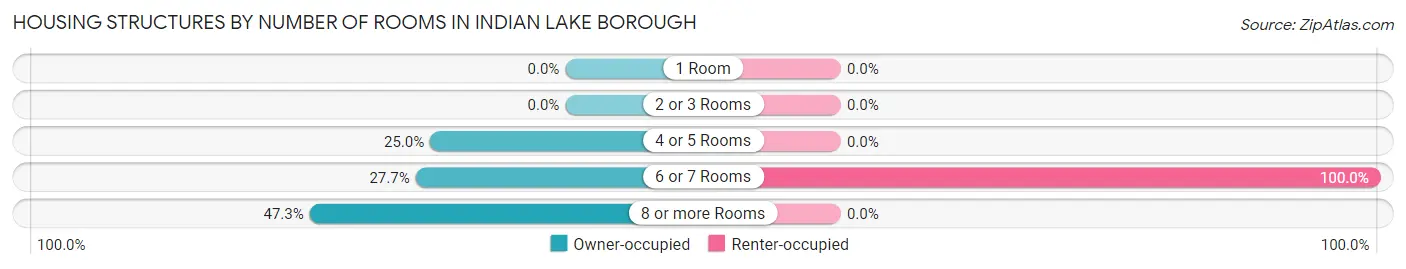
| Number of Rooms | Owner-occupied | Renter-occupied |
| 1 Room | 0 (0.0%) | 0 (0.0%) |
| 2 or 3 Rooms | 0 (0.0%) | 0 (0.0%) |
| 4 or 5 Rooms | 37 (25.0%) | 0 (0.0%) |
| 6 or 7 Rooms | 41 (27.7%) | 17 (100.0%) |
| 8 or more Rooms | 70 (47.3%) | 0 (0.0%) |
| Total | 148 (100.0%) | 17 (100.0%) |
Housing Structure by Heating Type in Indian Lake borough
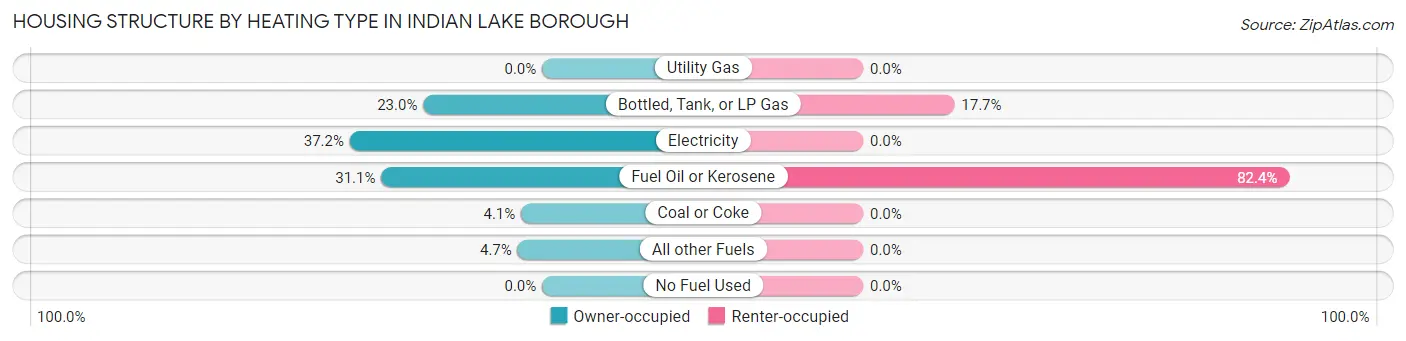
| Heating Type | Owner-occupied | Renter-occupied |
| Utility Gas | 0 (0.0%) | 0 (0.0%) |
| Bottled, Tank, or LP Gas | 34 (23.0%) | 3 (17.6%) |
| Electricity | 55 (37.2%) | 0 (0.0%) |
| Fuel Oil or Kerosene | 46 (31.1%) | 14 (82.4%) |
| Coal or Coke | 6 (4.1%) | 0 (0.0%) |
| All other Fuels | 7 (4.7%) | 0 (0.0%) |
| No Fuel Used | 0 (0.0%) | 0 (0.0%) |
| Total | 148 (100.0%) | 17 (100.0%) |
Household Vehicle Usage in Indian Lake borough
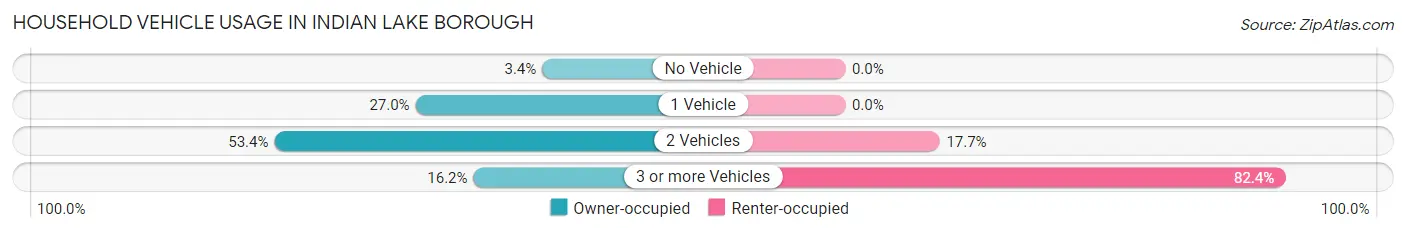
| Vehicles per Household | Owner-occupied | Renter-occupied |
| No Vehicle | 5 (3.4%) | 0 (0.0%) |
| 1 Vehicle | 40 (27.0%) | 0 (0.0%) |
| 2 Vehicles | 79 (53.4%) | 3 (17.6%) |
| 3 or more Vehicles | 24 (16.2%) | 14 (82.4%) |
| Total | 148 (100.0%) | 17 (100.0%) |
Real Estate & Mortgages in Indian Lake borough
Real Estate and Mortgage Overview in Indian Lake borough
| Characteristic | Without Mortgage | With Mortgage |
| Housing Units | 73 | 75 |
| Median Property Value | $244,600 | $395,500 |
| Median Household Income | $114,063 | $31 |
| Monthly Housing Costs | $721 | $17 |
| Real Estate Taxes | $3,794 | $0 |
Property Value by Mortgage Status in Indian Lake borough
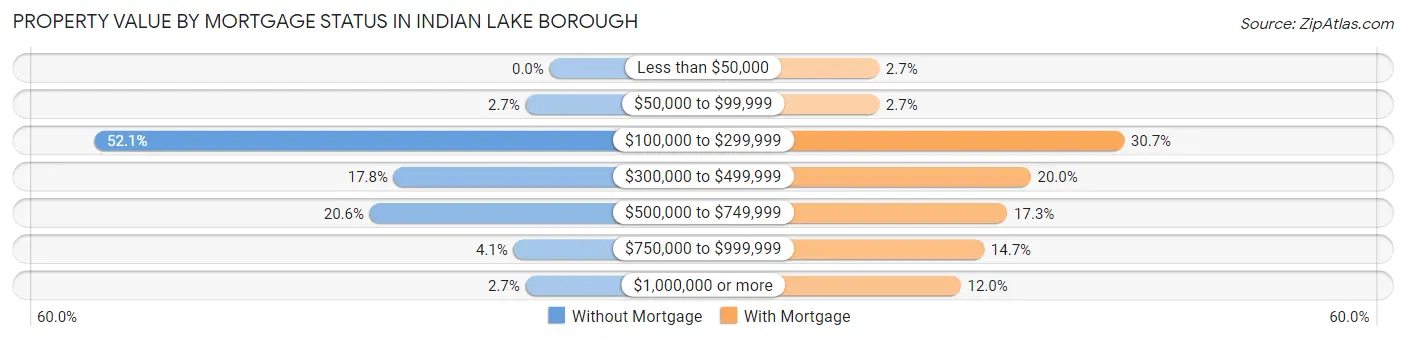
| Property Value | Without Mortgage | With Mortgage |
| Less than $50,000 | 0 (0.0%) | 2 (2.7%) |
| $50,000 to $99,999 | 2 (2.7%) | 2 (2.7%) |
| $100,000 to $299,999 | 38 (52.0%) | 23 (30.7%) |
| $300,000 to $499,999 | 13 (17.8%) | 15 (20.0%) |
| $500,000 to $749,999 | 15 (20.5%) | 13 (17.3%) |
| $750,000 to $999,999 | 3 (4.1%) | 11 (14.7%) |
| $1,000,000 or more | 2 (2.7%) | 9 (12.0%) |
| Total | 73 (100.0%) | 75 (100.0%) |
Household Income by Mortgage Status in Indian Lake borough
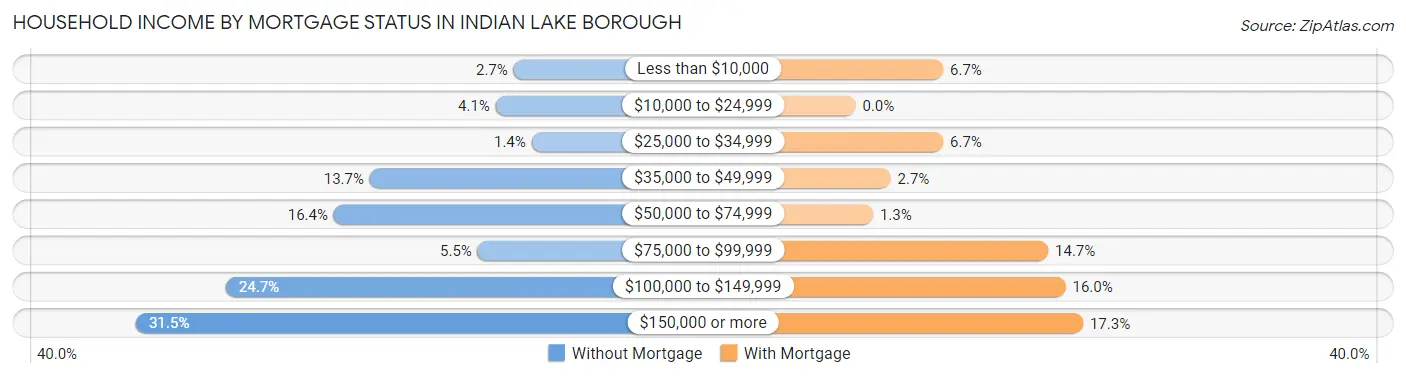
| Household Income | Without Mortgage | With Mortgage |
| Less than $10,000 | 2 (2.7%) | 5 (6.7%) |
| $10,000 to $24,999 | 3 (4.1%) | 0 (0.0%) |
| $25,000 to $34,999 | 1 (1.4%) | 5 (6.7%) |
| $35,000 to $49,999 | 10 (13.7%) | 2 (2.7%) |
| $50,000 to $74,999 | 12 (16.4%) | 1 (1.3%) |
| $75,000 to $99,999 | 4 (5.5%) | 11 (14.7%) |
| $100,000 to $149,999 | 18 (24.7%) | 12 (16.0%) |
| $150,000 or more | 23 (31.5%) | 13 (17.3%) |
| Total | 73 (100.0%) | 75 (100.0%) |
Property Value to Household Income Ratio in Indian Lake borough
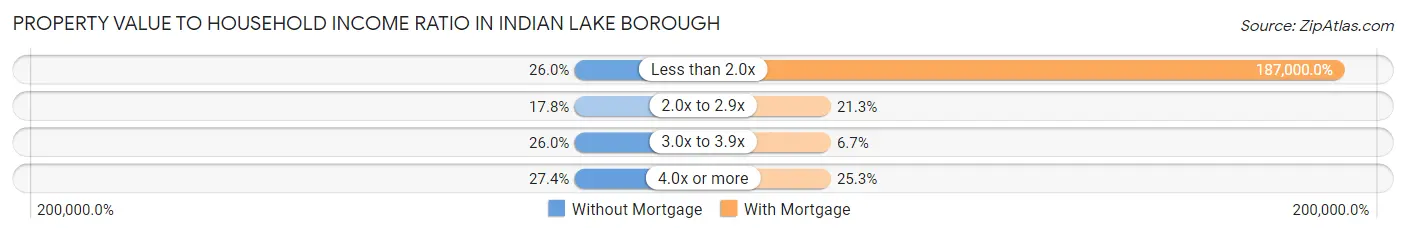
| Value-to-Income Ratio | Without Mortgage | With Mortgage |
| Less than 2.0x | 19 (26.0%) | 140,250 (187,000.0%) |
| 2.0x to 2.9x | 13 (17.8%) | 16 (21.3%) |
| 3.0x to 3.9x | 19 (26.0%) | 5 (6.7%) |
| 4.0x or more | 20 (27.4%) | 19 (25.3%) |
| Total | 73 (100.0%) | 75 (100.0%) |
Real Estate Taxes by Mortgage Status in Indian Lake borough
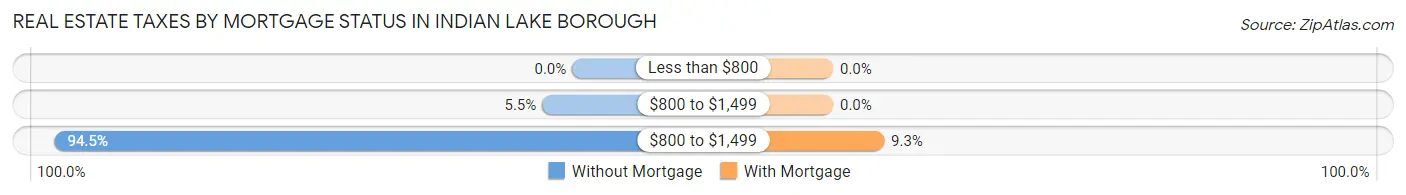
| Property Taxes | Without Mortgage | With Mortgage |
| Less than $800 | 0 (0.0%) | 0 (0.0%) |
| $800 to $1,499 | 4 (5.5%) | 0 (0.0%) |
| $800 to $1,499 | 69 (94.5%) | 7 (9.3%) |
| Total | 73 (100.0%) | 75 (100.0%) |
Health & Disability in Indian Lake borough
Health Insurance Coverage by Age in Indian Lake borough
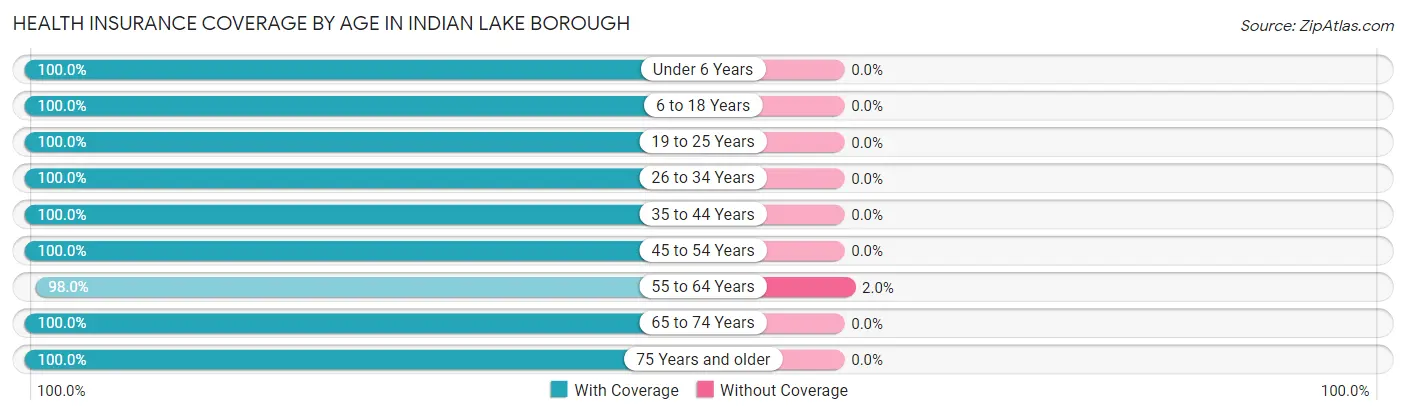
| Age Bracket | With Coverage | Without Coverage |
| Under 6 Years | 10 (100.0%) | 0 (0.0%) |
| 6 to 18 Years | 10 (100.0%) | 0 (0.0%) |
| 19 to 25 Years | 21 (100.0%) | 0 (0.0%) |
| 26 to 34 Years | 22 (100.0%) | 0 (0.0%) |
| 35 to 44 Years | 7 (100.0%) | 0 (0.0%) |
| 45 to 54 Years | 29 (100.0%) | 0 (0.0%) |
| 55 to 64 Years | 97 (98.0%) | 2 (2.0%) |
| 65 to 74 Years | 83 (100.0%) | 0 (0.0%) |
| 75 Years and older | 31 (100.0%) | 0 (0.0%) |
| Total | 310 (99.4%) | 2 (0.6%) |
Health Insurance Coverage by Citizenship Status in Indian Lake borough
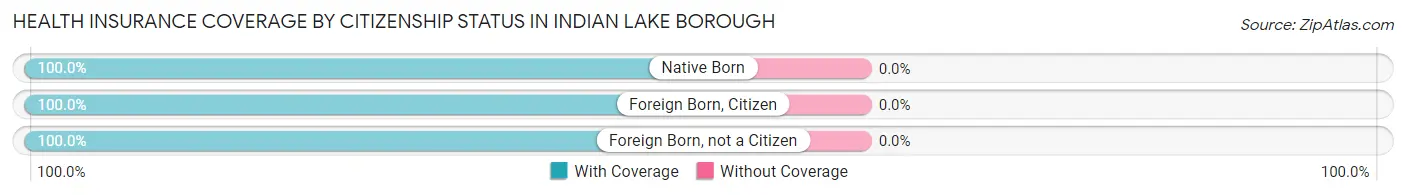
| Citizenship Status | With Coverage | Without Coverage |
| Native Born | 10 (100.0%) | 0 (0.0%) |
| Foreign Born, Citizen | 10 (100.0%) | 0 (0.0%) |
| Foreign Born, not a Citizen | 21 (100.0%) | 0 (0.0%) |
Health Insurance Coverage by Household Income in Indian Lake borough
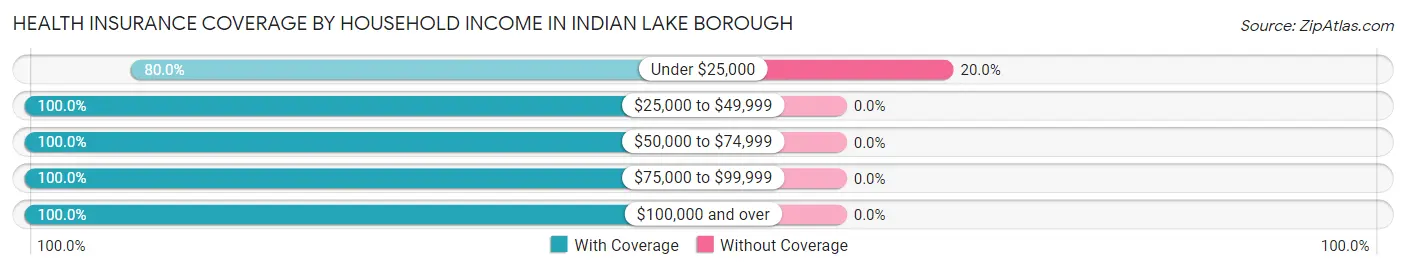
| Household Income | With Coverage | Without Coverage |
| Under $25,000 | 8 (80.0%) | 2 (20.0%) |
| $25,000 to $49,999 | 18 (100.0%) | 0 (0.0%) |
| $50,000 to $74,999 | 77 (100.0%) | 0 (0.0%) |
| $75,000 to $99,999 | 26 (100.0%) | 0 (0.0%) |
| $100,000 and over | 181 (100.0%) | 0 (0.0%) |
Public vs Private Health Insurance Coverage by Age in Indian Lake borough
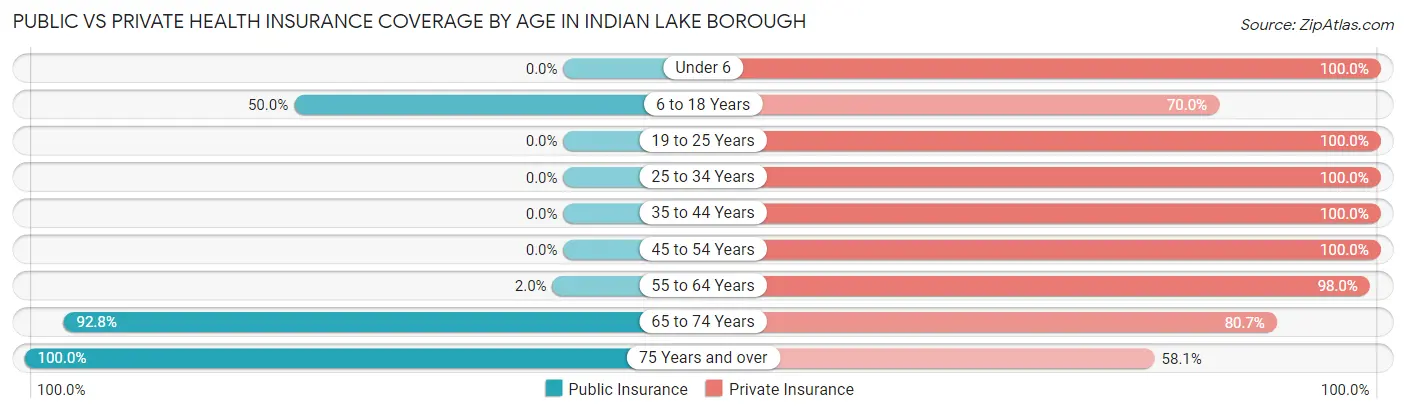
| Age Bracket | Public Insurance | Private Insurance |
| Under 6 | 0 (0.0%) | 10 (100.0%) |
| 6 to 18 Years | 5 (50.0%) | 7 (70.0%) |
| 19 to 25 Years | 0 (0.0%) | 21 (100.0%) |
| 25 to 34 Years | 0 (0.0%) | 22 (100.0%) |
| 35 to 44 Years | 0 (0.0%) | 7 (100.0%) |
| 45 to 54 Years | 0 (0.0%) | 29 (100.0%) |
| 55 to 64 Years | 2 (2.0%) | 97 (98.0%) |
| 65 to 74 Years | 77 (92.8%) | 67 (80.7%) |
| 75 Years and over | 31 (100.0%) | 18 (58.1%) |
| Total | 115 (36.9%) | 278 (89.1%) |
Disability Status by Sex by Age in Indian Lake borough
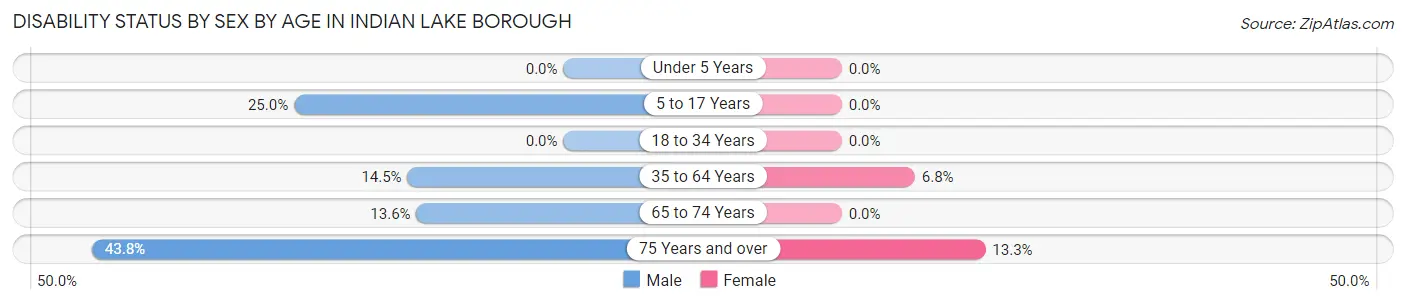
| Age Bracket | Male | Female |
| Under 5 Years | 0 (0.0%) | 0 (0.0%) |
| 5 to 17 Years | 2 (25.0%) | 0 (0.0%) |
| 18 to 34 Years | 0 (0.0%) | 0 (0.0%) |
| 35 to 64 Years | 11 (14.5%) | 4 (6.8%) |
| 65 to 74 Years | 6 (13.6%) | 0 (0.0%) |
| 75 Years and over | 7 (43.8%) | 2 (13.3%) |
Disability Class by Sex by Age in Indian Lake borough
Disability Class: Hearing Difficulty
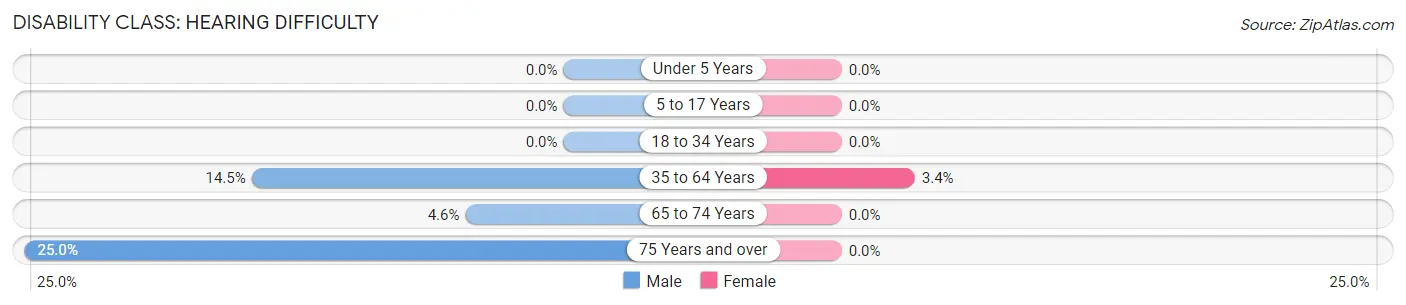
| Age Bracket | Male | Female |
| Under 5 Years | 0 (0.0%) | 0 (0.0%) |
| 5 to 17 Years | 0 (0.0%) | 0 (0.0%) |
| 18 to 34 Years | 0 (0.0%) | 0 (0.0%) |
| 35 to 64 Years | 11 (14.5%) | 2 (3.4%) |
| 65 to 74 Years | 2 (4.5%) | 0 (0.0%) |
| 75 Years and over | 4 (25.0%) | 0 (0.0%) |
Disability Class: Vision Difficulty
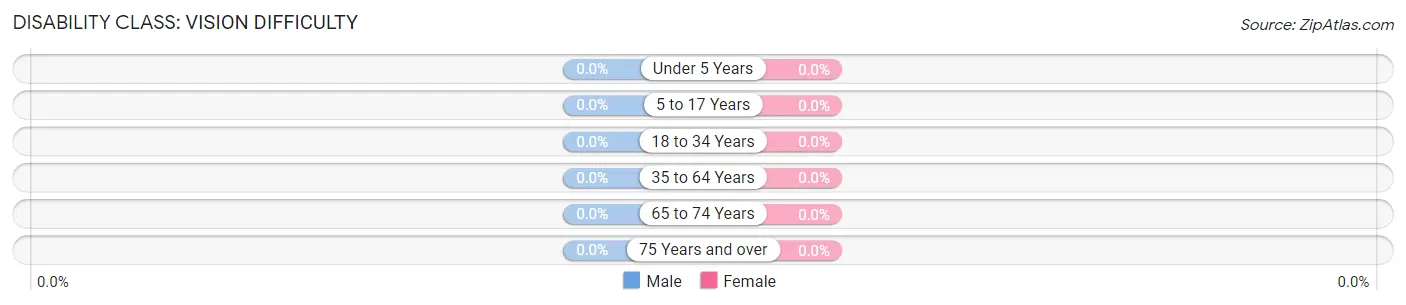
| Age Bracket | Male | Female |
| Under 5 Years | 0 (0.0%) | 0 (0.0%) |
| 5 to 17 Years | 0 (0.0%) | 0 (0.0%) |
| 18 to 34 Years | 0 (0.0%) | 0 (0.0%) |
| 35 to 64 Years | 0 (0.0%) | 0 (0.0%) |
| 65 to 74 Years | 0 (0.0%) | 0 (0.0%) |
| 75 Years and over | 0 (0.0%) | 0 (0.0%) |
Disability Class: Cognitive Difficulty
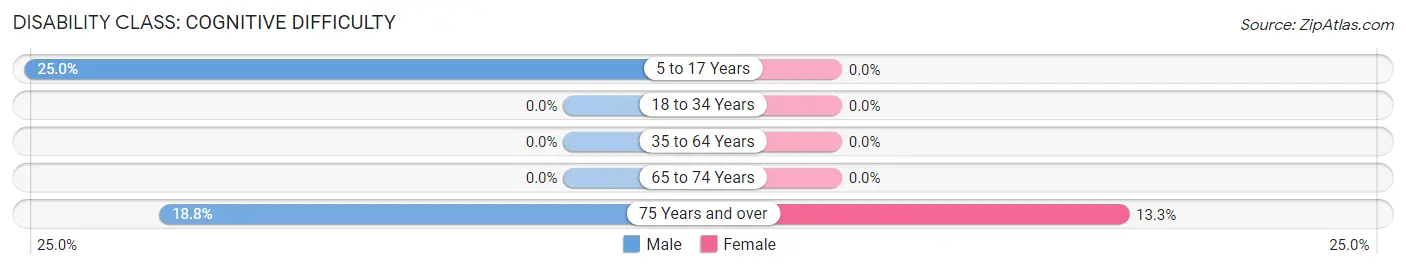
| Age Bracket | Male | Female |
| 5 to 17 Years | 2 (25.0%) | 0 (0.0%) |
| 18 to 34 Years | 0 (0.0%) | 0 (0.0%) |
| 35 to 64 Years | 0 (0.0%) | 0 (0.0%) |
| 65 to 74 Years | 0 (0.0%) | 0 (0.0%) |
| 75 Years and over | 3 (18.8%) | 2 (13.3%) |
Disability Class: Ambulatory Difficulty
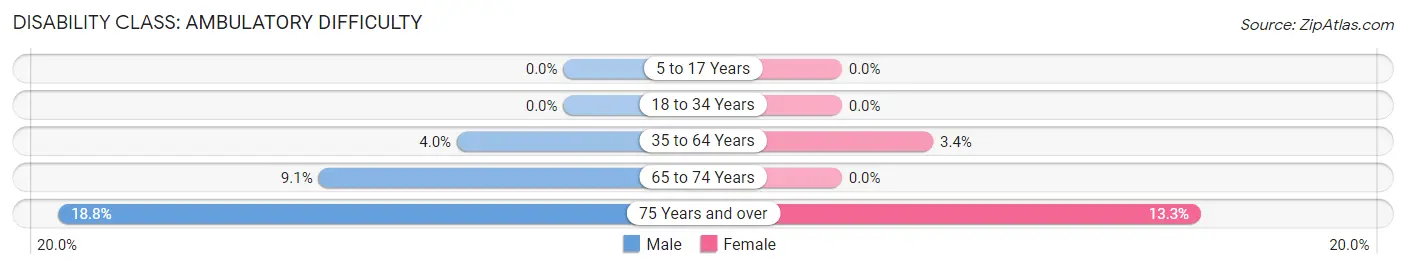
| Age Bracket | Male | Female |
| 5 to 17 Years | 0 (0.0%) | 0 (0.0%) |
| 18 to 34 Years | 0 (0.0%) | 0 (0.0%) |
| 35 to 64 Years | 3 (4.0%) | 2 (3.4%) |
| 65 to 74 Years | 4 (9.1%) | 0 (0.0%) |
| 75 Years and over | 3 (18.8%) | 2 (13.3%) |
Disability Class: Self-Care Difficulty
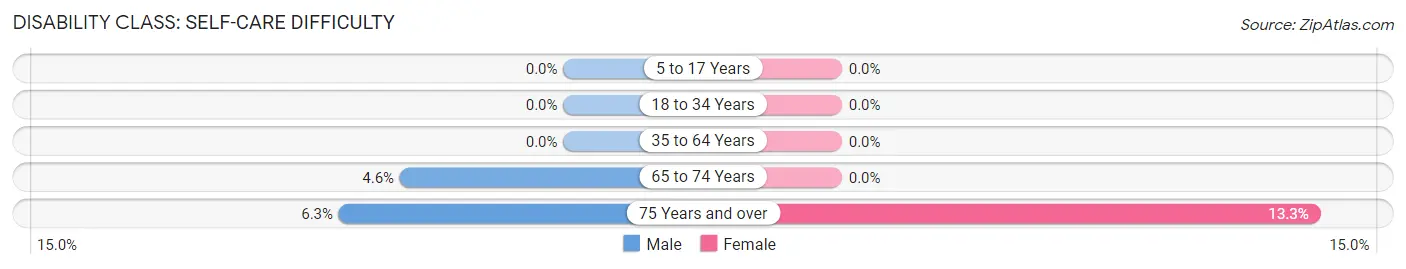
| Age Bracket | Male | Female |
| 5 to 17 Years | 0 (0.0%) | 0 (0.0%) |
| 18 to 34 Years | 0 (0.0%) | 0 (0.0%) |
| 35 to 64 Years | 0 (0.0%) | 0 (0.0%) |
| 65 to 74 Years | 2 (4.5%) | 0 (0.0%) |
| 75 Years and over | 1 (6.2%) | 2 (13.3%) |
Technology Access in Indian Lake borough
Computing Device Access in Indian Lake borough
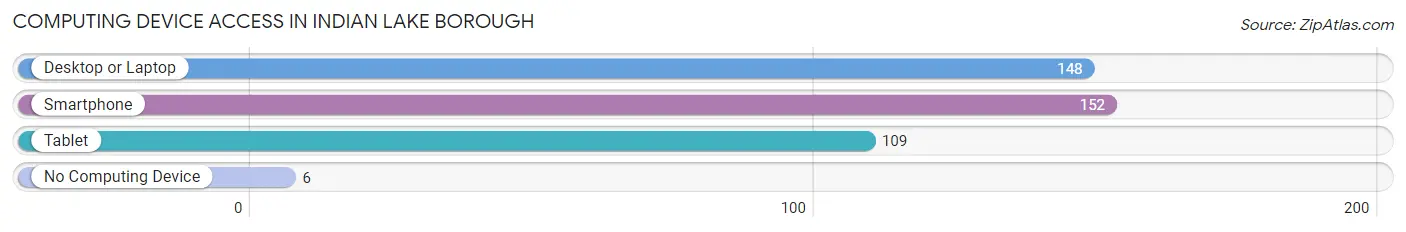
| Device Type | # Households | % Households |
| Desktop or Laptop | 148 | 89.7% |
| Smartphone | 152 | 92.1% |
| Tablet | 109 | 66.1% |
| No Computing Device | 6 | 3.6% |
| Total | 165 | 100.0% |
Internet Access in Indian Lake borough
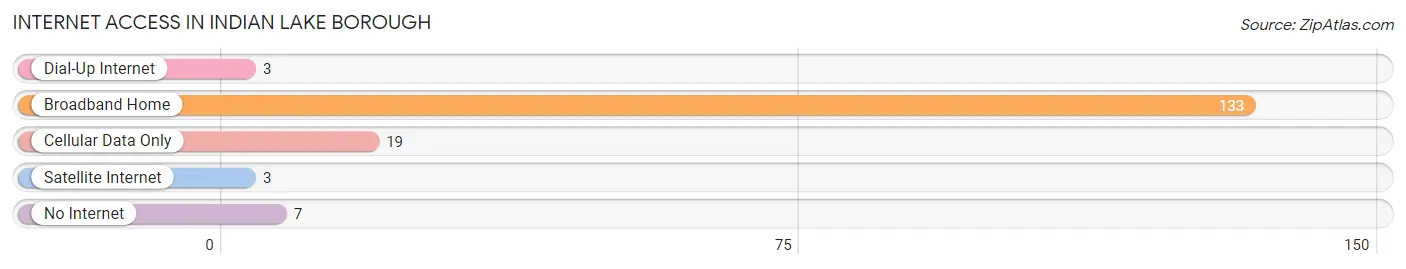
| Internet Type | # Households | % Households |
| Dial-Up Internet | 3 | 1.8% |
| Broadband Home | 133 | 80.6% |
| Cellular Data Only | 19 | 11.5% |
| Satellite Internet | 3 | 1.8% |
| No Internet | 7 | 4.2% |
| Total | 165 | 100.0% |
Indian Lake borough Summary
History
The history of Indian Lake Borough, Pennsylvania dates back to the late 1700s when the area was first settled by European settlers. The area was originally part of the larger Indian Lake Township, which was established in 1790. The area was originally inhabited by the Lenape Native Americans, who were displaced by the settlers. The area was known for its abundance of natural resources, including timber, fish, and game.
In 1845, the area was officially incorporated as the Borough of Indian Lake. The borough was named after the nearby lake, which was named for the Native Americans who once lived in the area. The borough was originally a small farming community, but it soon grew to become a popular summer resort destination. The area was known for its beautiful scenery and its abundance of outdoor activities, such as fishing, hunting, and boating.
In the late 1800s, the borough began to experience a period of rapid growth. The population increased from just over 500 in 1880 to over 1,000 by 1900. This growth was largely due to the influx of tourists who were drawn to the area for its natural beauty and recreational opportunities.
The borough continued to grow throughout the 20th century. By 2000, the population had grown to over 1,500. The borough is now home to a variety of businesses, including restaurants, shops, and hotels.
Geography
Indian Lake Borough is located in the northern part of Pennsylvania, in the Allegheny Mountains. The borough is situated in a valley between two mountain ranges, the Allegheny Front and the Allegheny Plateau. The borough is bordered by the towns of Indian Lake, Westmoreland County, and the boroughs of Donegal and Ligonier.
The borough covers an area of 1.3 square miles and is located at an elevation of 1,890 feet. The borough is home to the Indian Lake, which is a popular destination for fishing, boating, and swimming. The lake is fed by several small streams, including the Indian Creek and the Little Indian Creek.
The climate in Indian Lake Borough is classified as humid continental, with cold winters and warm summers. The average annual temperature is around 50 degrees Fahrenheit, with an average high of around 70 degrees in the summer and an average low of around 30 degrees in the winter.
Economy
The economy of Indian Lake Borough is largely based on tourism. The borough is home to several hotels, restaurants, and shops that cater to visitors. The borough is also home to several outdoor recreation businesses, such as fishing and hunting guides, boat rentals, and ski resorts.
The borough is also home to several manufacturing businesses, including a furniture factory and a metal fabrication plant. The borough is also home to several small businesses, such as auto repair shops, convenience stores, and gas stations.
Demographics
As of the 2010 census, the population of Indian Lake Borough was 1,541. The population is predominantly white, with a small minority population of African Americans, Hispanics, and Asians. The median household income is $41,944, and the median age is 44.
The borough is home to several churches, including the Indian Lake United Methodist Church, the Indian Lake Presbyterian Church, and the Indian Lake Baptist Church. The borough is also home to several schools, including the Indian Lake Elementary School, the Indian Lake Middle School, and the Indian Lake High School.
Common Questions
What is Per Capita Income in Indian Lake borough?
Per Capita income in Indian Lake borough is $72,070.
What is the Median Family Income in Indian Lake borough?
Median Family Income in Indian Lake borough is $141,750.
What is the Median Household income in Indian Lake borough?
Median Household Income in Indian Lake borough is $112,917.
What is Income or Wage Gap in Indian Lake borough?
Income or Wage Gap in Indian Lake borough is 36.4%.
Women in Indian Lake borough earn 63.6 cents for every dollar earned by a man.
What is Inequality or Gini Index in Indian Lake borough?
Inequality or Gini Index in Indian Lake borough is 0.40.
What is the Total Population of Indian Lake borough?
Total Population of Indian Lake borough is 314.
What is the Total Male Population of Indian Lake borough?
Total Male Population of Indian Lake borough is 180.
What is the Total Female Population of Indian Lake borough?
Total Female Population of Indian Lake borough is 134.
What is the Ratio of Males per 100 Females in Indian Lake borough?
There are 134.33 Males per 100 Females in Indian Lake borough.
What is the Ratio of Females per 100 Males in Indian Lake borough?
There are 74.44 Females per 100 Males in Indian Lake borough.
What is the Median Population Age in Indian Lake borough?
Median Population Age in Indian Lake borough is 60.5 Years.
What is the Average Family Size in Indian Lake borough
Average Family Size in Indian Lake borough is 2.2 People.
What is the Average Household Size in Indian Lake borough
Average Household Size in Indian Lake borough is 1.9 People.
How Large is the Labor Force in Indian Lake borough?
There are 184 People in the Labor Forcein in Indian Lake borough.
What is the Percentage of People in the Labor Force in Indian Lake borough?
61.7% of People are in the Labor Force in Indian Lake borough.
What is the Unemployment Rate in Indian Lake borough?
Unemployment Rate in Indian Lake borough is 3.3%.