New Castle Northwest, PA Map & Demographics
New Castle Northwest Map
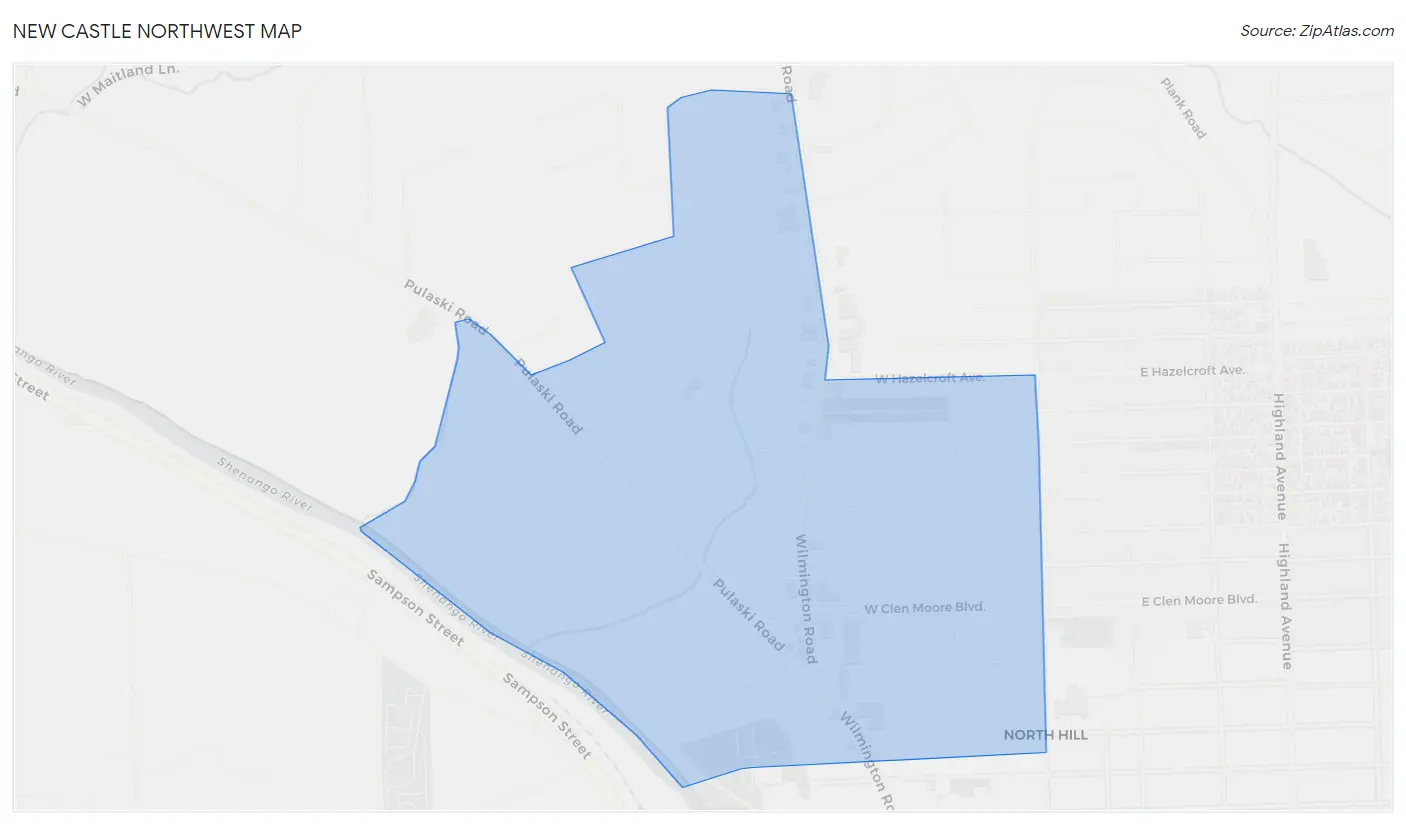
New Castle Northwest Overview
$30,787
PER CAPITA INCOME
$92,704
AVG FAMILY INCOME
$69,659
AVG HOUSEHOLD INCOME
31.5%
WAGE / INCOME GAP [ % ]
68.5¢/ $1
WAGE / INCOME GAP [ $ ]
0.32
INEQUALITY / GINI INDEX
1,440
TOTAL POPULATION
597
MALE POPULATION
843
FEMALE POPULATION
70.82
MALES / 100 FEMALES
141.21
FEMALES / 100 MALES
40.9
MEDIAN AGE
3.0
AVG FAMILY SIZE
2.5
AVG HOUSEHOLD SIZE
725
LABOR FORCE [ PEOPLE ]
58.3%
PERCENT IN LABOR FORCE
2.6%
UNEMPLOYMENT RATE
Income in New Castle Northwest
Income Overview in New Castle Northwest
Per Capita Income in New Castle Northwest is $30,787, while median incomes of families and households are $92,704 and $69,659 respectively.
| Characteristic | Number | Measure |
| Per Capita Income | 1,440 | $30,787 |
| Median Family Income | 398 | $92,704 |
| Mean Family Income | 398 | $86,477 |
| Median Household Income | 585 | $69,659 |
| Mean Household Income | 585 | $75,339 |
| Income Deficit | 398 | $0 |
| Wage / Income Gap (%) | 1,440 | 31.52% |
| Wage / Income Gap ($) | 1,440 | 68.48¢ per $1 |
| Gini / Inequality Index | 1,440 | 0.32 |
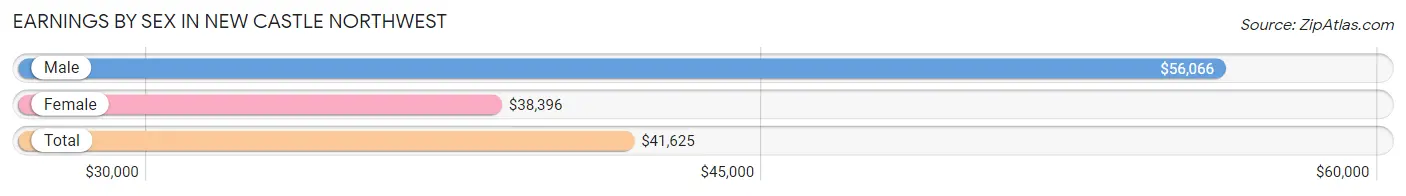
Earnings by Sex in New Castle Northwest
Average Earnings in New Castle Northwest are $41,625, $56,066 for men and $38,396 for women, a difference of 31.5%.
| Sex | Number | Average Earnings |
| Male | 244 (33.0%) | $56,066 |
| Female | 495 (67.0%) | $38,396 |
| Total | 739 (100.0%) | $41,625 |
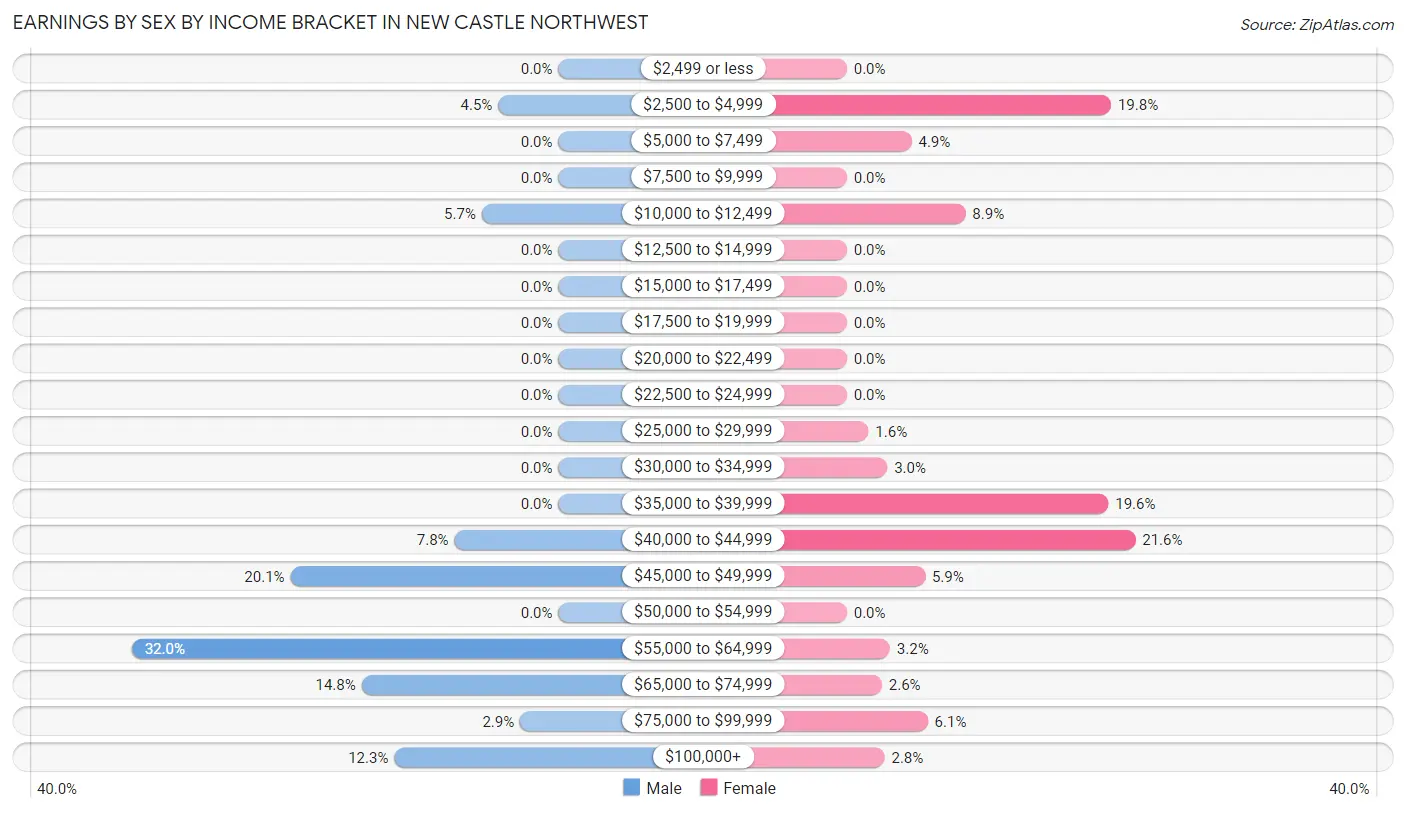
Earnings by Sex by Income Bracket in New Castle Northwest
The most common earnings brackets in New Castle Northwest are $55,000 to $64,999 for men (78 | 32.0%) and $40,000 to $44,999 for women (107 | 21.6%).
| Income | Male | Female |
| $2,499 or less | 0 (0.0%) | 0 (0.0%) |
| $2,500 to $4,999 | 11 (4.5%) | 98 (19.8%) |
| $5,000 to $7,499 | 0 (0.0%) | 24 (4.9%) |
| $7,500 to $9,999 | 0 (0.0%) | 0 (0.0%) |
| $10,000 to $12,499 | 14 (5.7%) | 44 (8.9%) |
| $12,500 to $14,999 | 0 (0.0%) | 0 (0.0%) |
| $15,000 to $17,499 | 0 (0.0%) | 0 (0.0%) |
| $17,500 to $19,999 | 0 (0.0%) | 0 (0.0%) |
| $20,000 to $22,499 | 0 (0.0%) | 0 (0.0%) |
| $22,500 to $24,999 | 0 (0.0%) | 0 (0.0%) |
| $25,000 to $29,999 | 0 (0.0%) | 8 (1.6%) |
| $30,000 to $34,999 | 0 (0.0%) | 15 (3.0%) |
| $35,000 to $39,999 | 0 (0.0%) | 97 (19.6%) |
| $40,000 to $44,999 | 19 (7.8%) | 107 (21.6%) |
| $45,000 to $49,999 | 49 (20.1%) | 29 (5.9%) |
| $50,000 to $54,999 | 0 (0.0%) | 0 (0.0%) |
| $55,000 to $64,999 | 78 (32.0%) | 16 (3.2%) |
| $65,000 to $74,999 | 36 (14.7%) | 13 (2.6%) |
| $75,000 to $99,999 | 7 (2.9%) | 30 (6.1%) |
| $100,000+ | 30 (12.3%) | 14 (2.8%) |
| Total | 244 (100.0%) | 495 (100.0%) |
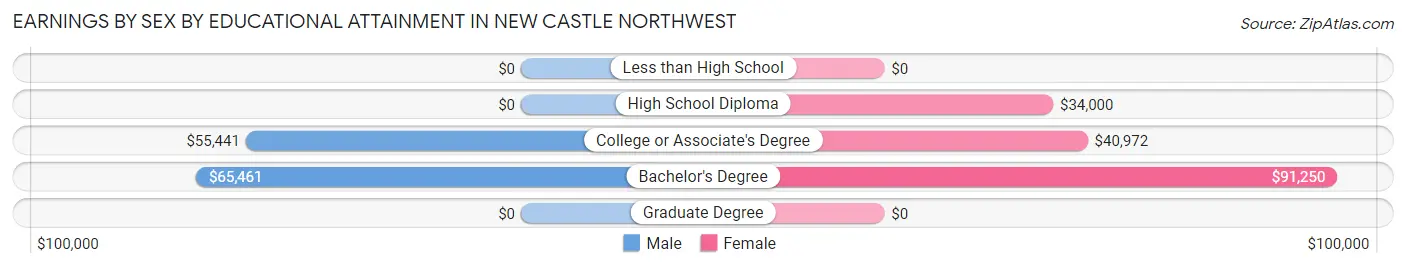
Earnings by Sex by Educational Attainment in New Castle Northwest
Average earnings in New Castle Northwest are $56,324 for men and $40,278 for women, a difference of 28.5%. Men with an educational attainment of bachelor's degree enjoy the highest average annual earnings of $65,461, while those with college or associate's degree education earn the least with $55,441. Women with an educational attainment of bachelor's degree earn the most with the average annual earnings of $91,250, while those with high school diploma education have the smallest earnings of $34,000.
| Educational Attainment | Male Income | Female Income |
| Less than High School | - | - |
| High School Diploma | - | - |
| College or Associate's Degree | $55,441 | $40,972 |
| Bachelor's Degree | $65,461 | $91,250 |
| Graduate Degree | - | - |
| Total | $56,324 | $40,278 |
Family Income in New Castle Northwest
Family Income Brackets in New Castle Northwest
According to the New Castle Northwest family income data, there are 124 families falling into the $75,000 to $99,999 income range, which is the most common income bracket and makes up 31.2% of all families.
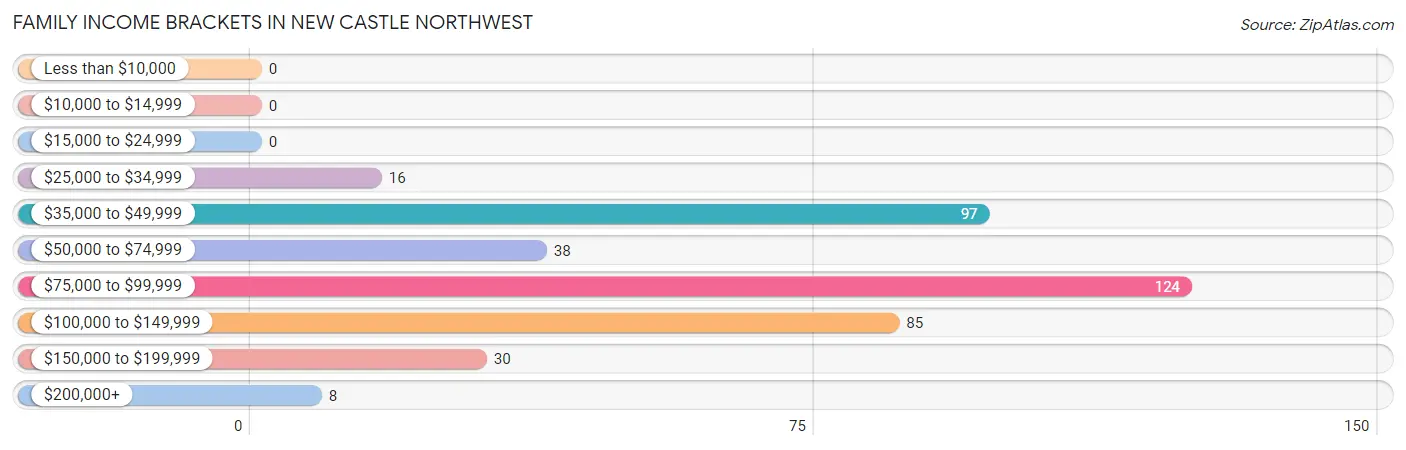
| Income Bracket | # Families | % Families |
| Less than $10,000 | 0 | 0.0% |
| $10,000 to $14,999 | 0 | 0.0% |
| $15,000 to $24,999 | 0 | 0.0% |
| $25,000 to $34,999 | 16 | 4.0% |
| $35,000 to $49,999 | 97 | 24.4% |
| $50,000 to $74,999 | 38 | 9.5% |
| $75,000 to $99,999 | 124 | 31.2% |
| $100,000 to $149,999 | 85 | 21.4% |
| $150,000 to $199,999 | 30 | 7.5% |
| $200,000+ | 8 | 2.0% |
Family Income by Famaliy Size in New Castle Northwest
3-person families (107 | 26.9%) account for the highest median family income in New Castle Northwest with $94,005 per family, while 2-person families (189 | 47.5%) have the highest median income of $44,032 per family member.
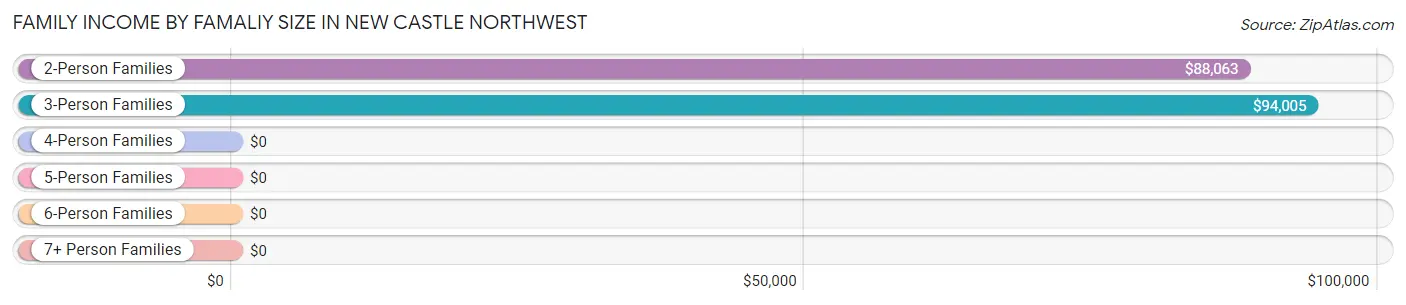
| Income Bracket | # Families | Median Income |
| 2-Person Families | 189 (47.5%) | $88,063 |
| 3-Person Families | 107 (26.9%) | $94,005 |
| 4-Person Families | 61 (15.3%) | $0 |
| 5-Person Families | 19 (4.8%) | $0 |
| 6-Person Families | 22 (5.5%) | $0 |
| 7+ Person Families | 0 (0.0%) | $0 |
| Total | 398 (100.0%) | $92,704 |
Family Income by Number of Earners in New Castle Northwest
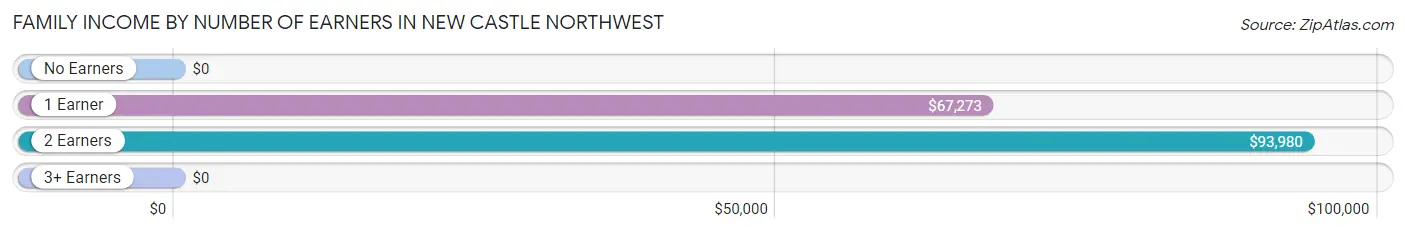
| Number of Earners | # Families | Median Income |
| No Earners | 38 (9.6%) | $0 |
| 1 Earner | 124 (31.2%) | $67,273 |
| 2 Earners | 228 (57.3%) | $93,980 |
| 3+ Earners | 8 (2.0%) | $0 |
| Total | 398 (100.0%) | $92,704 |
Household Income in New Castle Northwest
Household Income Brackets in New Castle Northwest
With 139 households falling in the category, the $100,000 to $149,999 income range is the most frequent in New Castle Northwest, accounting for 23.8% of all households.
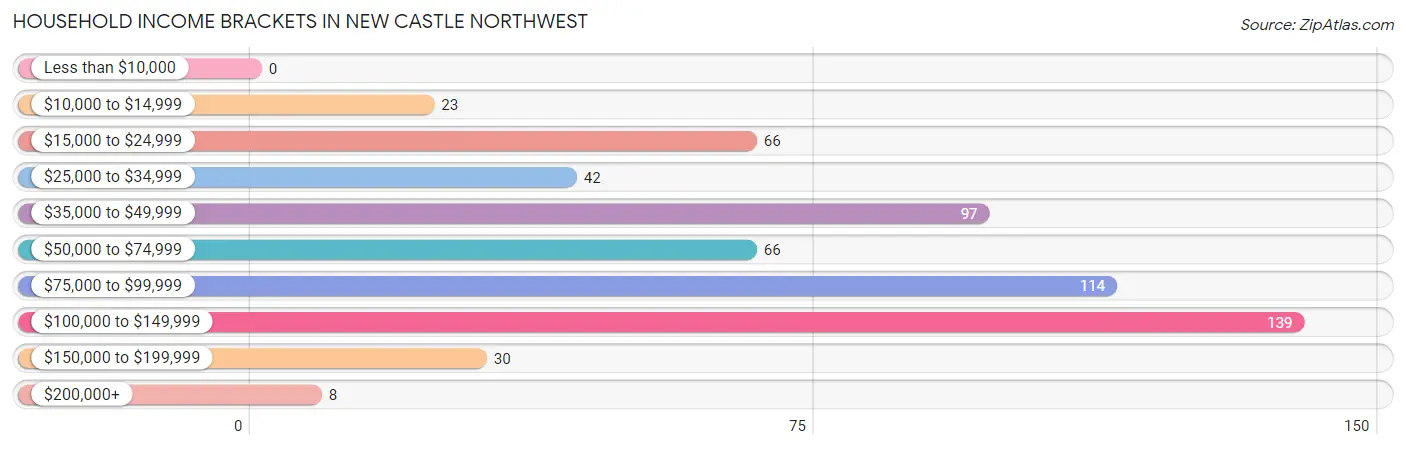
| Income Bracket | # Households | % Households |
| Less than $10,000 | 0 | 0.0% |
| $10,000 to $14,999 | 23 | 3.9% |
| $15,000 to $24,999 | 66 | 11.3% |
| $25,000 to $34,999 | 42 | 7.2% |
| $35,000 to $49,999 | 97 | 16.6% |
| $50,000 to $74,999 | 66 | 11.3% |
| $75,000 to $99,999 | 114 | 19.5% |
| $100,000 to $149,999 | 139 | 23.8% |
| $150,000 to $199,999 | 30 | 5.1% |
| $200,000+ | 8 | 1.4% |
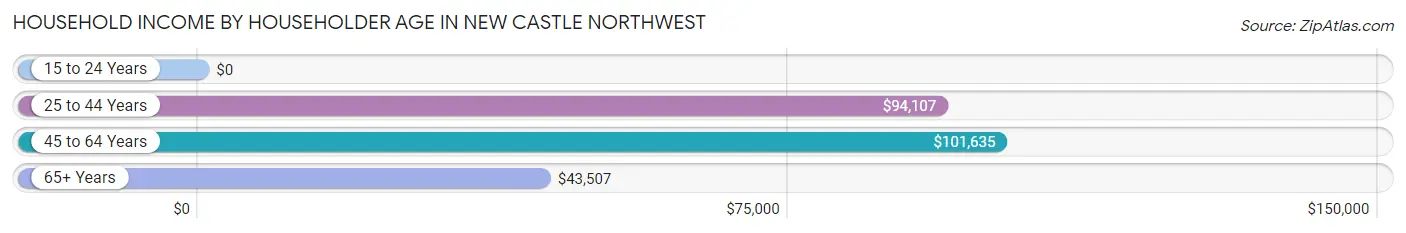
Household Income by Householder Age in New Castle Northwest
The median household income in New Castle Northwest is $69,659, with the highest median household income of $101,635 found in the 45 to 64 years age bracket for the primary householder. A total of 91 households (15.6%) fall into this category.
| Income Bracket | # Households | Median Income |
| 15 to 24 Years | 0 (0.0%) | $0 |
| 25 to 44 Years | 219 (37.4%) | $94,107 |
| 45 to 64 Years | 91 (15.6%) | $101,635 |
| 65+ Years | 275 (47.0%) | $43,507 |
| Total | 585 (100.0%) | $69,659 |
Poverty in New Castle Northwest
Income Below Poverty by Sex and Age in New Castle Northwest
With 2.4% poverty level for males and 5.1% for females among the residents of New Castle Northwest, 18 to 24 year old males and 25 to 34 year old females are the most vulnerable to poverty, with 14 males (20.3%) and 17 females (51.5%) in their respective age groups living below the poverty level.
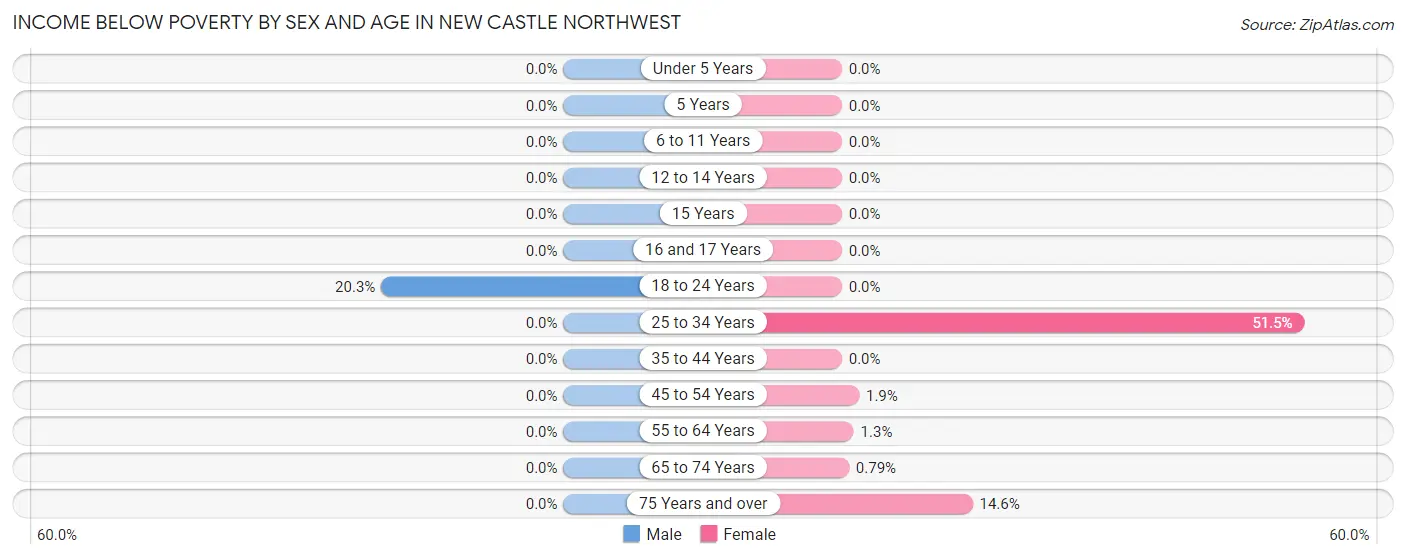
| Age Bracket | Male | Female |
| Under 5 Years | 0 (0.0%) | 0 (0.0%) |
| 5 Years | 0 (0.0%) | 0 (0.0%) |
| 6 to 11 Years | 0 (0.0%) | 0 (0.0%) |
| 12 to 14 Years | 0 (0.0%) | 0 (0.0%) |
| 15 Years | 0 (0.0%) | 0 (0.0%) |
| 16 and 17 Years | 0 (0.0%) | 0 (0.0%) |
| 18 to 24 Years | 14 (20.3%) | 0 (0.0%) |
| 25 to 34 Years | 0 (0.0%) | 17 (51.5%) |
| 35 to 44 Years | 0 (0.0%) | 0 (0.0%) |
| 45 to 54 Years | 0 (0.0%) | 1 (1.9%) |
| 55 to 64 Years | 0 (0.0%) | 1 (1.3%) |
| 65 to 74 Years | 0 (0.0%) | 1 (0.8%) |
| 75 Years and over | 0 (0.0%) | 23 (14.6%) |
| Total | 14 (2.4%) | 43 (5.1%) |
Income Above Poverty by Sex and Age in New Castle Northwest
According to the poverty statistics in New Castle Northwest, males aged under 5 years and females aged 6 to 11 years are the age groups that are most secure financially, with 100.0% of males and 100.0% of females in these age groups living above the poverty line.
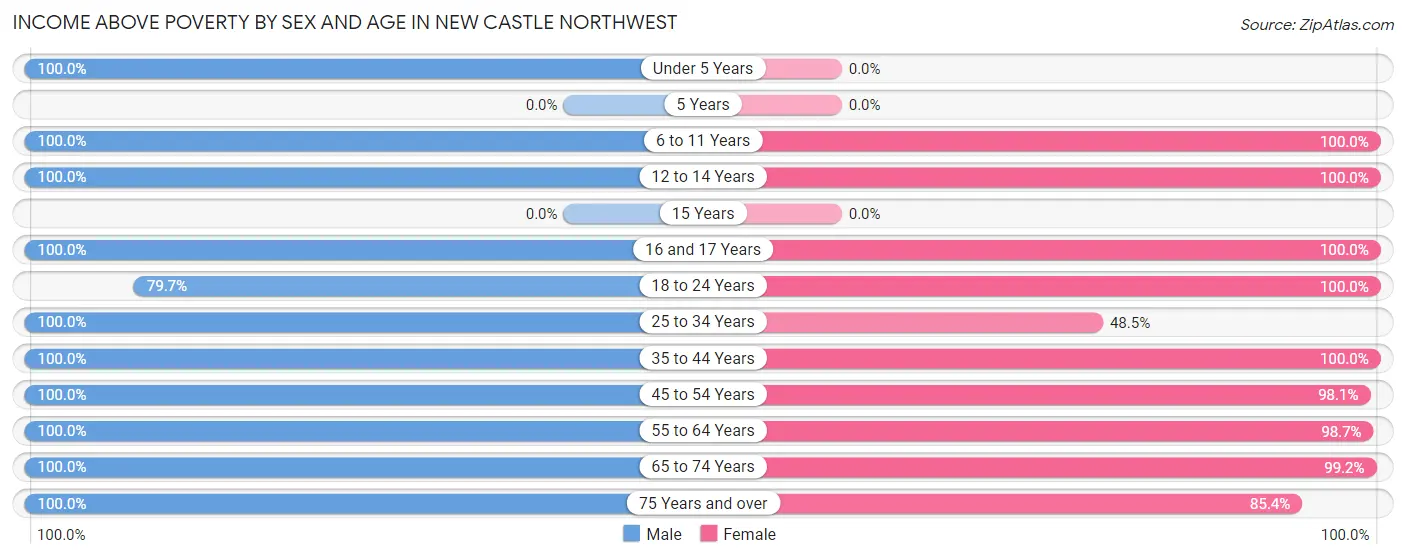
| Age Bracket | Male | Female |
| Under 5 Years | 20 (100.0%) | 0 (0.0%) |
| 5 Years | 0 (0.0%) | 0 (0.0%) |
| 6 to 11 Years | 29 (100.0%) | 22 (100.0%) |
| 12 to 14 Years | 75 (100.0%) | 50 (100.0%) |
| 15 Years | 0 (0.0%) | 0 (0.0%) |
| 16 and 17 Years | 26 (100.0%) | 26 (100.0%) |
| 18 to 24 Years | 55 (79.7%) | 97 (100.0%) |
| 25 to 34 Years | 57 (100.0%) | 16 (48.5%) |
| 35 to 44 Years | 105 (100.0%) | 203 (100.0%) |
| 45 to 54 Years | 58 (100.0%) | 51 (98.1%) |
| 55 to 64 Years | 29 (100.0%) | 75 (98.7%) |
| 65 to 74 Years | 87 (100.0%) | 125 (99.2%) |
| 75 Years and over | 42 (100.0%) | 135 (85.4%) |
| Total | 583 (97.7%) | 800 (94.9%) |
Income Below Poverty Among Married-Couple Families in New Castle Northwest
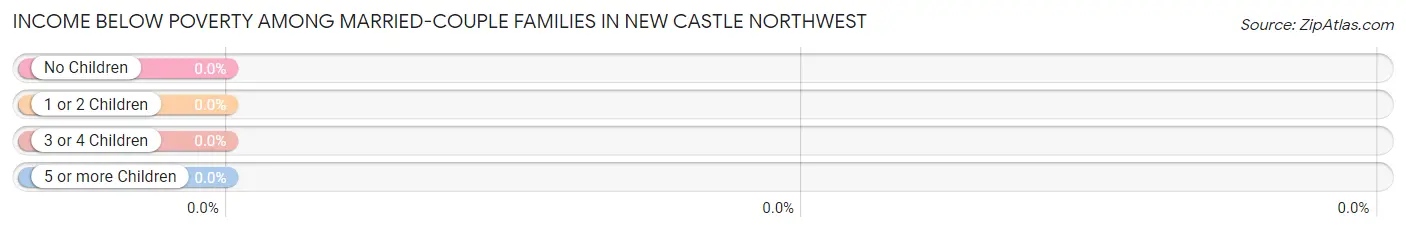
| Children | Above Poverty | Below Poverty |
| No Children | 170 (100.0%) | 0 (0.0%) |
| 1 or 2 Children | 85 (100.0%) | 0 (0.0%) |
| 3 or 4 Children | 22 (100.0%) | 0 (0.0%) |
| 5 or more Children | 0 (0.0%) | 0 (0.0%) |
| Total | 277 (100.0%) | 0 (0.0%) |
Income Below Poverty Among Single-Parent Households in New Castle Northwest
| Children | Single Father | Single Mother |
| No Children | 0 (0.0%) | 0 (0.0%) |
| 1 or 2 Children | 0 (0.0%) | 0 (0.0%) |
| 3 or 4 Children | 0 (0.0%) | 0 (0.0%) |
| 5 or more Children | 0 (0.0%) | 0 (0.0%) |
| Total | 0 (0.0%) | 0 (0.0%) |
Income Below Poverty Among Married-Couple vs Single-Parent Households in New Castle Northwest
| Children | Married-Couple Families | Single-Parent Households |
| No Children | 0 (0.0%) | 0 (0.0%) |
| 1 or 2 Children | 0 (0.0%) | 0 (0.0%) |
| 3 or 4 Children | 0 (0.0%) | 0 (0.0%) |
| 5 or more Children | 0 (0.0%) | 0 (0.0%) |
| Total | 0 (0.0%) | 0 (0.0%) |
Race in New Castle Northwest
The most populous races in New Castle Northwest are White / Caucasian (1,440 | 100.0%), and Hispanic or Latino (29 | 2.0%).
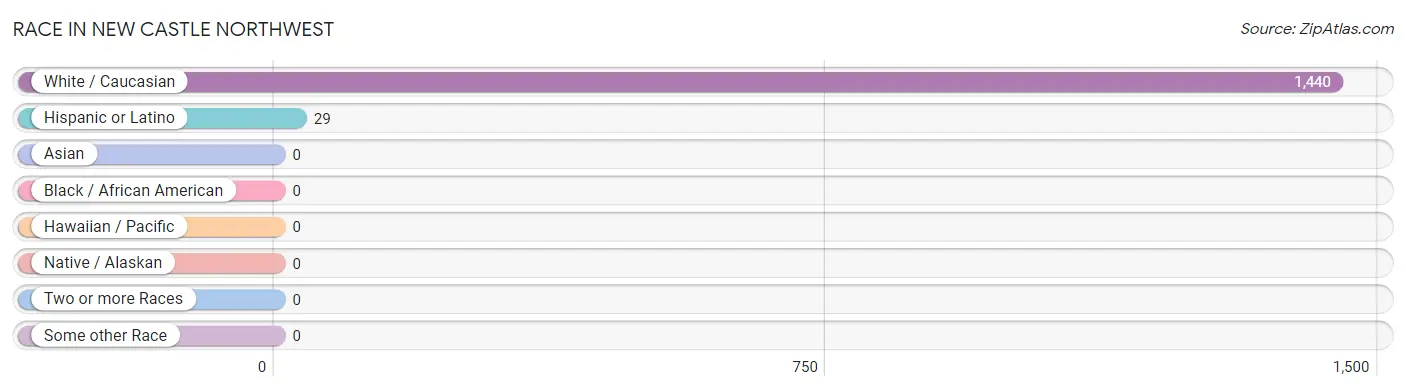
| Race | # Population | % Population |
| Asian | 0 | 0.0% |
| Black / African American | 0 | 0.0% |
| Hawaiian / Pacific | 0 | 0.0% |
| Hispanic or Latino | 29 | 2.0% |
| Native / Alaskan | 0 | 0.0% |
| White / Caucasian | 1,440 | 100.0% |
| Two or more Races | 0 | 0.0% |
| Some other Race | 0 | 0.0% |
| Total | 1,440 | 100.0% |
Ancestry in New Castle Northwest
The most populous ancestries reported in New Castle Northwest are Italian (487 | 33.8%), Polish (306 | 21.2%), German (300 | 20.8%), Scotch-Irish (101 | 7.0%), and Irish (62 | 4.3%), together accounting for 87.2% of all New Castle Northwest residents.
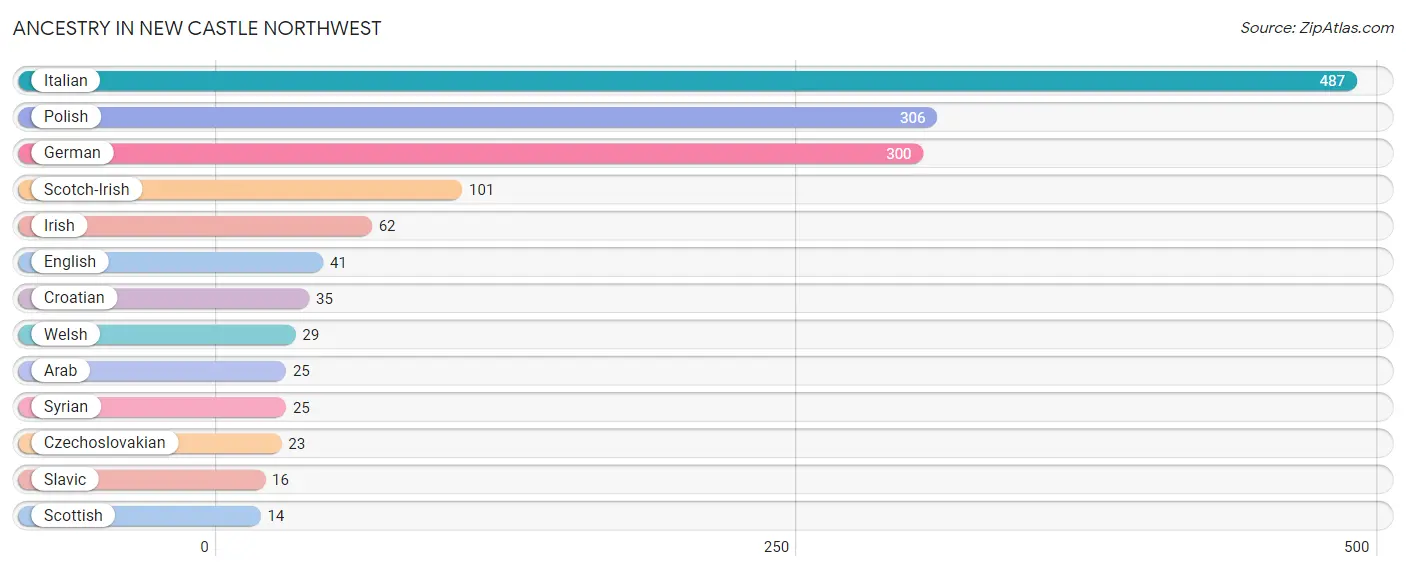
| Ancestry | # Population | % Population |
| Arab | 25 | 1.7% |
| Croatian | 35 | 2.4% |
| Czechoslovakian | 23 | 1.6% |
| English | 41 | 2.9% |
| German | 300 | 20.8% |
| Irish | 62 | 4.3% |
| Italian | 487 | 33.8% |
| Polish | 306 | 21.2% |
| Scotch-Irish | 101 | 7.0% |
| Scottish | 14 | 1.0% |
| Slavic | 16 | 1.1% |
| Syrian | 25 | 1.7% |
| Welsh | 29 | 2.0% | View All 13 Rows |
Immigrants in New Castle Northwest

| Immigration Origin | # Population | % Population | View All 0 Rows |
Sex and Age in New Castle Northwest
Sex and Age in New Castle Northwest
The most populous age groups in New Castle Northwest are 10 to 14 Years (88 | 14.7%) for men and 85 Years and over (112 | 13.3%) for women.
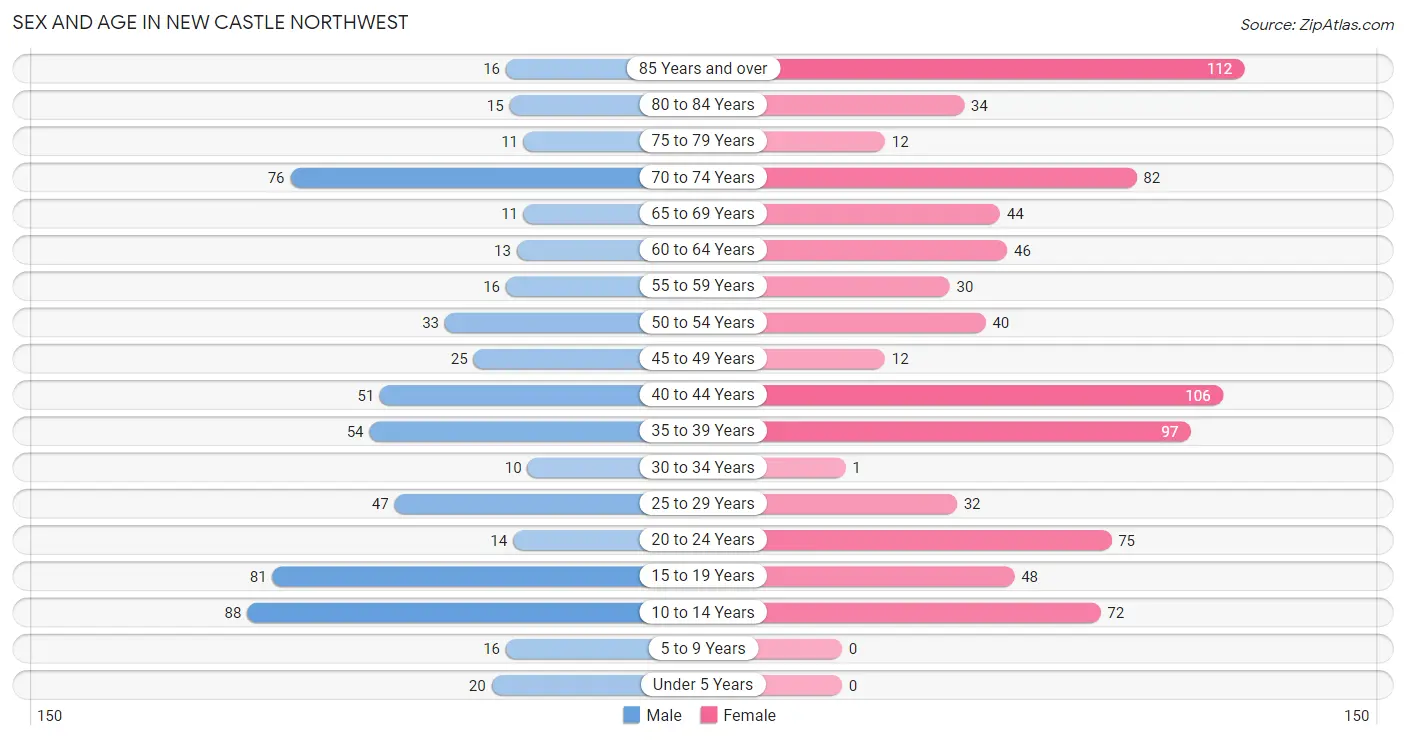
| Age Bracket | Male | Female |
| Under 5 Years | 20 (3.4%) | 0 (0.0%) |
| 5 to 9 Years | 16 (2.7%) | 0 (0.0%) |
| 10 to 14 Years | 88 (14.7%) | 72 (8.5%) |
| 15 to 19 Years | 81 (13.6%) | 48 (5.7%) |
| 20 to 24 Years | 14 (2.4%) | 75 (8.9%) |
| 25 to 29 Years | 47 (7.9%) | 32 (3.8%) |
| 30 to 34 Years | 10 (1.7%) | 1 (0.1%) |
| 35 to 39 Years | 54 (9.0%) | 97 (11.5%) |
| 40 to 44 Years | 51 (8.5%) | 106 (12.6%) |
| 45 to 49 Years | 25 (4.2%) | 12 (1.4%) |
| 50 to 54 Years | 33 (5.5%) | 40 (4.7%) |
| 55 to 59 Years | 16 (2.7%) | 30 (3.6%) |
| 60 to 64 Years | 13 (2.2%) | 46 (5.5%) |
| 65 to 69 Years | 11 (1.8%) | 44 (5.2%) |
| 70 to 74 Years | 76 (12.7%) | 82 (9.7%) |
| 75 to 79 Years | 11 (1.8%) | 12 (1.4%) |
| 80 to 84 Years | 15 (2.5%) | 34 (4.0%) |
| 85 Years and over | 16 (2.7%) | 112 (13.3%) |
| Total | 597 (100.0%) | 843 (100.0%) |
Families and Households in New Castle Northwest
Median Family Size in New Castle Northwest
The median family size in New Castle Northwest is 2.97 persons per family, with single female/mother families (81 | 20.3%) accounting for the largest median family size of 3.57 persons per family. On the other hand, single male/father families (40 | 10.1%) represent the smallest median family size with 2.68 persons per family.
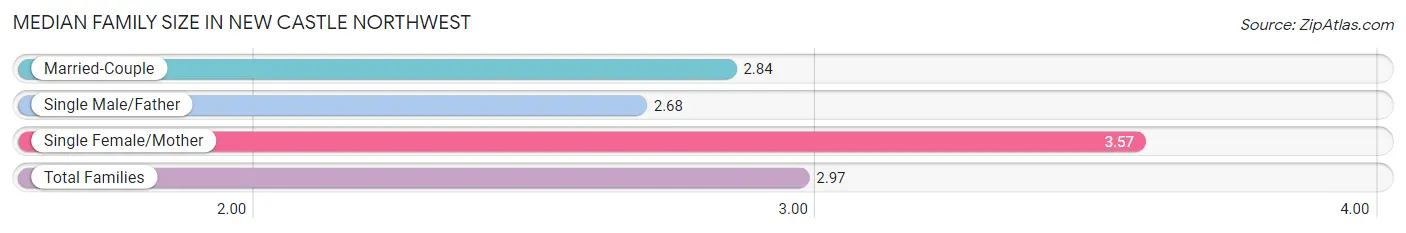
| Family Type | # Families | Family Size |
| Married-Couple | 277 (69.6%) | 2.84 |
| Single Male/Father | 40 (10.1%) | 2.68 |
| Single Female/Mother | 81 (20.3%) | 3.57 |
| Total Families | 398 (100.0%) | 2.97 |
Median Household Size in New Castle Northwest
The median household size in New Castle Northwest is 2.45 persons per household, with single female/mother households (81 | 13.9%) accounting for the largest median household size of 3.57 persons per household. non-family households (187 | 32.0%) represent the smallest median household size with 1.22 persons per household.
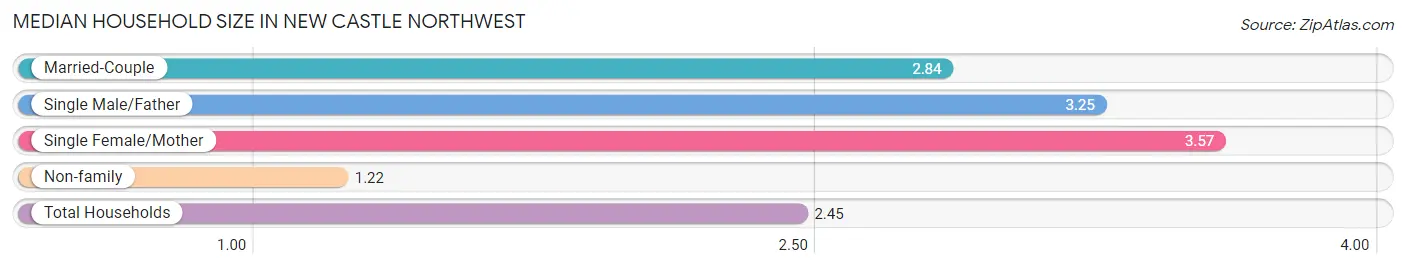
| Household Type | # Households | Household Size |
| Married-Couple | 277 (47.3%) | 2.84 |
| Single Male/Father | 40 (6.8%) | 3.25 |
| Single Female/Mother | 81 (13.9%) | 3.57 |
| Non-family | 187 (32.0%) | 1.22 |
| Total Households | 585 (100.0%) | 2.45 |
Household Size by Marriage Status in New Castle Northwest
Out of a total of 585 households in New Castle Northwest, 398 (68.0%) are family households, while 187 (32.0%) are nonfamily households. The most numerous type of family households are 2-person households, comprising 189, and the most common type of nonfamily households are 1-person households, comprising 154.
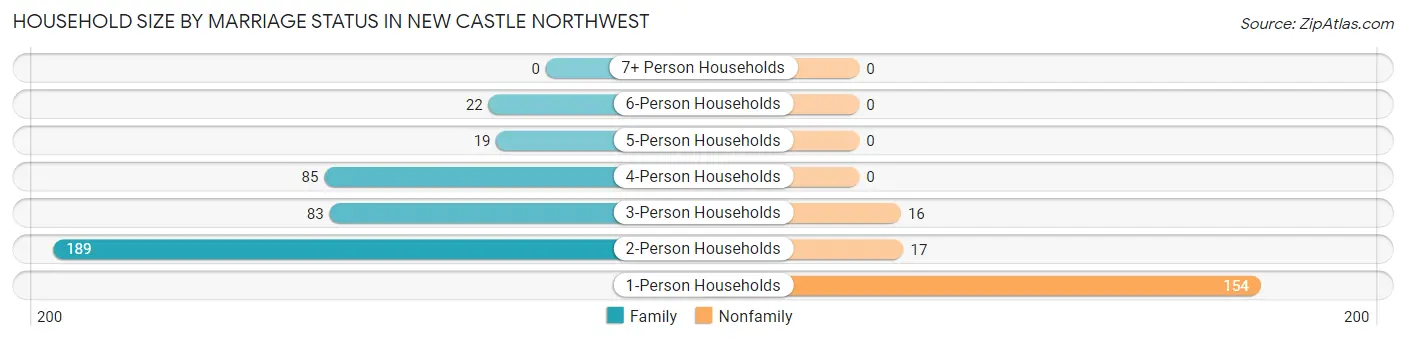
| Household Size | Family Households | Nonfamily Households |
| 1-Person Households | - | 154 (26.3%) |
| 2-Person Households | 189 (32.3%) | 17 (2.9%) |
| 3-Person Households | 83 (14.2%) | 16 (2.7%) |
| 4-Person Households | 85 (14.5%) | 0 (0.0%) |
| 5-Person Households | 19 (3.3%) | 0 (0.0%) |
| 6-Person Households | 22 (3.8%) | 0 (0.0%) |
| 7+ Person Households | 0 (0.0%) | 0 (0.0%) |
| Total | 398 (68.0%) | 187 (32.0%) |
Female Fertility in New Castle Northwest
Fertility by Age in New Castle Northwest
| Age Bracket | Women with Births | Births / 1,000 Women |
| 15 to 19 years | 0 (0.0%) | 0.0 |
| 20 to 34 years | 0 (0.0%) | 0.0 |
| 35 to 50 years | 0 (0.0%) | 0.0 |
| Total | 0 (0.0%) | 0.0 |
Fertility by Age by Marriage Status in New Castle Northwest
| Age Bracket | Married | Unmarried |
| 15 to 19 years | 0 (0.0%) | 0 (0.0%) |
| 20 to 34 years | 0 (0.0%) | 0 (0.0%) |
| 35 to 50 years | 0 (0.0%) | 0 (0.0%) |
| Total | 0 (0.0%) | 0 (0.0%) |
Fertility by Education in New Castle Northwest
| Educational Attainment | Women with Births | Births / 1,000 Women |
| Less than High School | 0 (0.0%) | 0.0 |
| High School Diploma | 0 (0.0%) | 0.0 |
| College or Associate's Degree | 0 (0.0%) | 0.0 |
| Bachelor's Degree | 0 (0.0%) | 0.0 |
| Graduate Degree | 0 (0.0%) | 0.0 |
| Total | 0 (0.0%) | 0.0 |
Fertility by Education by Marriage Status in New Castle Northwest
| Educational Attainment | Married | Unmarried |
| Less than High School | 0 (0.0%) | 0 (0.0%) |
| High School Diploma | 0 (0.0%) | 0 (0.0%) |
| College or Associate's Degree | 0 (0.0%) | 0 (0.0%) |
| Bachelor's Degree | 0 (0.0%) | 0 (0.0%) |
| Graduate Degree | 0 (0.0%) | 0 (0.0%) |
| Total | 0 (0.0%) | 0 (0.0%) |
Employment Characteristics in New Castle Northwest
Employment by Class of Employer in New Castle Northwest
Among the 676 employed individuals in New Castle Northwest, private company employees (519 | 76.8%), local government employees (75 | 11.1%), and not-for-profit organizations (59 | 8.7%) make up the most common classes of employment.
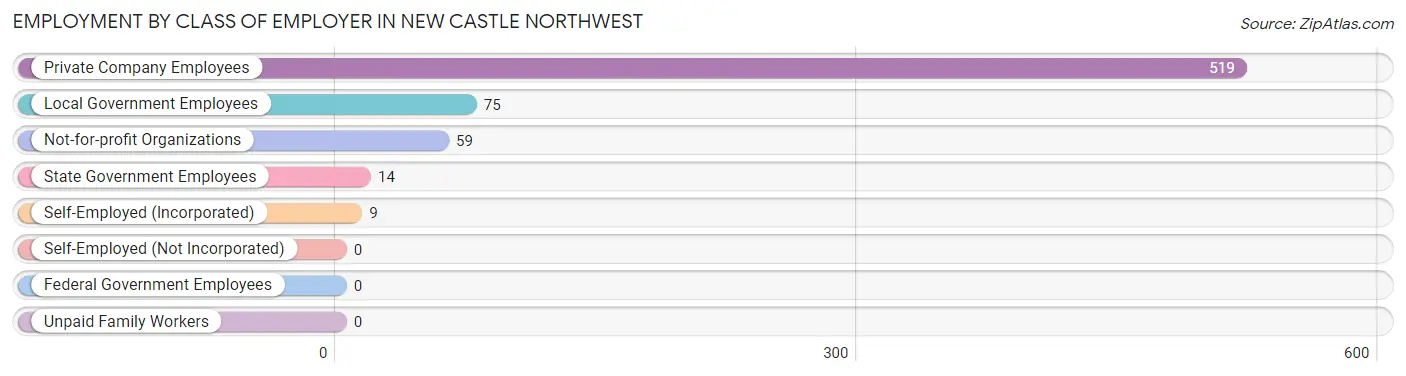
| Employer Class | # Employees | % Employees |
| Private Company Employees | 519 | 76.8% |
| Self-Employed (Incorporated) | 9 | 1.3% |
| Self-Employed (Not Incorporated) | 0 | 0.0% |
| Not-for-profit Organizations | 59 | 8.7% |
| Local Government Employees | 75 | 11.1% |
| State Government Employees | 14 | 2.1% |
| Federal Government Employees | 0 | 0.0% |
| Unpaid Family Workers | 0 | 0.0% |
| Total | 676 | 100.0% |
Employment Status by Age in New Castle Northwest
According to the labor force statistics for New Castle Northwest, out of the total population over 16 years of age (1,244), 58.3% or 725 individuals are in the labor force, with 2.6% or 19 of them unemployed. The age group with the highest labor force participation rate is 20 to 24 years, with 100.0% or 89 individuals in the labor force. Within the labor force, the 35 to 44 years age range has the highest percentage of unemployed individuals, with 6.2% or 19 of them being unemployed.
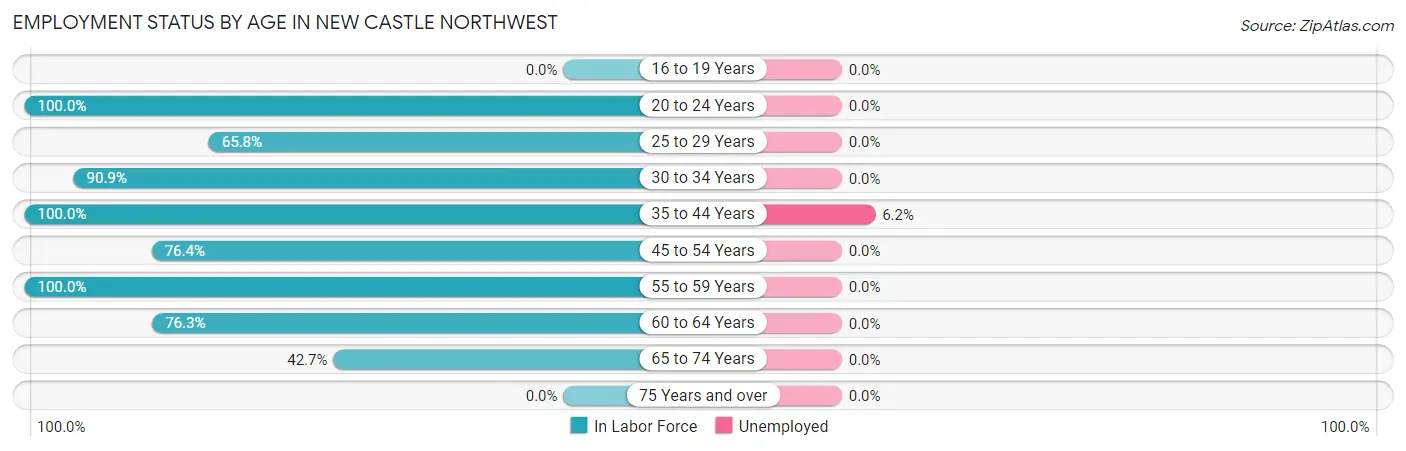
| Age Bracket | In Labor Force | Unemployed |
| 16 to 19 Years | 0 (0.0%) | 0 (0.0%) |
| 20 to 24 Years | 89 (100.0%) | 0 (0.0%) |
| 25 to 29 Years | 52 (65.8%) | 0 (0.0%) |
| 30 to 34 Years | 10 (90.9%) | 0 (0.0%) |
| 35 to 44 Years | 308 (100.0%) | 19 (6.2%) |
| 45 to 54 Years | 84 (76.4%) | 0 (0.0%) |
| 55 to 59 Years | 46 (100.0%) | 0 (0.0%) |
| 60 to 64 Years | 45 (76.3%) | 0 (0.0%) |
| 65 to 74 Years | 91 (42.7%) | 0 (0.0%) |
| 75 Years and over | 0 (0.0%) | 0 (0.0%) |
| Total | 725 (58.3%) | 19 (2.6%) |
Employment Status by Educational Attainment in New Castle Northwest
According to labor force statistics for New Castle Northwest, 88.9% of individuals (545) out of the total population between 25 and 64 years of age (613) are in the labor force, with 3.5% or 19 of them being unemployed. The group with the highest labor force participation rate are those with the educational attainment of college / associate degree, with 92.6% or 326 individuals in the labor force. Within the labor force, individuals with bachelor's degree or higher education have the highest percentage of unemployment, with 15.2% or 19 of them being unemployed.
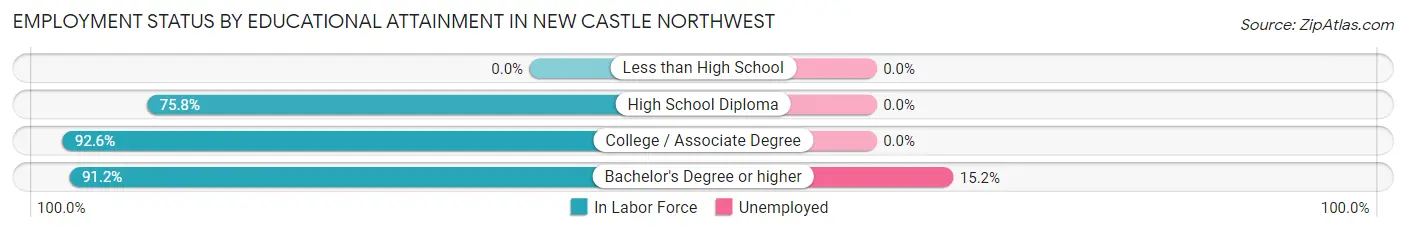
| Educational Attainment | In Labor Force | Unemployed |
| Less than High School | 0 (0.0%) | 0 (0.0%) |
| High School Diploma | 94 (75.8%) | 0 (0.0%) |
| College / Associate Degree | 326 (92.6%) | 0 (0.0%) |
| Bachelor's Degree or higher | 125 (91.2%) | 21 (15.2%) |
| Total | 545 (88.9%) | 21 (3.5%) |
Employment Occupations by Sex in New Castle Northwest
Management, Business, Science and Arts Occupations
The most common Management, Business, Science and Arts occupations in New Castle Northwest are Community & Social Service (127 | 18.0%), Education Instruction & Library (89 | 12.6%), Management (76 | 10.8%), Business & Financial (47 | 6.7%), and Health Diagnosing & Treating (31 | 4.4%).
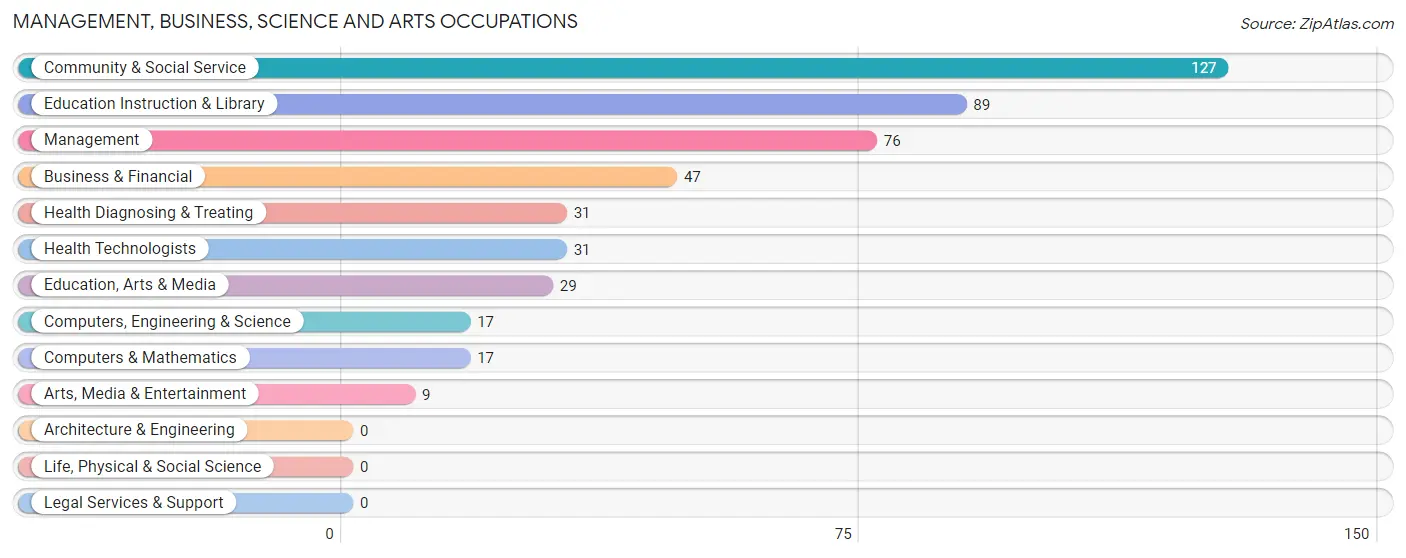
Management, Business, Science and Arts Occupations by Sex
Within the Management, Business, Science and Arts occupations in New Castle Northwest, the most male-oriented occupations are Computers, Engineering & Science (100.0%), Computers & Mathematics (100.0%), and Arts, Media & Entertainment (100.0%), while the most female-oriented occupations are Education, Arts & Media (100.0%), Education Instruction & Library (100.0%), and Health Diagnosing & Treating (100.0%).
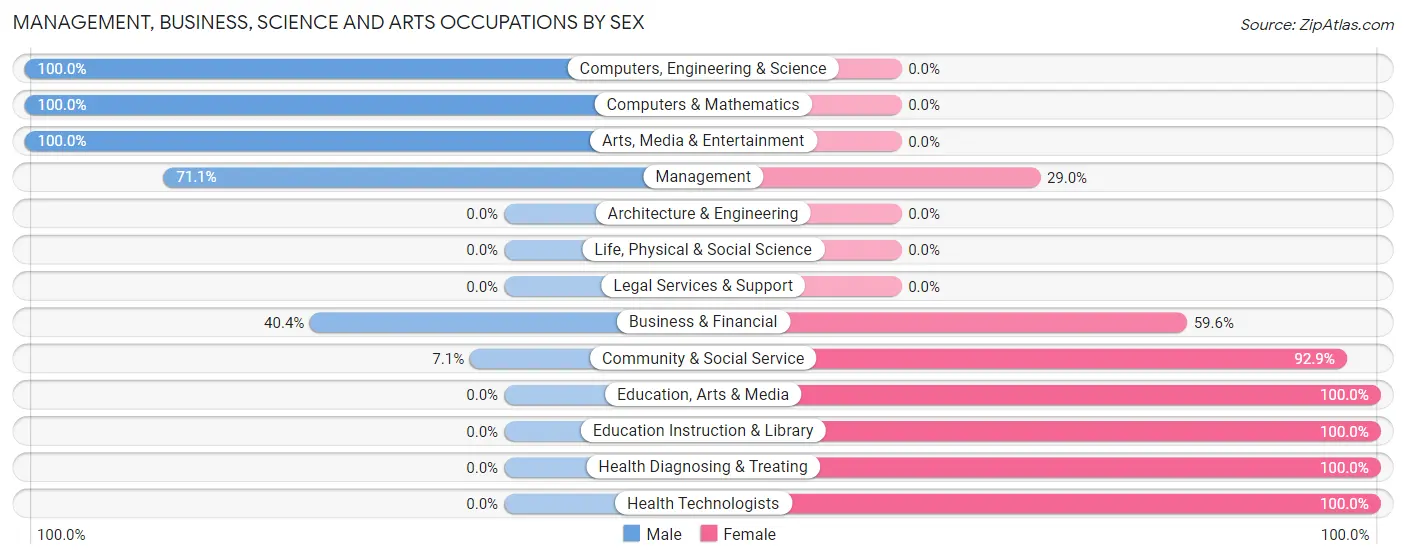
| Occupation | Male | Female |
| Management | 54 (71.1%) | 22 (28.9%) |
| Business & Financial | 19 (40.4%) | 28 (59.6%) |
| Computers, Engineering & Science | 17 (100.0%) | 0 (0.0%) |
| Computers & Mathematics | 17 (100.0%) | 0 (0.0%) |
| Architecture & Engineering | 0 (0.0%) | 0 (0.0%) |
| Life, Physical & Social Science | 0 (0.0%) | 0 (0.0%) |
| Community & Social Service | 9 (7.1%) | 118 (92.9%) |
| Education, Arts & Media | 0 (0.0%) | 29 (100.0%) |
| Legal Services & Support | 0 (0.0%) | 0 (0.0%) |
| Education Instruction & Library | 0 (0.0%) | 89 (100.0%) |
| Arts, Media & Entertainment | 9 (100.0%) | 0 (0.0%) |
| Health Diagnosing & Treating | 0 (0.0%) | 31 (100.0%) |
| Health Technologists | 0 (0.0%) | 31 (100.0%) |
| Total (Category) | 99 (33.2%) | 199 (66.8%) |
| Total (Overall) | 233 (33.0%) | 473 (67.0%) |
Services Occupations
The most common Services occupations in New Castle Northwest are , and Personal Care & Service (35 | 5.0%).
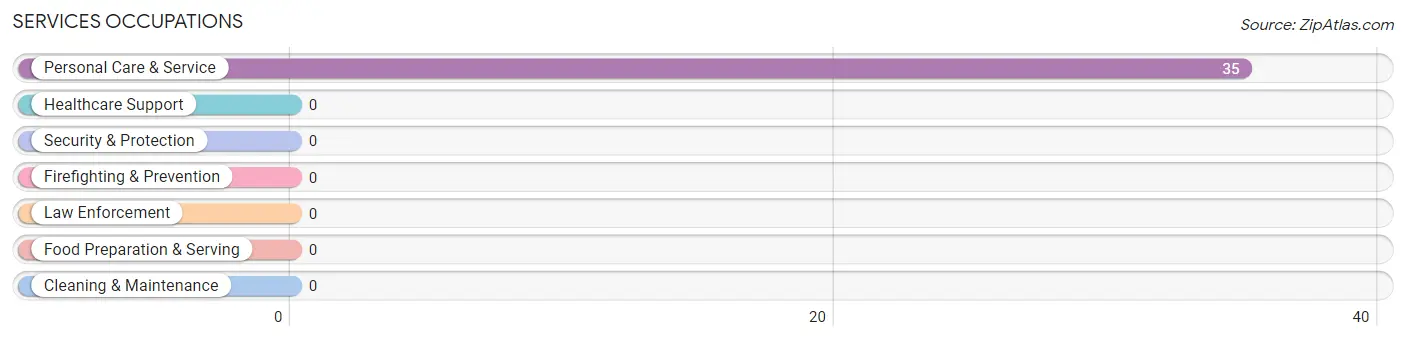
Services Occupations by Sex
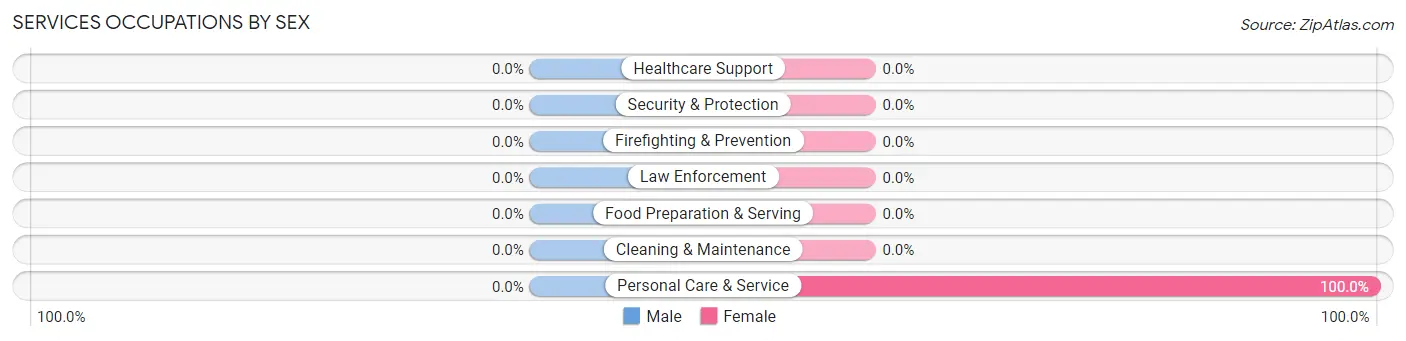
| Occupation | Male | Female |
| Healthcare Support | 0 (0.0%) | 0 (0.0%) |
| Security & Protection | 0 (0.0%) | 0 (0.0%) |
| Firefighting & Prevention | 0 (0.0%) | 0 (0.0%) |
| Law Enforcement | 0 (0.0%) | 0 (0.0%) |
| Food Preparation & Serving | 0 (0.0%) | 0 (0.0%) |
| Cleaning & Maintenance | 0 (0.0%) | 0 (0.0%) |
| Personal Care & Service | 0 (0.0%) | 35 (100.0%) |
| Total (Category) | 0 (0.0%) | 35 (100.0%) |
| Total (Overall) | 233 (33.0%) | 473 (67.0%) |
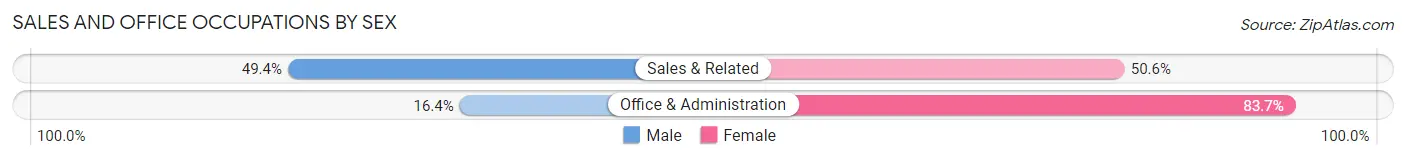
Sales and Office Occupations
The most common Sales and Office occupations in New Castle Northwest are Sales & Related (162 | 23.0%), and Office & Administration (104 | 14.7%).
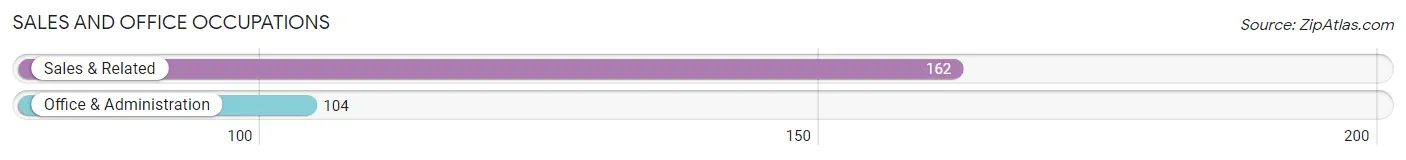
Sales and Office Occupations by Sex
| Occupation | Male | Female |
| Sales & Related | 80 (49.4%) | 82 (50.6%) |
| Office & Administration | 17 (16.4%) | 87 (83.7%) |
| Total (Category) | 97 (36.5%) | 169 (63.5%) |
| Total (Overall) | 233 (33.0%) | 473 (67.0%) |
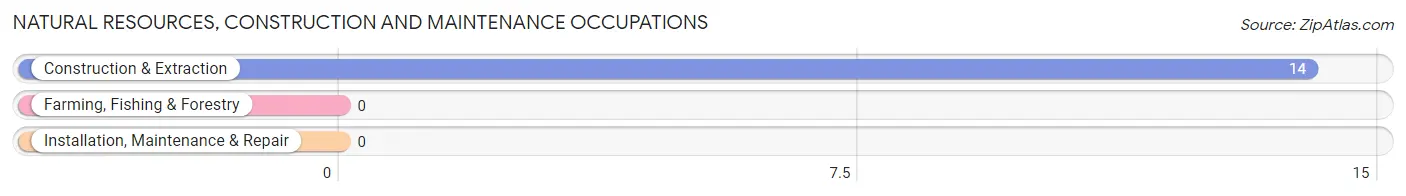
Natural Resources, Construction and Maintenance Occupations
The most common Natural Resources, Construction and Maintenance occupations in New Castle Northwest are , and Construction & Extraction (14 | 2.0%).
Natural Resources, Construction and Maintenance Occupations by Sex
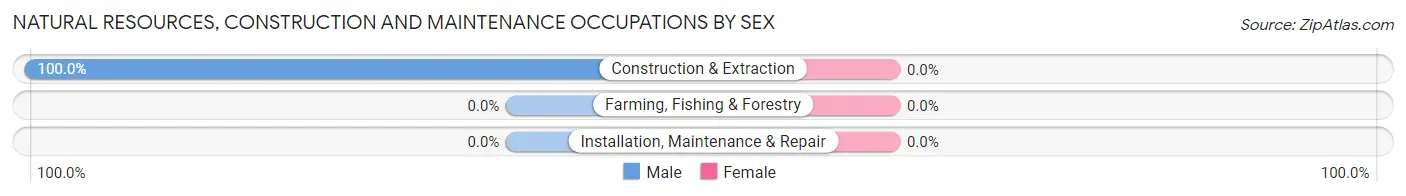
| Occupation | Male | Female |
| Farming, Fishing & Forestry | 0 (0.0%) | 0 (0.0%) |
| Construction & Extraction | 14 (100.0%) | 0 (0.0%) |
| Installation, Maintenance & Repair | 0 (0.0%) | 0 (0.0%) |
| Total (Category) | 14 (100.0%) | 0 (0.0%) |
| Total (Overall) | 233 (33.0%) | 473 (67.0%) |
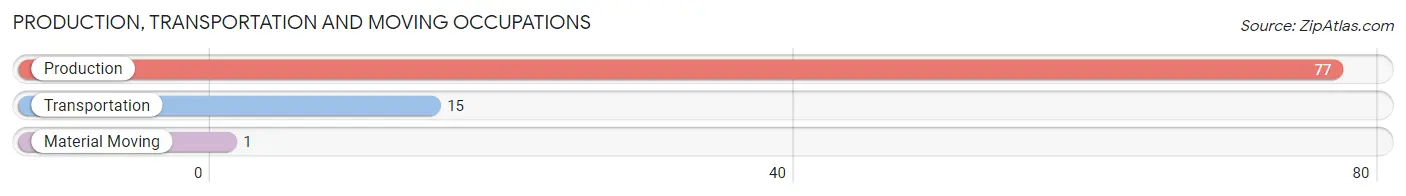
Production, Transportation and Moving Occupations
The most common Production, Transportation and Moving occupations in New Castle Northwest are Production (77 | 10.9%), Transportation (15 | 2.1%), and Material Moving (1 | 0.1%).
Production, Transportation and Moving Occupations by Sex
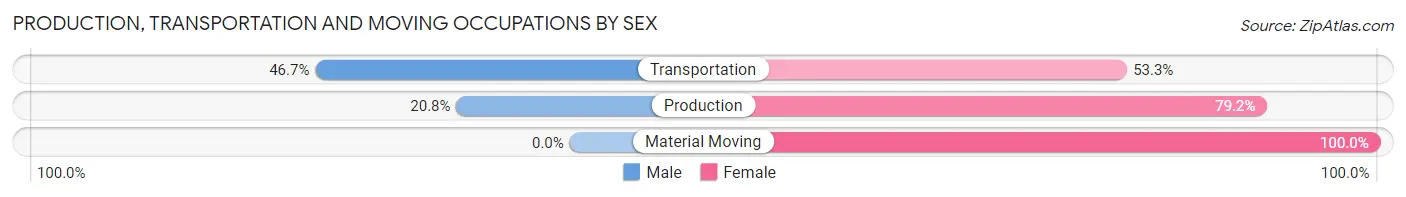
| Occupation | Male | Female |
| Production | 16 (20.8%) | 61 (79.2%) |
| Transportation | 7 (46.7%) | 8 (53.3%) |
| Material Moving | 0 (0.0%) | 1 (100.0%) |
| Total (Category) | 23 (24.7%) | 70 (75.3%) |
| Total (Overall) | 233 (33.0%) | 473 (67.0%) |
Employment Industries by Sex in New Castle Northwest
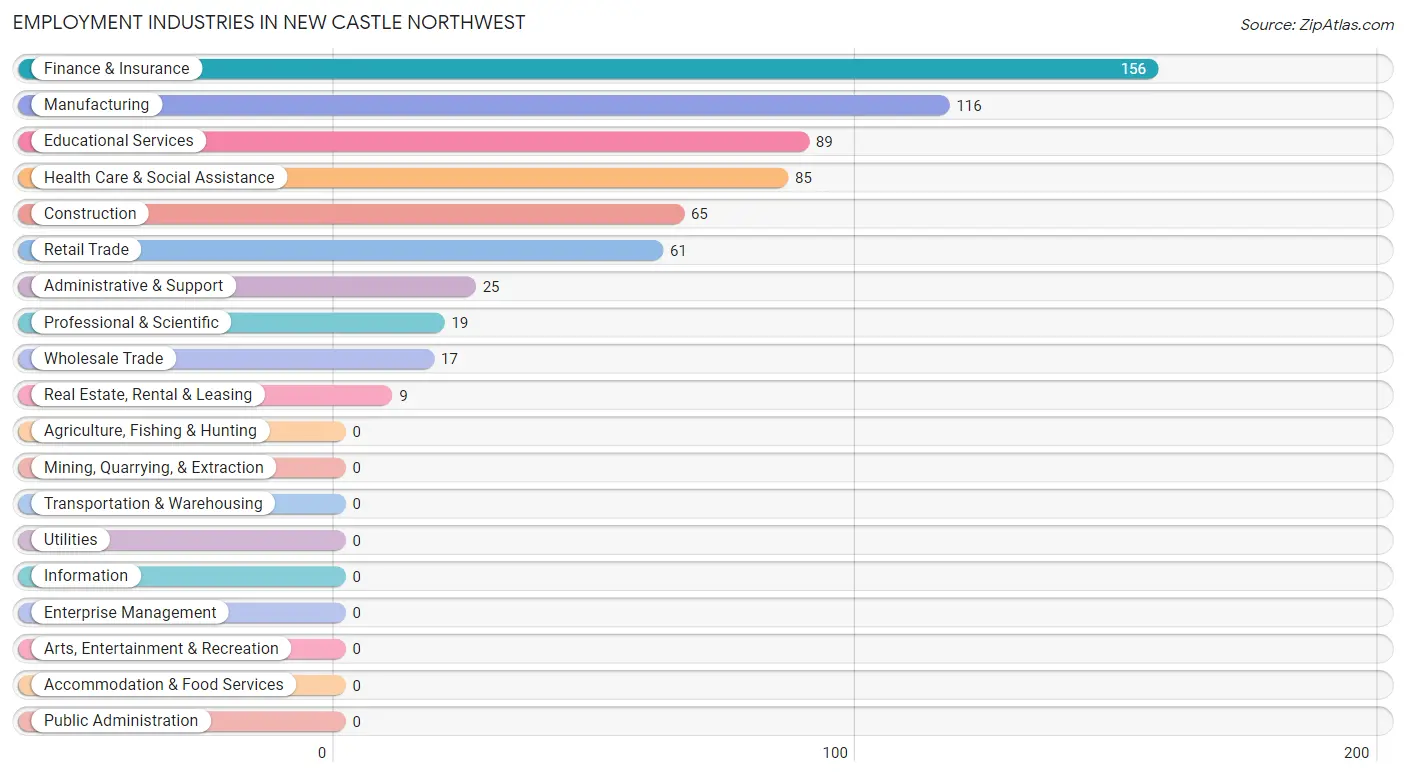
Employment Industries in New Castle Northwest
The major employment industries in New Castle Northwest include Finance & Insurance (156 | 22.1%), Manufacturing (116 | 16.4%), Educational Services (89 | 12.6%), Health Care & Social Assistance (85 | 12.0%), and Construction (65 | 9.2%).
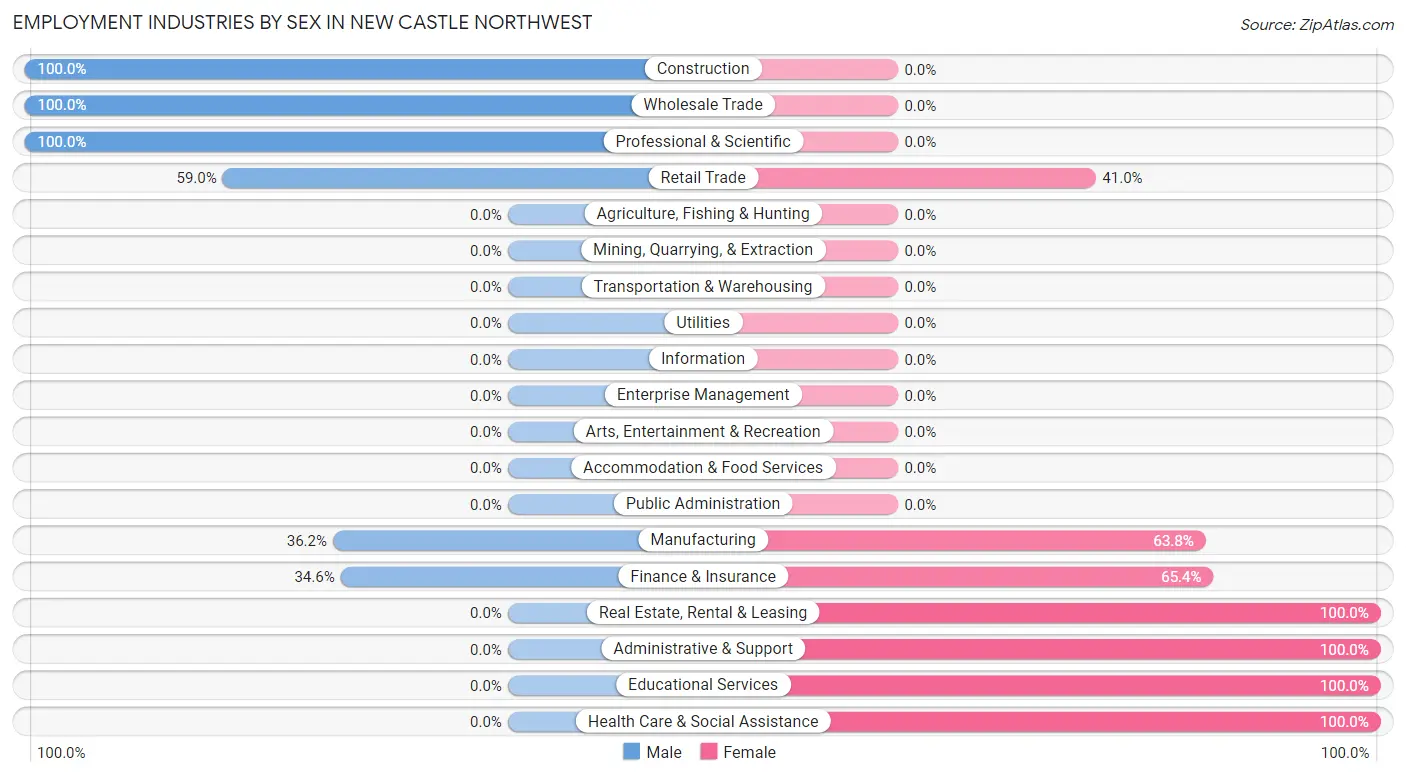
Employment Industries by Sex in New Castle Northwest
The New Castle Northwest industries that see more men than women are Construction (100.0%), Wholesale Trade (100.0%), and Professional & Scientific (100.0%), whereas the industries that tend to have a higher number of women are Real Estate, Rental & Leasing (100.0%), Administrative & Support (100.0%), and Educational Services (100.0%).
| Industry | Male | Female |
| Agriculture, Fishing & Hunting | 0 (0.0%) | 0 (0.0%) |
| Mining, Quarrying, & Extraction | 0 (0.0%) | 0 (0.0%) |
| Construction | 65 (100.0%) | 0 (0.0%) |
| Manufacturing | 42 (36.2%) | 74 (63.8%) |
| Wholesale Trade | 17 (100.0%) | 0 (0.0%) |
| Retail Trade | 36 (59.0%) | 25 (41.0%) |
| Transportation & Warehousing | 0 (0.0%) | 0 (0.0%) |
| Utilities | 0 (0.0%) | 0 (0.0%) |
| Information | 0 (0.0%) | 0 (0.0%) |
| Finance & Insurance | 54 (34.6%) | 102 (65.4%) |
| Real Estate, Rental & Leasing | 0 (0.0%) | 9 (100.0%) |
| Professional & Scientific | 19 (100.0%) | 0 (0.0%) |
| Enterprise Management | 0 (0.0%) | 0 (0.0%) |
| Administrative & Support | 0 (0.0%) | 25 (100.0%) |
| Educational Services | 0 (0.0%) | 89 (100.0%) |
| Health Care & Social Assistance | 0 (0.0%) | 85 (100.0%) |
| Arts, Entertainment & Recreation | 0 (0.0%) | 0 (0.0%) |
| Accommodation & Food Services | 0 (0.0%) | 0 (0.0%) |
| Public Administration | 0 (0.0%) | 0 (0.0%) |
| Total | 233 (33.0%) | 473 (67.0%) |
Education in New Castle Northwest
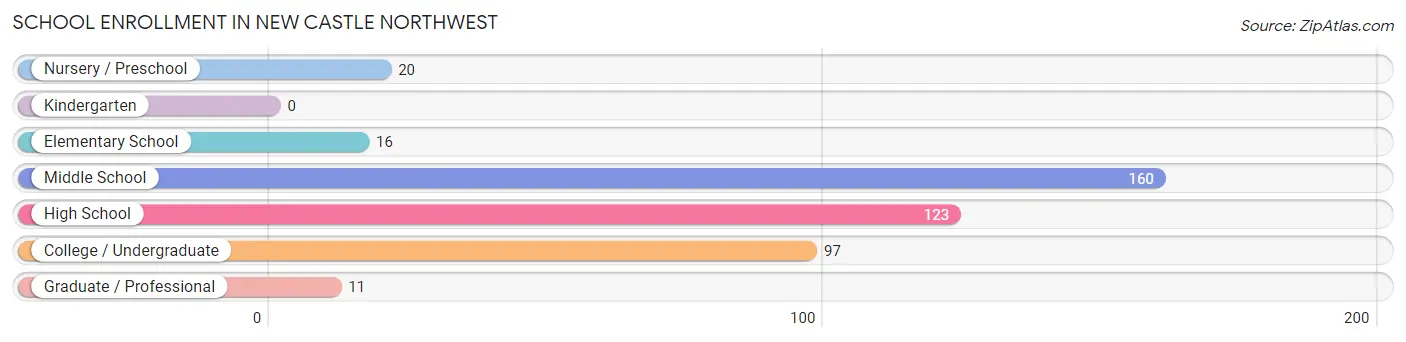
School Enrollment in New Castle Northwest
The most common levels of schooling among the 427 students in New Castle Northwest are middle school (160 | 37.5%), high school (123 | 28.8%), and college / undergraduate (97 | 22.7%).
| School Level | # Students | % Students |
| Nursery / Preschool | 20 | 4.7% |
| Kindergarten | 0 | 0.0% |
| Elementary School | 16 | 3.7% |
| Middle School | 160 | 37.5% |
| High School | 123 | 28.8% |
| College / Undergraduate | 97 | 22.7% |
| Graduate / Professional | 11 | 2.6% |
| Total | 427 | 100.0% |
School Enrollment by Age by Funding Source in New Castle Northwest
Out of a total of 427 students who are enrolled in schools in New Castle Northwest, 16 (3.7%) attend a private institution, while the remaining 411 (96.3%) are enrolled in public schools. The age group of 35 years and over has the highest likelihood of being enrolled in private schools, with 16 (100.0% in the age bracket) enrolled. Conversely, the age group of 3 to 4 year olds has the lowest likelihood of being enrolled in a private school, with 20 (100.0% in the age bracket) attending a public institution.
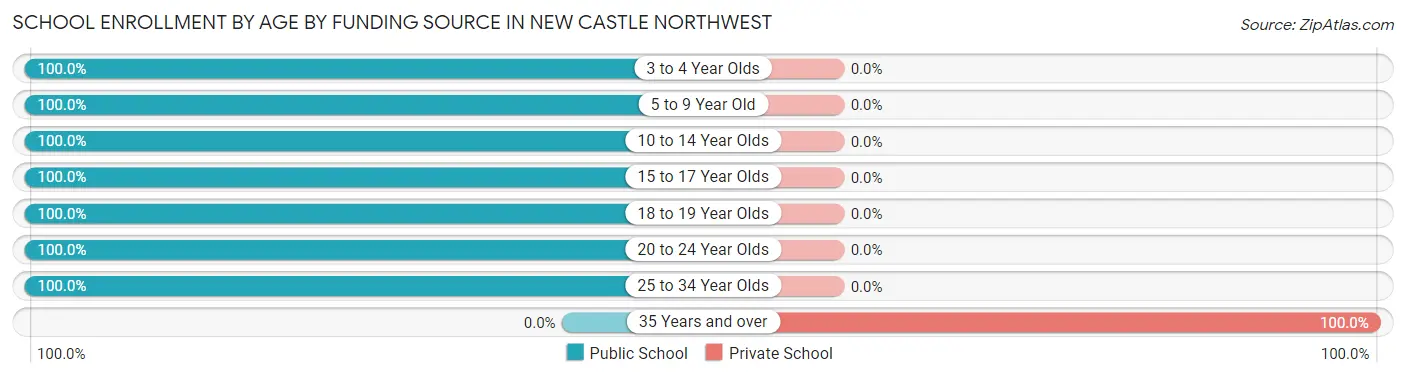
| Age Bracket | Public School | Private School |
| 3 to 4 Year Olds | 20 (100.0%) | 0 (0.0%) |
| 5 to 9 Year Old | 16 (100.0%) | 0 (0.0%) |
| 10 to 14 Year Olds | 160 (100.0%) | 0 (0.0%) |
| 15 to 17 Year Olds | 52 (100.0%) | 0 (0.0%) |
| 18 to 19 Year Olds | 77 (100.0%) | 0 (0.0%) |
| 20 to 24 Year Olds | 75 (100.0%) | 0 (0.0%) |
| 25 to 34 Year Olds | 11 (100.0%) | 0 (0.0%) |
| 35 Years and over | 0 (0.0%) | 16 (100.0%) |
| Total | 411 (96.3%) | 16 (3.7%) |
Educational Attainment by Field of Study in New Castle Northwest
Education (93 | 39.4%), science & technology (31 | 13.1%), engineering (30 | 12.7%), communications (27 | 11.4%), and business (19 | 8.1%) are the most common fields of study among 236 individuals in New Castle Northwest who have obtained a bachelor's degree or higher.
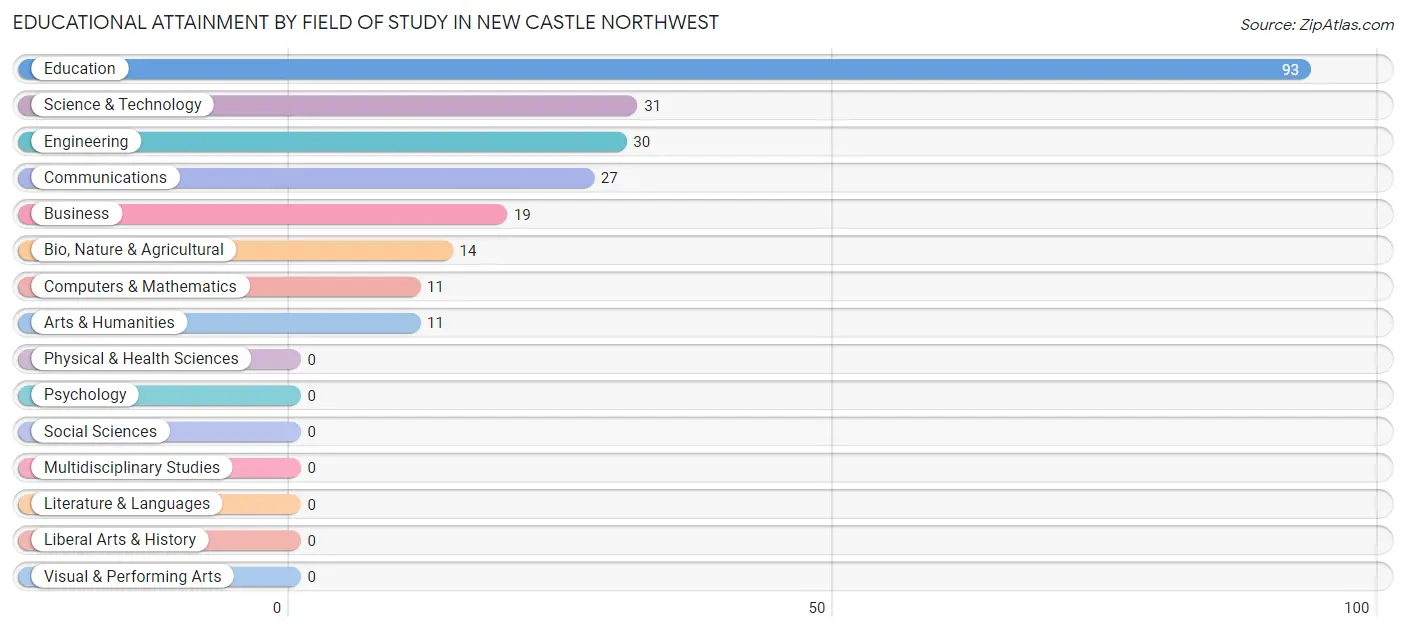
| Field of Study | # Graduates | % Graduates |
| Computers & Mathematics | 11 | 4.7% |
| Bio, Nature & Agricultural | 14 | 5.9% |
| Physical & Health Sciences | 0 | 0.0% |
| Psychology | 0 | 0.0% |
| Social Sciences | 0 | 0.0% |
| Engineering | 30 | 12.7% |
| Multidisciplinary Studies | 0 | 0.0% |
| Science & Technology | 31 | 13.1% |
| Business | 19 | 8.1% |
| Education | 93 | 39.4% |
| Literature & Languages | 0 | 0.0% |
| Liberal Arts & History | 0 | 0.0% |
| Visual & Performing Arts | 0 | 0.0% |
| Communications | 27 | 11.4% |
| Arts & Humanities | 11 | 4.7% |
| Total | 236 | 100.0% |
Transportation & Commute in New Castle Northwest
Vehicle Availability by Sex in New Castle Northwest
The most prevalent vehicle ownership categories in New Castle Northwest are males with 2 vehicles (111, accounting for 54.7%) and females with 2 vehicles (258, making up 23.5%).
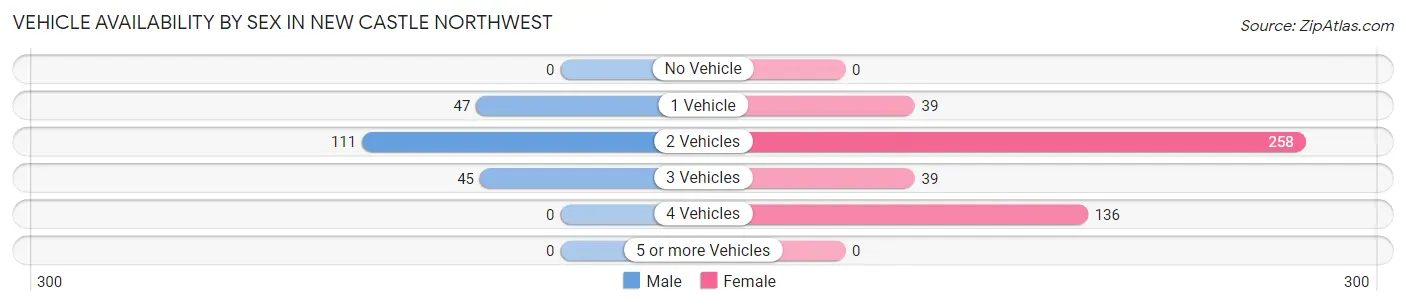
| Vehicles Available | Male | Female |
| No Vehicle | 0 (0.0%) | 0 (0.0%) |
| 1 Vehicle | 47 (23.2%) | 39 (8.3%) |
| 2 Vehicles | 111 (54.7%) | 258 (54.7%) |
| 3 Vehicles | 45 (22.2%) | 39 (8.3%) |
| 4 Vehicles | 0 (0.0%) | 136 (28.8%) |
| 5 or more Vehicles | 0 (0.0%) | 0 (0.0%) |
| Total | 203 (100.0%) | 472 (100.0%) |
Commute Time in New Castle Northwest
The most frequently occuring commute durations in New Castle Northwest are 5 to 9 minutes (306 commuters, 50.2%), 15 to 19 minutes (92 commuters, 15.1%), and 40 to 44 minutes (73 commuters, 12.0%).
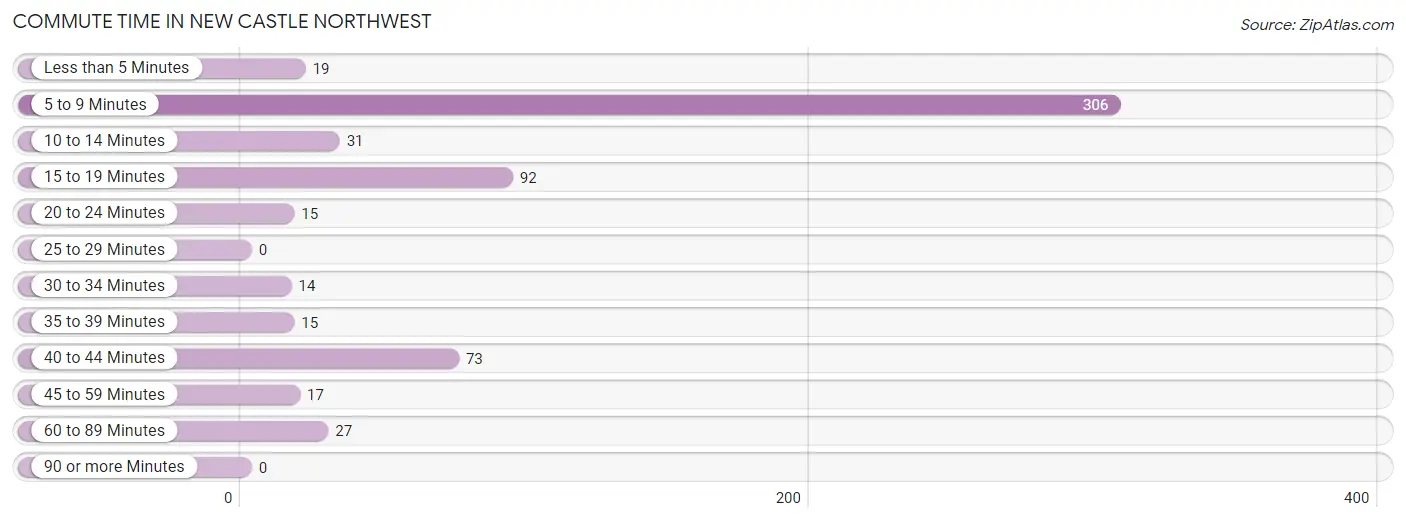
| Commute Time | # Commuters | % Commuters |
| Less than 5 Minutes | 19 | 3.1% |
| 5 to 9 Minutes | 306 | 50.2% |
| 10 to 14 Minutes | 31 | 5.1% |
| 15 to 19 Minutes | 92 | 15.1% |
| 20 to 24 Minutes | 15 | 2.5% |
| 25 to 29 Minutes | 0 | 0.0% |
| 30 to 34 Minutes | 14 | 2.3% |
| 35 to 39 Minutes | 15 | 2.5% |
| 40 to 44 Minutes | 73 | 12.0% |
| 45 to 59 Minutes | 17 | 2.8% |
| 60 to 89 Minutes | 27 | 4.4% |
| 90 or more Minutes | 0 | 0.0% |
Commute Time by Sex in New Castle Northwest
The most common commute times in New Castle Northwest are 40 to 44 minutes (51 commuters, 28.8%) for males and 5 to 9 minutes (282 commuters, 65.3%) for females.
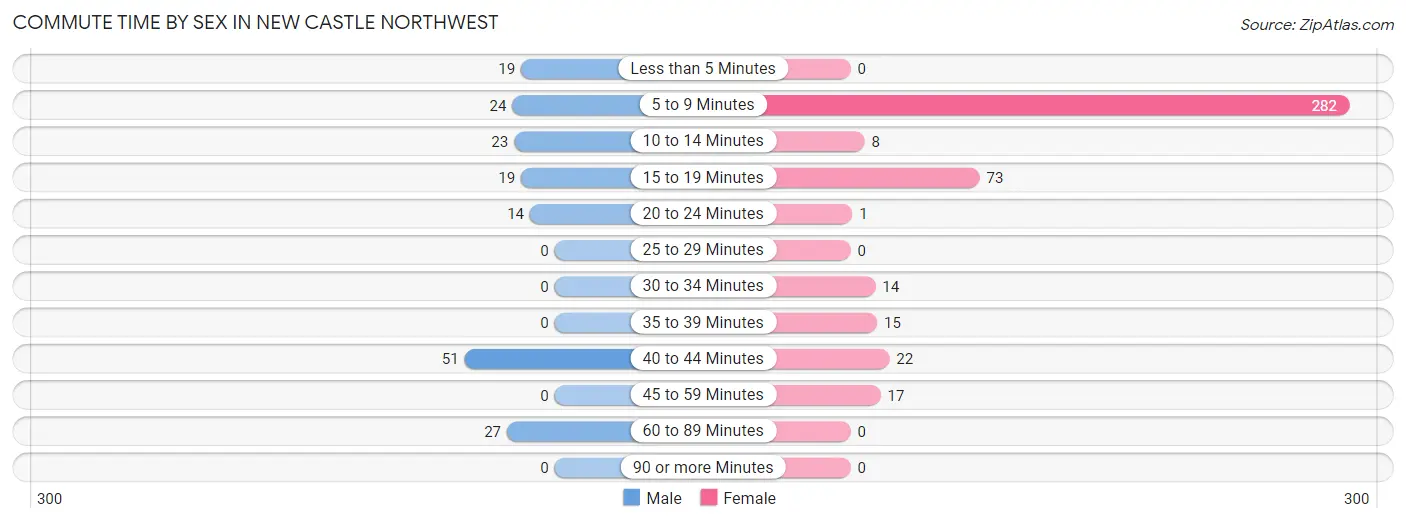
| Commute Time | Male | Female |
| Less than 5 Minutes | 19 (10.7%) | 0 (0.0%) |
| 5 to 9 Minutes | 24 (13.6%) | 282 (65.3%) |
| 10 to 14 Minutes | 23 (13.0%) | 8 (1.8%) |
| 15 to 19 Minutes | 19 (10.7%) | 73 (16.9%) |
| 20 to 24 Minutes | 14 (7.9%) | 1 (0.2%) |
| 25 to 29 Minutes | 0 (0.0%) | 0 (0.0%) |
| 30 to 34 Minutes | 0 (0.0%) | 14 (3.2%) |
| 35 to 39 Minutes | 0 (0.0%) | 15 (3.5%) |
| 40 to 44 Minutes | 51 (28.8%) | 22 (5.1%) |
| 45 to 59 Minutes | 0 (0.0%) | 17 (3.9%) |
| 60 to 89 Minutes | 27 (15.2%) | 0 (0.0%) |
| 90 or more Minutes | 0 (0.0%) | 0 (0.0%) |
Time of Departure to Work by Sex in New Castle Northwest
The most frequent times of departure to work in New Castle Northwest are 8:00 AM to 8:29 AM (68, 38.4%) for males and 7:30 AM to 7:59 AM (126, 29.2%) for females.
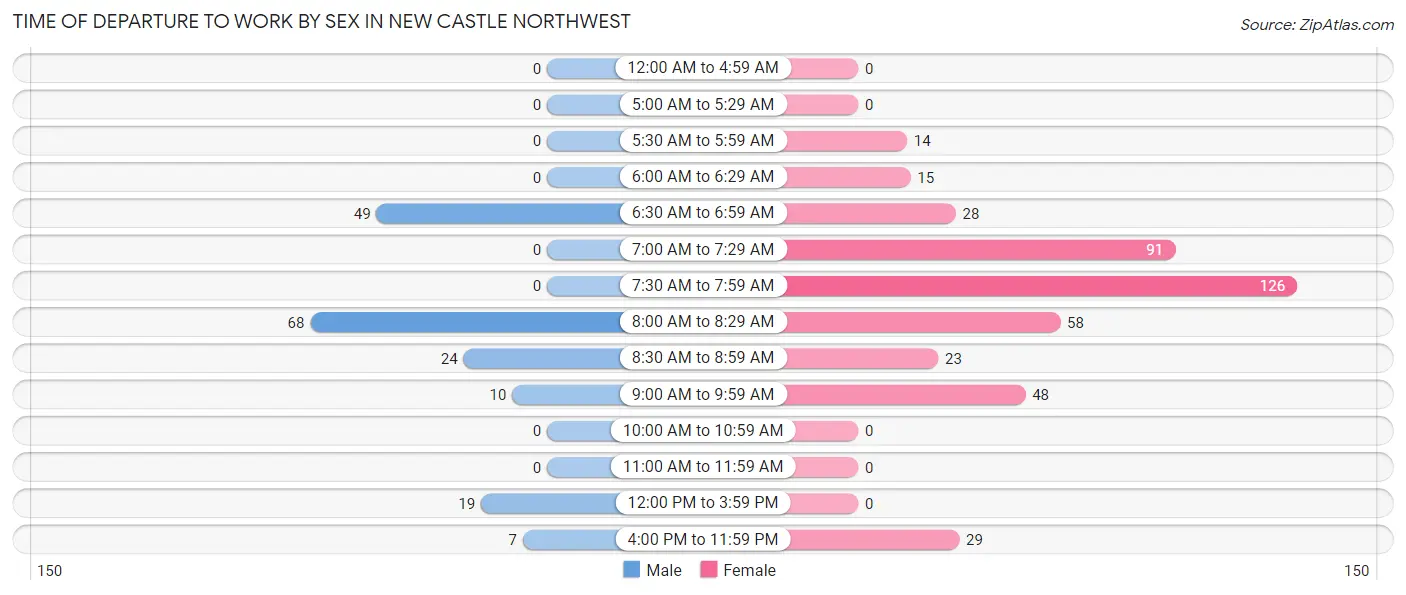
| Time of Departure | Male | Female |
| 12:00 AM to 4:59 AM | 0 (0.0%) | 0 (0.0%) |
| 5:00 AM to 5:29 AM | 0 (0.0%) | 0 (0.0%) |
| 5:30 AM to 5:59 AM | 0 (0.0%) | 14 (3.2%) |
| 6:00 AM to 6:29 AM | 0 (0.0%) | 15 (3.5%) |
| 6:30 AM to 6:59 AM | 49 (27.7%) | 28 (6.5%) |
| 7:00 AM to 7:29 AM | 0 (0.0%) | 91 (21.1%) |
| 7:30 AM to 7:59 AM | 0 (0.0%) | 126 (29.2%) |
| 8:00 AM to 8:29 AM | 68 (38.4%) | 58 (13.4%) |
| 8:30 AM to 8:59 AM | 24 (13.6%) | 23 (5.3%) |
| 9:00 AM to 9:59 AM | 10 (5.7%) | 48 (11.1%) |
| 10:00 AM to 10:59 AM | 0 (0.0%) | 0 (0.0%) |
| 11:00 AM to 11:59 AM | 0 (0.0%) | 0 (0.0%) |
| 12:00 PM to 3:59 PM | 19 (10.7%) | 0 (0.0%) |
| 4:00 PM to 11:59 PM | 7 (4.0%) | 29 (6.7%) |
| Total | 177 (100.0%) | 432 (100.0%) |
Housing Occupancy in New Castle Northwest
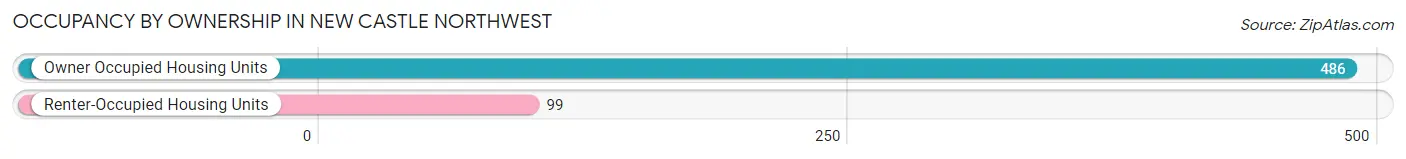
Occupancy by Ownership in New Castle Northwest
Of the total 585 dwellings in New Castle Northwest, owner-occupied units account for 486 (83.1%), while renter-occupied units make up 99 (16.9%).
| Occupancy | # Housing Units | % Housing Units |
| Owner Occupied Housing Units | 486 | 83.1% |
| Renter-Occupied Housing Units | 99 | 16.9% |
| Total Occupied Housing Units | 585 | 100.0% |
Occupancy by Household Size in New Castle Northwest
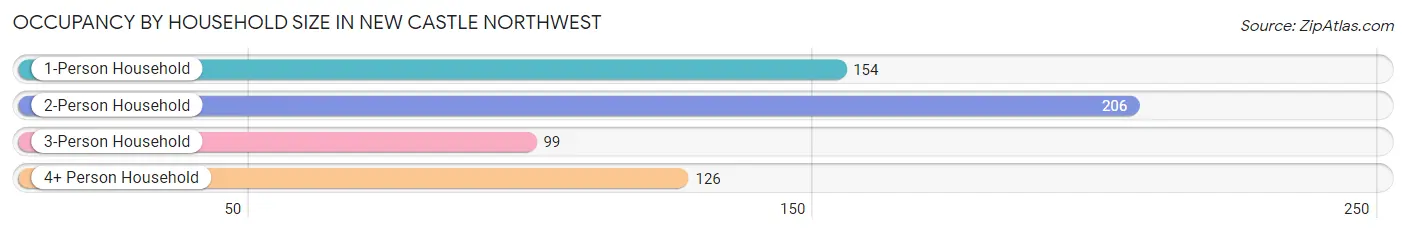
| Household Size | # Housing Units | % Housing Units |
| 1-Person Household | 154 | 26.3% |
| 2-Person Household | 206 | 35.2% |
| 3-Person Household | 99 | 16.9% |
| 4+ Person Household | 126 | 21.5% |
| Total Housing Units | 585 | 100.0% |
Occupancy by Ownership by Household Size in New Castle Northwest
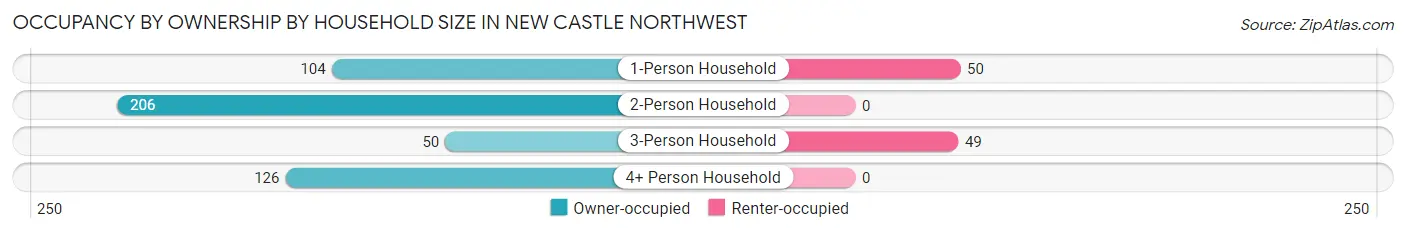
| Household Size | Owner-occupied | Renter-occupied |
| 1-Person Household | 104 (67.5%) | 50 (32.5%) |
| 2-Person Household | 206 (100.0%) | 0 (0.0%) |
| 3-Person Household | 50 (50.5%) | 49 (49.5%) |
| 4+ Person Household | 126 (100.0%) | 0 (0.0%) |
| Total Housing Units | 486 (83.1%) | 99 (16.9%) |
Occupancy by Educational Attainment in New Castle Northwest
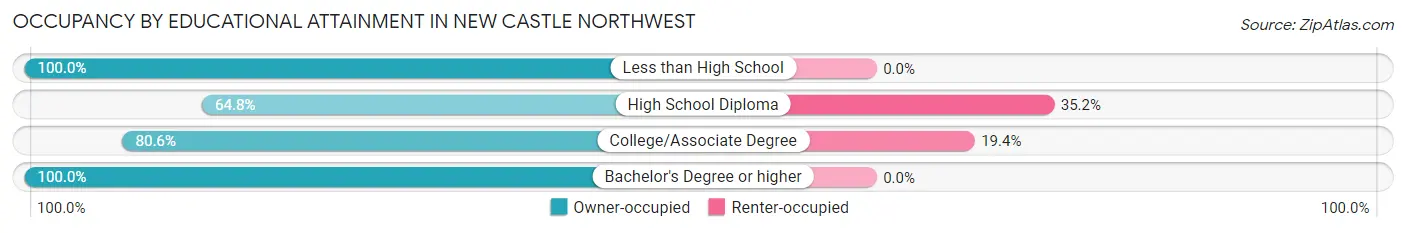
| Household Size | Owner-occupied | Renter-occupied |
| Less than High School | 45 (100.0%) | 0 (0.0%) |
| High School Diploma | 92 (64.8%) | 50 (35.2%) |
| College/Associate Degree | 203 (80.6%) | 49 (19.4%) |
| Bachelor's Degree or higher | 146 (100.0%) | 0 (0.0%) |
Occupancy by Age of Householder in New Castle Northwest
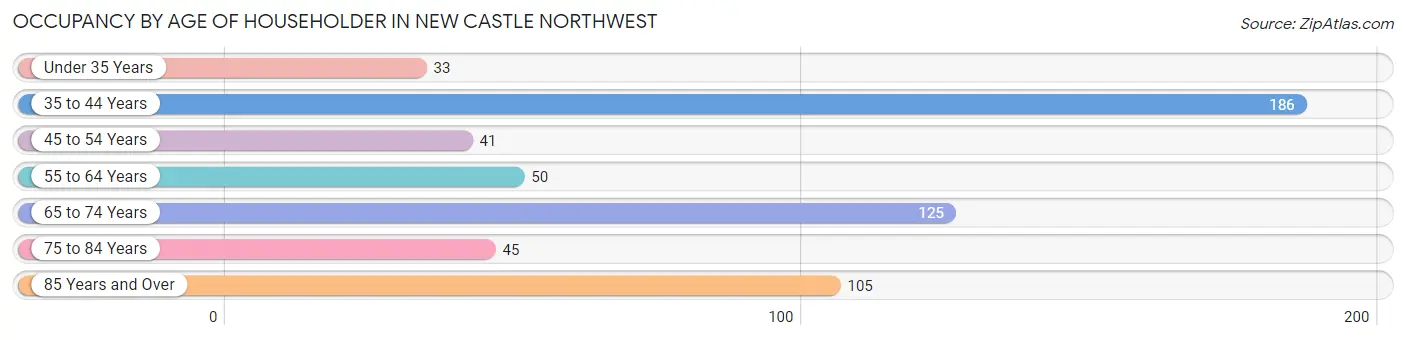
| Age Bracket | # Households | % Households |
| Under 35 Years | 33 | 5.6% |
| 35 to 44 Years | 186 | 31.8% |
| 45 to 54 Years | 41 | 7.0% |
| 55 to 64 Years | 50 | 8.6% |
| 65 to 74 Years | 125 | 21.4% |
| 75 to 84 Years | 45 | 7.7% |
| 85 Years and Over | 105 | 17.9% |
| Total | 585 | 100.0% |
Housing Finances in New Castle Northwest
Median Income by Occupancy in New Castle Northwest
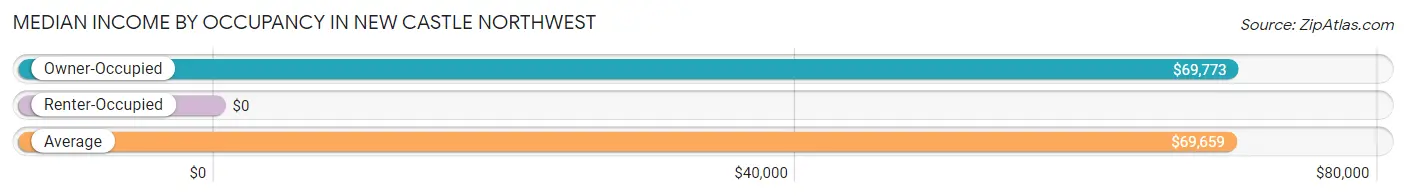
| Occupancy Type | # Households | Median Income |
| Owner-Occupied | 486 (83.1%) | $69,773 |
| Renter-Occupied | 99 (16.9%) | $0 |
| Average | 585 (100.0%) | $69,659 |
Occupancy by Householder Income Bracket in New Castle Northwest
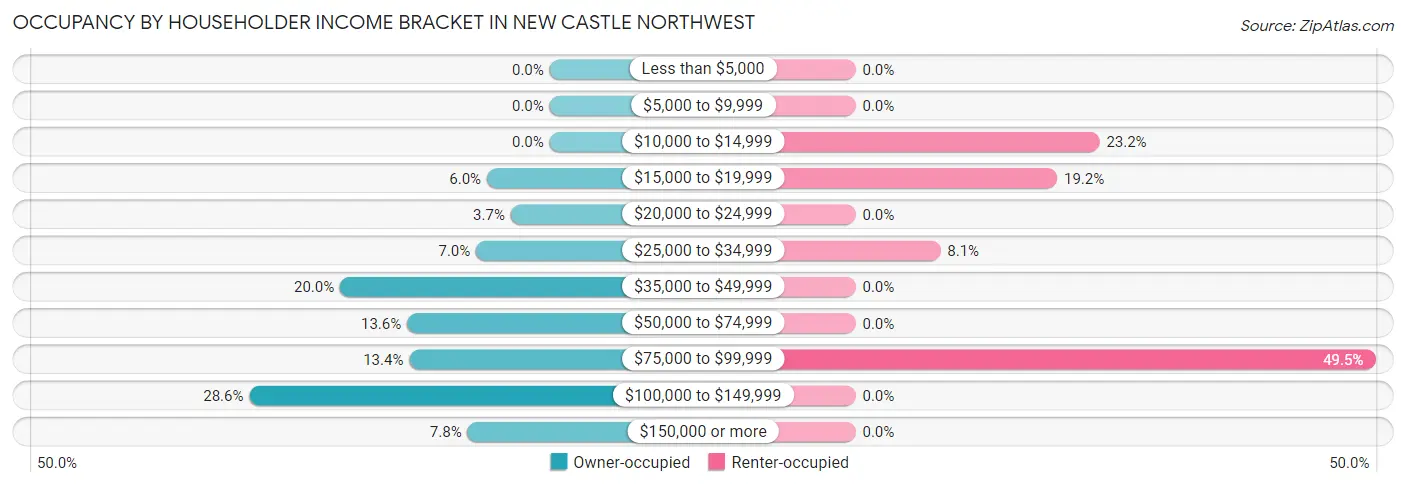
| Income Bracket | Owner-occupied | Renter-occupied |
| Less than $5,000 | 0 (0.0%) | 0 (0.0%) |
| $5,000 to $9,999 | 0 (0.0%) | 0 (0.0%) |
| $10,000 to $14,999 | 0 (0.0%) | 23 (23.2%) |
| $15,000 to $19,999 | 29 (6.0%) | 19 (19.2%) |
| $20,000 to $24,999 | 18 (3.7%) | 0 (0.0%) |
| $25,000 to $34,999 | 34 (7.0%) | 8 (8.1%) |
| $35,000 to $49,999 | 97 (20.0%) | 0 (0.0%) |
| $50,000 to $74,999 | 66 (13.6%) | 0 (0.0%) |
| $75,000 to $99,999 | 65 (13.4%) | 49 (49.5%) |
| $100,000 to $149,999 | 139 (28.6%) | 0 (0.0%) |
| $150,000 or more | 38 (7.8%) | 0 (0.0%) |
| Total | 486 (100.0%) | 99 (100.0%) |
Monthly Housing Cost Tiers in New Castle Northwest
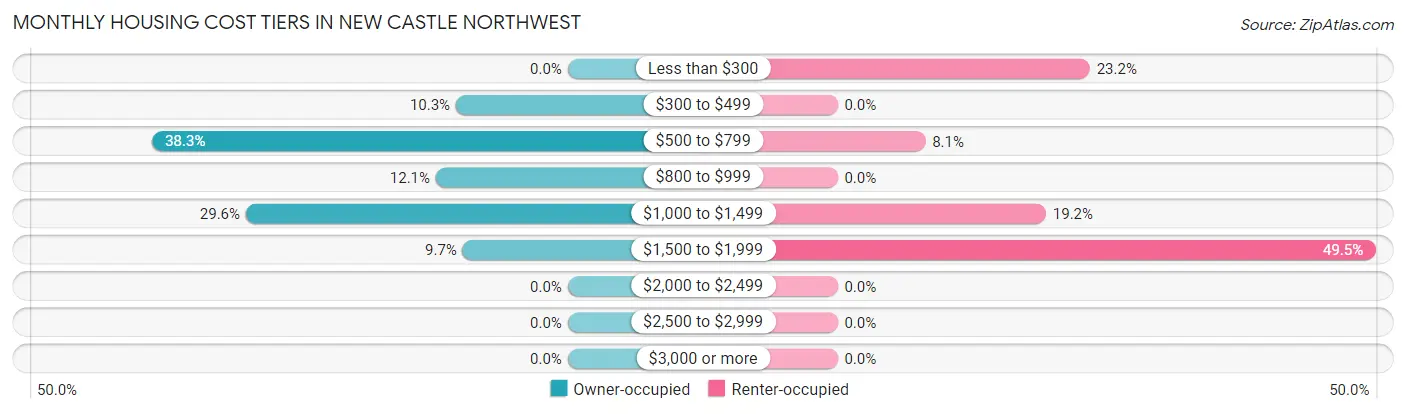
| Monthly Cost | Owner-occupied | Renter-occupied |
| Less than $300 | 0 (0.0%) | 23 (23.2%) |
| $300 to $499 | 50 (10.3%) | 0 (0.0%) |
| $500 to $799 | 186 (38.3%) | 8 (8.1%) |
| $800 to $999 | 59 (12.1%) | 0 (0.0%) |
| $1,000 to $1,499 | 144 (29.6%) | 19 (19.2%) |
| $1,500 to $1,999 | 47 (9.7%) | 49 (49.5%) |
| $2,000 to $2,499 | 0 (0.0%) | 0 (0.0%) |
| $2,500 to $2,999 | 0 (0.0%) | 0 (0.0%) |
| $3,000 or more | 0 (0.0%) | 0 (0.0%) |
| Total | 486 (100.0%) | 99 (100.0%) |
Physical Housing Characteristics in New Castle Northwest
Housing Structures in New Castle Northwest
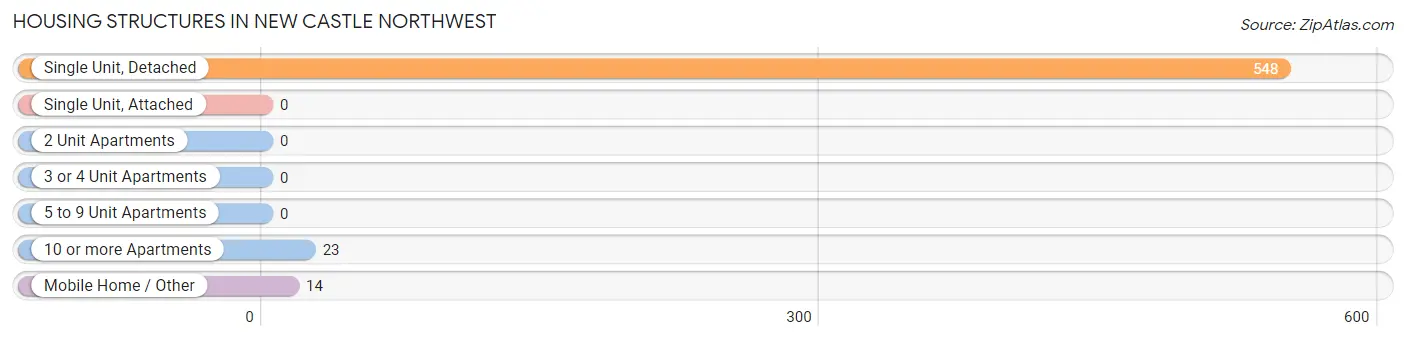
| Structure Type | # Housing Units | % Housing Units |
| Single Unit, Detached | 548 | 93.7% |
| Single Unit, Attached | 0 | 0.0% |
| 2 Unit Apartments | 0 | 0.0% |
| 3 or 4 Unit Apartments | 0 | 0.0% |
| 5 to 9 Unit Apartments | 0 | 0.0% |
| 10 or more Apartments | 23 | 3.9% |
| Mobile Home / Other | 14 | 2.4% |
| Total | 585 | 100.0% |
Housing Structures by Occupancy in New Castle Northwest
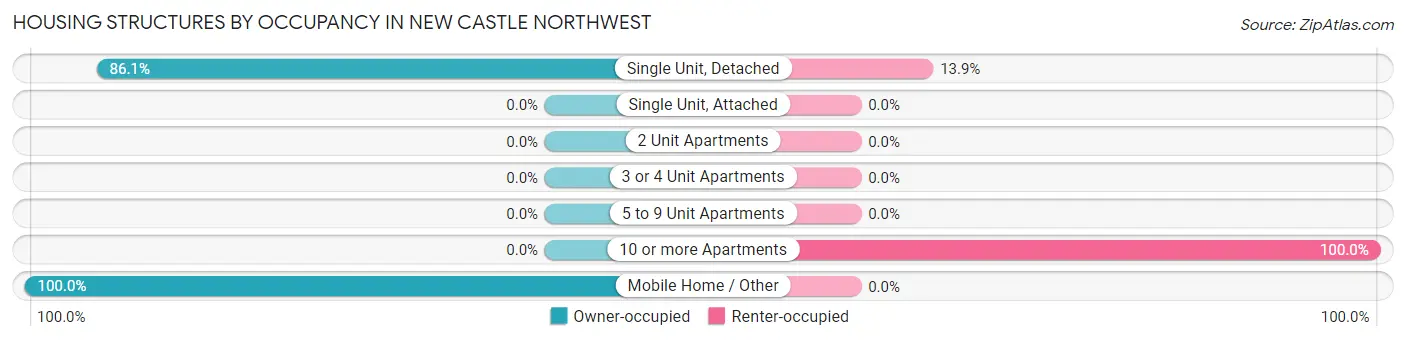
| Structure Type | Owner-occupied | Renter-occupied |
| Single Unit, Detached | 472 (86.1%) | 76 (13.9%) |
| Single Unit, Attached | 0 (0.0%) | 0 (0.0%) |
| 2 Unit Apartments | 0 (0.0%) | 0 (0.0%) |
| 3 or 4 Unit Apartments | 0 (0.0%) | 0 (0.0%) |
| 5 to 9 Unit Apartments | 0 (0.0%) | 0 (0.0%) |
| 10 or more Apartments | 0 (0.0%) | 23 (100.0%) |
| Mobile Home / Other | 14 (100.0%) | 0 (0.0%) |
| Total | 486 (83.1%) | 99 (16.9%) |
Housing Structures by Number of Rooms in New Castle Northwest
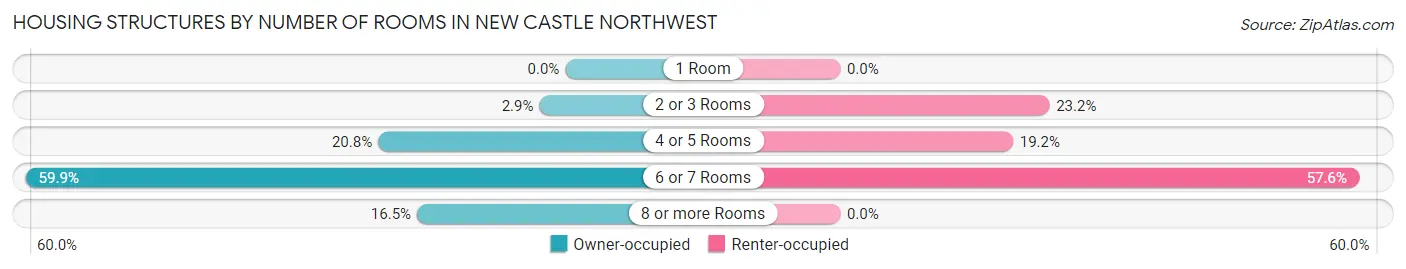
| Number of Rooms | Owner-occupied | Renter-occupied |
| 1 Room | 0 (0.0%) | 0 (0.0%) |
| 2 or 3 Rooms | 14 (2.9%) | 23 (23.2%) |
| 4 or 5 Rooms | 101 (20.8%) | 19 (19.2%) |
| 6 or 7 Rooms | 291 (59.9%) | 57 (57.6%) |
| 8 or more Rooms | 80 (16.5%) | 0 (0.0%) |
| Total | 486 (100.0%) | 99 (100.0%) |
Housing Structure by Heating Type in New Castle Northwest
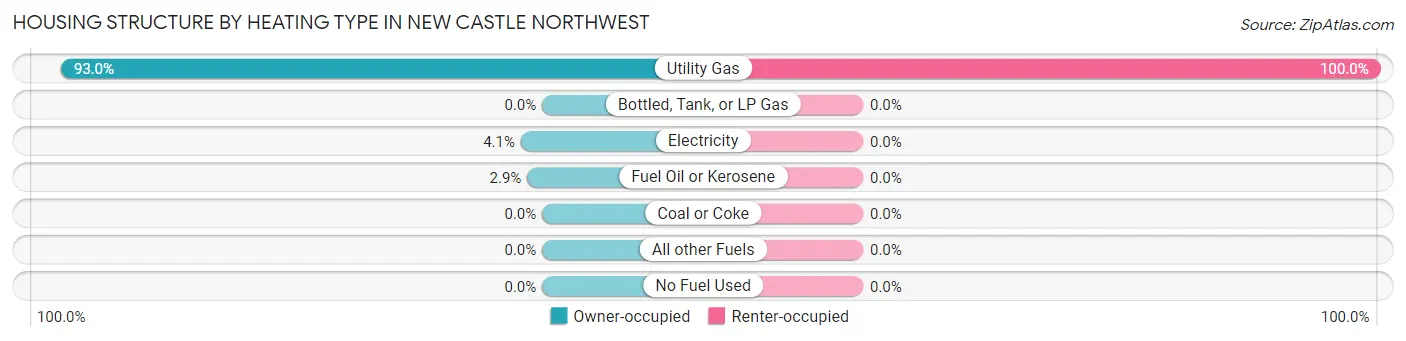
| Heating Type | Owner-occupied | Renter-occupied |
| Utility Gas | 452 (93.0%) | 99 (100.0%) |
| Bottled, Tank, or LP Gas | 0 (0.0%) | 0 (0.0%) |
| Electricity | 20 (4.1%) | 0 (0.0%) |
| Fuel Oil or Kerosene | 14 (2.9%) | 0 (0.0%) |
| Coal or Coke | 0 (0.0%) | 0 (0.0%) |
| All other Fuels | 0 (0.0%) | 0 (0.0%) |
| No Fuel Used | 0 (0.0%) | 0 (0.0%) |
| Total | 486 (100.0%) | 99 (100.0%) |
Household Vehicle Usage in New Castle Northwest
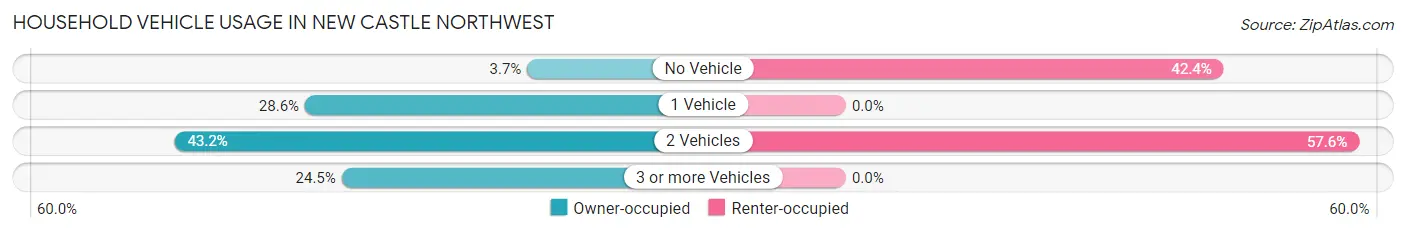
| Vehicles per Household | Owner-occupied | Renter-occupied |
| No Vehicle | 18 (3.7%) | 42 (42.4%) |
| 1 Vehicle | 139 (28.6%) | 0 (0.0%) |
| 2 Vehicles | 210 (43.2%) | 57 (57.6%) |
| 3 or more Vehicles | 119 (24.5%) | 0 (0.0%) |
| Total | 486 (100.0%) | 99 (100.0%) |
Real Estate & Mortgages in New Castle Northwest
Real Estate and Mortgage Overview in New Castle Northwest
| Characteristic | Without Mortgage | With Mortgage |
| Housing Units | 173 | 313 |
| Median Property Value | $159,000 | $120,900 |
| Median Household Income | $43,993 | $38 |
| Monthly Housing Costs | $623 | $0 |
| Real Estate Taxes | $2,517 | $0 |
Property Value by Mortgage Status in New Castle Northwest
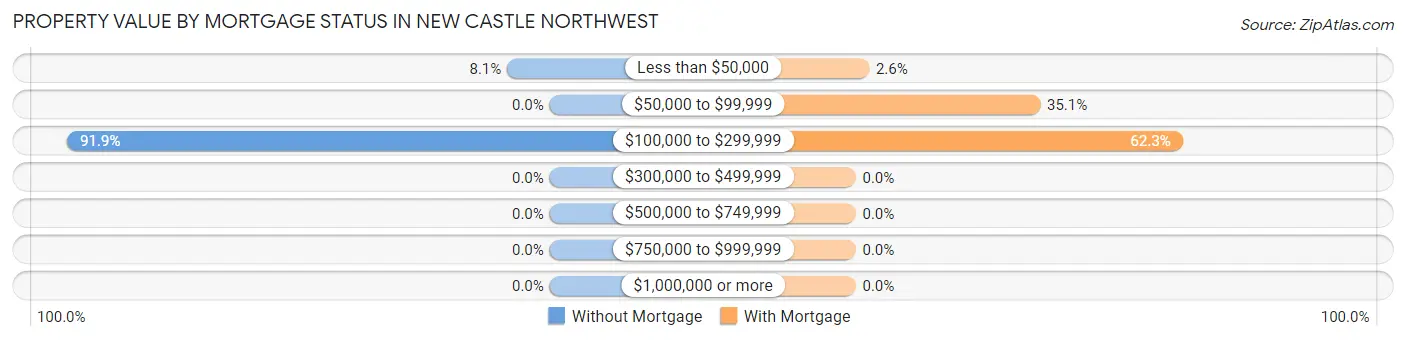
| Property Value | Without Mortgage | With Mortgage |
| Less than $50,000 | 14 (8.1%) | 8 (2.6%) |
| $50,000 to $99,999 | 0 (0.0%) | 110 (35.1%) |
| $100,000 to $299,999 | 159 (91.9%) | 195 (62.3%) |
| $300,000 to $499,999 | 0 (0.0%) | 0 (0.0%) |
| $500,000 to $749,999 | 0 (0.0%) | 0 (0.0%) |
| $750,000 to $999,999 | 0 (0.0%) | 0 (0.0%) |
| $1,000,000 or more | 0 (0.0%) | 0 (0.0%) |
| Total | 173 (100.0%) | 313 (100.0%) |
Household Income by Mortgage Status in New Castle Northwest
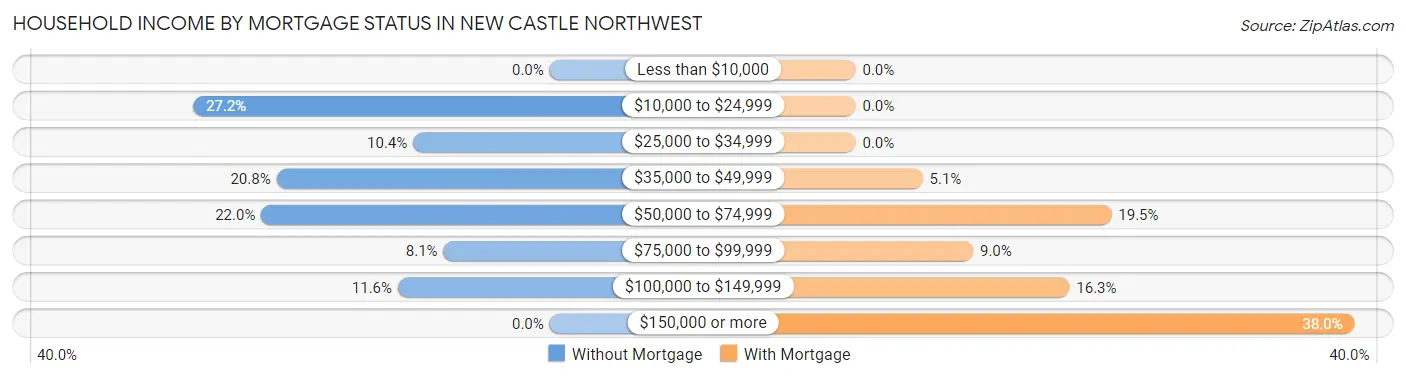
| Household Income | Without Mortgage | With Mortgage |
| Less than $10,000 | 0 (0.0%) | 0 (0.0%) |
| $10,000 to $24,999 | 47 (27.2%) | 0 (0.0%) |
| $25,000 to $34,999 | 18 (10.4%) | 0 (0.0%) |
| $35,000 to $49,999 | 36 (20.8%) | 16 (5.1%) |
| $50,000 to $74,999 | 38 (22.0%) | 61 (19.5%) |
| $75,000 to $99,999 | 14 (8.1%) | 28 (8.9%) |
| $100,000 to $149,999 | 20 (11.6%) | 51 (16.3%) |
| $150,000 or more | 0 (0.0%) | 119 (38.0%) |
| Total | 173 (100.0%) | 313 (100.0%) |
Property Value to Household Income Ratio in New Castle Northwest
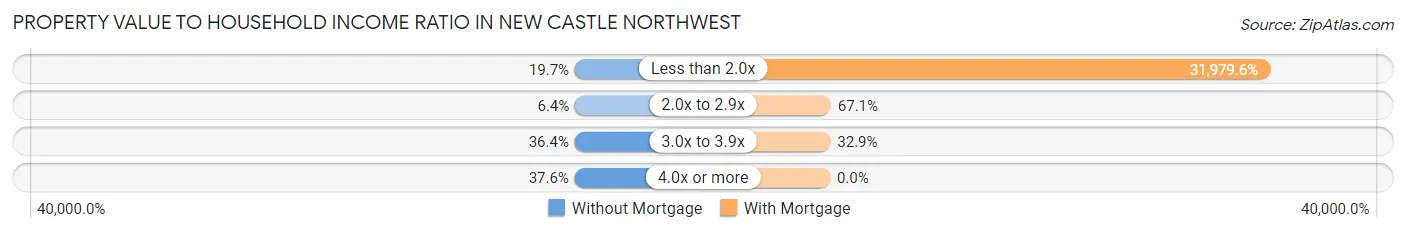
| Value-to-Income Ratio | Without Mortgage | With Mortgage |
| Less than 2.0x | 34 (19.7%) | 100,096 (31,979.6%) |
| 2.0x to 2.9x | 11 (6.4%) | 210 (67.1%) |
| 3.0x to 3.9x | 63 (36.4%) | 103 (32.9%) |
| 4.0x or more | 65 (37.6%) | 0 (0.0%) |
| Total | 173 (100.0%) | 313 (100.0%) |
Real Estate Taxes by Mortgage Status in New Castle Northwest
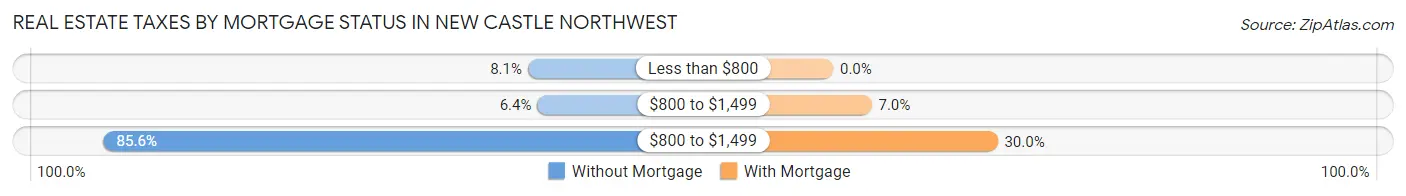
| Property Taxes | Without Mortgage | With Mortgage |
| Less than $800 | 14 (8.1%) | 0 (0.0%) |
| $800 to $1,499 | 11 (6.4%) | 22 (7.0%) |
| $800 to $1,499 | 148 (85.6%) | 94 (30.0%) |
| Total | 173 (100.0%) | 313 (100.0%) |
Health & Disability in New Castle Northwest
Health Insurance Coverage by Age in New Castle Northwest
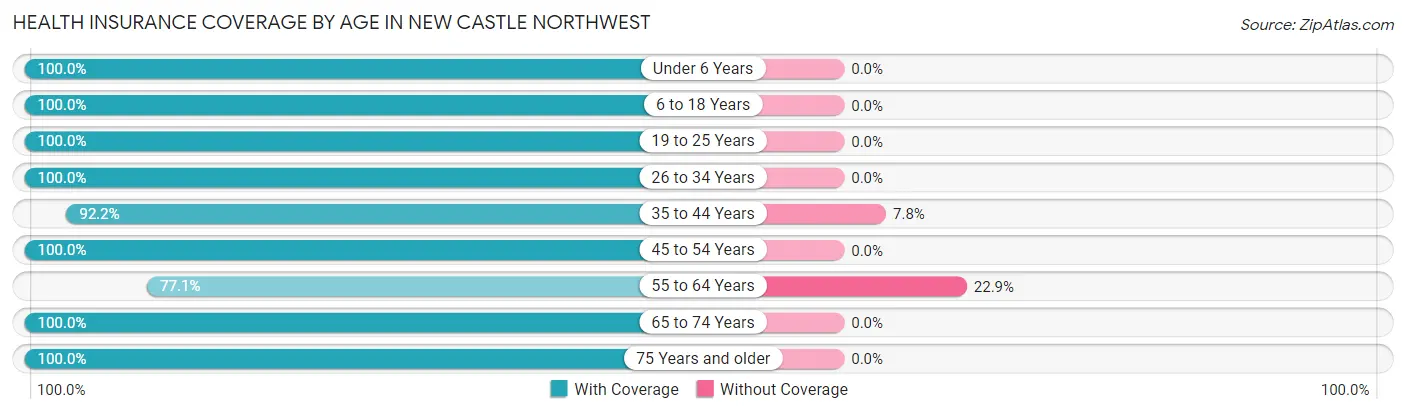
| Age Bracket | With Coverage | Without Coverage |
| Under 6 Years | 20 (100.0%) | 0 (0.0%) |
| 6 to 18 Years | 283 (100.0%) | 0 (0.0%) |
| 19 to 25 Years | 122 (100.0%) | 0 (0.0%) |
| 26 to 34 Years | 79 (100.0%) | 0 (0.0%) |
| 35 to 44 Years | 284 (92.2%) | 24 (7.8%) |
| 45 to 54 Years | 110 (100.0%) | 0 (0.0%) |
| 55 to 64 Years | 81 (77.1%) | 24 (22.9%) |
| 65 to 74 Years | 213 (100.0%) | 0 (0.0%) |
| 75 Years and older | 200 (100.0%) | 0 (0.0%) |
| Total | 1,392 (96.7%) | 48 (3.3%) |
Health Insurance Coverage by Citizenship Status in New Castle Northwest
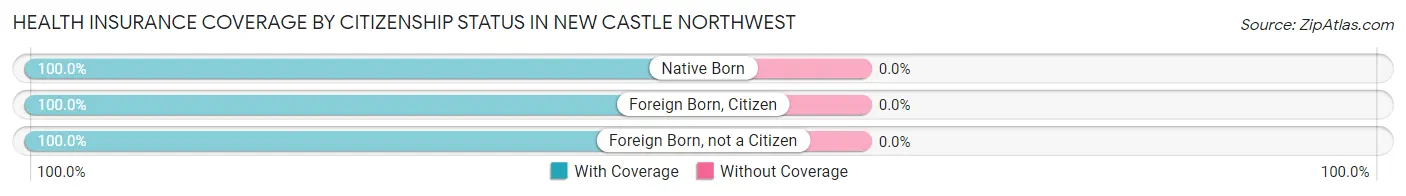
| Citizenship Status | With Coverage | Without Coverage |
| Native Born | 20 (100.0%) | 0 (0.0%) |
| Foreign Born, Citizen | 283 (100.0%) | 0 (0.0%) |
| Foreign Born, not a Citizen | 122 (100.0%) | 0 (0.0%) |
Health Insurance Coverage by Household Income in New Castle Northwest
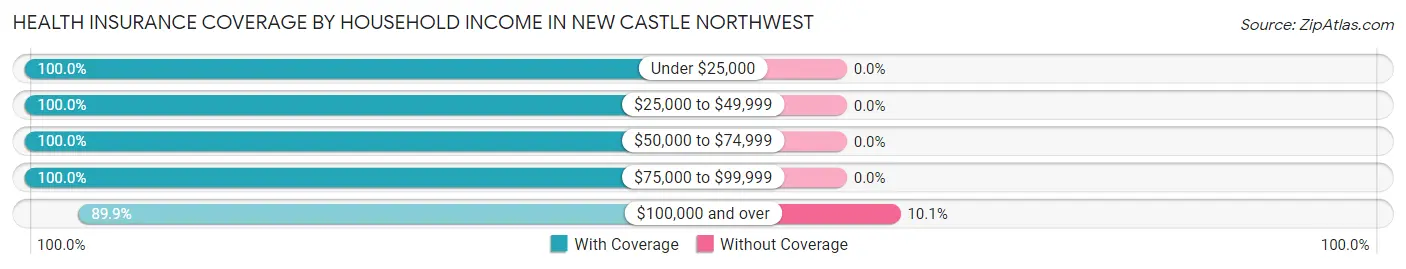
| Household Income | With Coverage | Without Coverage |
| Under $25,000 | 89 (100.0%) | 0 (0.0%) |
| $25,000 to $49,999 | 374 (100.0%) | 0 (0.0%) |
| $50,000 to $74,999 | 122 (100.0%) | 0 (0.0%) |
| $75,000 to $99,999 | 373 (100.0%) | 0 (0.0%) |
| $100,000 and over | 429 (89.9%) | 48 (10.1%) |
Public vs Private Health Insurance Coverage by Age in New Castle Northwest
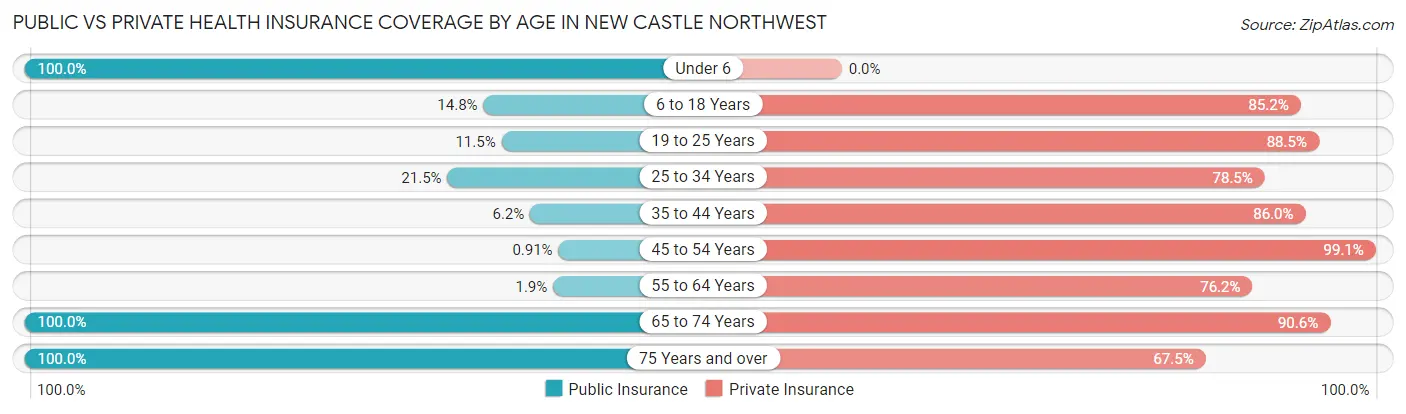
| Age Bracket | Public Insurance | Private Insurance |
| Under 6 | 20 (100.0%) | 0 (0.0%) |
| 6 to 18 Years | 42 (14.8%) | 241 (85.2%) |
| 19 to 25 Years | 14 (11.5%) | 108 (88.5%) |
| 25 to 34 Years | 17 (21.5%) | 62 (78.5%) |
| 35 to 44 Years | 19 (6.2%) | 265 (86.0%) |
| 45 to 54 Years | 1 (0.9%) | 109 (99.1%) |
| 55 to 64 Years | 2 (1.9%) | 80 (76.2%) |
| 65 to 74 Years | 213 (100.0%) | 193 (90.6%) |
| 75 Years and over | 200 (100.0%) | 135 (67.5%) |
| Total | 528 (36.7%) | 1,193 (82.9%) |
Disability Status by Sex by Age in New Castle Northwest
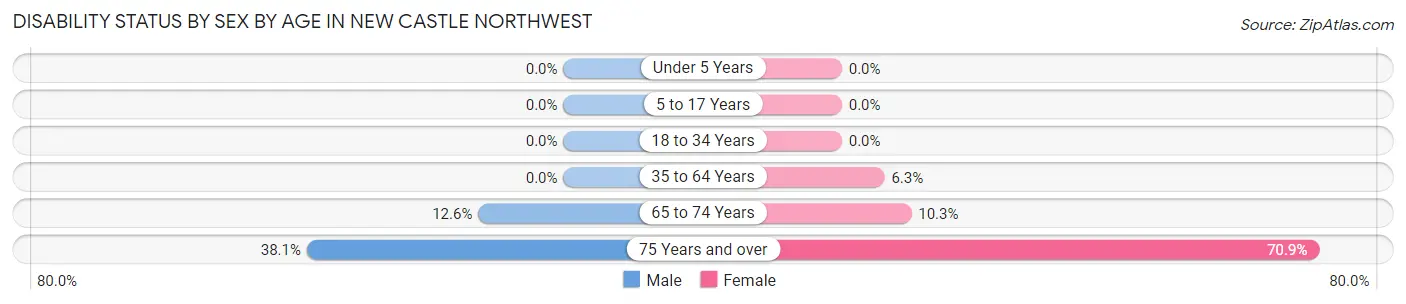
| Age Bracket | Male | Female |
| Under 5 Years | 0 (0.0%) | 0 (0.0%) |
| 5 to 17 Years | 0 (0.0%) | 0 (0.0%) |
| 18 to 34 Years | 0 (0.0%) | 0 (0.0%) |
| 35 to 64 Years | 0 (0.0%) | 21 (6.3%) |
| 65 to 74 Years | 11 (12.6%) | 13 (10.3%) |
| 75 Years and over | 16 (38.1%) | 112 (70.9%) |
Disability Class by Sex by Age in New Castle Northwest
Disability Class: Hearing Difficulty
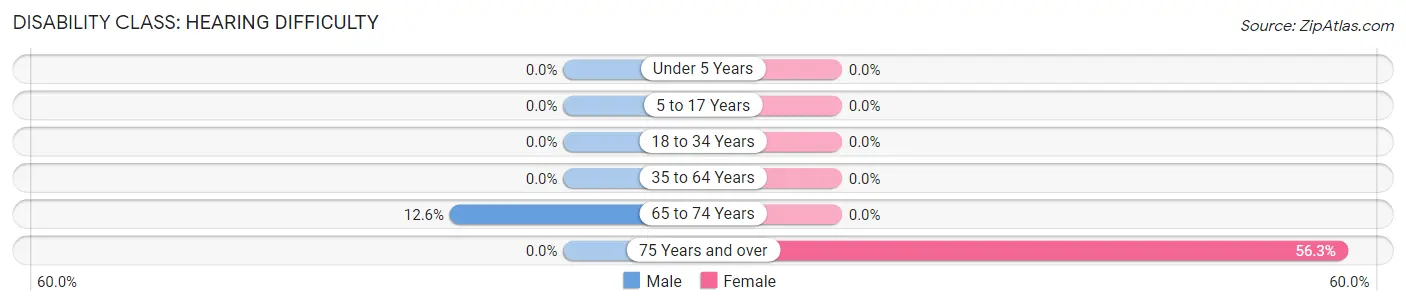
| Age Bracket | Male | Female |
| Under 5 Years | 0 (0.0%) | 0 (0.0%) |
| 5 to 17 Years | 0 (0.0%) | 0 (0.0%) |
| 18 to 34 Years | 0 (0.0%) | 0 (0.0%) |
| 35 to 64 Years | 0 (0.0%) | 0 (0.0%) |
| 65 to 74 Years | 11 (12.6%) | 0 (0.0%) |
| 75 Years and over | 0 (0.0%) | 89 (56.3%) |
Disability Class: Vision Difficulty
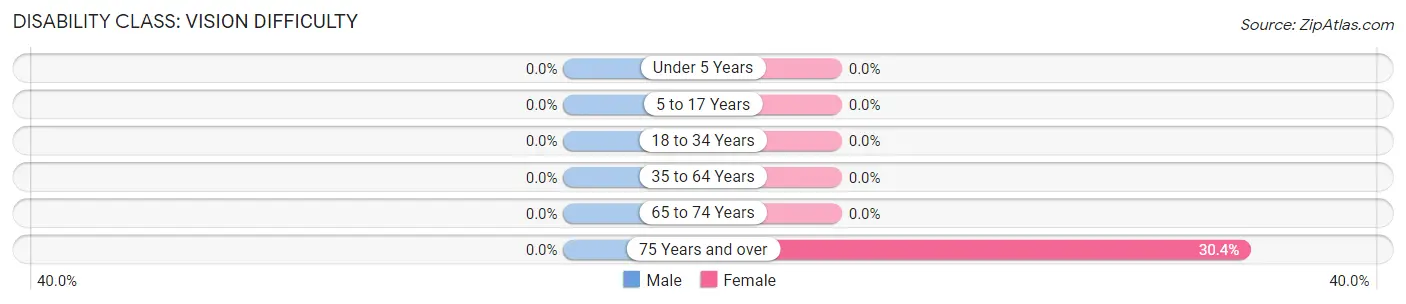
| Age Bracket | Male | Female |
| Under 5 Years | 0 (0.0%) | 0 (0.0%) |
| 5 to 17 Years | 0 (0.0%) | 0 (0.0%) |
| 18 to 34 Years | 0 (0.0%) | 0 (0.0%) |
| 35 to 64 Years | 0 (0.0%) | 0 (0.0%) |
| 65 to 74 Years | 0 (0.0%) | 0 (0.0%) |
| 75 Years and over | 0 (0.0%) | 48 (30.4%) |
Disability Class: Cognitive Difficulty
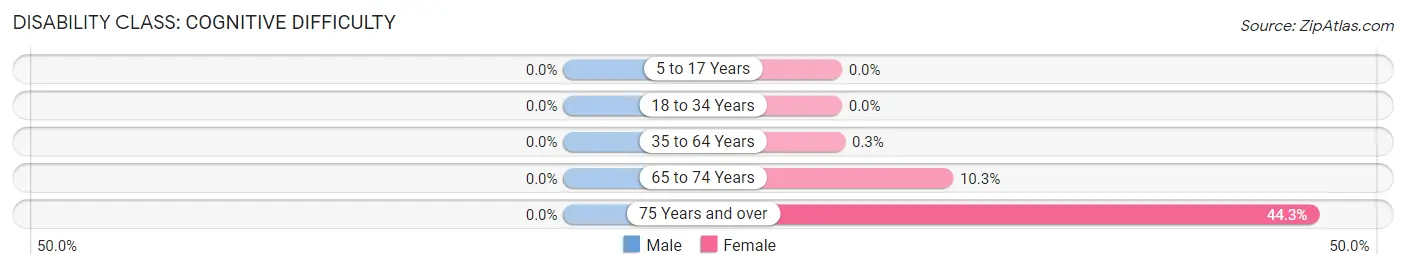
| Age Bracket | Male | Female |
| 5 to 17 Years | 0 (0.0%) | 0 (0.0%) |
| 18 to 34 Years | 0 (0.0%) | 0 (0.0%) |
| 35 to 64 Years | 0 (0.0%) | 1 (0.3%) |
| 65 to 74 Years | 0 (0.0%) | 13 (10.3%) |
| 75 Years and over | 0 (0.0%) | 70 (44.3%) |
Disability Class: Ambulatory Difficulty
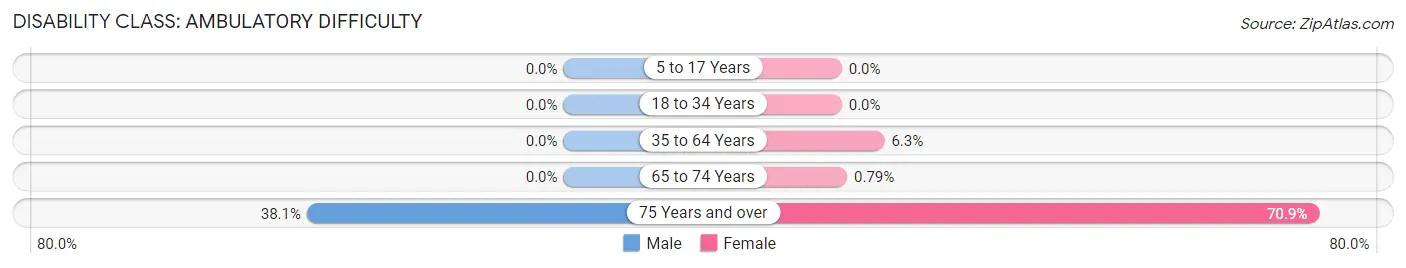
| Age Bracket | Male | Female |
| 5 to 17 Years | 0 (0.0%) | 0 (0.0%) |
| 18 to 34 Years | 0 (0.0%) | 0 (0.0%) |
| 35 to 64 Years | 0 (0.0%) | 21 (6.3%) |
| 65 to 74 Years | 0 (0.0%) | 1 (0.8%) |
| 75 Years and over | 16 (38.1%) | 112 (70.9%) |
Disability Class: Self-Care Difficulty
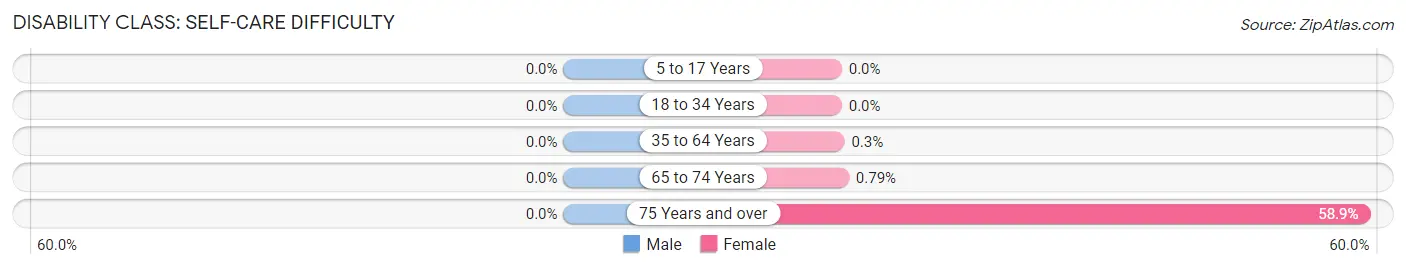
| Age Bracket | Male | Female |
| 5 to 17 Years | 0 (0.0%) | 0 (0.0%) |
| 18 to 34 Years | 0 (0.0%) | 0 (0.0%) |
| 35 to 64 Years | 0 (0.0%) | 1 (0.3%) |
| 65 to 74 Years | 0 (0.0%) | 1 (0.8%) |
| 75 Years and over | 0 (0.0%) | 93 (58.9%) |
Technology Access in New Castle Northwest
Computing Device Access in New Castle Northwest
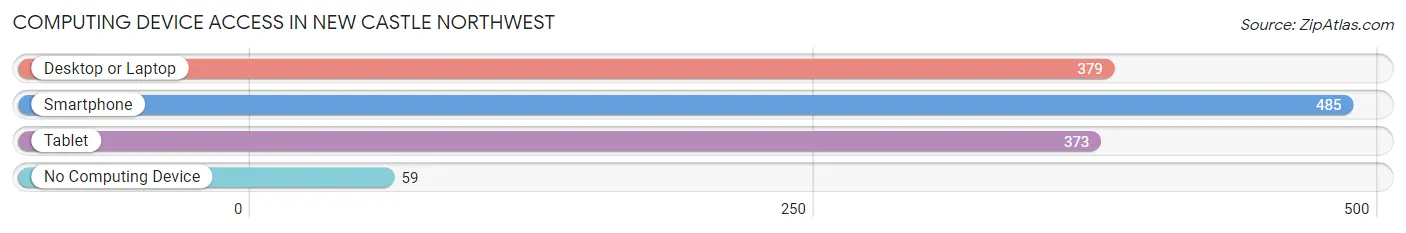
| Device Type | # Households | % Households |
| Desktop or Laptop | 379 | 64.8% |
| Smartphone | 485 | 82.9% |
| Tablet | 373 | 63.8% |
| No Computing Device | 59 | 10.1% |
| Total | 585 | 100.0% |
Internet Access in New Castle Northwest
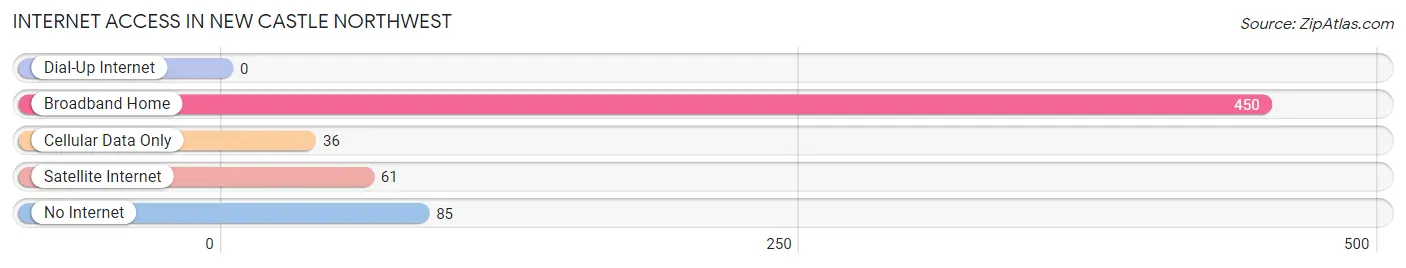
| Internet Type | # Households | % Households |
| Dial-Up Internet | 0 | 0.0% |
| Broadband Home | 450 | 76.9% |
| Cellular Data Only | 36 | 6.1% |
| Satellite Internet | 61 | 10.4% |
| No Internet | 85 | 14.5% |
| Total | 585 | 100.0% |
New Castle Northwest Summary
New Castle Northwest is a census-designated place (CDP) located in Lawrence County, Pennsylvania. It is part of the New Castle, Pennsylvania Metropolitan Statistical Area. The population was 4,845 at the 2010 census.
Geography
New Castle Northwest is located at 41 005045 80 351845
According to the United States Census Bureau, the CDP has a total area of 4.2 square miles (10.8 km2), all of it land.
Demographics
As of the census of 2000, there were 4,845 people, 2,039 households, and 1,372 families residing in the CDP. The population density was 1,154.3 people per square mile (446.7/km2). There were 2,164 housing units at an average density of 514.7/sq mi (198.2/km2). The racial makeup of the CDP was 97.90% White, 0.90% African American, 0.08% Native American, 0.25% Asian, 0.02% Pacific Islander, 0.25% from other races, and 0.60% from two or more races. Hispanic or Latino of any race were 0.60% of the population.
There were 2,039 households, out of which 28.2% had children under the age of 18 living with them, 49.2% were married couples living together, 13.2% had a female householder with no husband present, and 33.2% were non-families. 29.2% of all households were made up of individuals, and 14.2% had someone living alone who was 65 years of age or older. The average household size was 2.37 and the average family size was 2.91.
In the CDP, the population was spread out, with 22.7% under the age of 18, 7.2% from 18 to 24, 28.2% from 25 to 44, 23.2% from 45 to 64, and 18.7% who were 65 years of age or older. The median age was 40 years. For every 100 females, there were 90.2 males. For every 100 females age 18 and over, there were 86.2 males.
The median income for a household in the CDP was $30,917, and the median income for a family was $37,917. Males had a median income of $30,917 versus $21,917 for females. The per capita income for the CDP was $16,917. About 8.2% of families and 10.2% of the population were below the poverty line, including 14.2% of those under age 18 and 8.2% of those age 65 or over.
Economy
New Castle Northwest is home to several businesses, including a variety of retail stores, restaurants, and service providers. The area is also home to several manufacturing companies, including a steel mill and a plastics plant.
The area is served by the New Castle Municipal Airport, which is located just outside of the CDP. The airport offers general aviation services, including charter flights, air taxi services, and flight instruction.
The area is also served by the New Castle School District, which provides public education to students in grades K-12. The district operates several elementary schools, a middle school, and a high school.
Conclusion
New Castle Northwest is a census-designated place located in Lawrence County, Pennsylvania. It is part of the New Castle, Pennsylvania Metropolitan Statistical Area. The population was 4,845 at the 2010 census. The area is home to a variety of businesses, including retail stores, restaurants, and manufacturing companies. It is also served by the New Castle Municipal Airport and the New Castle School District. The area has a diverse population and a median household income of $30,917.
Common Questions
What is Per Capita Income in New Castle Northwest?
Per Capita income in New Castle Northwest is $30,787.
What is the Median Family Income in New Castle Northwest?
Median Family Income in New Castle Northwest is $92,704.
What is the Median Household income in New Castle Northwest?
Median Household Income in New Castle Northwest is $69,659.
What is Income or Wage Gap in New Castle Northwest?
Income or Wage Gap in New Castle Northwest is 31.5%.
Women in New Castle Northwest earn 68.5 cents for every dollar earned by a man.
What is Inequality or Gini Index in New Castle Northwest?
Inequality or Gini Index in New Castle Northwest is 0.32.
What is the Total Population of New Castle Northwest?
Total Population of New Castle Northwest is 1,440.
What is the Total Male Population of New Castle Northwest?
Total Male Population of New Castle Northwest is 597.
What is the Total Female Population of New Castle Northwest?
Total Female Population of New Castle Northwest is 843.
What is the Ratio of Males per 100 Females in New Castle Northwest?
There are 70.82 Males per 100 Females in New Castle Northwest.
What is the Ratio of Females per 100 Males in New Castle Northwest?
There are 141.21 Females per 100 Males in New Castle Northwest.
What is the Median Population Age in New Castle Northwest?
Median Population Age in New Castle Northwest is 40.9 Years.
What is the Average Family Size in New Castle Northwest
Average Family Size in New Castle Northwest is 3.0 People.
What is the Average Household Size in New Castle Northwest
Average Household Size in New Castle Northwest is 2.5 People.
How Large is the Labor Force in New Castle Northwest?
There are 725 People in the Labor Forcein in New Castle Northwest.
What is the Percentage of People in the Labor Force in New Castle Northwest?
58.3% of People are in the Labor Force in New Castle Northwest.
What is the Unemployment Rate in New Castle Northwest?
Unemployment Rate in New Castle Northwest is 2.6%.