Cetronia, PA Map & Demographics
Cetronia Map
Cetronia Overview
$39,140
PER CAPITA INCOME
$108,417
AVG FAMILY INCOME
$75,200
AVG HOUSEHOLD INCOME
17.8%
WAGE / INCOME GAP [ % ]
82.2¢/ $1
WAGE / INCOME GAP [ $ ]
0.39
INEQUALITY / GINI INDEX
2,377
TOTAL POPULATION
1,156
MALE POPULATION
1,221
FEMALE POPULATION
94.68
MALES / 100 FEMALES
105.62
FEMALES / 100 MALES
43.6
MEDIAN AGE
3.0
AVG FAMILY SIZE
2.4
AVG HOUSEHOLD SIZE
1,125
LABOR FORCE [ PEOPLE ]
58.6%
PERCENT IN LABOR FORCE
2.6%
UNEMPLOYMENT RATE
Income in Cetronia
Income Overview in Cetronia
Per Capita Income in Cetronia is $39,140, while median incomes of families and households are $108,417 and $75,200 respectively.
| Characteristic | Number | Measure |
| Per Capita Income | 2,377 | $39,140 |
| Median Family Income | 625 | $108,417 |
| Mean Family Income | 625 | $114,784 |
| Median Household Income | 970 | $75,200 |
| Mean Household Income | 970 | $94,156 |
| Income Deficit | 625 | $0 |
| Wage / Income Gap (%) | 2,377 | 17.78% |
| Wage / Income Gap ($) | 2,377 | 82.22¢ per $1 |
| Gini / Inequality Index | 2,377 | 0.39 |
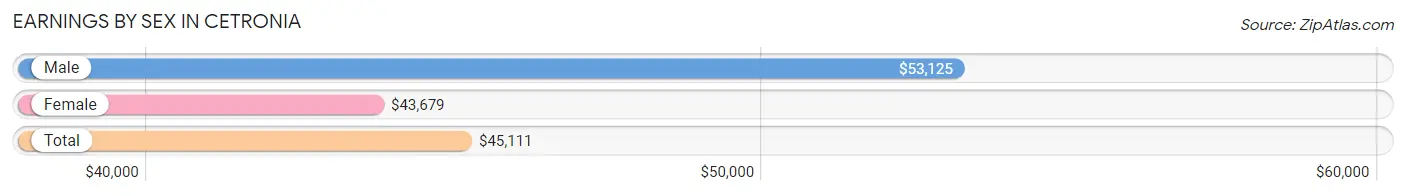
Earnings by Sex in Cetronia
Average Earnings in Cetronia are $45,111, $53,125 for men and $43,679 for women, a difference of 17.8%.
| Sex | Number | Average Earnings |
| Male | 571 (48.7%) | $53,125 |
| Female | 601 (51.3%) | $43,679 |
| Total | 1,172 (100.0%) | $45,111 |
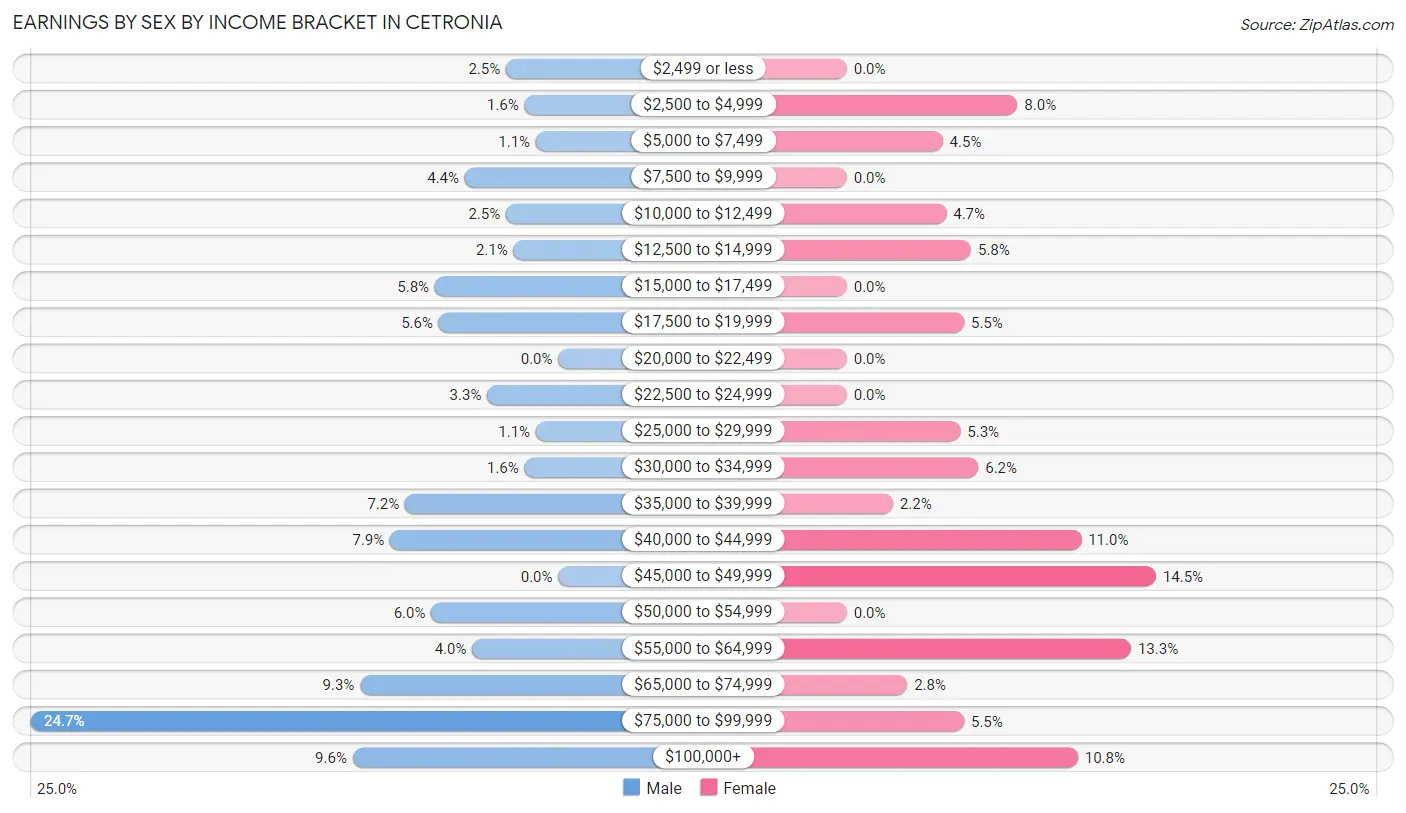
Earnings by Sex by Income Bracket in Cetronia
The most common earnings brackets in Cetronia are $75,000 to $99,999 for men (141 | 24.7%) and $45,000 to $49,999 for women (87 | 14.5%).
| Income | Male | Female |
| $2,499 or less | 14 (2.5%) | 0 (0.0%) |
| $2,500 to $4,999 | 9 (1.6%) | 48 (8.0%) |
| $5,000 to $7,499 | 6 (1.1%) | 27 (4.5%) |
| $7,500 to $9,999 | 25 (4.4%) | 0 (0.0%) |
| $10,000 to $12,499 | 14 (2.5%) | 28 (4.7%) |
| $12,500 to $14,999 | 12 (2.1%) | 35 (5.8%) |
| $15,000 to $17,499 | 33 (5.8%) | 0 (0.0%) |
| $17,500 to $19,999 | 32 (5.6%) | 33 (5.5%) |
| $20,000 to $22,499 | 0 (0.0%) | 0 (0.0%) |
| $22,500 to $24,999 | 19 (3.3%) | 0 (0.0%) |
| $25,000 to $29,999 | 6 (1.1%) | 32 (5.3%) |
| $30,000 to $34,999 | 9 (1.6%) | 37 (6.2%) |
| $35,000 to $39,999 | 41 (7.2%) | 13 (2.2%) |
| $40,000 to $44,999 | 45 (7.9%) | 66 (11.0%) |
| $45,000 to $49,999 | 0 (0.0%) | 87 (14.5%) |
| $50,000 to $54,999 | 34 (5.9%) | 0 (0.0%) |
| $55,000 to $64,999 | 23 (4.0%) | 80 (13.3%) |
| $65,000 to $74,999 | 53 (9.3%) | 17 (2.8%) |
| $75,000 to $99,999 | 141 (24.7%) | 33 (5.5%) |
| $100,000+ | 55 (9.6%) | 65 (10.8%) |
| Total | 571 (100.0%) | 601 (100.0%) |
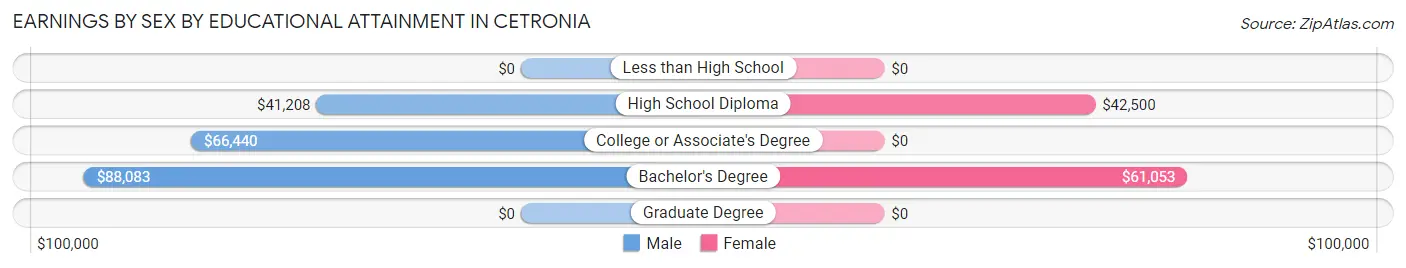
Earnings by Sex by Educational Attainment in Cetronia
Average earnings in Cetronia are $61,806 for men and $45,556 for women, a difference of 26.3%. Men with an educational attainment of bachelor's degree enjoy the highest average annual earnings of $88,083, while those with high school diploma education earn the least with $41,208. Women with an educational attainment of bachelor's degree earn the most with the average annual earnings of $61,053, while those with high school diploma education have the smallest earnings of $42,500.
| Educational Attainment | Male Income | Female Income |
| Less than High School | - | - |
| High School Diploma | $41,208 | $42,500 |
| College or Associate's Degree | $66,440 | $0 |
| Bachelor's Degree | $88,083 | $61,053 |
| Graduate Degree | - | - |
| Total | $61,806 | $45,556 |
Family Income in Cetronia
Family Income Brackets in Cetronia
According to the Cetronia family income data, there are 155 families falling into the $150,000 to $199,999 income range, which is the most common income bracket and makes up 24.8% of all families.
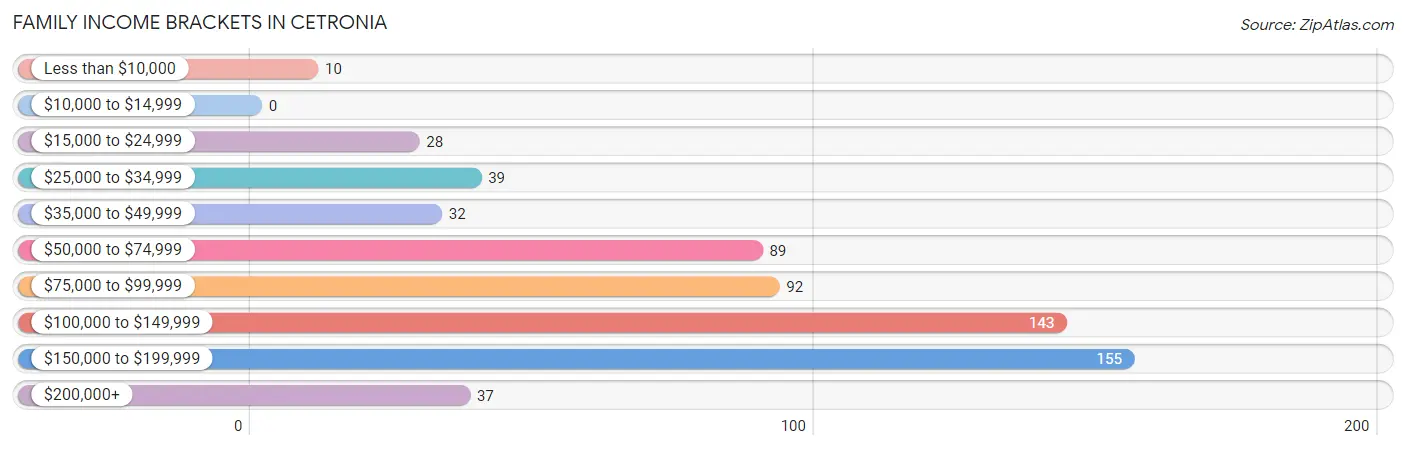
| Income Bracket | # Families | % Families |
| Less than $10,000 | 10 | 1.6% |
| $10,000 to $14,999 | 0 | 0.0% |
| $15,000 to $24,999 | 28 | 4.5% |
| $25,000 to $34,999 | 39 | 6.2% |
| $35,000 to $49,999 | 32 | 5.1% |
| $50,000 to $74,999 | 89 | 14.2% |
| $75,000 to $99,999 | 92 | 14.7% |
| $100,000 to $149,999 | 143 | 22.9% |
| $150,000 to $199,999 | 155 | 24.8% |
| $200,000+ | 37 | 5.9% |
Family Income by Famaliy Size in Cetronia
3-person families (115 | 18.4%) account for the highest median family income in Cetronia with $151,146 per family, while 3-person families (115 | 18.4%) have the highest median income of $50,382 per family member.
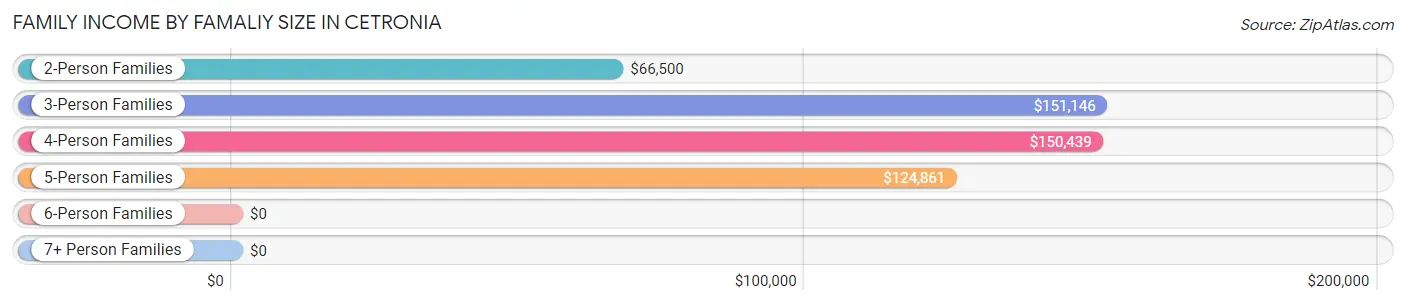
| Income Bracket | # Families | Median Income |
| 2-Person Families | 300 (48.0%) | $66,500 |
| 3-Person Families | 115 (18.4%) | $151,146 |
| 4-Person Families | 146 (23.4%) | $150,439 |
| 5-Person Families | 64 (10.2%) | $124,861 |
| 6-Person Families | 0 (0.0%) | $0 |
| 7+ Person Families | 0 (0.0%) | $0 |
| Total | 625 (100.0%) | $108,417 |
Family Income by Number of Earners in Cetronia
The median family income in Cetronia is $108,417, with families comprising 3+ earners (78) having the highest median family income of $131,250, while families with no earners (92) have the lowest median family income of $58,138, accounting for 12.5% and 14.7% of families, respectively.
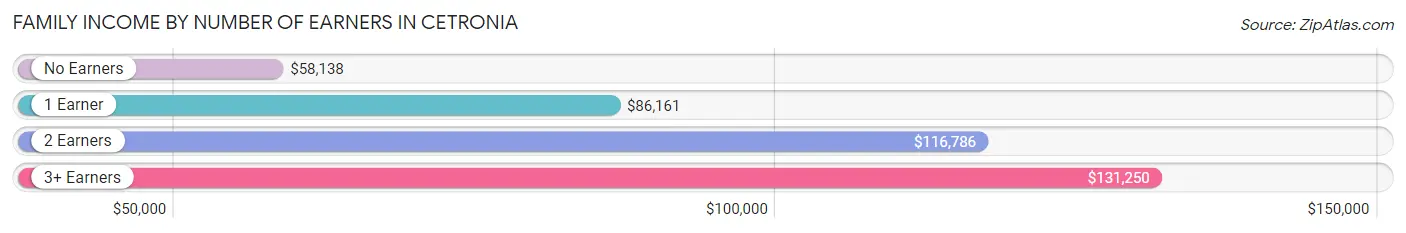
| Number of Earners | # Families | Median Income |
| No Earners | 92 (14.7%) | $58,138 |
| 1 Earner | 197 (31.5%) | $86,161 |
| 2 Earners | 258 (41.3%) | $116,786 |
| 3+ Earners | 78 (12.5%) | $131,250 |
| Total | 625 (100.0%) | $108,417 |
Household Income in Cetronia
Household Income Brackets in Cetronia
With 180 households falling in the category, the $100,000 to $149,999 income range is the most frequent in Cetronia, accounting for 18.6% of all households. In contrast, only 10 households (1.0%) fall into the less than $10,000 income bracket, making it the least populous group.
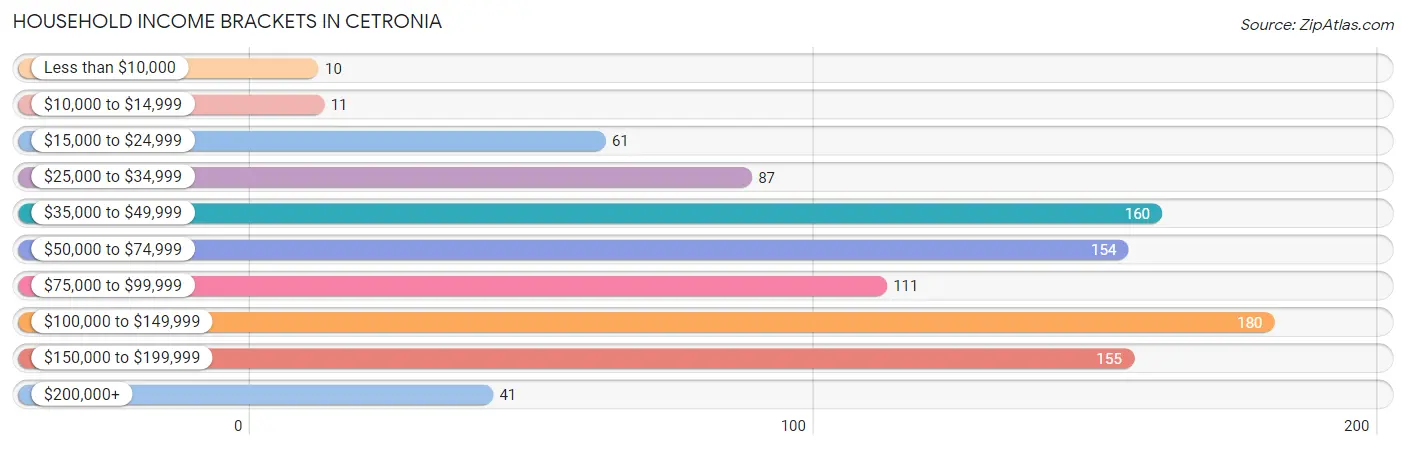
| Income Bracket | # Households | % Households |
| Less than $10,000 | 10 | 1.0% |
| $10,000 to $14,999 | 11 | 1.1% |
| $15,000 to $24,999 | 61 | 6.3% |
| $25,000 to $34,999 | 87 | 9.0% |
| $35,000 to $49,999 | 160 | 16.5% |
| $50,000 to $74,999 | 154 | 15.9% |
| $75,000 to $99,999 | 111 | 11.4% |
| $100,000 to $149,999 | 180 | 18.6% |
| $150,000 to $199,999 | 155 | 16.0% |
| $200,000+ | 41 | 4.2% |
Household Income by Householder Age in Cetronia
The median household income in Cetronia is $75,200, with the highest median household income of $117,232 found in the 25 to 44 years age bracket for the primary householder. A total of 287 households (29.6%) fall into this category.
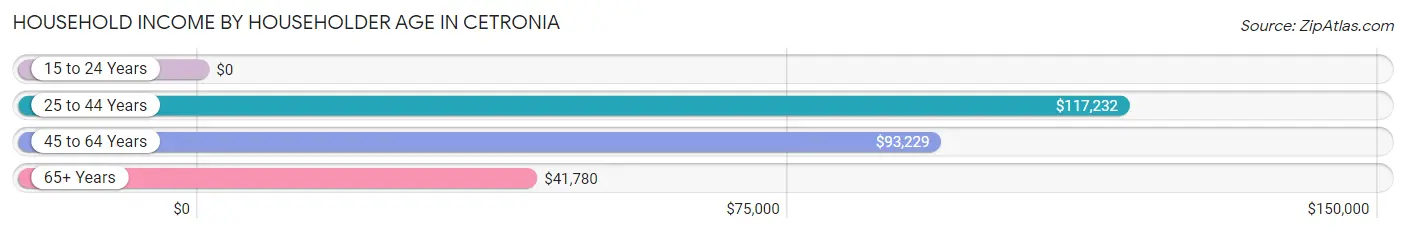
| Income Bracket | # Households | Median Income |
| 15 to 24 Years | 0 (0.0%) | $0 |
| 25 to 44 Years | 287 (29.6%) | $117,232 |
| 45 to 64 Years | 301 (31.0%) | $93,229 |
| 65+ Years | 382 (39.4%) | $41,780 |
| Total | 970 (100.0%) | $75,200 |
Poverty in Cetronia
Income Below Poverty by Sex and Age in Cetronia
With 3.1% poverty level for males and 2.9% for females among the residents of Cetronia, 75 year old and over males and 18 to 24 year old females are the most vulnerable to poverty, with 10 males (12.2%) and 14 females (22.6%) in their respective age groups living below the poverty level.
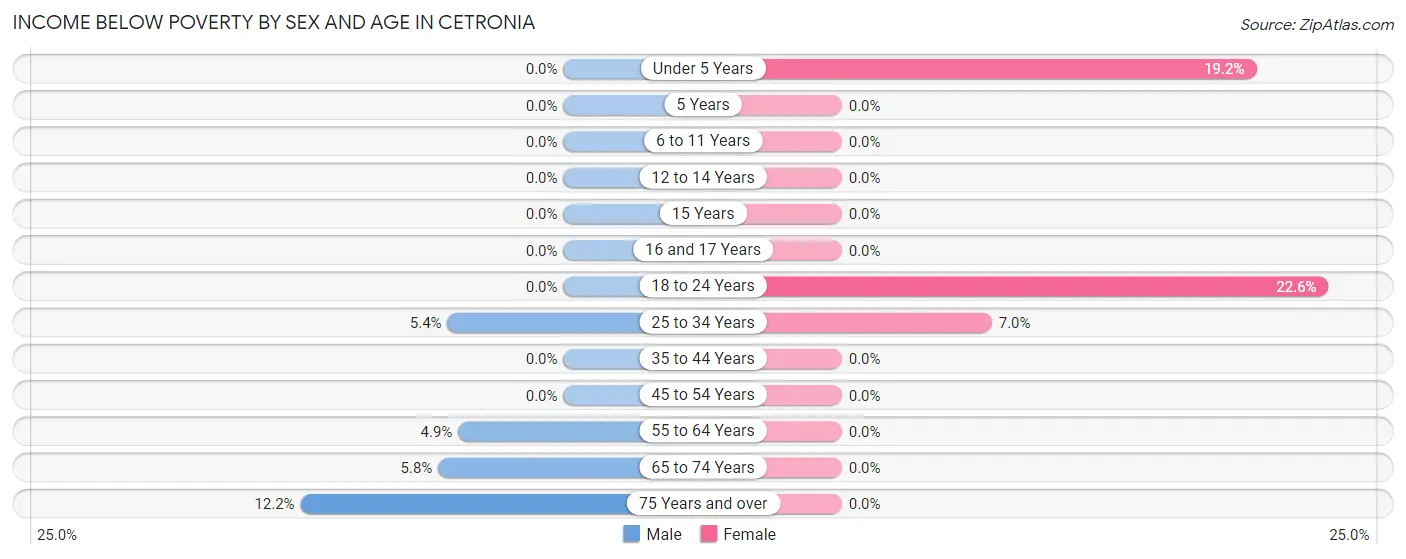
| Age Bracket | Male | Female |
| Under 5 Years | 0 (0.0%) | 10 (19.2%) |
| 5 Years | 0 (0.0%) | 0 (0.0%) |
| 6 to 11 Years | 0 (0.0%) | 0 (0.0%) |
| 12 to 14 Years | 0 (0.0%) | 0 (0.0%) |
| 15 Years | 0 (0.0%) | 0 (0.0%) |
| 16 and 17 Years | 0 (0.0%) | 0 (0.0%) |
| 18 to 24 Years | 0 (0.0%) | 14 (22.6%) |
| 25 to 34 Years | 10 (5.4%) | 11 (7.0%) |
| 35 to 44 Years | 0 (0.0%) | 0 (0.0%) |
| 45 to 54 Years | 0 (0.0%) | 0 (0.0%) |
| 55 to 64 Years | 6 (4.9%) | 0 (0.0%) |
| 65 to 74 Years | 10 (5.8%) | 0 (0.0%) |
| 75 Years and over | 10 (12.2%) | 0 (0.0%) |
| Total | 36 (3.1%) | 35 (2.9%) |
Income Above Poverty by Sex and Age in Cetronia
According to the poverty statistics in Cetronia, males aged under 5 years and females aged 5 years are the age groups that are most secure financially, with 100.0% of males and 100.0% of females in these age groups living above the poverty line.
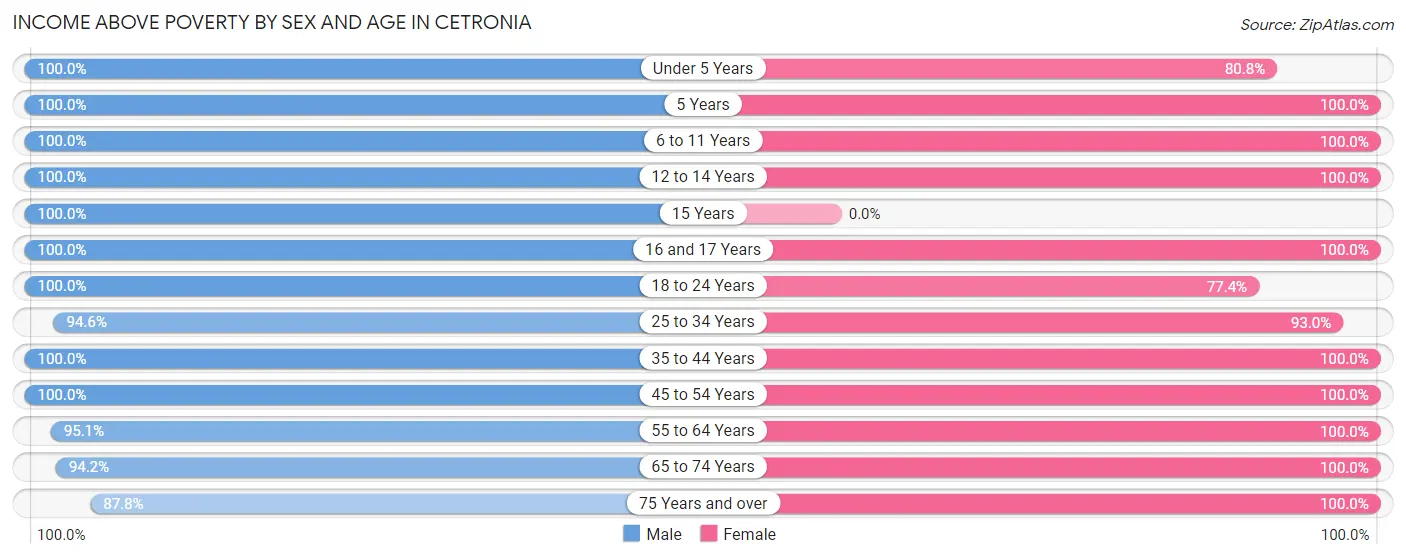
| Age Bracket | Male | Female |
| Under 5 Years | 96 (100.0%) | 42 (80.8%) |
| 5 Years | 68 (100.0%) | 12 (100.0%) |
| 6 to 11 Years | 62 (100.0%) | 84 (100.0%) |
| 12 to 14 Years | 25 (100.0%) | 43 (100.0%) |
| 15 Years | 15 (100.0%) | 0 (0.0%) |
| 16 and 17 Years | 22 (100.0%) | 26 (100.0%) |
| 18 to 24 Years | 68 (100.0%) | 48 (77.4%) |
| 25 to 34 Years | 176 (94.6%) | 147 (93.0%) |
| 35 to 44 Years | 106 (100.0%) | 151 (100.0%) |
| 45 to 54 Years | 131 (100.0%) | 137 (100.0%) |
| 55 to 64 Years | 117 (95.1%) | 140 (100.0%) |
| 65 to 74 Years | 162 (94.2%) | 283 (100.0%) |
| 75 Years and over | 72 (87.8%) | 73 (100.0%) |
| Total | 1,120 (96.9%) | 1,186 (97.1%) |
Income Below Poverty Among Married-Couple Families in Cetronia
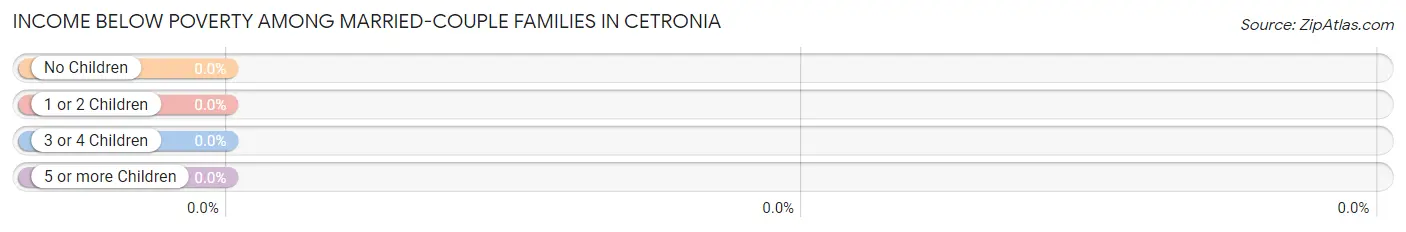
| Children | Above Poverty | Below Poverty |
| No Children | 220 (100.0%) | 0 (0.0%) |
| 1 or 2 Children | 186 (100.0%) | 0 (0.0%) |
| 3 or 4 Children | 30 (100.0%) | 0 (0.0%) |
| 5 or more Children | 0 (0.0%) | 0 (0.0%) |
| Total | 436 (100.0%) | 0 (0.0%) |
Income Below Poverty Among Single-Parent Households in Cetronia
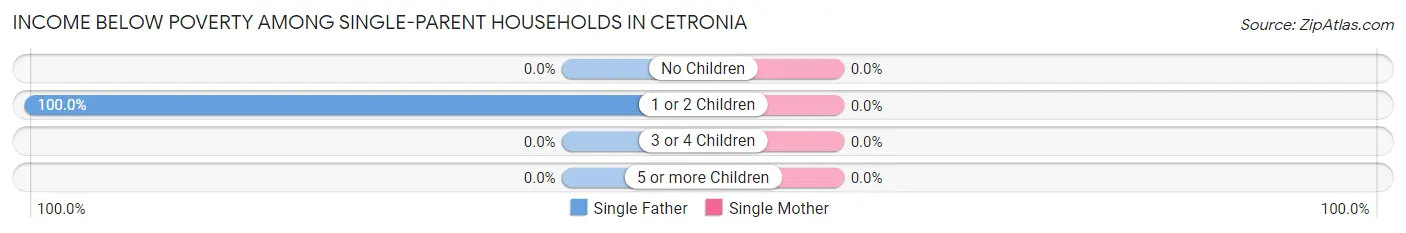
| Children | Single Father | Single Mother |
| No Children | 0 (0.0%) | 0 (0.0%) |
| 1 or 2 Children | 10 (100.0%) | 0 (0.0%) |
| 3 or 4 Children | 0 (0.0%) | 0 (0.0%) |
| 5 or more Children | 0 (0.0%) | 0 (0.0%) |
| Total | 10 (29.4%) | 0 (0.0%) |
Income Below Poverty Among Married-Couple vs Single-Parent Households in Cetronia
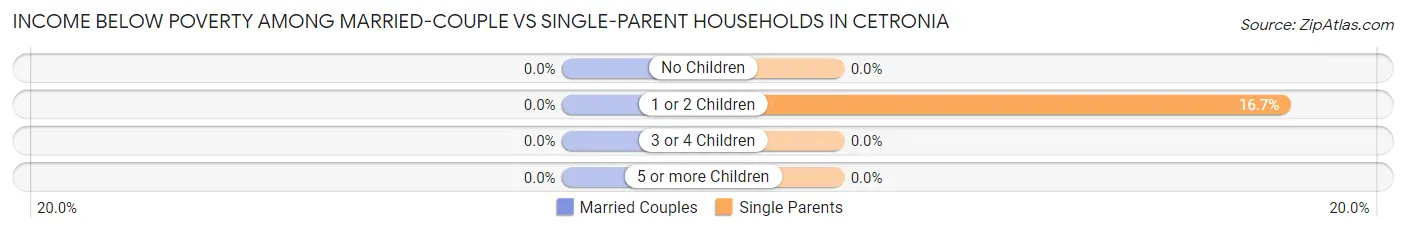
| Children | Married-Couple Families | Single-Parent Households |
| No Children | 0 (0.0%) | 0 (0.0%) |
| 1 or 2 Children | 0 (0.0%) | 10 (16.7%) |
| 3 or 4 Children | 0 (0.0%) | 0 (0.0%) |
| 5 or more Children | 0 (0.0%) | 0 (0.0%) |
| Total | 0 (0.0%) | 10 (5.3%) |
Race in Cetronia
The most populous races in Cetronia are White / Caucasian (2,256 | 94.9%), Hispanic or Latino (203 | 8.5%), and Some other Race (59 | 2.5%).
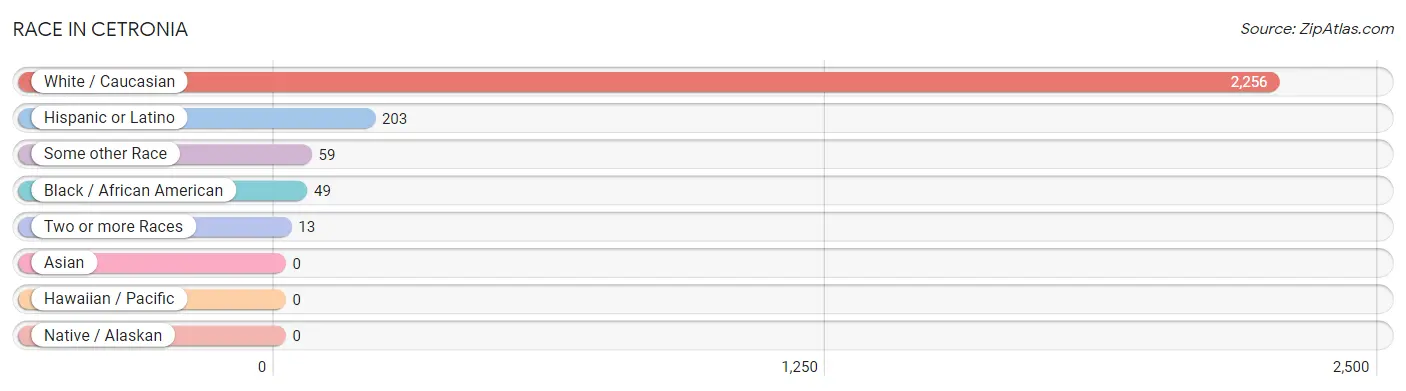
| Race | # Population | % Population |
| Asian | 0 | 0.0% |
| Black / African American | 49 | 2.1% |
| Hawaiian / Pacific | 0 | 0.0% |
| Hispanic or Latino | 203 | 8.5% |
| Native / Alaskan | 0 | 0.0% |
| White / Caucasian | 2,256 | 94.9% |
| Two or more Races | 13 | 0.5% |
| Some other Race | 59 | 2.5% |
| Total | 2,377 | 100.0% |
Ancestry in Cetronia
The most populous ancestries reported in Cetronia are German (768 | 32.3%), Irish (415 | 17.5%), Italian (226 | 9.5%), Polish (171 | 7.2%), and Pennsylvania German (139 | 5.9%), together accounting for 72.3% of all Cetronia residents.
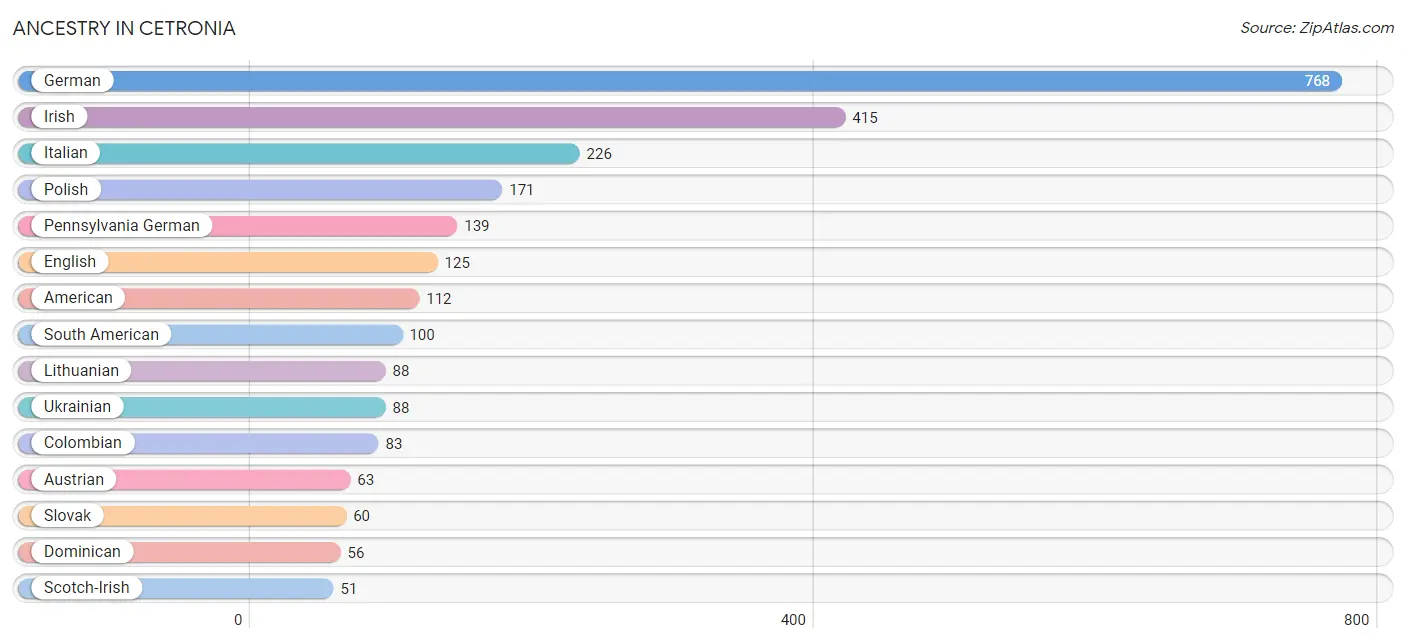
| Ancestry | # Population | % Population |
| American | 112 | 4.7% |
| Arab | 26 | 1.1% |
| Austrian | 63 | 2.6% |
| Canadian | 18 | 0.8% |
| Carpatho Rusyn | 17 | 0.7% |
| Central American | 30 | 1.3% |
| Colombian | 83 | 3.5% |
| Dominican | 56 | 2.4% |
| Dutch | 17 | 0.7% |
| Eastern European | 17 | 0.7% |
| English | 125 | 5.3% |
| European | 14 | 0.6% |
| French | 12 | 0.5% |
| German | 768 | 32.3% |
| Hungarian | 19 | 0.8% |
| Irish | 415 | 17.5% |
| Italian | 226 | 9.5% |
| Lithuanian | 88 | 3.7% |
| Panamanian | 30 | 1.3% |
| Pennsylvania German | 139 | 5.9% |
| Polish | 171 | 7.2% |
| Portuguese | 18 | 0.8% |
| Puerto Rican | 4 | 0.2% |
| Russian | 21 | 0.9% |
| Scotch-Irish | 51 | 2.1% |
| Scottish | 18 | 0.8% |
| Slovak | 60 | 2.5% |
| South American | 100 | 4.2% |
| Spanish | 13 | 0.5% |
| Swedish | 9 | 0.4% |
| Swiss | 18 | 0.8% |
| Syrian | 26 | 1.1% |
| Trinidadian and Tobagonian | 30 | 1.3% |
| Ukrainian | 88 | 3.7% |
| Venezuelan | 17 | 0.7% |
| Welsh | 17 | 0.7% | View All 36 Rows |
Immigrants in Cetronia
The most numerous immigrant groups reported in Cetronia came from Europe (119 | 5.0%), Eastern Europe (104 | 4.4%), Moldova (88 | 3.7%), Latin America (56 | 2.4%), and South America (49 | 2.1%), together accounting for 17.5% of all Cetronia residents.
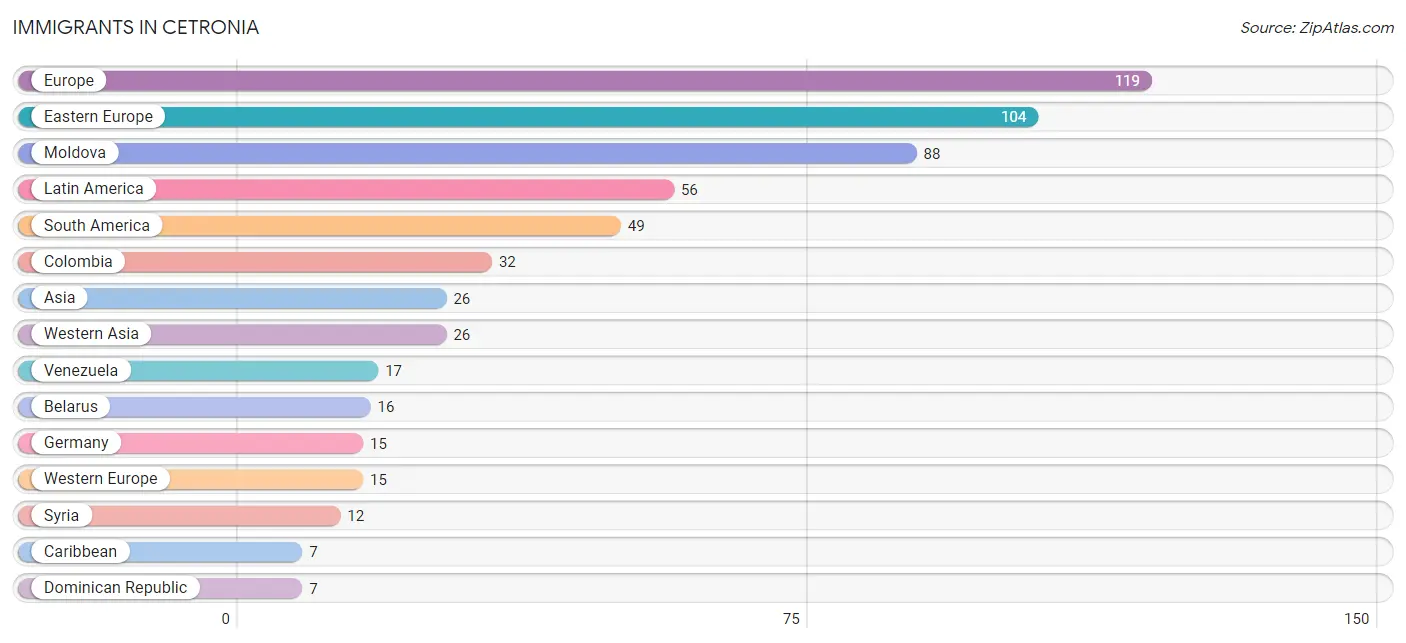
| Immigration Origin | # Population | % Population |
| Asia | 26 | 1.1% |
| Belarus | 16 | 0.7% |
| Caribbean | 7 | 0.3% |
| Colombia | 32 | 1.3% |
| Dominican Republic | 7 | 0.3% |
| Eastern Europe | 104 | 4.4% |
| Europe | 119 | 5.0% |
| Germany | 15 | 0.6% |
| Latin America | 56 | 2.4% |
| Moldova | 88 | 3.7% |
| South America | 49 | 2.1% |
| Syria | 12 | 0.5% |
| Venezuela | 17 | 0.7% |
| Western Asia | 26 | 1.1% |
| Western Europe | 15 | 0.6% | View All 15 Rows |
Sex and Age in Cetronia
Sex and Age in Cetronia
The most populous age groups in Cetronia are 30 to 34 Years (158 | 13.7%) for men and 70 to 74 Years (153 | 12.5%) for women.
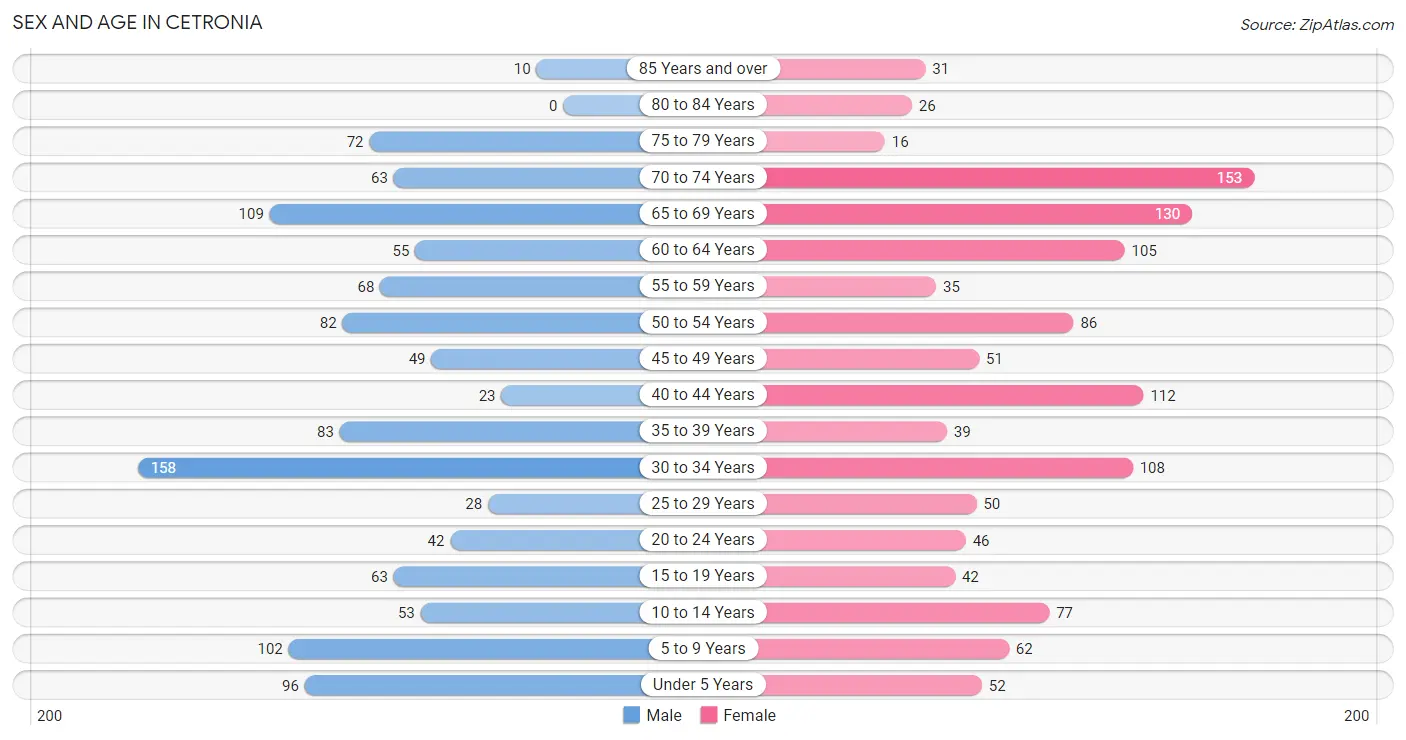
| Age Bracket | Male | Female |
| Under 5 Years | 96 (8.3%) | 52 (4.3%) |
| 5 to 9 Years | 102 (8.8%) | 62 (5.1%) |
| 10 to 14 Years | 53 (4.6%) | 77 (6.3%) |
| 15 to 19 Years | 63 (5.4%) | 42 (3.4%) |
| 20 to 24 Years | 42 (3.6%) | 46 (3.8%) |
| 25 to 29 Years | 28 (2.4%) | 50 (4.1%) |
| 30 to 34 Years | 158 (13.7%) | 108 (8.8%) |
| 35 to 39 Years | 83 (7.2%) | 39 (3.2%) |
| 40 to 44 Years | 23 (2.0%) | 112 (9.2%) |
| 45 to 49 Years | 49 (4.2%) | 51 (4.2%) |
| 50 to 54 Years | 82 (7.1%) | 86 (7.0%) |
| 55 to 59 Years | 68 (5.9%) | 35 (2.9%) |
| 60 to 64 Years | 55 (4.8%) | 105 (8.6%) |
| 65 to 69 Years | 109 (9.4%) | 130 (10.6%) |
| 70 to 74 Years | 63 (5.4%) | 153 (12.5%) |
| 75 to 79 Years | 72 (6.2%) | 16 (1.3%) |
| 80 to 84 Years | 0 (0.0%) | 26 (2.1%) |
| 85 Years and over | 10 (0.9%) | 31 (2.5%) |
| Total | 1,156 (100.0%) | 1,221 (100.0%) |
Families and Households in Cetronia
Median Family Size in Cetronia
The median family size in Cetronia is 3.04 persons per family, with married-couple families (436 | 69.8%) accounting for the largest median family size of 3.31 persons per family. On the other hand, single male/father families (34 | 5.4%) represent the smallest median family size with 2.15 persons per family.
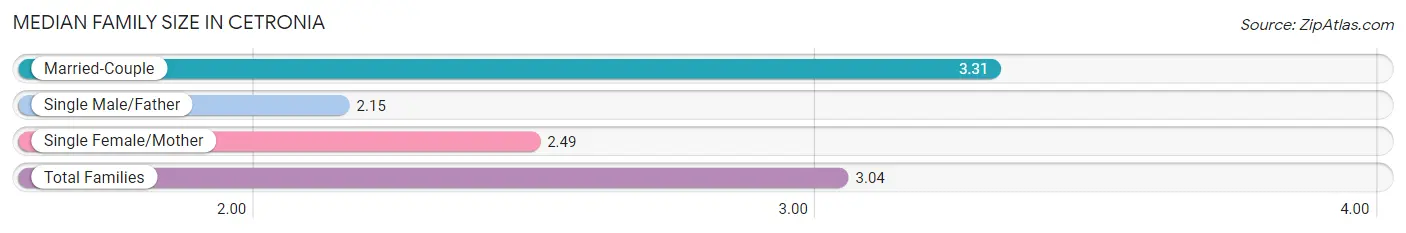
| Family Type | # Families | Family Size |
| Married-Couple | 436 (69.8%) | 3.31 |
| Single Male/Father | 34 (5.4%) | 2.15 |
| Single Female/Mother | 155 (24.8%) | 2.49 |
| Total Families | 625 (100.0%) | 3.04 |
Median Household Size in Cetronia
The median household size in Cetronia is 2.43 persons per household, with married-couple households (436 | 45.0%) accounting for the largest median household size of 3.31 persons per household. non-family households (345 | 35.6%) represent the smallest median household size with 1.25 persons per household.
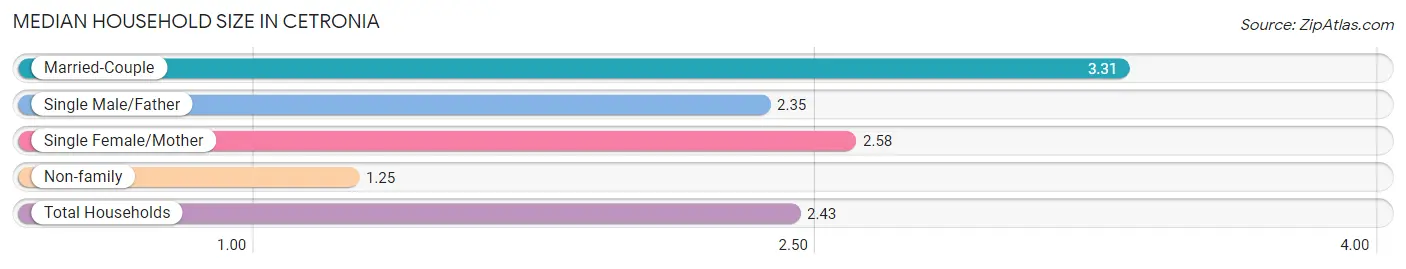
| Household Type | # Households | Household Size |
| Married-Couple | 436 (45.0%) | 3.31 |
| Single Male/Father | 34 (3.5%) | 2.35 |
| Single Female/Mother | 155 (16.0%) | 2.58 |
| Non-family | 345 (35.6%) | 1.25 |
| Total Households | 970 (100.0%) | 2.43 |
Household Size by Marriage Status in Cetronia
Out of a total of 970 households in Cetronia, 625 (64.4%) are family households, while 345 (35.6%) are nonfamily households. The most numerous type of family households are 2-person households, comprising 278, and the most common type of nonfamily households are 1-person households, comprising 255.
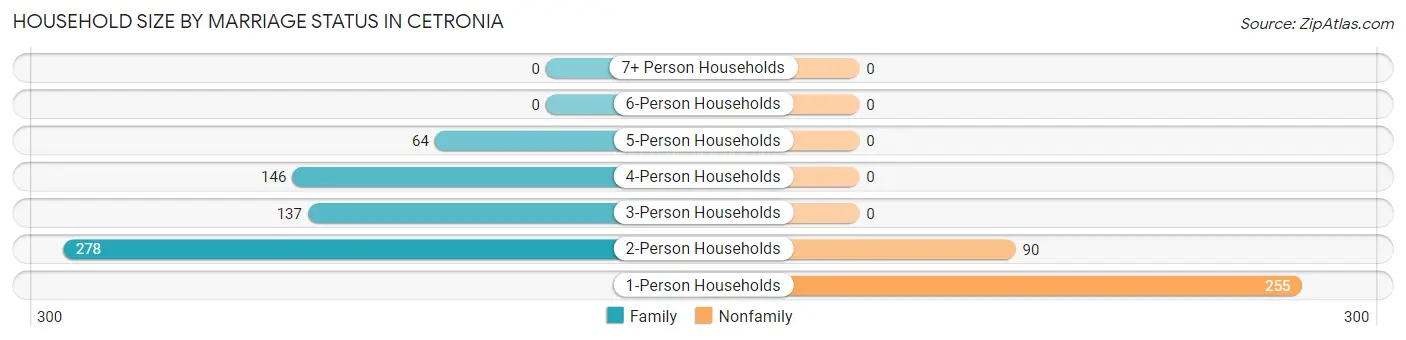
| Household Size | Family Households | Nonfamily Households |
| 1-Person Households | - | 255 (26.3%) |
| 2-Person Households | 278 (28.7%) | 90 (9.3%) |
| 3-Person Households | 137 (14.1%) | 0 (0.0%) |
| 4-Person Households | 146 (15.0%) | 0 (0.0%) |
| 5-Person Households | 64 (6.6%) | 0 (0.0%) |
| 6-Person Households | 0 (0.0%) | 0 (0.0%) |
| 7+ Person Households | 0 (0.0%) | 0 (0.0%) |
| Total | 625 (64.4%) | 345 (35.6%) |
Female Fertility in Cetronia
Fertility by Age in Cetronia
| Age Bracket | Women with Births | Births / 1,000 Women |
| 15 to 19 years | 0 (0.0%) | 0.0 |
| 20 to 34 years | 0 (0.0%) | 0.0 |
| 35 to 50 years | 0 (0.0%) | 0.0 |
| Total | 0 (0.0%) | 0.0 |
Fertility by Age by Marriage Status in Cetronia
| Age Bracket | Married | Unmarried |
| 15 to 19 years | 0 (0.0%) | 0 (0.0%) |
| 20 to 34 years | 0 (0.0%) | 0 (0.0%) |
| 35 to 50 years | 0 (0.0%) | 0 (0.0%) |
| Total | 0 (0.0%) | 0 (0.0%) |
Fertility by Education in Cetronia
| Educational Attainment | Women with Births | Births / 1,000 Women |
| Less than High School | 0 (0.0%) | 0.0 |
| High School Diploma | 0 (0.0%) | 0.0 |
| College or Associate's Degree | 0 (0.0%) | 0.0 |
| Bachelor's Degree | 0 (0.0%) | 0.0 |
| Graduate Degree | 0 (0.0%) | 0.0 |
| Total | 0 (0.0%) | 0.0 |
Fertility by Education by Marriage Status in Cetronia
| Educational Attainment | Married | Unmarried |
| Less than High School | 0 (0.0%) | 0 (0.0%) |
| High School Diploma | 0 (0.0%) | 0 (0.0%) |
| College or Associate's Degree | 0 (0.0%) | 0 (0.0%) |
| Bachelor's Degree | 0 (0.0%) | 0 (0.0%) |
| Graduate Degree | 0 (0.0%) | 0 (0.0%) |
| Total | 0 (0.0%) | 0 (0.0%) |
Employment Characteristics in Cetronia
Employment by Class of Employer in Cetronia
Among the 1,097 employed individuals in Cetronia, private company employees (791 | 72.1%), not-for-profit organizations (171 | 15.6%), and local government employees (90 | 8.2%) make up the most common classes of employment.
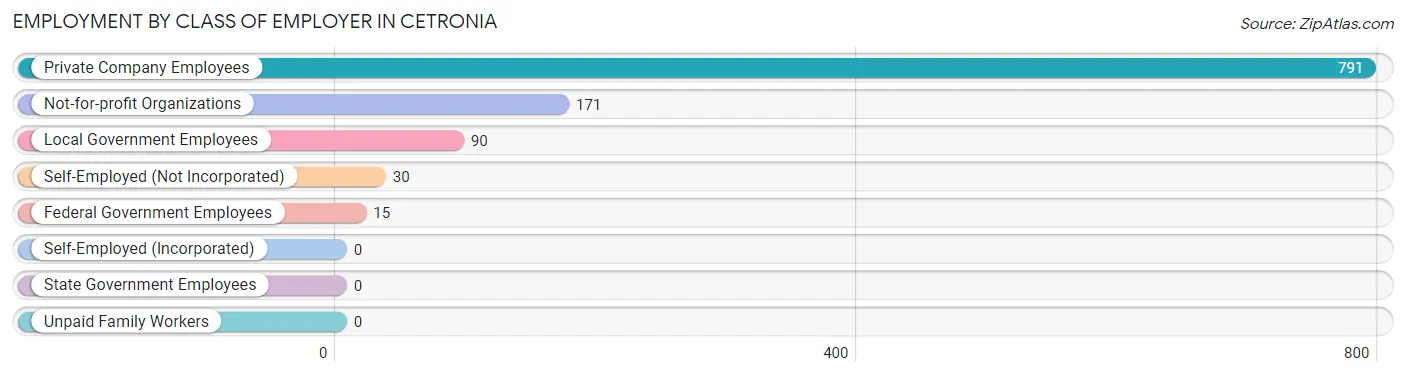
| Employer Class | # Employees | % Employees |
| Private Company Employees | 791 | 72.1% |
| Self-Employed (Incorporated) | 0 | 0.0% |
| Self-Employed (Not Incorporated) | 30 | 2.7% |
| Not-for-profit Organizations | 171 | 15.6% |
| Local Government Employees | 90 | 8.2% |
| State Government Employees | 0 | 0.0% |
| Federal Government Employees | 15 | 1.4% |
| Unpaid Family Workers | 0 | 0.0% |
| Total | 1,097 | 100.0% |
Employment Status by Age in Cetronia
According to the labor force statistics for Cetronia, out of the total population over 16 years of age (1,920), 58.6% or 1,125 individuals are in the labor force, with 2.6% or 29 of them unemployed. The age group with the highest labor force participation rate is 25 to 29 years, with 100.0% or 78 individuals in the labor force. Within the labor force, the 55 to 59 years age range has the highest percentage of unemployed individuals, with 18.4% or 19 of them being unemployed.
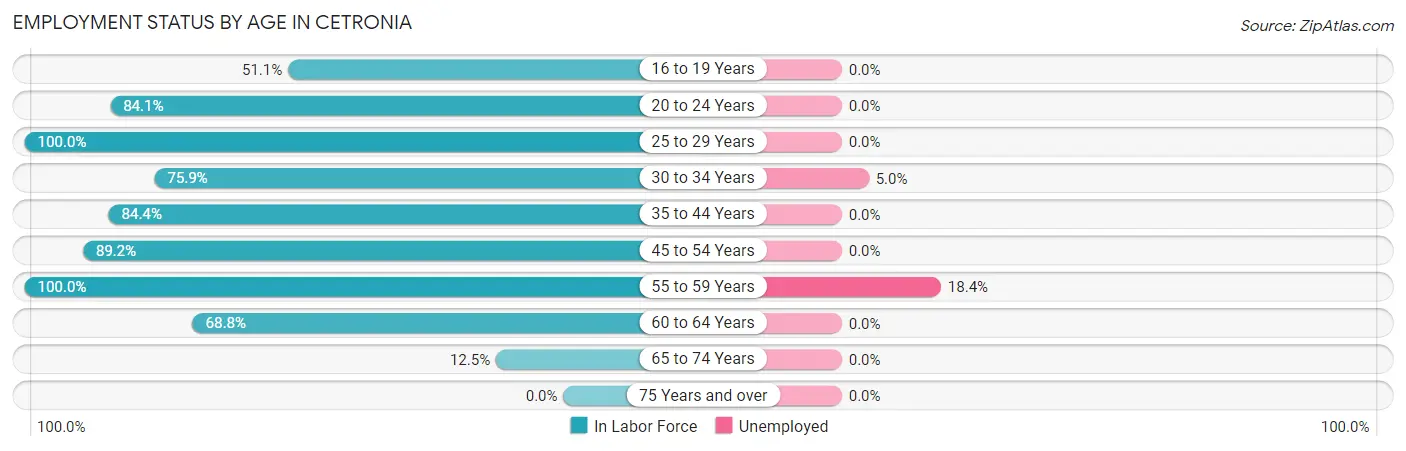
| Age Bracket | In Labor Force | Unemployed |
| 16 to 19 Years | 46 (51.1%) | 0 (0.0%) |
| 20 to 24 Years | 74 (84.1%) | 0 (0.0%) |
| 25 to 29 Years | 78 (100.0%) | 0 (0.0%) |
| 30 to 34 Years | 202 (75.9%) | 10 (5.0%) |
| 35 to 44 Years | 217 (84.4%) | 0 (0.0%) |
| 45 to 54 Years | 239 (89.2%) | 0 (0.0%) |
| 55 to 59 Years | 103 (100.0%) | 19 (18.4%) |
| 60 to 64 Years | 110 (68.8%) | 0 (0.0%) |
| 65 to 74 Years | 57 (12.5%) | 0 (0.0%) |
| 75 Years and over | 0 (0.0%) | 0 (0.0%) |
| Total | 1,125 (58.6%) | 29 (2.6%) |
Employment Status by Educational Attainment in Cetronia
According to labor force statistics for Cetronia, 83.8% of individuals (949) out of the total population between 25 and 64 years of age (1,132) are in the labor force, with 3.1% or 29 of them being unemployed. The group with the highest labor force participation rate are those with the educational attainment of less than high school, with 100.0% or 22 individuals in the labor force. Within the labor force, individuals with high school diploma education have the highest percentage of unemployment, with 9.0% or 19 of them being unemployed.
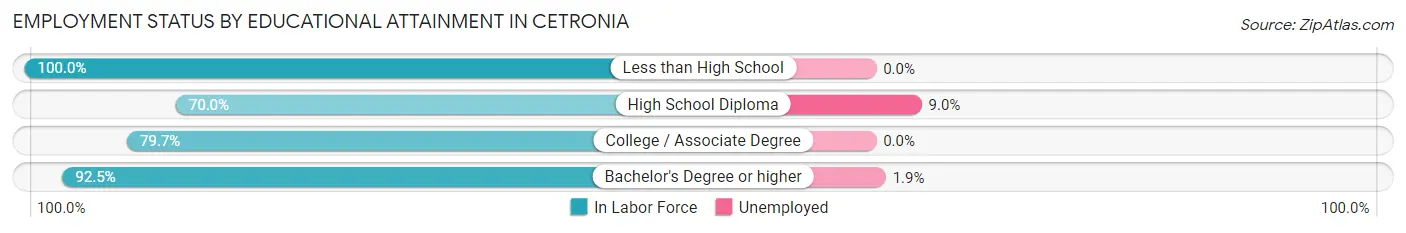
| Educational Attainment | In Labor Force | Unemployed |
| Less than High School | 22 (100.0%) | 0 (0.0%) |
| High School Diploma | 210 (70.0%) | 27 (9.0%) |
| College / Associate Degree | 200 (79.7%) | 0 (0.0%) |
| Bachelor's Degree or higher | 517 (92.5%) | 11 (1.9%) |
| Total | 949 (83.8%) | 35 (3.1%) |
Employment Occupations by Sex in Cetronia
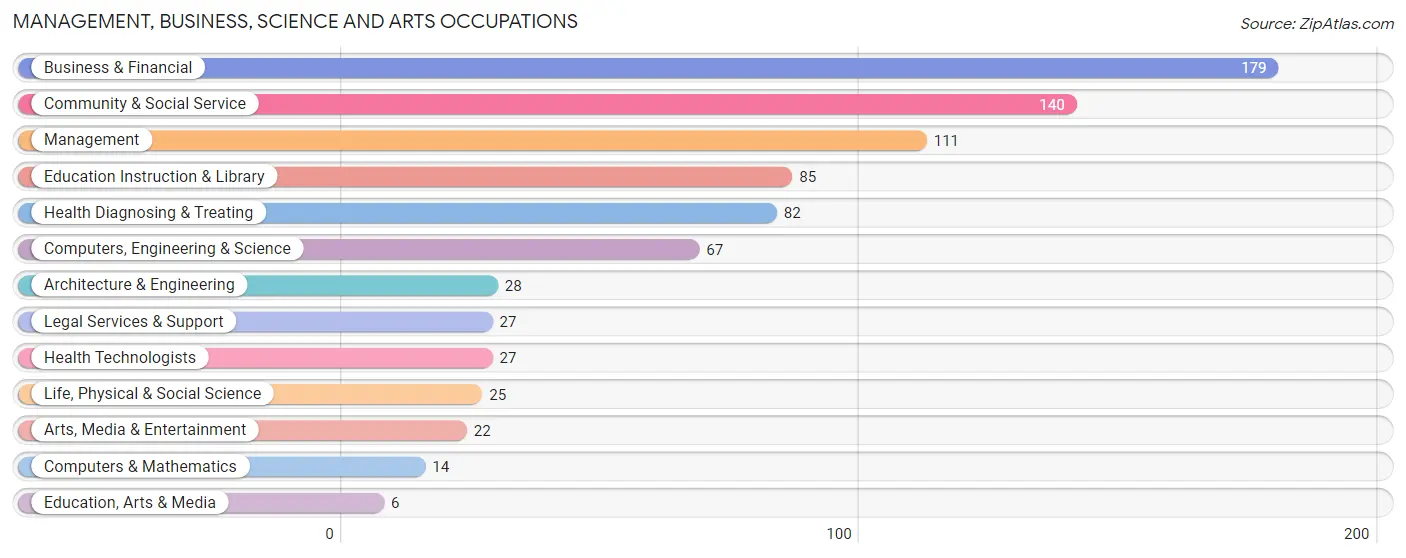
Management, Business, Science and Arts Occupations
The most common Management, Business, Science and Arts occupations in Cetronia are Business & Financial (179 | 16.3%), Community & Social Service (140 | 12.8%), Management (111 | 10.1%), Education Instruction & Library (85 | 7.7%), and Health Diagnosing & Treating (82 | 7.5%).
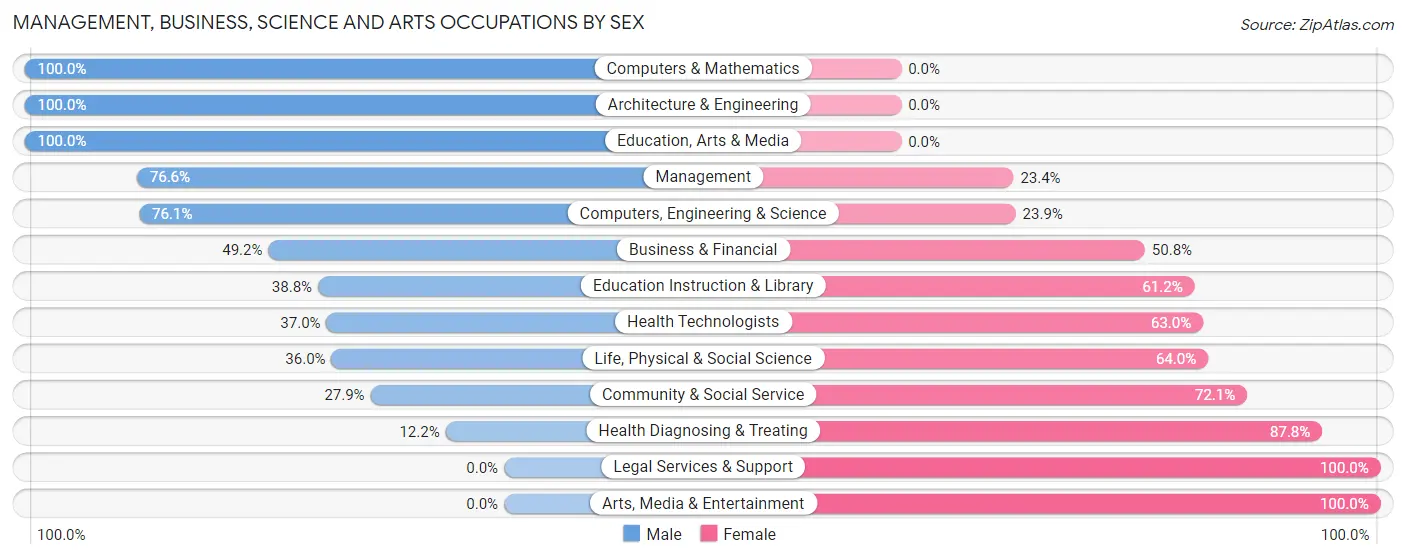
Management, Business, Science and Arts Occupations by Sex
Within the Management, Business, Science and Arts occupations in Cetronia, the most male-oriented occupations are Computers & Mathematics (100.0%), Architecture & Engineering (100.0%), and Education, Arts & Media (100.0%), while the most female-oriented occupations are Legal Services & Support (100.0%), Arts, Media & Entertainment (100.0%), and Health Diagnosing & Treating (87.8%).
| Occupation | Male | Female |
| Management | 85 (76.6%) | 26 (23.4%) |
| Business & Financial | 88 (49.2%) | 91 (50.8%) |
| Computers, Engineering & Science | 51 (76.1%) | 16 (23.9%) |
| Computers & Mathematics | 14 (100.0%) | 0 (0.0%) |
| Architecture & Engineering | 28 (100.0%) | 0 (0.0%) |
| Life, Physical & Social Science | 9 (36.0%) | 16 (64.0%) |
| Community & Social Service | 39 (27.9%) | 101 (72.1%) |
| Education, Arts & Media | 6 (100.0%) | 0 (0.0%) |
| Legal Services & Support | 0 (0.0%) | 27 (100.0%) |
| Education Instruction & Library | 33 (38.8%) | 52 (61.2%) |
| Arts, Media & Entertainment | 0 (0.0%) | 22 (100.0%) |
| Health Diagnosing & Treating | 10 (12.2%) | 72 (87.8%) |
| Health Technologists | 10 (37.0%) | 17 (63.0%) |
| Total (Category) | 273 (47.1%) | 306 (52.8%) |
| Total (Overall) | 530 (48.3%) | 567 (51.7%) |
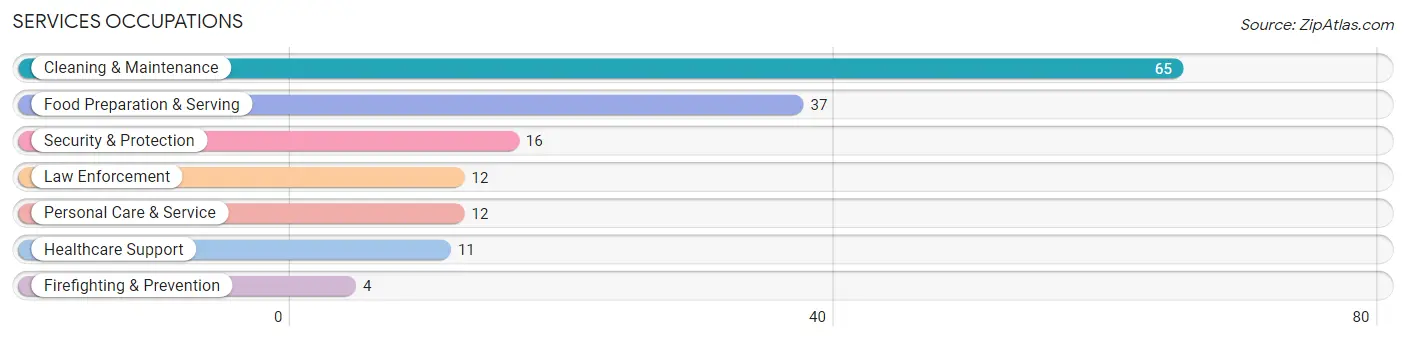
Services Occupations
The most common Services occupations in Cetronia are Cleaning & Maintenance (65 | 5.9%), Food Preparation & Serving (37 | 3.4%), Security & Protection (16 | 1.5%), Law Enforcement (12 | 1.1%), and Personal Care & Service (12 | 1.1%).
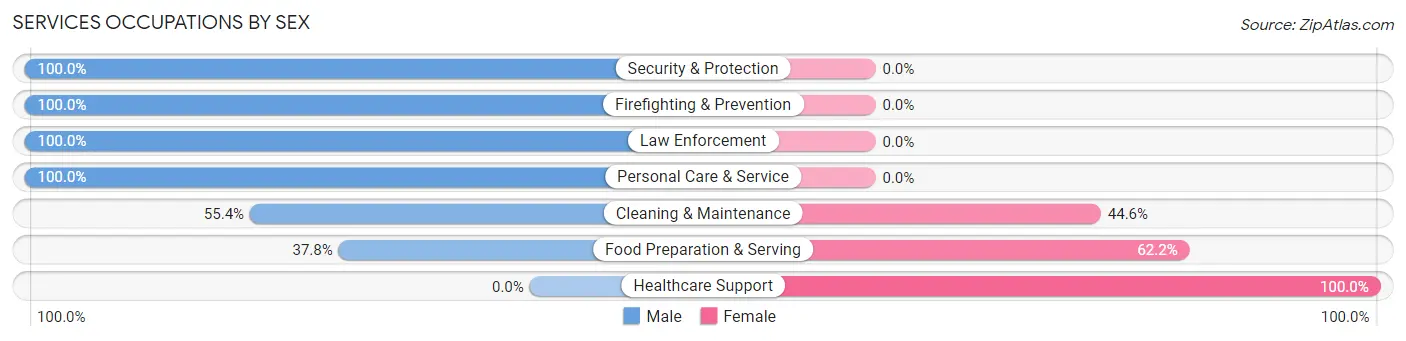
Services Occupations by Sex
Within the Services occupations in Cetronia, the most male-oriented occupations are Security & Protection (100.0%), Firefighting & Prevention (100.0%), and Law Enforcement (100.0%), while the most female-oriented occupations are Healthcare Support (100.0%), Food Preparation & Serving (62.2%), and Cleaning & Maintenance (44.6%).
| Occupation | Male | Female |
| Healthcare Support | 0 (0.0%) | 11 (100.0%) |
| Security & Protection | 16 (100.0%) | 0 (0.0%) |
| Firefighting & Prevention | 4 (100.0%) | 0 (0.0%) |
| Law Enforcement | 12 (100.0%) | 0 (0.0%) |
| Food Preparation & Serving | 14 (37.8%) | 23 (62.2%) |
| Cleaning & Maintenance | 36 (55.4%) | 29 (44.6%) |
| Personal Care & Service | 12 (100.0%) | 0 (0.0%) |
| Total (Category) | 78 (55.3%) | 63 (44.7%) |
| Total (Overall) | 530 (48.3%) | 567 (51.7%) |
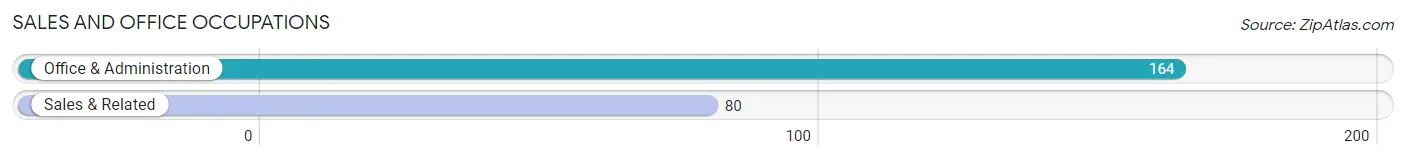
Sales and Office Occupations
The most common Sales and Office occupations in Cetronia are Office & Administration (164 | 14.9%), and Sales & Related (80 | 7.3%).
Sales and Office Occupations by Sex
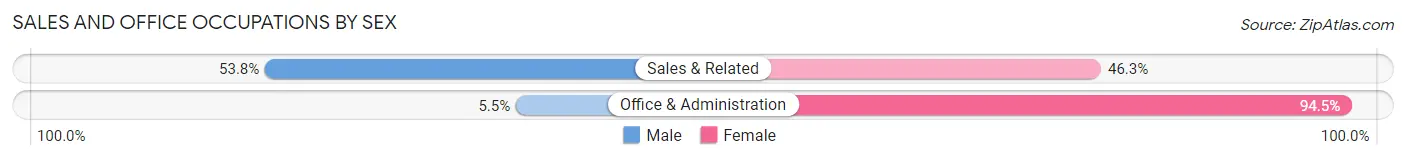
| Occupation | Male | Female |
| Sales & Related | 43 (53.7%) | 37 (46.3%) |
| Office & Administration | 9 (5.5%) | 155 (94.5%) |
| Total (Category) | 52 (21.3%) | 192 (78.7%) |
| Total (Overall) | 530 (48.3%) | 567 (51.7%) |
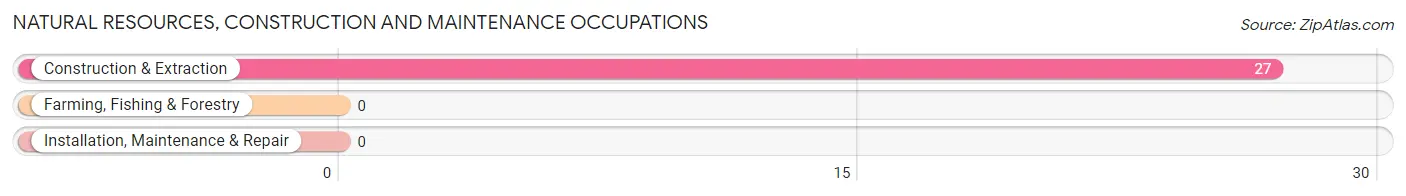
Natural Resources, Construction and Maintenance Occupations
The most common Natural Resources, Construction and Maintenance occupations in Cetronia are , and Construction & Extraction (27 | 2.5%).
Natural Resources, Construction and Maintenance Occupations by Sex
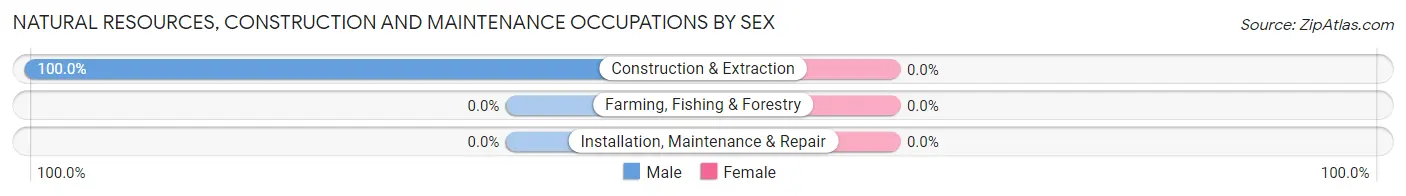
| Occupation | Male | Female |
| Farming, Fishing & Forestry | 0 (0.0%) | 0 (0.0%) |
| Construction & Extraction | 27 (100.0%) | 0 (0.0%) |
| Installation, Maintenance & Repair | 0 (0.0%) | 0 (0.0%) |
| Total (Category) | 27 (100.0%) | 0 (0.0%) |
| Total (Overall) | 530 (48.3%) | 567 (51.7%) |
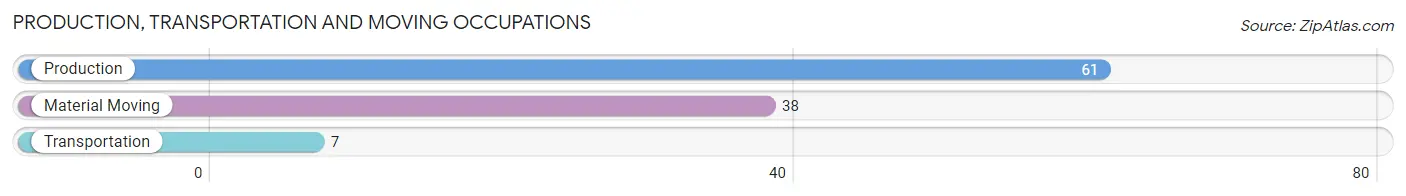
Production, Transportation and Moving Occupations
The most common Production, Transportation and Moving occupations in Cetronia are Production (61 | 5.6%), Material Moving (38 | 3.5%), and Transportation (7 | 0.6%).
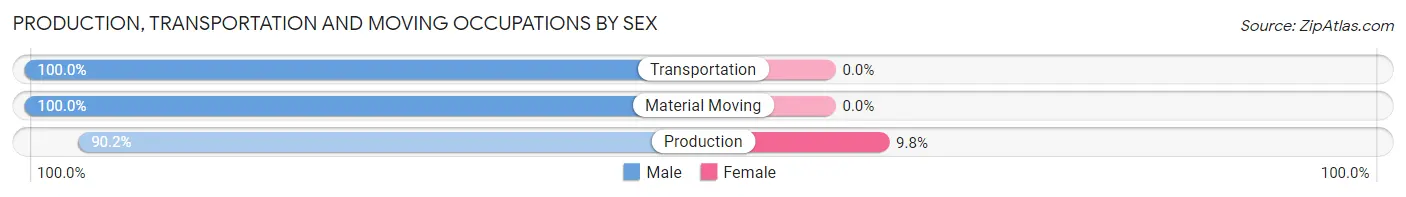
Production, Transportation and Moving Occupations by Sex
| Occupation | Male | Female |
| Production | 55 (90.2%) | 6 (9.8%) |
| Transportation | 7 (100.0%) | 0 (0.0%) |
| Material Moving | 38 (100.0%) | 0 (0.0%) |
| Total (Category) | 100 (94.3%) | 6 (5.7%) |
| Total (Overall) | 530 (48.3%) | 567 (51.7%) |
Employment Industries by Sex in Cetronia
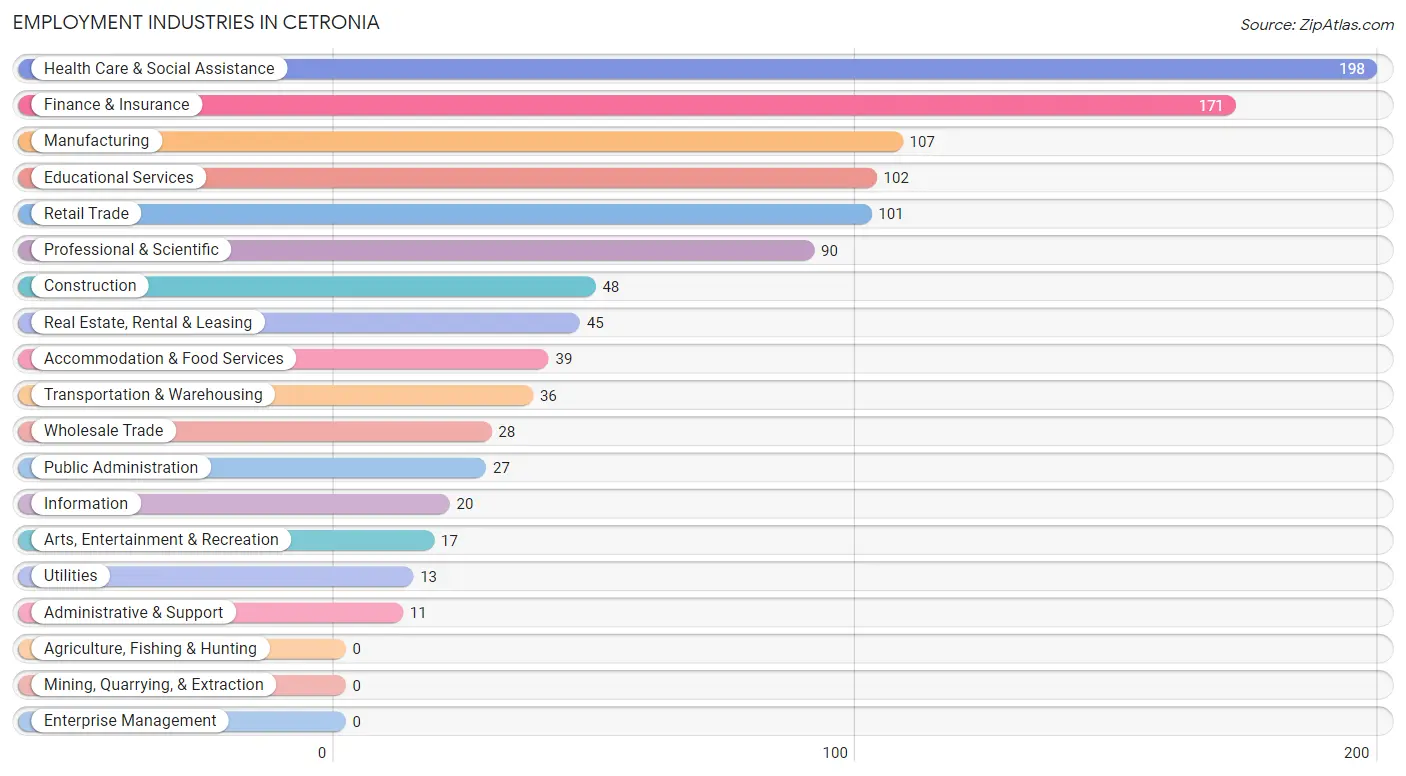
Employment Industries in Cetronia
The major employment industries in Cetronia include Health Care & Social Assistance (198 | 18.0%), Finance & Insurance (171 | 15.6%), Manufacturing (107 | 9.8%), Educational Services (102 | 9.3%), and Retail Trade (101 | 9.2%).
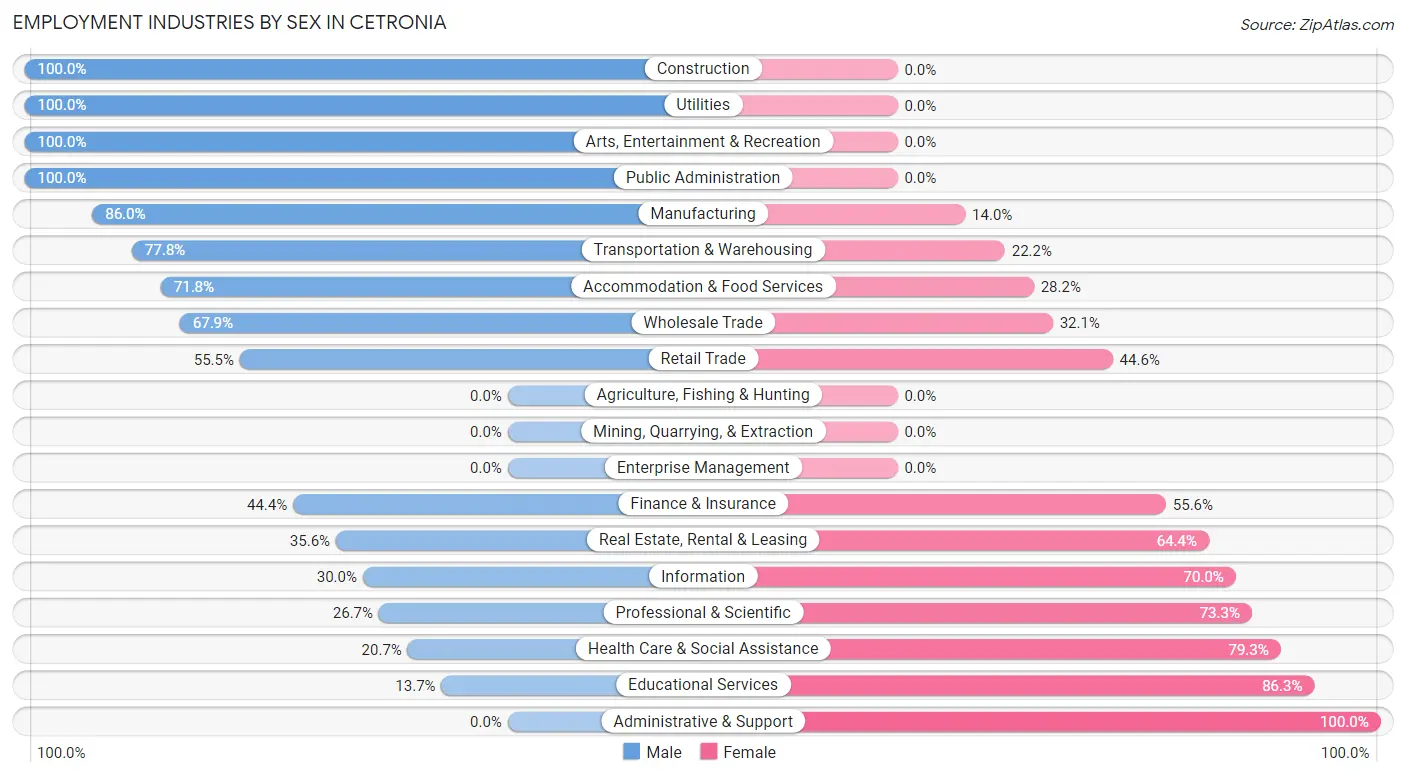
Employment Industries by Sex in Cetronia
The Cetronia industries that see more men than women are Construction (100.0%), Utilities (100.0%), and Arts, Entertainment & Recreation (100.0%), whereas the industries that tend to have a higher number of women are Administrative & Support (100.0%), Educational Services (86.3%), and Health Care & Social Assistance (79.3%).
| Industry | Male | Female |
| Agriculture, Fishing & Hunting | 0 (0.0%) | 0 (0.0%) |
| Mining, Quarrying, & Extraction | 0 (0.0%) | 0 (0.0%) |
| Construction | 48 (100.0%) | 0 (0.0%) |
| Manufacturing | 92 (86.0%) | 15 (14.0%) |
| Wholesale Trade | 19 (67.9%) | 9 (32.1%) |
| Retail Trade | 56 (55.4%) | 45 (44.6%) |
| Transportation & Warehousing | 28 (77.8%) | 8 (22.2%) |
| Utilities | 13 (100.0%) | 0 (0.0%) |
| Information | 6 (30.0%) | 14 (70.0%) |
| Finance & Insurance | 76 (44.4%) | 95 (55.6%) |
| Real Estate, Rental & Leasing | 16 (35.6%) | 29 (64.4%) |
| Professional & Scientific | 24 (26.7%) | 66 (73.3%) |
| Enterprise Management | 0 (0.0%) | 0 (0.0%) |
| Administrative & Support | 0 (0.0%) | 11 (100.0%) |
| Educational Services | 14 (13.7%) | 88 (86.3%) |
| Health Care & Social Assistance | 41 (20.7%) | 157 (79.3%) |
| Arts, Entertainment & Recreation | 17 (100.0%) | 0 (0.0%) |
| Accommodation & Food Services | 28 (71.8%) | 11 (28.2%) |
| Public Administration | 27 (100.0%) | 0 (0.0%) |
| Total | 530 (48.3%) | 567 (51.7%) |
Education in Cetronia
School Enrollment in Cetronia
The most common levels of schooling among the 557 students in Cetronia are nursery / preschool (152 | 27.3%), elementary school (102 | 18.3%), and high school (90 | 16.2%).
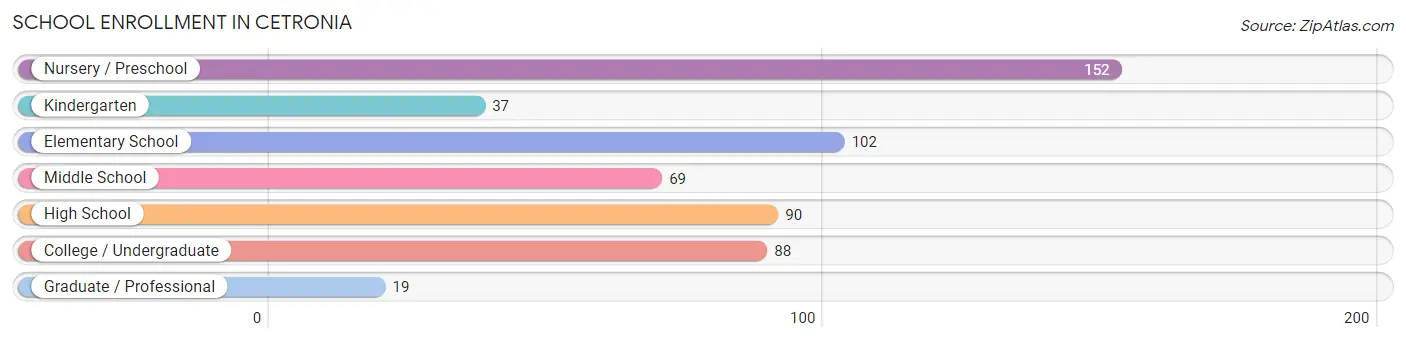
| School Level | # Students | % Students |
| Nursery / Preschool | 152 | 27.3% |
| Kindergarten | 37 | 6.6% |
| Elementary School | 102 | 18.3% |
| Middle School | 69 | 12.4% |
| High School | 90 | 16.2% |
| College / Undergraduate | 88 | 15.8% |
| Graduate / Professional | 19 | 3.4% |
| Total | 557 | 100.0% |
School Enrollment by Age by Funding Source in Cetronia
Out of a total of 557 students who are enrolled in schools in Cetronia, 207 (37.2%) attend a private institution, while the remaining 350 (62.8%) are enrolled in public schools. The age group of 3 to 4 year olds has the highest likelihood of being enrolled in private schools, with 81 (87.1% in the age bracket) enrolled. Conversely, the age group of 15 to 17 year olds has the lowest likelihood of being enrolled in a private school, with 63 (100.0% in the age bracket) attending a public institution.
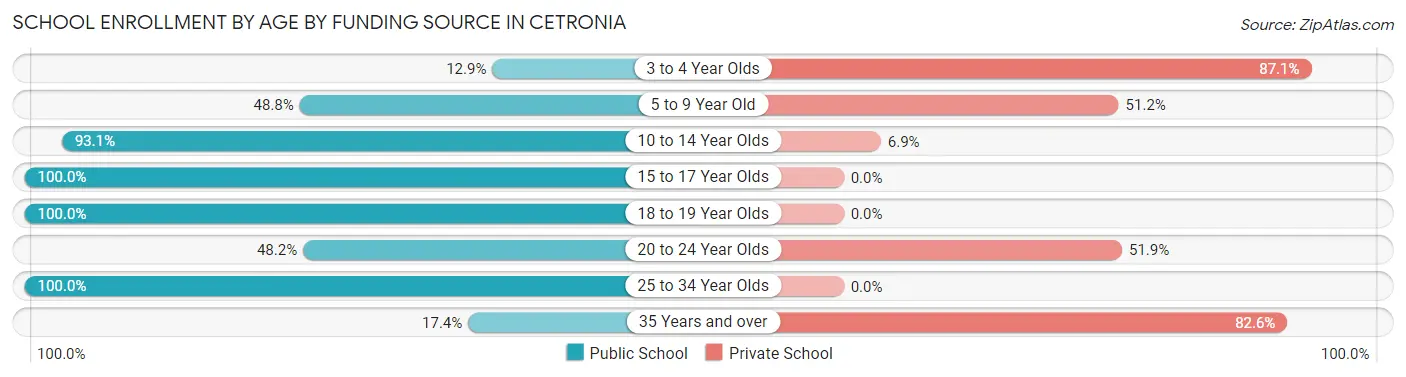
| Age Bracket | Public School | Private School |
| 3 to 4 Year Olds | 12 (12.9%) | 81 (87.1%) |
| 5 to 9 Year Old | 80 (48.8%) | 84 (51.2%) |
| 10 to 14 Year Olds | 121 (93.1%) | 9 (6.9%) |
| 15 to 17 Year Olds | 63 (100.0%) | 0 (0.0%) |
| 18 to 19 Year Olds | 42 (100.0%) | 0 (0.0%) |
| 20 to 24 Year Olds | 13 (48.1%) | 14 (51.8%) |
| 25 to 34 Year Olds | 15 (100.0%) | 0 (0.0%) |
| 35 Years and over | 4 (17.4%) | 19 (82.6%) |
| Total | 350 (62.8%) | 207 (37.2%) |
Educational Attainment by Field of Study in Cetronia
Business (238 | 29.9%), science & technology (113 | 14.2%), education (96 | 12.1%), social sciences (63 | 7.9%), and engineering (54 | 6.8%) are the most common fields of study among 796 individuals in Cetronia who have obtained a bachelor's degree or higher.
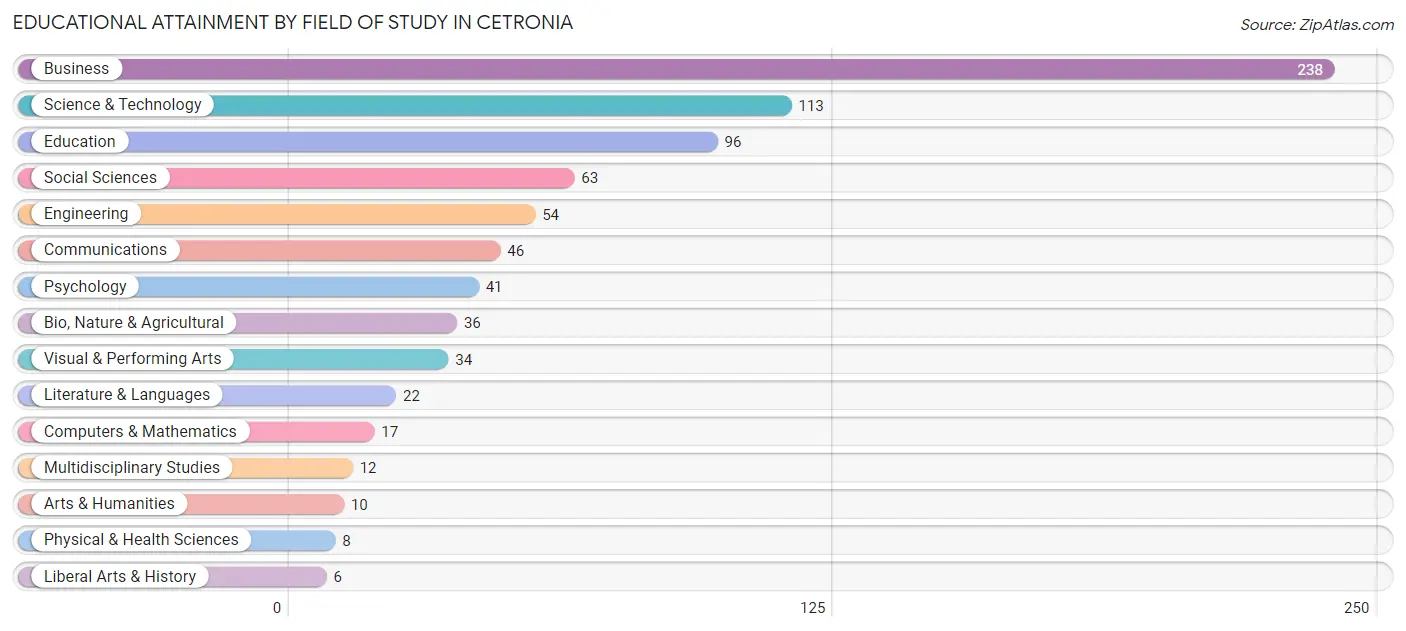
| Field of Study | # Graduates | % Graduates |
| Computers & Mathematics | 17 | 2.1% |
| Bio, Nature & Agricultural | 36 | 4.5% |
| Physical & Health Sciences | 8 | 1.0% |
| Psychology | 41 | 5.1% |
| Social Sciences | 63 | 7.9% |
| Engineering | 54 | 6.8% |
| Multidisciplinary Studies | 12 | 1.5% |
| Science & Technology | 113 | 14.2% |
| Business | 238 | 29.9% |
| Education | 96 | 12.1% |
| Literature & Languages | 22 | 2.8% |
| Liberal Arts & History | 6 | 0.7% |
| Visual & Performing Arts | 34 | 4.3% |
| Communications | 46 | 5.8% |
| Arts & Humanities | 10 | 1.3% |
| Total | 796 | 100.0% |
Transportation & Commute in Cetronia
Vehicle Availability by Sex in Cetronia
The most prevalent vehicle ownership categories in Cetronia are males with 2 vehicles (314, accounting for 59.9%) and females with 2 vehicles (261, making up 55.4%).
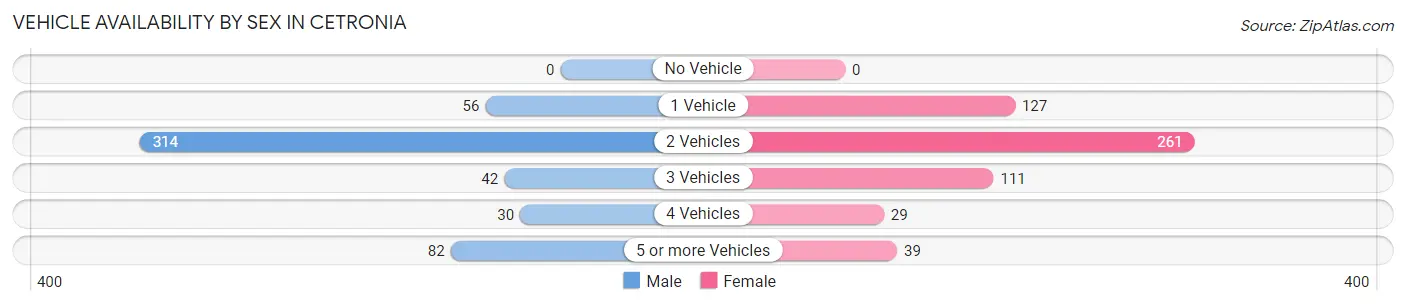
| Vehicles Available | Male | Female |
| No Vehicle | 0 (0.0%) | 0 (0.0%) |
| 1 Vehicle | 56 (10.7%) | 127 (22.4%) |
| 2 Vehicles | 314 (59.9%) | 261 (46.0%) |
| 3 Vehicles | 42 (8.0%) | 111 (19.6%) |
| 4 Vehicles | 30 (5.7%) | 29 (5.1%) |
| 5 or more Vehicles | 82 (15.7%) | 39 (6.9%) |
| Total | 524 (100.0%) | 567 (100.0%) |
Commute Time in Cetronia
The most frequently occuring commute durations in Cetronia are 20 to 24 minutes (209 commuters, 21.9%), 15 to 19 minutes (177 commuters, 18.5%), and 5 to 9 minutes (145 commuters, 15.2%).
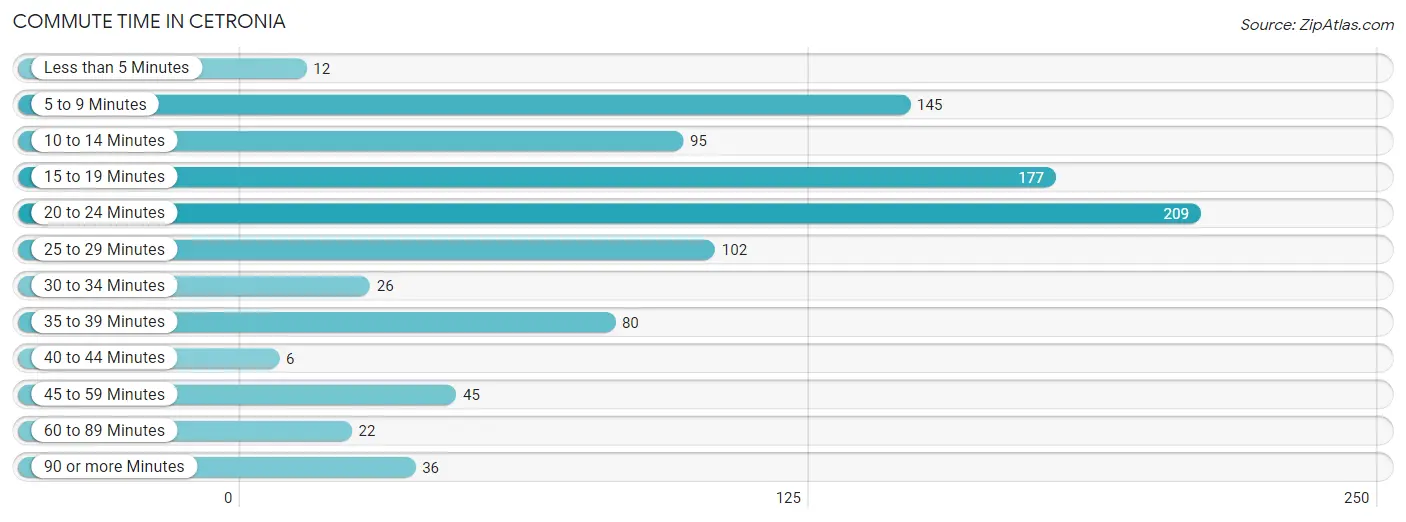
| Commute Time | # Commuters | % Commuters |
| Less than 5 Minutes | 12 | 1.3% |
| 5 to 9 Minutes | 145 | 15.2% |
| 10 to 14 Minutes | 95 | 10.0% |
| 15 to 19 Minutes | 177 | 18.5% |
| 20 to 24 Minutes | 209 | 21.9% |
| 25 to 29 Minutes | 102 | 10.7% |
| 30 to 34 Minutes | 26 | 2.7% |
| 35 to 39 Minutes | 80 | 8.4% |
| 40 to 44 Minutes | 6 | 0.6% |
| 45 to 59 Minutes | 45 | 4.7% |
| 60 to 89 Minutes | 22 | 2.3% |
| 90 or more Minutes | 36 | 3.8% |
Commute Time by Sex in Cetronia
The most common commute times in Cetronia are 20 to 24 minutes (107 commuters, 23.5%) for males and 15 to 19 minutes (129 commuters, 25.8%) for females.
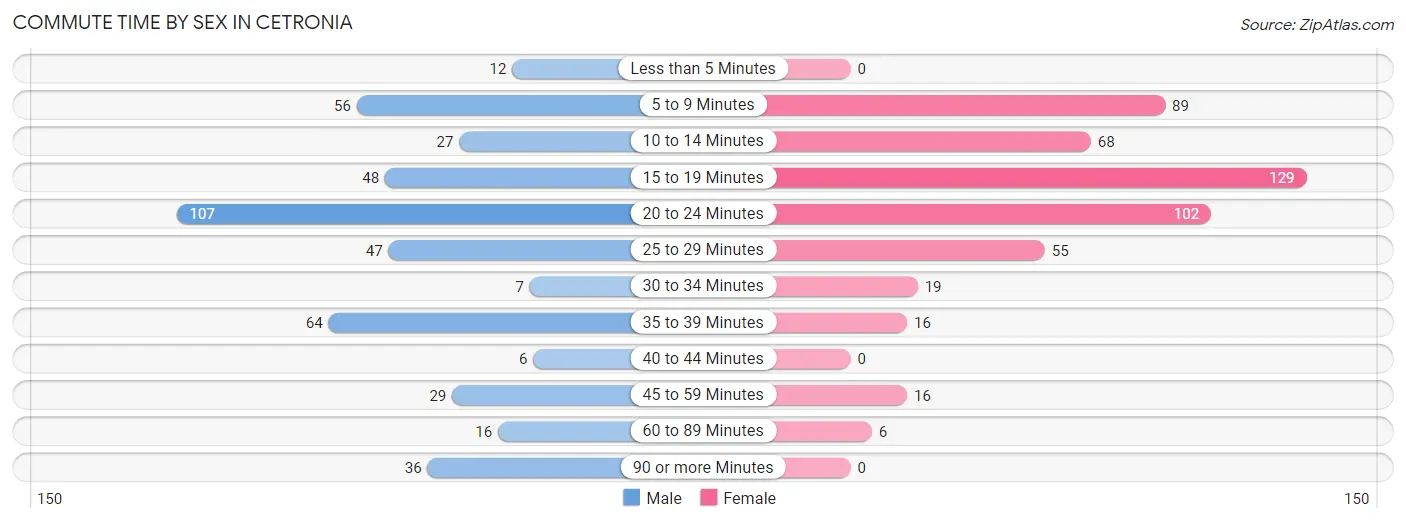
| Commute Time | Male | Female |
| Less than 5 Minutes | 12 (2.6%) | 0 (0.0%) |
| 5 to 9 Minutes | 56 (12.3%) | 89 (17.8%) |
| 10 to 14 Minutes | 27 (5.9%) | 68 (13.6%) |
| 15 to 19 Minutes | 48 (10.5%) | 129 (25.8%) |
| 20 to 24 Minutes | 107 (23.5%) | 102 (20.4%) |
| 25 to 29 Minutes | 47 (10.3%) | 55 (11.0%) |
| 30 to 34 Minutes | 7 (1.5%) | 19 (3.8%) |
| 35 to 39 Minutes | 64 (14.1%) | 16 (3.2%) |
| 40 to 44 Minutes | 6 (1.3%) | 0 (0.0%) |
| 45 to 59 Minutes | 29 (6.4%) | 16 (3.2%) |
| 60 to 89 Minutes | 16 (3.5%) | 6 (1.2%) |
| 90 or more Minutes | 36 (7.9%) | 0 (0.0%) |
Time of Departure to Work by Sex in Cetronia
The most frequent times of departure to work in Cetronia are 6:30 AM to 6:59 AM (101, 22.2%) for males and 8:30 AM to 8:59 AM (136, 27.2%) for females.
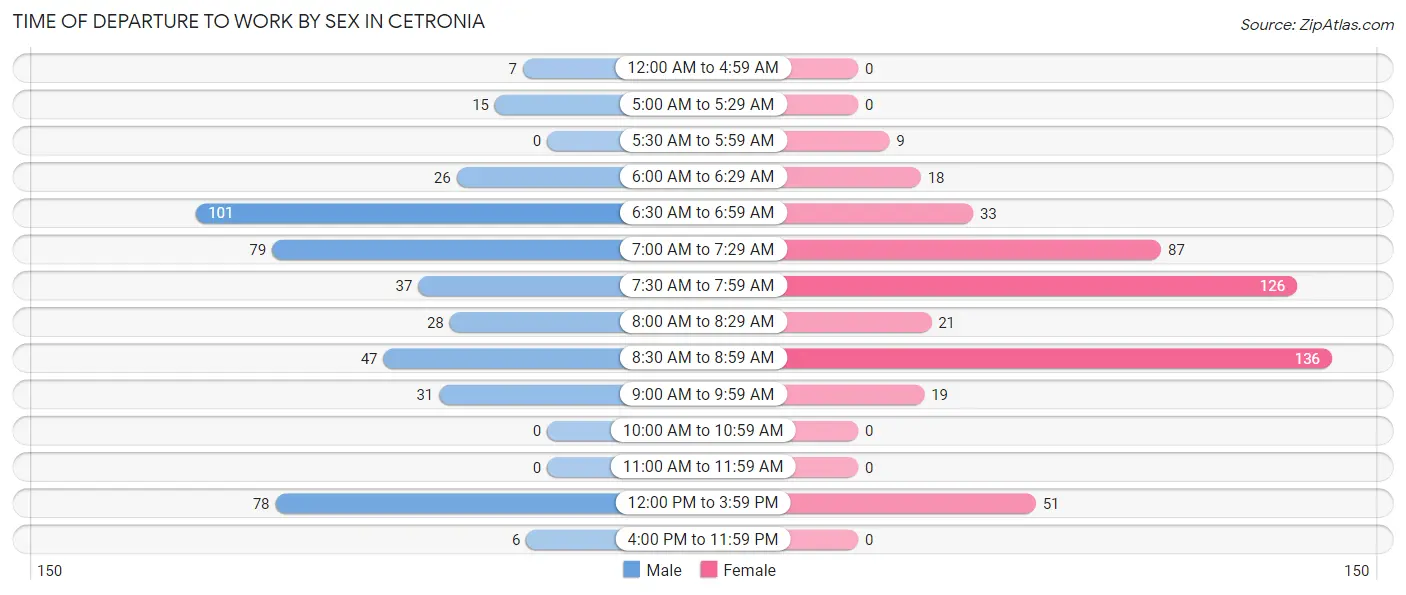
| Time of Departure | Male | Female |
| 12:00 AM to 4:59 AM | 7 (1.5%) | 0 (0.0%) |
| 5:00 AM to 5:29 AM | 15 (3.3%) | 0 (0.0%) |
| 5:30 AM to 5:59 AM | 0 (0.0%) | 9 (1.8%) |
| 6:00 AM to 6:29 AM | 26 (5.7%) | 18 (3.6%) |
| 6:30 AM to 6:59 AM | 101 (22.2%) | 33 (6.6%) |
| 7:00 AM to 7:29 AM | 79 (17.4%) | 87 (17.4%) |
| 7:30 AM to 7:59 AM | 37 (8.1%) | 126 (25.2%) |
| 8:00 AM to 8:29 AM | 28 (6.1%) | 21 (4.2%) |
| 8:30 AM to 8:59 AM | 47 (10.3%) | 136 (27.2%) |
| 9:00 AM to 9:59 AM | 31 (6.8%) | 19 (3.8%) |
| 10:00 AM to 10:59 AM | 0 (0.0%) | 0 (0.0%) |
| 11:00 AM to 11:59 AM | 0 (0.0%) | 0 (0.0%) |
| 12:00 PM to 3:59 PM | 78 (17.1%) | 51 (10.2%) |
| 4:00 PM to 11:59 PM | 6 (1.3%) | 0 (0.0%) |
| Total | 455 (100.0%) | 500 (100.0%) |
Housing Occupancy in Cetronia
Occupancy by Ownership in Cetronia
Of the total 970 dwellings in Cetronia, owner-occupied units account for 889 (91.6%), while renter-occupied units make up 81 (8.4%).
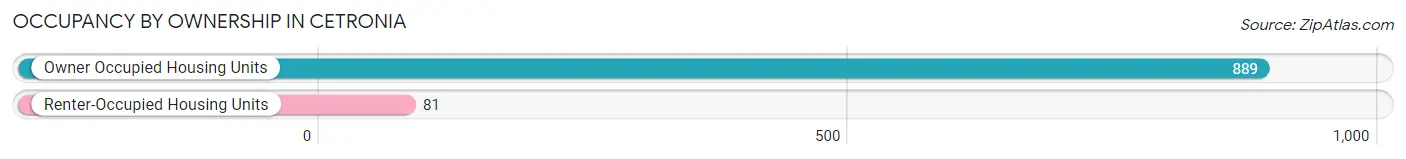
| Occupancy | # Housing Units | % Housing Units |
| Owner Occupied Housing Units | 889 | 91.6% |
| Renter-Occupied Housing Units | 81 | 8.4% |
| Total Occupied Housing Units | 970 | 100.0% |
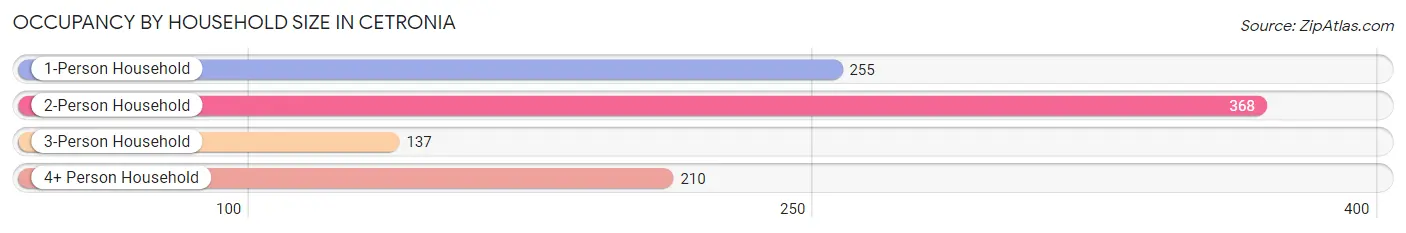
Occupancy by Household Size in Cetronia
| Household Size | # Housing Units | % Housing Units |
| 1-Person Household | 255 | 26.3% |
| 2-Person Household | 368 | 37.9% |
| 3-Person Household | 137 | 14.1% |
| 4+ Person Household | 210 | 21.6% |
| Total Housing Units | 970 | 100.0% |
Occupancy by Ownership by Household Size in Cetronia
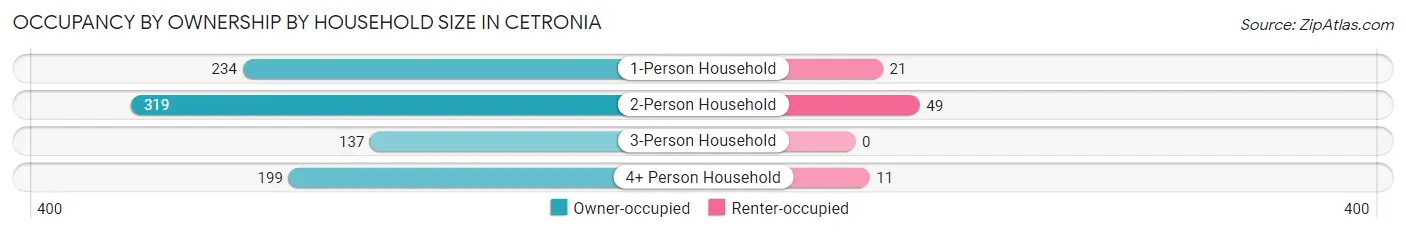
| Household Size | Owner-occupied | Renter-occupied |
| 1-Person Household | 234 (91.8%) | 21 (8.2%) |
| 2-Person Household | 319 (86.7%) | 49 (13.3%) |
| 3-Person Household | 137 (100.0%) | 0 (0.0%) |
| 4+ Person Household | 199 (94.8%) | 11 (5.2%) |
| Total Housing Units | 889 (91.6%) | 81 (8.4%) |
Occupancy by Educational Attainment in Cetronia
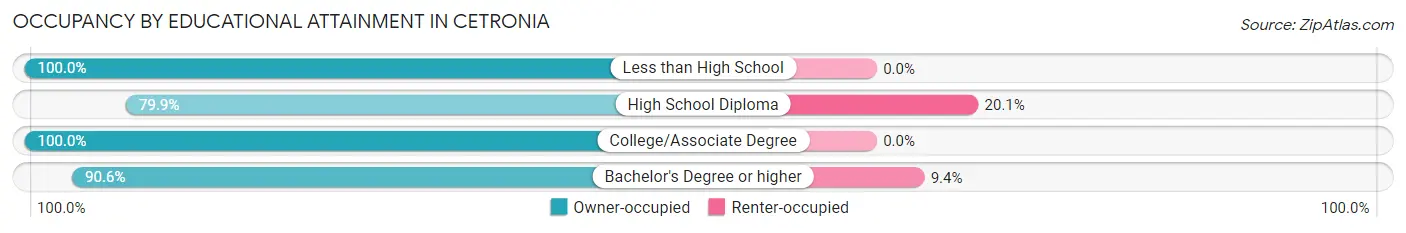
| Household Size | Owner-occupied | Renter-occupied |
| Less than High School | 25 (100.0%) | 0 (0.0%) |
| High School Diploma | 151 (79.9%) | 38 (20.1%) |
| College/Associate Degree | 300 (100.0%) | 0 (0.0%) |
| Bachelor's Degree or higher | 413 (90.6%) | 43 (9.4%) |
Occupancy by Age of Householder in Cetronia
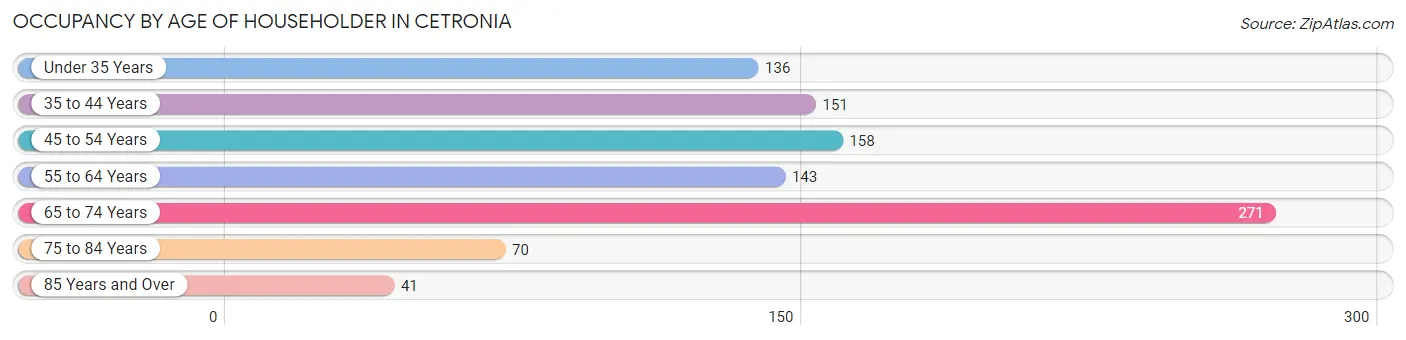
| Age Bracket | # Households | % Households |
| Under 35 Years | 136 | 14.0% |
| 35 to 44 Years | 151 | 15.6% |
| 45 to 54 Years | 158 | 16.3% |
| 55 to 64 Years | 143 | 14.7% |
| 65 to 74 Years | 271 | 27.9% |
| 75 to 84 Years | 70 | 7.2% |
| 85 Years and Over | 41 | 4.2% |
| Total | 970 | 100.0% |
Housing Finances in Cetronia
Median Income by Occupancy in Cetronia
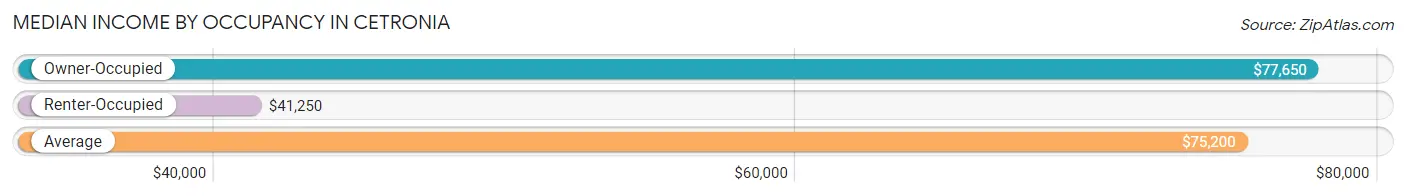
| Occupancy Type | # Households | Median Income |
| Owner-Occupied | 889 (91.6%) | $77,650 |
| Renter-Occupied | 81 (8.4%) | $41,250 |
| Average | 970 (100.0%) | $75,200 |
Occupancy by Householder Income Bracket in Cetronia
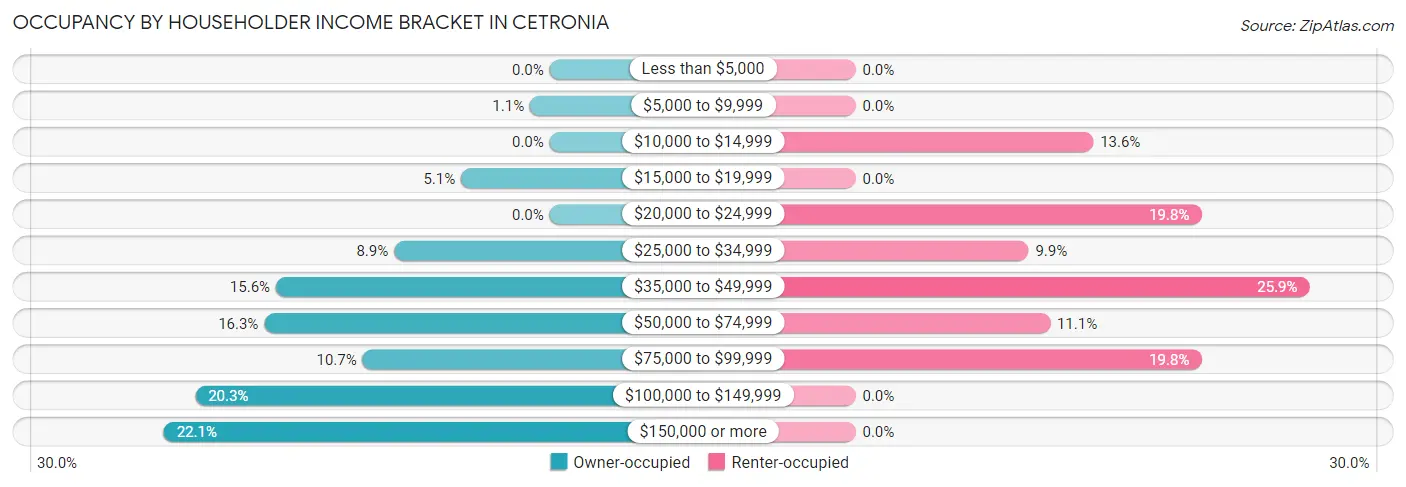
| Income Bracket | Owner-occupied | Renter-occupied |
| Less than $5,000 | 0 (0.0%) | 0 (0.0%) |
| $5,000 to $9,999 | 10 (1.1%) | 0 (0.0%) |
| $10,000 to $14,999 | 0 (0.0%) | 11 (13.6%) |
| $15,000 to $19,999 | 45 (5.1%) | 0 (0.0%) |
| $20,000 to $24,999 | 0 (0.0%) | 16 (19.8%) |
| $25,000 to $34,999 | 79 (8.9%) | 8 (9.9%) |
| $35,000 to $49,999 | 139 (15.6%) | 21 (25.9%) |
| $50,000 to $74,999 | 145 (16.3%) | 9 (11.1%) |
| $75,000 to $99,999 | 95 (10.7%) | 16 (19.8%) |
| $100,000 to $149,999 | 180 (20.3%) | 0 (0.0%) |
| $150,000 or more | 196 (22.1%) | 0 (0.0%) |
| Total | 889 (100.0%) | 81 (100.0%) |
Monthly Housing Cost Tiers in Cetronia
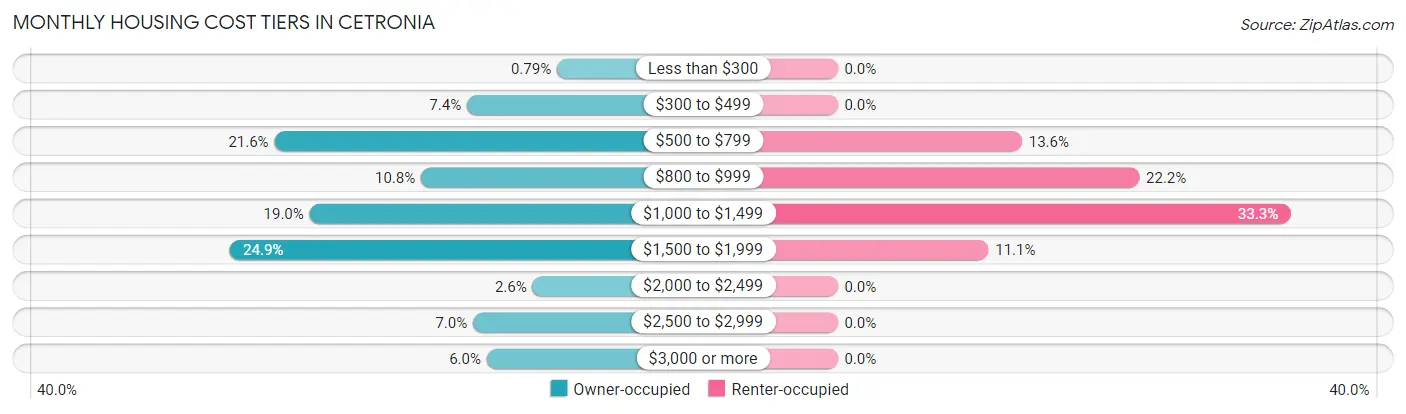
| Monthly Cost | Owner-occupied | Renter-occupied |
| Less than $300 | 7 (0.8%) | 0 (0.0%) |
| $300 to $499 | 66 (7.4%) | 0 (0.0%) |
| $500 to $799 | 192 (21.6%) | 11 (13.6%) |
| $800 to $999 | 96 (10.8%) | 18 (22.2%) |
| $1,000 to $1,499 | 169 (19.0%) | 27 (33.3%) |
| $1,500 to $1,999 | 221 (24.9%) | 9 (11.1%) |
| $2,000 to $2,499 | 23 (2.6%) | 0 (0.0%) |
| $2,500 to $2,999 | 62 (7.0%) | 0 (0.0%) |
| $3,000 or more | 53 (6.0%) | 0 (0.0%) |
| Total | 889 (100.0%) | 81 (100.0%) |
Physical Housing Characteristics in Cetronia
Housing Structures in Cetronia
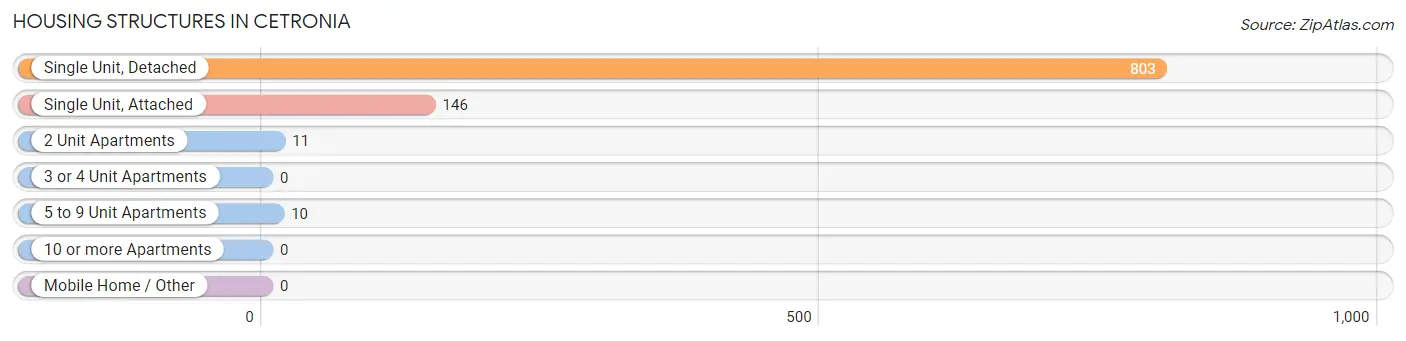
| Structure Type | # Housing Units | % Housing Units |
| Single Unit, Detached | 803 | 82.8% |
| Single Unit, Attached | 146 | 15.0% |
| 2 Unit Apartments | 11 | 1.1% |
| 3 or 4 Unit Apartments | 0 | 0.0% |
| 5 to 9 Unit Apartments | 10 | 1.0% |
| 10 or more Apartments | 0 | 0.0% |
| Mobile Home / Other | 0 | 0.0% |
| Total | 970 | 100.0% |
Housing Structures by Occupancy in Cetronia
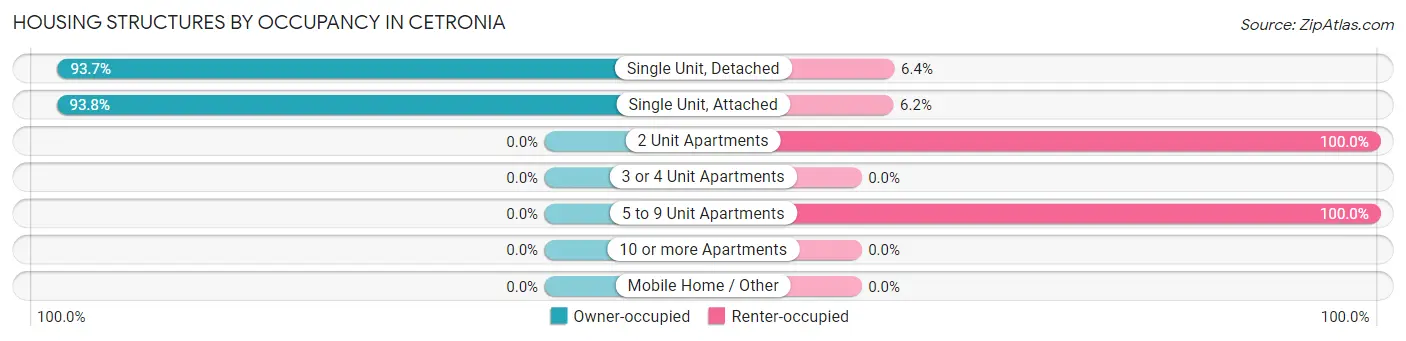
| Structure Type | Owner-occupied | Renter-occupied |
| Single Unit, Detached | 752 (93.6%) | 51 (6.4%) |
| Single Unit, Attached | 137 (93.8%) | 9 (6.2%) |
| 2 Unit Apartments | 0 (0.0%) | 11 (100.0%) |
| 3 or 4 Unit Apartments | 0 (0.0%) | 0 (0.0%) |
| 5 to 9 Unit Apartments | 0 (0.0%) | 10 (100.0%) |
| 10 or more Apartments | 0 (0.0%) | 0 (0.0%) |
| Mobile Home / Other | 0 (0.0%) | 0 (0.0%) |
| Total | 889 (91.6%) | 81 (8.4%) |
Housing Structures by Number of Rooms in Cetronia
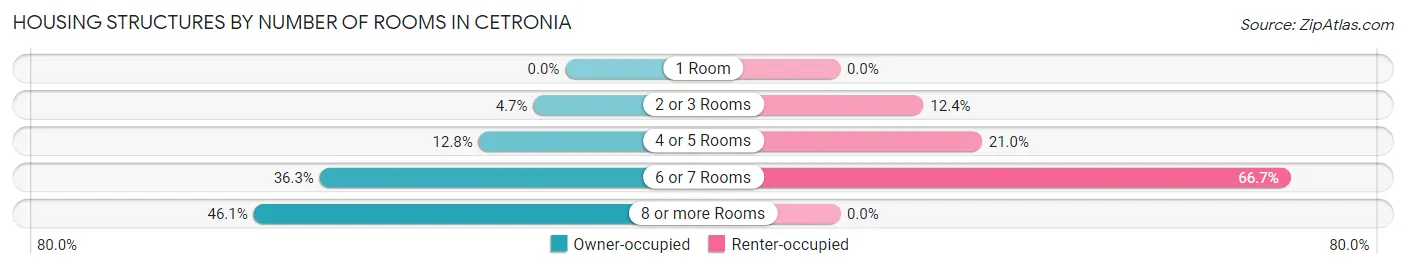
| Number of Rooms | Owner-occupied | Renter-occupied |
| 1 Room | 0 (0.0%) | 0 (0.0%) |
| 2 or 3 Rooms | 42 (4.7%) | 10 (12.3%) |
| 4 or 5 Rooms | 114 (12.8%) | 17 (21.0%) |
| 6 or 7 Rooms | 323 (36.3%) | 54 (66.7%) |
| 8 or more Rooms | 410 (46.1%) | 0 (0.0%) |
| Total | 889 (100.0%) | 81 (100.0%) |
Housing Structure by Heating Type in Cetronia
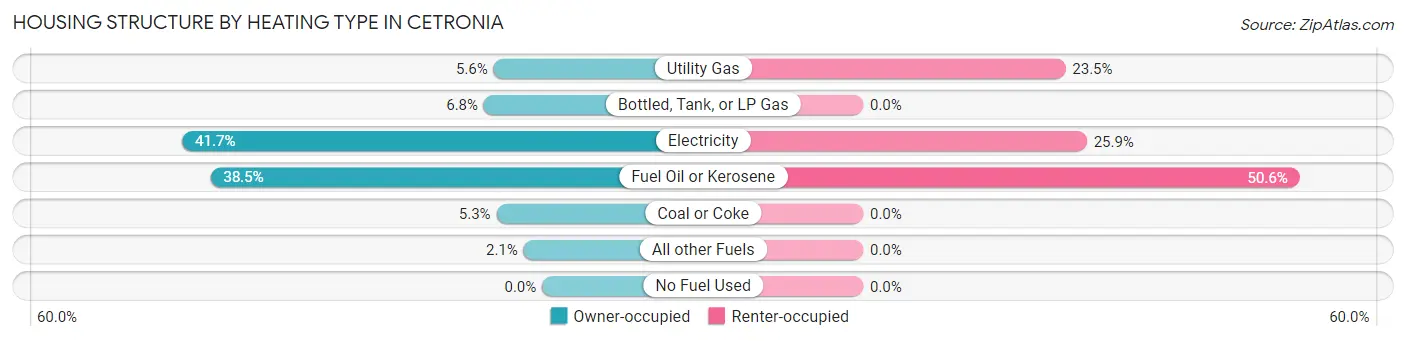
| Heating Type | Owner-occupied | Renter-occupied |
| Utility Gas | 50 (5.6%) | 19 (23.5%) |
| Bottled, Tank, or LP Gas | 60 (6.8%) | 0 (0.0%) |
| Electricity | 371 (41.7%) | 21 (25.9%) |
| Fuel Oil or Kerosene | 342 (38.5%) | 41 (50.6%) |
| Coal or Coke | 47 (5.3%) | 0 (0.0%) |
| All other Fuels | 19 (2.1%) | 0 (0.0%) |
| No Fuel Used | 0 (0.0%) | 0 (0.0%) |
| Total | 889 (100.0%) | 81 (100.0%) |
Household Vehicle Usage in Cetronia
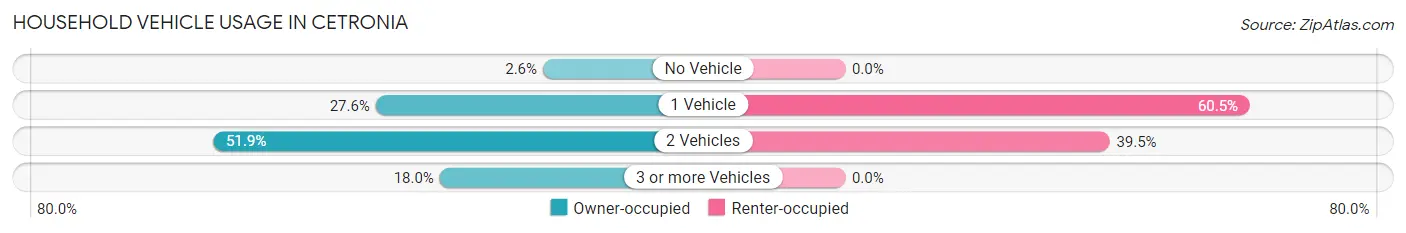
| Vehicles per Household | Owner-occupied | Renter-occupied |
| No Vehicle | 23 (2.6%) | 0 (0.0%) |
| 1 Vehicle | 245 (27.6%) | 49 (60.5%) |
| 2 Vehicles | 461 (51.9%) | 32 (39.5%) |
| 3 or more Vehicles | 160 (18.0%) | 0 (0.0%) |
| Total | 889 (100.0%) | 81 (100.0%) |
Real Estate & Mortgages in Cetronia
Real Estate and Mortgage Overview in Cetronia
| Characteristic | Without Mortgage | With Mortgage |
| Housing Units | 404 | 485 |
| Median Property Value | $266,300 | $291,800 |
| Median Household Income | $43,110 | $175 |
| Monthly Housing Costs | $746 | $53 |
| Real Estate Taxes | $4,857 | $0 |
Property Value by Mortgage Status in Cetronia
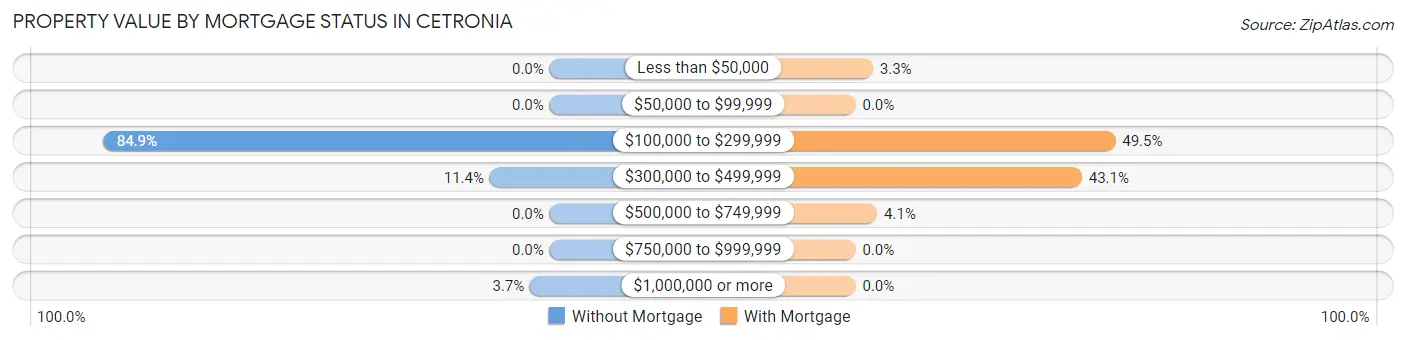
| Property Value | Without Mortgage | With Mortgage |
| Less than $50,000 | 0 (0.0%) | 16 (3.3%) |
| $50,000 to $99,999 | 0 (0.0%) | 0 (0.0%) |
| $100,000 to $299,999 | 343 (84.9%) | 240 (49.5%) |
| $300,000 to $499,999 | 46 (11.4%) | 209 (43.1%) |
| $500,000 to $749,999 | 0 (0.0%) | 20 (4.1%) |
| $750,000 to $999,999 | 0 (0.0%) | 0 (0.0%) |
| $1,000,000 or more | 15 (3.7%) | 0 (0.0%) |
| Total | 404 (100.0%) | 485 (100.0%) |
Household Income by Mortgage Status in Cetronia
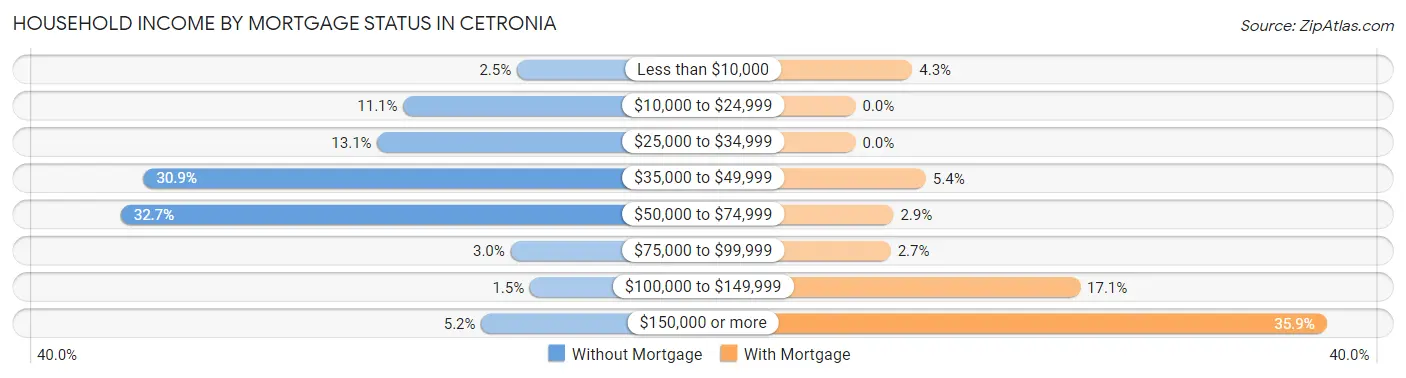
| Household Income | Without Mortgage | With Mortgage |
| Less than $10,000 | 10 (2.5%) | 21 (4.3%) |
| $10,000 to $24,999 | 45 (11.1%) | 0 (0.0%) |
| $25,000 to $34,999 | 53 (13.1%) | 0 (0.0%) |
| $35,000 to $49,999 | 125 (30.9%) | 26 (5.4%) |
| $50,000 to $74,999 | 132 (32.7%) | 14 (2.9%) |
| $75,000 to $99,999 | 12 (3.0%) | 13 (2.7%) |
| $100,000 to $149,999 | 6 (1.5%) | 83 (17.1%) |
| $150,000 or more | 21 (5.2%) | 174 (35.9%) |
| Total | 404 (100.0%) | 485 (100.0%) |
Property Value to Household Income Ratio in Cetronia
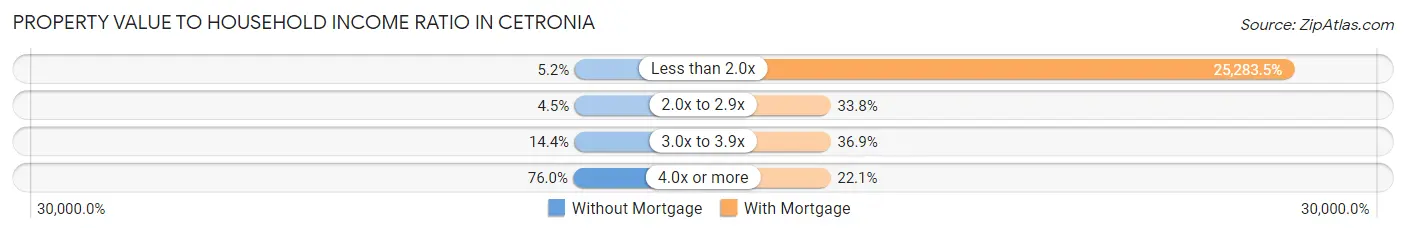
| Value-to-Income Ratio | Without Mortgage | With Mortgage |
| Less than 2.0x | 21 (5.2%) | 122,625 (25,283.5%) |
| 2.0x to 2.9x | 18 (4.5%) | 164 (33.8%) |
| 3.0x to 3.9x | 58 (14.4%) | 179 (36.9%) |
| 4.0x or more | 307 (76.0%) | 107 (22.1%) |
| Total | 404 (100.0%) | 485 (100.0%) |
Real Estate Taxes by Mortgage Status in Cetronia
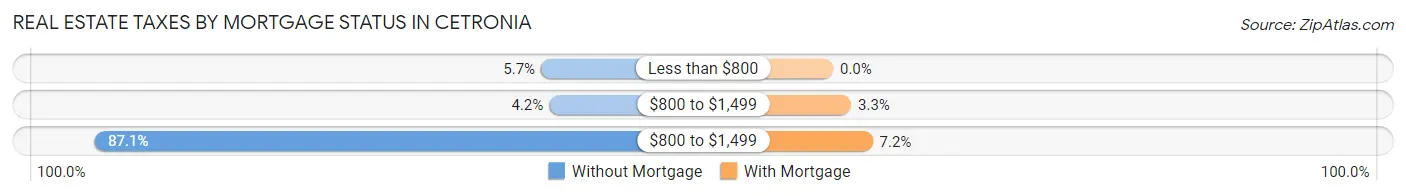
| Property Taxes | Without Mortgage | With Mortgage |
| Less than $800 | 23 (5.7%) | 0 (0.0%) |
| $800 to $1,499 | 17 (4.2%) | 16 (3.3%) |
| $800 to $1,499 | 352 (87.1%) | 35 (7.2%) |
| Total | 404 (100.0%) | 485 (100.0%) |
Health & Disability in Cetronia
Health Insurance Coverage by Age in Cetronia
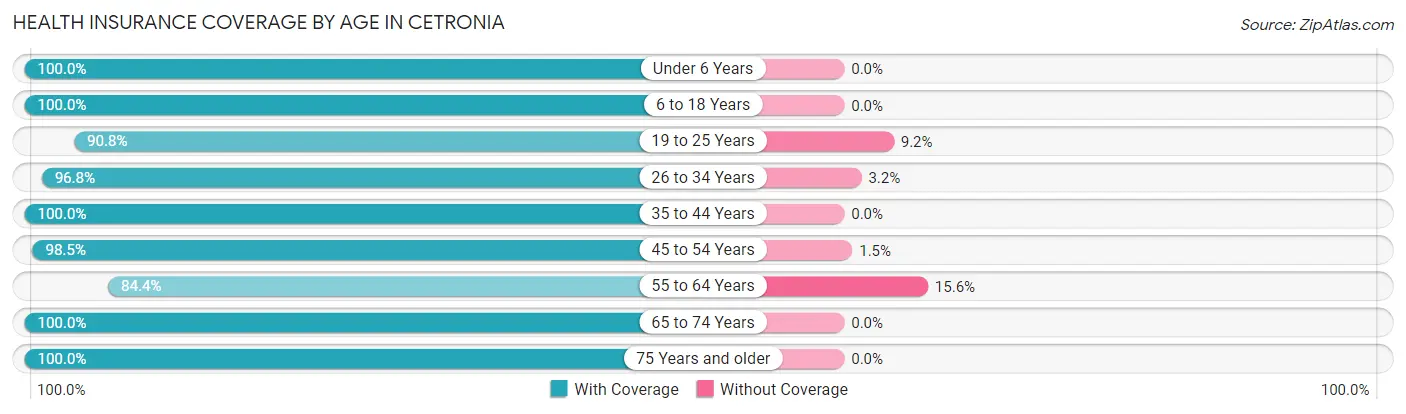
| Age Bracket | With Coverage | Without Coverage |
| Under 6 Years | 228 (100.0%) | 0 (0.0%) |
| 6 to 18 Years | 277 (100.0%) | 0 (0.0%) |
| 19 to 25 Years | 118 (90.8%) | 12 (9.2%) |
| 26 to 34 Years | 333 (96.8%) | 11 (3.2%) |
| 35 to 44 Years | 257 (100.0%) | 0 (0.0%) |
| 45 to 54 Years | 264 (98.5%) | 4 (1.5%) |
| 55 to 64 Years | 222 (84.4%) | 41 (15.6%) |
| 65 to 74 Years | 455 (100.0%) | 0 (0.0%) |
| 75 Years and older | 155 (100.0%) | 0 (0.0%) |
| Total | 2,309 (97.1%) | 68 (2.9%) |
Health Insurance Coverage by Citizenship Status in Cetronia
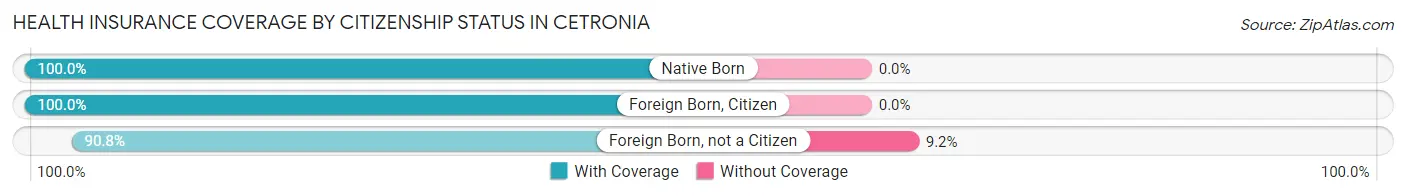
| Citizenship Status | With Coverage | Without Coverage |
| Native Born | 228 (100.0%) | 0 (0.0%) |
| Foreign Born, Citizen | 277 (100.0%) | 0 (0.0%) |
| Foreign Born, not a Citizen | 118 (90.8%) | 12 (9.2%) |
Health Insurance Coverage by Household Income in Cetronia
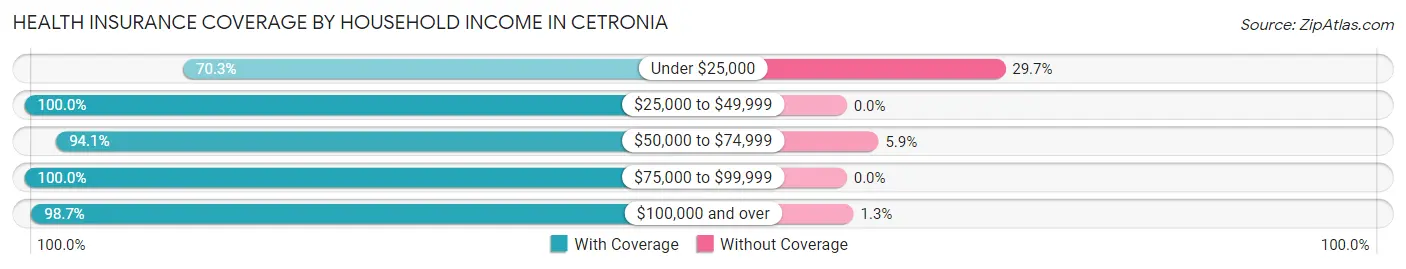
| Household Income | With Coverage | Without Coverage |
| Under $25,000 | 71 (70.3%) | 30 (29.7%) |
| $25,000 to $49,999 | 473 (100.0%) | 0 (0.0%) |
| $50,000 to $74,999 | 254 (94.1%) | 16 (5.9%) |
| $75,000 to $99,999 | 256 (100.0%) | 0 (0.0%) |
| $100,000 and over | 1,237 (98.7%) | 16 (1.3%) |
Public vs Private Health Insurance Coverage by Age in Cetronia
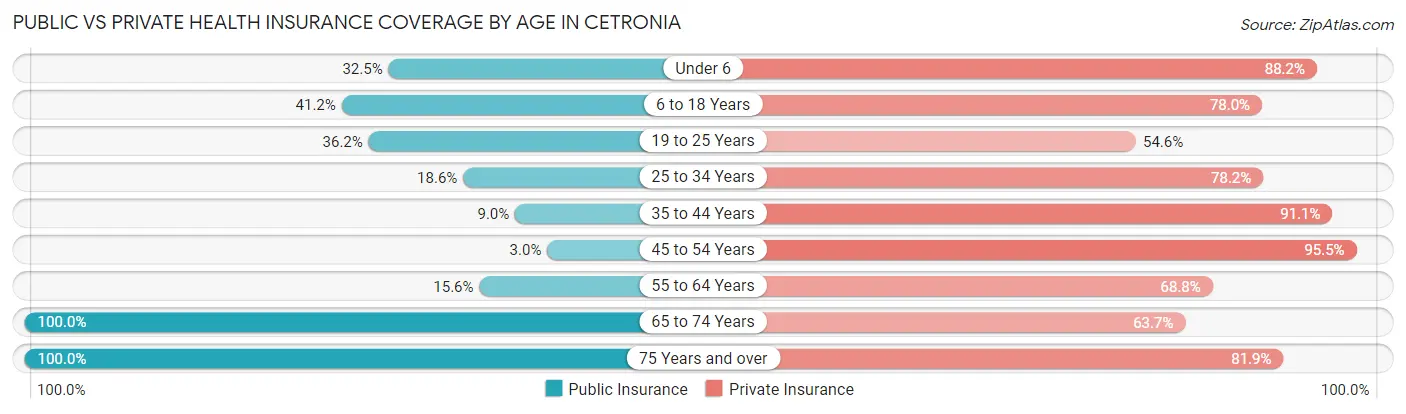
| Age Bracket | Public Insurance | Private Insurance |
| Under 6 | 74 (32.5%) | 201 (88.2%) |
| 6 to 18 Years | 114 (41.2%) | 216 (78.0%) |
| 19 to 25 Years | 47 (36.1%) | 71 (54.6%) |
| 25 to 34 Years | 64 (18.6%) | 269 (78.2%) |
| 35 to 44 Years | 23 (8.9%) | 234 (91.0%) |
| 45 to 54 Years | 8 (3.0%) | 256 (95.5%) |
| 55 to 64 Years | 41 (15.6%) | 181 (68.8%) |
| 65 to 74 Years | 455 (100.0%) | 290 (63.7%) |
| 75 Years and over | 155 (100.0%) | 127 (81.9%) |
| Total | 981 (41.3%) | 1,845 (77.6%) |
Disability Status by Sex by Age in Cetronia
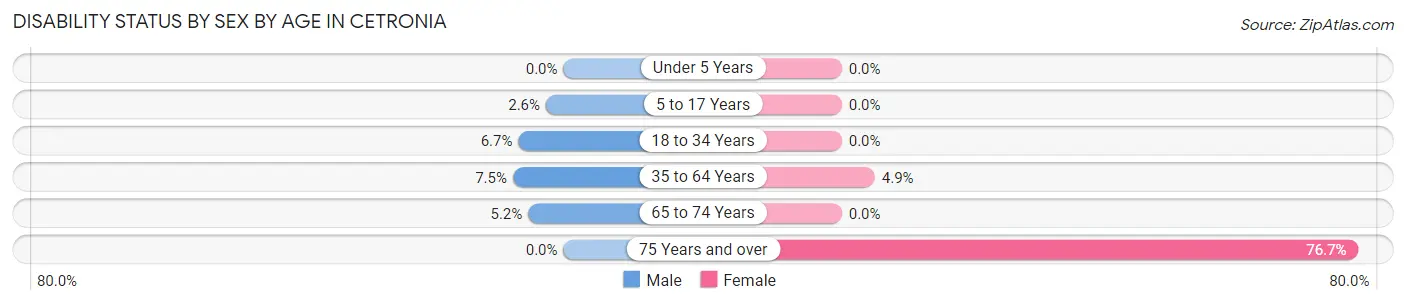
| Age Bracket | Male | Female |
| Under 5 Years | 0 (0.0%) | 0 (0.0%) |
| 5 to 17 Years | 5 (2.6%) | 0 (0.0%) |
| 18 to 34 Years | 17 (6.7%) | 0 (0.0%) |
| 35 to 64 Years | 27 (7.5%) | 21 (4.9%) |
| 65 to 74 Years | 9 (5.2%) | 0 (0.0%) |
| 75 Years and over | 0 (0.0%) | 56 (76.7%) |
Disability Class by Sex by Age in Cetronia
Disability Class: Hearing Difficulty
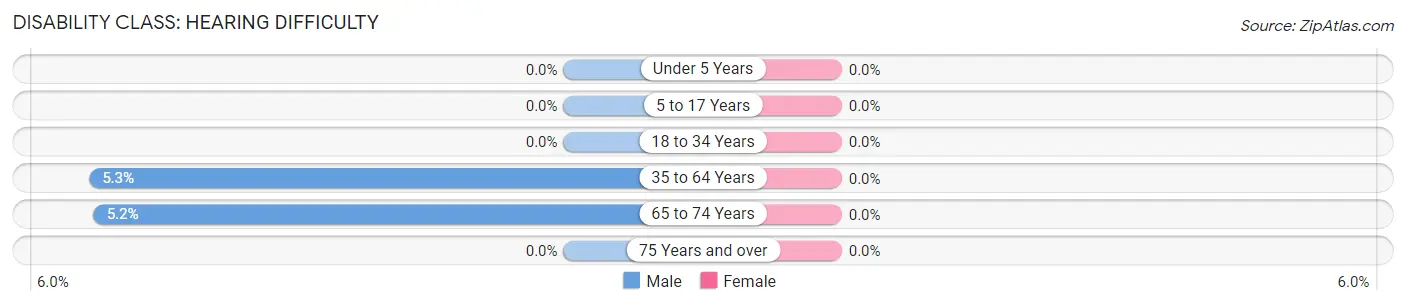
| Age Bracket | Male | Female |
| Under 5 Years | 0 (0.0%) | 0 (0.0%) |
| 5 to 17 Years | 0 (0.0%) | 0 (0.0%) |
| 18 to 34 Years | 0 (0.0%) | 0 (0.0%) |
| 35 to 64 Years | 19 (5.3%) | 0 (0.0%) |
| 65 to 74 Years | 9 (5.2%) | 0 (0.0%) |
| 75 Years and over | 0 (0.0%) | 0 (0.0%) |
Disability Class: Vision Difficulty
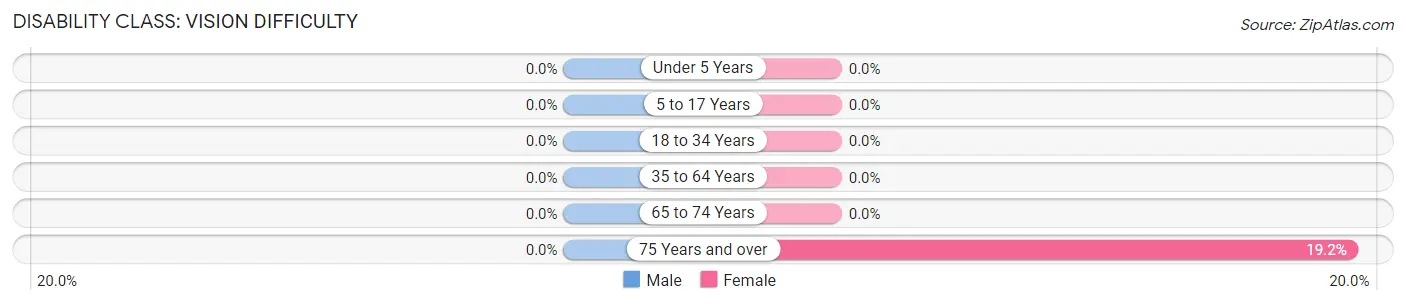
| Age Bracket | Male | Female |
| Under 5 Years | 0 (0.0%) | 0 (0.0%) |
| 5 to 17 Years | 0 (0.0%) | 0 (0.0%) |
| 18 to 34 Years | 0 (0.0%) | 0 (0.0%) |
| 35 to 64 Years | 0 (0.0%) | 0 (0.0%) |
| 65 to 74 Years | 0 (0.0%) | 0 (0.0%) |
| 75 Years and over | 0 (0.0%) | 14 (19.2%) |
Disability Class: Cognitive Difficulty
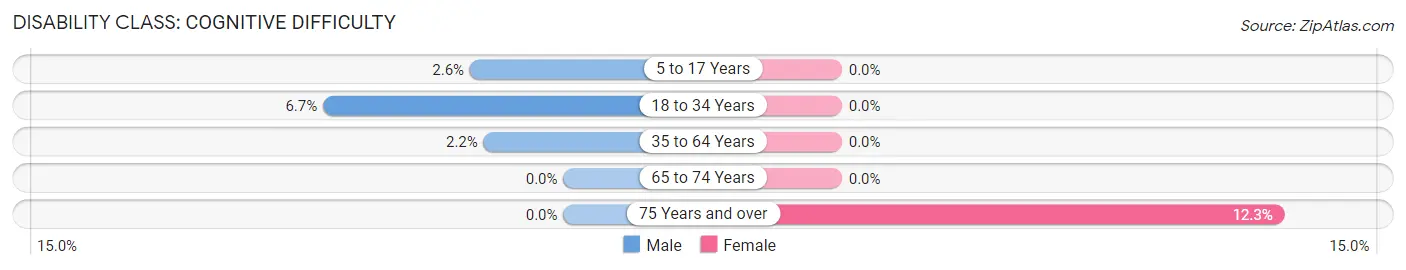
| Age Bracket | Male | Female |
| 5 to 17 Years | 5 (2.6%) | 0 (0.0%) |
| 18 to 34 Years | 17 (6.7%) | 0 (0.0%) |
| 35 to 64 Years | 8 (2.2%) | 0 (0.0%) |
| 65 to 74 Years | 0 (0.0%) | 0 (0.0%) |
| 75 Years and over | 0 (0.0%) | 9 (12.3%) |
Disability Class: Ambulatory Difficulty
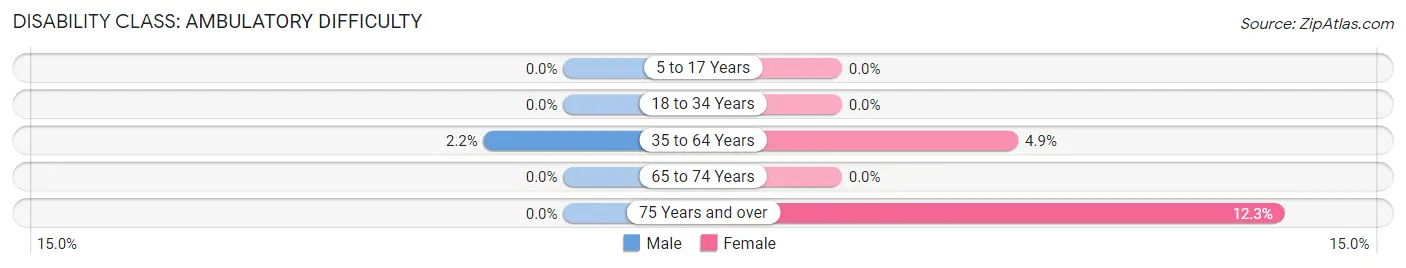
| Age Bracket | Male | Female |
| 5 to 17 Years | 0 (0.0%) | 0 (0.0%) |
| 18 to 34 Years | 0 (0.0%) | 0 (0.0%) |
| 35 to 64 Years | 8 (2.2%) | 21 (4.9%) |
| 65 to 74 Years | 0 (0.0%) | 0 (0.0%) |
| 75 Years and over | 0 (0.0%) | 9 (12.3%) |
Disability Class: Self-Care Difficulty
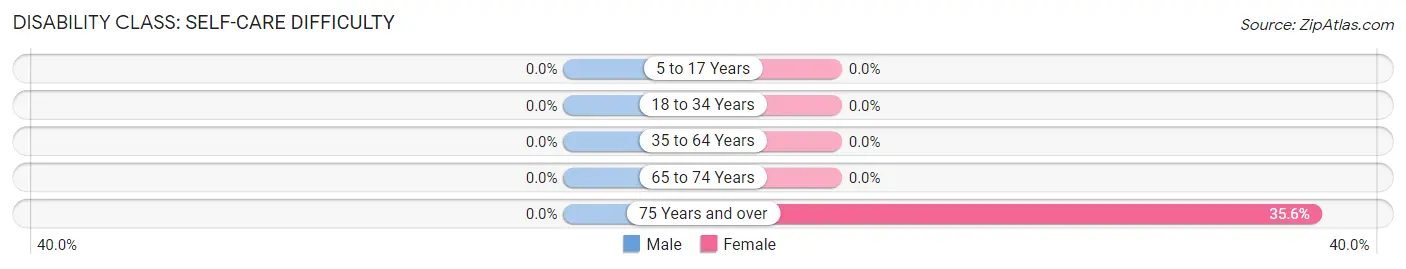
| Age Bracket | Male | Female |
| 5 to 17 Years | 0 (0.0%) | 0 (0.0%) |
| 18 to 34 Years | 0 (0.0%) | 0 (0.0%) |
| 35 to 64 Years | 0 (0.0%) | 0 (0.0%) |
| 65 to 74 Years | 0 (0.0%) | 0 (0.0%) |
| 75 Years and over | 0 (0.0%) | 26 (35.6%) |
Technology Access in Cetronia
Computing Device Access in Cetronia
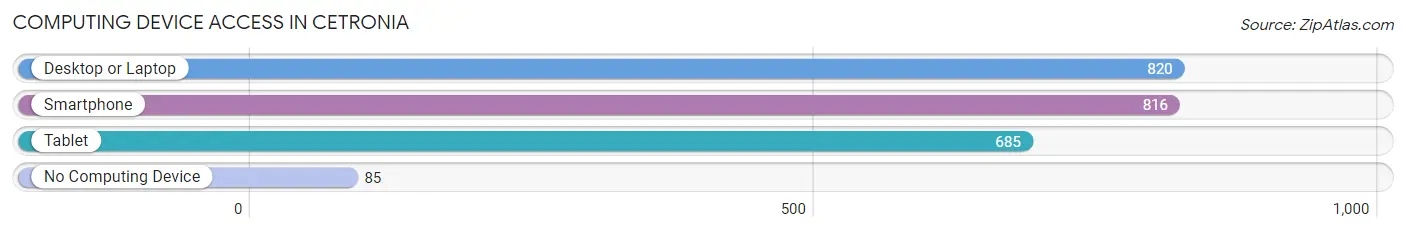
| Device Type | # Households | % Households |
| Desktop or Laptop | 820 | 84.5% |
| Smartphone | 816 | 84.1% |
| Tablet | 685 | 70.6% |
| No Computing Device | 85 | 8.8% |
| Total | 970 | 100.0% |
Internet Access in Cetronia
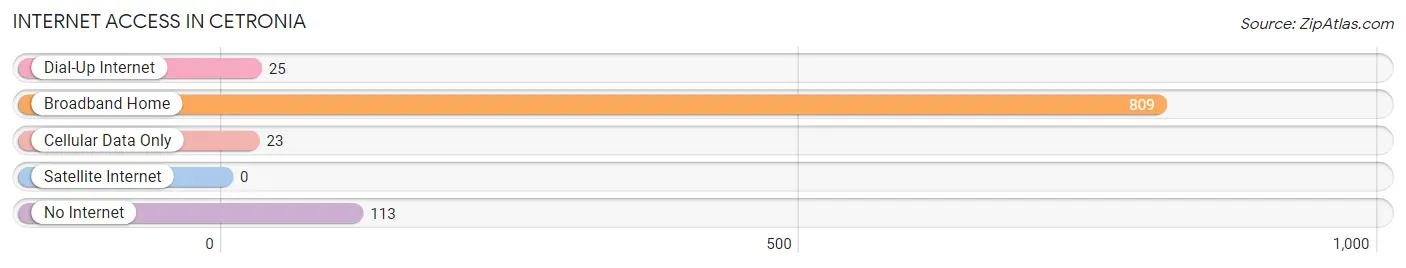
| Internet Type | # Households | % Households |
| Dial-Up Internet | 25 | 2.6% |
| Broadband Home | 809 | 83.4% |
| Cellular Data Only | 23 | 2.4% |
| Satellite Internet | 0 | 0.0% |
| No Internet | 113 | 11.7% |
| Total | 970 | 100.0% |
Cetronia Summary
Cetronia is a small unincorporated community located in South Whitehall Township, Lehigh County, Pennsylvania. It is situated in the Lehigh Valley region of the state, approximately 8 miles northwest of Allentown, the county seat. The community is bordered by the communities of Orefield, Schnecksville, and Fogelsville.
History
Cetronia was founded in the late 19th century by the Cetron family, who were of German descent. The family owned a large tract of land in the area, and the community was named after them. The Cetron family operated a general store in the area, which served as the center of the community.
The first post office in Cetronia was established in 1891. The community was served by the Lehigh Valley Railroad, which provided passenger and freight service to the area. The railroad station was located near the Cetron family store.
In the early 20th century, Cetronia was a thriving community with a population of over 500 people. The community had several businesses, including a hotel, a blacksmith shop, a sawmill, and a grist mill.
Geography
Cetronia is located in South Whitehall Township, Lehigh County, Pennsylvania. It is situated in the Lehigh Valley region of the state, approximately 8 miles northwest of Allentown, the county seat. The community is bordered by the communities of Orefield, Schnecksville, and Fogelsville.
The terrain of Cetronia is mostly flat, with some rolling hills. The area is drained by the Little Lehigh Creek, which flows through the community. The climate is humid continental, with cold winters and hot, humid summers.
Economy
Cetronia is a primarily residential community, with no major industries or businesses. The community is served by several small businesses, including a convenience store, a gas station, and a few restaurants.
The nearest major employers are located in Allentown, which is 8 miles away. The city is home to several large companies, including Air Products and Chemicals, PPL Corporation, and Lehigh Valley Health Network.
Demographics
As of the 2010 census, Cetronia had a population of 1,845. The racial makeup of the community was 94.3% White, 1.2% African American, 0.3% Native American, 1.2% Asian, and 2.9% from other races. Hispanic or Latino of any race were 4.2% of the population.
The median household income in Cetronia was $60,938, and the median family income was $68,958. The per capita income was $27,945. About 4.2% of families and 5.3% of the population were below the poverty line.
Common Questions
What is Per Capita Income in Cetronia?
Per Capita income in Cetronia is $39,140.
What is the Median Family Income in Cetronia?
Median Family Income in Cetronia is $108,417.
What is the Median Household income in Cetronia?
Median Household Income in Cetronia is $75,200.
What is Income or Wage Gap in Cetronia?
Income or Wage Gap in Cetronia is 17.8%.
Women in Cetronia earn 82.2 cents for every dollar earned by a man.
What is Inequality or Gini Index in Cetronia?
Inequality or Gini Index in Cetronia is 0.39.
What is the Total Population of Cetronia?
Total Population of Cetronia is 2,377.
What is the Total Male Population of Cetronia?
Total Male Population of Cetronia is 1,156.
What is the Total Female Population of Cetronia?
Total Female Population of Cetronia is 1,221.
What is the Ratio of Males per 100 Females in Cetronia?
There are 94.68 Males per 100 Females in Cetronia.
What is the Ratio of Females per 100 Males in Cetronia?
There are 105.62 Females per 100 Males in Cetronia.
What is the Median Population Age in Cetronia?
Median Population Age in Cetronia is 43.6 Years.
What is the Average Family Size in Cetronia
Average Family Size in Cetronia is 3.0 People.
What is the Average Household Size in Cetronia
Average Household Size in Cetronia is 2.4 People.
How Large is the Labor Force in Cetronia?
There are 1,125 People in the Labor Forcein in Cetronia.
What is the Percentage of People in the Labor Force in Cetronia?
58.6% of People are in the Labor Force in Cetronia.
What is the Unemployment Rate in Cetronia?
Unemployment Rate in Cetronia is 2.6%.