Zip Codes with the Highest Percentage of Population Employed in Finance & Insurance in Scranton, PA
RELATED REPORTS & OPTIONS
Finance & Insurance
Scranton
Compare Zip Codes
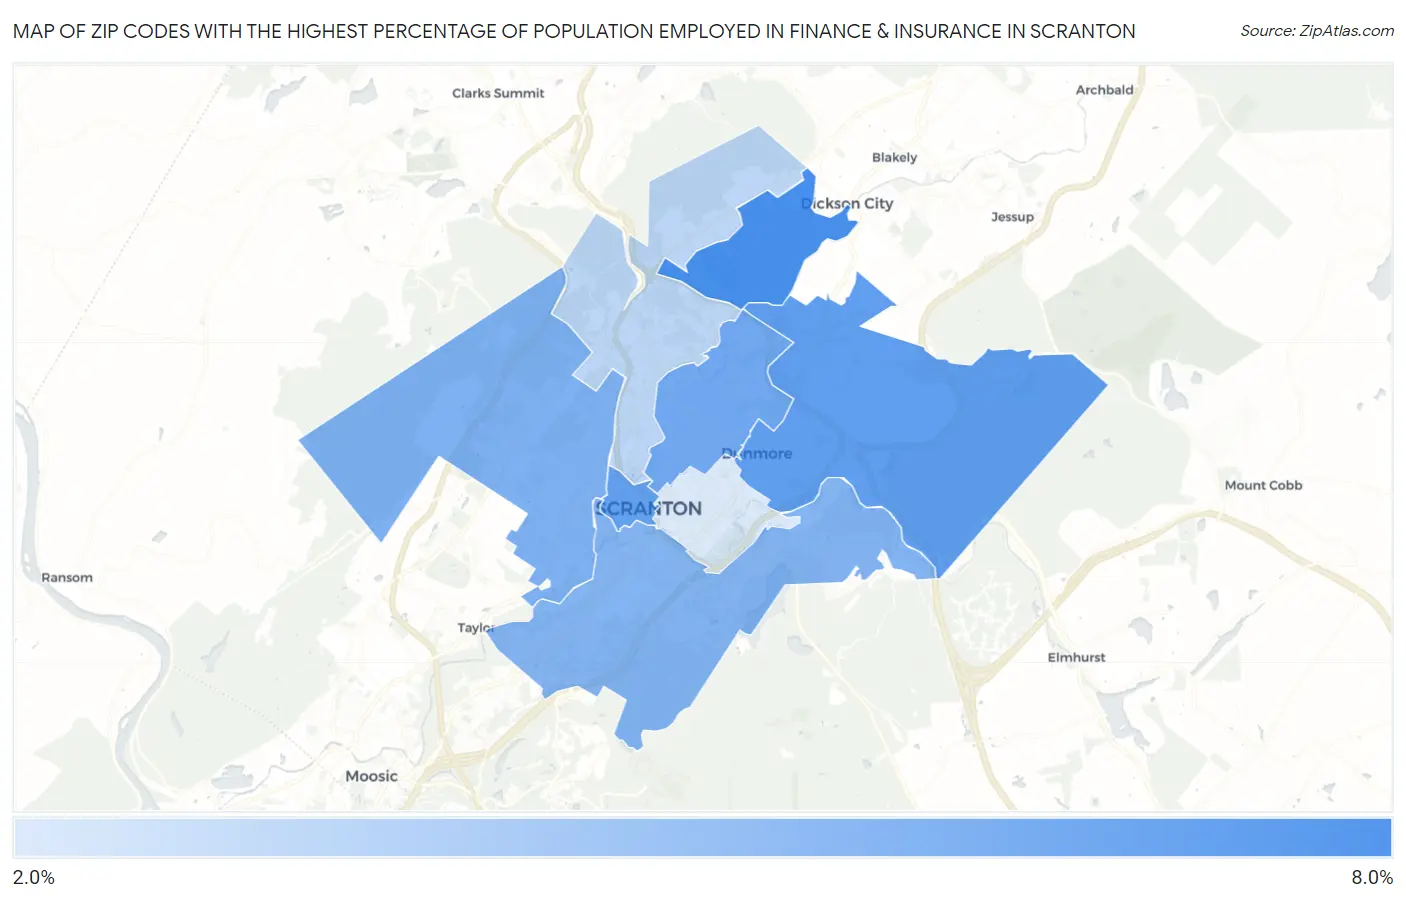
Map of Zip Codes with the Highest Percentage of Population Employed in Finance & Insurance in Scranton
2.6%
7.9%
Zip Codes with the Highest Percentage of Population Employed in Finance & Insurance in Scranton, PA
| Zip Code | % Employed | vs State | vs National | |
| 1. | 18519 | 7.9% | 5.1%(+2.72)#200 | 4.8%(+3.08)#3,235 |
| 2. | 18512 | 7.0% | 5.1%(+1.85)#265 | 4.8%(+2.21)#4,258 |
| 3. | 18503 | 6.8% | 5.1%(+1.71)#274 | 4.8%(+2.08)#4,460 |
| 4. | 18509 | 6.3% | 5.1%(+1.22)#317 | 4.8%(+1.58)#5,228 |
| 5. | 18504 | 5.9% | 5.1%(+0.808)#361 | 4.8%(+1.17)#5,995 |
| 6. | 18505 | 5.8% | 5.1%(+0.628)#381 | 4.8%(+0.990)#6,383 |
| 7. | 18508 | 3.7% | 5.1%(-1.39)#711 | 4.8%(-1.03)#12,619 |
| 8. | 18510 | 2.6% | 5.1%(-2.48)#965 | 4.8%(-2.12)#17,477 |
1
Common Questions
What are the Top 5 Zip Codes with the Highest Percentage of Population Employed in Finance & Insurance in Scranton, PA?
Top 5 Zip Codes with the Highest Percentage of Population Employed in Finance & Insurance in Scranton, PA are:
What zip code has the Highest Percentage of Population Employed in Finance & Insurance in Scranton, PA?
18519 has the Highest Percentage of Population Employed in Finance & Insurance in Scranton, PA with 7.9%.
What is the Percentage of Population Employed in Finance & Insurance in Scranton, PA?
Percentage of Population Employed in Finance & Insurance in Scranton is 4.9%.
What is the Percentage of Population Employed in Finance & Insurance in Pennsylvania?
Percentage of Population Employed in Finance & Insurance in Pennsylvania is 5.1%.
What is the Percentage of Population Employed in Finance & Insurance in the United States?
Percentage of Population Employed in Finance & Insurance in the United States is 4.8%.