West Hills, PA Map & Demographics
West Hills Map
West Hills Overview
$42,593
PER CAPITA INCOME
$94,717
AVG FAMILY INCOME
$91,250
AVG HOUSEHOLD INCOME
0.39
INEQUALITY / GINI INDEX
1,424
TOTAL POPULATION
747
MALE POPULATION
677
FEMALE POPULATION
110.34
MALES / 100 FEMALES
90.63
FEMALES / 100 MALES
54.1
MEDIAN AGE
2.6
AVG FAMILY SIZE
2.2
AVG HOUSEHOLD SIZE
703
LABOR FORCE [ PEOPLE ]
56.9%
PERCENT IN LABOR FORCE
7.3%
UNEMPLOYMENT RATE
Income in West Hills
Income Overview in West Hills
Per Capita Income in West Hills is $42,593, while median incomes of families and households are $94,717 and $91,250 respectively.
| Characteristic | Number | Measure |
| Per Capita Income | 1,424 | $42,593 |
| Median Family Income | 481 | $94,717 |
| Mean Family Income | 481 | $106,397 |
| Median Household Income | 660 | $91,250 |
| Mean Household Income | 660 | $94,240 |
| Income Deficit | 481 | $0 |
| Wage / Income Gap (%) | 1,424 | 0.00% |
| Wage / Income Gap ($) | 1,424 | 100.00¢ per $1 |
| Gini / Inequality Index | 1,424 | 0.39 |
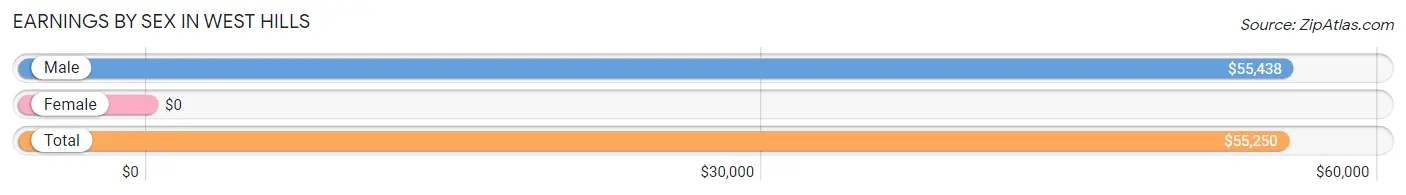
Earnings by Sex in West Hills
| Sex | Number | Average Earnings |
| Male | 431 (66.1%) | $55,438 |
| Female | 221 (33.9%) | $0 |
| Total | 652 (100.0%) | $55,250 |
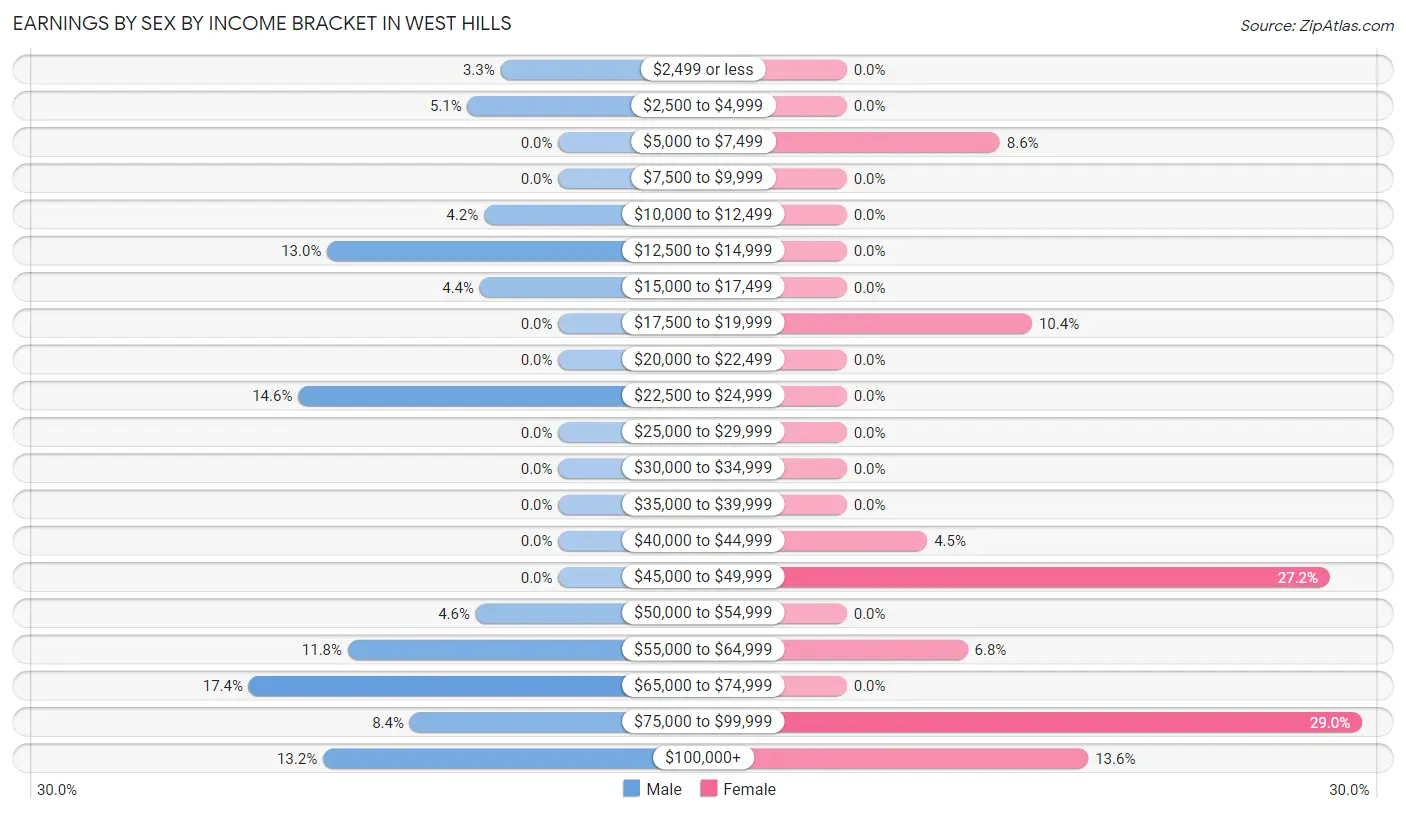
Earnings by Sex by Income Bracket in West Hills
The most common earnings brackets in West Hills are $65,000 to $74,999 for men (75 | 17.4%) and $75,000 to $99,999 for women (64 | 29.0%).
| Income | Male | Female |
| $2,499 or less | 14 (3.3%) | 0 (0.0%) |
| $2,500 to $4,999 | 22 (5.1%) | 0 (0.0%) |
| $5,000 to $7,499 | 0 (0.0%) | 19 (8.6%) |
| $7,500 to $9,999 | 0 (0.0%) | 0 (0.0%) |
| $10,000 to $12,499 | 18 (4.2%) | 0 (0.0%) |
| $12,500 to $14,999 | 56 (13.0%) | 0 (0.0%) |
| $15,000 to $17,499 | 19 (4.4%) | 0 (0.0%) |
| $17,500 to $19,999 | 0 (0.0%) | 23 (10.4%) |
| $20,000 to $22,499 | 0 (0.0%) | 0 (0.0%) |
| $22,500 to $24,999 | 63 (14.6%) | 0 (0.0%) |
| $25,000 to $29,999 | 0 (0.0%) | 0 (0.0%) |
| $30,000 to $34,999 | 0 (0.0%) | 0 (0.0%) |
| $35,000 to $39,999 | 0 (0.0%) | 0 (0.0%) |
| $40,000 to $44,999 | 0 (0.0%) | 10 (4.5%) |
| $45,000 to $49,999 | 0 (0.0%) | 60 (27.2%) |
| $50,000 to $54,999 | 20 (4.6%) | 0 (0.0%) |
| $55,000 to $64,999 | 51 (11.8%) | 15 (6.8%) |
| $65,000 to $74,999 | 75 (17.4%) | 0 (0.0%) |
| $75,000 to $99,999 | 36 (8.4%) | 64 (29.0%) |
| $100,000+ | 57 (13.2%) | 30 (13.6%) |
| Total | 431 (100.0%) | 221 (100.0%) |
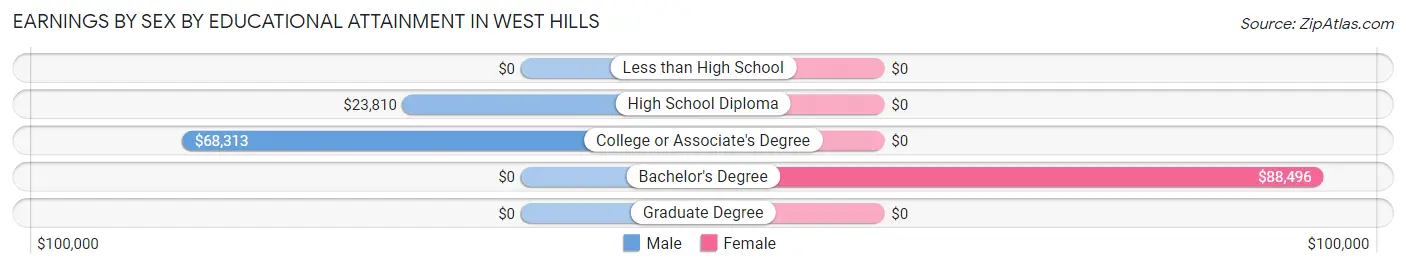
Earnings by Sex by Educational Attainment in West Hills
| Educational Attainment | Male Income | Female Income |
| Less than High School | - | - |
| High School Diploma | $23,810 | $0 |
| College or Associate's Degree | $68,313 | $0 |
| Bachelor's Degree | - | - |
| Graduate Degree | - | - |
| Total | $63,472 | $0 |
Family Income in West Hills
Family Income Brackets in West Hills
According to the West Hills family income data, there are 128 families falling into the $75,000 to $99,999 income range, which is the most common income bracket and makes up 26.6% of all families.
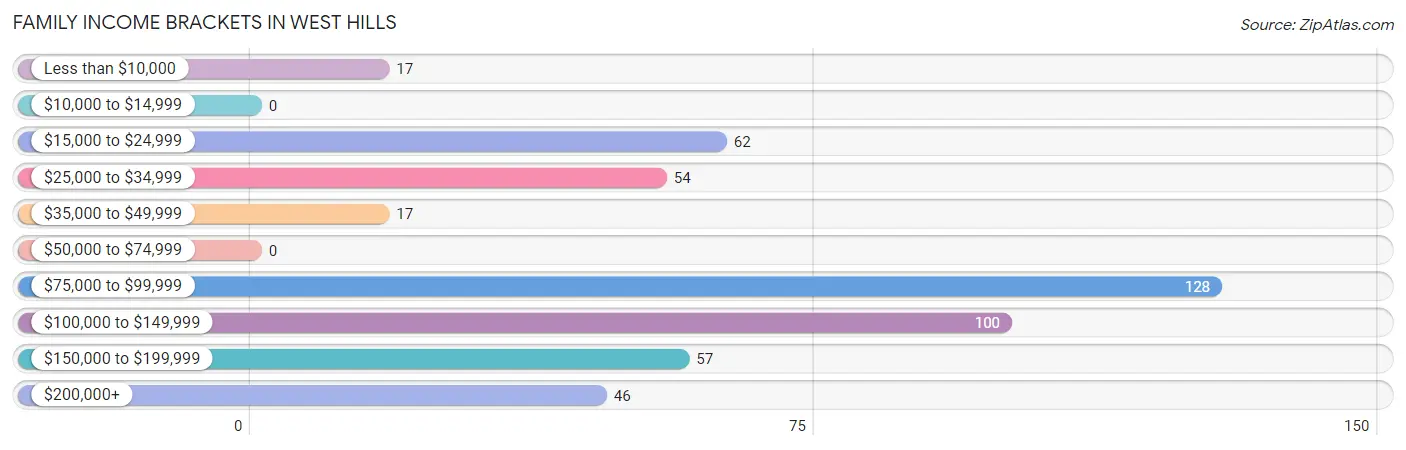
| Income Bracket | # Families | % Families |
| Less than $10,000 | 17 | 3.5% |
| $10,000 to $14,999 | 0 | 0.0% |
| $15,000 to $24,999 | 62 | 12.9% |
| $25,000 to $34,999 | 54 | 11.2% |
| $35,000 to $49,999 | 17 | 3.5% |
| $50,000 to $74,999 | 0 | 0.0% |
| $75,000 to $99,999 | 128 | 26.6% |
| $100,000 to $149,999 | 100 | 20.8% |
| $150,000 to $199,999 | 57 | 11.9% |
| $200,000+ | 46 | 9.6% |
Family Income by Famaliy Size in West Hills
3-person families (74 | 15.4%) account for the highest median family income in West Hills with $101,250 per family, while 2-person families (276 | 57.4%) have the highest median income of $46,444 per family member.
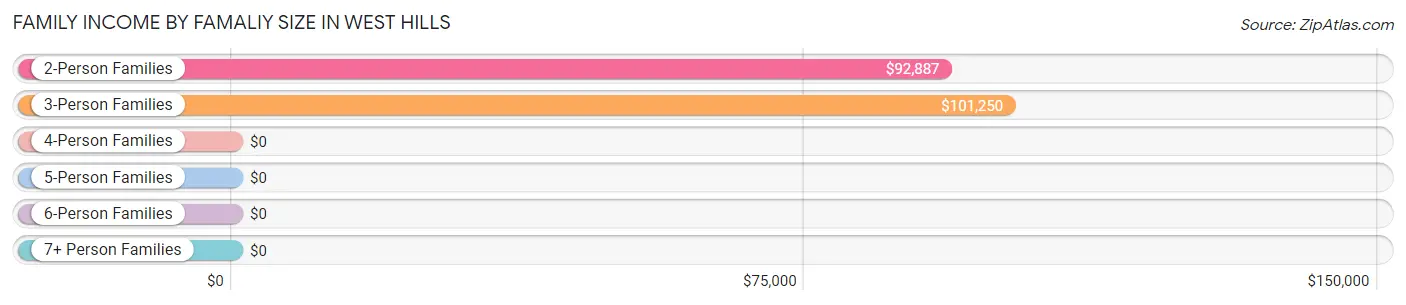
| Income Bracket | # Families | Median Income |
| 2-Person Families | 276 (57.4%) | $92,887 |
| 3-Person Families | 74 (15.4%) | $101,250 |
| 4-Person Families | 87 (18.1%) | $0 |
| 5-Person Families | 33 (6.9%) | $0 |
| 6-Person Families | 11 (2.3%) | $0 |
| 7+ Person Families | 0 (0.0%) | $0 |
| Total | 481 (100.0%) | $94,717 |
Family Income by Number of Earners in West Hills
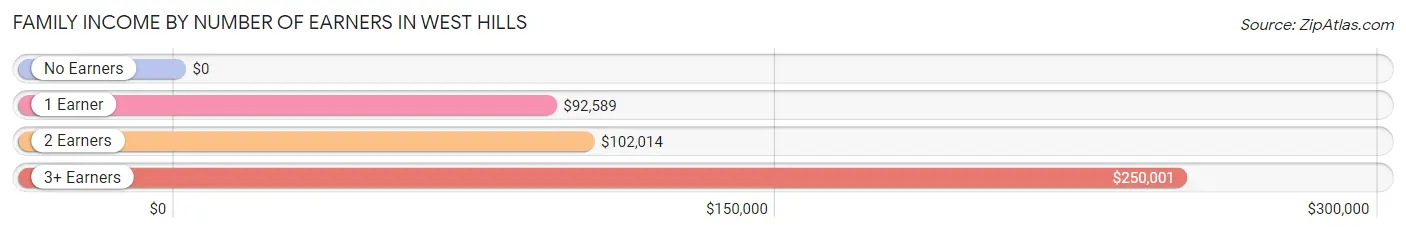
| Number of Earners | # Families | Median Income |
| No Earners | 155 (32.2%) | $0 |
| 1 Earner | 162 (33.7%) | $92,589 |
| 2 Earners | 85 (17.7%) | $102,014 |
| 3+ Earners | 79 (16.4%) | $250,001 |
| Total | 481 (100.0%) | $94,717 |
Household Income in West Hills
Household Income Brackets in West Hills
With 179 households falling in the category, the $75,000 to $99,999 income range is the most frequent in West Hills, accounting for 27.1% of all households.
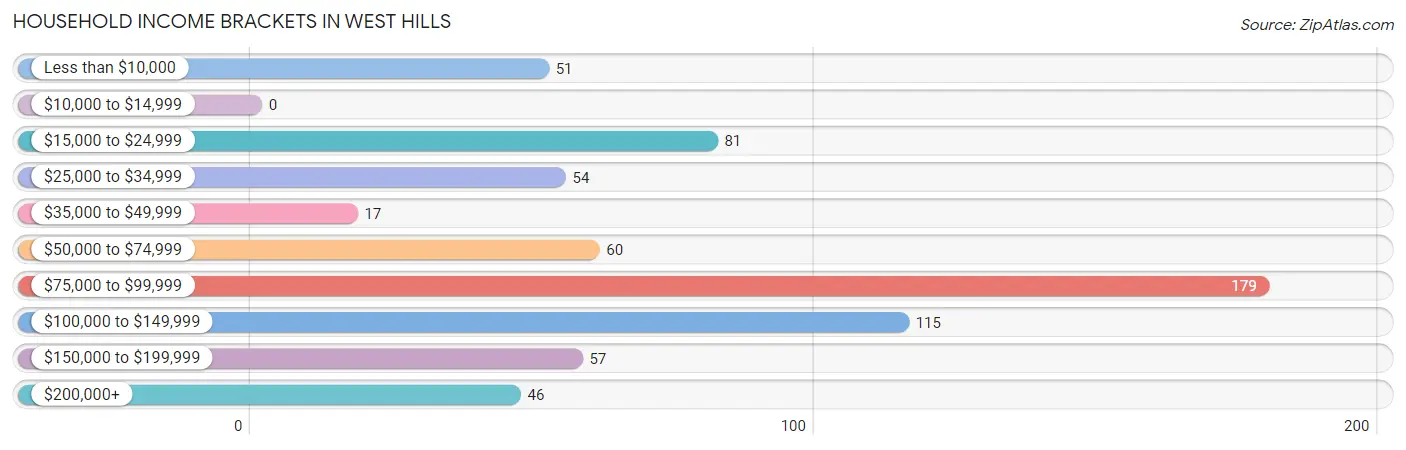
| Income Bracket | # Households | % Households |
| Less than $10,000 | 51 | 7.7% |
| $10,000 to $14,999 | 0 | 0.0% |
| $15,000 to $24,999 | 81 | 12.3% |
| $25,000 to $34,999 | 54 | 8.2% |
| $35,000 to $49,999 | 17 | 2.6% |
| $50,000 to $74,999 | 60 | 9.1% |
| $75,000 to $99,999 | 179 | 27.1% |
| $100,000 to $149,999 | 115 | 17.4% |
| $150,000 to $199,999 | 57 | 8.6% |
| $200,000+ | 46 | 7.0% |
Household Income by Householder Age in West Hills
The median household income in West Hills is $91,250, with the highest median household income of $97,589 found in the 45 to 64 years age bracket for the primary householder. A total of 272 households (41.2%) fall into this category. Meanwhile, the 15 to 24 years age bracket for the primary householder has the lowest median household income of $0, with 19 households (2.9%) in this group.
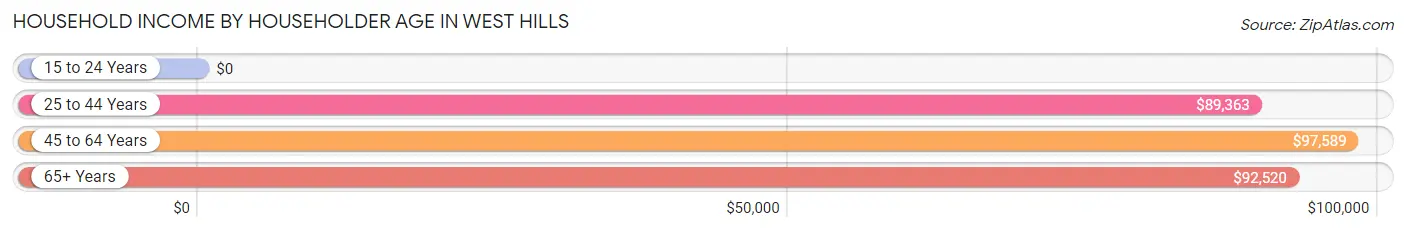
| Income Bracket | # Households | Median Income |
| 15 to 24 Years | 19 (2.9%) | $0 |
| 25 to 44 Years | 110 (16.7%) | $89,363 |
| 45 to 64 Years | 272 (41.2%) | $97,589 |
| 65+ Years | 259 (39.2%) | $92,520 |
| Total | 660 (100.0%) | $91,250 |
Poverty in West Hills
Income Below Poverty by Sex and Age in West Hills
With 10.0% poverty level for males and 22.3% for females among the residents of West Hills, under 5 year old males and 12 to 14 year old females are the most vulnerable to poverty, with 37 males (75.5%) and 18 females (100.0%) in their respective age groups living below the poverty level.
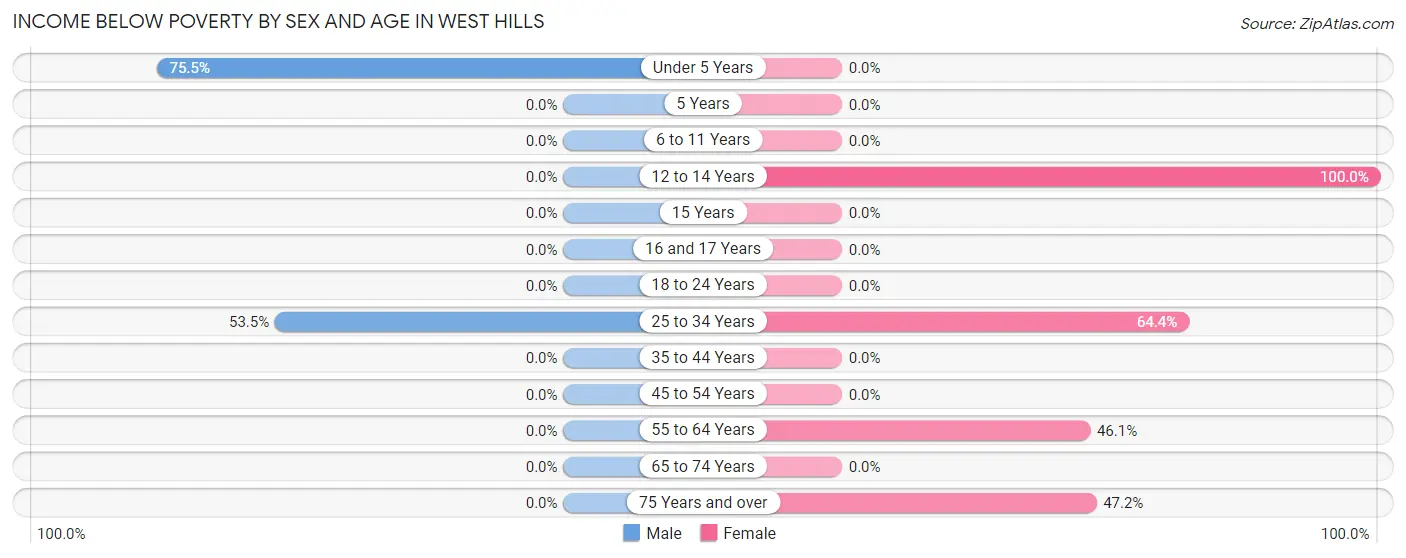
| Age Bracket | Male | Female |
| Under 5 Years | 37 (75.5%) | 0 (0.0%) |
| 5 Years | 0 (0.0%) | 0 (0.0%) |
| 6 to 11 Years | 0 (0.0%) | 0 (0.0%) |
| 12 to 14 Years | 0 (0.0%) | 18 (100.0%) |
| 15 Years | 0 (0.0%) | 0 (0.0%) |
| 16 and 17 Years | 0 (0.0%) | 0 (0.0%) |
| 18 to 24 Years | 0 (0.0%) | 0 (0.0%) |
| 25 to 34 Years | 38 (53.5%) | 58 (64.4%) |
| 35 to 44 Years | 0 (0.0%) | 0 (0.0%) |
| 45 to 54 Years | 0 (0.0%) | 0 (0.0%) |
| 55 to 64 Years | 0 (0.0%) | 41 (46.1%) |
| 65 to 74 Years | 0 (0.0%) | 0 (0.0%) |
| 75 Years and over | 0 (0.0%) | 34 (47.2%) |
| Total | 75 (10.0%) | 151 (22.3%) |
Income Above Poverty by Sex and Age in West Hills
According to the poverty statistics in West Hills, males aged 6 to 11 years and females aged under 5 years are the age groups that are most secure financially, with 100.0% of males and 100.0% of females in these age groups living above the poverty line.
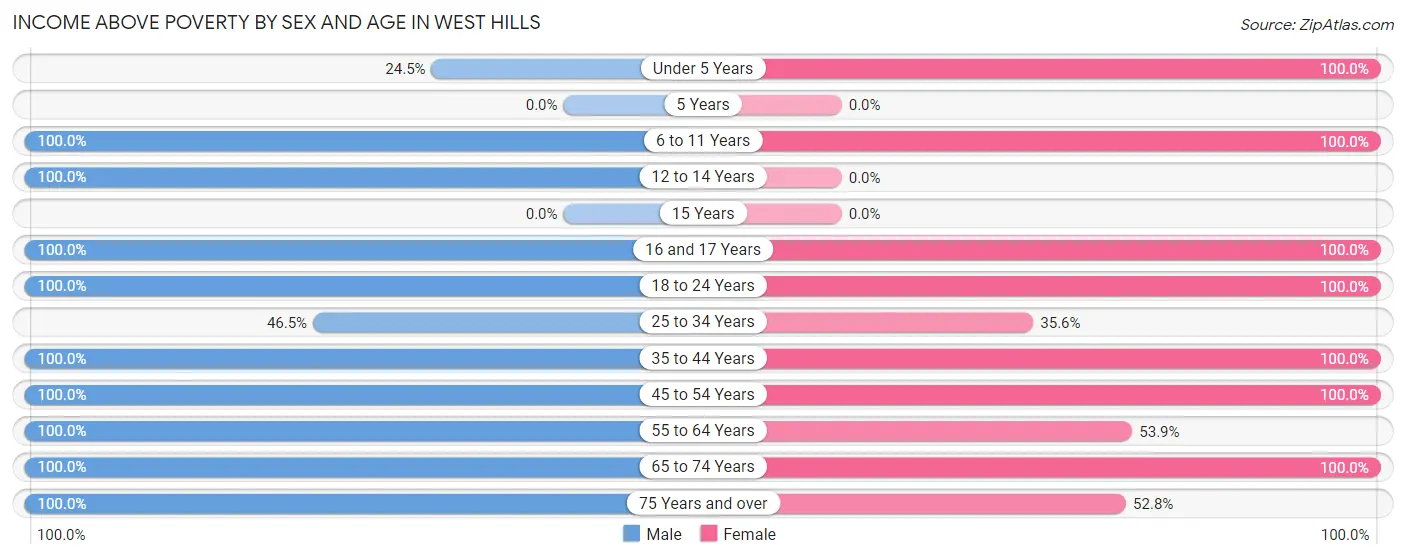
| Age Bracket | Male | Female |
| Under 5 Years | 12 (24.5%) | 17 (100.0%) |
| 5 Years | 0 (0.0%) | 0 (0.0%) |
| 6 to 11 Years | 10 (100.0%) | 13 (100.0%) |
| 12 to 14 Years | 81 (100.0%) | 0 (0.0%) |
| 15 Years | 0 (0.0%) | 0 (0.0%) |
| 16 and 17 Years | 14 (100.0%) | 13 (100.0%) |
| 18 to 24 Years | 69 (100.0%) | 21 (100.0%) |
| 25 to 34 Years | 33 (46.5%) | 32 (35.6%) |
| 35 to 44 Years | 11 (100.0%) | 76 (100.0%) |
| 45 to 54 Years | 93 (100.0%) | 79 (100.0%) |
| 55 to 64 Years | 82 (100.0%) | 48 (53.9%) |
| 65 to 74 Years | 208 (100.0%) | 189 (100.0%) |
| 75 Years and over | 59 (100.0%) | 38 (52.8%) |
| Total | 672 (90.0%) | 526 (77.7%) |
Income Below Poverty Among Married-Couple Families in West Hills
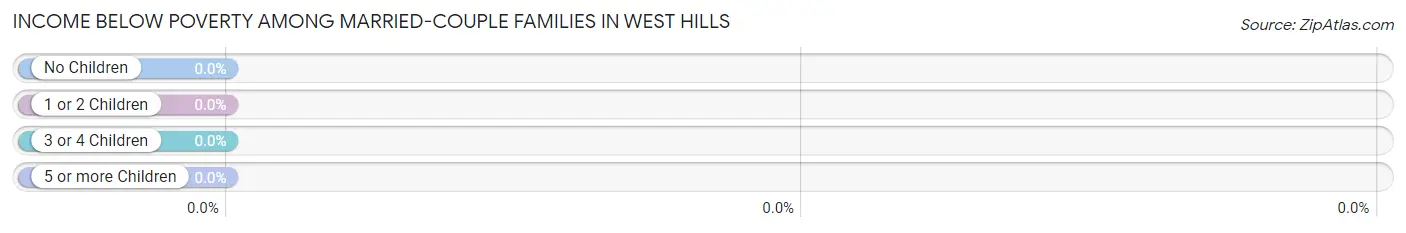
| Children | Above Poverty | Below Poverty |
| No Children | 320 (100.0%) | 0 (0.0%) |
| 1 or 2 Children | 77 (100.0%) | 0 (0.0%) |
| 3 or 4 Children | 26 (100.0%) | 0 (0.0%) |
| 5 or more Children | 0 (0.0%) | 0 (0.0%) |
| Total | 423 (100.0%) | 0 (0.0%) |
Income Below Poverty Among Single-Parent Households in West Hills
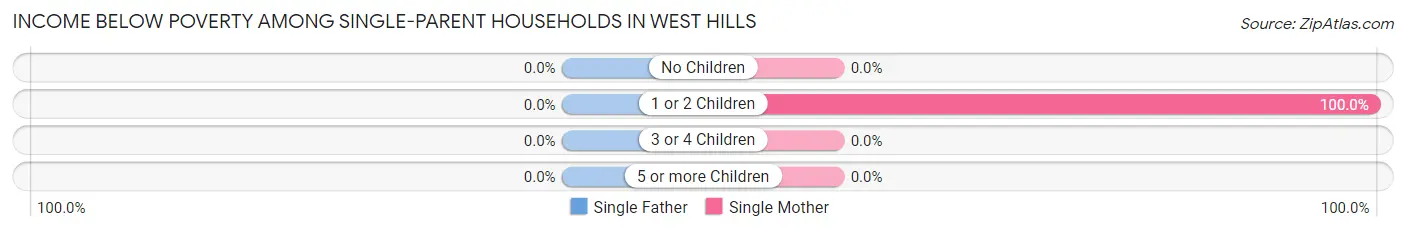
| Children | Single Father | Single Mother |
| No Children | 0 (0.0%) | 0 (0.0%) |
| 1 or 2 Children | 0 (0.0%) | 58 (100.0%) |
| 3 or 4 Children | 0 (0.0%) | 0 (0.0%) |
| 5 or more Children | 0 (0.0%) | 0 (0.0%) |
| Total | 0 (0.0%) | 58 (100.0%) |
Income Below Poverty Among Married-Couple vs Single-Parent Households in West Hills
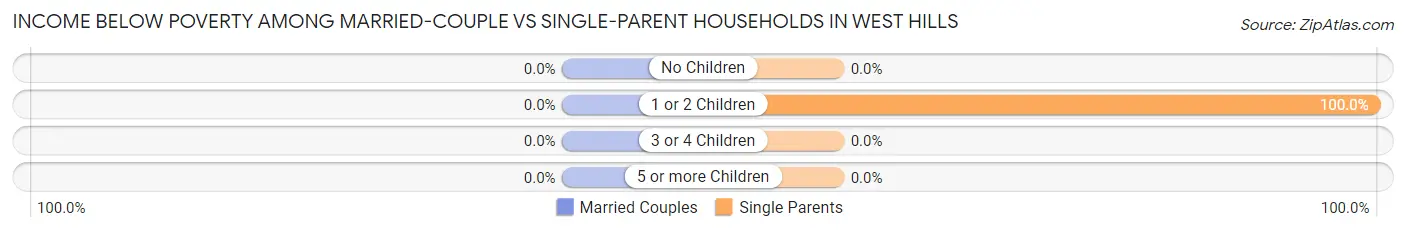
| Children | Married-Couple Families | Single-Parent Households |
| No Children | 0 (0.0%) | 0 (0.0%) |
| 1 or 2 Children | 0 (0.0%) | 58 (100.0%) |
| 3 or 4 Children | 0 (0.0%) | 0 (0.0%) |
| 5 or more Children | 0 (0.0%) | 0 (0.0%) |
| Total | 0 (0.0%) | 58 (100.0%) |
Race in West Hills
The most populous races in West Hills are White / Caucasian (1,362 | 95.7%), and Asian (62 | 4.3%).
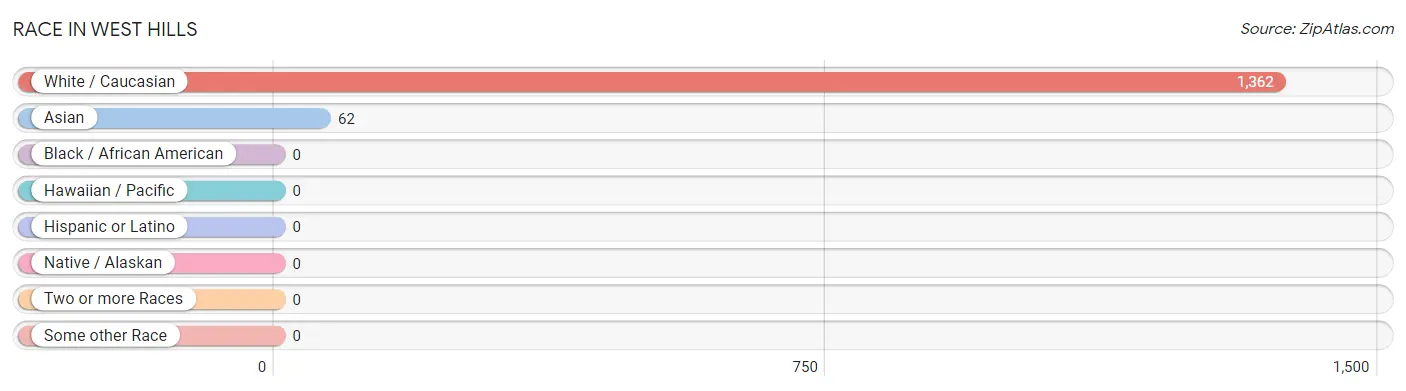
| Race | # Population | % Population |
| Asian | 62 | 4.3% |
| Black / African American | 0 | 0.0% |
| Hawaiian / Pacific | 0 | 0.0% |
| Hispanic or Latino | 0 | 0.0% |
| Native / Alaskan | 0 | 0.0% |
| White / Caucasian | 1,362 | 95.7% |
| Two or more Races | 0 | 0.0% |
| Some other Race | 0 | 0.0% |
| Total | 1,424 | 100.0% |
Ancestry in West Hills
The most populous ancestries reported in West Hills are German (590 | 41.4%), Irish (379 | 26.6%), Italian (313 | 22.0%), English (112 | 7.9%), and Polish (79 | 5.6%), together accounting for 103.4% of all West Hills residents.
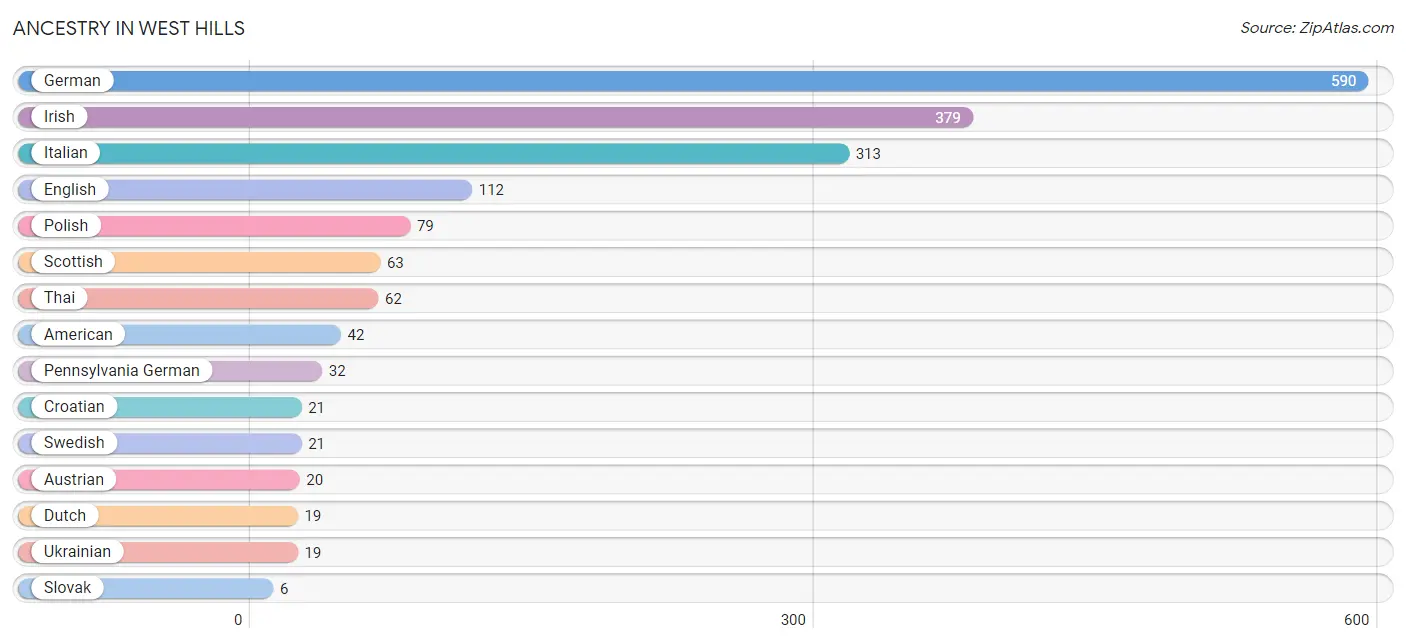
| Ancestry | # Population | % Population |
| American | 42 | 2.9% |
| Austrian | 20 | 1.4% |
| Croatian | 21 | 1.5% |
| Dutch | 19 | 1.3% |
| English | 112 | 7.9% |
| German | 590 | 41.4% |
| Irish | 379 | 26.6% |
| Italian | 313 | 22.0% |
| Pennsylvania German | 32 | 2.2% |
| Polish | 79 | 5.6% |
| Scottish | 63 | 4.4% |
| Slovak | 6 | 0.4% |
| Swedish | 21 | 1.5% |
| Thai | 62 | 4.3% |
| Ukrainian | 19 | 1.3% | View All 15 Rows |
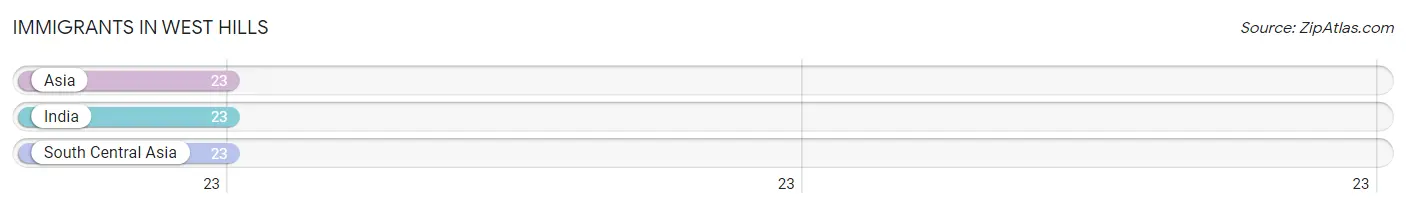
Immigrants in West Hills
The most numerous immigrant groups reported in West Hills came from Asia (23 | 1.6%), India (23 | 1.6%), and South Central Asia (23 | 1.6%), together accounting for 4.9% of all West Hills residents.
| Immigration Origin | # Population | % Population |
| Asia | 23 | 1.6% |
| India | 23 | 1.6% |
| South Central Asia | 23 | 1.6% | View All 3 Rows |
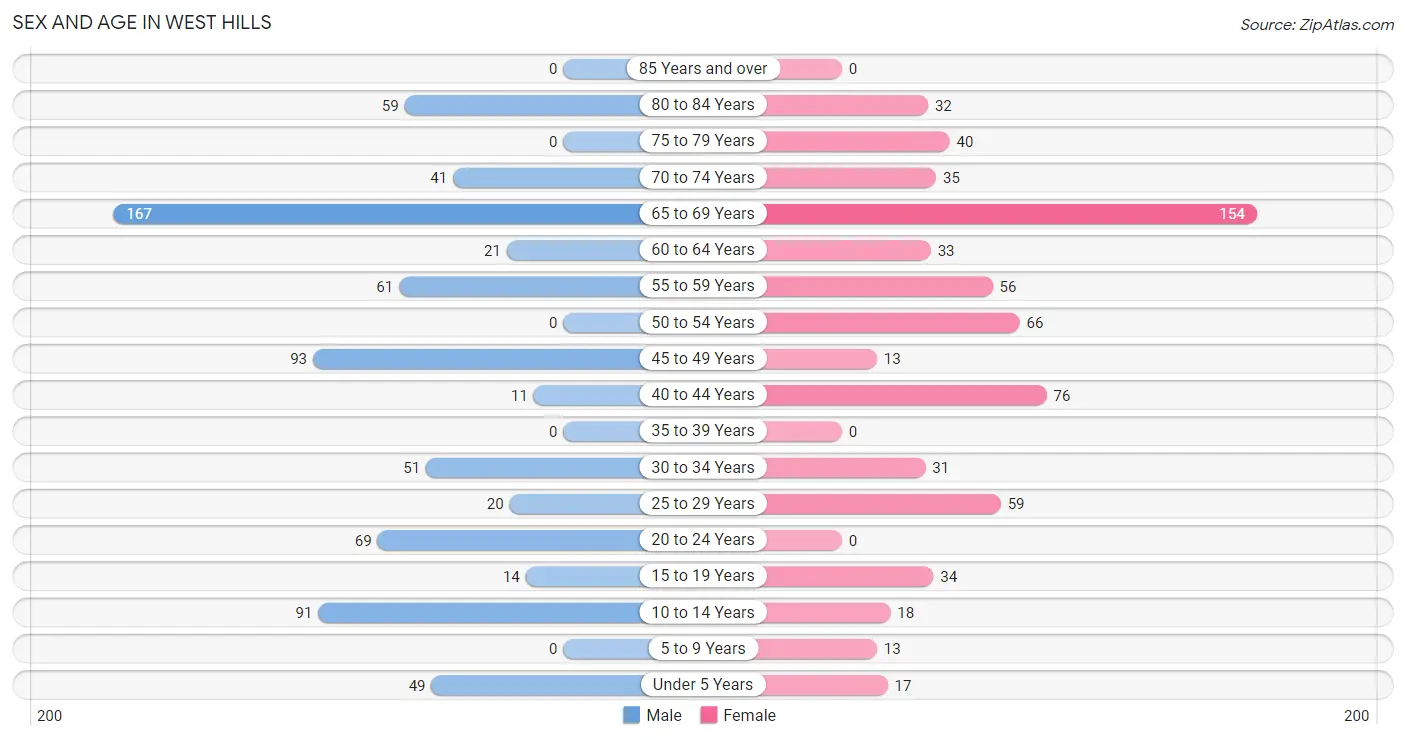
Sex and Age in West Hills
Sex and Age in West Hills
The most populous age groups in West Hills are 65 to 69 Years (167 | 22.4%) for men and 65 to 69 Years (154 | 22.8%) for women.
| Age Bracket | Male | Female |
| Under 5 Years | 49 (6.6%) | 17 (2.5%) |
| 5 to 9 Years | 0 (0.0%) | 13 (1.9%) |
| 10 to 14 Years | 91 (12.2%) | 18 (2.7%) |
| 15 to 19 Years | 14 (1.9%) | 34 (5.0%) |
| 20 to 24 Years | 69 (9.2%) | 0 (0.0%) |
| 25 to 29 Years | 20 (2.7%) | 59 (8.7%) |
| 30 to 34 Years | 51 (6.8%) | 31 (4.6%) |
| 35 to 39 Years | 0 (0.0%) | 0 (0.0%) |
| 40 to 44 Years | 11 (1.5%) | 76 (11.2%) |
| 45 to 49 Years | 93 (12.4%) | 13 (1.9%) |
| 50 to 54 Years | 0 (0.0%) | 66 (9.8%) |
| 55 to 59 Years | 61 (8.2%) | 56 (8.3%) |
| 60 to 64 Years | 21 (2.8%) | 33 (4.9%) |
| 65 to 69 Years | 167 (22.4%) | 154 (22.8%) |
| 70 to 74 Years | 41 (5.5%) | 35 (5.2%) |
| 75 to 79 Years | 0 (0.0%) | 40 (5.9%) |
| 80 to 84 Years | 59 (7.9%) | 32 (4.7%) |
| 85 Years and over | 0 (0.0%) | 0 (0.0%) |
| Total | 747 (100.0%) | 677 (100.0%) |
Families and Households in West Hills
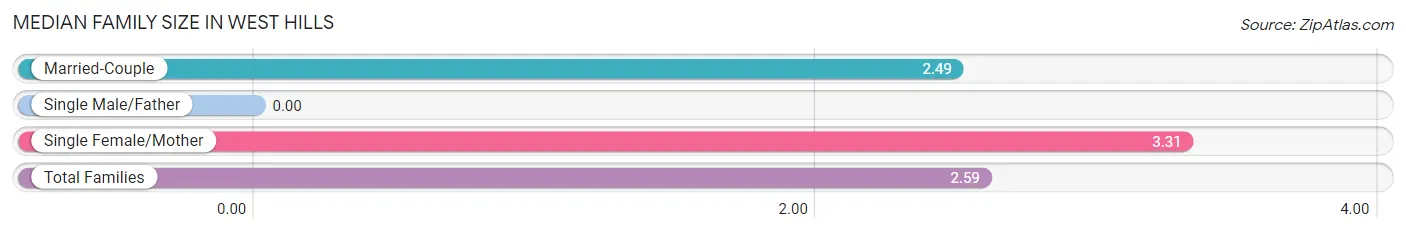
Median Family Size in West Hills
| Family Type | # Families | Family Size |
| Married-Couple | 423 (87.9%) | 2.49 |
| Single Male/Father | 0 (0.0%) | - |
| Single Female/Mother | 58 (12.1%) | 3.31 |
| Total Families | 481 (100.0%) | 2.59 |
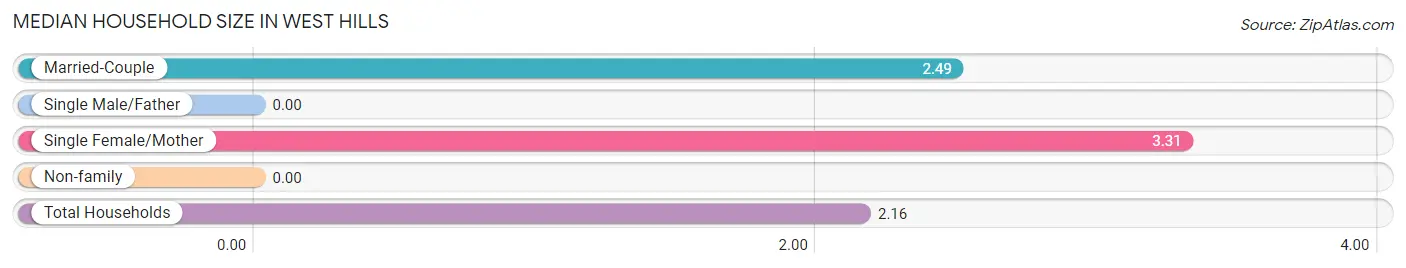
Median Household Size in West Hills
| Household Type | # Households | Household Size |
| Married-Couple | 423 (64.1%) | 2.49 |
| Single Male/Father | 0 (0.0%) | - |
| Single Female/Mother | 58 (8.8%) | 3.31 |
| Non-family | 179 (27.1%) | - |
| Total Households | 660 (100.0%) | 2.16 |
Household Size by Marriage Status in West Hills
Out of a total of 660 households in West Hills, 481 (72.9%) are family households, while 179 (27.1%) are nonfamily households. The most numerous type of family households are 2-person households, comprising 276, and the most common type of nonfamily households are 1-person households, comprising 179.
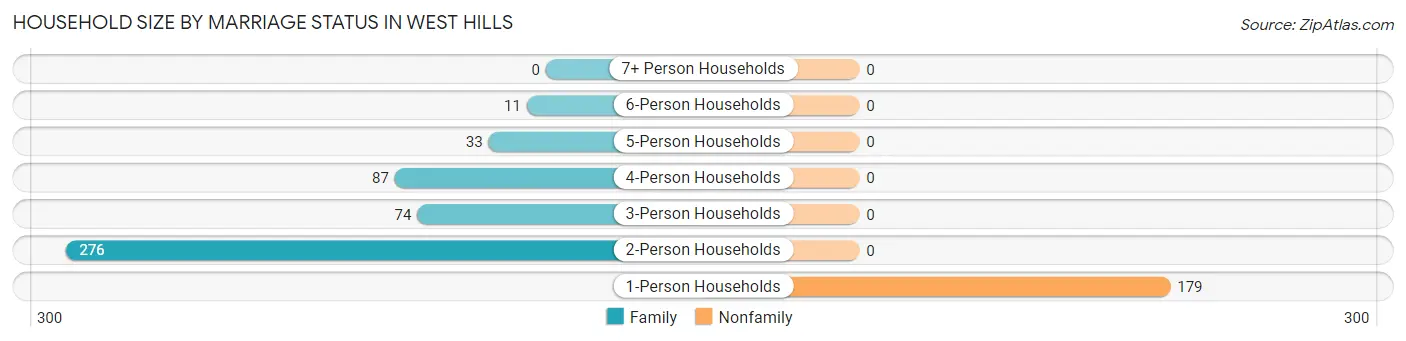
| Household Size | Family Households | Nonfamily Households |
| 1-Person Households | - | 179 (27.1%) |
| 2-Person Households | 276 (41.8%) | 0 (0.0%) |
| 3-Person Households | 74 (11.2%) | 0 (0.0%) |
| 4-Person Households | 87 (13.2%) | 0 (0.0%) |
| 5-Person Households | 33 (5.0%) | 0 (0.0%) |
| 6-Person Households | 11 (1.7%) | 0 (0.0%) |
| 7+ Person Households | 0 (0.0%) | 0 (0.0%) |
| Total | 481 (72.9%) | 179 (27.1%) |
Female Fertility in West Hills
Fertility by Age in West Hills
Average fertility rate in West Hills is 133.0 births per 1,000 women. Women in the age bracket of 20 to 34 years have the highest fertility rate with 356.0 births per 1,000 women. Women in the age bracket of 20 to 34 years acount for 100.0% of all women with births.
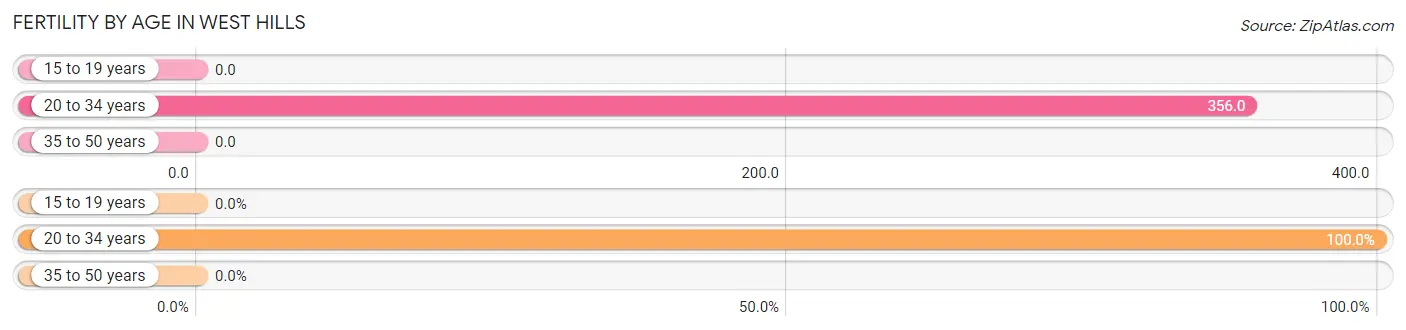
| Age Bracket | Women with Births | Births / 1,000 Women |
| 15 to 19 years | 0 (0.0%) | 0.0 |
| 20 to 34 years | 32 (100.0%) | 356.0 |
| 35 to 50 years | 0 (0.0%) | 0.0 |
| Total | 32 (100.0%) | 133.0 |
Fertility by Age by Marriage Status in West Hills
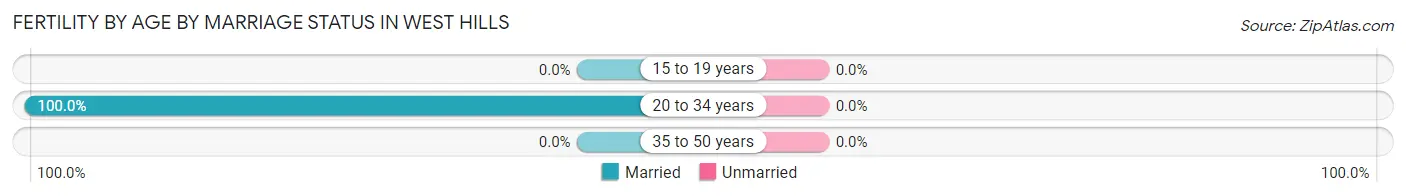
| Age Bracket | Married | Unmarried |
| 15 to 19 years | 0 (0.0%) | 0 (0.0%) |
| 20 to 34 years | 32 (100.0%) | 0 (0.0%) |
| 35 to 50 years | 0 (0.0%) | 0 (0.0%) |
| Total | 32 (100.0%) | 0 (0.0%) |
Fertility by Education in West Hills
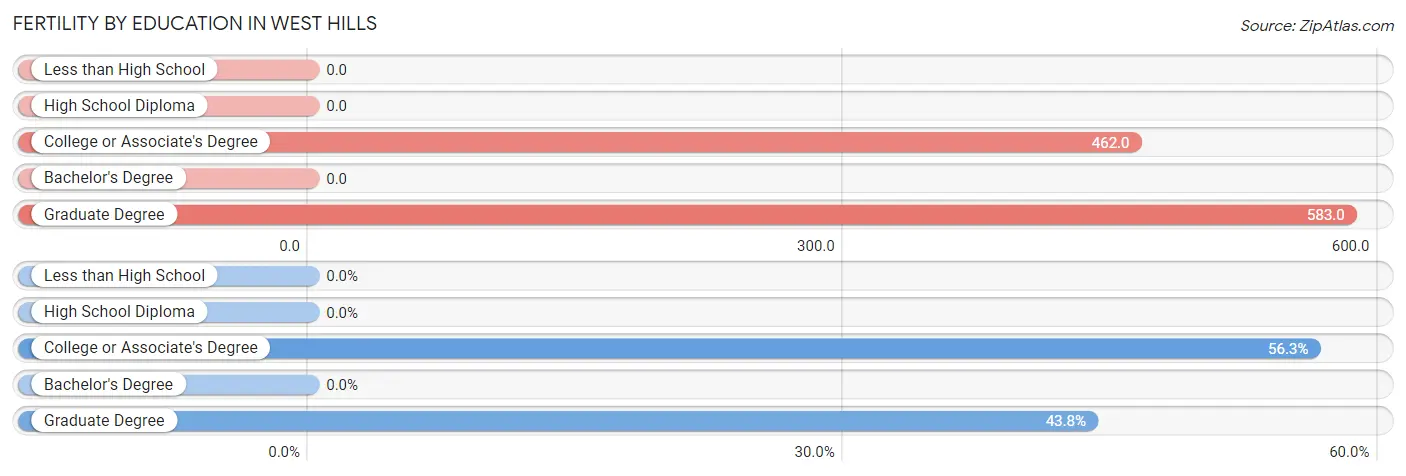
| Educational Attainment | Women with Births | Births / 1,000 Women |
| Less than High School | 0 (0.0%) | 0.0 |
| High School Diploma | 0 (0.0%) | 0.0 |
| College or Associate's Degree | 18 (56.2%) | 462.0 |
| Bachelor's Degree | 0 (0.0%) | 0.0 |
| Graduate Degree | 14 (43.8%) | 583.0 |
| Total | 32 (100.0%) | 133.0 |
Fertility by Education by Marriage Status in West Hills
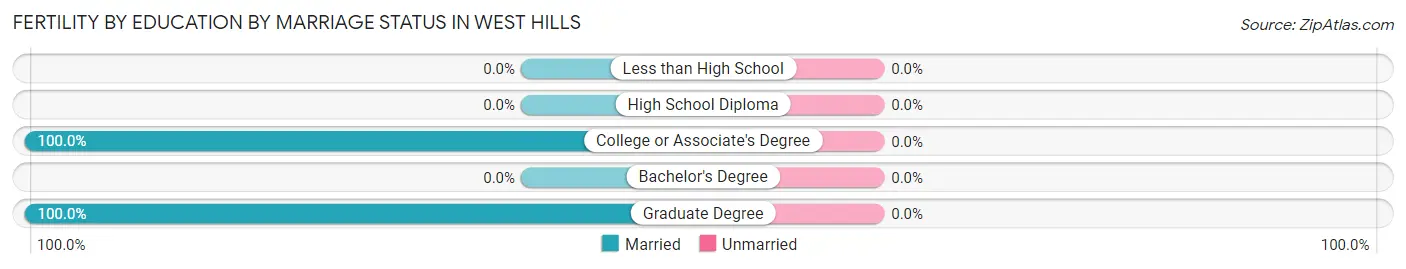
| Educational Attainment | Married | Unmarried |
| Less than High School | 0 (0.0%) | 0 (0.0%) |
| High School Diploma | 0 (0.0%) | 0 (0.0%) |
| College or Associate's Degree | 18 (100.0%) | 0 (0.0%) |
| Bachelor's Degree | 0 (0.0%) | 0 (0.0%) |
| Graduate Degree | 14 (100.0%) | 0 (0.0%) |
| Total | 32 (100.0%) | 0 (0.0%) |
Employment Characteristics in West Hills
Employment by Class of Employer in West Hills
Among the 652 employed individuals in West Hills, private company employees (373 | 57.2%), local government employees (111 | 17.0%), and not-for-profit organizations (94 | 14.4%) make up the most common classes of employment.
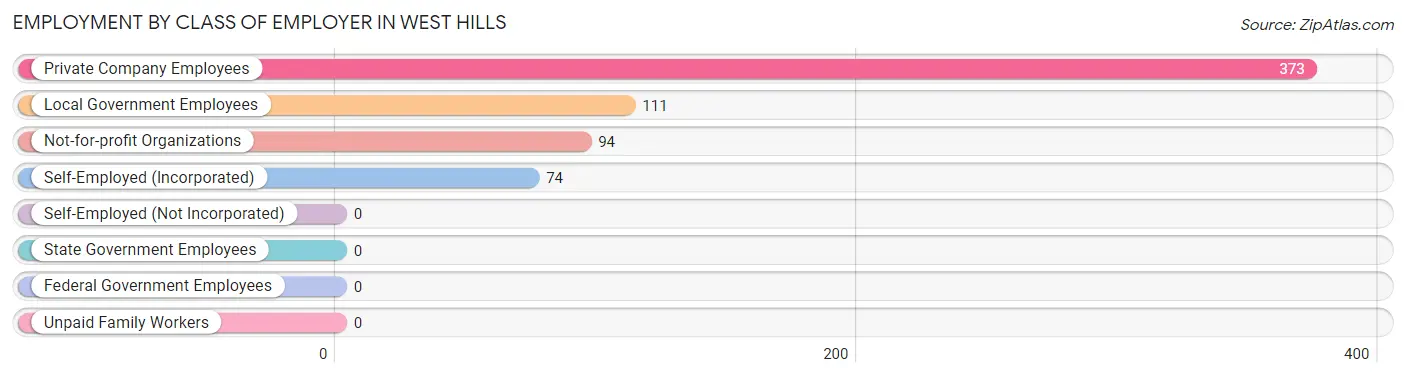
| Employer Class | # Employees | % Employees |
| Private Company Employees | 373 | 57.2% |
| Self-Employed (Incorporated) | 74 | 11.4% |
| Self-Employed (Not Incorporated) | 0 | 0.0% |
| Not-for-profit Organizations | 94 | 14.4% |
| Local Government Employees | 111 | 17.0% |
| State Government Employees | 0 | 0.0% |
| Federal Government Employees | 0 | 0.0% |
| Unpaid Family Workers | 0 | 0.0% |
| Total | 652 | 100.0% |
Employment Status by Age in West Hills
According to the labor force statistics for West Hills, out of the total population over 16 years of age (1,236), 56.9% or 703 individuals are in the labor force, with 7.3% or 51 of them unemployed. The age group with the highest labor force participation rate is 20 to 24 years, with 100.0% or 69 individuals in the labor force. Within the labor force, the 25 to 29 years age range has the highest percentage of unemployed individuals, with 51.9% or 41 of them being unemployed.
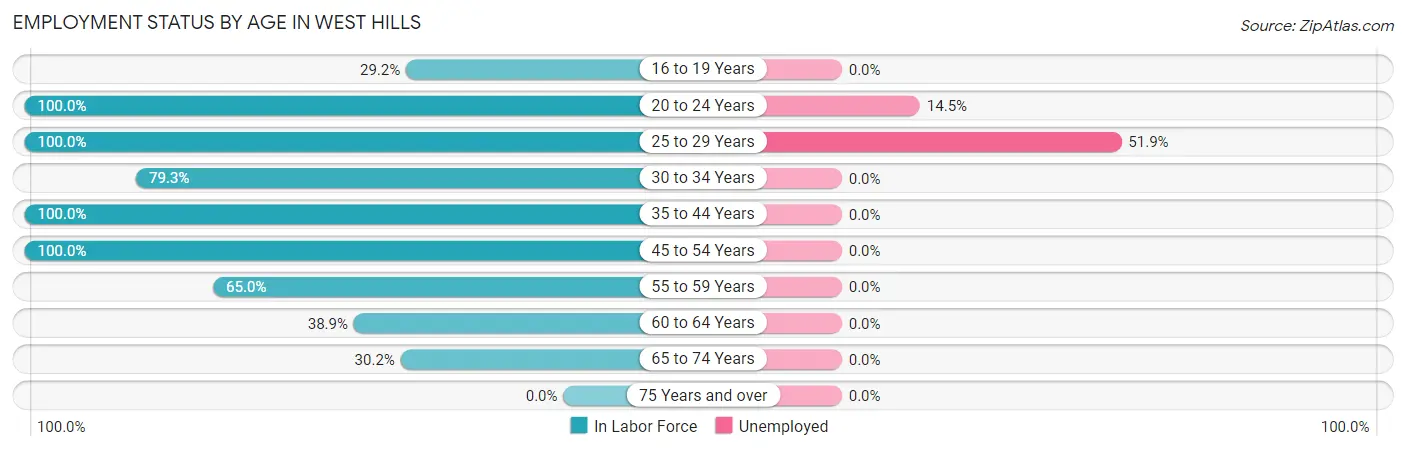
| Age Bracket | In Labor Force | Unemployed |
| 16 to 19 Years | 14 (29.2%) | 0 (0.0%) |
| 20 to 24 Years | 69 (100.0%) | 10 (14.5%) |
| 25 to 29 Years | 79 (100.0%) | 41 (51.9%) |
| 30 to 34 Years | 65 (79.3%) | 0 (0.0%) |
| 35 to 44 Years | 87 (100.0%) | 0 (0.0%) |
| 45 to 54 Years | 172 (100.0%) | 0 (0.0%) |
| 55 to 59 Years | 76 (65.0%) | 0 (0.0%) |
| 60 to 64 Years | 21 (38.9%) | 0 (0.0%) |
| 65 to 74 Years | 120 (30.2%) | 0 (0.0%) |
| 75 Years and over | 0 (0.0%) | 0 (0.0%) |
| Total | 703 (56.9%) | 51 (7.3%) |
Employment Status by Educational Attainment in West Hills
According to labor force statistics for West Hills, 84.6% of individuals (500) out of the total population between 25 and 64 years of age (591) are in the labor force, with 8.2% or 41 of them being unemployed. The group with the highest labor force participation rate are those with the educational attainment of college / associate degree, with 100.0% or 134 individuals in the labor force. Within the labor force, individuals with high school diploma education have the highest percentage of unemployment, with 27.3% or 41 of them being unemployed.
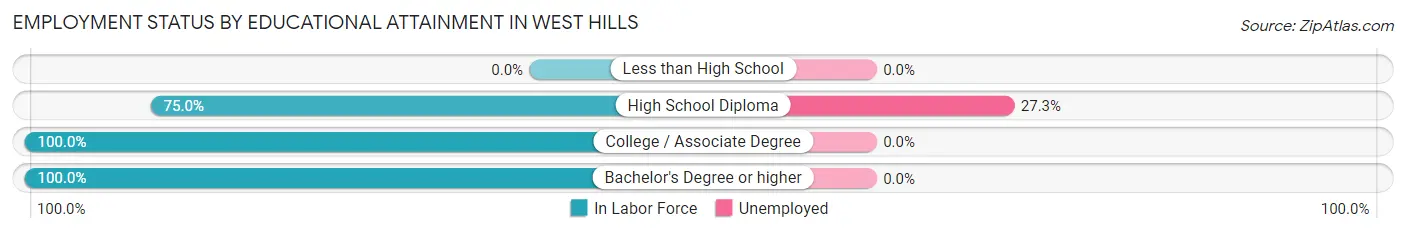
| Educational Attainment | In Labor Force | Unemployed |
| Less than High School | 0 (0.0%) | 0 (0.0%) |
| High School Diploma | 150 (75.0%) | 55 (27.3%) |
| College / Associate Degree | 134 (100.0%) | 0 (0.0%) |
| Bachelor's Degree or higher | 216 (100.0%) | 0 (0.0%) |
| Total | 500 (84.6%) | 48 (8.2%) |
Employment Occupations by Sex in West Hills
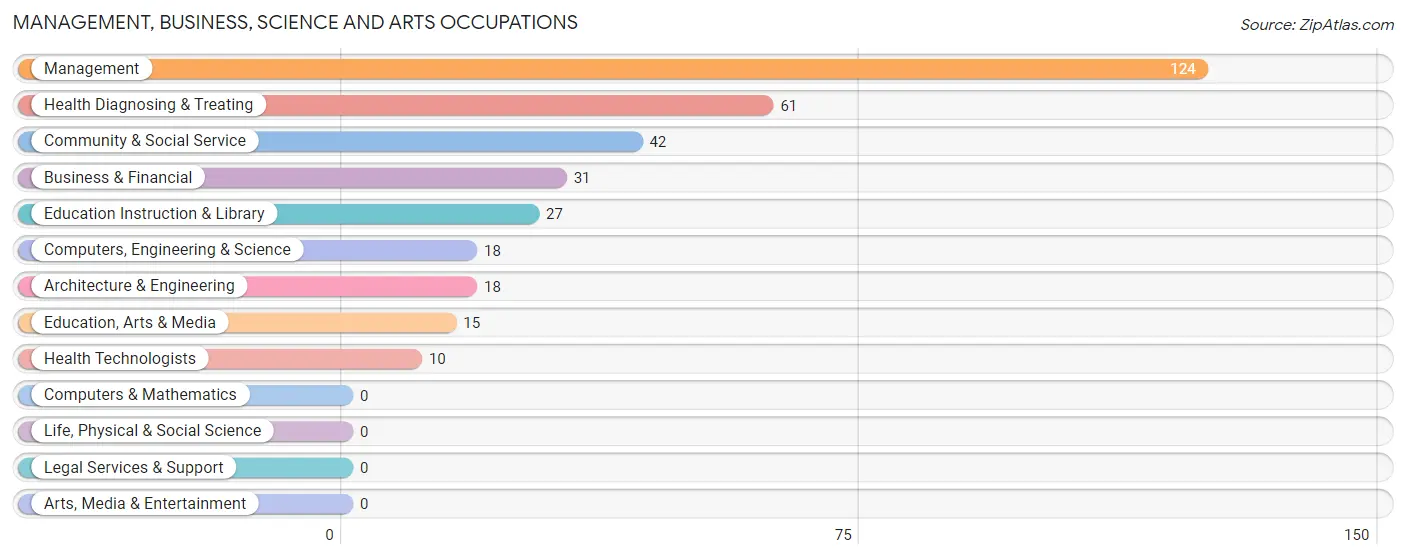
Management, Business, Science and Arts Occupations
The most common Management, Business, Science and Arts occupations in West Hills are Management (124 | 19.0%), Health Diagnosing & Treating (61 | 9.4%), Community & Social Service (42 | 6.4%), Business & Financial (31 | 4.8%), and Education Instruction & Library (27 | 4.1%).
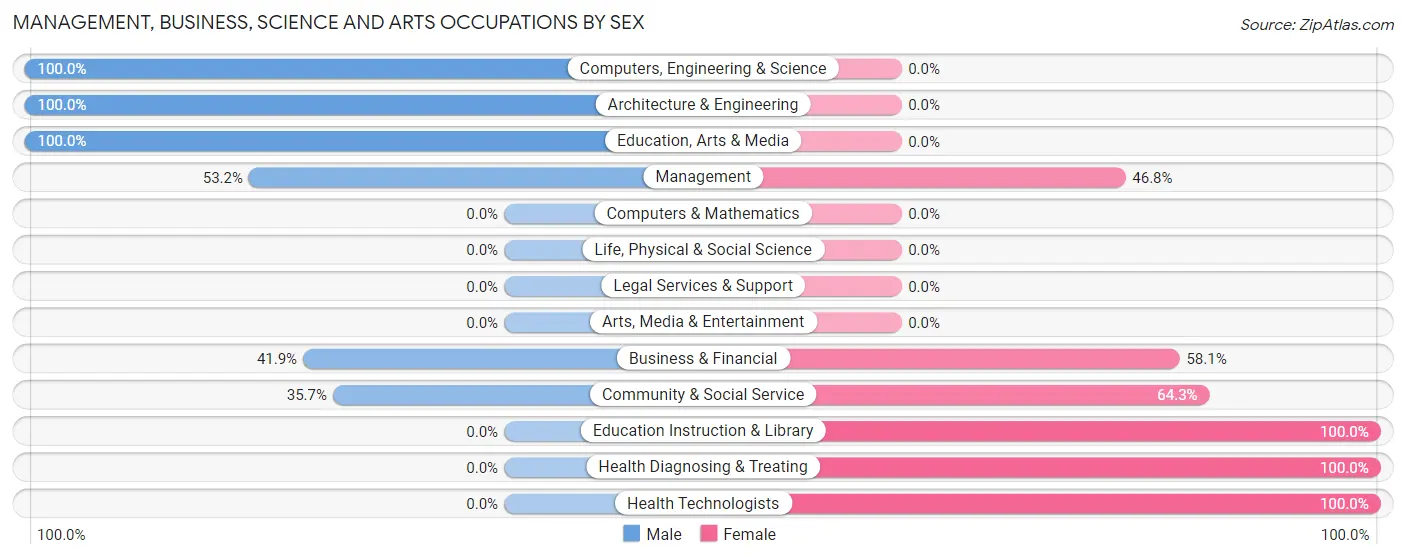
Management, Business, Science and Arts Occupations by Sex
Within the Management, Business, Science and Arts occupations in West Hills, the most male-oriented occupations are Computers, Engineering & Science (100.0%), Architecture & Engineering (100.0%), and Education, Arts & Media (100.0%), while the most female-oriented occupations are Education Instruction & Library (100.0%), Health Diagnosing & Treating (100.0%), and Health Technologists (100.0%).
| Occupation | Male | Female |
| Management | 66 (53.2%) | 58 (46.8%) |
| Business & Financial | 13 (41.9%) | 18 (58.1%) |
| Computers, Engineering & Science | 18 (100.0%) | 0 (0.0%) |
| Computers & Mathematics | 0 (0.0%) | 0 (0.0%) |
| Architecture & Engineering | 18 (100.0%) | 0 (0.0%) |
| Life, Physical & Social Science | 0 (0.0%) | 0 (0.0%) |
| Community & Social Service | 15 (35.7%) | 27 (64.3%) |
| Education, Arts & Media | 15 (100.0%) | 0 (0.0%) |
| Legal Services & Support | 0 (0.0%) | 0 (0.0%) |
| Education Instruction & Library | 0 (0.0%) | 27 (100.0%) |
| Arts, Media & Entertainment | 0 (0.0%) | 0 (0.0%) |
| Health Diagnosing & Treating | 0 (0.0%) | 61 (100.0%) |
| Health Technologists | 0 (0.0%) | 10 (100.0%) |
| Total (Category) | 112 (40.6%) | 164 (59.4%) |
| Total (Overall) | 431 (66.1%) | 221 (33.9%) |
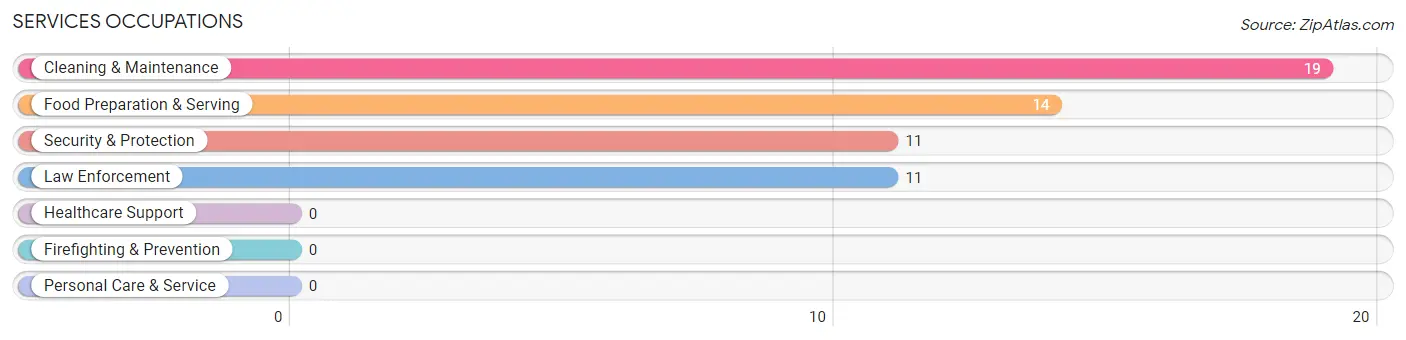
Services Occupations
The most common Services occupations in West Hills are Cleaning & Maintenance (19 | 2.9%), Food Preparation & Serving (14 | 2.1%), Security & Protection (11 | 1.7%), and Law Enforcement (11 | 1.7%).
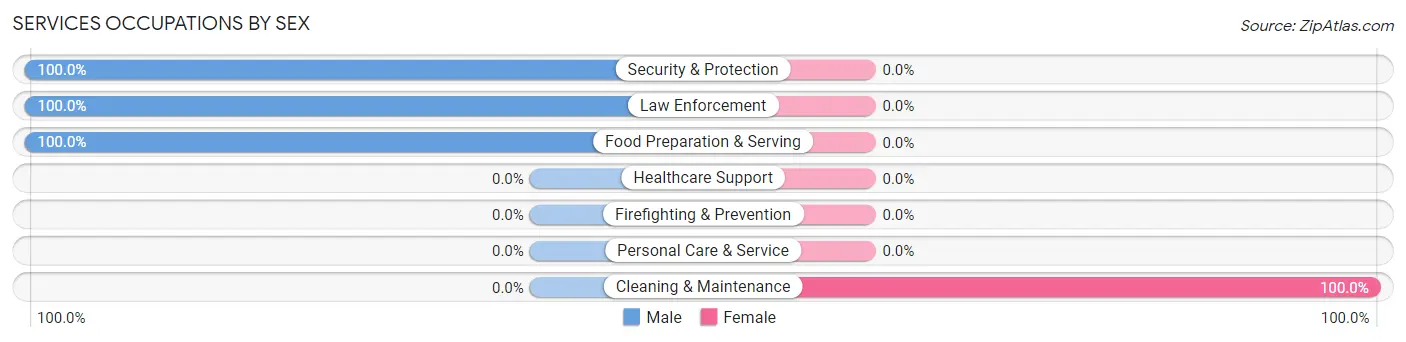
Services Occupations by Sex
| Occupation | Male | Female |
| Healthcare Support | 0 (0.0%) | 0 (0.0%) |
| Security & Protection | 11 (100.0%) | 0 (0.0%) |
| Firefighting & Prevention | 0 (0.0%) | 0 (0.0%) |
| Law Enforcement | 11 (100.0%) | 0 (0.0%) |
| Food Preparation & Serving | 14 (100.0%) | 0 (0.0%) |
| Cleaning & Maintenance | 0 (0.0%) | 19 (100.0%) |
| Personal Care & Service | 0 (0.0%) | 0 (0.0%) |
| Total (Category) | 25 (56.8%) | 19 (43.2%) |
| Total (Overall) | 431 (66.1%) | 221 (33.9%) |
Sales and Office Occupations
The most common Sales and Office occupations in West Hills are Office & Administration (38 | 5.8%), and Sales & Related (18 | 2.8%).
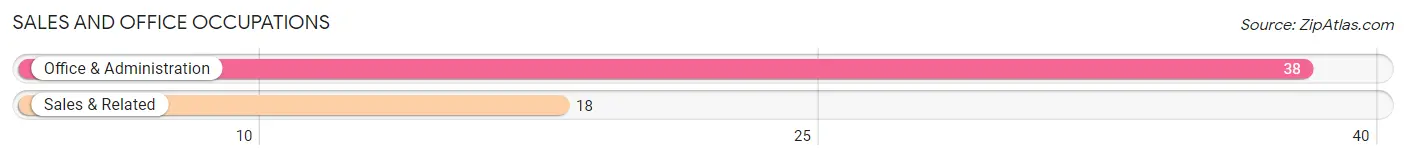
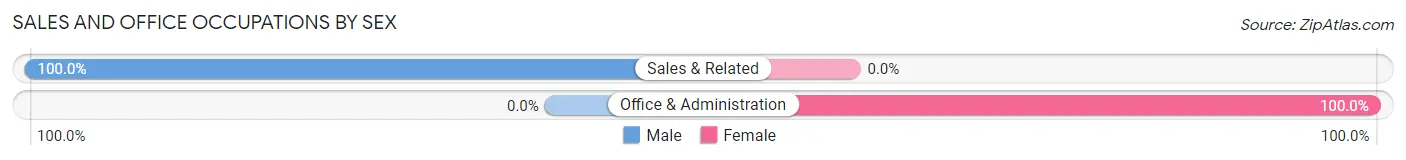
Sales and Office Occupations by Sex
| Occupation | Male | Female |
| Sales & Related | 18 (100.0%) | 0 (0.0%) |
| Office & Administration | 0 (0.0%) | 38 (100.0%) |
| Total (Category) | 18 (32.1%) | 38 (67.9%) |
| Total (Overall) | 431 (66.1%) | 221 (33.9%) |
Natural Resources, Construction and Maintenance Occupations
The most common Natural Resources, Construction and Maintenance occupations in West Hills are , and Construction & Extraction (21 | 3.2%).
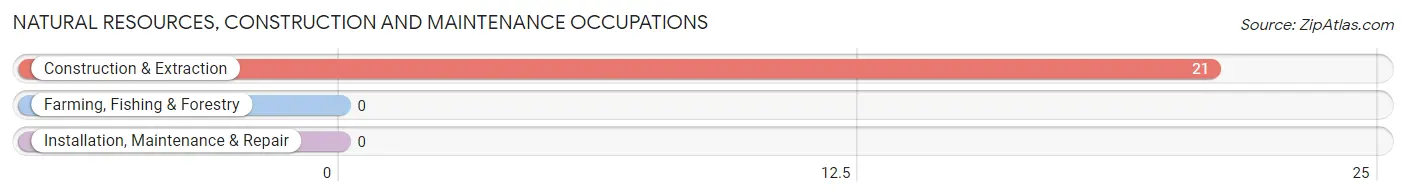
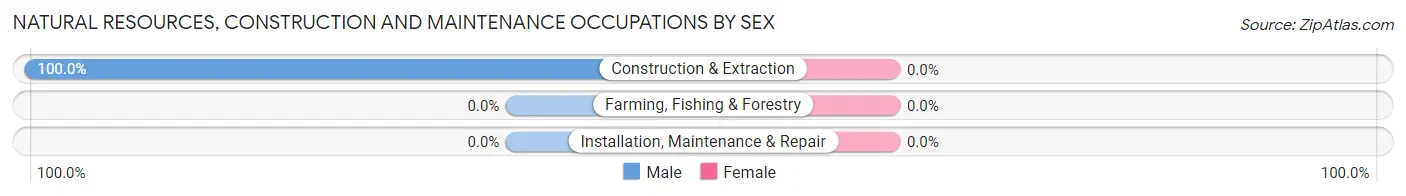
Natural Resources, Construction and Maintenance Occupations by Sex
| Occupation | Male | Female |
| Farming, Fishing & Forestry | 0 (0.0%) | 0 (0.0%) |
| Construction & Extraction | 21 (100.0%) | 0 (0.0%) |
| Installation, Maintenance & Repair | 0 (0.0%) | 0 (0.0%) |
| Total (Category) | 21 (100.0%) | 0 (0.0%) |
| Total (Overall) | 431 (66.1%) | 221 (33.9%) |
Production, Transportation and Moving Occupations
The most common Production, Transportation and Moving occupations in West Hills are Transportation (156 | 23.9%), Material Moving (79 | 12.1%), and Production (20 | 3.1%).
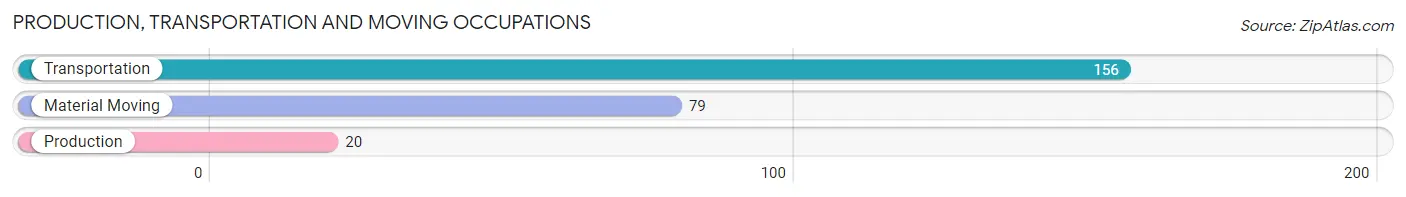
Production, Transportation and Moving Occupations by Sex
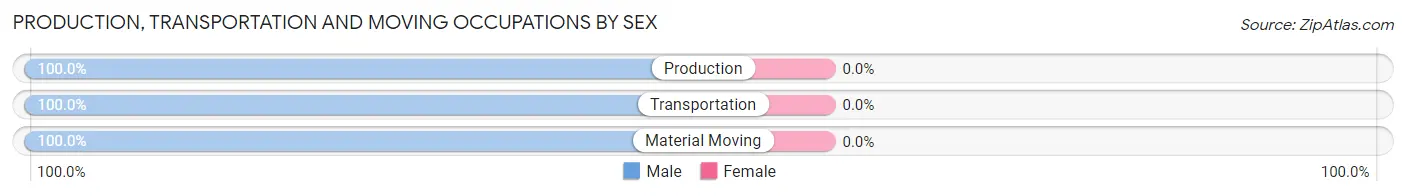
| Occupation | Male | Female |
| Production | 20 (100.0%) | 0 (0.0%) |
| Transportation | 156 (100.0%) | 0 (0.0%) |
| Material Moving | 79 (100.0%) | 0 (0.0%) |
| Total (Category) | 255 (100.0%) | 0 (0.0%) |
| Total (Overall) | 431 (66.1%) | 221 (33.9%) |
Employment Industries by Sex in West Hills
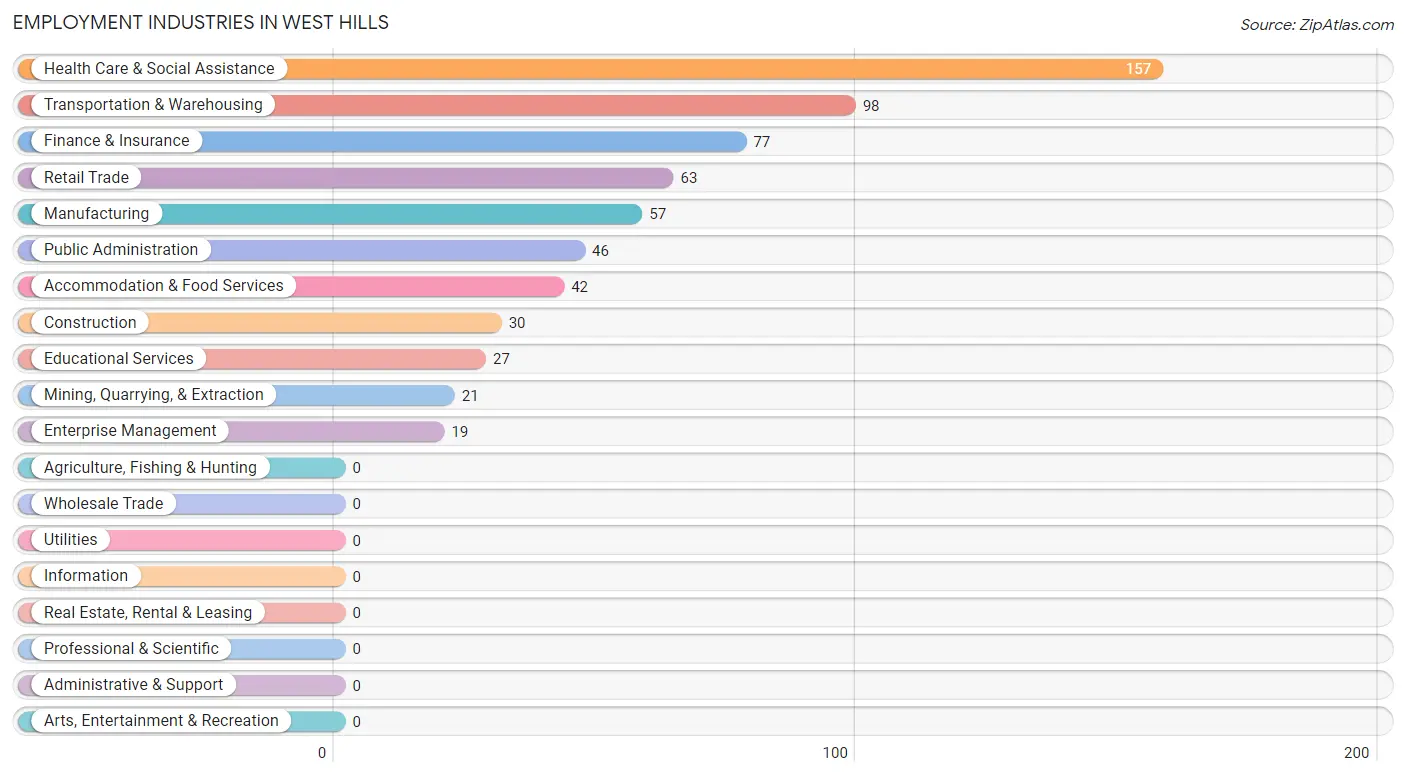
Employment Industries in West Hills
The major employment industries in West Hills include Health Care & Social Assistance (157 | 24.1%), Transportation & Warehousing (98 | 15.0%), Finance & Insurance (77 | 11.8%), Retail Trade (63 | 9.7%), and Manufacturing (57 | 8.7%).
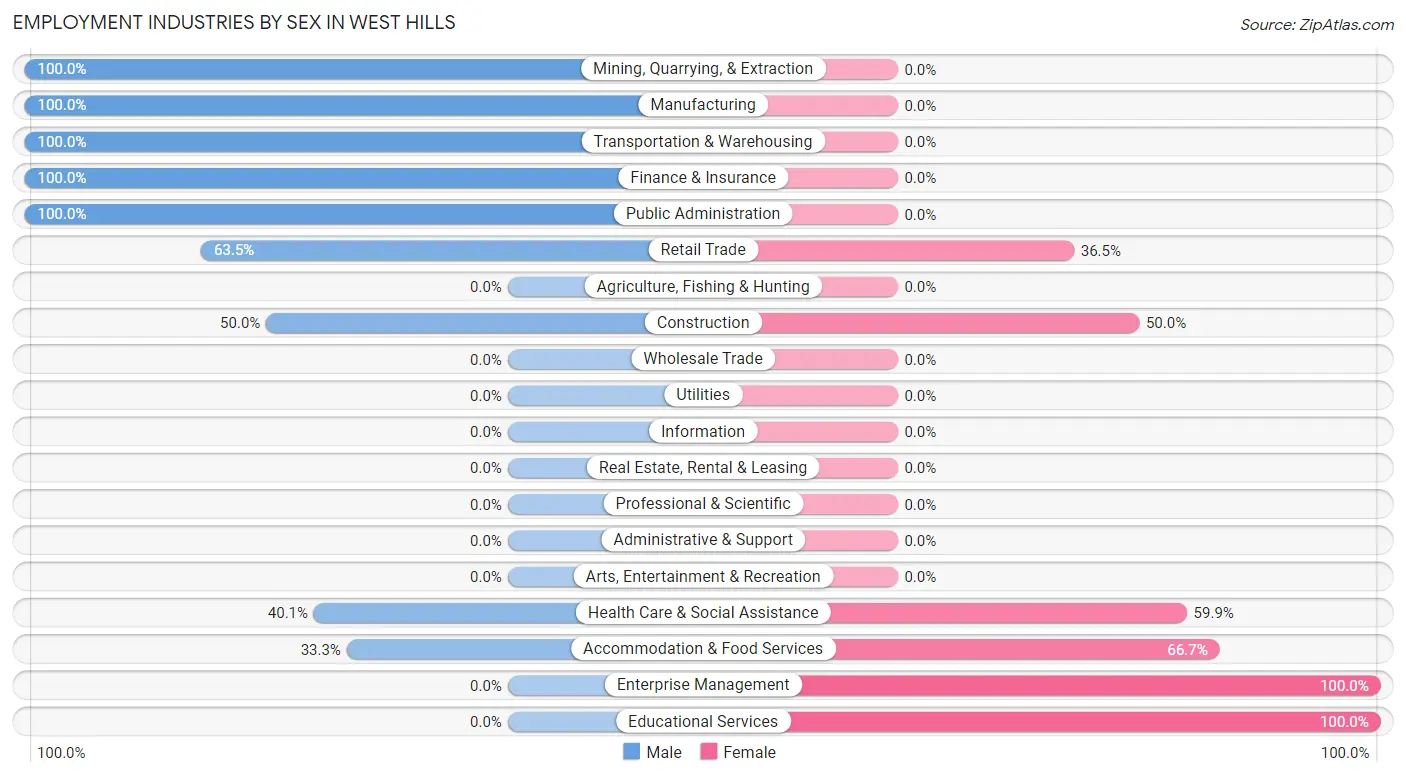
Employment Industries by Sex in West Hills
The West Hills industries that see more men than women are Mining, Quarrying, & Extraction (100.0%), Manufacturing (100.0%), and Transportation & Warehousing (100.0%), whereas the industries that tend to have a higher number of women are Enterprise Management (100.0%), Educational Services (100.0%), and Accommodation & Food Services (66.7%).
| Industry | Male | Female |
| Agriculture, Fishing & Hunting | 0 (0.0%) | 0 (0.0%) |
| Mining, Quarrying, & Extraction | 21 (100.0%) | 0 (0.0%) |
| Construction | 15 (50.0%) | 15 (50.0%) |
| Manufacturing | 57 (100.0%) | 0 (0.0%) |
| Wholesale Trade | 0 (0.0%) | 0 (0.0%) |
| Retail Trade | 40 (63.5%) | 23 (36.5%) |
| Transportation & Warehousing | 98 (100.0%) | 0 (0.0%) |
| Utilities | 0 (0.0%) | 0 (0.0%) |
| Information | 0 (0.0%) | 0 (0.0%) |
| Finance & Insurance | 77 (100.0%) | 0 (0.0%) |
| Real Estate, Rental & Leasing | 0 (0.0%) | 0 (0.0%) |
| Professional & Scientific | 0 (0.0%) | 0 (0.0%) |
| Enterprise Management | 0 (0.0%) | 19 (100.0%) |
| Administrative & Support | 0 (0.0%) | 0 (0.0%) |
| Educational Services | 0 (0.0%) | 27 (100.0%) |
| Health Care & Social Assistance | 63 (40.1%) | 94 (59.9%) |
| Arts, Entertainment & Recreation | 0 (0.0%) | 0 (0.0%) |
| Accommodation & Food Services | 14 (33.3%) | 28 (66.7%) |
| Public Administration | 46 (100.0%) | 0 (0.0%) |
| Total | 431 (66.1%) | 221 (33.9%) |
Education in West Hills
School Enrollment in West Hills
The most common levels of schooling among the 219 students in West Hills are middle school (99 | 45.2%), college / undergraduate (70 | 32.0%), and high school (37 | 16.9%).

| School Level | # Students | % Students |
| Nursery / Preschool | 0 | 0.0% |
| Kindergarten | 0 | 0.0% |
| Elementary School | 13 | 5.9% |
| Middle School | 99 | 45.2% |
| High School | 37 | 16.9% |
| College / Undergraduate | 70 | 32.0% |
| Graduate / Professional | 0 | 0.0% |
| Total | 219 | 100.0% |
School Enrollment by Age by Funding Source in West Hills
Out of a total of 219 students who are enrolled in schools in West Hills, 60 (27.4%) attend a private institution, while the remaining 159 (72.6%) are enrolled in public schools. The age group of 18 to 19 year olds has the highest likelihood of being enrolled in private schools, with 21 (100.0% in the age bracket) enrolled. Conversely, the age group of 5 to 9 year old has the lowest likelihood of being enrolled in a private school, with 13 (100.0% in the age bracket) attending a public institution.
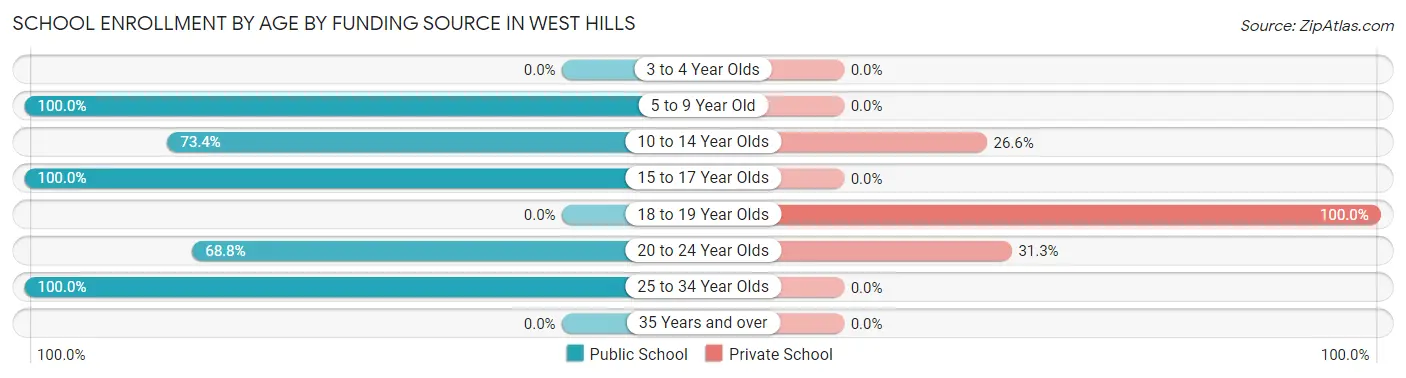
| Age Bracket | Public School | Private School |
| 3 to 4 Year Olds | 0 (0.0%) | 0 (0.0%) |
| 5 to 9 Year Old | 13 (100.0%) | 0 (0.0%) |
| 10 to 14 Year Olds | 80 (73.4%) | 29 (26.6%) |
| 15 to 17 Year Olds | 27 (100.0%) | 0 (0.0%) |
| 18 to 19 Year Olds | 0 (0.0%) | 21 (100.0%) |
| 20 to 24 Year Olds | 22 (68.8%) | 10 (31.2%) |
| 25 to 34 Year Olds | 17 (100.0%) | 0 (0.0%) |
| 35 Years and over | 0 (0.0%) | 0 (0.0%) |
| Total | 159 (72.6%) | 60 (27.4%) |
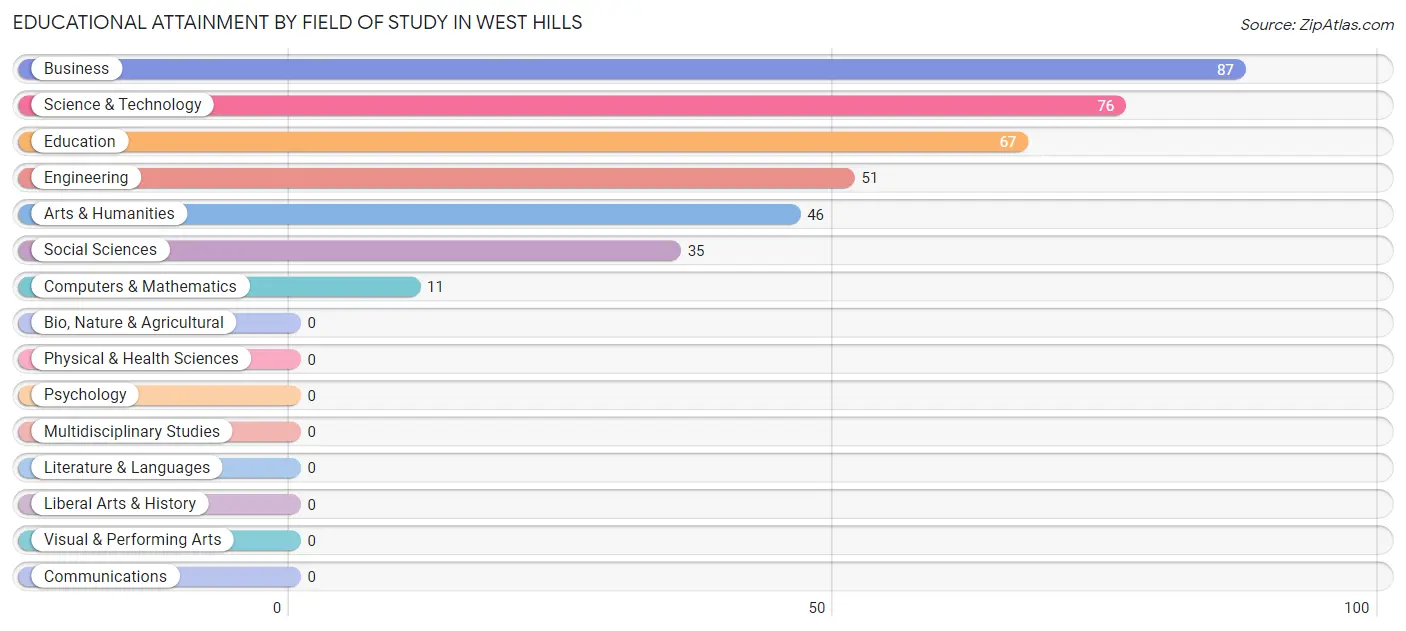
Educational Attainment by Field of Study in West Hills
Business (87 | 23.3%), science & technology (76 | 20.4%), education (67 | 18.0%), engineering (51 | 13.7%), and arts & humanities (46 | 12.3%) are the most common fields of study among 373 individuals in West Hills who have obtained a bachelor's degree or higher.
| Field of Study | # Graduates | % Graduates |
| Computers & Mathematics | 11 | 2.9% |
| Bio, Nature & Agricultural | 0 | 0.0% |
| Physical & Health Sciences | 0 | 0.0% |
| Psychology | 0 | 0.0% |
| Social Sciences | 35 | 9.4% |
| Engineering | 51 | 13.7% |
| Multidisciplinary Studies | 0 | 0.0% |
| Science & Technology | 76 | 20.4% |
| Business | 87 | 23.3% |
| Education | 67 | 18.0% |
| Literature & Languages | 0 | 0.0% |
| Liberal Arts & History | 0 | 0.0% |
| Visual & Performing Arts | 0 | 0.0% |
| Communications | 0 | 0.0% |
| Arts & Humanities | 46 | 12.3% |
| Total | 373 | 100.0% |
Transportation & Commute in West Hills
Vehicle Availability by Sex in West Hills
The most prevalent vehicle ownership categories in West Hills are males with 2 vehicles (159, accounting for 36.9%) and females with 2 vehicles (84, making up 72.0%).
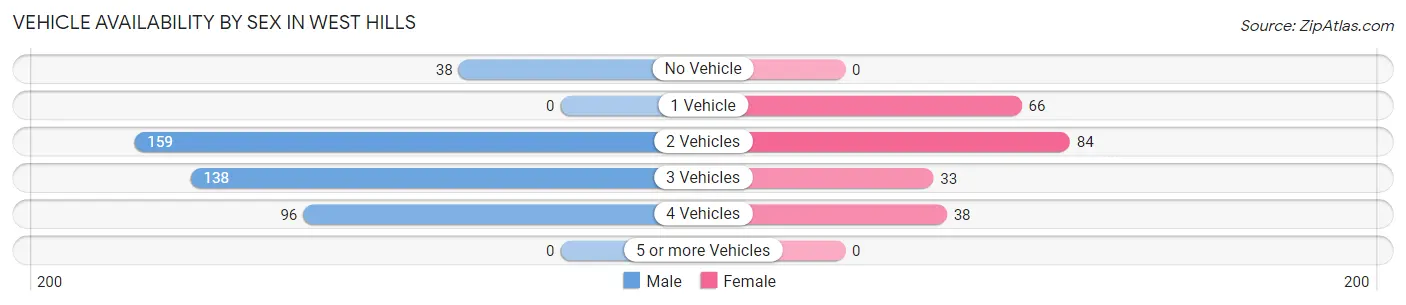
| Vehicles Available | Male | Female |
| No Vehicle | 38 (8.8%) | 0 (0.0%) |
| 1 Vehicle | 0 (0.0%) | 66 (29.9%) |
| 2 Vehicles | 159 (36.9%) | 84 (38.0%) |
| 3 Vehicles | 138 (32.0%) | 33 (14.9%) |
| 4 Vehicles | 96 (22.3%) | 38 (17.2%) |
| 5 or more Vehicles | 0 (0.0%) | 0 (0.0%) |
| Total | 431 (100.0%) | 221 (100.0%) |
Commute Time in West Hills
The most frequently occuring commute durations in West Hills are 10 to 14 minutes (305 commuters, 46.8%), 30 to 34 minutes (89 commuters, 13.7%), and 5 to 9 minutes (84 commuters, 12.9%).
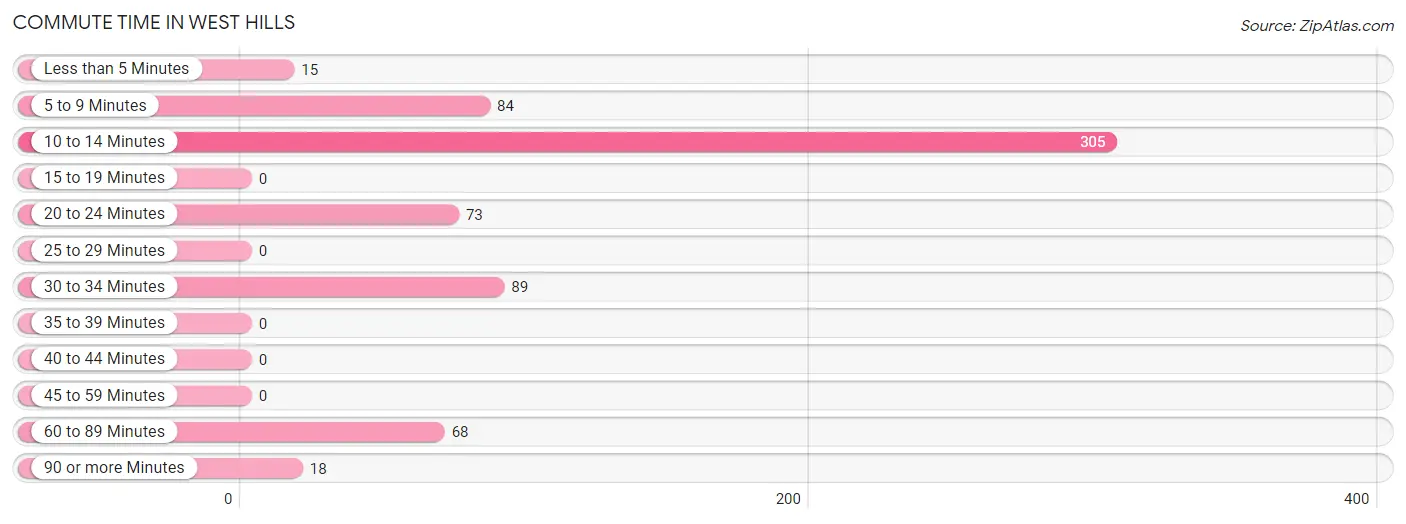
| Commute Time | # Commuters | % Commuters |
| Less than 5 Minutes | 15 | 2.3% |
| 5 to 9 Minutes | 84 | 12.9% |
| 10 to 14 Minutes | 305 | 46.8% |
| 15 to 19 Minutes | 0 | 0.0% |
| 20 to 24 Minutes | 73 | 11.2% |
| 25 to 29 Minutes | 0 | 0.0% |
| 30 to 34 Minutes | 89 | 13.7% |
| 35 to 39 Minutes | 0 | 0.0% |
| 40 to 44 Minutes | 0 | 0.0% |
| 45 to 59 Minutes | 0 | 0.0% |
| 60 to 89 Minutes | 68 | 10.4% |
| 90 or more Minutes | 18 | 2.8% |
Commute Time by Sex in West Hills
The most common commute times in West Hills are 10 to 14 minutes (248 commuters, 57.5%) for males and 60 to 89 minutes (68 commuters, 30.8%) for females.
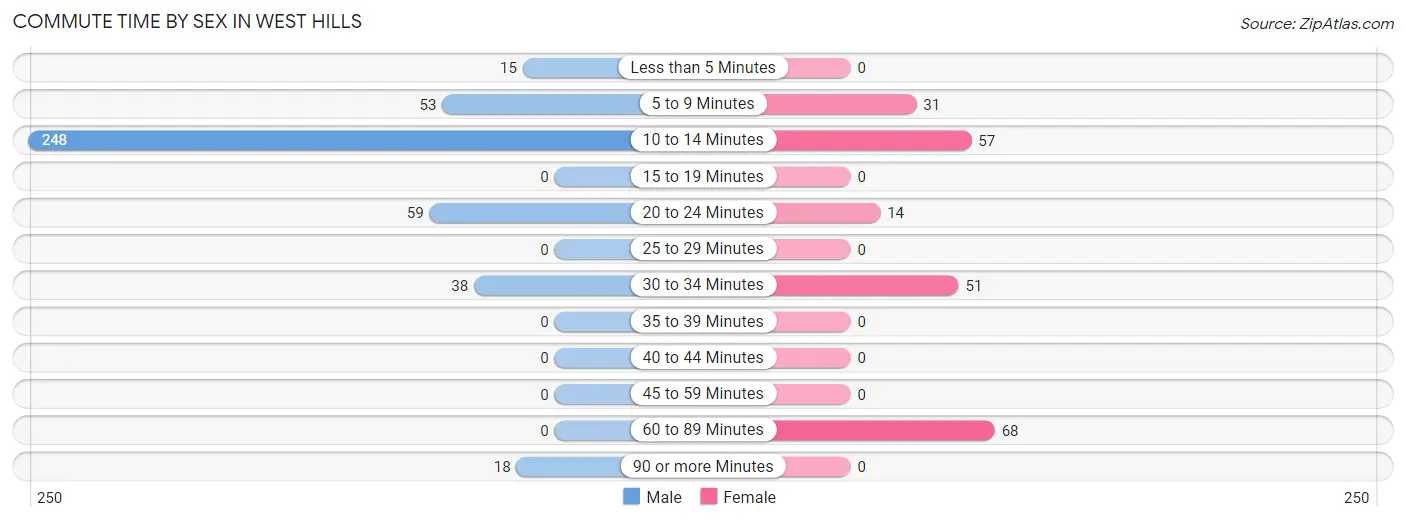
| Commute Time | Male | Female |
| Less than 5 Minutes | 15 (3.5%) | 0 (0.0%) |
| 5 to 9 Minutes | 53 (12.3%) | 31 (14.0%) |
| 10 to 14 Minutes | 248 (57.5%) | 57 (25.8%) |
| 15 to 19 Minutes | 0 (0.0%) | 0 (0.0%) |
| 20 to 24 Minutes | 59 (13.7%) | 14 (6.3%) |
| 25 to 29 Minutes | 0 (0.0%) | 0 (0.0%) |
| 30 to 34 Minutes | 38 (8.8%) | 51 (23.1%) |
| 35 to 39 Minutes | 0 (0.0%) | 0 (0.0%) |
| 40 to 44 Minutes | 0 (0.0%) | 0 (0.0%) |
| 45 to 59 Minutes | 0 (0.0%) | 0 (0.0%) |
| 60 to 89 Minutes | 0 (0.0%) | 68 (30.8%) |
| 90 or more Minutes | 18 (4.2%) | 0 (0.0%) |
Time of Departure to Work by Sex in West Hills
The most frequent times of departure to work in West Hills are 7:30 AM to 7:59 AM (85, 19.7%) for males and 6:30 AM to 6:59 AM (67, 30.3%) for females.
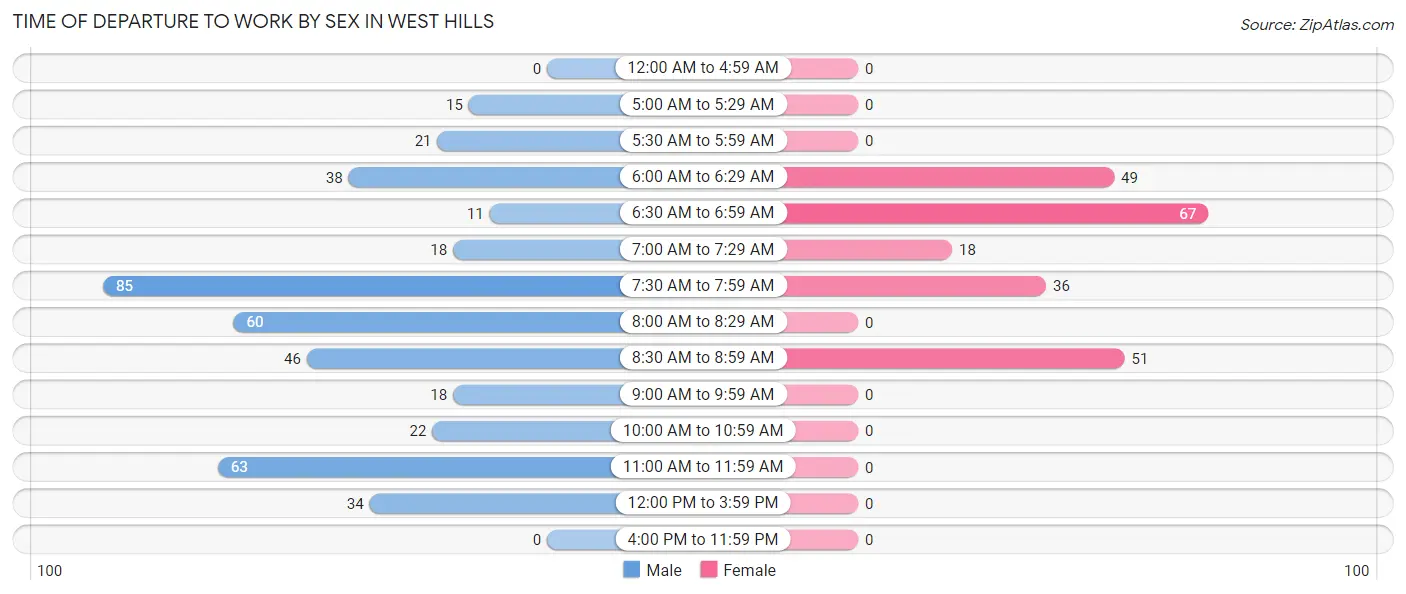
| Time of Departure | Male | Female |
| 12:00 AM to 4:59 AM | 0 (0.0%) | 0 (0.0%) |
| 5:00 AM to 5:29 AM | 15 (3.5%) | 0 (0.0%) |
| 5:30 AM to 5:59 AM | 21 (4.9%) | 0 (0.0%) |
| 6:00 AM to 6:29 AM | 38 (8.8%) | 49 (22.2%) |
| 6:30 AM to 6:59 AM | 11 (2.5%) | 67 (30.3%) |
| 7:00 AM to 7:29 AM | 18 (4.2%) | 18 (8.1%) |
| 7:30 AM to 7:59 AM | 85 (19.7%) | 36 (16.3%) |
| 8:00 AM to 8:29 AM | 60 (13.9%) | 0 (0.0%) |
| 8:30 AM to 8:59 AM | 46 (10.7%) | 51 (23.1%) |
| 9:00 AM to 9:59 AM | 18 (4.2%) | 0 (0.0%) |
| 10:00 AM to 10:59 AM | 22 (5.1%) | 0 (0.0%) |
| 11:00 AM to 11:59 AM | 63 (14.6%) | 0 (0.0%) |
| 12:00 PM to 3:59 PM | 34 (7.9%) | 0 (0.0%) |
| 4:00 PM to 11:59 PM | 0 (0.0%) | 0 (0.0%) |
| Total | 431 (100.0%) | 221 (100.0%) |
Housing Occupancy in West Hills
Occupancy by Ownership in West Hills
Of the total 660 dwellings in West Hills, owner-occupied units account for 583 (88.3%), while renter-occupied units make up 77 (11.7%).
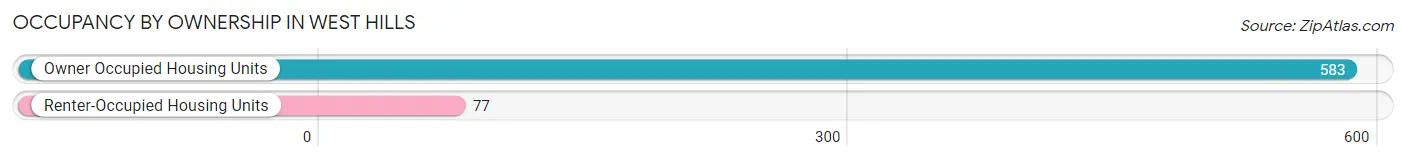
| Occupancy | # Housing Units | % Housing Units |
| Owner Occupied Housing Units | 583 | 88.3% |
| Renter-Occupied Housing Units | 77 | 11.7% |
| Total Occupied Housing Units | 660 | 100.0% |
Occupancy by Household Size in West Hills
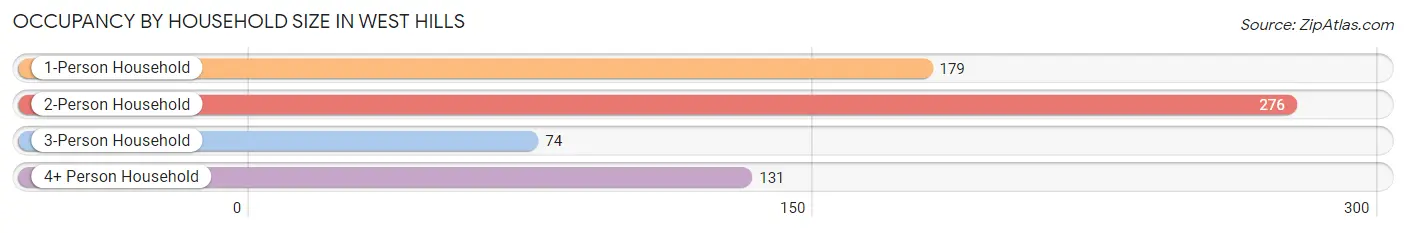
| Household Size | # Housing Units | % Housing Units |
| 1-Person Household | 179 | 27.1% |
| 2-Person Household | 276 | 41.8% |
| 3-Person Household | 74 | 11.2% |
| 4+ Person Household | 131 | 19.9% |
| Total Housing Units | 660 | 100.0% |
Occupancy by Ownership by Household Size in West Hills
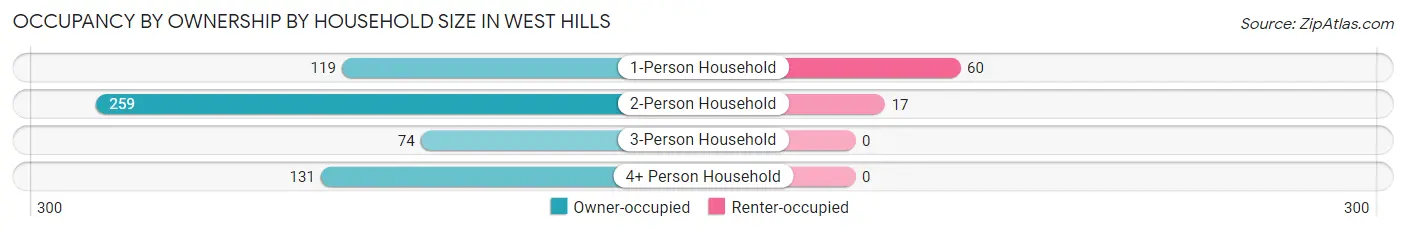
| Household Size | Owner-occupied | Renter-occupied |
| 1-Person Household | 119 (66.5%) | 60 (33.5%) |
| 2-Person Household | 259 (93.8%) | 17 (6.2%) |
| 3-Person Household | 74 (100.0%) | 0 (0.0%) |
| 4+ Person Household | 131 (100.0%) | 0 (0.0%) |
| Total Housing Units | 583 (88.3%) | 77 (11.7%) |
Occupancy by Educational Attainment in West Hills
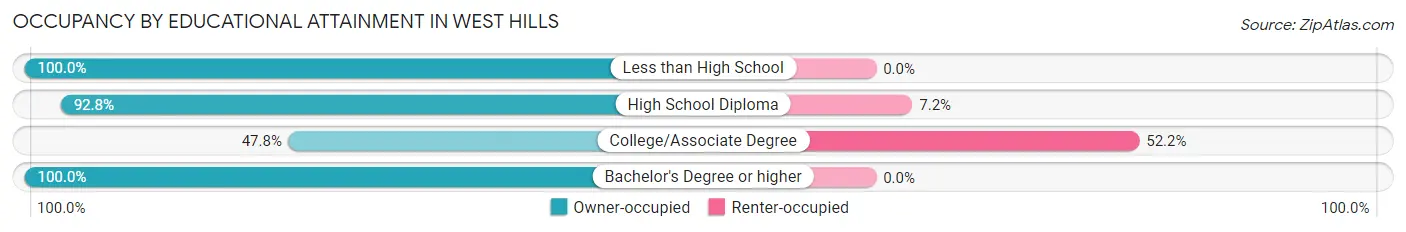
| Household Size | Owner-occupied | Renter-occupied |
| Less than High School | 77 (100.0%) | 0 (0.0%) |
| High School Diploma | 220 (92.8%) | 17 (7.2%) |
| College/Associate Degree | 55 (47.8%) | 60 (52.2%) |
| Bachelor's Degree or higher | 231 (100.0%) | 0 (0.0%) |
Occupancy by Age of Householder in West Hills
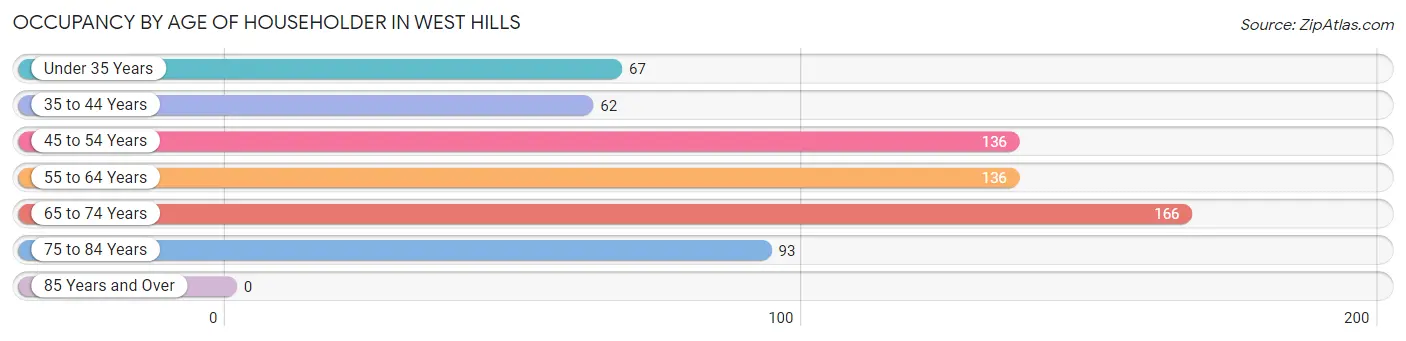
| Age Bracket | # Households | % Households |
| Under 35 Years | 67 | 10.2% |
| 35 to 44 Years | 62 | 9.4% |
| 45 to 54 Years | 136 | 20.6% |
| 55 to 64 Years | 136 | 20.6% |
| 65 to 74 Years | 166 | 25.2% |
| 75 to 84 Years | 93 | 14.1% |
| 85 Years and Over | 0 | 0.0% |
| Total | 660 | 100.0% |
Housing Finances in West Hills
Median Income by Occupancy in West Hills
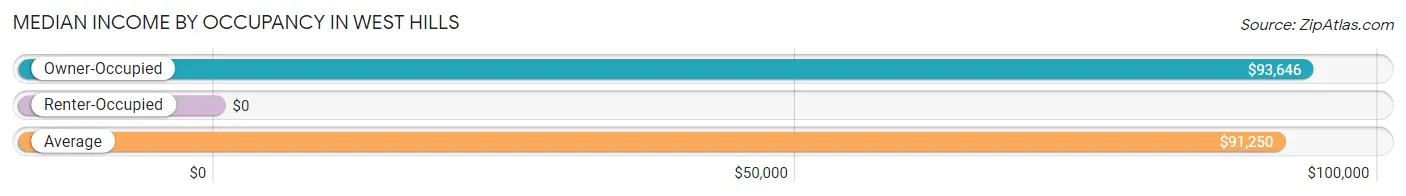
| Occupancy Type | # Households | Median Income |
| Owner-Occupied | 583 (88.3%) | $93,646 |
| Renter-Occupied | 77 (11.7%) | $0 |
| Average | 660 (100.0%) | $91,250 |
Occupancy by Householder Income Bracket in West Hills
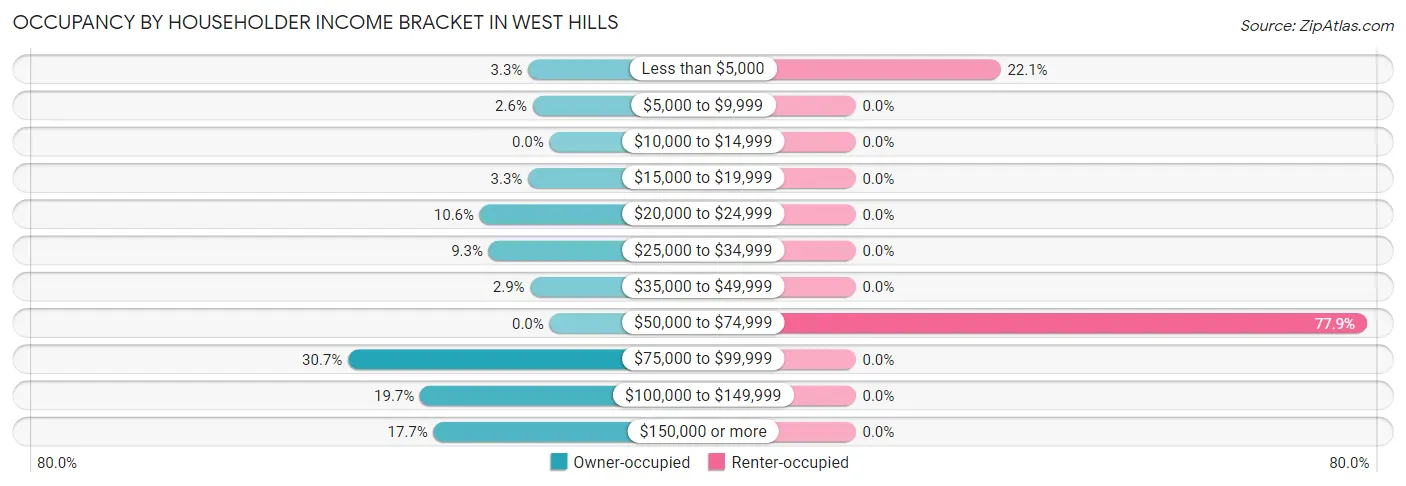
| Income Bracket | Owner-occupied | Renter-occupied |
| Less than $5,000 | 19 (3.3%) | 17 (22.1%) |
| $5,000 to $9,999 | 15 (2.6%) | 0 (0.0%) |
| $10,000 to $14,999 | 0 (0.0%) | 0 (0.0%) |
| $15,000 to $19,999 | 19 (3.3%) | 0 (0.0%) |
| $20,000 to $24,999 | 62 (10.6%) | 0 (0.0%) |
| $25,000 to $34,999 | 54 (9.3%) | 0 (0.0%) |
| $35,000 to $49,999 | 17 (2.9%) | 0 (0.0%) |
| $50,000 to $74,999 | 0 (0.0%) | 60 (77.9%) |
| $75,000 to $99,999 | 179 (30.7%) | 0 (0.0%) |
| $100,000 to $149,999 | 115 (19.7%) | 0 (0.0%) |
| $150,000 or more | 103 (17.7%) | 0 (0.0%) |
| Total | 583 (100.0%) | 77 (100.0%) |
Monthly Housing Cost Tiers in West Hills
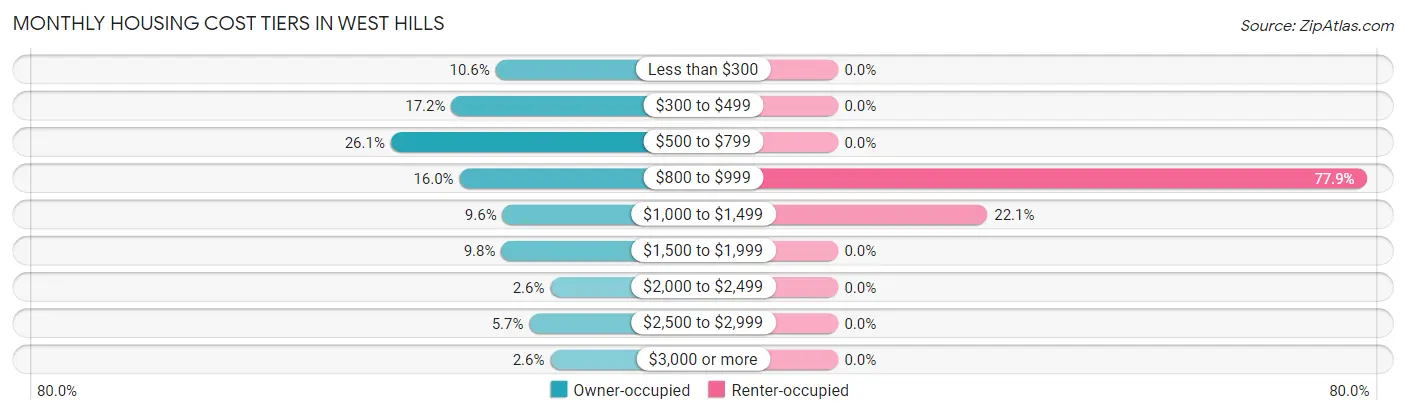
| Monthly Cost | Owner-occupied | Renter-occupied |
| Less than $300 | 62 (10.6%) | 0 (0.0%) |
| $300 to $499 | 100 (17.2%) | 0 (0.0%) |
| $500 to $799 | 152 (26.1%) | 0 (0.0%) |
| $800 to $999 | 93 (16.0%) | 60 (77.9%) |
| $1,000 to $1,499 | 56 (9.6%) | 17 (22.1%) |
| $1,500 to $1,999 | 57 (9.8%) | 0 (0.0%) |
| $2,000 to $2,499 | 15 (2.6%) | 0 (0.0%) |
| $2,500 to $2,999 | 33 (5.7%) | 0 (0.0%) |
| $3,000 or more | 15 (2.6%) | 0 (0.0%) |
| Total | 583 (100.0%) | 77 (100.0%) |
Physical Housing Characteristics in West Hills
Housing Structures in West Hills
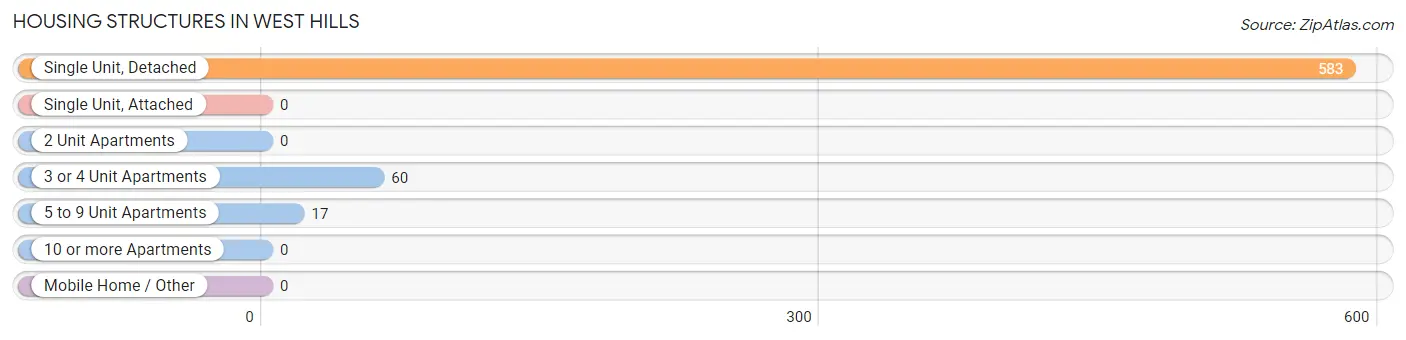
| Structure Type | # Housing Units | % Housing Units |
| Single Unit, Detached | 583 | 88.3% |
| Single Unit, Attached | 0 | 0.0% |
| 2 Unit Apartments | 0 | 0.0% |
| 3 or 4 Unit Apartments | 60 | 9.1% |
| 5 to 9 Unit Apartments | 17 | 2.6% |
| 10 or more Apartments | 0 | 0.0% |
| Mobile Home / Other | 0 | 0.0% |
| Total | 660 | 100.0% |
Housing Structures by Occupancy in West Hills
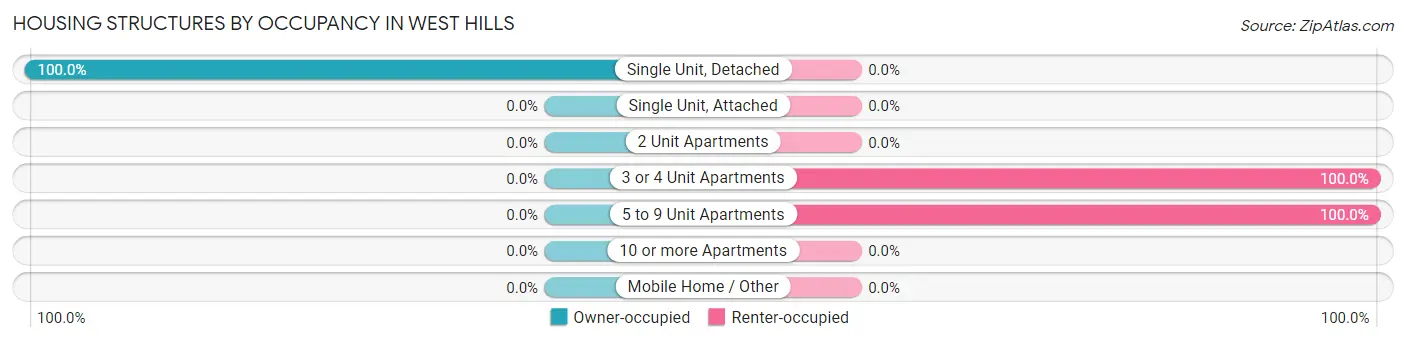
| Structure Type | Owner-occupied | Renter-occupied |
| Single Unit, Detached | 583 (100.0%) | 0 (0.0%) |
| Single Unit, Attached | 0 (0.0%) | 0 (0.0%) |
| 2 Unit Apartments | 0 (0.0%) | 0 (0.0%) |
| 3 or 4 Unit Apartments | 0 (0.0%) | 60 (100.0%) |
| 5 to 9 Unit Apartments | 0 (0.0%) | 17 (100.0%) |
| 10 or more Apartments | 0 (0.0%) | 0 (0.0%) |
| Mobile Home / Other | 0 (0.0%) | 0 (0.0%) |
| Total | 583 (88.3%) | 77 (11.7%) |
Housing Structures by Number of Rooms in West Hills
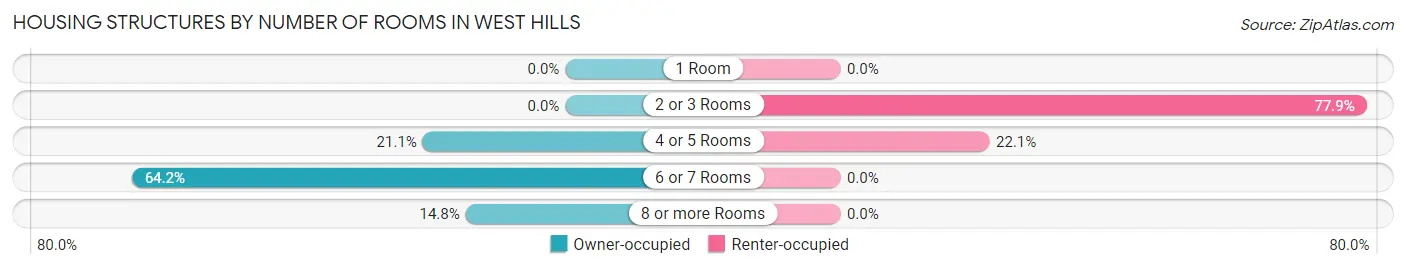
| Number of Rooms | Owner-occupied | Renter-occupied |
| 1 Room | 0 (0.0%) | 0 (0.0%) |
| 2 or 3 Rooms | 0 (0.0%) | 60 (77.9%) |
| 4 or 5 Rooms | 123 (21.1%) | 17 (22.1%) |
| 6 or 7 Rooms | 374 (64.1%) | 0 (0.0%) |
| 8 or more Rooms | 86 (14.7%) | 0 (0.0%) |
| Total | 583 (100.0%) | 77 (100.0%) |
Housing Structure by Heating Type in West Hills
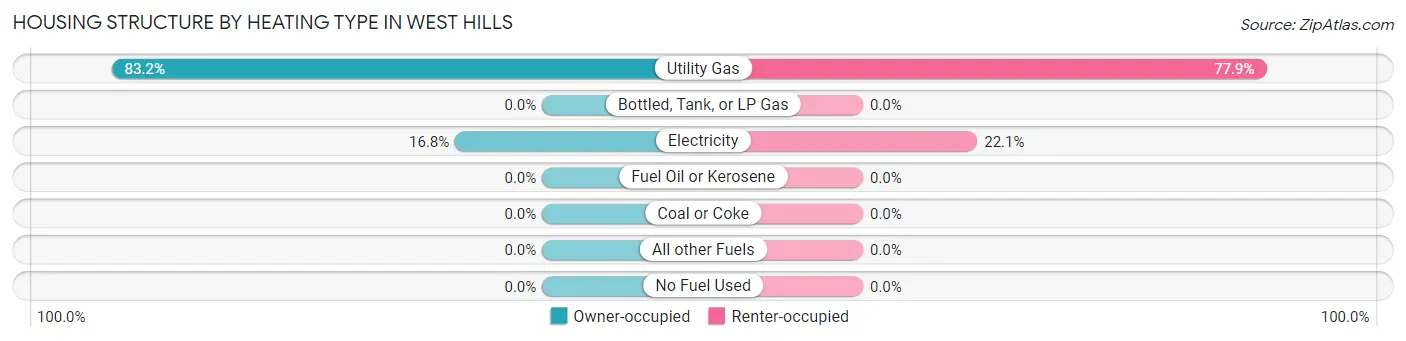
| Heating Type | Owner-occupied | Renter-occupied |
| Utility Gas | 485 (83.2%) | 60 (77.9%) |
| Bottled, Tank, or LP Gas | 0 (0.0%) | 0 (0.0%) |
| Electricity | 98 (16.8%) | 17 (22.1%) |
| Fuel Oil or Kerosene | 0 (0.0%) | 0 (0.0%) |
| Coal or Coke | 0 (0.0%) | 0 (0.0%) |
| All other Fuels | 0 (0.0%) | 0 (0.0%) |
| No Fuel Used | 0 (0.0%) | 0 (0.0%) |
| Total | 583 (100.0%) | 77 (100.0%) |
Household Vehicle Usage in West Hills
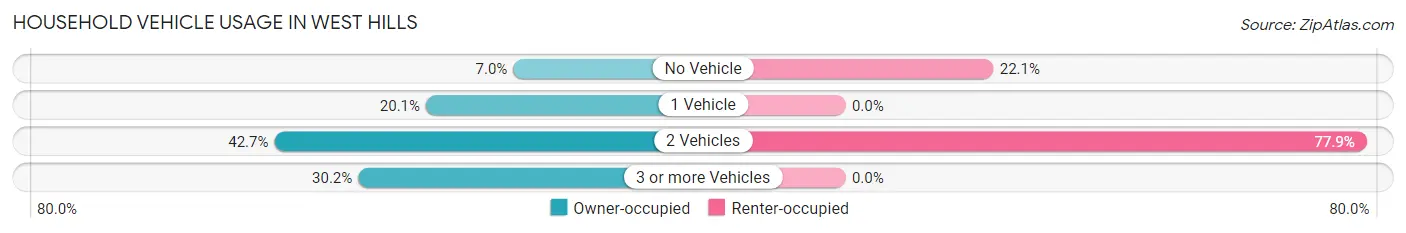
| Vehicles per Household | Owner-occupied | Renter-occupied |
| No Vehicle | 41 (7.0%) | 17 (22.1%) |
| 1 Vehicle | 117 (20.1%) | 0 (0.0%) |
| 2 Vehicles | 249 (42.7%) | 60 (77.9%) |
| 3 or more Vehicles | 176 (30.2%) | 0 (0.0%) |
| Total | 583 (100.0%) | 77 (100.0%) |
Real Estate & Mortgages in West Hills
Real Estate and Mortgage Overview in West Hills
| Characteristic | Without Mortgage | With Mortgage |
| Housing Units | 376 | 207 |
| Median Property Value | $185,400 | $192,300 |
| Median Household Income | - | - |
| Monthly Housing Costs | $576 | $15 |
| Real Estate Taxes | $2,167 | $0 |
Property Value by Mortgage Status in West Hills
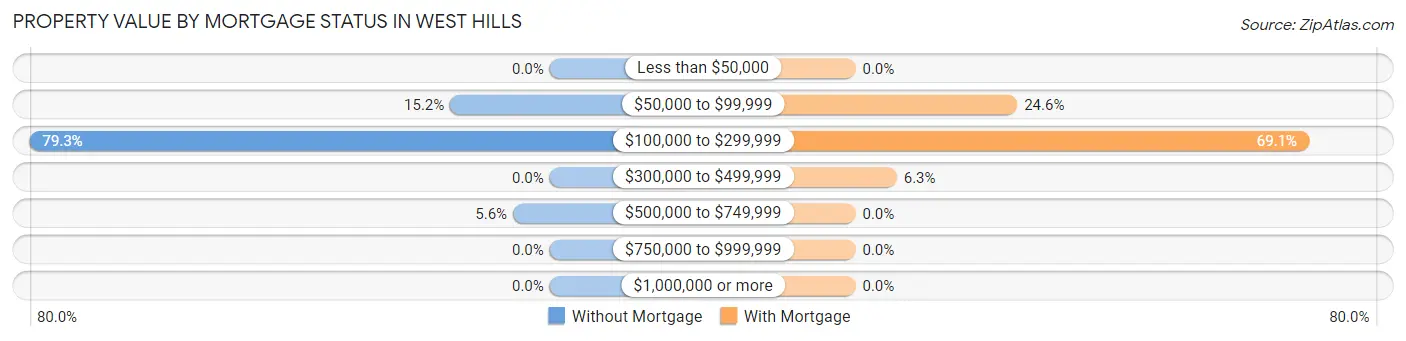
| Property Value | Without Mortgage | With Mortgage |
| Less than $50,000 | 0 (0.0%) | 0 (0.0%) |
| $50,000 to $99,999 | 57 (15.2%) | 51 (24.6%) |
| $100,000 to $299,999 | 298 (79.3%) | 143 (69.1%) |
| $300,000 to $499,999 | 0 (0.0%) | 13 (6.3%) |
| $500,000 to $749,999 | 21 (5.6%) | 0 (0.0%) |
| $750,000 to $999,999 | 0 (0.0%) | 0 (0.0%) |
| $1,000,000 or more | 0 (0.0%) | 0 (0.0%) |
| Total | 376 (100.0%) | 207 (100.0%) |
Household Income by Mortgage Status in West Hills
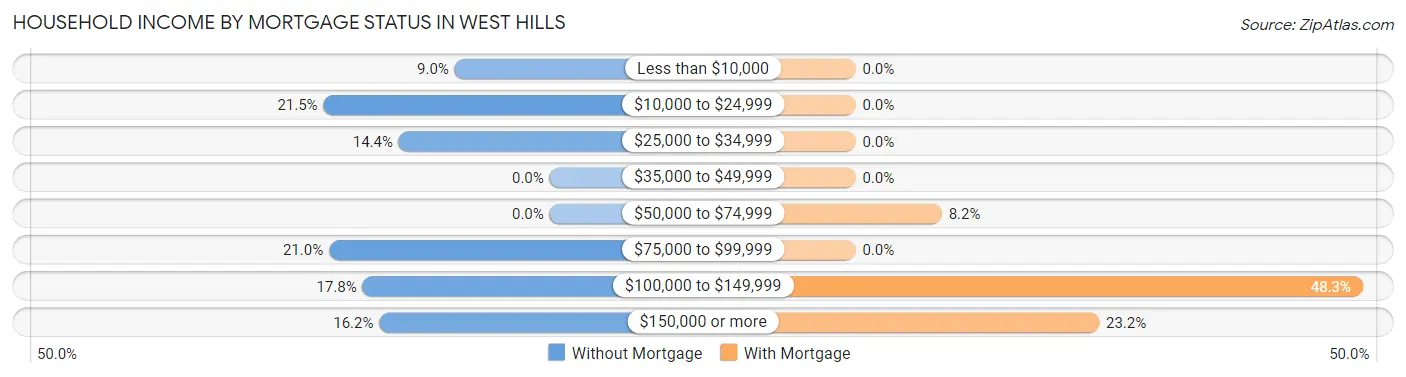
| Household Income | Without Mortgage | With Mortgage |
| Less than $10,000 | 34 (9.0%) | 0 (0.0%) |
| $10,000 to $24,999 | 81 (21.5%) | 0 (0.0%) |
| $25,000 to $34,999 | 54 (14.4%) | 0 (0.0%) |
| $35,000 to $49,999 | 0 (0.0%) | 0 (0.0%) |
| $50,000 to $74,999 | 0 (0.0%) | 17 (8.2%) |
| $75,000 to $99,999 | 79 (21.0%) | 0 (0.0%) |
| $100,000 to $149,999 | 67 (17.8%) | 100 (48.3%) |
| $150,000 or more | 61 (16.2%) | 48 (23.2%) |
| Total | 376 (100.0%) | 207 (100.0%) |
Property Value to Household Income Ratio in West Hills
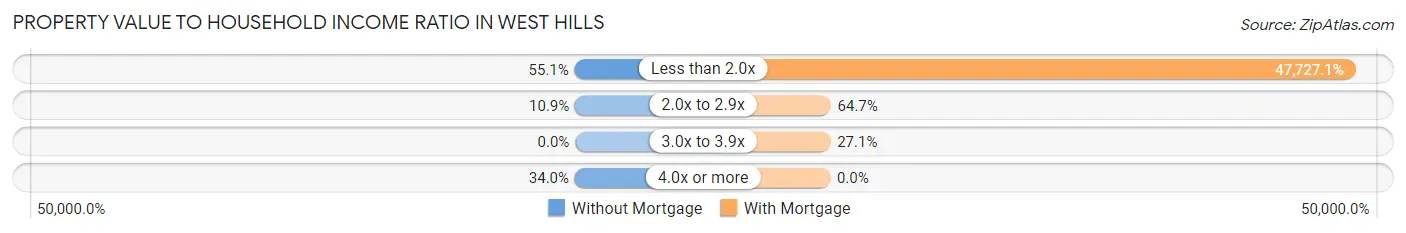
| Value-to-Income Ratio | Without Mortgage | With Mortgage |
| Less than 2.0x | 207 (55.0%) | 98,795 (47,727.1%) |
| 2.0x to 2.9x | 41 (10.9%) | 134 (64.7%) |
| 3.0x to 3.9x | 0 (0.0%) | 56 (27.1%) |
| 4.0x or more | 128 (34.0%) | 0 (0.0%) |
| Total | 376 (100.0%) | 207 (100.0%) |
Real Estate Taxes by Mortgage Status in West Hills
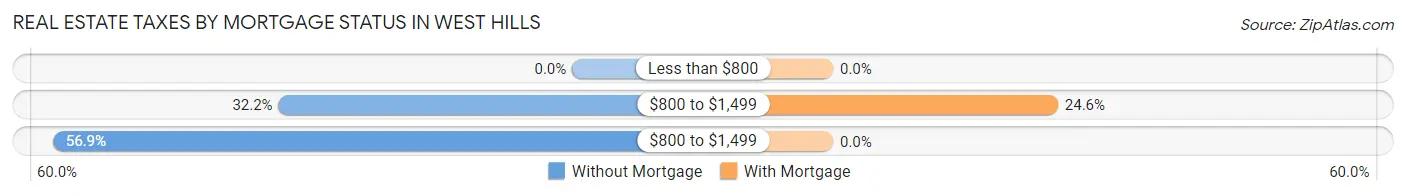
| Property Taxes | Without Mortgage | With Mortgage |
| Less than $800 | 0 (0.0%) | 0 (0.0%) |
| $800 to $1,499 | 121 (32.2%) | 51 (24.6%) |
| $800 to $1,499 | 214 (56.9%) | 0 (0.0%) |
| Total | 376 (100.0%) | 207 (100.0%) |
Health & Disability in West Hills
Health Insurance Coverage by Age in West Hills
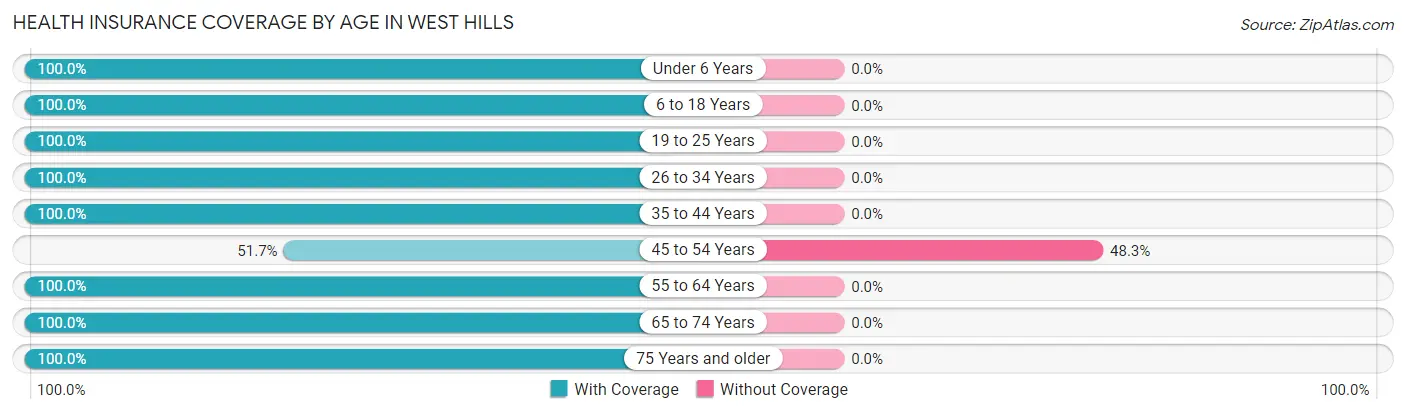
| Age Bracket | With Coverage | Without Coverage |
| Under 6 Years | 66 (100.0%) | 0 (0.0%) |
| 6 to 18 Years | 149 (100.0%) | 0 (0.0%) |
| 19 to 25 Years | 90 (100.0%) | 0 (0.0%) |
| 26 to 34 Years | 161 (100.0%) | 0 (0.0%) |
| 35 to 44 Years | 87 (100.0%) | 0 (0.0%) |
| 45 to 54 Years | 89 (51.7%) | 83 (48.3%) |
| 55 to 64 Years | 171 (100.0%) | 0 (0.0%) |
| 65 to 74 Years | 397 (100.0%) | 0 (0.0%) |
| 75 Years and older | 131 (100.0%) | 0 (0.0%) |
| Total | 1,341 (94.2%) | 83 (5.8%) |
Health Insurance Coverage by Citizenship Status in West Hills
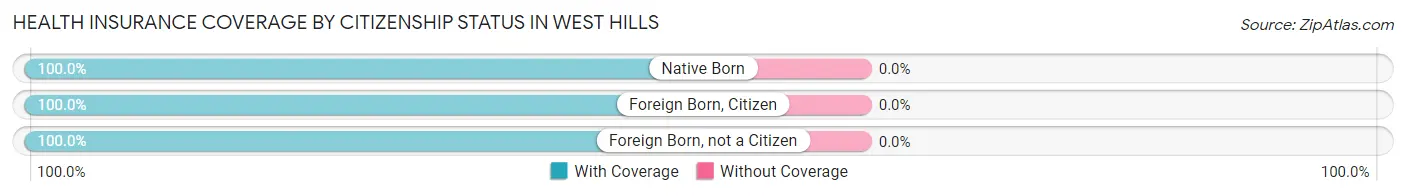
| Citizenship Status | With Coverage | Without Coverage |
| Native Born | 66 (100.0%) | 0 (0.0%) |
| Foreign Born, Citizen | 149 (100.0%) | 0 (0.0%) |
| Foreign Born, not a Citizen | 90 (100.0%) | 0 (0.0%) |
Health Insurance Coverage by Household Income in West Hills
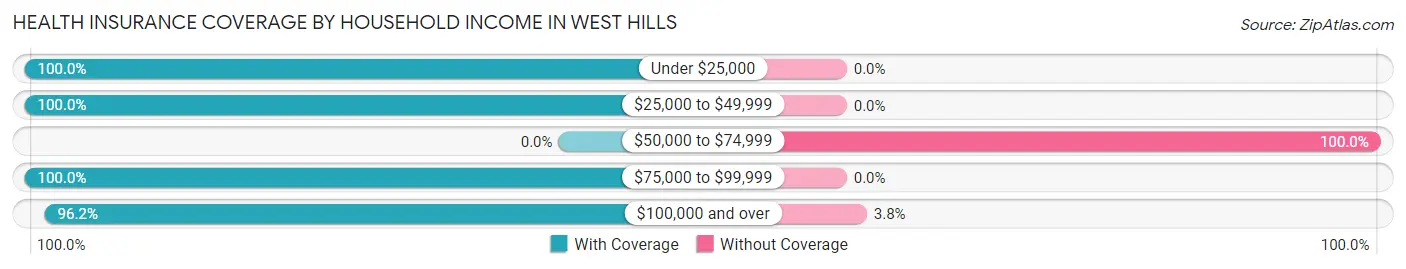
| Household Income | With Coverage | Without Coverage |
| Under $25,000 | 287 (100.0%) | 0 (0.0%) |
| $25,000 to $49,999 | 133 (100.0%) | 0 (0.0%) |
| $50,000 to $74,999 | 0 (0.0%) | 60 (100.0%) |
| $75,000 to $99,999 | 332 (100.0%) | 0 (0.0%) |
| $100,000 and over | 589 (96.2%) | 23 (3.8%) |
Public vs Private Health Insurance Coverage by Age in West Hills
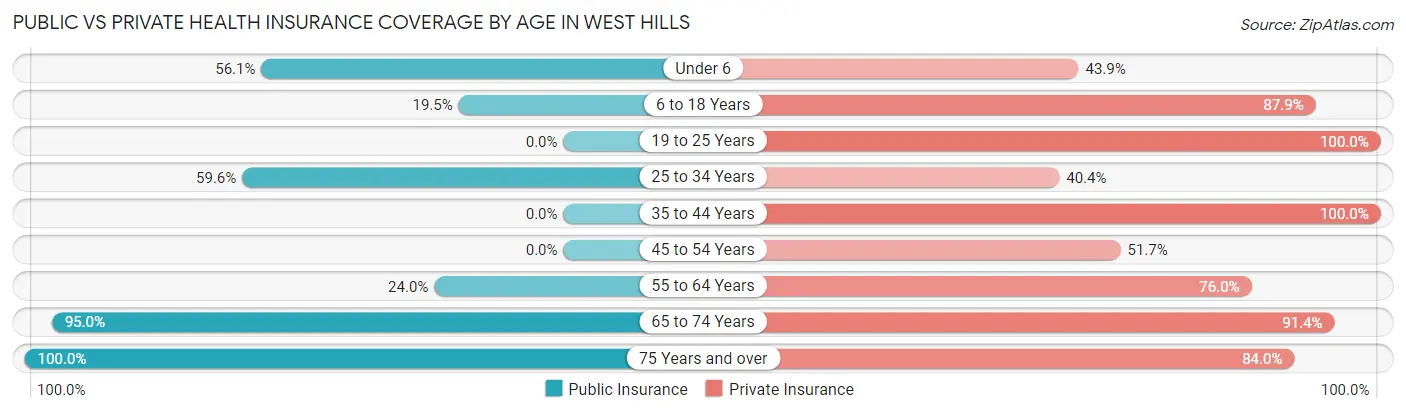
| Age Bracket | Public Insurance | Private Insurance |
| Under 6 | 37 (56.1%) | 29 (43.9%) |
| 6 to 18 Years | 29 (19.5%) | 131 (87.9%) |
| 19 to 25 Years | 0 (0.0%) | 90 (100.0%) |
| 25 to 34 Years | 96 (59.6%) | 65 (40.4%) |
| 35 to 44 Years | 0 (0.0%) | 87 (100.0%) |
| 45 to 54 Years | 0 (0.0%) | 89 (51.7%) |
| 55 to 64 Years | 41 (24.0%) | 130 (76.0%) |
| 65 to 74 Years | 377 (95.0%) | 363 (91.4%) |
| 75 Years and over | 131 (100.0%) | 110 (84.0%) |
| Total | 711 (49.9%) | 1,094 (76.8%) |
Disability Status by Sex by Age in West Hills
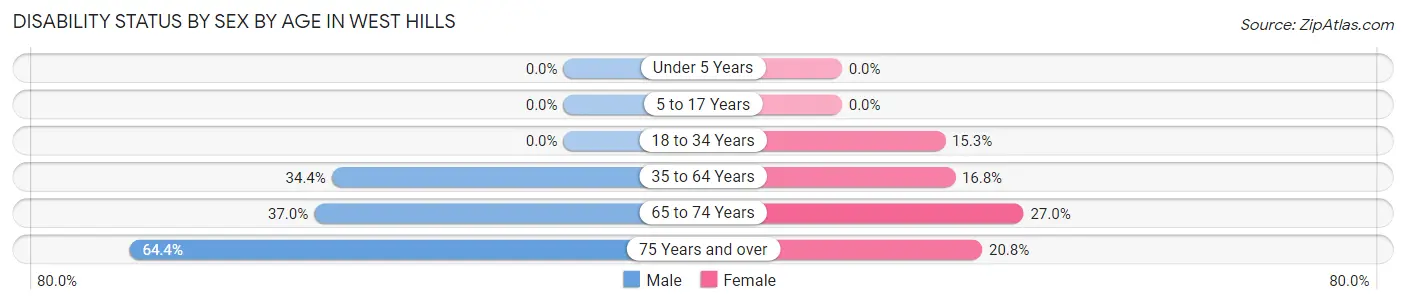
| Age Bracket | Male | Female |
| Under 5 Years | 0 (0.0%) | 0 (0.0%) |
| 5 to 17 Years | 0 (0.0%) | 0 (0.0%) |
| 18 to 34 Years | 0 (0.0%) | 17 (15.3%) |
| 35 to 64 Years | 64 (34.4%) | 41 (16.8%) |
| 65 to 74 Years | 77 (37.0%) | 51 (27.0%) |
| 75 Years and over | 38 (64.4%) | 15 (20.8%) |
Disability Class by Sex by Age in West Hills
Disability Class: Hearing Difficulty
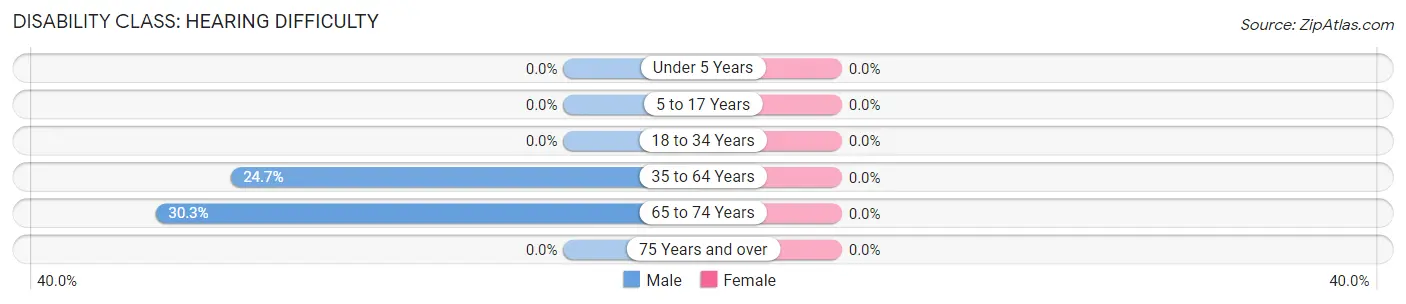
| Age Bracket | Male | Female |
| Under 5 Years | 0 (0.0%) | 0 (0.0%) |
| 5 to 17 Years | 0 (0.0%) | 0 (0.0%) |
| 18 to 34 Years | 0 (0.0%) | 0 (0.0%) |
| 35 to 64 Years | 46 (24.7%) | 0 (0.0%) |
| 65 to 74 Years | 63 (30.3%) | 0 (0.0%) |
| 75 Years and over | 0 (0.0%) | 0 (0.0%) |
Disability Class: Vision Difficulty
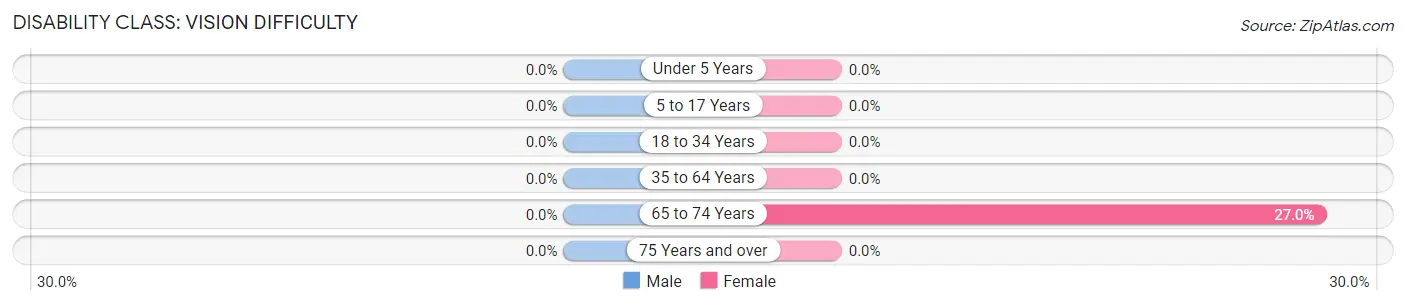
| Age Bracket | Male | Female |
| Under 5 Years | 0 (0.0%) | 0 (0.0%) |
| 5 to 17 Years | 0 (0.0%) | 0 (0.0%) |
| 18 to 34 Years | 0 (0.0%) | 0 (0.0%) |
| 35 to 64 Years | 0 (0.0%) | 0 (0.0%) |
| 65 to 74 Years | 0 (0.0%) | 51 (27.0%) |
| 75 Years and over | 0 (0.0%) | 0 (0.0%) |
Disability Class: Cognitive Difficulty
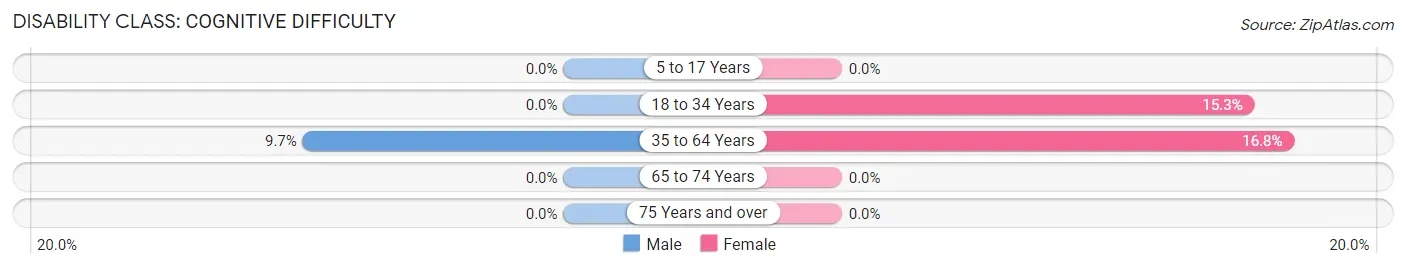
| Age Bracket | Male | Female |
| 5 to 17 Years | 0 (0.0%) | 0 (0.0%) |
| 18 to 34 Years | 0 (0.0%) | 17 (15.3%) |
| 35 to 64 Years | 18 (9.7%) | 41 (16.8%) |
| 65 to 74 Years | 0 (0.0%) | 0 (0.0%) |
| 75 Years and over | 0 (0.0%) | 0 (0.0%) |
Disability Class: Ambulatory Difficulty
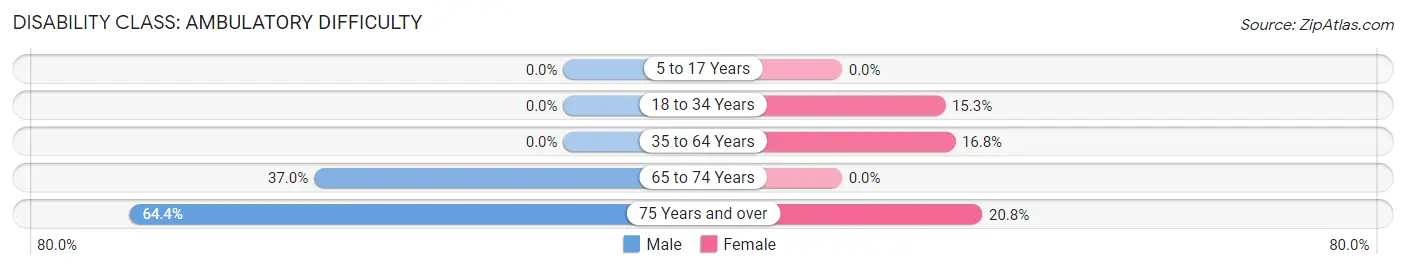
| Age Bracket | Male | Female |
| 5 to 17 Years | 0 (0.0%) | 0 (0.0%) |
| 18 to 34 Years | 0 (0.0%) | 17 (15.3%) |
| 35 to 64 Years | 0 (0.0%) | 41 (16.8%) |
| 65 to 74 Years | 77 (37.0%) | 0 (0.0%) |
| 75 Years and over | 38 (64.4%) | 15 (20.8%) |
Disability Class: Self-Care Difficulty
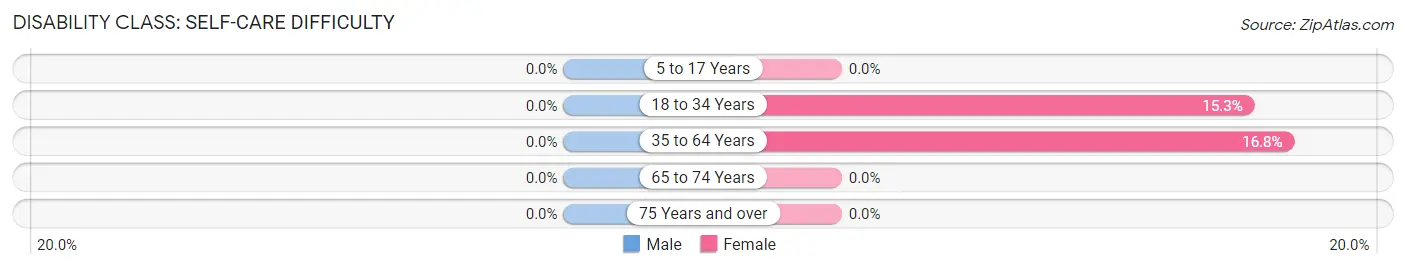
| Age Bracket | Male | Female |
| 5 to 17 Years | 0 (0.0%) | 0 (0.0%) |
| 18 to 34 Years | 0 (0.0%) | 17 (15.3%) |
| 35 to 64 Years | 0 (0.0%) | 41 (16.8%) |
| 65 to 74 Years | 0 (0.0%) | 0 (0.0%) |
| 75 Years and over | 0 (0.0%) | 0 (0.0%) |
Technology Access in West Hills
Computing Device Access in West Hills
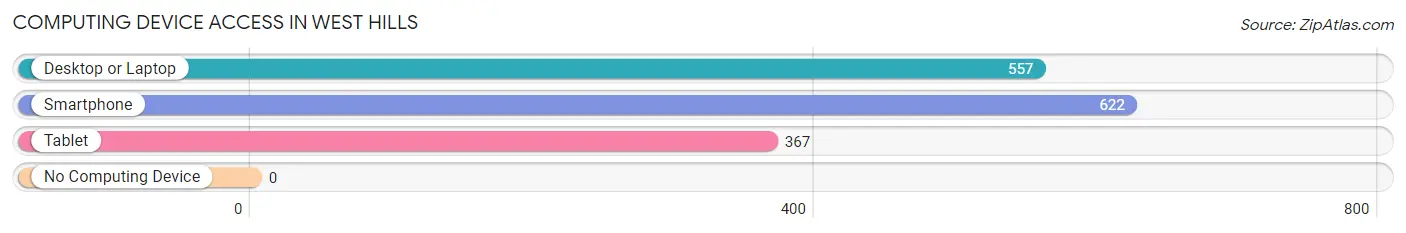
| Device Type | # Households | % Households |
| Desktop or Laptop | 557 | 84.4% |
| Smartphone | 622 | 94.2% |
| Tablet | 367 | 55.6% |
| No Computing Device | 0 | 0.0% |
| Total | 660 | 100.0% |
Internet Access in West Hills
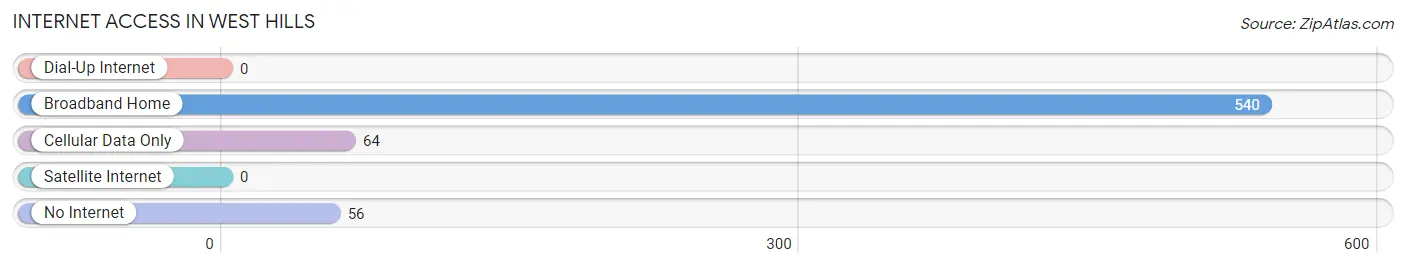
| Internet Type | # Households | % Households |
| Dial-Up Internet | 0 | 0.0% |
| Broadband Home | 540 | 81.8% |
| Cellular Data Only | 64 | 9.7% |
| Satellite Internet | 0 | 0.0% |
| No Internet | 56 | 8.5% |
| Total | 660 | 100.0% |
West Hills Summary
History
West Hills, Pennsylvania is a small borough located in Allegheny County, Pennsylvania. It is situated in the western part of the county, approximately 15 miles from the city of Pittsburgh. The area was first settled in the late 1700s by a group of German immigrants who were attracted to the area by its abundant natural resources. The area was originally known as “West Hill” and was part of the larger township of Moon. In 1845, the area was officially incorporated as the Borough of West Hills.
The early settlers of West Hills were primarily farmers and the area was known for its production of wheat, corn, and other grains. The area also had a thriving lumber industry, with several sawmills located in the area. In the late 1800s, the area began to experience a period of growth and development. The Pittsburgh and Lake Erie Railroad was built through the area in 1879, connecting West Hills to the larger cities of Pittsburgh and Cleveland. This allowed for the development of new industries and businesses in the area, including a brickyard, a flour mill, and a tannery.
In the early 1900s, West Hills experienced a period of rapid growth and development. The population of the borough increased from just over 500 in 1900 to over 1,500 by 1920. This growth was largely due to the influx of immigrants from Eastern Europe, who were attracted to the area by the availability of jobs in the steel and coal industries. The borough also experienced a period of industrialization, with several factories and mills being built in the area.
Geography
West Hills is located in the western part of Allegheny County, Pennsylvania. It is situated in the foothills of the Allegheny Mountains, approximately 15 miles from the city of Pittsburgh. The borough is bordered by the boroughs of Moon, Crescent, and Coraopolis to the north, the boroughs of Sewickley and Edgeworth to the east, the boroughs of Leetsdale and Leet Township to the south, and the boroughs of Findlay and Robinson Township to the west.
The terrain of West Hills is mostly hilly, with some flat areas in the valleys. The borough is located in the Allegheny Plateau, which is characterized by rolling hills and valleys. The highest point in the borough is located at an elevation of 1,068 feet, while the lowest point is located at an elevation of 890 feet. The borough is located in the Allegheny River watershed, with several small streams and creeks flowing through the area.
Economy
West Hills has a diverse economy, with a variety of industries and businesses located in the borough. The largest employers in the area are the healthcare and education sectors, with several hospitals and universities located in the area. Other major employers include manufacturing, retail, and service industries.
The borough is also home to several small businesses, including restaurants, shops, and other services. The borough is also home to several corporate headquarters, including the headquarters of the Pittsburgh Steelers football team.
Demographics
As of the 2010 census, the population of West Hills was 1,845. The racial makeup of the borough was 94.3% White, 2.2% African American, 0.3% Native American, 0.7% Asian, 0.1% Pacific Islander, and 2.4% from other races. Hispanic or Latino of any race were 1.3% of the population.
The median household income in West Hills was $50,945, and the median family income was $60,917. The per capita income for the borough was $25,945. About 5.3% of families and 7.2% of the population were below the poverty line, including 8.3% of those under age 18 and 4.2% of those age 65 or over.
Common Questions
What is Per Capita Income in West Hills?
Per Capita income in West Hills is $42,593.
What is the Median Family Income in West Hills?
Median Family Income in West Hills is $94,717.
What is the Median Household income in West Hills?
Median Household Income in West Hills is $91,250.
What is Inequality or Gini Index in West Hills?
Inequality or Gini Index in West Hills is 0.39.
What is the Total Population of West Hills?
Total Population of West Hills is 1,424.
What is the Total Male Population of West Hills?
Total Male Population of West Hills is 747.
What is the Total Female Population of West Hills?
Total Female Population of West Hills is 677.
What is the Ratio of Males per 100 Females in West Hills?
There are 110.34 Males per 100 Females in West Hills.
What is the Ratio of Females per 100 Males in West Hills?
There are 90.63 Females per 100 Males in West Hills.
What is the Median Population Age in West Hills?
Median Population Age in West Hills is 54.1 Years.
What is the Average Family Size in West Hills
Average Family Size in West Hills is 2.6 People.
What is the Average Household Size in West Hills
Average Household Size in West Hills is 2.2 People.
How Large is the Labor Force in West Hills?
There are 703 People in the Labor Forcein in West Hills.
What is the Percentage of People in the Labor Force in West Hills?
56.9% of People are in the Labor Force in West Hills.
What is the Unemployment Rate in West Hills?
Unemployment Rate in West Hills is 7.3%.