Riverside, PA Map & Demographics
Riverside Map
Riverside Overview
$27,275
PER CAPITA INCOME
$75,000
AVG FAMILY INCOME
$46,458
AVG HOUSEHOLD INCOME
23.5%
WAGE / INCOME GAP [ % ]
76.5¢/ $1
WAGE / INCOME GAP [ $ ]
0.38
INEQUALITY / GINI INDEX
267
TOTAL POPULATION
135
MALE POPULATION
132
FEMALE POPULATION
102.27
MALES / 100 FEMALES
97.78
FEMALES / 100 MALES
55.0
MEDIAN AGE
3.1
AVG FAMILY SIZE
2.1
AVG HOUSEHOLD SIZE
138
LABOR FORCE [ PEOPLE ]
58.5%
PERCENT IN LABOR FORCE
Riverside Zip Codes
Riverside Area Codes
Income in Riverside
Income Overview in Riverside
Per Capita Income in Riverside is $27,275, while median incomes of families and households are $75,000 and $46,458 respectively.
| Characteristic | Number | Measure |
| Per Capita Income | 267 | $27,275 |
| Median Family Income | 58 | $75,000 |
| Mean Family Income | 58 | $76,617 |
| Median Household Income | 127 | $46,458 |
| Mean Household Income | 127 | $54,898 |
| Income Deficit | 58 | $0 |
| Wage / Income Gap (%) | 267 | 23.53% |
| Wage / Income Gap ($) | 267 | 76.47¢ per $1 |
| Gini / Inequality Index | 267 | 0.38 |
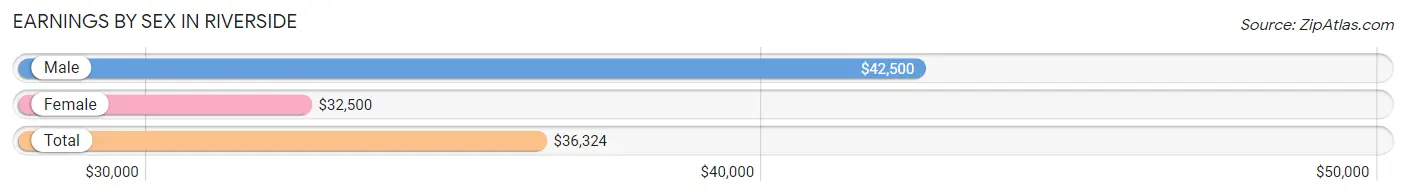
Earnings by Sex in Riverside
Average Earnings in Riverside are $36,324, $42,500 for men and $32,500 for women, a difference of 23.5%.
| Sex | Number | Average Earnings |
| Male | 82 (59.4%) | $42,500 |
| Female | 56 (40.6%) | $32,500 |
| Total | 138 (100.0%) | $36,324 |
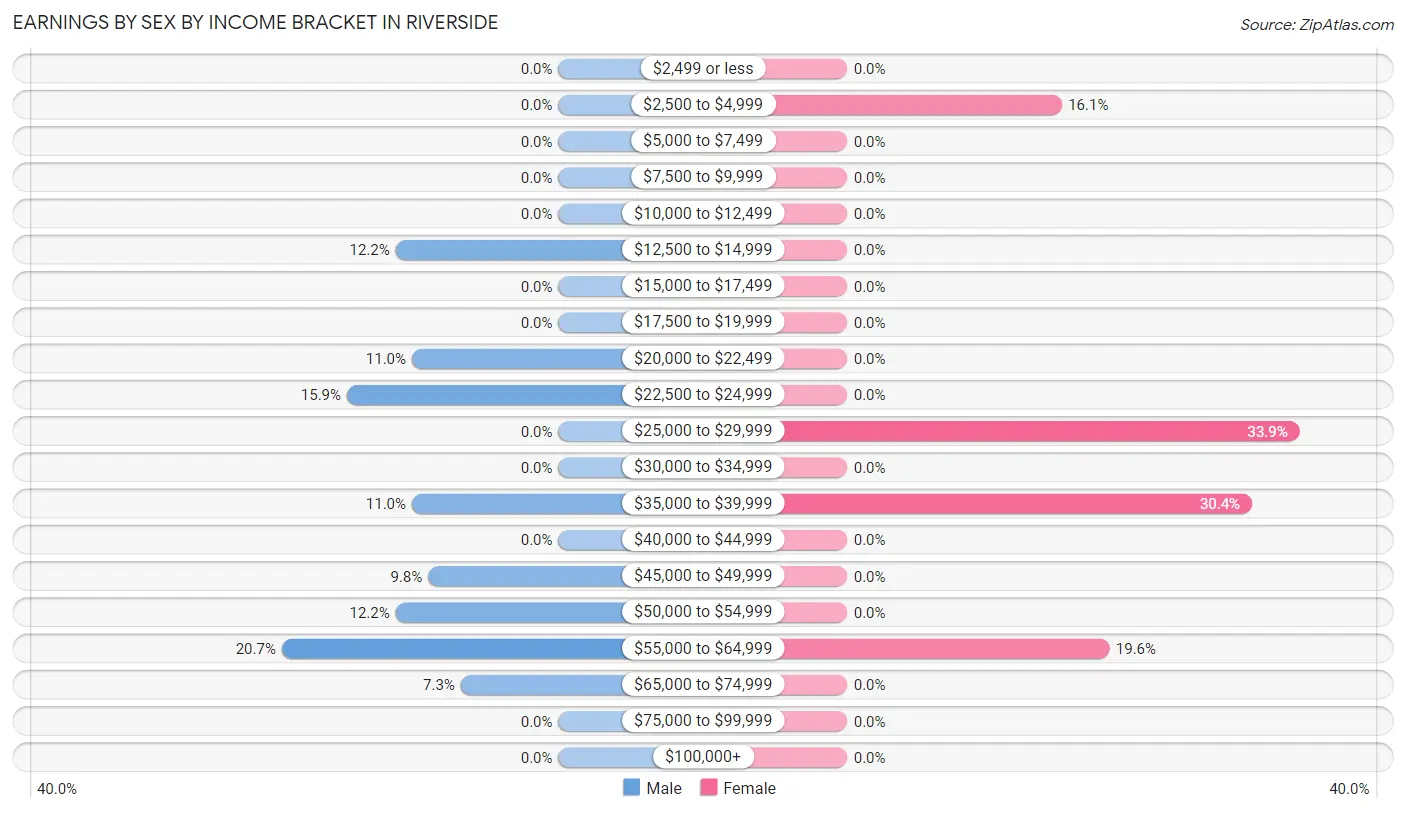
Earnings by Sex by Income Bracket in Riverside
The most common earnings brackets in Riverside are $55,000 to $64,999 for men (17 | 20.7%) and $25,000 to $29,999 for women (19 | 33.9%).
| Income | Male | Female |
| $2,499 or less | 0 (0.0%) | 0 (0.0%) |
| $2,500 to $4,999 | 0 (0.0%) | 9 (16.1%) |
| $5,000 to $7,499 | 0 (0.0%) | 0 (0.0%) |
| $7,500 to $9,999 | 0 (0.0%) | 0 (0.0%) |
| $10,000 to $12,499 | 0 (0.0%) | 0 (0.0%) |
| $12,500 to $14,999 | 10 (12.2%) | 0 (0.0%) |
| $15,000 to $17,499 | 0 (0.0%) | 0 (0.0%) |
| $17,500 to $19,999 | 0 (0.0%) | 0 (0.0%) |
| $20,000 to $22,499 | 9 (11.0%) | 0 (0.0%) |
| $22,500 to $24,999 | 13 (15.9%) | 0 (0.0%) |
| $25,000 to $29,999 | 0 (0.0%) | 19 (33.9%) |
| $30,000 to $34,999 | 0 (0.0%) | 0 (0.0%) |
| $35,000 to $39,999 | 9 (11.0%) | 17 (30.4%) |
| $40,000 to $44,999 | 0 (0.0%) | 0 (0.0%) |
| $45,000 to $49,999 | 8 (9.8%) | 0 (0.0%) |
| $50,000 to $54,999 | 10 (12.2%) | 0 (0.0%) |
| $55,000 to $64,999 | 17 (20.7%) | 11 (19.6%) |
| $65,000 to $74,999 | 6 (7.3%) | 0 (0.0%) |
| $75,000 to $99,999 | 0 (0.0%) | 0 (0.0%) |
| $100,000+ | 0 (0.0%) | 0 (0.0%) |
| Total | 82 (100.0%) | 56 (100.0%) |
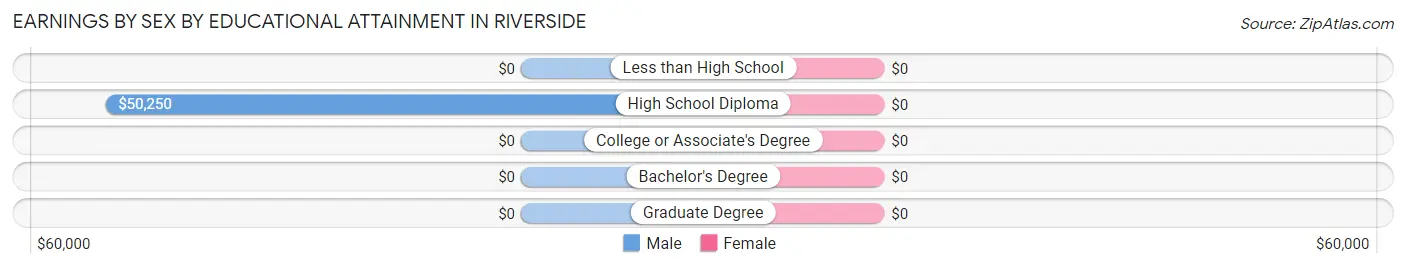
Earnings by Sex by Educational Attainment in Riverside
| Educational Attainment | Male Income | Female Income |
| Less than High School | - | - |
| High School Diploma | $50,250 | $0 |
| College or Associate's Degree | - | - |
| Bachelor's Degree | - | - |
| Graduate Degree | - | - |
| Total | $42,500 | $32,500 |
Family Income in Riverside
Family Income Brackets in Riverside
According to the Riverside family income data, there are 20 families falling into the $75,000 to $99,999 income range, which is the most common income bracket and makes up 34.5% of all families.
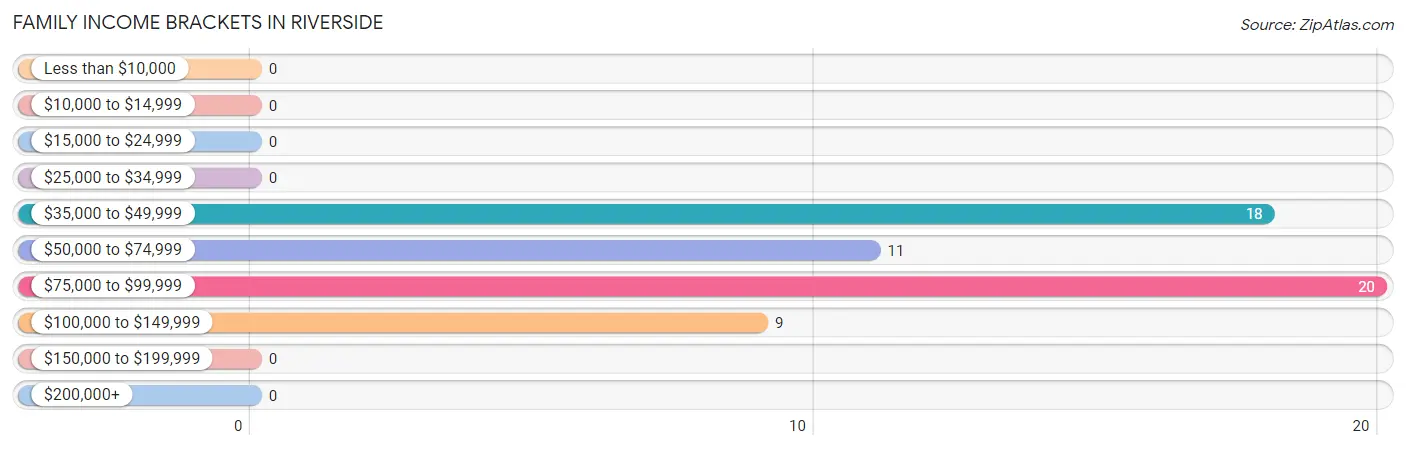
| Income Bracket | # Families | % Families |
| Less than $10,000 | 0 | 0.0% |
| $10,000 to $14,999 | 0 | 0.0% |
| $15,000 to $24,999 | 0 | 0.0% |
| $25,000 to $34,999 | 0 | 0.0% |
| $35,000 to $49,999 | 18 | 31.0% |
| $50,000 to $74,999 | 11 | 19.0% |
| $75,000 to $99,999 | 20 | 34.5% |
| $100,000 to $149,999 | 9 | 15.5% |
| $150,000 to $199,999 | 0 | 0.0% |
| $200,000+ | 0 | 0.0% |
Family Income by Famaliy Size in Riverside
3-person families (21 | 36.2%) account for the highest median family income in Riverside with $96,875 per family, while 3-person families (21 | 36.2%) have the highest median income of $32,292 per family member.
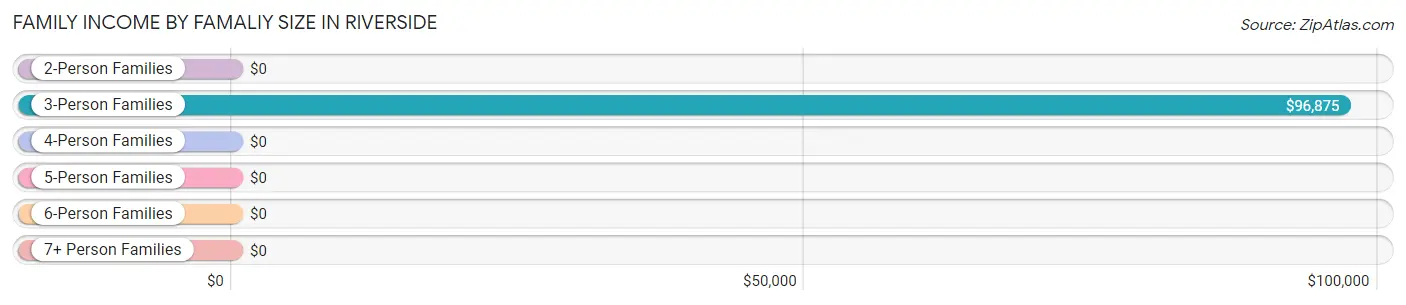
| Income Bracket | # Families | Median Income |
| 2-Person Families | 20 (34.5%) | $0 |
| 3-Person Families | 21 (36.2%) | $96,875 |
| 4-Person Families | 17 (29.3%) | $0 |
| 5-Person Families | 0 (0.0%) | $0 |
| 6-Person Families | 0 (0.0%) | $0 |
| 7+ Person Families | 0 (0.0%) | $0 |
| Total | 58 (100.0%) | $75,000 |
Family Income by Number of Earners in Riverside
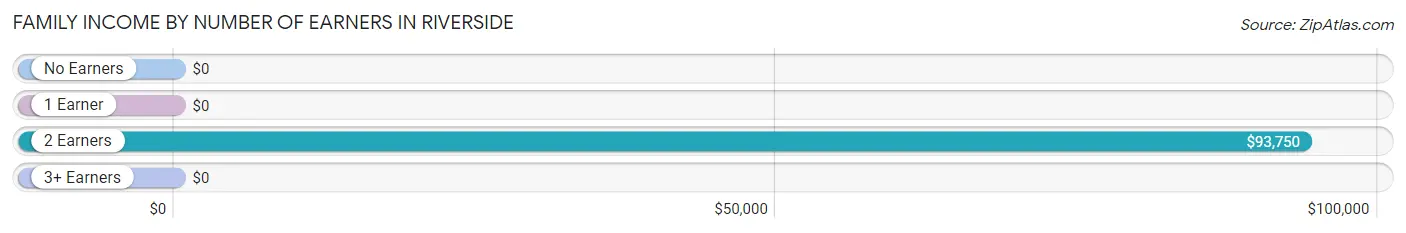
| Number of Earners | # Families | Median Income |
| No Earners | 9 (15.5%) | $0 |
| 1 Earner | 11 (19.0%) | $0 |
| 2 Earners | 38 (65.5%) | $93,750 |
| 3+ Earners | 0 (0.0%) | $0 |
| Total | 58 (100.0%) | $75,000 |
Household Income in Riverside
Household Income Brackets in Riverside
With 30 households falling in the category, the $75,000 to $99,999 income range is the most frequent in Riverside, accounting for 23.6% of all households.
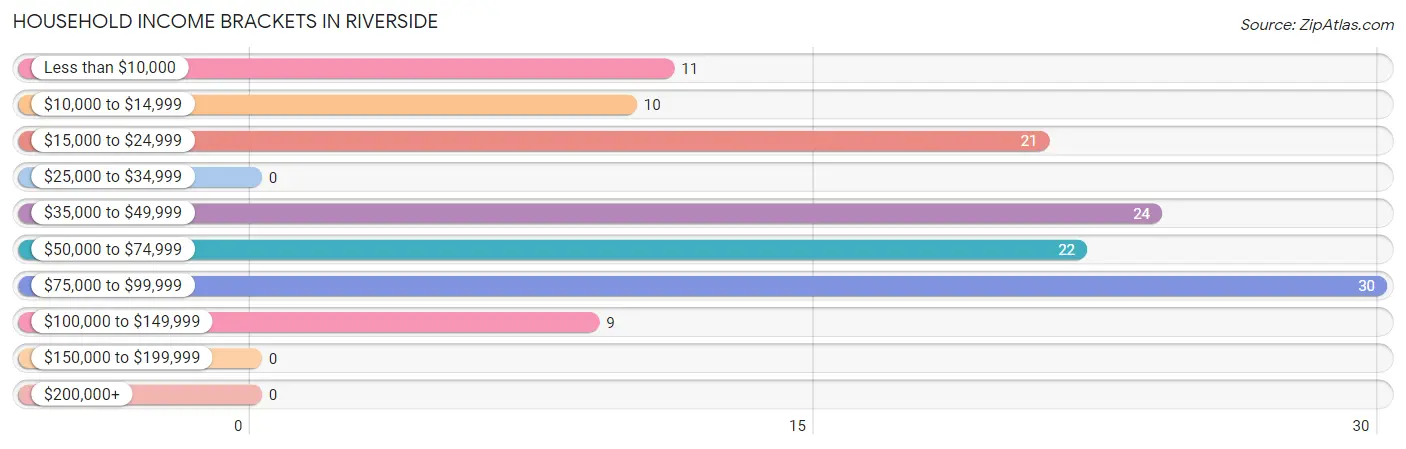
| Income Bracket | # Households | % Households |
| Less than $10,000 | 11 | 8.7% |
| $10,000 to $14,999 | 10 | 7.9% |
| $15,000 to $24,999 | 21 | 16.5% |
| $25,000 to $34,999 | 0 | 0.0% |
| $35,000 to $49,999 | 24 | 18.9% |
| $50,000 to $74,999 | 22 | 17.3% |
| $75,000 to $99,999 | 30 | 23.6% |
| $100,000 to $149,999 | 9 | 7.1% |
| $150,000 to $199,999 | 0 | 0.0% |
| $200,000+ | 0 | 0.0% |
Household Income by Householder Age in Riverside
The median household income in Riverside is $46,458, with the highest median household income of $88,542 found in the 25 to 44 years age bracket for the primary householder. A total of 35 households (27.6%) fall into this category.
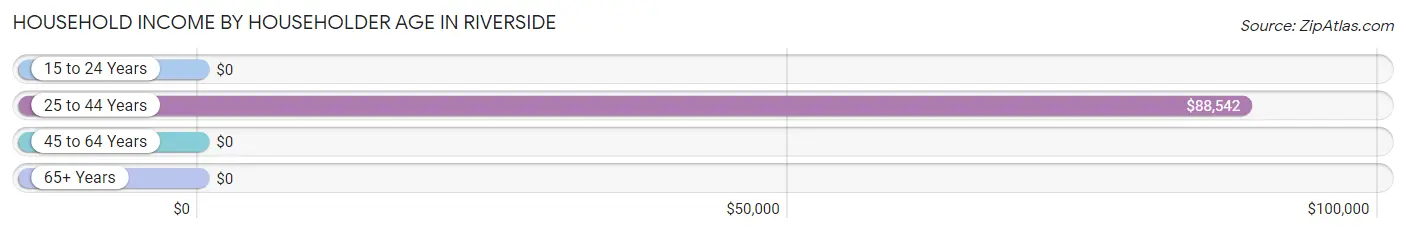
| Income Bracket | # Households | Median Income |
| 15 to 24 Years | 0 (0.0%) | $0 |
| 25 to 44 Years | 35 (27.6%) | $88,542 |
| 45 to 64 Years | 54 (42.5%) | $0 |
| 65+ Years | 38 (29.9%) | $0 |
| Total | 127 (100.0%) | $46,458 |
Poverty in Riverside
Income Below Poverty by Sex and Age in Riverside
With 7.4% poverty level for males and 8.3% for females among the residents of Riverside, 55 to 64 year old males and 55 to 64 year old females are the most vulnerable to poverty, with 10 males (31.2%) and 11 females (26.2%) in their respective age groups living below the poverty level.
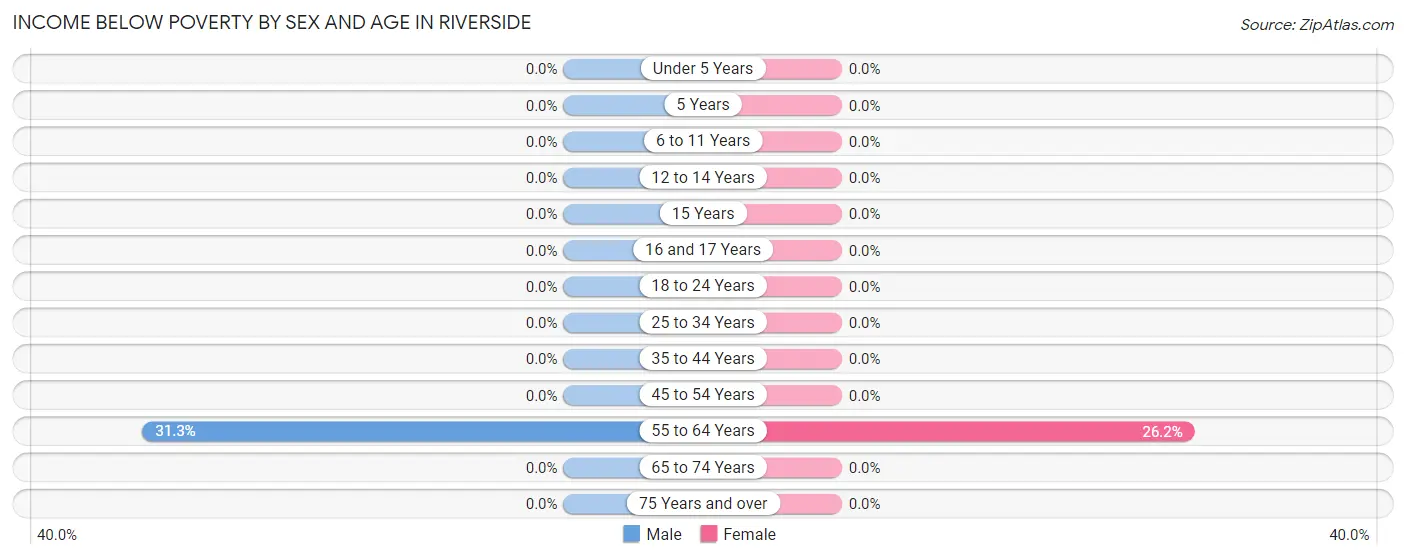
| Age Bracket | Male | Female |
| Under 5 Years | 0 (0.0%) | 0 (0.0%) |
| 5 Years | 0 (0.0%) | 0 (0.0%) |
| 6 to 11 Years | 0 (0.0%) | 0 (0.0%) |
| 12 to 14 Years | 0 (0.0%) | 0 (0.0%) |
| 15 Years | 0 (0.0%) | 0 (0.0%) |
| 16 and 17 Years | 0 (0.0%) | 0 (0.0%) |
| 18 to 24 Years | 0 (0.0%) | 0 (0.0%) |
| 25 to 34 Years | 0 (0.0%) | 0 (0.0%) |
| 35 to 44 Years | 0 (0.0%) | 0 (0.0%) |
| 45 to 54 Years | 0 (0.0%) | 0 (0.0%) |
| 55 to 64 Years | 10 (31.2%) | 11 (26.2%) |
| 65 to 74 Years | 0 (0.0%) | 0 (0.0%) |
| 75 Years and over | 0 (0.0%) | 0 (0.0%) |
| Total | 10 (7.4%) | 11 (8.3%) |
Income Above Poverty by Sex and Age in Riverside
According to the poverty statistics in Riverside, males aged under 5 years and females aged under 5 years are the age groups that are most secure financially, with 100.0% of males and 100.0% of females in these age groups living above the poverty line.
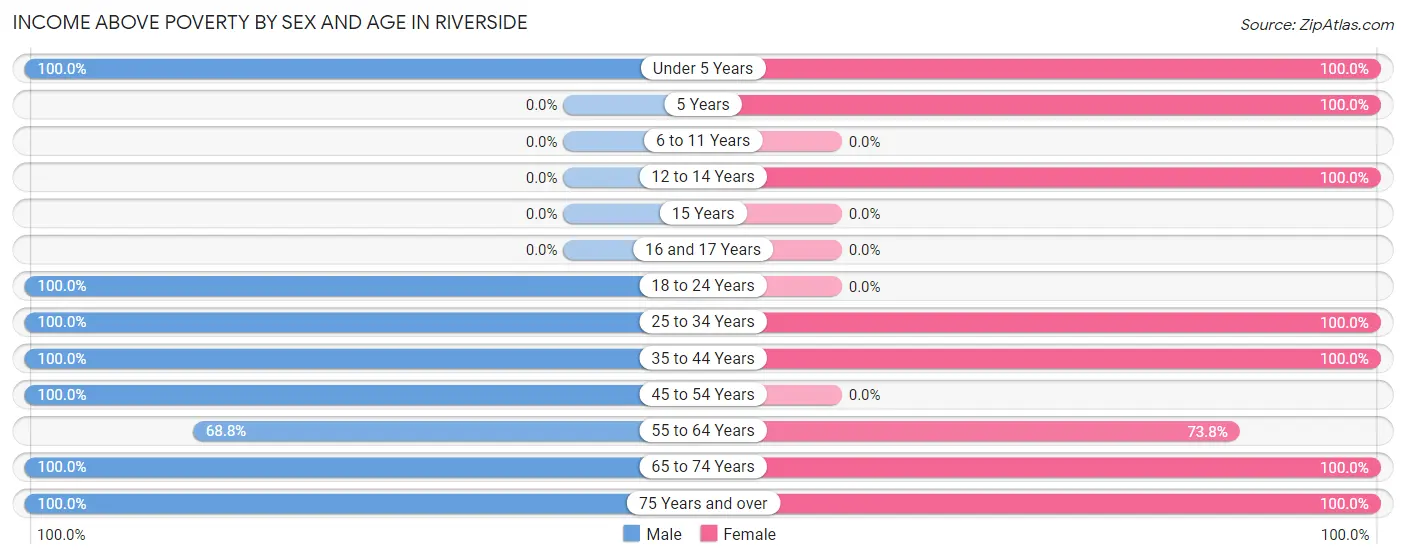
| Age Bracket | Male | Female |
| Under 5 Years | 9 (100.0%) | 8 (100.0%) |
| 5 Years | 0 (0.0%) | 7 (100.0%) |
| 6 to 11 Years | 0 (0.0%) | 0 (0.0%) |
| 12 to 14 Years | 0 (0.0%) | 7 (100.0%) |
| 15 Years | 0 (0.0%) | 0 (0.0%) |
| 16 and 17 Years | 0 (0.0%) | 0 (0.0%) |
| 18 to 24 Years | 13 (100.0%) | 0 (0.0%) |
| 25 to 34 Years | 24 (100.0%) | 12 (100.0%) |
| 35 to 44 Years | 12 (100.0%) | 24 (100.0%) |
| 45 to 54 Years | 17 (100.0%) | 0 (0.0%) |
| 55 to 64 Years | 22 (68.8%) | 31 (73.8%) |
| 65 to 74 Years | 19 (100.0%) | 22 (100.0%) |
| 75 Years and over | 9 (100.0%) | 10 (100.0%) |
| Total | 125 (92.6%) | 121 (91.7%) |
Income Below Poverty Among Married-Couple Families in Riverside
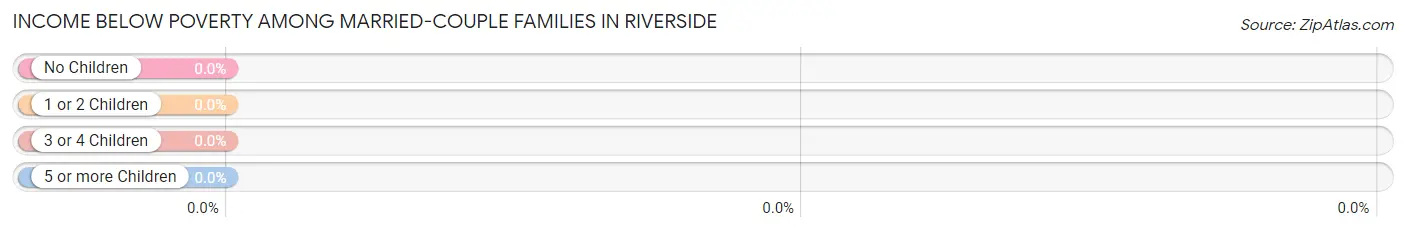
| Children | Above Poverty | Below Poverty |
| No Children | 35 (100.0%) | 0 (0.0%) |
| 1 or 2 Children | 23 (100.0%) | 0 (0.0%) |
| 3 or 4 Children | 0 (0.0%) | 0 (0.0%) |
| 5 or more Children | 0 (0.0%) | 0 (0.0%) |
| Total | 58 (100.0%) | 0 (0.0%) |
Income Below Poverty Among Single-Parent Households in Riverside
| Children | Single Father | Single Mother |
| No Children | 0 (0.0%) | 0 (0.0%) |
| 1 or 2 Children | 0 (0.0%) | 0 (0.0%) |
| 3 or 4 Children | 0 (0.0%) | 0 (0.0%) |
| 5 or more Children | 0 (0.0%) | 0 (0.0%) |
| Total | 0 (0.0%) | 0 (0.0%) |
Income Below Poverty Among Married-Couple vs Single-Parent Households in Riverside
| Children | Married-Couple Families | Single-Parent Households |
| No Children | 0 (0.0%) | 0 (0.0%) |
| 1 or 2 Children | 0 (0.0%) | 0 (0.0%) |
| 3 or 4 Children | 0 (0.0%) | 0 (0.0%) |
| 5 or more Children | 0 (0.0%) | 0 (0.0%) |
| Total | 0 (0.0%) | 0 (0.0%) |
Race in Riverside
The most populous races in Riverside are White / Caucasian (252 | 94.4%), and Two or more Races (15 | 5.6%).
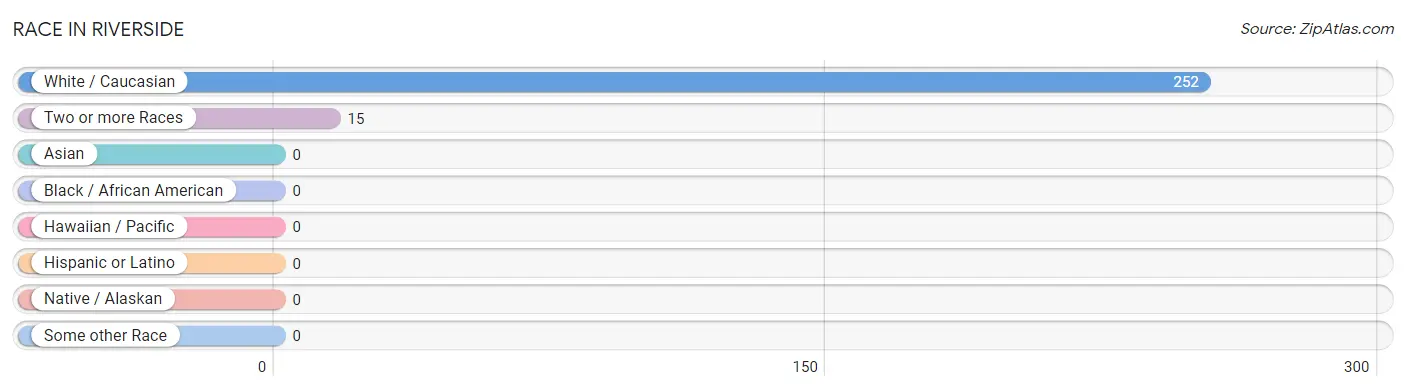
| Race | # Population | % Population |
| Asian | 0 | 0.0% |
| Black / African American | 0 | 0.0% |
| Hawaiian / Pacific | 0 | 0.0% |
| Hispanic or Latino | 0 | 0.0% |
| Native / Alaskan | 0 | 0.0% |
| White / Caucasian | 252 | 94.4% |
| Two or more Races | 15 | 5.6% |
| Some other Race | 0 | 0.0% |
| Total | 267 | 100.0% |
Ancestry in Riverside
The most populous ancestries reported in Riverside are German (72 | 27.0%), English (46 | 17.2%), Welsh (25 | 9.4%), American (22 | 8.2%), and Pennsylvania German (20 | 7.5%), together accounting for 69.3% of all Riverside residents.
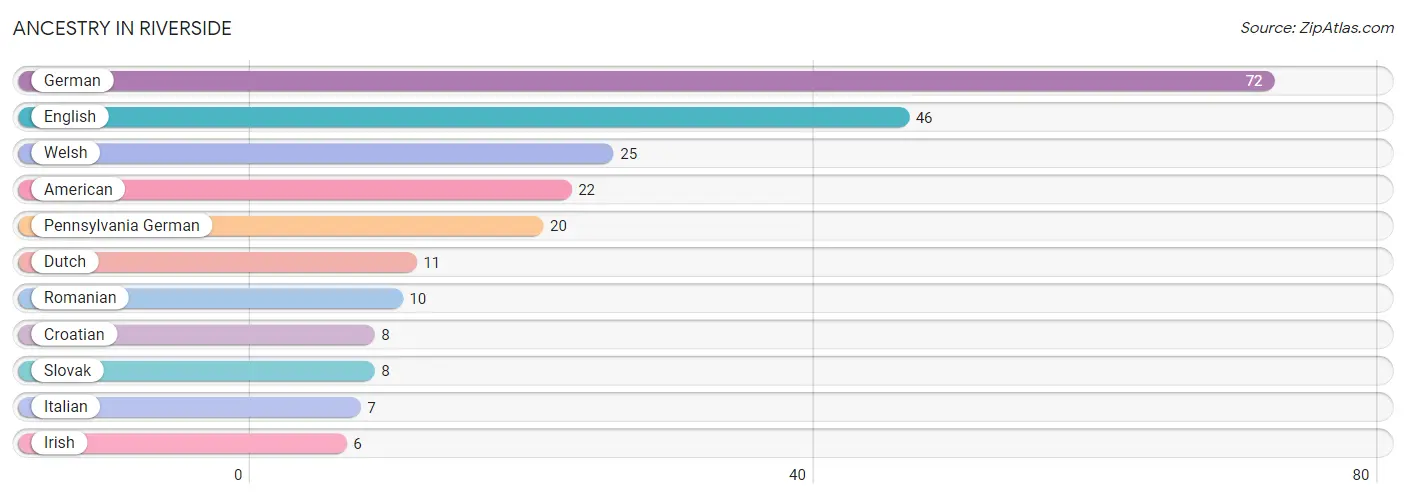
| Ancestry | # Population | % Population |
| American | 22 | 8.2% |
| Croatian | 8 | 3.0% |
| Dutch | 11 | 4.1% |
| English | 46 | 17.2% |
| German | 72 | 27.0% |
| Irish | 6 | 2.2% |
| Italian | 7 | 2.6% |
| Pennsylvania German | 20 | 7.5% |
| Romanian | 10 | 3.7% |
| Slovak | 8 | 3.0% |
| Welsh | 25 | 9.4% | View All 11 Rows |
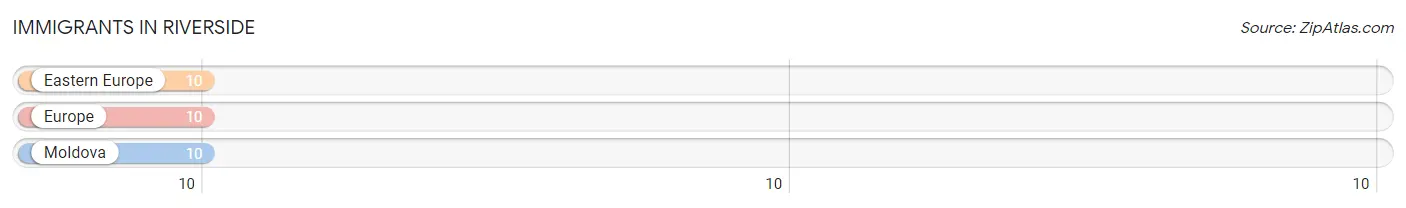
Immigrants in Riverside
The most numerous immigrant groups reported in Riverside came from Eastern Europe (10 | 3.7%), Europe (10 | 3.7%), and Moldova (10 | 3.7%), together accounting for 11.2% of all Riverside residents.
| Immigration Origin | # Population | % Population |
| Eastern Europe | 10 | 3.7% |
| Europe | 10 | 3.7% |
| Moldova | 10 | 3.7% | View All 3 Rows |
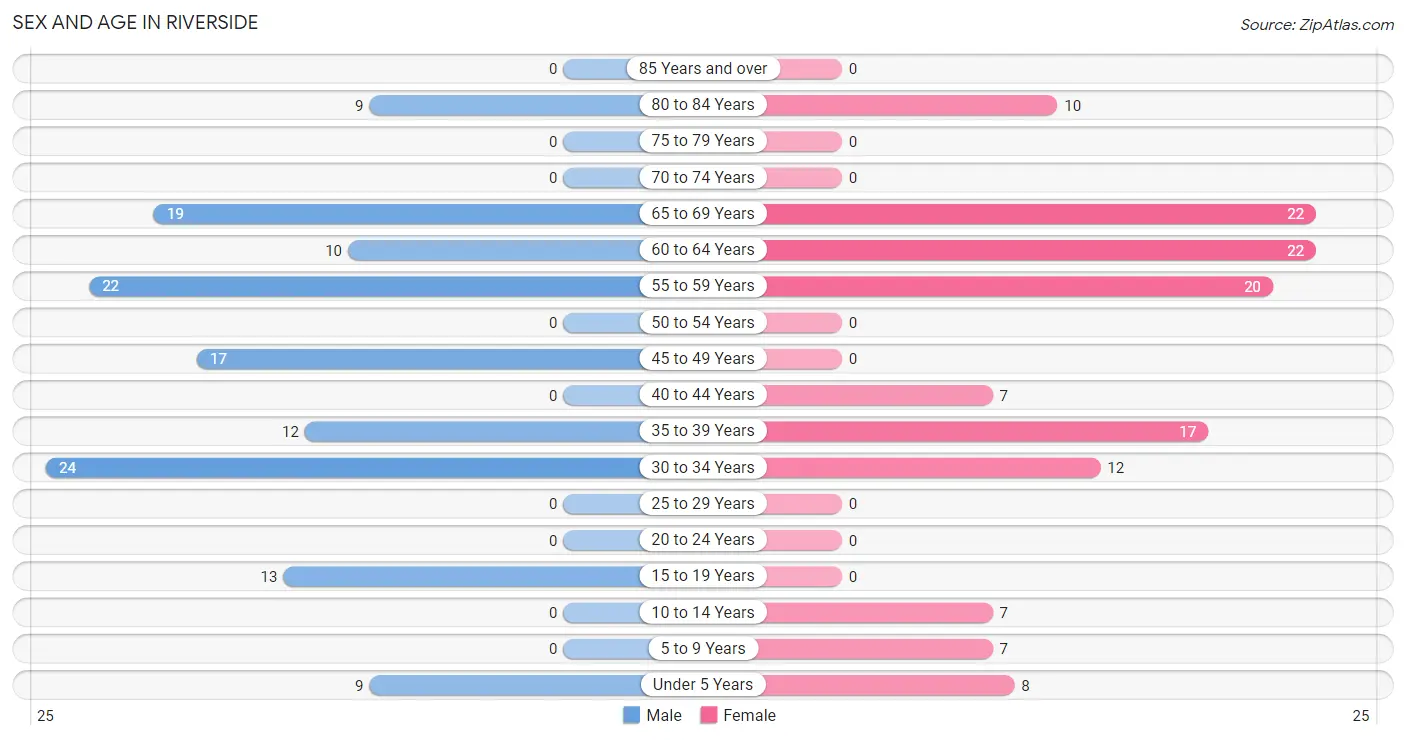
Sex and Age in Riverside
Sex and Age in Riverside
The most populous age groups in Riverside are 30 to 34 Years (24 | 17.8%) for men and 60 to 64 Years (22 | 16.7%) for women.
| Age Bracket | Male | Female |
| Under 5 Years | 9 (6.7%) | 8 (6.1%) |
| 5 to 9 Years | 0 (0.0%) | 7 (5.3%) |
| 10 to 14 Years | 0 (0.0%) | 7 (5.3%) |
| 15 to 19 Years | 13 (9.6%) | 0 (0.0%) |
| 20 to 24 Years | 0 (0.0%) | 0 (0.0%) |
| 25 to 29 Years | 0 (0.0%) | 0 (0.0%) |
| 30 to 34 Years | 24 (17.8%) | 12 (9.1%) |
| 35 to 39 Years | 12 (8.9%) | 17 (12.9%) |
| 40 to 44 Years | 0 (0.0%) | 7 (5.3%) |
| 45 to 49 Years | 17 (12.6%) | 0 (0.0%) |
| 50 to 54 Years | 0 (0.0%) | 0 (0.0%) |
| 55 to 59 Years | 22 (16.3%) | 20 (15.1%) |
| 60 to 64 Years | 10 (7.4%) | 22 (16.7%) |
| 65 to 69 Years | 19 (14.1%) | 22 (16.7%) |
| 70 to 74 Years | 0 (0.0%) | 0 (0.0%) |
| 75 to 79 Years | 0 (0.0%) | 0 (0.0%) |
| 80 to 84 Years | 9 (6.7%) | 10 (7.6%) |
| 85 Years and over | 0 (0.0%) | 0 (0.0%) |
| Total | 135 (100.0%) | 132 (100.0%) |
Families and Households in Riverside
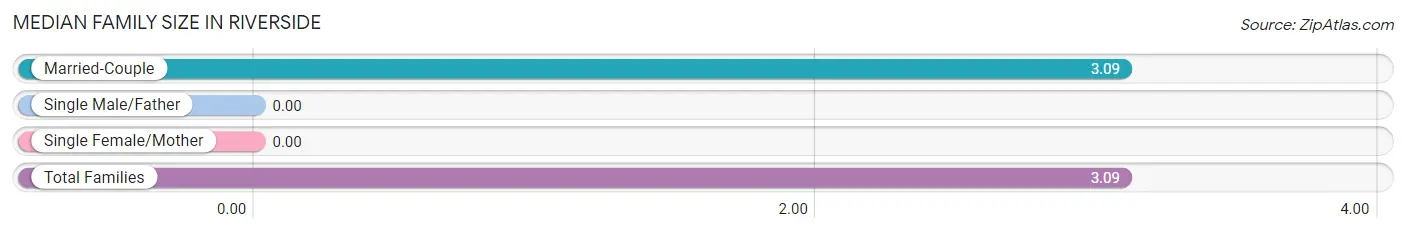
Median Family Size in Riverside
| Family Type | # Families | Family Size |
| Married-Couple | 58 (100.0%) | 3.09 |
| Single Male/Father | 0 (0.0%) | - |
| Single Female/Mother | 0 (0.0%) | - |
| Total Families | 58 (100.0%) | 3.09 |
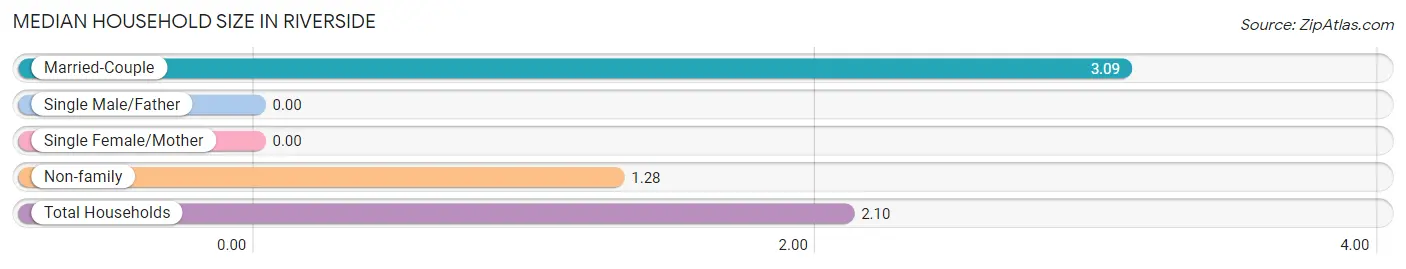
Median Household Size in Riverside
| Household Type | # Households | Household Size |
| Married-Couple | 58 (45.7%) | 3.09 |
| Single Male/Father | 0 (0.0%) | - |
| Single Female/Mother | 0 (0.0%) | - |
| Non-family | 69 (54.3%) | 1.28 |
| Total Households | 127 (100.0%) | 2.10 |
Household Size by Marriage Status in Riverside
Out of a total of 127 households in Riverside, 58 (45.7%) are family households, while 69 (54.3%) are nonfamily households. The most numerous type of family households are 3-person households, comprising 21, and the most common type of nonfamily households are 1-person households, comprising 53.
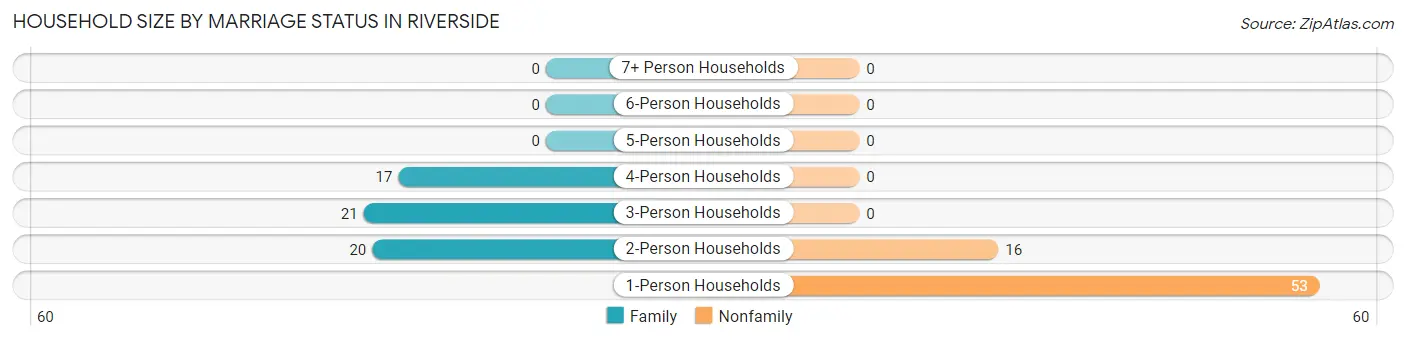
| Household Size | Family Households | Nonfamily Households |
| 1-Person Households | - | 53 (41.7%) |
| 2-Person Households | 20 (15.8%) | 16 (12.6%) |
| 3-Person Households | 21 (16.5%) | 0 (0.0%) |
| 4-Person Households | 17 (13.4%) | 0 (0.0%) |
| 5-Person Households | 0 (0.0%) | 0 (0.0%) |
| 6-Person Households | 0 (0.0%) | 0 (0.0%) |
| 7+ Person Households | 0 (0.0%) | 0 (0.0%) |
| Total | 58 (45.7%) | 69 (54.3%) |
Female Fertility in Riverside
Fertility by Age in Riverside
Average fertility rate in Riverside is 222.0 births per 1,000 women. Women in the age bracket of 35 to 50 years have the highest fertility rate with 333.0 births per 1,000 women. Women in the age bracket of 35 to 50 years acount for 100.0% of all women with births.
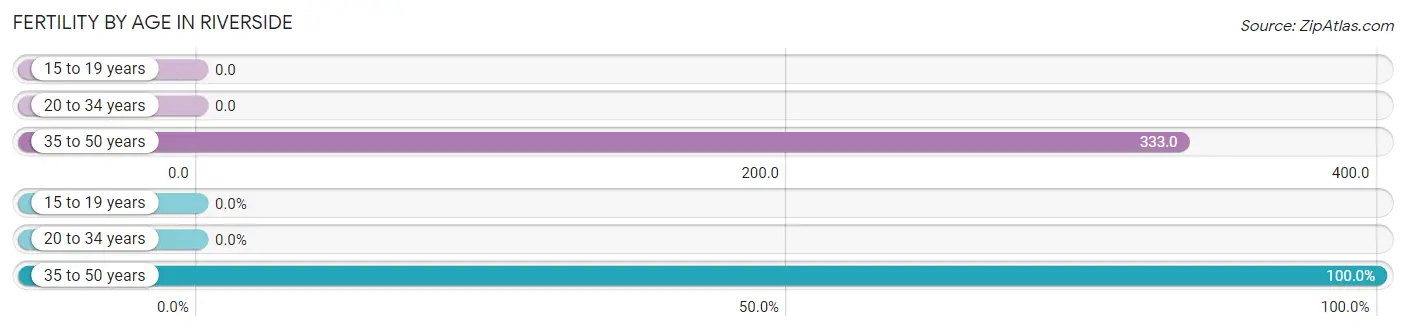
| Age Bracket | Women with Births | Births / 1,000 Women |
| 15 to 19 years | 0 (0.0%) | 0.0 |
| 20 to 34 years | 0 (0.0%) | 0.0 |
| 35 to 50 years | 8 (100.0%) | 333.0 |
| Total | 8 (100.0%) | 222.0 |
Fertility by Age by Marriage Status in Riverside
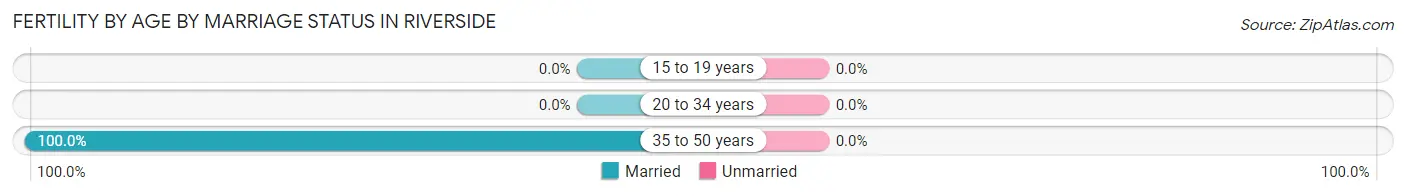
| Age Bracket | Married | Unmarried |
| 15 to 19 years | 0 (0.0%) | 0 (0.0%) |
| 20 to 34 years | 0 (0.0%) | 0 (0.0%) |
| 35 to 50 years | 8 (100.0%) | 0 (0.0%) |
| Total | 8 (100.0%) | 0 (0.0%) |
Fertility by Education in Riverside
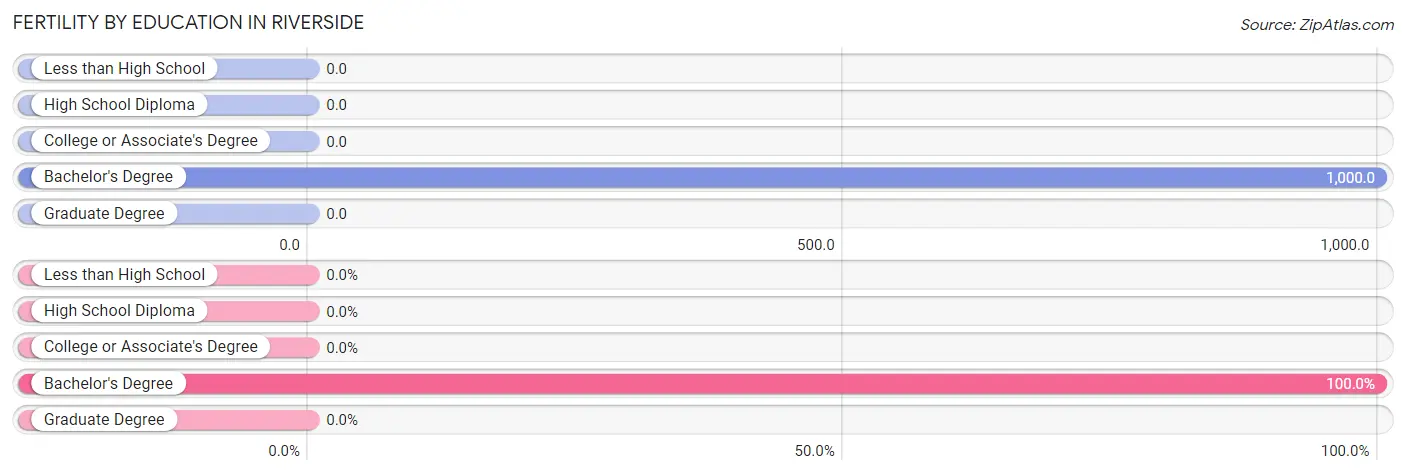
| Educational Attainment | Women with Births | Births / 1,000 Women |
| Less than High School | 0 (0.0%) | 0.0 |
| High School Diploma | 0 (0.0%) | 0.0 |
| College or Associate's Degree | 0 (0.0%) | 0.0 |
| Bachelor's Degree | 8 (100.0%) | 1,000.0 |
| Graduate Degree | 0 (0.0%) | 0.0 |
| Total | 8 (100.0%) | 222.0 |
Fertility by Education by Marriage Status in Riverside
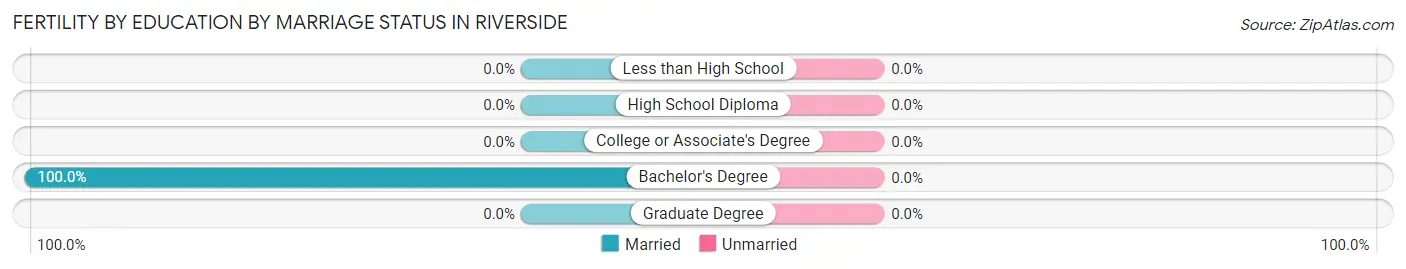
| Educational Attainment | Married | Unmarried |
| Less than High School | 0 (0.0%) | 0 (0.0%) |
| High School Diploma | 0 (0.0%) | 0 (0.0%) |
| College or Associate's Degree | 0 (0.0%) | 0 (0.0%) |
| Bachelor's Degree | 8 (100.0%) | 0 (0.0%) |
| Graduate Degree | 0 (0.0%) | 0 (0.0%) |
| Total | 8 (100.0%) | 0 (0.0%) |
Employment Characteristics in Riverside
Employment by Class of Employer in Riverside
Among the 118 employed individuals in Riverside, private company employees (82 | 69.5%), local government employees (17 | 14.4%), and self-employed (not incorporated) (10 | 8.5%) make up the most common classes of employment.
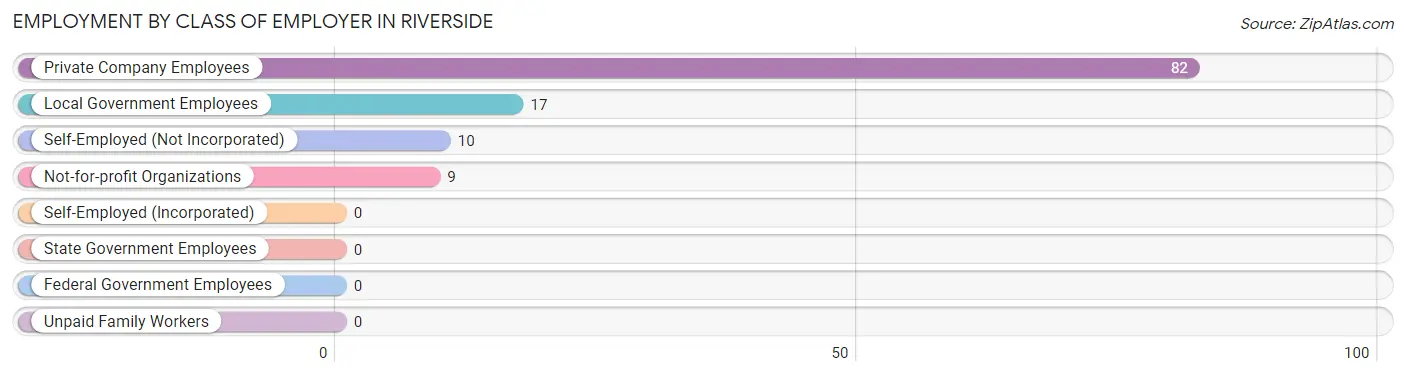
| Employer Class | # Employees | % Employees |
| Private Company Employees | 82 | 69.5% |
| Self-Employed (Incorporated) | 0 | 0.0% |
| Self-Employed (Not Incorporated) | 10 | 8.5% |
| Not-for-profit Organizations | 9 | 7.6% |
| Local Government Employees | 17 | 14.4% |
| State Government Employees | 0 | 0.0% |
| Federal Government Employees | 0 | 0.0% |
| Unpaid Family Workers | 0 | 0.0% |
| Total | 118 | 100.0% |
Employment Status by Age in Riverside
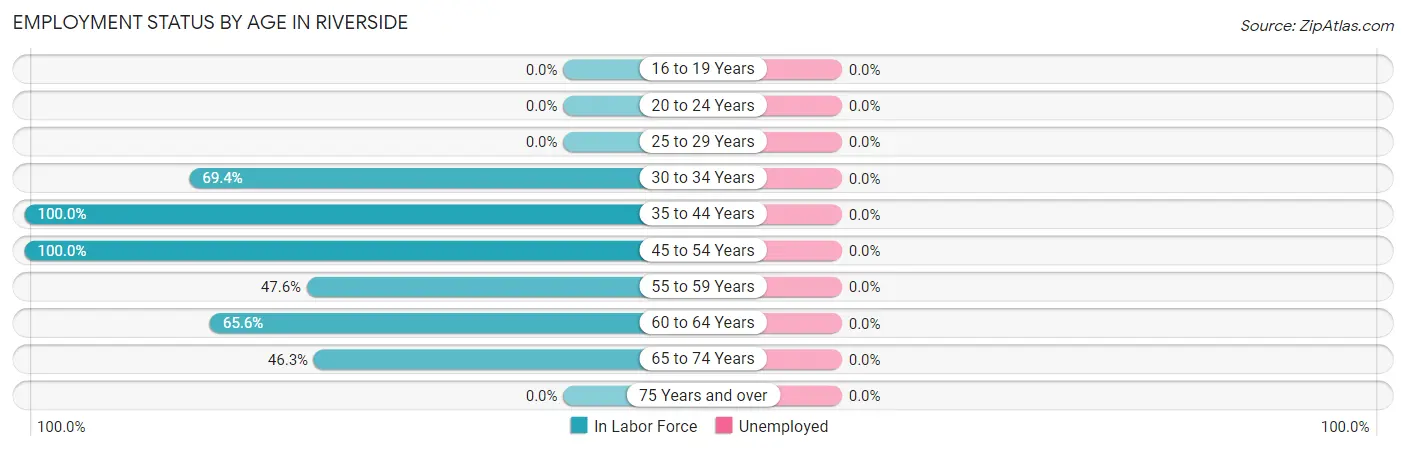
| Age Bracket | In Labor Force | Unemployed |
| 16 to 19 Years | 0 (0.0%) | 0 (0.0%) |
| 20 to 24 Years | 0 (0.0%) | 0 (0.0%) |
| 25 to 29 Years | 0 (0.0%) | 0 (0.0%) |
| 30 to 34 Years | 25 (69.4%) | 0 (0.0%) |
| 35 to 44 Years | 36 (100.0%) | 0 (0.0%) |
| 45 to 54 Years | 17 (100.0%) | 0 (0.0%) |
| 55 to 59 Years | 20 (47.6%) | 0 (0.0%) |
| 60 to 64 Years | 21 (65.6%) | 0 (0.0%) |
| 65 to 74 Years | 19 (46.3%) | 0 (0.0%) |
| 75 Years and over | 0 (0.0%) | 0 (0.0%) |
| Total | 138 (58.5%) | 0 (0.0%) |
Employment Status by Educational Attainment in Riverside
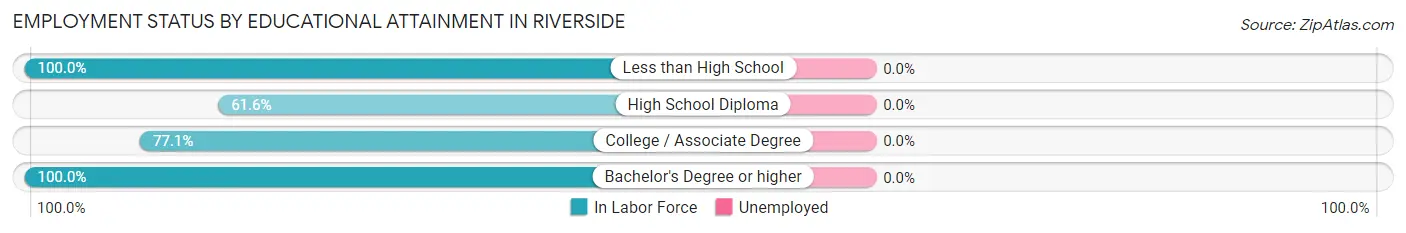
| Educational Attainment | In Labor Force | Unemployed |
| Less than High School | 7 (100.0%) | 0 (0.0%) |
| High School Diploma | 53 (61.6%) | 0 (0.0%) |
| College / Associate Degree | 37 (77.1%) | 0 (0.0%) |
| Bachelor's Degree or higher | 22 (100.0%) | 0 (0.0%) |
| Total | 119 (73.0%) | 0 (0.0%) |
Employment Occupations by Sex in Riverside
Management, Business, Science and Arts Occupations
The most common Management, Business, Science and Arts occupations in Riverside are Community & Social Service (9 | 6.5%), Education Instruction & Library (9 | 6.5%), and Management (8 | 5.8%).
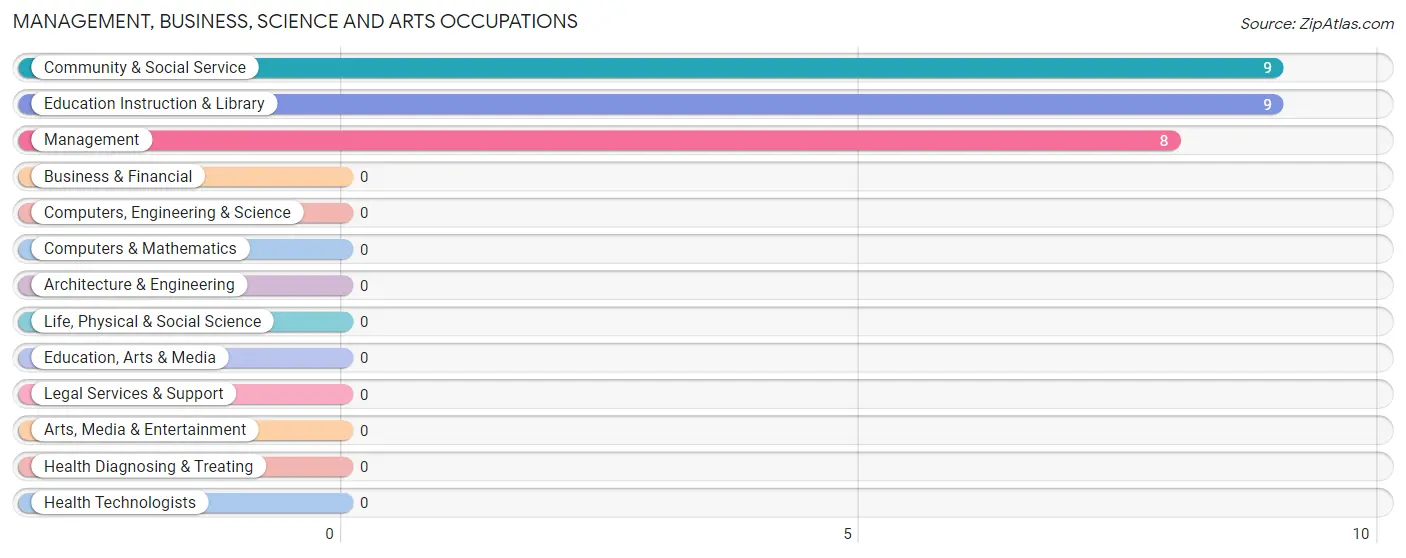
Management, Business, Science and Arts Occupations by Sex
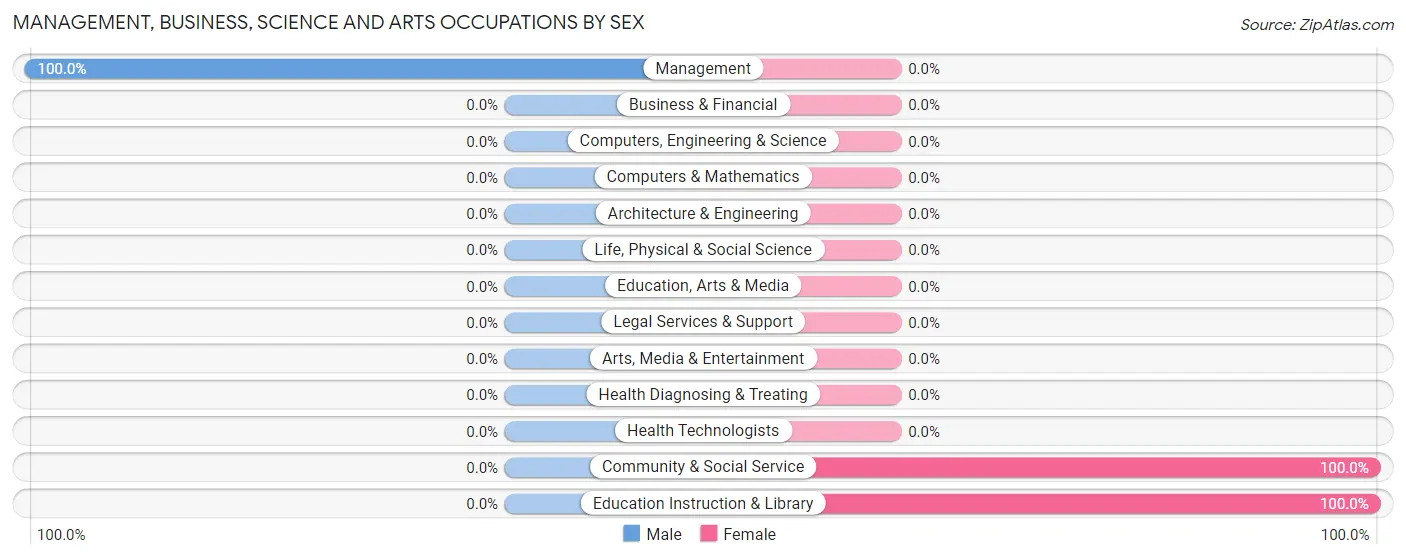
| Occupation | Male | Female |
| Management | 8 (100.0%) | 0 (0.0%) |
| Business & Financial | 0 (0.0%) | 0 (0.0%) |
| Computers, Engineering & Science | 0 (0.0%) | 0 (0.0%) |
| Computers & Mathematics | 0 (0.0%) | 0 (0.0%) |
| Architecture & Engineering | 0 (0.0%) | 0 (0.0%) |
| Life, Physical & Social Science | 0 (0.0%) | 0 (0.0%) |
| Community & Social Service | 0 (0.0%) | 9 (100.0%) |
| Education, Arts & Media | 0 (0.0%) | 0 (0.0%) |
| Legal Services & Support | 0 (0.0%) | 0 (0.0%) |
| Education Instruction & Library | 0 (0.0%) | 9 (100.0%) |
| Arts, Media & Entertainment | 0 (0.0%) | 0 (0.0%) |
| Health Diagnosing & Treating | 0 (0.0%) | 0 (0.0%) |
| Health Technologists | 0 (0.0%) | 0 (0.0%) |
| Total (Category) | 8 (47.1%) | 9 (52.9%) |
| Total (Overall) | 82 (59.4%) | 56 (40.6%) |
Services Occupations
The most common Services occupations in Riverside are Security & Protection (11 | 8.0%), Law Enforcement (11 | 8.0%), and Cleaning & Maintenance (9 | 6.5%).
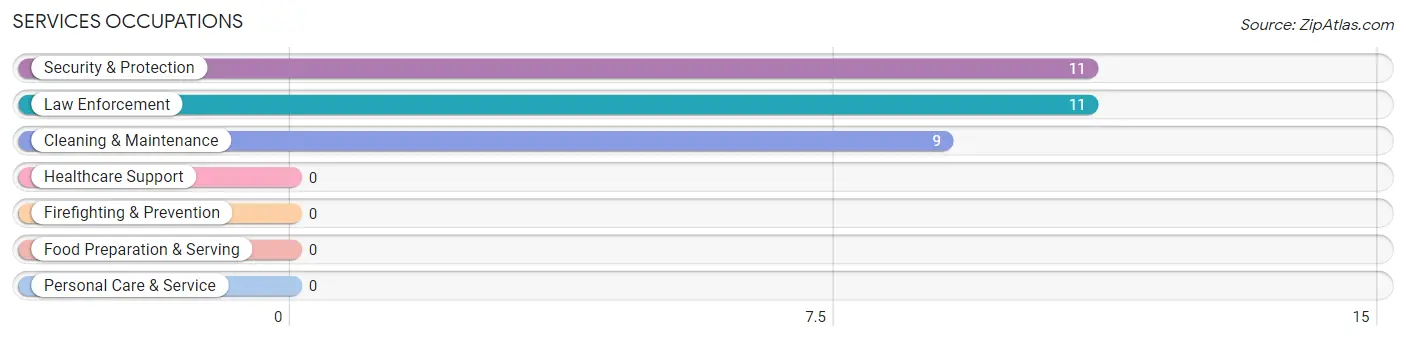
Services Occupations by Sex
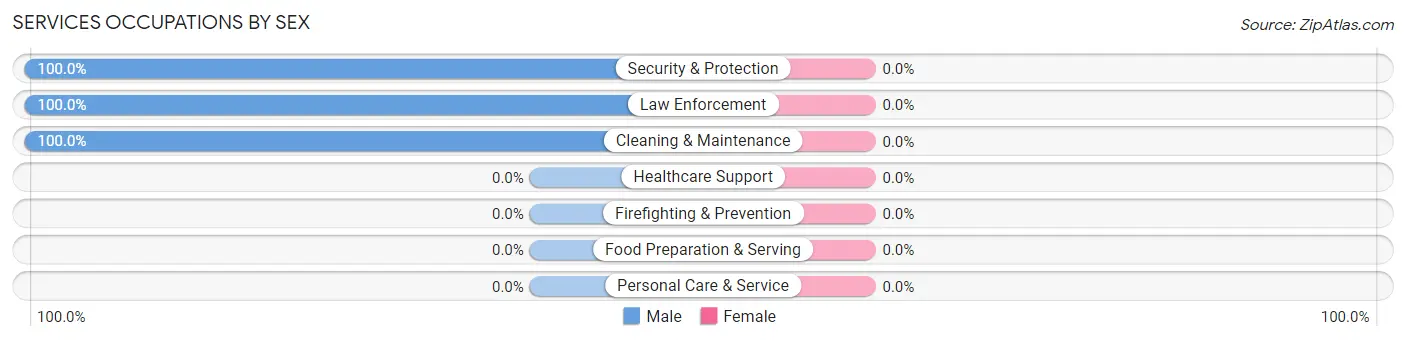
| Occupation | Male | Female |
| Healthcare Support | 0 (0.0%) | 0 (0.0%) |
| Security & Protection | 11 (100.0%) | 0 (0.0%) |
| Firefighting & Prevention | 0 (0.0%) | 0 (0.0%) |
| Law Enforcement | 11 (100.0%) | 0 (0.0%) |
| Food Preparation & Serving | 0 (0.0%) | 0 (0.0%) |
| Cleaning & Maintenance | 9 (100.0%) | 0 (0.0%) |
| Personal Care & Service | 0 (0.0%) | 0 (0.0%) |
| Total (Category) | 20 (100.0%) | 0 (0.0%) |
| Total (Overall) | 82 (59.4%) | 56 (40.6%) |
Sales and Office Occupations
The most common Sales and Office occupations in Riverside are Sales & Related (53 | 38.4%), and Office & Administration (26 | 18.8%).
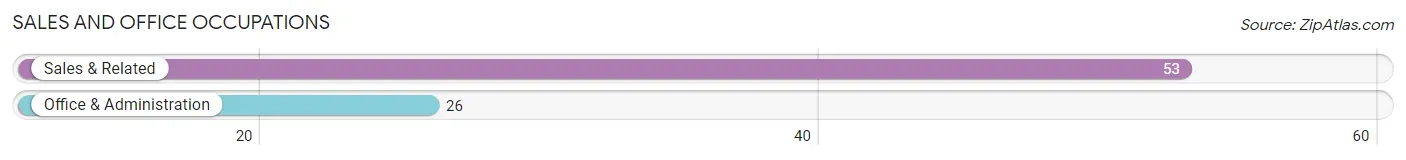
Sales and Office Occupations by Sex
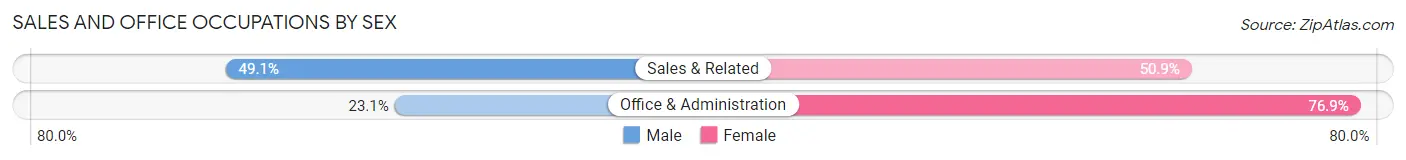
| Occupation | Male | Female |
| Sales & Related | 26 (49.1%) | 27 (50.9%) |
| Office & Administration | 6 (23.1%) | 20 (76.9%) |
| Total (Category) | 32 (40.5%) | 47 (59.5%) |
| Total (Overall) | 82 (59.4%) | 56 (40.6%) |
Natural Resources, Construction and Maintenance Occupations
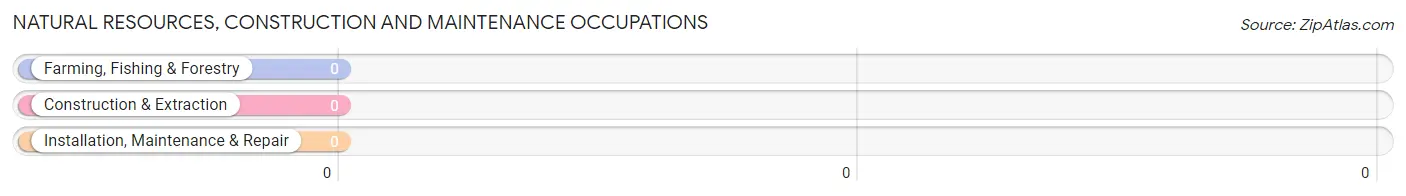
Natural Resources, Construction and Maintenance Occupations by Sex
| Occupation | Male | Female |
| Farming, Fishing & Forestry | 0 (0.0%) | 0 (0.0%) |
| Construction & Extraction | 0 (0.0%) | 0 (0.0%) |
| Installation, Maintenance & Repair | 0 (0.0%) | 0 (0.0%) |
| Total (Category) | 0 (0.0%) | 0 (0.0%) |
| Total (Overall) | 82 (59.4%) | 56 (40.6%) |
Production, Transportation and Moving Occupations
The most common Production, Transportation and Moving occupations in Riverside are Production (16 | 11.6%), and Transportation (6 | 4.3%).
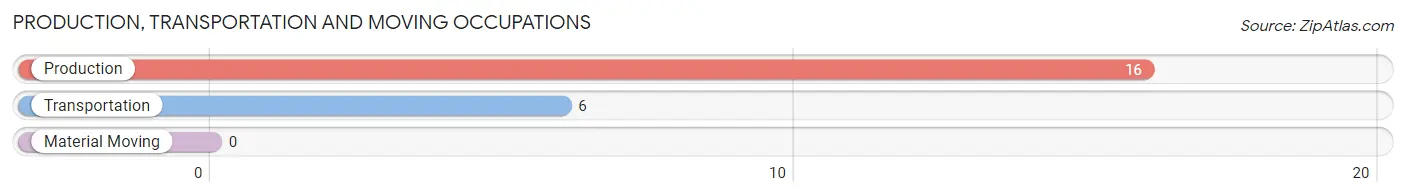
Production, Transportation and Moving Occupations by Sex
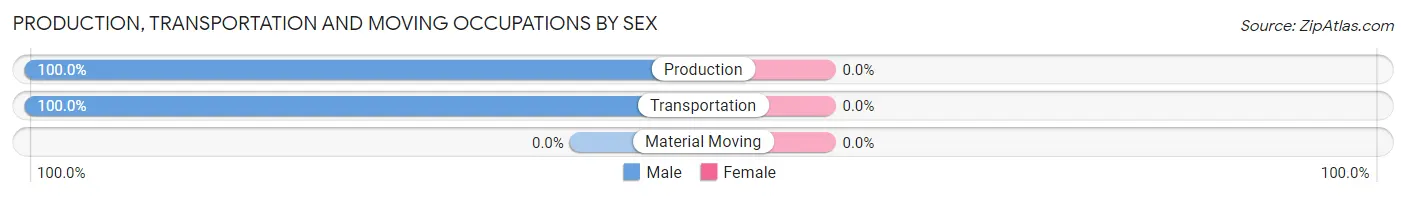
| Occupation | Male | Female |
| Production | 16 (100.0%) | 0 (0.0%) |
| Transportation | 6 (100.0%) | 0 (0.0%) |
| Material Moving | 0 (0.0%) | 0 (0.0%) |
| Total (Category) | 22 (100.0%) | 0 (0.0%) |
| Total (Overall) | 82 (59.4%) | 56 (40.6%) |
Employment Industries by Sex in Riverside
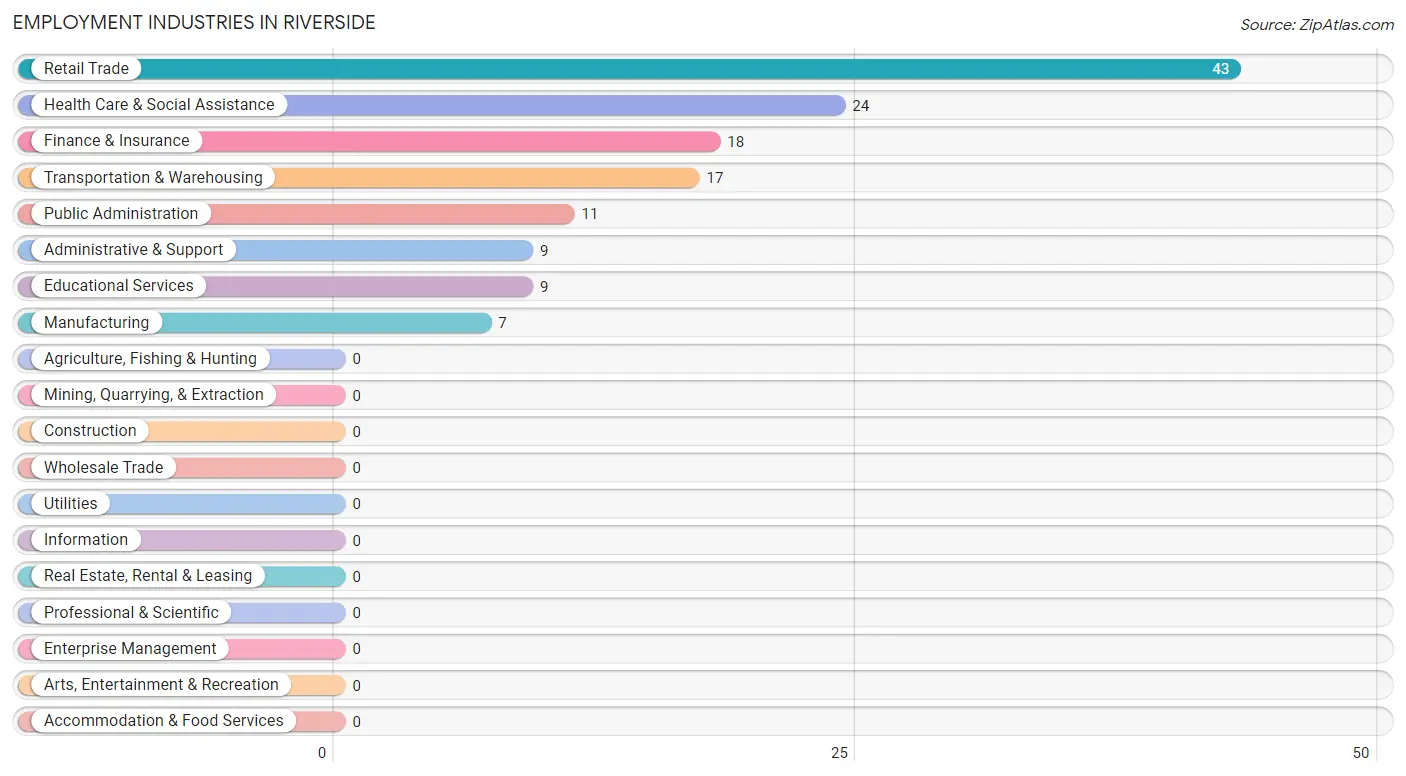
Employment Industries in Riverside
The major employment industries in Riverside include Retail Trade (43 | 31.2%), Health Care & Social Assistance (24 | 17.4%), Finance & Insurance (18 | 13.0%), Transportation & Warehousing (17 | 12.3%), and Public Administration (11 | 8.0%).
Employment Industries by Sex in Riverside
The Riverside industries that see more men than women are Manufacturing (100.0%), Finance & Insurance (100.0%), and Administrative & Support (100.0%), whereas the industries that tend to have a higher number of women are Educational Services (100.0%), Transportation & Warehousing (64.7%), and Retail Trade (62.8%).
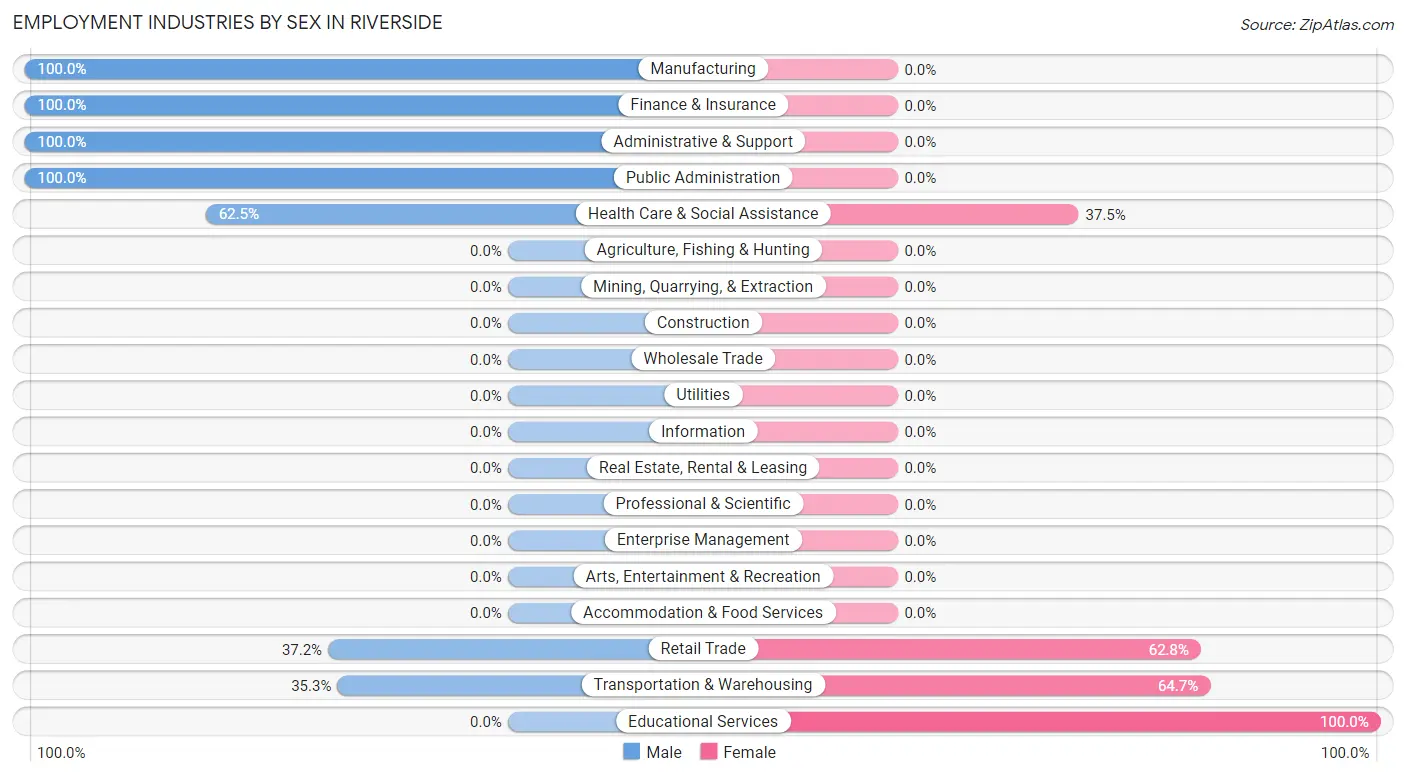
| Industry | Male | Female |
| Agriculture, Fishing & Hunting | 0 (0.0%) | 0 (0.0%) |
| Mining, Quarrying, & Extraction | 0 (0.0%) | 0 (0.0%) |
| Construction | 0 (0.0%) | 0 (0.0%) |
| Manufacturing | 7 (100.0%) | 0 (0.0%) |
| Wholesale Trade | 0 (0.0%) | 0 (0.0%) |
| Retail Trade | 16 (37.2%) | 27 (62.8%) |
| Transportation & Warehousing | 6 (35.3%) | 11 (64.7%) |
| Utilities | 0 (0.0%) | 0 (0.0%) |
| Information | 0 (0.0%) | 0 (0.0%) |
| Finance & Insurance | 18 (100.0%) | 0 (0.0%) |
| Real Estate, Rental & Leasing | 0 (0.0%) | 0 (0.0%) |
| Professional & Scientific | 0 (0.0%) | 0 (0.0%) |
| Enterprise Management | 0 (0.0%) | 0 (0.0%) |
| Administrative & Support | 9 (100.0%) | 0 (0.0%) |
| Educational Services | 0 (0.0%) | 9 (100.0%) |
| Health Care & Social Assistance | 15 (62.5%) | 9 (37.5%) |
| Arts, Entertainment & Recreation | 0 (0.0%) | 0 (0.0%) |
| Accommodation & Food Services | 0 (0.0%) | 0 (0.0%) |
| Public Administration | 11 (100.0%) | 0 (0.0%) |
| Total | 82 (59.4%) | 56 (40.6%) |
Education in Riverside
School Enrollment in Riverside
The most common levels of schooling among the 23 students in Riverside are college / undergraduate (9 | 39.1%), nursery / preschool (7 | 30.4%), and middle school (7 | 30.4%).
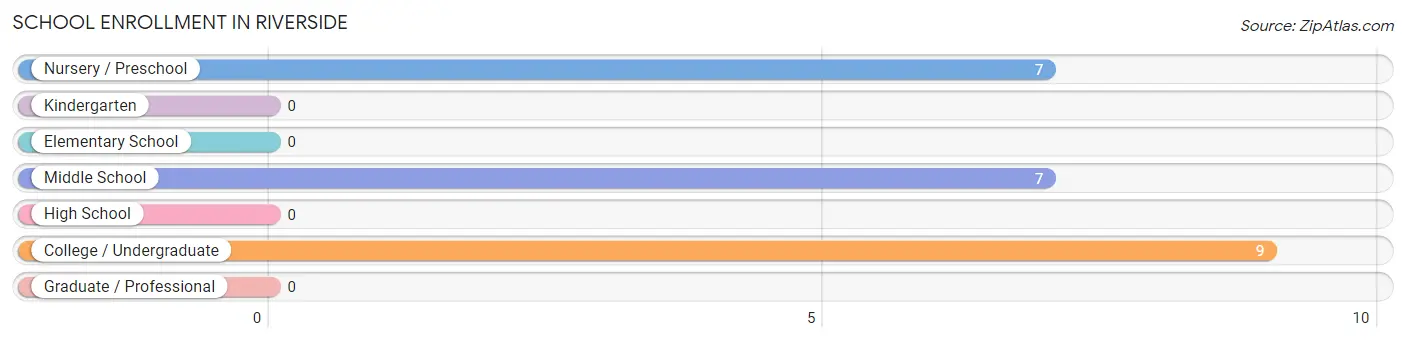
| School Level | # Students | % Students |
| Nursery / Preschool | 7 | 30.4% |
| Kindergarten | 0 | 0.0% |
| Elementary School | 0 | 0.0% |
| Middle School | 7 | 30.4% |
| High School | 0 | 0.0% |
| College / Undergraduate | 9 | 39.1% |
| Graduate / Professional | 0 | 0.0% |
| Total | 23 | 100.0% |
School Enrollment by Age by Funding Source in Riverside
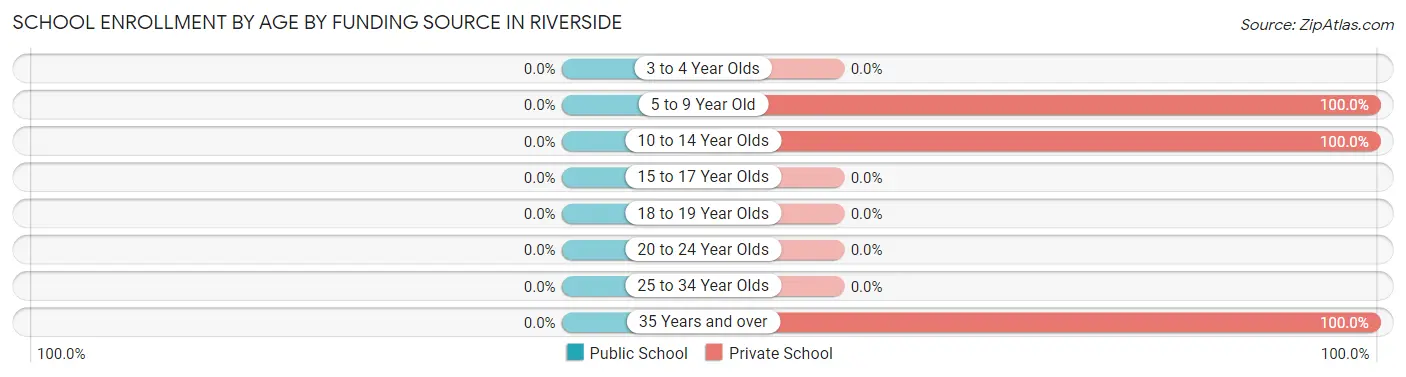
| Age Bracket | Public School | Private School |
| 3 to 4 Year Olds | 0 (0.0%) | 0 (0.0%) |
| 5 to 9 Year Old | 0 (0.0%) | 7 (100.0%) |
| 10 to 14 Year Olds | 0 (0.0%) | 7 (100.0%) |
| 15 to 17 Year Olds | 0 (0.0%) | 0 (0.0%) |
| 18 to 19 Year Olds | 0 (0.0%) | 0 (0.0%) |
| 20 to 24 Year Olds | 0 (0.0%) | 0 (0.0%) |
| 25 to 34 Year Olds | 0 (0.0%) | 0 (0.0%) |
| 35 Years and over | 0 (0.0%) | 9 (100.0%) |
| Total | 0 (0.0%) | 23 (100.0%) |
Educational Attainment by Field of Study in Riverside
Business (8 | 36.4%), communications (8 | 36.4%), and arts & humanities (6 | 27.3%) are the most common fields of study among 22 individuals in Riverside who have obtained a bachelor's degree or higher.
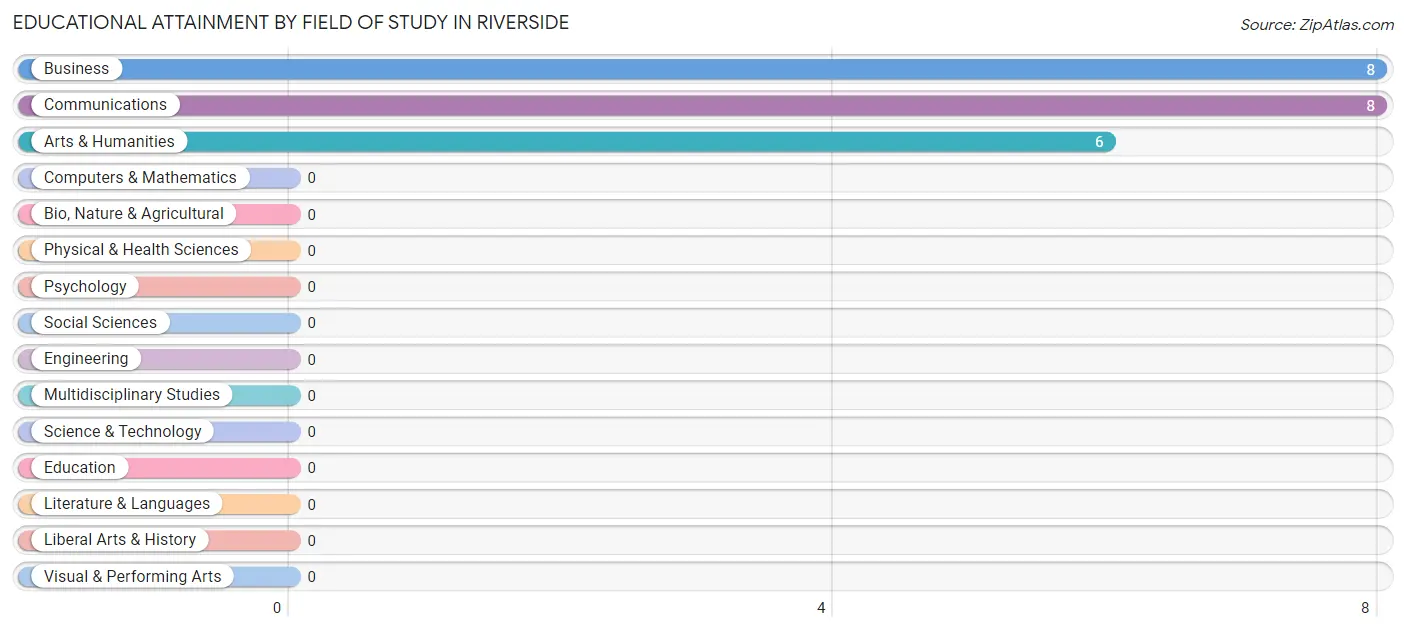
| Field of Study | # Graduates | % Graduates |
| Computers & Mathematics | 0 | 0.0% |
| Bio, Nature & Agricultural | 0 | 0.0% |
| Physical & Health Sciences | 0 | 0.0% |
| Psychology | 0 | 0.0% |
| Social Sciences | 0 | 0.0% |
| Engineering | 0 | 0.0% |
| Multidisciplinary Studies | 0 | 0.0% |
| Science & Technology | 0 | 0.0% |
| Business | 8 | 36.4% |
| Education | 0 | 0.0% |
| Literature & Languages | 0 | 0.0% |
| Liberal Arts & History | 0 | 0.0% |
| Visual & Performing Arts | 0 | 0.0% |
| Communications | 8 | 36.4% |
| Arts & Humanities | 6 | 27.3% |
| Total | 22 | 100.0% |
Transportation & Commute in Riverside
Vehicle Availability by Sex in Riverside
The most prevalent vehicle ownership categories in Riverside are males with 2 vehicles (63, accounting for 76.8%) and females with 2 vehicles (27, making up 175.0%).
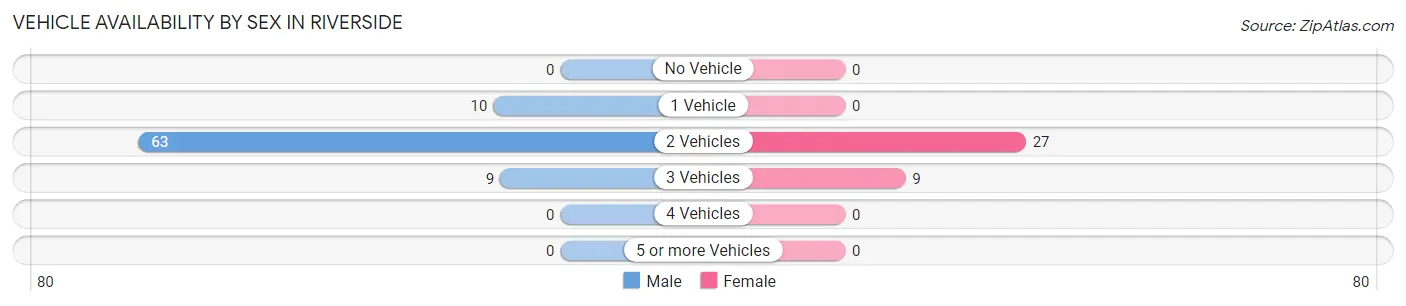
| Vehicles Available | Male | Female |
| No Vehicle | 0 (0.0%) | 0 (0.0%) |
| 1 Vehicle | 10 (12.2%) | 0 (0.0%) |
| 2 Vehicles | 63 (76.8%) | 27 (75.0%) |
| 3 Vehicles | 9 (11.0%) | 9 (25.0%) |
| 4 Vehicles | 0 (0.0%) | 0 (0.0%) |
| 5 or more Vehicles | 0 (0.0%) | 0 (0.0%) |
| Total | 82 (100.0%) | 36 (100.0%) |
Commute Time in Riverside
The most frequently occuring commute durations in Riverside are 15 to 19 minutes (57 commuters, 57.6%), 30 to 34 minutes (15 commuters, 15.1%), and 10 to 14 minutes (8 commuters, 8.1%).
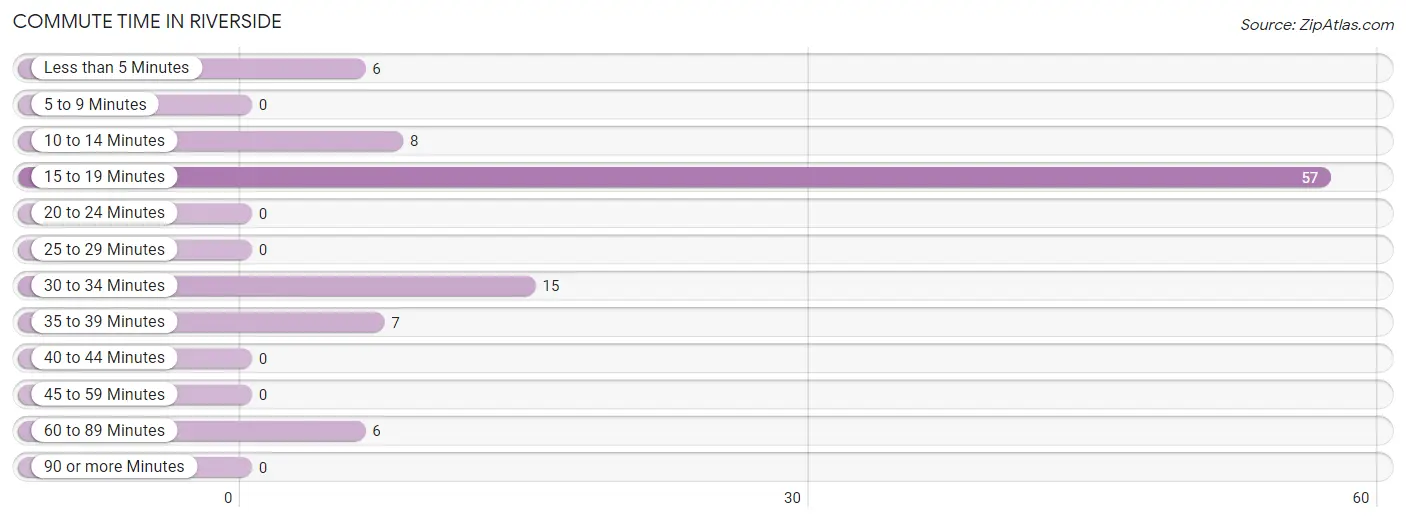
| Commute Time | # Commuters | % Commuters |
| Less than 5 Minutes | 6 | 6.1% |
| 5 to 9 Minutes | 0 | 0.0% |
| 10 to 14 Minutes | 8 | 8.1% |
| 15 to 19 Minutes | 57 | 57.6% |
| 20 to 24 Minutes | 0 | 0.0% |
| 25 to 29 Minutes | 0 | 0.0% |
| 30 to 34 Minutes | 15 | 15.1% |
| 35 to 39 Minutes | 7 | 7.1% |
| 40 to 44 Minutes | 0 | 0.0% |
| 45 to 59 Minutes | 0 | 0.0% |
| 60 to 89 Minutes | 6 | 6.1% |
| 90 or more Minutes | 0 | 0.0% |
Commute Time by Sex in Riverside
The most common commute times in Riverside are 15 to 19 minutes (21 commuters, 33.3%) for males and 15 to 19 minutes (36 commuters, 100.0%) for females.
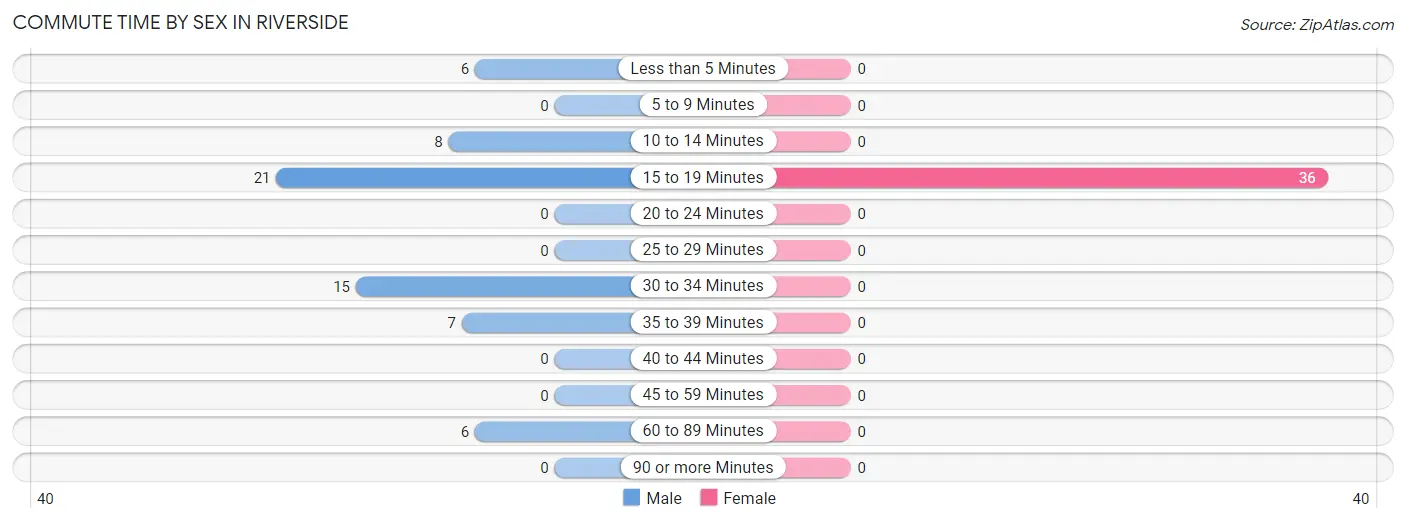
| Commute Time | Male | Female |
| Less than 5 Minutes | 6 (9.5%) | 0 (0.0%) |
| 5 to 9 Minutes | 0 (0.0%) | 0 (0.0%) |
| 10 to 14 Minutes | 8 (12.7%) | 0 (0.0%) |
| 15 to 19 Minutes | 21 (33.3%) | 36 (100.0%) |
| 20 to 24 Minutes | 0 (0.0%) | 0 (0.0%) |
| 25 to 29 Minutes | 0 (0.0%) | 0 (0.0%) |
| 30 to 34 Minutes | 15 (23.8%) | 0 (0.0%) |
| 35 to 39 Minutes | 7 (11.1%) | 0 (0.0%) |
| 40 to 44 Minutes | 0 (0.0%) | 0 (0.0%) |
| 45 to 59 Minutes | 0 (0.0%) | 0 (0.0%) |
| 60 to 89 Minutes | 6 (9.5%) | 0 (0.0%) |
| 90 or more Minutes | 0 (0.0%) | 0 (0.0%) |
Time of Departure to Work by Sex in Riverside
The most frequent times of departure to work in Riverside are 7:30 AM to 7:59 AM (19, 30.2%) for males and 6:30 AM to 6:59 AM (12, 33.3%) for females.
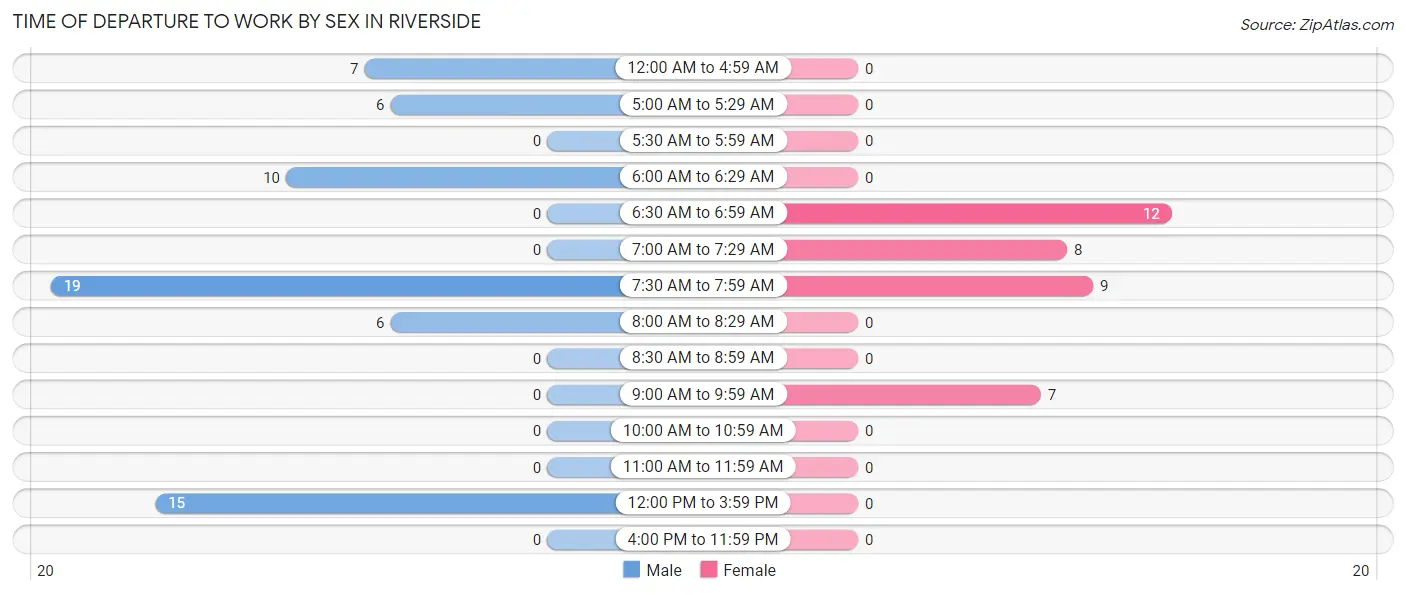
| Time of Departure | Male | Female |
| 12:00 AM to 4:59 AM | 7 (11.1%) | 0 (0.0%) |
| 5:00 AM to 5:29 AM | 6 (9.5%) | 0 (0.0%) |
| 5:30 AM to 5:59 AM | 0 (0.0%) | 0 (0.0%) |
| 6:00 AM to 6:29 AM | 10 (15.9%) | 0 (0.0%) |
| 6:30 AM to 6:59 AM | 0 (0.0%) | 12 (33.3%) |
| 7:00 AM to 7:29 AM | 0 (0.0%) | 8 (22.2%) |
| 7:30 AM to 7:59 AM | 19 (30.2%) | 9 (25.0%) |
| 8:00 AM to 8:29 AM | 6 (9.5%) | 0 (0.0%) |
| 8:30 AM to 8:59 AM | 0 (0.0%) | 0 (0.0%) |
| 9:00 AM to 9:59 AM | 0 (0.0%) | 7 (19.4%) |
| 10:00 AM to 10:59 AM | 0 (0.0%) | 0 (0.0%) |
| 11:00 AM to 11:59 AM | 0 (0.0%) | 0 (0.0%) |
| 12:00 PM to 3:59 PM | 15 (23.8%) | 0 (0.0%) |
| 4:00 PM to 11:59 PM | 0 (0.0%) | 0 (0.0%) |
| Total | 63 (100.0%) | 36 (100.0%) |
Housing Occupancy in Riverside
Occupancy by Ownership in Riverside
Of the total 127 dwellings in Riverside, owner-occupied units account for 105 (82.7%), while renter-occupied units make up 22 (17.3%).
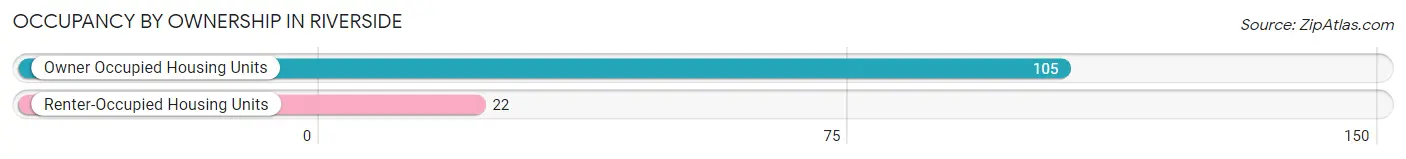
| Occupancy | # Housing Units | % Housing Units |
| Owner Occupied Housing Units | 105 | 82.7% |
| Renter-Occupied Housing Units | 22 | 17.3% |
| Total Occupied Housing Units | 127 | 100.0% |
Occupancy by Household Size in Riverside
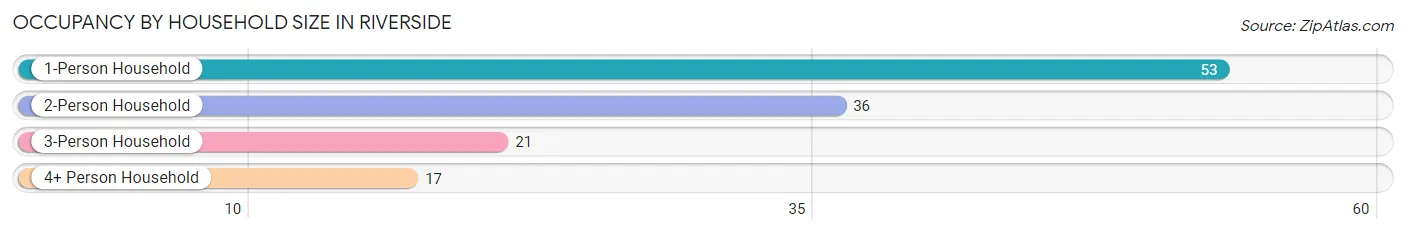
| Household Size | # Housing Units | % Housing Units |
| 1-Person Household | 53 | 41.7% |
| 2-Person Household | 36 | 28.3% |
| 3-Person Household | 21 | 16.5% |
| 4+ Person Household | 17 | 13.4% |
| Total Housing Units | 127 | 100.0% |
Occupancy by Ownership by Household Size in Riverside
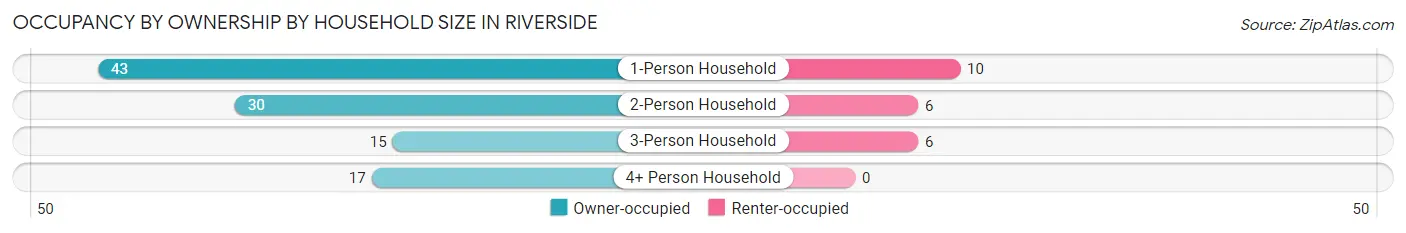
| Household Size | Owner-occupied | Renter-occupied |
| 1-Person Household | 43 (81.1%) | 10 (18.9%) |
| 2-Person Household | 30 (83.3%) | 6 (16.7%) |
| 3-Person Household | 15 (71.4%) | 6 (28.6%) |
| 4+ Person Household | 17 (100.0%) | 0 (0.0%) |
| Total Housing Units | 105 (82.7%) | 22 (17.3%) |
Occupancy by Educational Attainment in Riverside
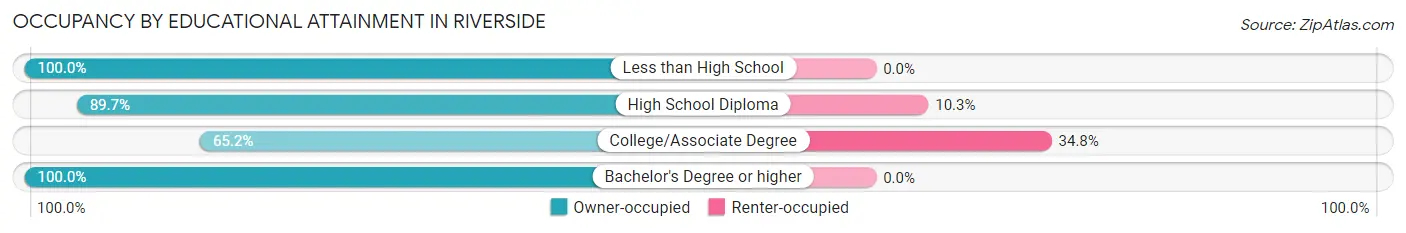
| Household Size | Owner-occupied | Renter-occupied |
| Less than High School | 9 (100.0%) | 0 (0.0%) |
| High School Diploma | 52 (89.7%) | 6 (10.3%) |
| College/Associate Degree | 30 (65.2%) | 16 (34.8%) |
| Bachelor's Degree or higher | 14 (100.0%) | 0 (0.0%) |
Occupancy by Age of Householder in Riverside
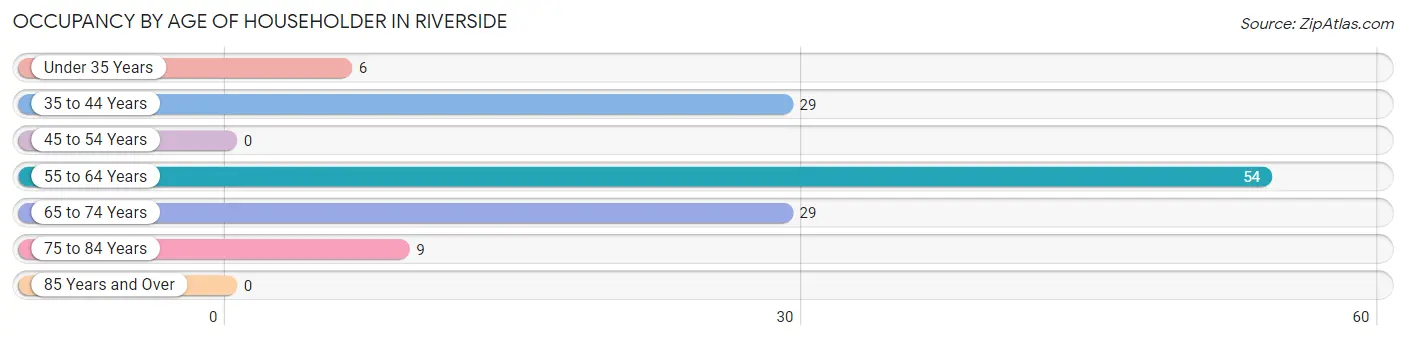
| Age Bracket | # Households | % Households |
| Under 35 Years | 6 | 4.7% |
| 35 to 44 Years | 29 | 22.8% |
| 45 to 54 Years | 0 | 0.0% |
| 55 to 64 Years | 54 | 42.5% |
| 65 to 74 Years | 29 | 22.8% |
| 75 to 84 Years | 9 | 7.1% |
| 85 Years and Over | 0 | 0.0% |
| Total | 127 | 100.0% |
Housing Finances in Riverside
Median Income by Occupancy in Riverside
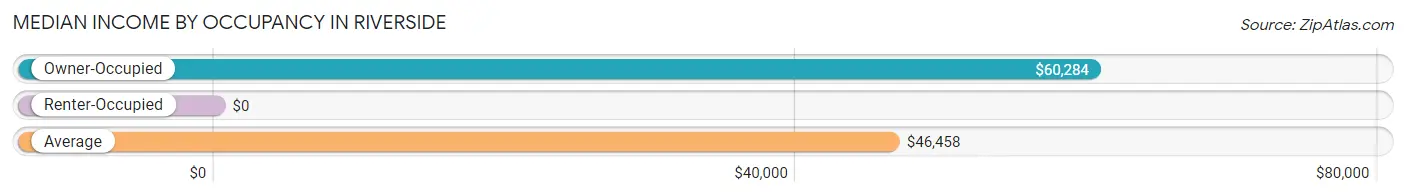
| Occupancy Type | # Households | Median Income |
| Owner-Occupied | 105 (82.7%) | $60,284 |
| Renter-Occupied | 22 (17.3%) | $0 |
| Average | 127 (100.0%) | $46,458 |
Occupancy by Householder Income Bracket in Riverside
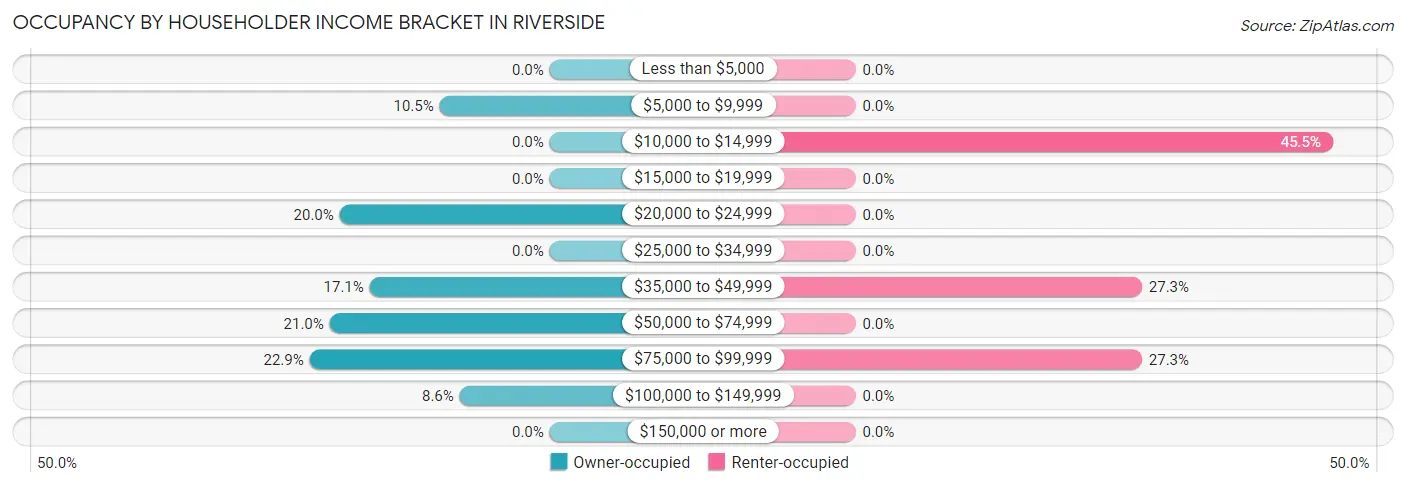
| Income Bracket | Owner-occupied | Renter-occupied |
| Less than $5,000 | 0 (0.0%) | 0 (0.0%) |
| $5,000 to $9,999 | 11 (10.5%) | 0 (0.0%) |
| $10,000 to $14,999 | 0 (0.0%) | 10 (45.5%) |
| $15,000 to $19,999 | 0 (0.0%) | 0 (0.0%) |
| $20,000 to $24,999 | 21 (20.0%) | 0 (0.0%) |
| $25,000 to $34,999 | 0 (0.0%) | 0 (0.0%) |
| $35,000 to $49,999 | 18 (17.1%) | 6 (27.3%) |
| $50,000 to $74,999 | 22 (20.9%) | 0 (0.0%) |
| $75,000 to $99,999 | 24 (22.9%) | 6 (27.3%) |
| $100,000 to $149,999 | 9 (8.6%) | 0 (0.0%) |
| $150,000 or more | 0 (0.0%) | 0 (0.0%) |
| Total | 105 (100.0%) | 22 (100.0%) |
Monthly Housing Cost Tiers in Riverside
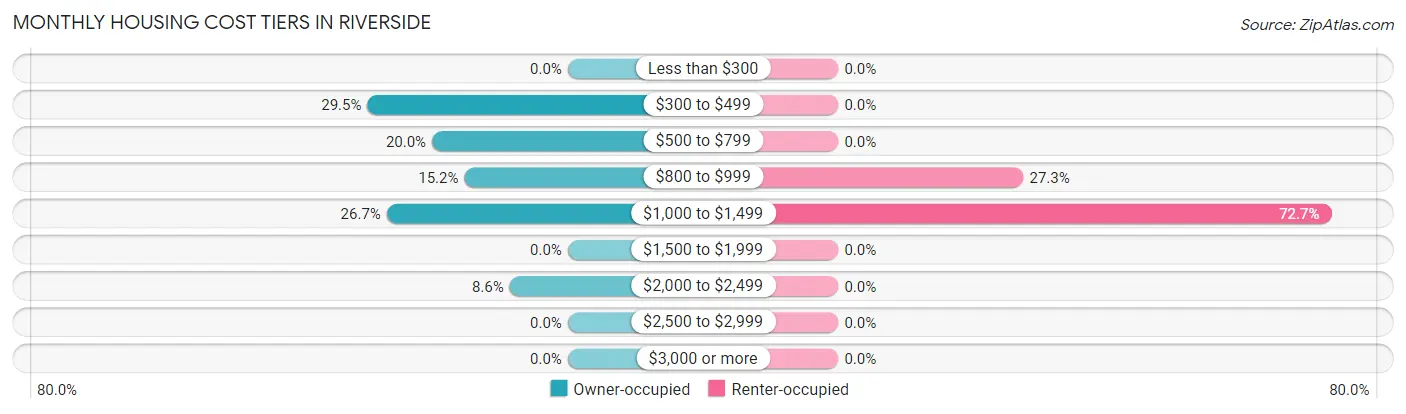
| Monthly Cost | Owner-occupied | Renter-occupied |
| Less than $300 | 0 (0.0%) | 0 (0.0%) |
| $300 to $499 | 31 (29.5%) | 0 (0.0%) |
| $500 to $799 | 21 (20.0%) | 0 (0.0%) |
| $800 to $999 | 16 (15.2%) | 6 (27.3%) |
| $1,000 to $1,499 | 28 (26.7%) | 16 (72.7%) |
| $1,500 to $1,999 | 0 (0.0%) | 0 (0.0%) |
| $2,000 to $2,499 | 9 (8.6%) | 0 (0.0%) |
| $2,500 to $2,999 | 0 (0.0%) | 0 (0.0%) |
| $3,000 or more | 0 (0.0%) | 0 (0.0%) |
| Total | 105 (100.0%) | 22 (100.0%) |
Physical Housing Characteristics in Riverside
Housing Structures in Riverside
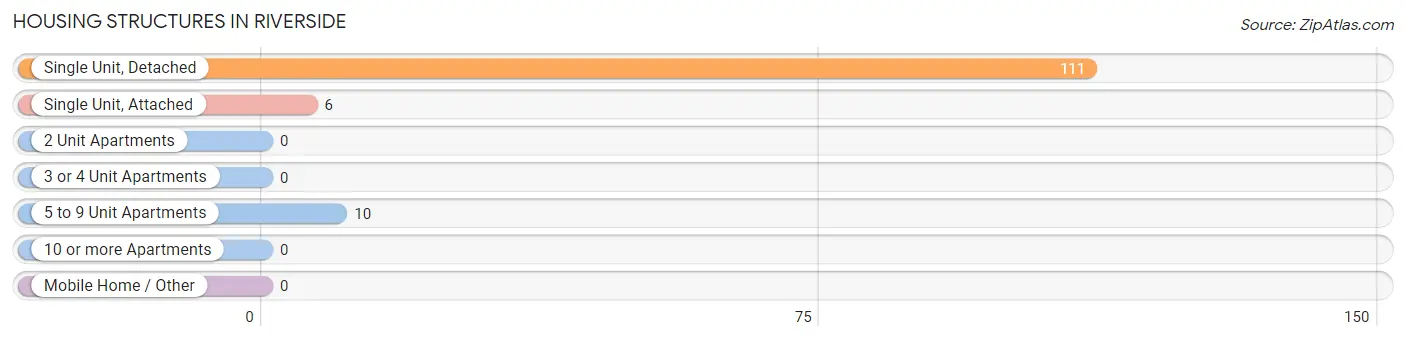
| Structure Type | # Housing Units | % Housing Units |
| Single Unit, Detached | 111 | 87.4% |
| Single Unit, Attached | 6 | 4.7% |
| 2 Unit Apartments | 0 | 0.0% |
| 3 or 4 Unit Apartments | 0 | 0.0% |
| 5 to 9 Unit Apartments | 10 | 7.9% |
| 10 or more Apartments | 0 | 0.0% |
| Mobile Home / Other | 0 | 0.0% |
| Total | 127 | 100.0% |
Housing Structures by Occupancy in Riverside
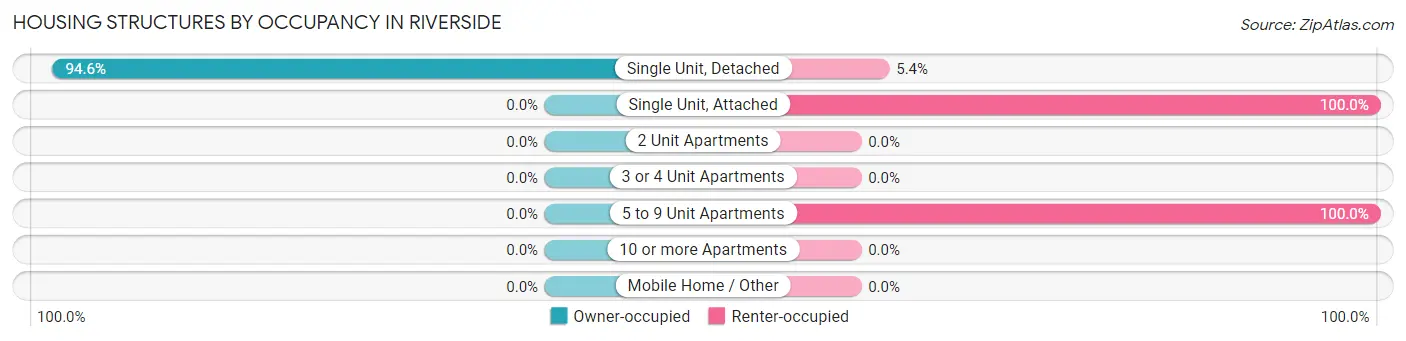
| Structure Type | Owner-occupied | Renter-occupied |
| Single Unit, Detached | 105 (94.6%) | 6 (5.4%) |
| Single Unit, Attached | 0 (0.0%) | 6 (100.0%) |
| 2 Unit Apartments | 0 (0.0%) | 0 (0.0%) |
| 3 or 4 Unit Apartments | 0 (0.0%) | 0 (0.0%) |
| 5 to 9 Unit Apartments | 0 (0.0%) | 10 (100.0%) |
| 10 or more Apartments | 0 (0.0%) | 0 (0.0%) |
| Mobile Home / Other | 0 (0.0%) | 0 (0.0%) |
| Total | 105 (82.7%) | 22 (17.3%) |
Housing Structures by Number of Rooms in Riverside
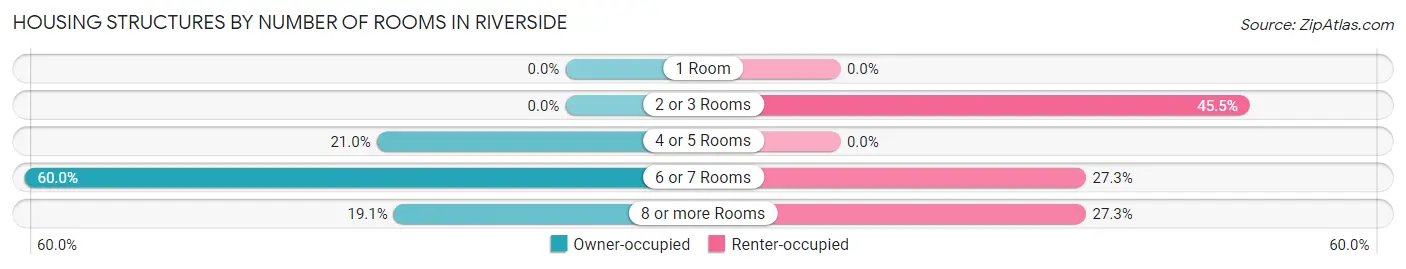
| Number of Rooms | Owner-occupied | Renter-occupied |
| 1 Room | 0 (0.0%) | 0 (0.0%) |
| 2 or 3 Rooms | 0 (0.0%) | 10 (45.5%) |
| 4 or 5 Rooms | 22 (20.9%) | 0 (0.0%) |
| 6 or 7 Rooms | 63 (60.0%) | 6 (27.3%) |
| 8 or more Rooms | 20 (19.1%) | 6 (27.3%) |
| Total | 105 (100.0%) | 22 (100.0%) |
Housing Structure by Heating Type in Riverside
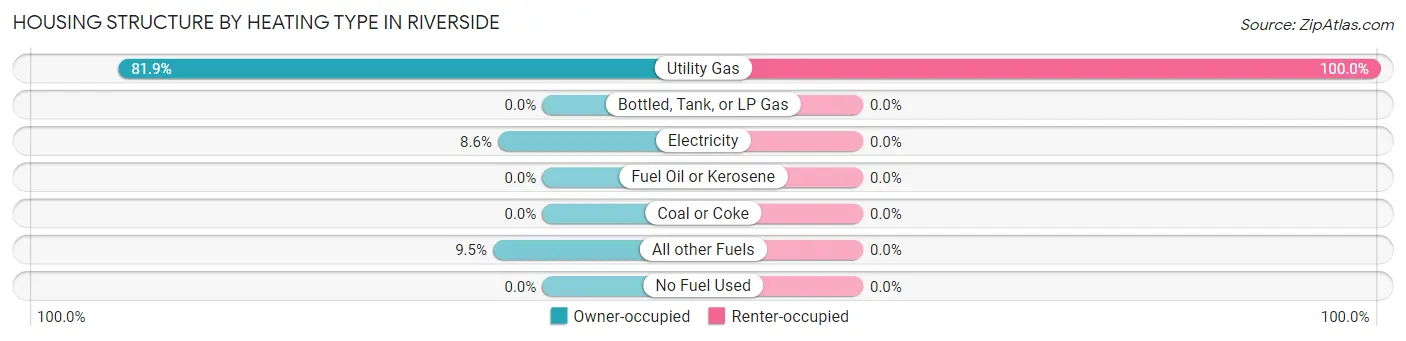
| Heating Type | Owner-occupied | Renter-occupied |
| Utility Gas | 86 (81.9%) | 22 (100.0%) |
| Bottled, Tank, or LP Gas | 0 (0.0%) | 0 (0.0%) |
| Electricity | 9 (8.6%) | 0 (0.0%) |
| Fuel Oil or Kerosene | 0 (0.0%) | 0 (0.0%) |
| Coal or Coke | 0 (0.0%) | 0 (0.0%) |
| All other Fuels | 10 (9.5%) | 0 (0.0%) |
| No Fuel Used | 0 (0.0%) | 0 (0.0%) |
| Total | 105 (100.0%) | 22 (100.0%) |
Household Vehicle Usage in Riverside
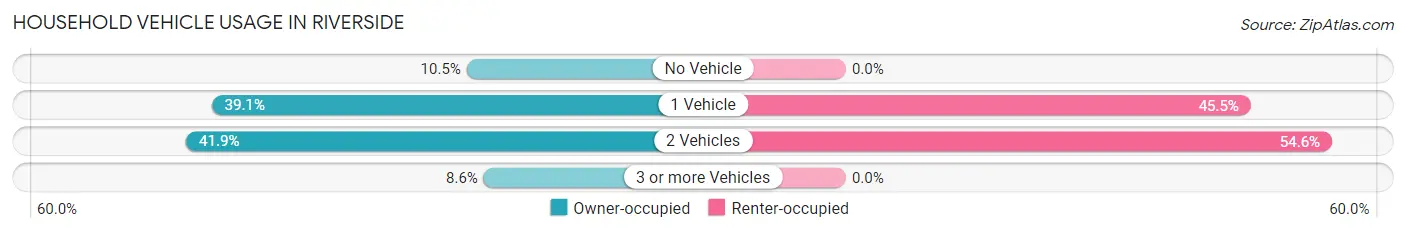
| Vehicles per Household | Owner-occupied | Renter-occupied |
| No Vehicle | 11 (10.5%) | 0 (0.0%) |
| 1 Vehicle | 41 (39.1%) | 10 (45.5%) |
| 2 Vehicles | 44 (41.9%) | 12 (54.5%) |
| 3 or more Vehicles | 9 (8.6%) | 0 (0.0%) |
| Total | 105 (100.0%) | 22 (100.0%) |
Real Estate & Mortgages in Riverside
Real Estate and Mortgage Overview in Riverside
| Characteristic | Without Mortgage | With Mortgage |
| Housing Units | 41 | 64 |
| Median Property Value | $58,600 | $87,000 |
| Median Household Income | $60,114 | $0 |
| Monthly Housing Costs | $405 | $0 |
| Real Estate Taxes | - | - |
Property Value by Mortgage Status in Riverside
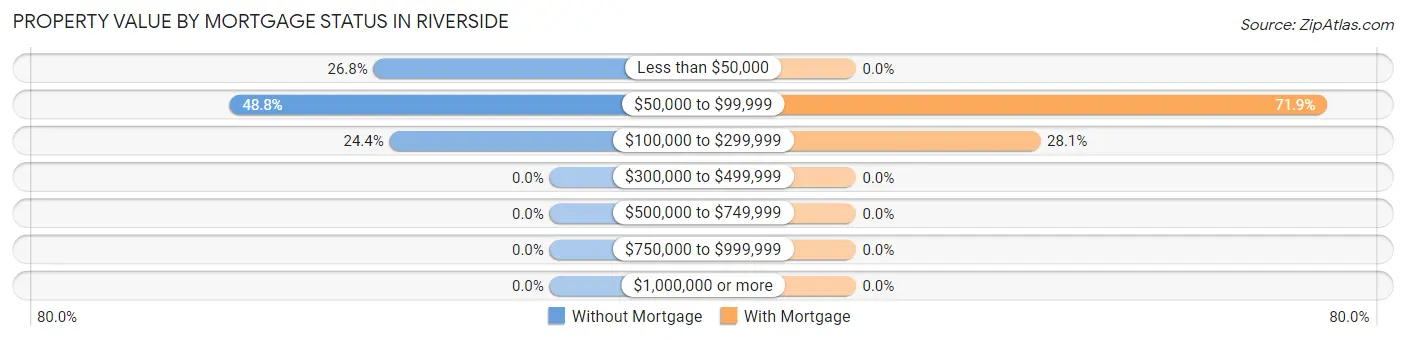
| Property Value | Without Mortgage | With Mortgage |
| Less than $50,000 | 11 (26.8%) | 0 (0.0%) |
| $50,000 to $99,999 | 20 (48.8%) | 46 (71.9%) |
| $100,000 to $299,999 | 10 (24.4%) | 18 (28.1%) |
| $300,000 to $499,999 | 0 (0.0%) | 0 (0.0%) |
| $500,000 to $749,999 | 0 (0.0%) | 0 (0.0%) |
| $750,000 to $999,999 | 0 (0.0%) | 0 (0.0%) |
| $1,000,000 or more | 0 (0.0%) | 0 (0.0%) |
| Total | 41 (100.0%) | 64 (100.0%) |
Household Income by Mortgage Status in Riverside
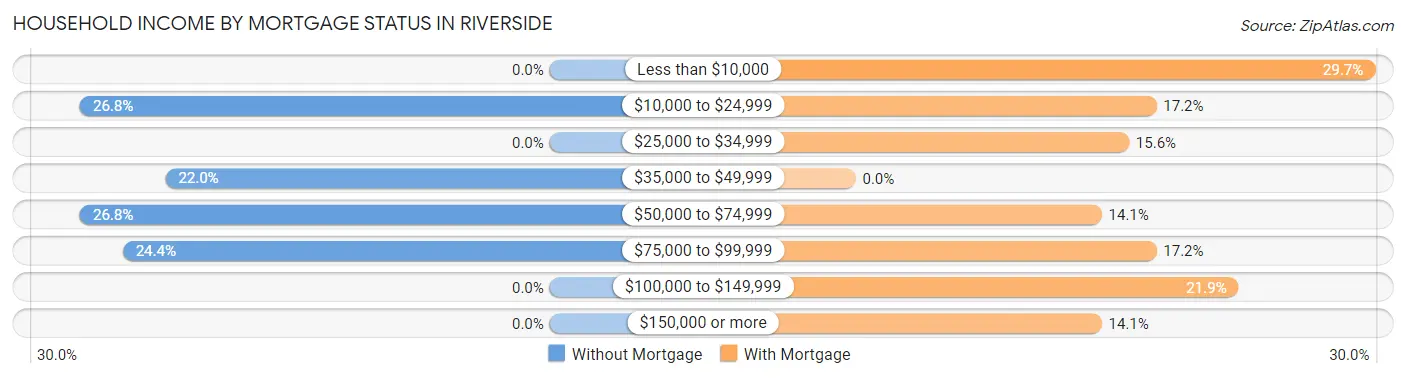
| Household Income | Without Mortgage | With Mortgage |
| Less than $10,000 | 0 (0.0%) | 19 (29.7%) |
| $10,000 to $24,999 | 11 (26.8%) | 11 (17.2%) |
| $25,000 to $34,999 | 0 (0.0%) | 10 (15.6%) |
| $35,000 to $49,999 | 9 (22.0%) | 0 (0.0%) |
| $50,000 to $74,999 | 11 (26.8%) | 9 (14.1%) |
| $75,000 to $99,999 | 10 (24.4%) | 11 (17.2%) |
| $100,000 to $149,999 | 0 (0.0%) | 14 (21.9%) |
| $150,000 or more | 0 (0.0%) | 9 (14.1%) |
| Total | 41 (100.0%) | 64 (100.0%) |
Property Value to Household Income Ratio in Riverside
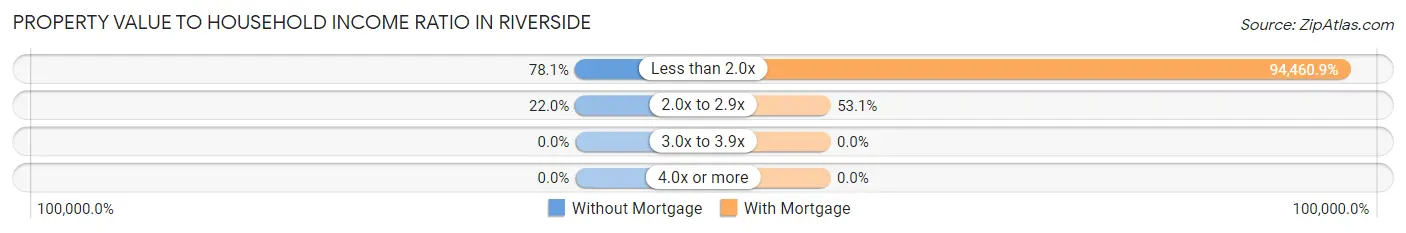
| Value-to-Income Ratio | Without Mortgage | With Mortgage |
| Less than 2.0x | 32 (78.0%) | 60,455 (94,460.9%) |
| 2.0x to 2.9x | 9 (22.0%) | 34 (53.1%) |
| 3.0x to 3.9x | 0 (0.0%) | 0 (0.0%) |
| 4.0x or more | 0 (0.0%) | 0 (0.0%) |
| Total | 41 (100.0%) | 64 (100.0%) |
Real Estate Taxes by Mortgage Status in Riverside
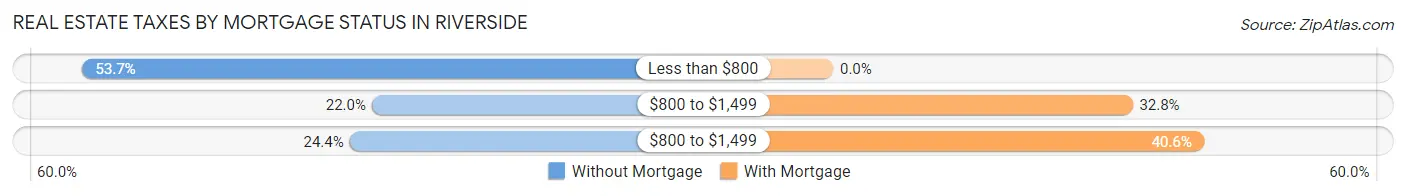
| Property Taxes | Without Mortgage | With Mortgage |
| Less than $800 | 22 (53.7%) | 0 (0.0%) |
| $800 to $1,499 | 9 (22.0%) | 21 (32.8%) |
| $800 to $1,499 | 10 (24.4%) | 26 (40.6%) |
| Total | 41 (100.0%) | 64 (100.0%) |
Health & Disability in Riverside
Health Insurance Coverage by Age in Riverside
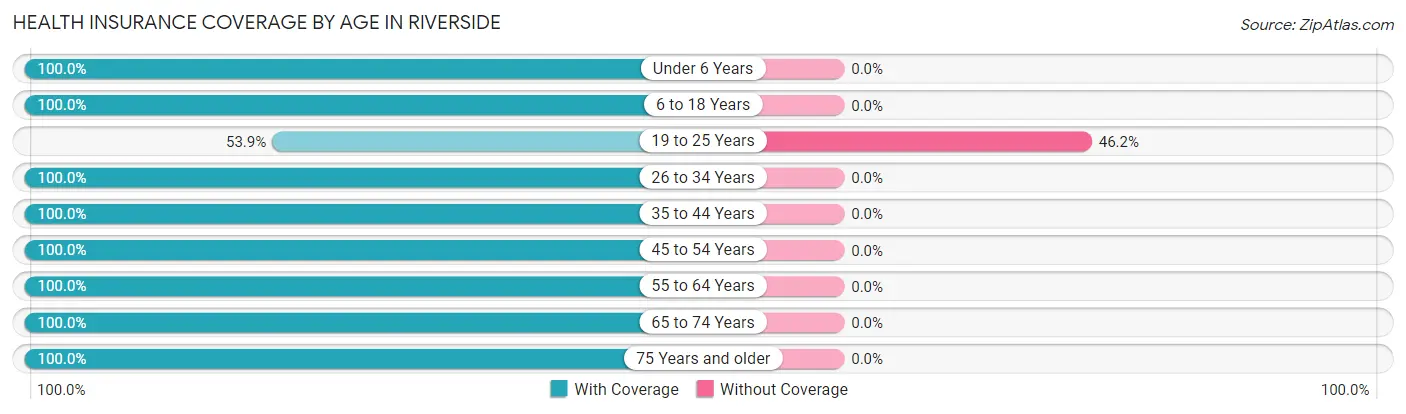
| Age Bracket | With Coverage | Without Coverage |
| Under 6 Years | 24 (100.0%) | 0 (0.0%) |
| 6 to 18 Years | 7 (100.0%) | 0 (0.0%) |
| 19 to 25 Years | 7 (53.8%) | 6 (46.2%) |
| 26 to 34 Years | 36 (100.0%) | 0 (0.0%) |
| 35 to 44 Years | 36 (100.0%) | 0 (0.0%) |
| 45 to 54 Years | 17 (100.0%) | 0 (0.0%) |
| 55 to 64 Years | 74 (100.0%) | 0 (0.0%) |
| 65 to 74 Years | 41 (100.0%) | 0 (0.0%) |
| 75 Years and older | 19 (100.0%) | 0 (0.0%) |
| Total | 261 (97.8%) | 6 (2.2%) |
Health Insurance Coverage by Citizenship Status in Riverside
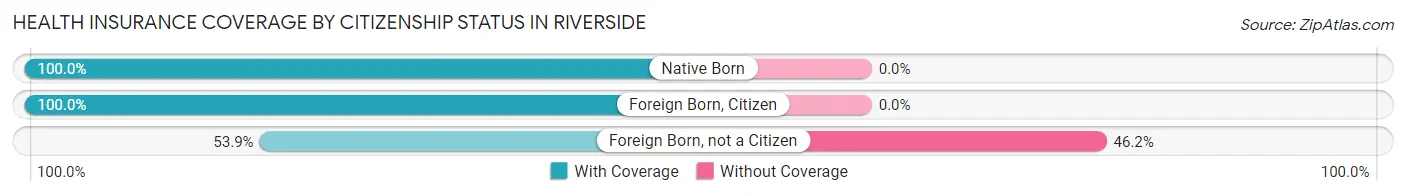
| Citizenship Status | With Coverage | Without Coverage |
| Native Born | 24 (100.0%) | 0 (0.0%) |
| Foreign Born, Citizen | 7 (100.0%) | 0 (0.0%) |
| Foreign Born, not a Citizen | 7 (53.8%) | 6 (46.2%) |
Health Insurance Coverage by Household Income in Riverside
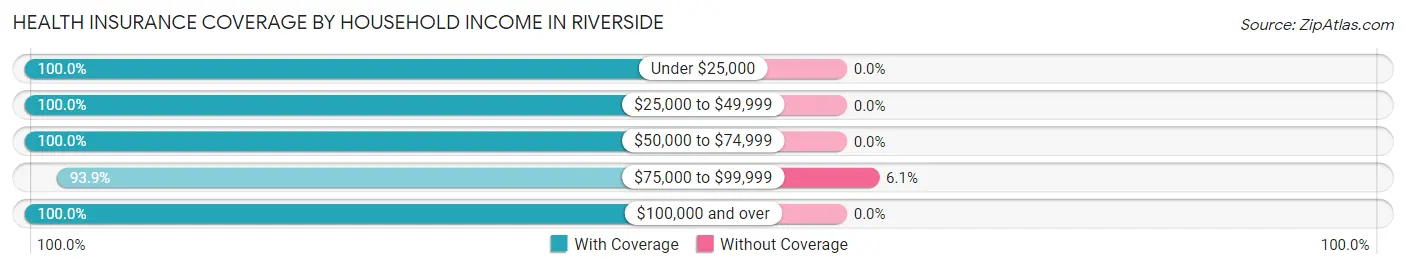
| Household Income | With Coverage | Without Coverage |
| Under $25,000 | 42 (100.0%) | 0 (0.0%) |
| $25,000 to $49,999 | 64 (100.0%) | 0 (0.0%) |
| $50,000 to $74,999 | 33 (100.0%) | 0 (0.0%) |
| $75,000 to $99,999 | 93 (93.9%) | 6 (6.1%) |
| $100,000 and over | 29 (100.0%) | 0 (0.0%) |
Public vs Private Health Insurance Coverage by Age in Riverside
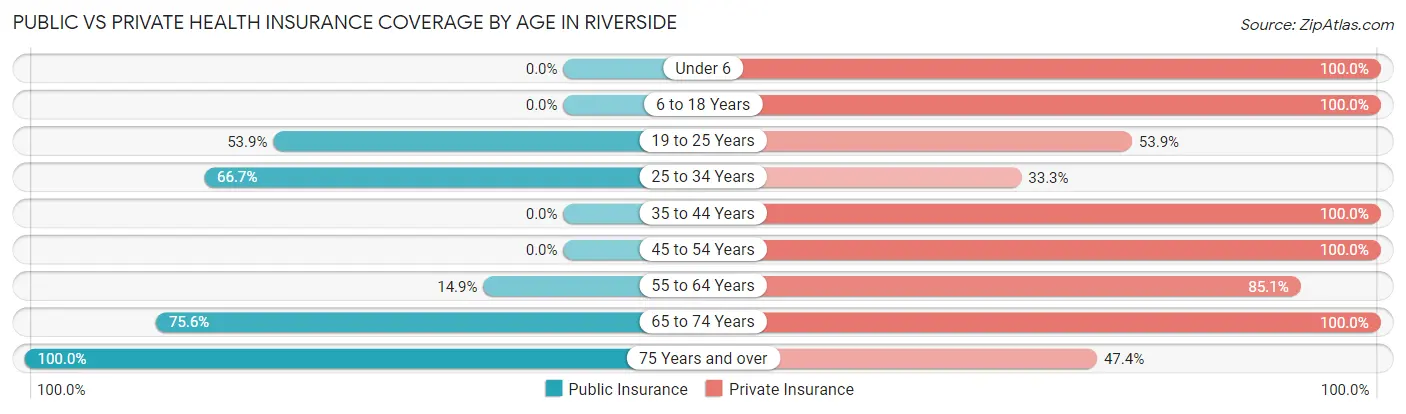
| Age Bracket | Public Insurance | Private Insurance |
| Under 6 | 0 (0.0%) | 24 (100.0%) |
| 6 to 18 Years | 0 (0.0%) | 7 (100.0%) |
| 19 to 25 Years | 7 (53.8%) | 7 (53.8%) |
| 25 to 34 Years | 24 (66.7%) | 12 (33.3%) |
| 35 to 44 Years | 0 (0.0%) | 36 (100.0%) |
| 45 to 54 Years | 0 (0.0%) | 17 (100.0%) |
| 55 to 64 Years | 11 (14.9%) | 63 (85.1%) |
| 65 to 74 Years | 31 (75.6%) | 41 (100.0%) |
| 75 Years and over | 19 (100.0%) | 9 (47.4%) |
| Total | 92 (34.5%) | 216 (80.9%) |
Disability Status by Sex by Age in Riverside
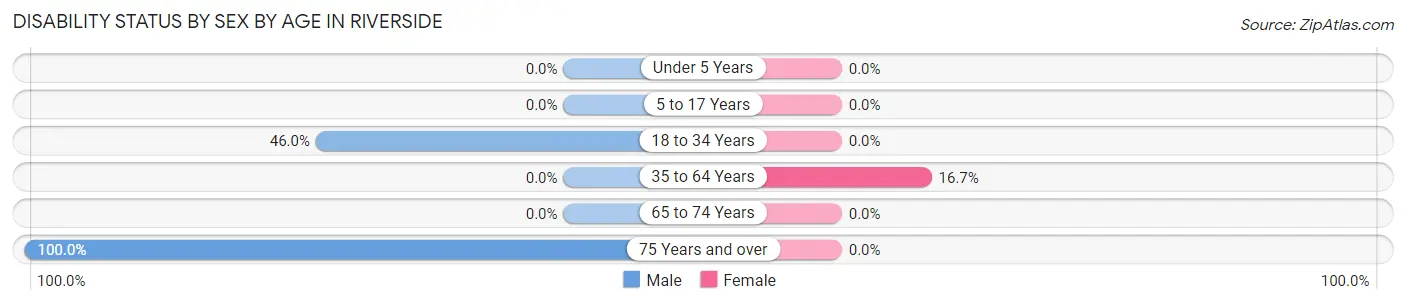
| Age Bracket | Male | Female |
| Under 5 Years | 0 (0.0%) | 0 (0.0%) |
| 5 to 17 Years | 0 (0.0%) | 0 (0.0%) |
| 18 to 34 Years | 17 (46.0%) | 0 (0.0%) |
| 35 to 64 Years | 0 (0.0%) | 11 (16.7%) |
| 65 to 74 Years | 0 (0.0%) | 0 (0.0%) |
| 75 Years and over | 9 (100.0%) | 0 (0.0%) |
Disability Class by Sex by Age in Riverside
Disability Class: Hearing Difficulty
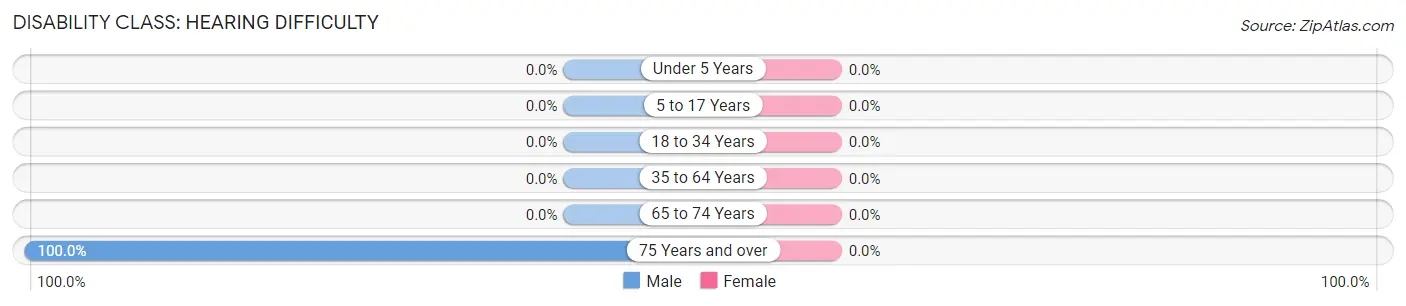
| Age Bracket | Male | Female |
| Under 5 Years | 0 (0.0%) | 0 (0.0%) |
| 5 to 17 Years | 0 (0.0%) | 0 (0.0%) |
| 18 to 34 Years | 0 (0.0%) | 0 (0.0%) |
| 35 to 64 Years | 0 (0.0%) | 0 (0.0%) |
| 65 to 74 Years | 0 (0.0%) | 0 (0.0%) |
| 75 Years and over | 9 (100.0%) | 0 (0.0%) |
Disability Class: Vision Difficulty
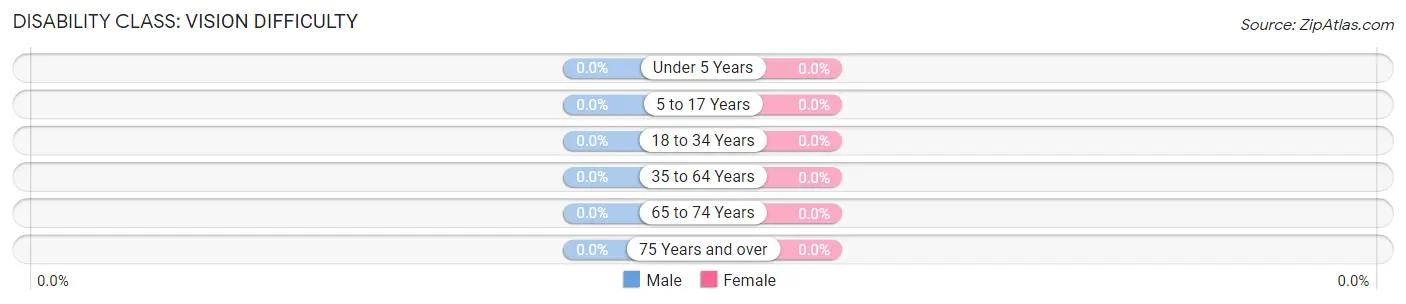
| Age Bracket | Male | Female |
| Under 5 Years | 0 (0.0%) | 0 (0.0%) |
| 5 to 17 Years | 0 (0.0%) | 0 (0.0%) |
| 18 to 34 Years | 0 (0.0%) | 0 (0.0%) |
| 35 to 64 Years | 0 (0.0%) | 0 (0.0%) |
| 65 to 74 Years | 0 (0.0%) | 0 (0.0%) |
| 75 Years and over | 0 (0.0%) | 0 (0.0%) |
Disability Class: Cognitive Difficulty
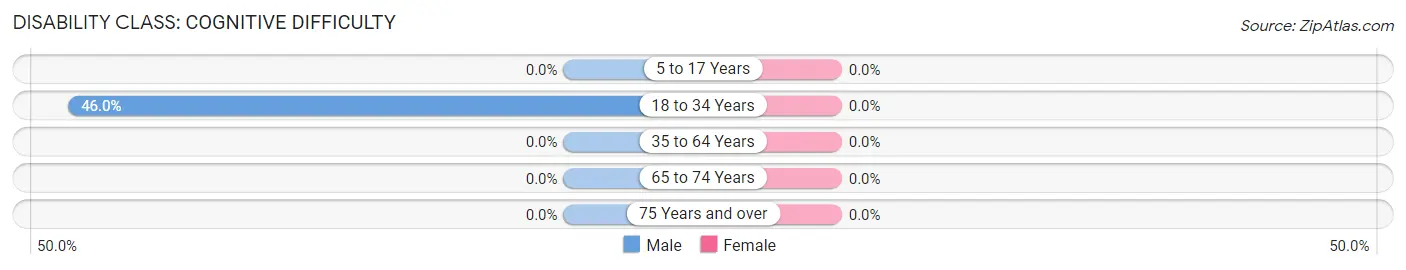
| Age Bracket | Male | Female |
| 5 to 17 Years | 0 (0.0%) | 0 (0.0%) |
| 18 to 34 Years | 17 (46.0%) | 0 (0.0%) |
| 35 to 64 Years | 0 (0.0%) | 0 (0.0%) |
| 65 to 74 Years | 0 (0.0%) | 0 (0.0%) |
| 75 Years and over | 0 (0.0%) | 0 (0.0%) |
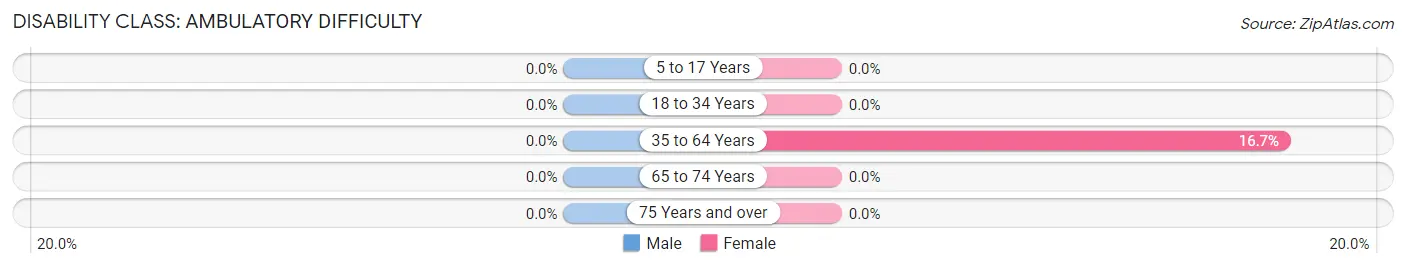
Disability Class: Ambulatory Difficulty
| Age Bracket | Male | Female |
| 5 to 17 Years | 0 (0.0%) | 0 (0.0%) |
| 18 to 34 Years | 0 (0.0%) | 0 (0.0%) |
| 35 to 64 Years | 0 (0.0%) | 11 (16.7%) |
| 65 to 74 Years | 0 (0.0%) | 0 (0.0%) |
| 75 Years and over | 0 (0.0%) | 0 (0.0%) |
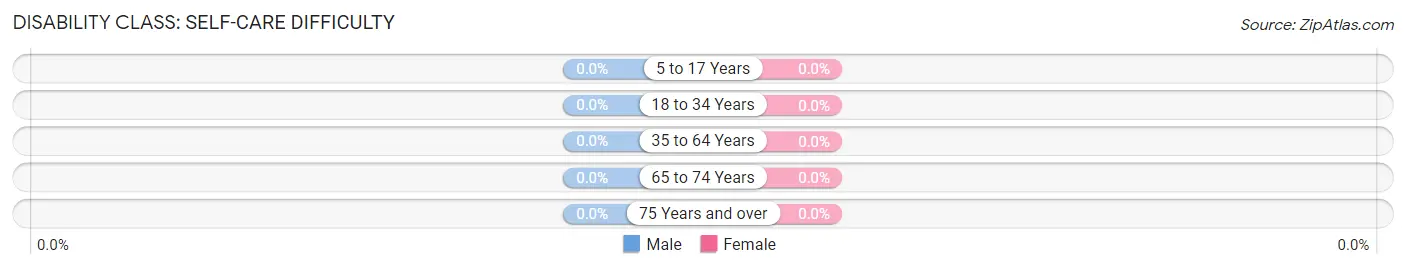
Disability Class: Self-Care Difficulty
| Age Bracket | Male | Female |
| 5 to 17 Years | 0 (0.0%) | 0 (0.0%) |
| 18 to 34 Years | 0 (0.0%) | 0 (0.0%) |
| 35 to 64 Years | 0 (0.0%) | 0 (0.0%) |
| 65 to 74 Years | 0 (0.0%) | 0 (0.0%) |
| 75 Years and over | 0 (0.0%) | 0 (0.0%) |
Technology Access in Riverside
Computing Device Access in Riverside
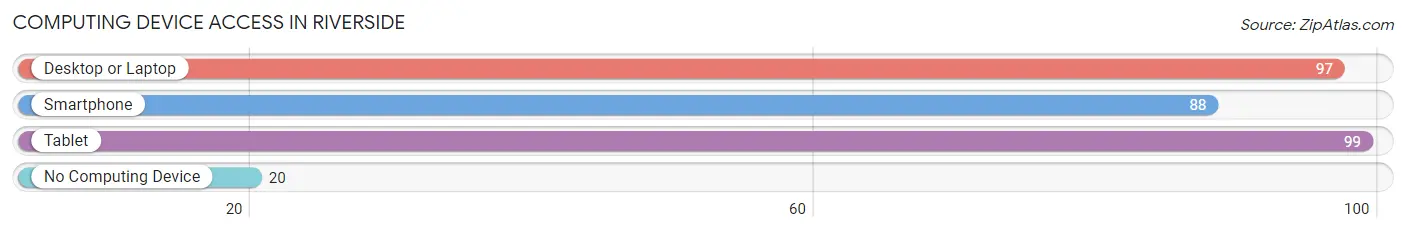
| Device Type | # Households | % Households |
| Desktop or Laptop | 97 | 76.4% |
| Smartphone | 88 | 69.3% |
| Tablet | 99 | 77.9% |
| No Computing Device | 20 | 15.8% |
| Total | 127 | 100.0% |
Internet Access in Riverside
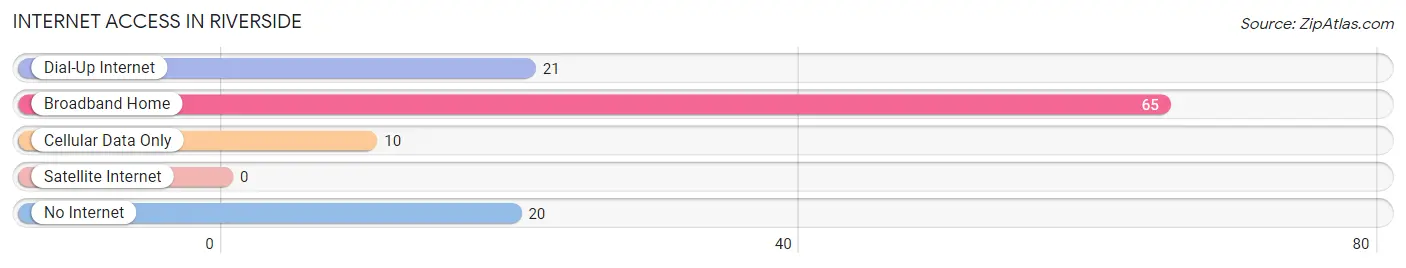
| Internet Type | # Households | % Households |
| Dial-Up Internet | 21 | 16.5% |
| Broadband Home | 65 | 51.2% |
| Cellular Data Only | 10 | 7.9% |
| Satellite Internet | 0 | 0.0% |
| No Internet | 20 | 15.8% |
| Total | 127 | 100.0% |
Riverside Summary
Riverside is a borough located in the western part of Beaver County, Pennsylvania, United States. The population was 1,845 at the 2010 census. It is part of the Pittsburgh Metropolitan Statistical Area.
History
Riverside was founded in 1832 by a group of settlers from the nearby town of Economy. The settlers chose the name Riverside because of its location on the banks of the Ohio River. The town was incorporated in 1867.
Riverside was a major industrial center in the late 19th and early 20th centuries. The town was home to several steel mills, coal mines, and other industries. The town was also home to the Riverside Iron Works, which produced iron products for the railroad industry.
Riverside was also home to the Riverside Amusement Park, which opened in 1906 and closed in the late 1970s. The park was home to several roller coasters, a carousel, and other attractions.
Geography
Riverside is located at 40°37'17" North, 80°20'45" West (40.6214, -80.3458). According to the United States Census Bureau, the borough has a total area of 0.7 square miles (1.8 km2), all of it land.
Economy
Riverside is home to several small businesses, including a few restaurants, a grocery store, and a few retail stores. The town is also home to a few manufacturing companies, including a steel mill and a plastics factory.
Demographics
As of the census of 2000, there were 1,845 people, 745 households, and 517 families residing in the borough. The population density was 2,619.3 people per square mile (1,011.2/km2). There were 790 housing units at an average density of 1,118.2 per square mile (431.2/km2). The racial makeup of the borough was 97.90% White, 0.76% African American, 0.05% Native American, 0.05% Asian, 0.05% Pacific Islander, 0.60% from other races, and 0.49% from two or more races. Hispanic or Latino of any race were 0.76% of the population.
There were 745 households, out of which 28.2% had children under the age of 18 living with them, 51.7% were married couples living together, 12.2% had a female householder with no husband present, and 32.2% were non-families. 28.7% of all households were made up of individuals, and 14.2% had someone living alone who was 65 years of age or older. The average household size was 2.47 and the average family size was 3.04.
In the borough the population was spread out, with 23.2% under the age of 18, 7.2% from 18 to 24, 28.2% from 25 to 44, 22.7% from 45 to 64, and 18.7% who were 65 years of age or older. The median age was 39 years. For every 100 females, there were 91.2 males. For every 100 females age 18 and over, there were 87.2 males.
The median income for a household in the borough was $33,750, and the median income for a family was $41,250. Males had a median income of $31,250 versus $22,500 for females. The per capita income for the borough was $17,845. About 8.2% of families and 10.2% of the population were below the poverty line, including 14.2% of those under age 18 and 8.2% of those age 65 or over.
Common Questions
What is Per Capita Income in Riverside?
Per Capita income in Riverside is $27,275.
What is the Median Family Income in Riverside?
Median Family Income in Riverside is $75,000.
What is the Median Household income in Riverside?
Median Household Income in Riverside is $46,458.
What is Income or Wage Gap in Riverside?
Income or Wage Gap in Riverside is 23.5%.
Women in Riverside earn 76.5 cents for every dollar earned by a man.
What is Inequality or Gini Index in Riverside?
Inequality or Gini Index in Riverside is 0.38.
What is the Total Population of Riverside?
Total Population of Riverside is 267.
What is the Total Male Population of Riverside?
Total Male Population of Riverside is 135.
What is the Total Female Population of Riverside?
Total Female Population of Riverside is 132.
What is the Ratio of Males per 100 Females in Riverside?
There are 102.27 Males per 100 Females in Riverside.
What is the Ratio of Females per 100 Males in Riverside?
There are 97.78 Females per 100 Males in Riverside.
What is the Median Population Age in Riverside?
Median Population Age in Riverside is 55.0 Years.
What is the Average Family Size in Riverside
Average Family Size in Riverside is 3.1 People.
What is the Average Household Size in Riverside
Average Household Size in Riverside is 2.1 People.
How Large is the Labor Force in Riverside?
There are 138 People in the Labor Forcein in Riverside.
What is the Percentage of People in the Labor Force in Riverside?
58.5% of People are in the Labor Force in Riverside.