Cities with the Lowest Wage/Income Gap (%) in Utah
RELATED REPORTS & OPTIONS
Lowest Wage/Income Gap (%)
Utah
Compare Cities
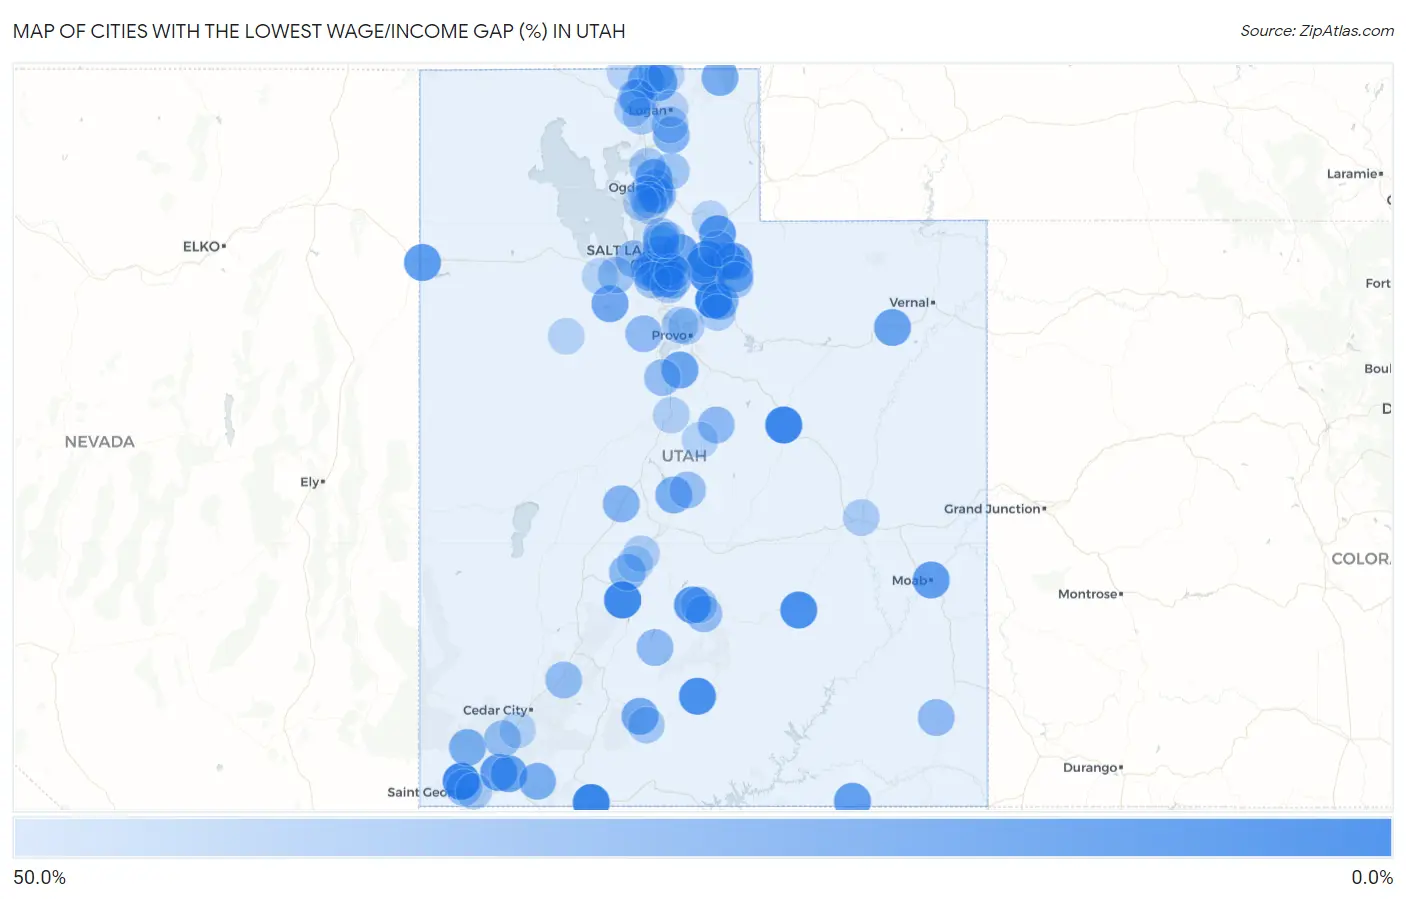
Map of Cities with the Lowest Wage/Income Gap (%) in Utah
50.0%
0.0%
Cities with the Lowest Wage/Income Gap (%) in Utah
| City | Wage/Income Gap (%) | vs State | vs National | |
| 1. | Charleston | 0.95% | 42.4%(-0.414)#1 | 28.0%(-0.270)#239 |
| 2. | Kanab | 1.5% | 42.4%(-0.409)#2 | 28.0%(-0.265)#388 |
| 3. | Ivins | 2.3% | 42.4%(-0.400)#3 | 28.0%(-0.256)#585 |
| 4. | Carbonville | 2.4% | 42.4%(-0.400)#4 | 28.0%(-0.256)#596 |
| 5. | Marysvale | 4.1% | 42.4%(-0.382)#5 | 28.0%(-0.239)#1,041 |
| 6. | Escalante | 6.4% | 42.4%(-0.360)#6 | 28.0%(-0.216)#1,630 |
| 7. | Hanksville | 6.9% | 42.4%(-0.355)#7 | 28.0%(-0.211)#1,752 |
| 8. | Park City | 8.9% | 42.4%(-0.335)#8 | 28.0%(-0.191)#2,366 |
| 9. | Peoa | 10.1% | 42.4%(-0.322)#9 | 28.0%(-0.178)#2,745 |
| 10. | Loa | 11.7% | 42.4%(-0.306)#10 | 28.0%(-0.162)#3,249 |
| 11. | Wendover | 12.7% | 42.4%(-0.296)#11 | 28.0%(-0.153)#3,590 |
| 12. | Coalville | 12.9% | 42.4%(-0.295)#12 | 28.0%(-0.151)#3,644 |
| 13. | Moab | 14.0% | 42.4%(-0.284)#13 | 28.0%(-0.140)#4,018 |
| 14. | Leeds | 14.1% | 42.4%(-0.283)#14 | 28.0%(-0.139)#4,044 |
| 15. | Oljato Monument Valley | 14.9% | 42.4%(-0.275)#15 | 28.0%(-0.131)#4,328 |
| 16. | Silver Summit | 14.9% | 42.4%(-0.274)#16 | 28.0%(-0.131)#4,352 |
| 17. | Midvale | 16.6% | 42.4%(-0.258)#17 | 28.0%(-0.114)#5,034 |
| 18. | Fort Duchesne | 17.4% | 42.4%(-0.249)#18 | 28.0%(-0.106)#5,369 |
| 19. | Emigration Canyon | 17.5% | 42.4%(-0.248)#19 | 28.0%(-0.104)#5,425 |
| 20. | La Verkin | 17.9% | 42.4%(-0.245)#20 | 28.0%(-0.101)#5,554 |
| 21. | Spring Lake | 18.2% | 42.4%(-0.241)#21 | 28.0%(-0.098)#5,709 |
| 22. | Harrisville | 19.0% | 42.4%(-0.233)#22 | 28.0%(-0.089)#6,033 |
| 23. | Trenton | 20.1% | 42.4%(-0.222)#23 | 28.0%(-0.079)#6,548 |
| 24. | Stockton | 20.1% | 42.4%(-0.222)#24 | 28.0%(-0.078)#6,558 |
| 25. | Oakley | 20.2% | 42.4%(-0.222)#25 | 28.0%(-0.078)#6,587 |
| 26. | Tropic | 21.0% | 42.4%(-0.214)#26 | 28.0%(-0.070)#6,961 |
| 27. | South Salt Lake | 21.4% | 42.4%(-0.210)#27 | 28.0%(-0.066)#7,176 |
| 28. | Garden City | 23.3% | 42.4%(-0.191)#28 | 28.0%(-0.047)#8,085 |
| 29. | Springdale | 23.5% | 42.4%(-0.189)#29 | 28.0%(-0.045)#8,188 |
| 30. | Clarkston | 23.6% | 42.4%(-0.188)#30 | 28.0%(-0.044)#8,251 |
| 31. | Central | 23.8% | 42.4%(-0.185)#31 | 28.0%(-0.041)#8,399 |
| 32. | Daniel | 24.1% | 42.4%(-0.183)#32 | 28.0%(-0.039)#8,531 |
| 33. | Gunnison | 24.2% | 42.4%(-0.182)#33 | 28.0%(-0.038)#8,562 |
| 34. | Murray | 24.2% | 42.4%(-0.181)#34 | 28.0%(-0.037)#8,596 |
| 35. | Kamas | 24.4% | 42.4%(-0.179)#35 | 28.0%(-0.036)#8,679 |
| 36. | Salt Lake City | 24.5% | 42.4%(-0.178)#36 | 28.0%(-0.035)#8,736 |
| 37. | Snyderville | 24.8% | 42.4%(-0.176)#37 | 28.0%(-0.032)#8,881 |
| 38. | West Valley City | 25.0% | 42.4%(-0.173)#38 | 28.0%(-0.030)#9,033 |
| 39. | Holden | 26.0% | 42.4%(-0.164)#39 | 28.0%(-0.020)#9,562 |
| 40. | Paradise | 26.4% | 42.4%(-0.159)#40 | 28.0%(-0.016)#9,768 |
| 41. | White | 26.8% | 42.4%(-0.155)#41 | 28.0%(-0.011)#10,010 |
| 42. | Taylorsville | 27.7% | 42.4%(-0.147)#42 | 28.0%(-0.003)#10,469 |
| 43. | South Ogden | 27.7% | 42.4%(-0.146)#43 | 28.0%(-0.002)#10,505 |
| 44. | Kearns | 28.0% | 42.4%(-0.143)#44 | 28.0%(+0.001)#10,690 |
| 45. | Cottonwood Heights | 28.7% | 42.4%(-0.136)#45 | 28.0%(+0.007)#11,026 |
| 46. | Ogden | 29.1% | 42.4%(-0.132)#46 | 28.0%(+0.012)#11,301 |
| 47. | Joseph | 29.2% | 42.4%(-0.131)#47 | 28.0%(+0.012)#11,352 |
| 48. | Fairview | 30.1% | 42.4%(-0.122)#48 | 28.0%(+0.022)#11,876 |
| 49. | Antimony | 30.2% | 42.4%(-0.121)#49 | 28.0%(+0.022)#11,928 |
| 50. | Fielding | 30.5% | 42.4%(-0.119)#50 | 28.0%(+0.025)#12,052 |
| 51. | Fairfield | 30.5% | 42.4%(-0.119)#51 | 28.0%(+0.025)#12,068 |
| 52. | Blanding | 30.9% | 42.4%(-0.115)#52 | 28.0%(+0.029)#12,259 |
| 53. | Washington Terrace | 31.1% | 42.4%(-0.113)#53 | 28.0%(+0.031)#12,373 |
| 54. | Millcreek | 31.5% | 42.4%(-0.109)#54 | 28.0%(+0.035)#12,568 |
| 55. | Magna | 31.8% | 42.4%(-0.106)#55 | 28.0%(+0.038)#12,717 |
| 56. | Paragonah | 31.8% | 42.4%(-0.105)#56 | 28.0%(+0.038)#12,763 |
| 57. | Bicknell | 32.0% | 42.4%(-0.103)#57 | 28.0%(+0.040)#12,858 |
| 58. | Santa Clara | 32.6% | 42.4%(-0.097)#58 | 28.0%(+0.046)#13,199 |
| 59. | Goshen | 32.9% | 42.4%(-0.095)#59 | 28.0%(+0.049)#13,311 |
| 60. | New Harmony | 32.9% | 42.4%(-0.094)#60 | 28.0%(+0.049)#13,339 |
| 61. | Sterling | 33.2% | 42.4%(-0.091)#61 | 28.0%(+0.052)#13,496 |
| 62. | Wanship | 33.4% | 42.4%(-0.089)#62 | 28.0%(+0.055)#13,633 |
| 63. | Riverside | 34.5% | 42.4%(-0.079)#63 | 28.0%(+0.065)#14,203 |
| 64. | West Bountiful | 35.1% | 42.4%(-0.072)#64 | 28.0%(+0.071)#14,563 |
| 65. | Stansbury Park | 35.8% | 42.4%(-0.065)#65 | 28.0%(+0.079)#14,942 |
| 66. | Hyrum | 36.0% | 42.4%(-0.063)#66 | 28.0%(+0.080)#15,028 |
| 67. | Francis | 36.4% | 42.4%(-0.059)#67 | 28.0%(+0.085)#15,238 |
| 68. | West Jordan | 36.8% | 42.4%(-0.056)#68 | 28.0%(+0.088)#15,411 |
| 69. | Wolf Creek | 36.8% | 42.4%(-0.055)#69 | 28.0%(+0.088)#15,419 |
| 70. | Cannonville | 37.0% | 42.4%(-0.054)#70 | 28.0%(+0.090)#15,520 |
| 71. | Deweyville | 37.4% | 42.4%(-0.050)#71 | 28.0%(+0.094)#15,721 |
| 72. | Lyman | 37.4% | 42.4%(-0.049)#72 | 28.0%(+0.094)#15,744 |
| 73. | North Salt Lake | 37.7% | 42.4%(-0.047)#73 | 28.0%(+0.097)#15,897 |
| 74. | Vineyard | 37.9% | 42.4%(-0.045)#74 | 28.0%(+0.099)#15,983 |
| 75. | South Willard | 38.2% | 42.4%(-0.041)#75 | 28.0%(+0.102)#16,133 |
| 76. | St George | 38.3% | 42.4%(-0.041)#76 | 28.0%(+0.103)#16,166 |
| 77. | Wallsburg | 38.8% | 42.4%(-0.035)#77 | 28.0%(+0.109)#16,420 |
| 78. | Sandy | 39.1% | 42.4%(-0.033)#78 | 28.0%(+0.111)#16,533 |
| 79. | Holladay | 39.1% | 42.4%(-0.033)#79 | 28.0%(+0.111)#16,540 |
| 80. | Roy | 39.1% | 42.4%(-0.032)#80 | 28.0%(+0.112)#16,560 |
| 81. | Cornish | 39.5% | 42.4%(-0.028)#81 | 28.0%(+0.115)#16,724 |
| 82. | Green River | 39.7% | 42.4%(-0.026)#82 | 28.0%(+0.117)#16,828 |
| 83. | Woods Cross | 39.9% | 42.4%(-0.025)#83 | 28.0%(+0.119)#16,889 |
| 84. | Richfield | 40.0% | 42.4%(-0.024)#84 | 28.0%(+0.120)#16,962 |
| 85. | Bountiful | 40.0% | 42.4%(-0.023)#85 | 28.0%(+0.120)#16,963 |
| 86. | Clearfield | 40.1% | 42.4%(-0.023)#86 | 28.0%(+0.121)#16,983 |
| 87. | Sunset | 40.5% | 42.4%(-0.019)#87 | 28.0%(+0.125)#17,175 |
| 88. | Orem | 40.5% | 42.4%(-0.018)#88 | 28.0%(+0.126)#17,199 |
| 89. | Nephi | 40.6% | 42.4%(-0.017)#89 | 28.0%(+0.126)#17,224 |
| 90. | Garland | 40.7% | 42.4%(-0.016)#90 | 28.0%(+0.128)#17,274 |
| 91. | West Point | 41.7% | 42.4%(-0.006)#91 | 28.0%(+0.138)#17,722 |
| 92. | Grantsville | 42.3% | 42.4%(-0.001)#92 | 28.0%(+0.143)#17,916 |
| 93. | Moroni | 42.4% | 42.4%(+0.000)#93 | 28.0%(+0.144)#17,955 |
| 94. | Dugway | 42.6% | 42.4%(+0.003)#94 | 28.0%(+0.147)#18,078 |
| 95. | Kanarraville | 42.7% | 42.4%(+0.003)#95 | 28.0%(+0.147)#18,094 |
| 96. | Lewiston | 42.7% | 42.4%(+0.004)#96 | 28.0%(+0.147)#18,113 |
| 97. | Logan | 43.0% | 42.4%(+0.006)#97 | 28.0%(+0.150)#18,221 |
| 98. | Elsinore | 43.1% | 42.4%(+0.008)#98 | 28.0%(+0.151)#18,287 |
| 99. | Portage | 43.2% | 42.4%(+0.009)#99 | 28.0%(+0.152)#18,344 |
| 100. | Henefer | 43.2% | 42.4%(+0.009)#100 | 28.0%(+0.152)#18,345 |
Common Questions
What are the Top 10 Cities with the Lowest Wage/Income Gap (%) in Utah?
Top 10 Cities with the Lowest Wage/Income Gap (%) in Utah are:
#1
0.95%
#2
1.5%
#3
2.3%
#4
2.4%
#5
4.1%
#6
6.4%
#7
6.9%
#8
8.9%
#9
10.1%
#10
11.7%
What city has the Lowest Wage/Income Gap (%) in Utah?
Charleston has the Lowest Wage/Income Gap (%) in Utah with 0.95%.
What is the Wage / Income Gap in Percentage Terms in the State of Utah?
Wage / Income Gap in Percentage Terms in Utah is 42.4%.
What is the Wage / Income Gap in Percentage Terms in the United States?
Wage / Income Gap in Percentage Terms in the United States is 28.0%.