Cities with the Lowest Wage/Income Gap (%) in Mississippi
RELATED REPORTS & OPTIONS
Lowest Wage/Income Gap (%)
Mississippi
Compare Cities
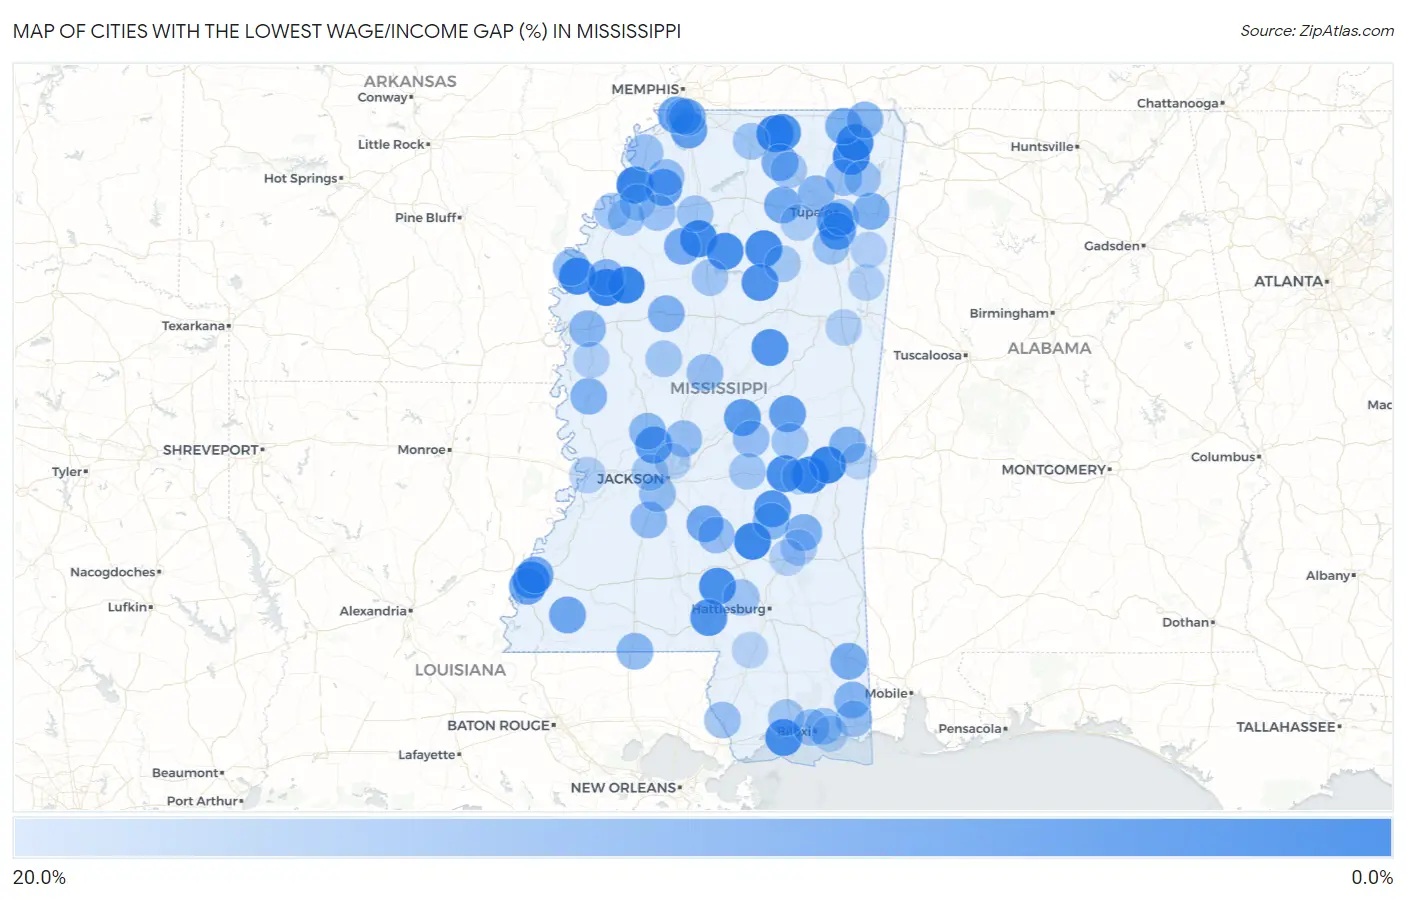
Map of Cities with the Lowest Wage/Income Gap (%) in Mississippi
20.0%
0.0%
Cities with the Lowest Wage/Income Gap (%) in Mississippi
| City | Wage/Income Gap (%) | vs State | vs National | |
| 1. | Boyle | 0.18% | 30.5%(-0.303)#1 | 28.0%(-0.278)#34 |
| 2. | Lula | 0.59% | 30.5%(-0.299)#2 | 28.0%(-0.274)#135 |
| 3. | Ruleville | 0.60% | 30.5%(-0.299)#3 | 28.0%(-0.274)#139 |
| 4. | Chunky | 0.64% | 30.5%(-0.299)#4 | 28.0%(-0.273)#152 |
| 5. | Nellieburg | 0.65% | 30.5%(-0.299)#5 | 28.0%(-0.273)#159 |
| 6. | Taylorsville | 1.1% | 30.5%(-0.294)#6 | 28.0%(-0.269)#278 |
| 7. | Oakland | 1.4% | 30.5%(-0.291)#7 | 28.0%(-0.266)#366 |
| 8. | Snow Lake Shores | 1.5% | 30.5%(-0.291)#8 | 28.0%(-0.265)#382 |
| 9. | Booneville | 1.5% | 30.5%(-0.290)#9 | 28.0%(-0.265)#386 |
| 10. | Natchez | 2.2% | 30.5%(-0.284)#10 | 28.0%(-0.258)#544 |
| 11. | Beulah | 2.2% | 30.5%(-0.283)#11 | 28.0%(-0.258)#556 |
| 12. | Rienzi | 2.4% | 30.5%(-0.281)#12 | 28.0%(-0.256)#606 |
| 13. | Bruce | 2.6% | 30.5%(-0.279)#13 | 28.0%(-0.254)#652 |
| 14. | Coffeeville | 2.9% | 30.5%(-0.276)#14 | 28.0%(-0.251)#738 |
| 15. | Newton | 2.9% | 30.5%(-0.276)#15 | 28.0%(-0.251)#743 |
| 16. | Verona | 3.0% | 30.5%(-0.275)#16 | 28.0%(-0.250)#754 |
| 17. | Long Beach | 3.1% | 30.5%(-0.274)#17 | 28.0%(-0.249)#781 |
| 18. | Bassfield | 3.3% | 30.5%(-0.272)#18 | 28.0%(-0.247)#824 |
| 19. | Slate Springs | 3.8% | 30.5%(-0.268)#19 | 28.0%(-0.242)#944 |
| 20. | Ashland | 4.3% | 30.5%(-0.262)#20 | 28.0%(-0.237)#1,083 |
| 21. | Columbia | 4.4% | 30.5%(-0.261)#21 | 28.0%(-0.235)#1,116 |
| 22. | Louin | 4.5% | 30.5%(-0.261)#22 | 28.0%(-0.235)#1,128 |
| 23. | Weir | 4.8% | 30.5%(-0.257)#23 | 28.0%(-0.231)#1,214 |
| 24. | Shannon | 5.7% | 30.5%(-0.249)#24 | 28.0%(-0.223)#1,455 |
| 25. | Flora | 6.0% | 30.5%(-0.245)#25 | 28.0%(-0.220)#1,539 |
| 26. | Carthage | 6.1% | 30.5%(-0.244)#26 | 28.0%(-0.219)#1,563 |
| 27. | Gluckstadt | 6.6% | 30.5%(-0.239)#27 | 28.0%(-0.213)#1,698 |
| 28. | Hernando | 6.7% | 30.5%(-0.239)#28 | 28.0%(-0.213)#1,699 |
| 29. | Sledge | 6.9% | 30.5%(-0.236)#29 | 28.0%(-0.211)#1,758 |
| 30. | Philadelphia | 7.4% | 30.5%(-0.232)#30 | 28.0%(-0.206)#1,900 |
| 31. | Cloverdale | 8.2% | 30.5%(-0.223)#31 | 28.0%(-0.198)#2,164 |
| 32. | Lynchburg | 8.5% | 30.5%(-0.220)#32 | 28.0%(-0.195)#2,255 |
| 33. | Crosby | 8.7% | 30.5%(-0.218)#33 | 28.0%(-0.193)#2,317 |
| 34. | Morgantown | 9.0% | 30.5%(-0.215)#34 | 28.0%(-0.190)#2,405 |
| 35. | Mendenhall | 9.1% | 30.5%(-0.214)#35 | 28.0%(-0.189)#2,426 |
| 36. | Thaxton | 9.4% | 30.5%(-0.212)#36 | 28.0%(-0.186)#2,516 |
| 37. | Charleston | 10.0% | 30.5%(-0.205)#37 | 28.0%(-0.179)#2,708 |
| 38. | Southaven | 10.3% | 30.5%(-0.202)#38 | 28.0%(-0.177)#2,801 |
| 39. | Lucedale | 10.4% | 30.5%(-0.201)#39 | 28.0%(-0.176)#2,834 |
| 40. | Hickory Flat | 10.5% | 30.5%(-0.200)#40 | 28.0%(-0.175)#2,858 |
| 41. | Kossuth | 10.9% | 30.5%(-0.196)#41 | 28.0%(-0.171)#2,968 |
| 42. | Fulton | 11.1% | 30.5%(-0.194)#42 | 28.0%(-0.169)#3,039 |
| 43. | Greenwood | 11.2% | 30.5%(-0.193)#43 | 28.0%(-0.168)#3,073 |
| 44. | Meridian Station | 11.6% | 30.5%(-0.190)#44 | 28.0%(-0.164)#3,182 |
| 45. | Renova | 11.7% | 30.5%(-0.188)#45 | 28.0%(-0.163)#3,238 |
| 46. | Heidelberg | 11.7% | 30.5%(-0.188)#46 | 28.0%(-0.163)#3,240 |
| 47. | Rolling Fork | 12.1% | 30.5%(-0.184)#47 | 28.0%(-0.159)#3,363 |
| 48. | Farmington | 12.4% | 30.5%(-0.182)#48 | 28.0%(-0.156)#3,470 |
| 49. | Wade | 12.4% | 30.5%(-0.181)#49 | 28.0%(-0.155)#3,505 |
| 50. | Leland | 12.6% | 30.5%(-0.180)#50 | 28.0%(-0.154)#3,536 |
| 51. | Blue Springs | 12.8% | 30.5%(-0.177)#51 | 28.0%(-0.152)#3,615 |
| 52. | Bay Springs | 12.9% | 30.5%(-0.177)#52 | 28.0%(-0.151)#3,638 |
| 53. | Osyka | 13.0% | 30.5%(-0.176)#53 | 28.0%(-0.150)#3,674 |
| 54. | Bentonia | 13.1% | 30.5%(-0.175)#54 | 28.0%(-0.149)#3,706 |
| 55. | Rosedale | 13.4% | 30.5%(-0.171)#55 | 28.0%(-0.145)#3,838 |
| 56. | Crystal Springs | 13.6% | 30.5%(-0.169)#56 | 28.0%(-0.143)#3,908 |
| 57. | Horn Lake | 14.2% | 30.5%(-0.163)#57 | 28.0%(-0.138)#4,098 |
| 58. | Crenshaw | 14.2% | 30.5%(-0.163)#58 | 28.0%(-0.137)#4,109 |
| 59. | Byram | 14.2% | 30.5%(-0.163)#59 | 28.0%(-0.137)#4,114 |
| 60. | Walnut Grove | 14.5% | 30.5%(-0.160)#60 | 28.0%(-0.135)#4,197 |
| 61. | Canton | 14.5% | 30.5%(-0.160)#61 | 28.0%(-0.135)#4,200 |
| 62. | Magee | 14.6% | 30.5%(-0.159)#62 | 28.0%(-0.133)#4,242 |
| 63. | Baldwyn | 14.8% | 30.5%(-0.157)#63 | 28.0%(-0.132)#4,296 |
| 64. | Escatawpa | 14.8% | 30.5%(-0.157)#64 | 28.0%(-0.132)#4,307 |
| 65. | Gulf Hills | 15.0% | 30.5%(-0.155)#65 | 28.0%(-0.129)#4,388 |
| 66. | Durant | 15.0% | 30.5%(-0.155)#66 | 28.0%(-0.129)#4,390 |
| 67. | Okolona | 15.5% | 30.5%(-0.150)#67 | 28.0%(-0.124)#4,569 |
| 68. | Biloxi | 15.6% | 30.5%(-0.149)#68 | 28.0%(-0.124)#4,584 |
| 69. | Tunica | 15.6% | 30.5%(-0.149)#69 | 28.0%(-0.123)#4,617 |
| 70. | Marietta | 15.7% | 30.5%(-0.148)#70 | 28.0%(-0.123)#4,650 |
| 71. | Marks | 15.7% | 30.5%(-0.148)#71 | 28.0%(-0.123)#4,654 |
| 72. | Nicholson | 15.7% | 30.5%(-0.148)#72 | 28.0%(-0.123)#4,656 |
| 73. | Lyon | 15.9% | 30.5%(-0.147)#73 | 28.0%(-0.121)#4,720 |
| 74. | Union | 15.9% | 30.5%(-0.147)#74 | 28.0%(-0.121)#4,722 |
| 75. | Plantersville | 15.9% | 30.5%(-0.146)#75 | 28.0%(-0.120)#4,750 |
| 76. | Courtland | 16.0% | 30.5%(-0.145)#76 | 28.0%(-0.120)#4,780 |
| 77. | Holly Springs | 16.1% | 30.5%(-0.144)#77 | 28.0%(-0.119)#4,816 |
| 78. | Sumrall | 16.3% | 30.5%(-0.142)#78 | 28.0%(-0.117)#4,901 |
| 79. | Lyman | 16.5% | 30.5%(-0.140)#79 | 28.0%(-0.115)#4,996 |
| 80. | Forest | 16.5% | 30.5%(-0.140)#80 | 28.0%(-0.114)#5,006 |
| 81. | Myrtle | 16.6% | 30.5%(-0.139)#81 | 28.0%(-0.114)#5,046 |
| 82. | Grenada | 16.6% | 30.5%(-0.139)#82 | 28.0%(-0.114)#5,056 |
| 83. | Vardaman | 16.9% | 30.5%(-0.136)#83 | 28.0%(-0.110)#5,169 |
| 84. | Clinton | 17.0% | 30.5%(-0.135)#84 | 28.0%(-0.110)#5,195 |
| 85. | Tchula | 17.1% | 30.5%(-0.134)#85 | 28.0%(-0.109)#5,225 |
| 86. | Farrell | 17.2% | 30.5%(-0.133)#86 | 28.0%(-0.107)#5,287 |
| 87. | Sandersville | 18.0% | 30.5%(-0.125)#87 | 28.0%(-0.099)#5,624 |
| 88. | Jonestown | 18.1% | 30.5%(-0.124)#88 | 28.0%(-0.099)#5,652 |
| 89. | Algoma | 18.2% | 30.5%(-0.123)#89 | 28.0%(-0.098)#5,704 |
| 90. | Hollandale | 18.5% | 30.5%(-0.120)#90 | 28.0%(-0.095)#5,815 |
| 91. | Artesia | 18.6% | 30.5%(-0.120)#91 | 28.0%(-0.094)#5,836 |
| 92. | New Hamilton | 18.8% | 30.5%(-0.117)#92 | 28.0%(-0.091)#5,953 |
| 93. | Vicksburg | 18.8% | 30.5%(-0.117)#93 | 28.0%(-0.091)#5,956 |
| 94. | Ridgeland | 19.1% | 30.5%(-0.114)#94 | 28.0%(-0.089)#6,068 |
| 95. | Hatley | 19.3% | 30.5%(-0.113)#95 | 28.0%(-0.087)#6,136 |
| 96. | Laurel | 19.4% | 30.5%(-0.112)#96 | 28.0%(-0.086)#6,186 |
| 97. | Hickory | 19.4% | 30.5%(-0.111)#97 | 28.0%(-0.086)#6,196 |
| 98. | Gulf Park Estates | 19.6% | 30.5%(-0.109)#98 | 28.0%(-0.084)#6,300 |
| 99. | Toomsuba | 19.6% | 30.5%(-0.109)#99 | 28.0%(-0.083)#6,311 |
| 100. | Lumberton | 19.9% | 30.5%(-0.106)#100 | 28.0%(-0.081)#6,435 |
Common Questions
What are the Top 10 Cities with the Lowest Wage/Income Gap (%) in Mississippi?
Top 10 Cities with the Lowest Wage/Income Gap (%) in Mississippi are:
#1
0.18%
#2
0.59%
#3
0.60%
#4
0.64%
#5
0.65%
#6
1.1%
#7
1.4%
#8
1.5%
#9
1.5%
#10
2.2%
What city has the Lowest Wage/Income Gap (%) in Mississippi?
Boyle has the Lowest Wage/Income Gap (%) in Mississippi with 0.18%.
What is the Wage / Income Gap in Percentage Terms in the State of Mississippi?
Wage / Income Gap in Percentage Terms in Mississippi is 30.5%.
What is the Wage / Income Gap in Percentage Terms in the United States?
Wage / Income Gap in Percentage Terms in the United States is 28.0%.