Cities with the Lowest Wage/Income Gap (%) in Maryland
RELATED REPORTS & OPTIONS
Lowest Wage/Income Gap (%)
Maryland
Compare Cities
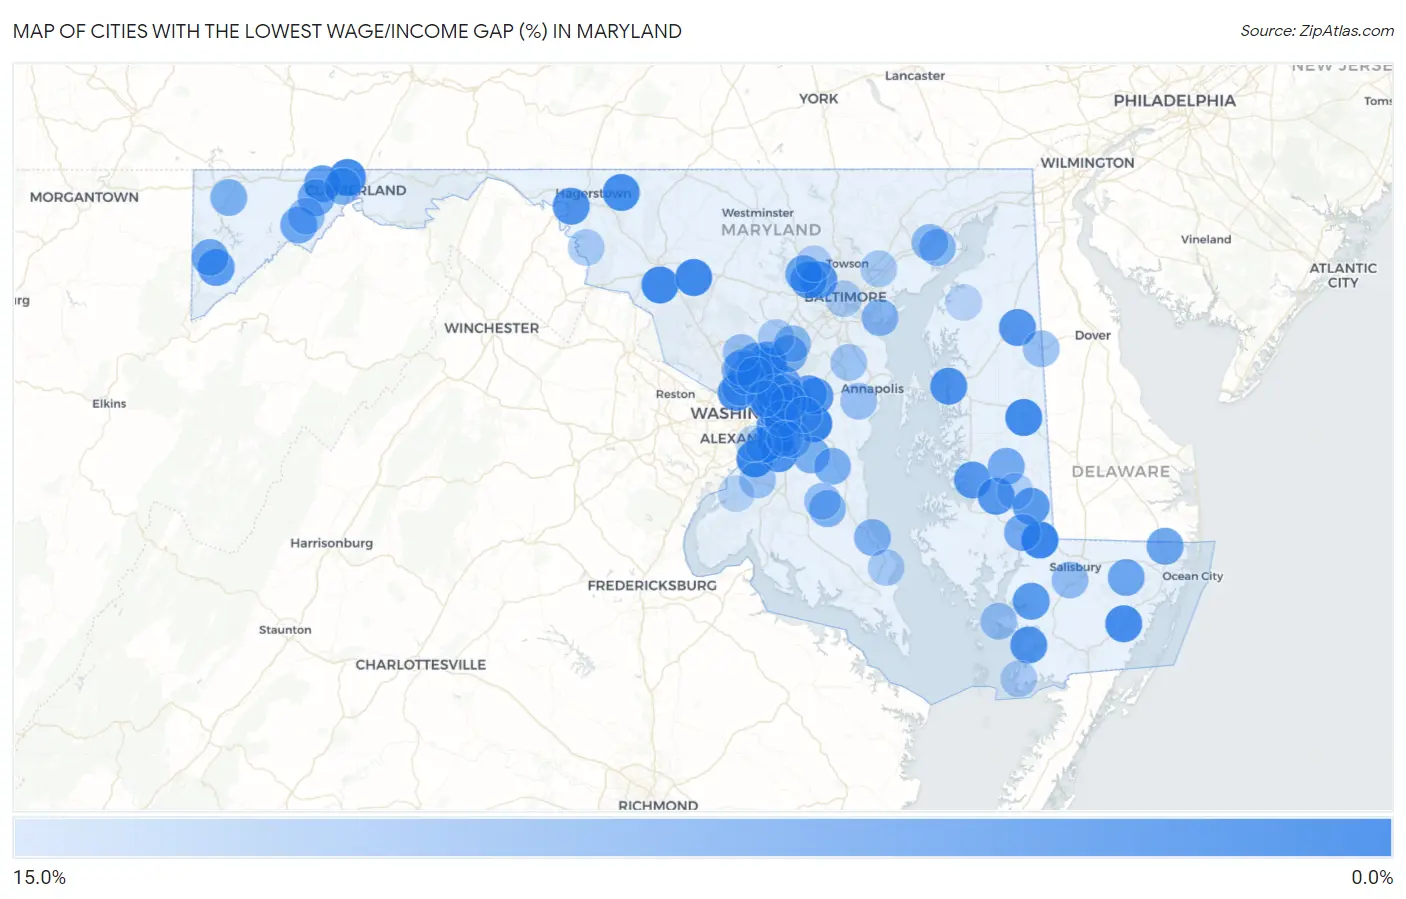
Map of Cities with the Lowest Wage/Income Gap (%) in Maryland
15.0%
0.0%
Cities with the Lowest Wage/Income Gap (%) in Maryland
| City | Wage/Income Gap (%) | vs State | vs National | |
| 1. | Calverton | 0.11% | 21.9%(-0.218)#1 | 28.0%(-0.279)#22 |
| 2. | Brock Hall | 0.21% | 21.9%(-0.217)#2 | 28.0%(-0.278)#43 |
| 3. | Fort Washington | 0.31% | 21.9%(-0.216)#3 | 28.0%(-0.277)#67 |
| 4. | Mardela Springs | 0.49% | 21.9%(-0.214)#4 | 28.0%(-0.275)#106 |
| 5. | Camp Springs | 0.71% | 21.9%(-0.212)#5 | 28.0%(-0.273)#172 |
| 6. | Buckeystown | 0.96% | 21.9%(-0.209)#6 | 28.0%(-0.270)#244 |
| 7. | Monrovia | 1.0% | 21.9%(-0.209)#7 | 28.0%(-0.270)#257 |
| 8. | Denton | 1.2% | 21.9%(-0.207)#8 | 28.0%(-0.268)#295 |
| 9. | Corriganville | 1.2% | 21.9%(-0.207)#9 | 28.0%(-0.268)#310 |
| 10. | Cavetown | 1.4% | 21.9%(-0.205)#10 | 28.0%(-0.266)#357 |
| 11. | Springdale | 1.4% | 21.9%(-0.205)#11 | 28.0%(-0.266)#372 |
| 12. | Suitland | 1.5% | 21.9%(-0.204)#12 | 28.0%(-0.265)#389 |
| 13. | Snow Hill | 1.7% | 21.9%(-0.202)#13 | 28.0%(-0.263)#427 |
| 14. | Friendship Heights Village | 1.7% | 21.9%(-0.202)#14 | 28.0%(-0.263)#434 |
| 15. | Brentwood | 1.8% | 21.9%(-0.201)#15 | 28.0%(-0.262)#457 |
| 16. | Graceham | 2.2% | 21.9%(-0.197)#16 | 28.0%(-0.258)#543 |
| 17. | Queenstown | 2.2% | 21.9%(-0.197)#17 | 28.0%(-0.258)#550 |
| 18. | Clinton | 2.3% | 21.9%(-0.196)#18 | 28.0%(-0.256)#582 |
| 19. | Williamsport | 2.4% | 21.9%(-0.195)#19 | 28.0%(-0.255)#615 |
| 20. | Fairmount | 2.6% | 21.9%(-0.193)#20 | 28.0%(-0.253)#667 |
| 21. | Lochearn | 2.9% | 21.9%(-0.190)#21 | 28.0%(-0.251)#725 |
| 22. | Trappe | 3.1% | 21.9%(-0.188)#22 | 28.0%(-0.249)#767 |
| 23. | Bowie | 3.1% | 21.9%(-0.188)#23 | 28.0%(-0.248)#793 |
| 24. | Sudlersville | 3.2% | 21.9%(-0.187)#24 | 28.0%(-0.248)#807 |
| 25. | Secretary | 3.2% | 21.9%(-0.187)#25 | 28.0%(-0.247)#810 |
| 26. | University Park | 3.3% | 21.9%(-0.186)#26 | 28.0%(-0.247)#827 |
| 27. | Milford Mill | 3.5% | 21.9%(-0.184)#27 | 28.0%(-0.245)#877 |
| 28. | Capitol Heights | 3.6% | 21.9%(-0.183)#28 | 28.0%(-0.244)#894 |
| 29. | Mount Vernon | 3.6% | 21.9%(-0.183)#29 | 28.0%(-0.244)#896 |
| 30. | Brookview | 3.6% | 21.9%(-0.183)#30 | 28.0%(-0.244)#897 |
| 31. | Loch Lynn Heights | 3.7% | 21.9%(-0.182)#31 | 28.0%(-0.243)#924 |
| 32. | Morningside | 4.1% | 21.9%(-0.178)#32 | 28.0%(-0.239)#1,029 |
| 33. | Fairwood | 4.2% | 21.9%(-0.177)#33 | 28.0%(-0.238)#1,060 |
| 34. | Zihlman | 4.5% | 21.9%(-0.174)#34 | 28.0%(-0.235)#1,134 |
| 35. | Fairmount Heights | 4.7% | 21.9%(-0.172)#35 | 28.0%(-0.233)#1,166 |
| 36. | Landover Hills | 4.9% | 21.9%(-0.170)#36 | 28.0%(-0.231)#1,227 |
| 37. | Greenbelt | 5.0% | 21.9%(-0.169)#37 | 28.0%(-0.230)#1,246 |
| 38. | Colesville | 5.0% | 21.9%(-0.169)#38 | 28.0%(-0.230)#1,269 |
| 39. | Randallstown | 5.4% | 21.9%(-0.165)#39 | 28.0%(-0.226)#1,374 |
| 40. | Bishopville | 5.4% | 21.9%(-0.165)#40 | 28.0%(-0.226)#1,383 |
| 41. | Shaft | 5.5% | 21.9%(-0.164)#41 | 28.0%(-0.225)#1,398 |
| 42. | Barton | 5.5% | 21.9%(-0.164)#42 | 28.0%(-0.225)#1,416 |
| 43. | Colmar Manor | 5.5% | 21.9%(-0.164)#43 | 28.0%(-0.225)#1,419 |
| 44. | Powellville | 5.6% | 21.9%(-0.163)#44 | 28.0%(-0.224)#1,435 |
| 45. | Oakland | 5.7% | 21.9%(-0.162)#45 | 28.0%(-0.223)#1,462 |
| 46. | Fairland | 5.8% | 21.9%(-0.161)#46 | 28.0%(-0.222)#1,484 |
| 47. | Vienna | 5.9% | 21.9%(-0.160)#47 | 28.0%(-0.221)#1,506 |
| 48. | Abingdon | 6.0% | 21.9%(-0.159)#48 | 28.0%(-0.220)#1,521 |
| 49. | Preston | 6.4% | 21.9%(-0.155)#49 | 28.0%(-0.216)#1,632 |
| 50. | Brown Station | 6.5% | 21.9%(-0.154)#50 | 28.0%(-0.214)#1,667 |
| 51. | District Heights | 6.6% | 21.9%(-0.153)#51 | 28.0%(-0.214)#1,685 |
| 52. | Laurel | 6.7% | 21.9%(-0.152)#52 | 28.0%(-0.213)#1,721 |
| 53. | Chevy Chase Section Three | 6.7% | 21.9%(-0.152)#53 | 28.0%(-0.212)#1,724 |
| 54. | Croom | 7.1% | 21.9%(-0.148)#54 | 28.0%(-0.209)#1,833 |
| 55. | Dunkirk | 7.2% | 21.9%(-0.147)#55 | 28.0%(-0.208)#1,855 |
| 56. | Accident | 7.3% | 21.9%(-0.146)#56 | 28.0%(-0.207)#1,878 |
| 57. | La Vale | 7.3% | 21.9%(-0.146)#57 | 28.0%(-0.206)#1,892 |
| 58. | Eagle Harbor | 7.6% | 21.9%(-0.143)#58 | 28.0%(-0.203)#1,988 |
| 59. | St Leonard | 7.7% | 21.9%(-0.142)#59 | 28.0%(-0.203)#2,010 |
| 60. | Bladensburg | 7.8% | 21.9%(-0.141)#60 | 28.0%(-0.202)#2,039 |
| 61. | Perryman | 8.1% | 21.9%(-0.138)#61 | 28.0%(-0.199)#2,126 |
| 62. | North Kensington | 8.1% | 21.9%(-0.138)#62 | 28.0%(-0.198)#2,142 |
| 63. | Edgemere | 8.4% | 21.9%(-0.135)#63 | 28.0%(-0.196)#2,212 |
| 64. | Melwood | 8.5% | 21.9%(-0.134)#64 | 28.0%(-0.195)#2,246 |
| 65. | Cedar Heights | 8.5% | 21.9%(-0.134)#65 | 28.0%(-0.195)#2,264 |
| 66. | Forest Glen | 8.7% | 21.9%(-0.132)#66 | 28.0%(-0.193)#2,306 |
| 67. | North Laurel | 8.7% | 21.9%(-0.132)#67 | 28.0%(-0.193)#2,312 |
| 68. | New Carrollton | 8.7% | 21.9%(-0.132)#68 | 28.0%(-0.193)#2,323 |
| 69. | Riverside | 8.7% | 21.9%(-0.132)#69 | 28.0%(-0.193)#2,324 |
| 70. | Wheaton | 8.9% | 21.9%(-0.130)#70 | 28.0%(-0.191)#2,374 |
| 71. | Lonaconing | 9.1% | 21.9%(-0.128)#71 | 28.0%(-0.189)#2,421 |
| 72. | Oxon Hill | 9.2% | 21.9%(-0.127)#72 | 28.0%(-0.187)#2,469 |
| 73. | Fruitland | 9.4% | 21.9%(-0.125)#73 | 28.0%(-0.186)#2,525 |
| 74. | Landover | 9.7% | 21.9%(-0.122)#74 | 28.0%(-0.183)#2,601 |
| 75. | Aquasco | 9.9% | 21.9%(-0.120)#75 | 28.0%(-0.181)#2,664 |
| 76. | Marydel | 9.9% | 21.9%(-0.120)#76 | 28.0%(-0.180)#2,674 |
| 77. | Chance | 10.0% | 21.9%(-0.119)#77 | 28.0%(-0.180)#2,682 |
| 78. | Leisure World | 10.0% | 21.9%(-0.119)#78 | 28.0%(-0.180)#2,689 |
| 79. | Edgewater | 10.1% | 21.9%(-0.118)#79 | 28.0%(-0.179)#2,738 |
| 80. | Accokeek | 10.3% | 21.9%(-0.116)#80 | 28.0%(-0.177)#2,798 |
| 81. | Riverdale Park | 10.3% | 21.9%(-0.116)#81 | 28.0%(-0.177)#2,803 |
| 82. | Walker Mill | 10.6% | 21.9%(-0.113)#82 | 28.0%(-0.174)#2,875 |
| 83. | Arden On The Severn | 10.6% | 21.9%(-0.113)#83 | 28.0%(-0.174)#2,882 |
| 84. | Woodlawn Cdp Baltimore County | 10.6% | 21.9%(-0.113)#84 | 28.0%(-0.174)#2,887 |
| 85. | Glenarden | 11.0% | 21.9%(-0.109)#85 | 28.0%(-0.170)#3,014 |
| 86. | Mount Rainier | 11.1% | 21.9%(-0.108)#86 | 28.0%(-0.169)#3,047 |
| 87. | Four Corners | 11.2% | 21.9%(-0.107)#87 | 28.0%(-0.167)#3,080 |
| 88. | Lusby | 11.3% | 21.9%(-0.106)#88 | 28.0%(-0.167)#3,108 |
| 89. | White Marsh | 11.5% | 21.9%(-0.104)#89 | 28.0%(-0.165)#3,161 |
| 90. | Fulton | 11.6% | 21.9%(-0.103)#90 | 28.0%(-0.164)#3,181 |
| 91. | Baltimore | 11.6% | 21.9%(-0.103)#91 | 28.0%(-0.164)#3,197 |
| 92. | Sharpsburg | 11.7% | 21.9%(-0.102)#92 | 28.0%(-0.163)#3,230 |
| 93. | Crisfield | 11.8% | 21.9%(-0.101)#93 | 28.0%(-0.162)#3,270 |
| 94. | Garrison | 12.0% | 21.9%(-0.099)#94 | 28.0%(-0.159)#3,349 |
| 95. | Hurlock | 12.4% | 21.9%(-0.095)#95 | 28.0%(-0.156)#3,481 |
| 96. | Kettering | 12.4% | 21.9%(-0.095)#96 | 28.0%(-0.156)#3,486 |
| 97. | National Harbor | 12.6% | 21.9%(-0.093)#97 | 28.0%(-0.154)#3,558 |
| 98. | Andrews Afb | 12.8% | 21.9%(-0.091)#98 | 28.0%(-0.152)#3,617 |
| 99. | Worton | 13.1% | 21.9%(-0.088)#99 | 28.0%(-0.149)#3,702 |
| 100. | Bryans Road | 13.1% | 21.9%(-0.088)#100 | 28.0%(-0.148)#3,731 |
Common Questions
What are the Top 10 Cities with the Lowest Wage/Income Gap (%) in Maryland?
Top 10 Cities with the Lowest Wage/Income Gap (%) in Maryland are:
#1
0.11%
#2
0.21%
#3
0.31%
#4
0.49%
#5
0.71%
#6
0.96%
#7
1.0%
#8
1.2%
#9
1.2%
#10
1.4%
What city has the Lowest Wage/Income Gap (%) in Maryland?
Calverton has the Lowest Wage/Income Gap (%) in Maryland with 0.11%.
What is the Wage / Income Gap in Percentage Terms in the State of Maryland?
Wage / Income Gap in Percentage Terms in Maryland is 21.9%.
What is the Wage / Income Gap in Percentage Terms in the United States?
Wage / Income Gap in Percentage Terms in the United States is 28.0%.