Cities with the Lowest Wage/Income Gap (%) in Virginia
RELATED REPORTS & OPTIONS
Lowest Wage/Income Gap (%)
Virginia
Compare Cities
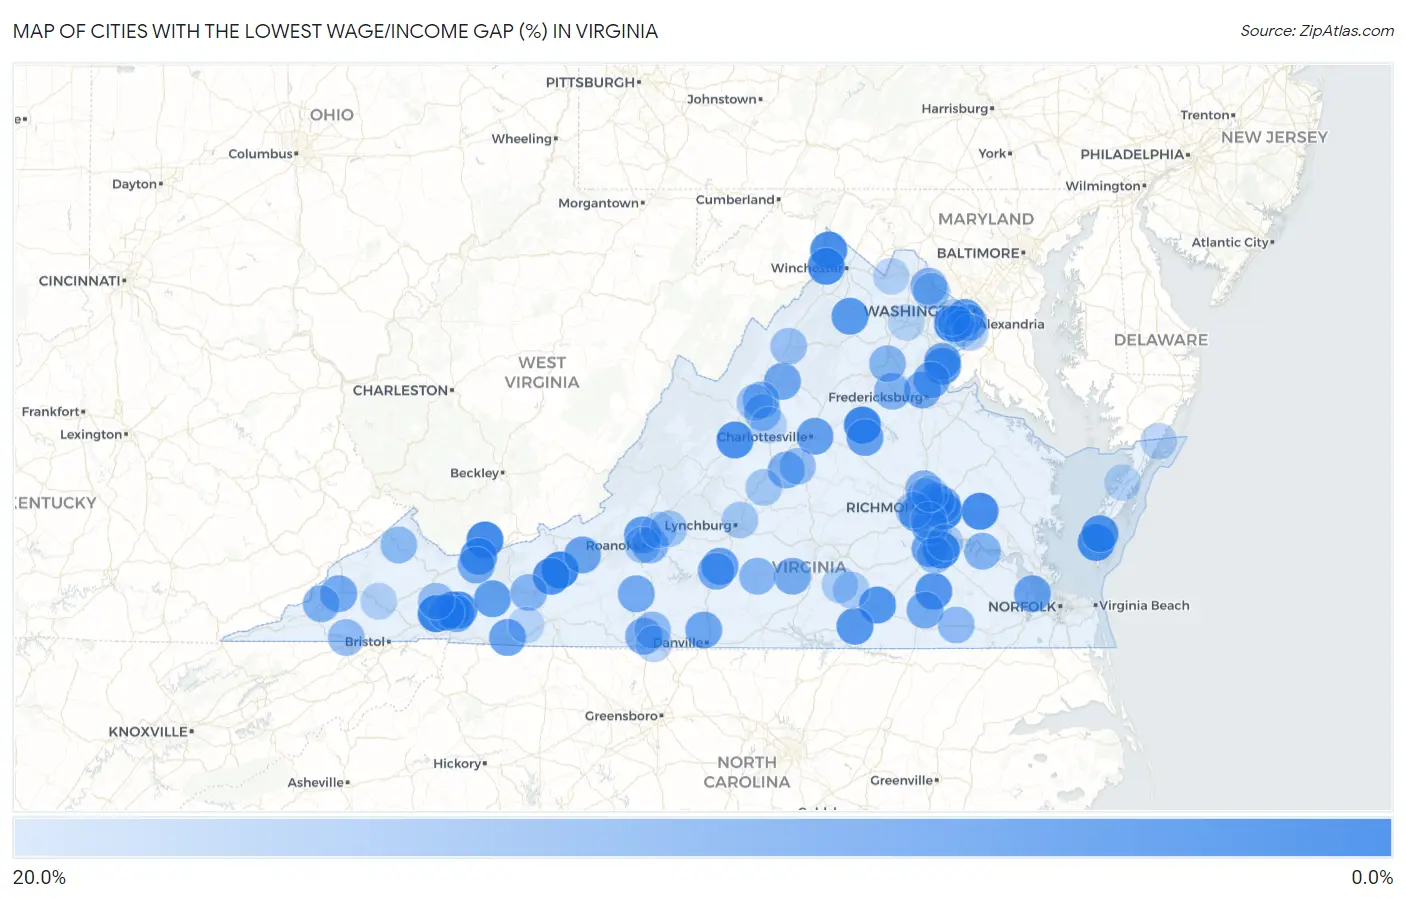
Map of Cities with the Lowest Wage/Income Gap (%) in Virginia
20.0%
0.0%
Cities with the Lowest Wage/Income Gap (%) in Virginia
| City | Wage/Income Gap (%) | vs State | vs National | |
| 1. | Sandston | 0.62% | 29.5%(-0.289)#1 | 28.0%(-0.274)#146 |
| 2. | Glade Spring | 1.1% | 29.5%(-0.284)#2 | 28.0%(-0.269)#284 |
| 3. | Blue Ridge Shores | 1.1% | 29.5%(-0.284)#3 | 28.0%(-0.268)#288 |
| 4. | Kings Park | 1.1% | 29.5%(-0.283)#4 | 28.0%(-0.268)#291 |
| 5. | Dublin | 1.2% | 29.5%(-0.283)#5 | 28.0%(-0.268)#315 |
| 6. | Fort Lee | 1.7% | 29.5%(-0.278)#6 | 28.0%(-0.263)#425 |
| 7. | Pocahontas | 1.7% | 29.5%(-0.278)#7 | 28.0%(-0.263)#438 |
| 8. | Cheriton | 2.1% | 29.5%(-0.274)#8 | 28.0%(-0.259)#536 |
| 9. | New Kent | 2.5% | 29.5%(-0.270)#9 | 28.0%(-0.255)#626 |
| 10. | Lake Holiday | 2.6% | 29.5%(-0.269)#10 | 28.0%(-0.254)#656 |
| 11. | Shawneeland | 2.6% | 29.5%(-0.269)#11 | 28.0%(-0.254)#664 |
| 12. | Woodlawn Cdp Fairfax County | 2.8% | 29.5%(-0.267)#12 | 28.0%(-0.252)#691 |
| 13. | Mcmullin | 2.8% | 29.5%(-0.267)#13 | 28.0%(-0.252)#708 |
| 14. | Greenville | 3.2% | 29.5%(-0.263)#14 | 28.0%(-0.248)#798 |
| 15. | Pulaski | 3.6% | 29.5%(-0.259)#15 | 28.0%(-0.244)#904 |
| 16. | Seven Mile Ford | 3.8% | 29.5%(-0.257)#16 | 28.0%(-0.242)#939 |
| 17. | Eastville | 3.8% | 29.5%(-0.256)#17 | 28.0%(-0.241)#961 |
| 18. | Alberta | 4.0% | 29.5%(-0.255)#18 | 28.0%(-0.240)#1,010 |
| 19. | Springville | 4.1% | 29.5%(-0.253)#19 | 28.0%(-0.238)#1,050 |
| 20. | Stony Creek | 4.3% | 29.5%(-0.251)#20 | 28.0%(-0.236)#1,094 |
| 21. | La Crosse | 4.4% | 29.5%(-0.250)#21 | 28.0%(-0.235)#1,119 |
| 22. | Quantico Base | 4.5% | 29.5%(-0.250)#22 | 28.0%(-0.235)#1,138 |
| 23. | Chester Gap | 4.7% | 29.5%(-0.247)#23 | 28.0%(-0.232)#1,191 |
| 24. | Bailey S Crossroads | 5.1% | 29.5%(-0.244)#24 | 28.0%(-0.229)#1,293 |
| 25. | Hollins | 5.5% | 29.5%(-0.240)#25 | 28.0%(-0.225)#1,403 |
| 26. | Rural Retreat | 5.7% | 29.5%(-0.238)#26 | 28.0%(-0.222)#1,471 |
| 27. | Altavista | 6.1% | 29.5%(-0.234)#27 | 28.0%(-0.219)#1,559 |
| 28. | Fairfield | 6.2% | 29.5%(-0.233)#28 | 28.0%(-0.218)#1,573 |
| 29. | Louisa | 6.2% | 29.5%(-0.233)#29 | 28.0%(-0.218)#1,594 |
| 30. | Pantops | 6.3% | 29.5%(-0.232)#30 | 28.0%(-0.217)#1,601 |
| 31. | Manchester | 6.4% | 29.5%(-0.230)#31 | 28.0%(-0.215)#1,640 |
| 32. | Ettrick | 6.5% | 29.5%(-0.230)#32 | 28.0%(-0.215)#1,662 |
| 33. | Independence | 6.7% | 29.5%(-0.228)#33 | 28.0%(-0.213)#1,714 |
| 34. | Carrollton | 6.8% | 29.5%(-0.226)#34 | 28.0%(-0.211)#1,747 |
| 35. | Prices Fork | 6.9% | 29.5%(-0.226)#35 | 28.0%(-0.211)#1,753 |
| 36. | Mount Hermon | 7.0% | 29.5%(-0.224)#36 | 28.0%(-0.209)#1,800 |
| 37. | Highland Springs | 7.6% | 29.5%(-0.219)#37 | 28.0%(-0.204)#1,982 |
| 38. | Southern Gateway | 7.7% | 29.5%(-0.218)#38 | 28.0%(-0.203)#2,000 |
| 39. | East Highland Park | 7.8% | 29.5%(-0.217)#39 | 28.0%(-0.202)#2,030 |
| 40. | Massanutten | 7.8% | 29.5%(-0.217)#40 | 28.0%(-0.202)#2,035 |
| 41. | Bellwood | 7.8% | 29.5%(-0.217)#41 | 28.0%(-0.202)#2,042 |
| 42. | Triangle | 7.9% | 29.5%(-0.216)#42 | 28.0%(-0.201)#2,051 |
| 43. | Hurt | 8.1% | 29.5%(-0.214)#43 | 28.0%(-0.199)#2,122 |
| 44. | Norton | 8.1% | 29.5%(-0.214)#44 | 28.0%(-0.199)#2,123 |
| 45. | Ferrum | 8.1% | 29.5%(-0.213)#45 | 28.0%(-0.198)#2,147 |
| 46. | Adwolf | 8.2% | 29.5%(-0.212)#46 | 28.0%(-0.197)#2,171 |
| 47. | Jarratt | 8.3% | 29.5%(-0.212)#47 | 28.0%(-0.197)#2,183 |
| 48. | Horse Pasture | 8.3% | 29.5%(-0.212)#48 | 28.0%(-0.197)#2,196 |
| 49. | Gratton | 8.4% | 29.5%(-0.211)#49 | 28.0%(-0.196)#2,223 |
| 50. | Charlotte Court House | 8.4% | 29.5%(-0.210)#50 | 28.0%(-0.195)#2,241 |
| 51. | Stafford Courthouse | 8.5% | 29.5%(-0.210)#51 | 28.0%(-0.195)#2,257 |
| 52. | Alexandria | 8.5% | 29.5%(-0.210)#52 | 28.0%(-0.194)#2,270 |
| 53. | Big Stone Gap | 9.5% | 29.5%(-0.200)#53 | 28.0%(-0.185)#2,543 |
| 54. | Schuyler | 9.5% | 29.5%(-0.200)#54 | 28.0%(-0.185)#2,544 |
| 55. | Glen Allen | 9.7% | 29.5%(-0.198)#55 | 28.0%(-0.183)#2,611 |
| 56. | Vinton | 9.8% | 29.5%(-0.197)#56 | 28.0%(-0.182)#2,641 |
| 57. | Lake Of The Woods | 9.8% | 29.5%(-0.196)#57 | 28.0%(-0.181)#2,654 |
| 58. | Weyers Cave | 10.1% | 29.5%(-0.194)#58 | 28.0%(-0.179)#2,726 |
| 59. | University Center | 10.1% | 29.5%(-0.193)#59 | 28.0%(-0.178)#2,744 |
| 60. | Remington | 10.2% | 29.5%(-0.193)#60 | 28.0%(-0.178)#2,748 |
| 61. | Claremont | 10.2% | 29.5%(-0.193)#61 | 28.0%(-0.178)#2,755 |
| 62. | Fort Chiswell | 10.2% | 29.5%(-0.193)#62 | 28.0%(-0.177)#2,777 |
| 63. | Brookneal | 10.6% | 29.5%(-0.188)#63 | 28.0%(-0.173)#2,899 |
| 64. | Grundy | 11.0% | 29.5%(-0.185)#64 | 28.0%(-0.170)#2,995 |
| 65. | Capron | 11.4% | 29.5%(-0.180)#65 | 28.0%(-0.165)#3,140 |
| 66. | Weber City | 11.4% | 29.5%(-0.180)#66 | 28.0%(-0.165)#3,142 |
| 67. | Chilhowie | 11.5% | 29.5%(-0.180)#67 | 28.0%(-0.165)#3,157 |
| 68. | New Hope | 11.5% | 29.5%(-0.180)#68 | 28.0%(-0.165)#3,172 |
| 69. | Martinsville | 11.6% | 29.5%(-0.178)#69 | 28.0%(-0.163)#3,214 |
| 70. | Esmont | 12.0% | 29.5%(-0.174)#70 | 28.0%(-0.159)#3,351 |
| 71. | Saltville | 12.2% | 29.5%(-0.173)#71 | 28.0%(-0.158)#3,395 |
| 72. | Lakeside | 12.2% | 29.5%(-0.173)#72 | 28.0%(-0.158)#3,402 |
| 73. | Dulles Town Center | 12.3% | 29.5%(-0.172)#73 | 28.0%(-0.157)#3,447 |
| 74. | Earlysville | 12.5% | 29.5%(-0.170)#74 | 28.0%(-0.155)#3,530 |
| 75. | Petersburg | 12.6% | 29.5%(-0.169)#75 | 28.0%(-0.154)#3,544 |
| 76. | New Market | 12.6% | 29.5%(-0.169)#76 | 28.0%(-0.153)#3,559 |
| 77. | Montvale | 13.1% | 29.5%(-0.164)#77 | 28.0%(-0.149)#3,711 |
| 78. | Mount Sidney | 13.1% | 29.5%(-0.164)#78 | 28.0%(-0.149)#3,723 |
| 79. | Bon Air | 13.3% | 29.5%(-0.161)#79 | 28.0%(-0.146)#3,803 |
| 80. | Roanoke | 13.8% | 29.5%(-0.157)#80 | 28.0%(-0.142)#3,955 |
| 81. | Arrington | 13.9% | 29.5%(-0.156)#81 | 28.0%(-0.141)#3,989 |
| 82. | Madison Heights | 14.0% | 29.5%(-0.155)#82 | 28.0%(-0.140)#4,004 |
| 83. | Kenbridge | 14.2% | 29.5%(-0.153)#83 | 28.0%(-0.138)#4,078 |
| 84. | Franconia | 14.2% | 29.5%(-0.153)#84 | 28.0%(-0.138)#4,100 |
| 85. | Hybla Valley | 14.7% | 29.5%(-0.147)#85 | 28.0%(-0.132)#4,278 |
| 86. | Bensley | 14.8% | 29.5%(-0.147)#86 | 28.0%(-0.132)#4,298 |
| 87. | Hopewell | 14.9% | 29.5%(-0.146)#87 | 28.0%(-0.130)#4,354 |
| 88. | Ridgeway | 15.0% | 29.5%(-0.145)#88 | 28.0%(-0.130)#4,372 |
| 89. | Victoria | 15.0% | 29.5%(-0.145)#89 | 28.0%(-0.130)#4,377 |
| 90. | Castlewood | 15.1% | 29.5%(-0.144)#90 | 28.0%(-0.129)#4,408 |
| 91. | Woodburn | 15.1% | 29.5%(-0.144)#91 | 28.0%(-0.128)#4,424 |
| 92. | Round Hill | 15.5% | 29.5%(-0.139)#92 | 28.0%(-0.124)#4,567 |
| 93. | Captains Cove | 15.6% | 29.5%(-0.139)#93 | 28.0%(-0.124)#4,597 |
| 94. | Dooms | 15.7% | 29.5%(-0.138)#94 | 28.0%(-0.123)#4,659 |
| 95. | Chamberlayne | 15.7% | 29.5%(-0.137)#95 | 28.0%(-0.122)#4,668 |
| 96. | Blue Ridge | 16.0% | 29.5%(-0.135)#96 | 28.0%(-0.120)#4,766 |
| 97. | Haymarket | 16.0% | 29.5%(-0.135)#97 | 28.0%(-0.120)#4,776 |
| 98. | Onancock | 16.0% | 29.5%(-0.134)#98 | 28.0%(-0.119)#4,785 |
| 99. | Fries | 16.1% | 29.5%(-0.134)#99 | 28.0%(-0.119)#4,794 |
| 100. | North Springfield | 16.3% | 29.5%(-0.132)#100 | 28.0%(-0.117)#4,885 |
Common Questions
What are the Top 10 Cities with the Lowest Wage/Income Gap (%) in Virginia?
Top 10 Cities with the Lowest Wage/Income Gap (%) in Virginia are:
#1
0.62%
#2
1.1%
#3
1.1%
#4
1.1%
#5
1.2%
#6
1.7%
#7
1.7%
#8
2.1%
#9
2.5%
#10
2.6%
What city has the Lowest Wage/Income Gap (%) in Virginia?
Sandston has the Lowest Wage/Income Gap (%) in Virginia with 0.62%.
What is the Wage / Income Gap in Percentage Terms in the State of Virginia?
Wage / Income Gap in Percentage Terms in Virginia is 29.5%.
What is the Wage / Income Gap in Percentage Terms in the United States?
Wage / Income Gap in Percentage Terms in the United States is 28.0%.