Millheim borough, PA Map & Demographics
Millheim borough Overview
$38,415
PER CAPITA INCOME
$91,250
AVG FAMILY INCOME
$61,250
AVG HOUSEHOLD INCOME
0.7%
WAGE / INCOME GAP [ % ]
99.3¢/ $1
WAGE / INCOME GAP [ $ ]
0.40
INEQUALITY / GINI INDEX
598
TOTAL POPULATION
320
MALE POPULATION
278
FEMALE POPULATION
115.11
MALES / 100 FEMALES
86.88
FEMALES / 100 MALES
48.4
MEDIAN AGE
2.8
AVG FAMILY SIZE
1.9
AVG HOUSEHOLD SIZE
372
LABOR FORCE [ PEOPLE ]
72.1%
PERCENT IN LABOR FORCE
Income in Millheim borough
Income Overview in Millheim borough
Per Capita Income in Millheim borough is $38,415, while median incomes of families and households are $91,250 and $61,250 respectively.
| Characteristic | Number | Measure |
| Per Capita Income | 598 | $38,415 |
| Median Family Income | 154 | $91,250 |
| Mean Family Income | 154 | $100,348 |
| Median Household Income | 314 | $61,250 |
| Mean Household Income | 314 | $73,413 |
| Income Deficit | 154 | $0 |
| Wage / Income Gap (%) | 598 | 0.71% |
| Wage / Income Gap ($) | 598 | 99.29¢ per $1 |
| Gini / Inequality Index | 598 | 0.40 |
Earnings by Sex in Millheim borough
Average Earnings in Millheim borough are $43,942, $43,750 for men and $44,063 for women, a difference of 0.7%.
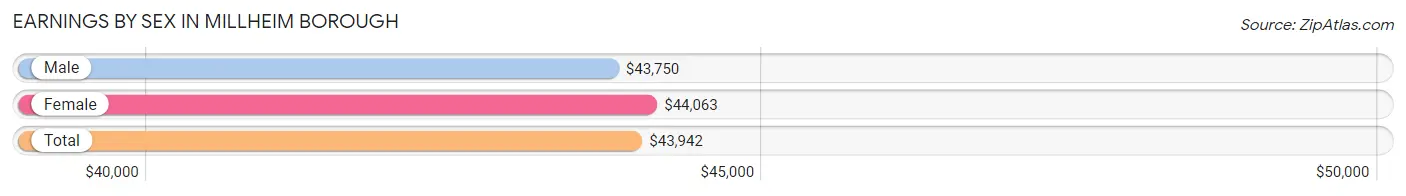
| Sex | Number | Average Earnings |
| Male | 203 (54.4%) | $43,750 |
| Female | 170 (45.6%) | $44,063 |
| Total | 373 (100.0%) | $43,942 |
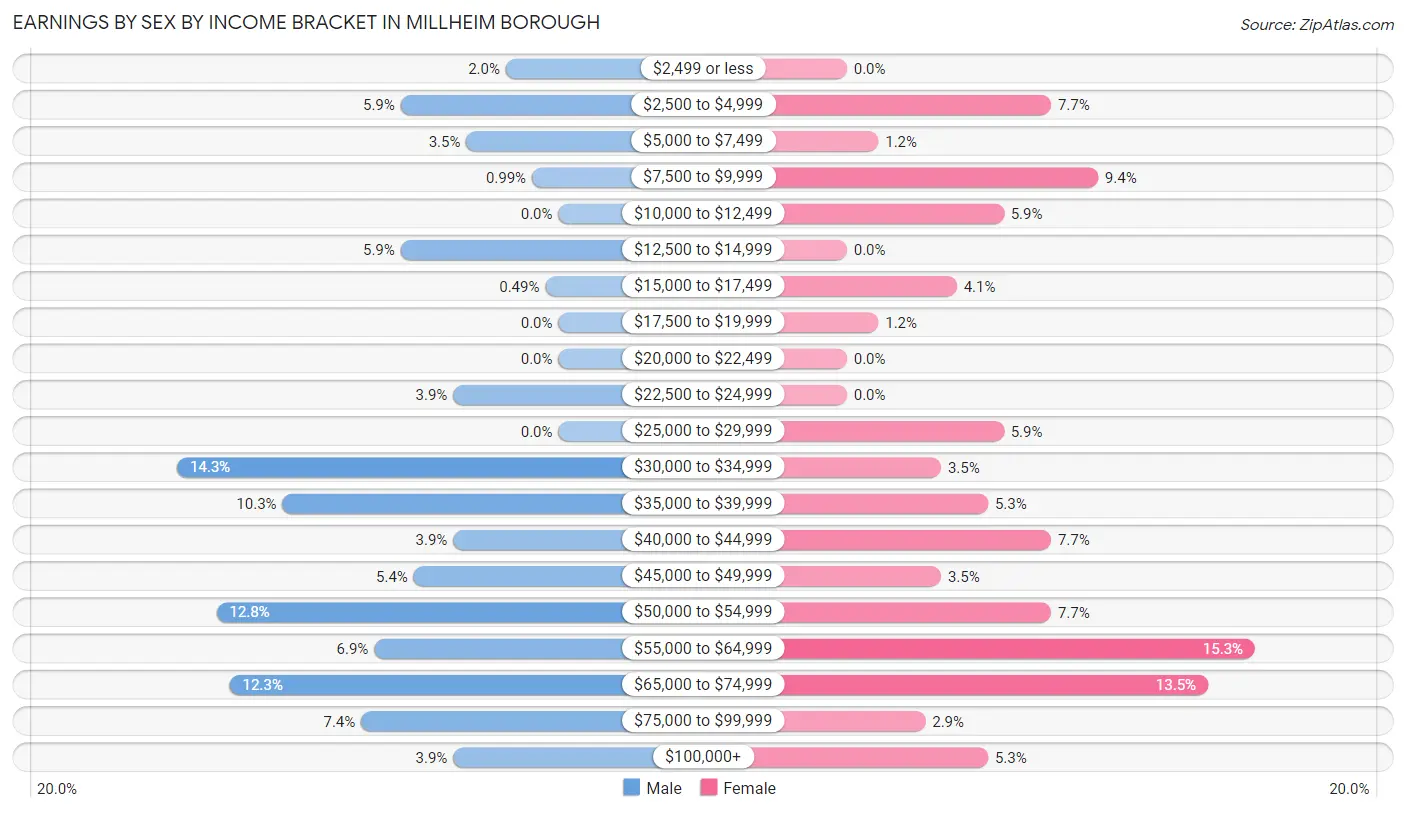
Earnings by Sex by Income Bracket in Millheim borough
The most common earnings brackets in Millheim borough are $30,000 to $34,999 for men (29 | 14.3%) and $55,000 to $64,999 for women (26 | 15.3%).
| Income | Male | Female |
| $2,499 or less | 4 (2.0%) | 0 (0.0%) |
| $2,500 to $4,999 | 12 (5.9%) | 13 (7.6%) |
| $5,000 to $7,499 | 7 (3.5%) | 2 (1.2%) |
| $7,500 to $9,999 | 2 (1.0%) | 16 (9.4%) |
| $10,000 to $12,499 | 0 (0.0%) | 10 (5.9%) |
| $12,500 to $14,999 | 12 (5.9%) | 0 (0.0%) |
| $15,000 to $17,499 | 1 (0.5%) | 7 (4.1%) |
| $17,500 to $19,999 | 0 (0.0%) | 2 (1.2%) |
| $20,000 to $22,499 | 0 (0.0%) | 0 (0.0%) |
| $22,500 to $24,999 | 8 (3.9%) | 0 (0.0%) |
| $25,000 to $29,999 | 0 (0.0%) | 10 (5.9%) |
| $30,000 to $34,999 | 29 (14.3%) | 6 (3.5%) |
| $35,000 to $39,999 | 21 (10.3%) | 9 (5.3%) |
| $40,000 to $44,999 | 8 (3.9%) | 13 (7.6%) |
| $45,000 to $49,999 | 11 (5.4%) | 6 (3.5%) |
| $50,000 to $54,999 | 26 (12.8%) | 13 (7.6%) |
| $55,000 to $64,999 | 14 (6.9%) | 26 (15.3%) |
| $65,000 to $74,999 | 25 (12.3%) | 23 (13.5%) |
| $75,000 to $99,999 | 15 (7.4%) | 5 (2.9%) |
| $100,000+ | 8 (3.9%) | 9 (5.3%) |
| Total | 203 (100.0%) | 170 (100.0%) |
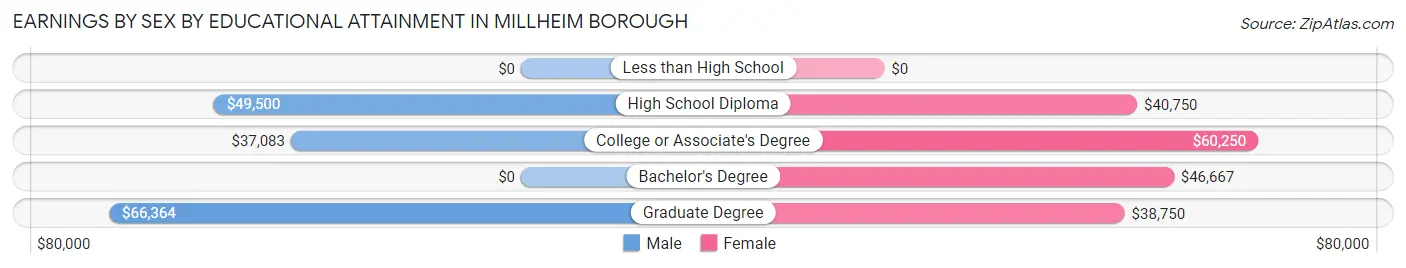
Earnings by Sex by Educational Attainment in Millheim borough
Average earnings in Millheim borough are $46,250 for men and $51,042 for women, a difference of 9.4%. Men with an educational attainment of graduate degree enjoy the highest average annual earnings of $66,364, while those with college or associate's degree education earn the least with $37,083. Women with an educational attainment of college or associate's degree earn the most with the average annual earnings of $60,250, while those with graduate degree education have the smallest earnings of $38,750.
| Educational Attainment | Male Income | Female Income |
| Less than High School | - | - |
| High School Diploma | $49,500 | $40,750 |
| College or Associate's Degree | $37,083 | $60,250 |
| Bachelor's Degree | - | - |
| Graduate Degree | $66,364 | $38,750 |
| Total | $46,250 | $51,042 |
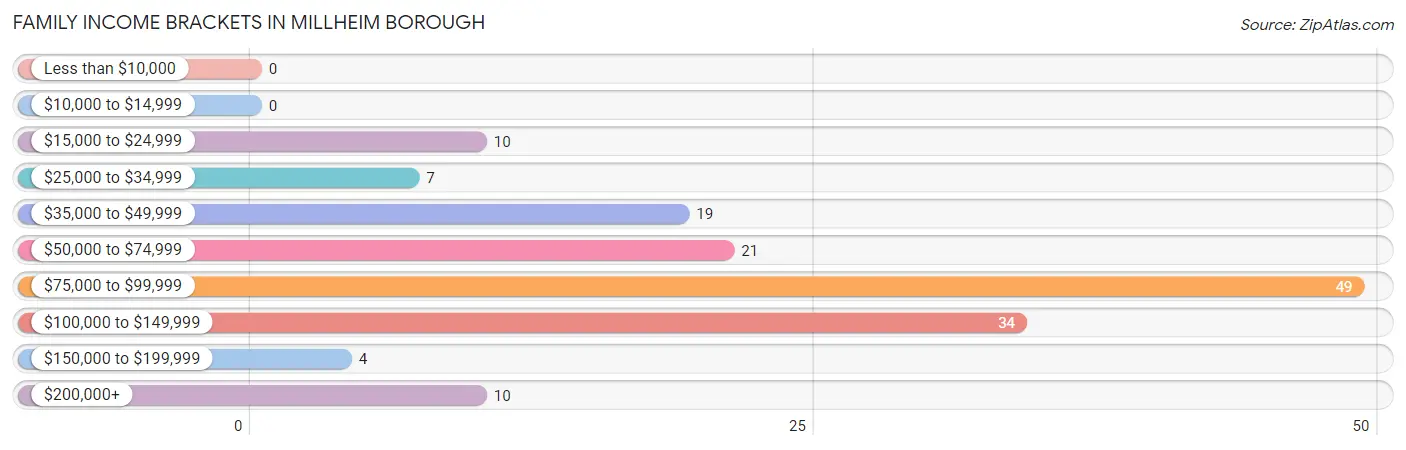
Family Income in Millheim borough
Family Income Brackets in Millheim borough
According to the Millheim borough family income data, there are 49 families falling into the $75,000 to $99,999 income range, which is the most common income bracket and makes up 31.8% of all families.
| Income Bracket | # Families | % Families |
| Less than $10,000 | 0 | 0.0% |
| $10,000 to $14,999 | 0 | 0.0% |
| $15,000 to $24,999 | 10 | 6.5% |
| $25,000 to $34,999 | 7 | 4.5% |
| $35,000 to $49,999 | 19 | 12.3% |
| $50,000 to $74,999 | 21 | 13.6% |
| $75,000 to $99,999 | 49 | 31.8% |
| $100,000 to $149,999 | 34 | 22.1% |
| $150,000 to $199,999 | 4 | 2.6% |
| $200,000+ | 10 | 6.5% |
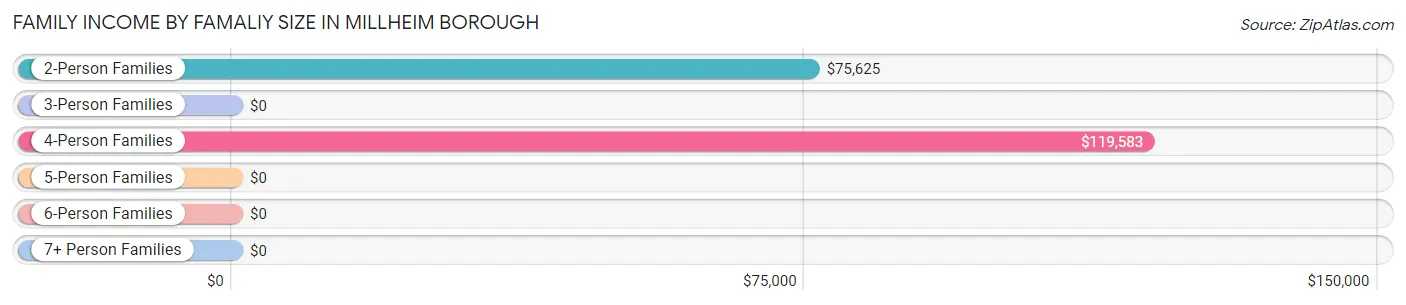
Family Income by Famaliy Size in Millheim borough
4-person families (39 | 25.3%) account for the highest median family income in Millheim borough with $119,583 per family, while 2-person families (77 | 50.0%) have the highest median income of $37,812 per family member.
| Income Bracket | # Families | Median Income |
| 2-Person Families | 77 (50.0%) | $75,625 |
| 3-Person Families | 34 (22.1%) | $0 |
| 4-Person Families | 39 (25.3%) | $119,583 |
| 5-Person Families | 2 (1.3%) | $0 |
| 6-Person Families | 2 (1.3%) | $0 |
| 7+ Person Families | 0 (0.0%) | $0 |
| Total | 154 (100.0%) | $91,250 |
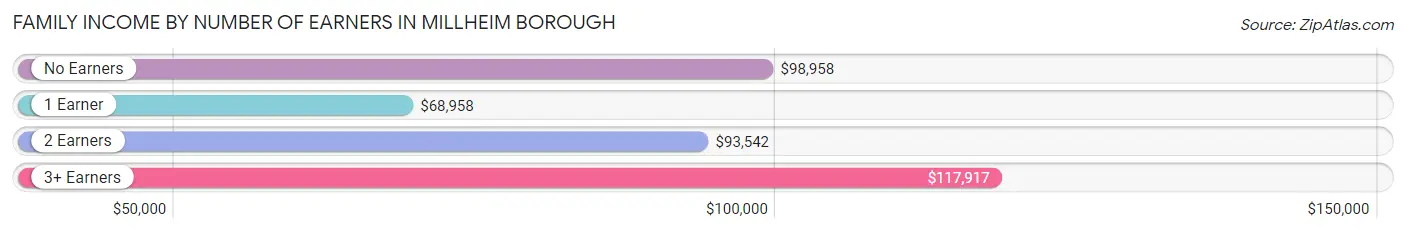
Family Income by Number of Earners in Millheim borough
The median family income in Millheim borough is $91,250, with families comprising 3+ earners (7) having the highest median family income of $117,917, while families with 1 earner (41) have the lowest median family income of $68,958, accounting for 4.5% and 26.6% of families, respectively.
| Number of Earners | # Families | Median Income |
| No Earners | 11 (7.1%) | $98,958 |
| 1 Earner | 41 (26.6%) | $68,958 |
| 2 Earners | 95 (61.7%) | $93,542 |
| 3+ Earners | 7 (4.5%) | $117,917 |
| Total | 154 (100.0%) | $91,250 |
Household Income in Millheim borough
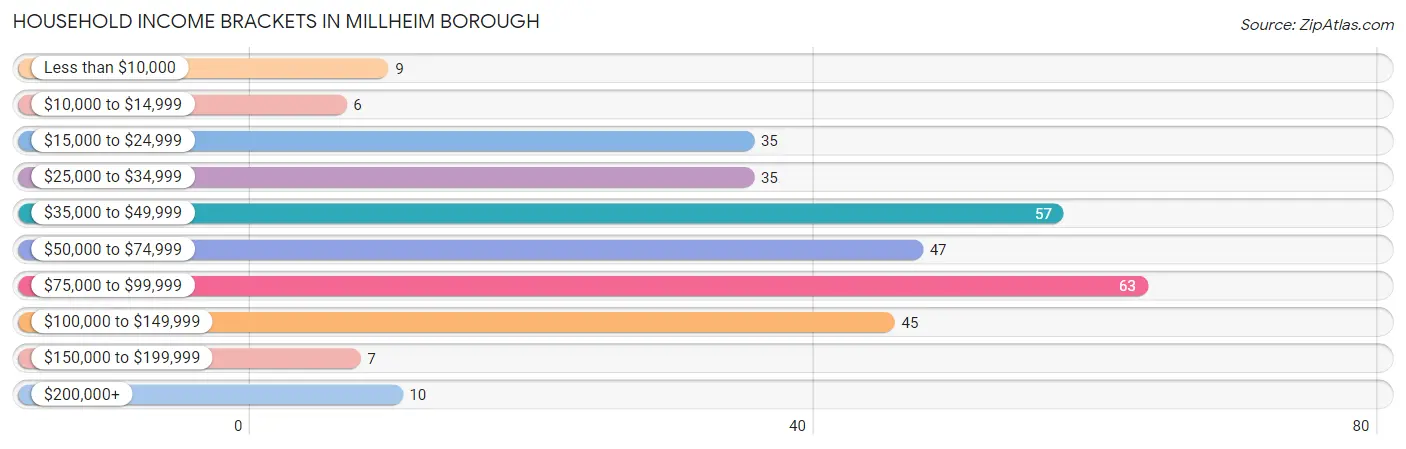
Household Income Brackets in Millheim borough
With 63 households falling in the category, the $75,000 to $99,999 income range is the most frequent in Millheim borough, accounting for 20.1% of all households. In contrast, only 6 households (1.9%) fall into the $10,000 to $14,999 income bracket, making it the least populous group.
| Income Bracket | # Households | % Households |
| Less than $10,000 | 9 | 2.9% |
| $10,000 to $14,999 | 6 | 1.9% |
| $15,000 to $24,999 | 35 | 11.1% |
| $25,000 to $34,999 | 35 | 11.1% |
| $35,000 to $49,999 | 57 | 18.2% |
| $50,000 to $74,999 | 47 | 15.0% |
| $75,000 to $99,999 | 63 | 20.1% |
| $100,000 to $149,999 | 45 | 14.3% |
| $150,000 to $199,999 | 7 | 2.2% |
| $200,000+ | 10 | 3.2% |
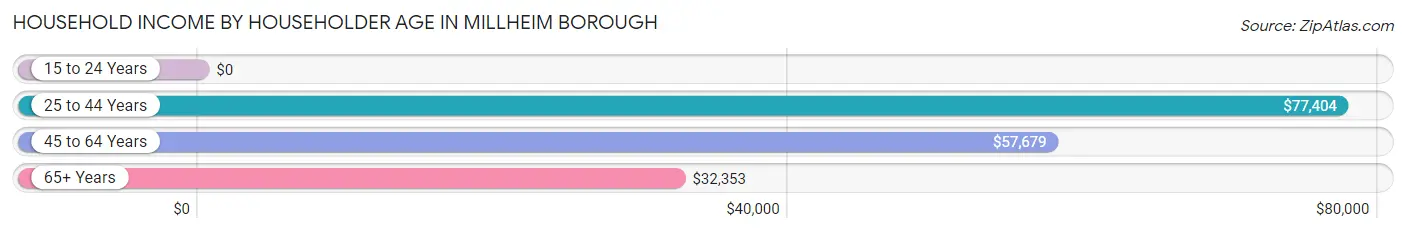
Household Income by Householder Age in Millheim borough
The median household income in Millheim borough is $61,250, with the highest median household income of $77,404 found in the 25 to 44 years age bracket for the primary householder. A total of 87 households (27.7%) fall into this category.
| Income Bracket | # Households | Median Income |
| 15 to 24 Years | 0 (0.0%) | $0 |
| 25 to 44 Years | 87 (27.7%) | $77,404 |
| 45 to 64 Years | 131 (41.7%) | $57,679 |
| 65+ Years | 96 (30.6%) | $32,353 |
| Total | 314 (100.0%) | $61,250 |
Poverty in Millheim borough
Income Below Poverty by Sex and Age in Millheim borough
With 7.2% poverty level for males and 5.8% for females among the residents of Millheim borough, 25 to 34 year old males and 75 year old and over females are the most vulnerable to poverty, with 12 males (46.2%) and 6 females (16.7%) in their respective age groups living below the poverty level.
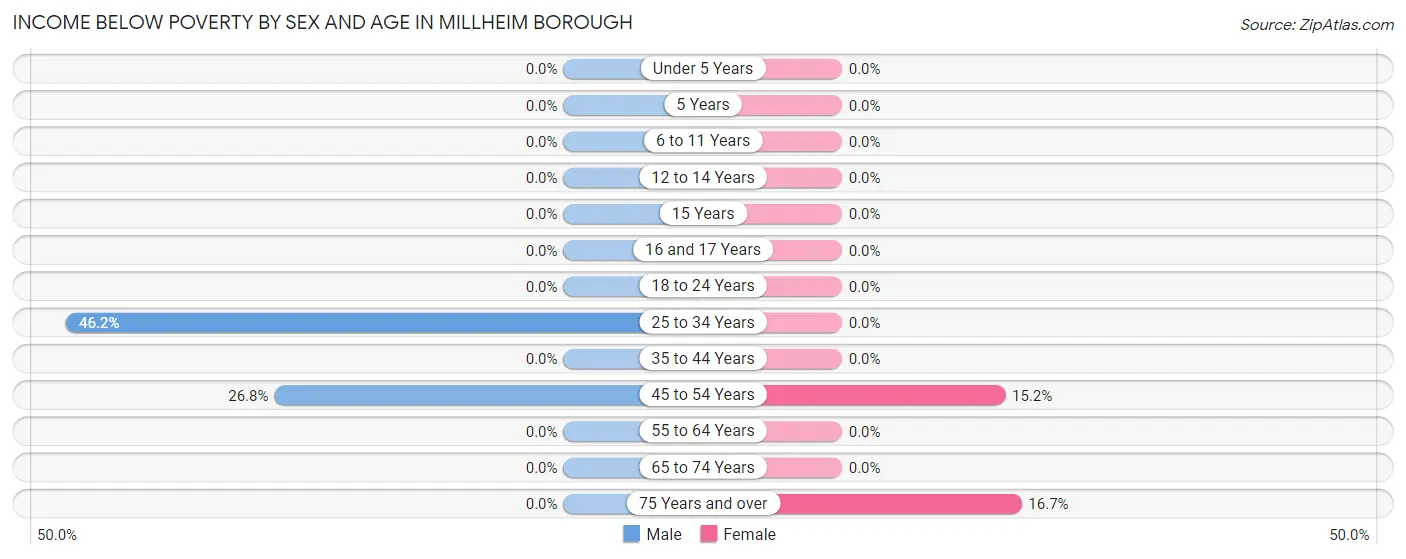
| Age Bracket | Male | Female |
| Under 5 Years | 0 (0.0%) | 0 (0.0%) |
| 5 Years | 0 (0.0%) | 0 (0.0%) |
| 6 to 11 Years | 0 (0.0%) | 0 (0.0%) |
| 12 to 14 Years | 0 (0.0%) | 0 (0.0%) |
| 15 Years | 0 (0.0%) | 0 (0.0%) |
| 16 and 17 Years | 0 (0.0%) | 0 (0.0%) |
| 18 to 24 Years | 0 (0.0%) | 0 (0.0%) |
| 25 to 34 Years | 12 (46.2%) | 0 (0.0%) |
| 35 to 44 Years | 0 (0.0%) | 0 (0.0%) |
| 45 to 54 Years | 11 (26.8%) | 10 (15.1%) |
| 55 to 64 Years | 0 (0.0%) | 0 (0.0%) |
| 65 to 74 Years | 0 (0.0%) | 0 (0.0%) |
| 75 Years and over | 0 (0.0%) | 6 (16.7%) |
| Total | 23 (7.2%) | 16 (5.8%) |
Income Above Poverty by Sex and Age in Millheim borough
According to the poverty statistics in Millheim borough, males aged under 5 years and females aged under 5 years are the age groups that are most secure financially, with 100.0% of males and 100.0% of females in these age groups living above the poverty line.
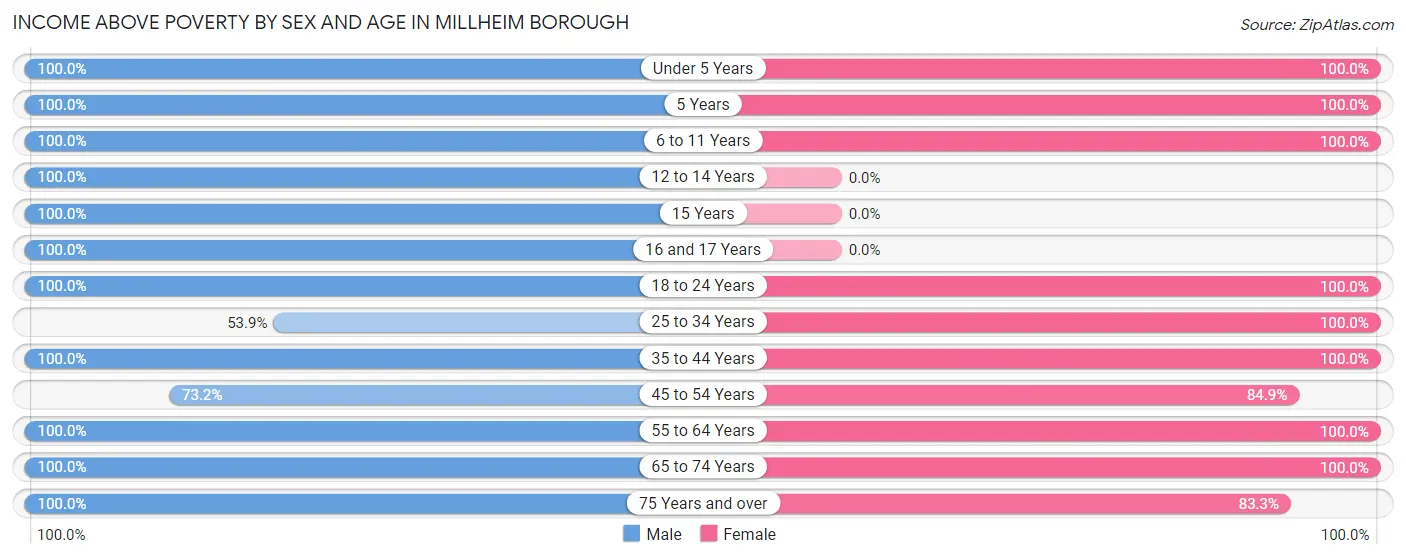
| Age Bracket | Male | Female |
| Under 5 Years | 7 (100.0%) | 6 (100.0%) |
| 5 Years | 6 (100.0%) | 1 (100.0%) |
| 6 to 11 Years | 30 (100.0%) | 28 (100.0%) |
| 12 to 14 Years | 2 (100.0%) | 0 (0.0%) |
| 15 Years | 2 (100.0%) | 0 (0.0%) |
| 16 and 17 Years | 13 (100.0%) | 0 (0.0%) |
| 18 to 24 Years | 13 (100.0%) | 23 (100.0%) |
| 25 to 34 Years | 14 (53.8%) | 27 (100.0%) |
| 35 to 44 Years | 68 (100.0%) | 32 (100.0%) |
| 45 to 54 Years | 30 (73.2%) | 56 (84.9%) |
| 55 to 64 Years | 54 (100.0%) | 36 (100.0%) |
| 65 to 74 Years | 40 (100.0%) | 23 (100.0%) |
| 75 Years and over | 18 (100.0%) | 30 (83.3%) |
| Total | 297 (92.8%) | 262 (94.2%) |
Income Below Poverty Among Married-Couple Families in Millheim borough
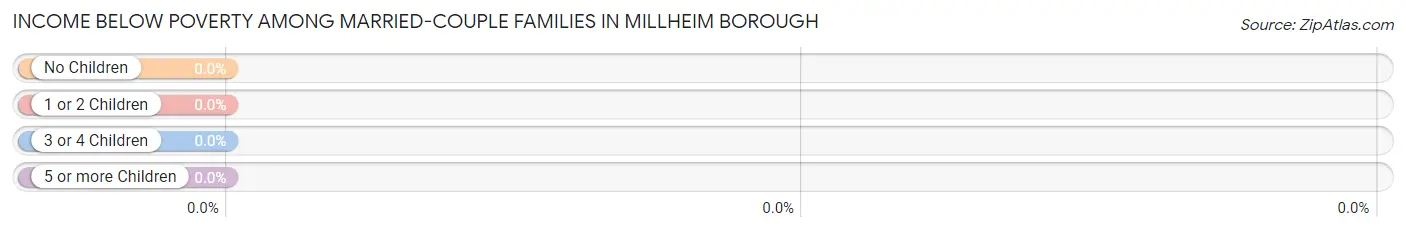
| Children | Above Poverty | Below Poverty |
| No Children | 60 (100.0%) | 0 (0.0%) |
| 1 or 2 Children | 65 (100.0%) | 0 (0.0%) |
| 3 or 4 Children | 2 (100.0%) | 0 (0.0%) |
| 5 or more Children | 0 (0.0%) | 0 (0.0%) |
| Total | 127 (100.0%) | 0 (0.0%) |
Income Below Poverty Among Single-Parent Households in Millheim borough
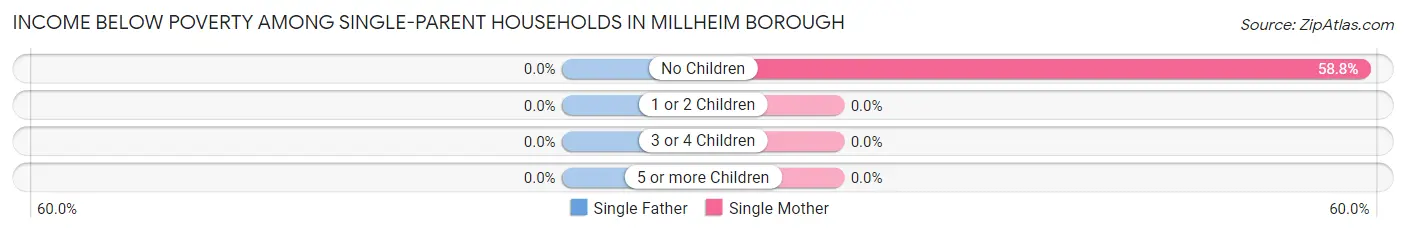
| Children | Single Father | Single Mother |
| No Children | 0 (0.0%) | 10 (58.8%) |
| 1 or 2 Children | 0 (0.0%) | 0 (0.0%) |
| 3 or 4 Children | 0 (0.0%) | 0 (0.0%) |
| 5 or more Children | 0 (0.0%) | 0 (0.0%) |
| Total | 0 (0.0%) | 10 (58.8%) |
Income Below Poverty Among Married-Couple vs Single-Parent Households in Millheim borough
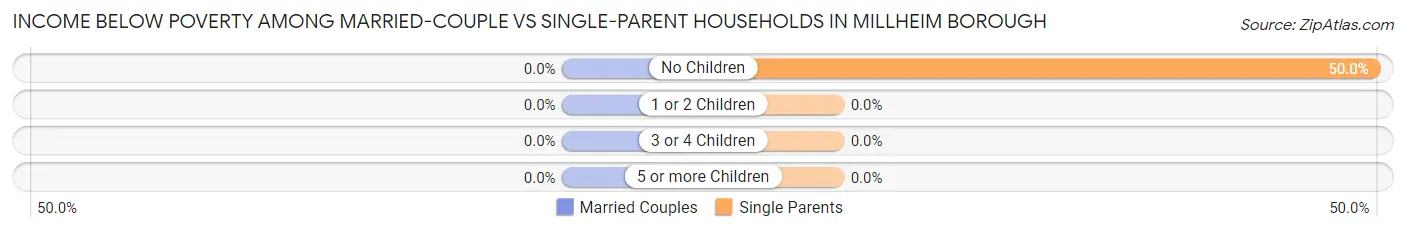
| Children | Married-Couple Families | Single-Parent Households |
| No Children | 0 (0.0%) | 10 (50.0%) |
| 1 or 2 Children | 0 (0.0%) | 0 (0.0%) |
| 3 or 4 Children | 0 (0.0%) | 0 (0.0%) |
| 5 or more Children | 0 (0.0%) | 0 (0.0%) |
| Total | 0 (0.0%) | 10 (37.0%) |
Race in Millheim borough
The most populous races in Millheim borough are White / Caucasian (569 | 95.2%), Hispanic or Latino (23 | 3.8%), and Some other Race (19 | 3.2%).
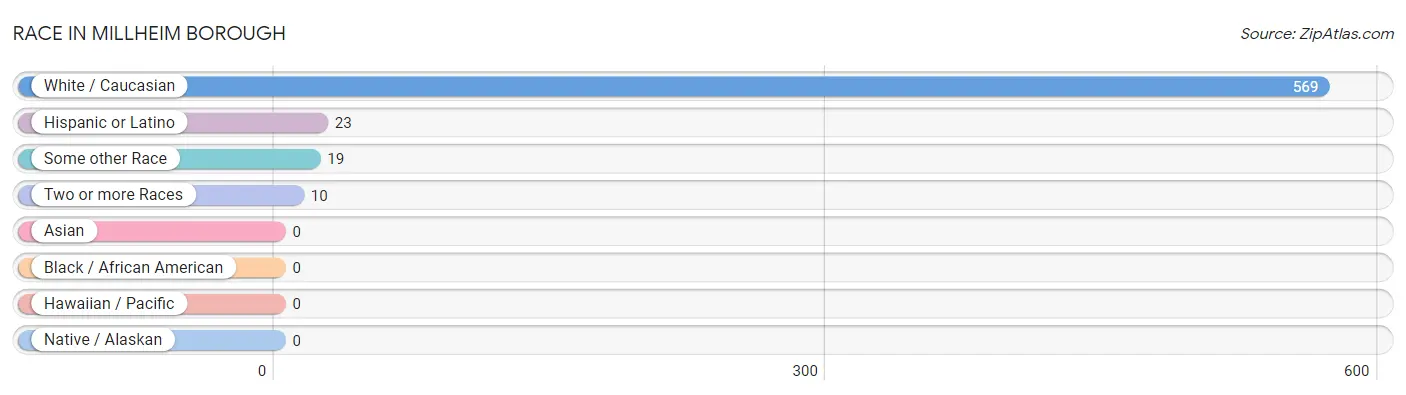
| Race | # Population | % Population |
| Asian | 0 | 0.0% |
| Black / African American | 0 | 0.0% |
| Hawaiian / Pacific | 0 | 0.0% |
| Hispanic or Latino | 23 | 3.8% |
| Native / Alaskan | 0 | 0.0% |
| White / Caucasian | 569 | 95.2% |
| Two or more Races | 10 | 1.7% |
| Some other Race | 19 | 3.2% |
| Total | 598 | 100.0% |
Ancestry in Millheim borough
The most populous ancestries reported in Millheim borough are German (192 | 32.1%), Irish (49 | 8.2%), Italian (47 | 7.9%), Pennsylvania German (35 | 5.9%), and American (33 | 5.5%), together accounting for 59.5% of all Millheim borough residents.
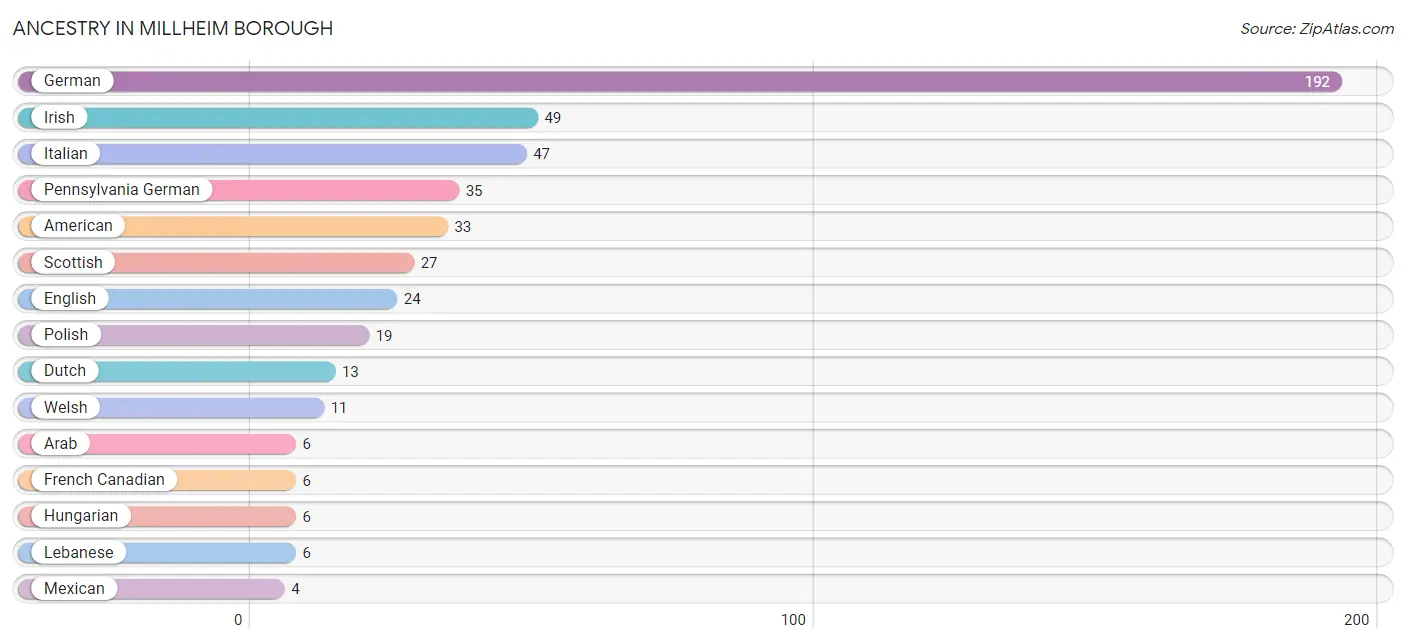
| Ancestry | # Population | % Population |
| American | 33 | 5.5% |
| Arab | 6 | 1.0% |
| Belgian | 2 | 0.3% |
| British | 1 | 0.2% |
| Danish | 2 | 0.3% |
| Dutch | 13 | 2.2% |
| English | 24 | 4.0% |
| French | 3 | 0.5% |
| French Canadian | 6 | 1.0% |
| German | 192 | 32.1% |
| Hungarian | 6 | 1.0% |
| Irish | 49 | 8.2% |
| Italian | 47 | 7.9% |
| Lebanese | 6 | 1.0% |
| Mexican | 4 | 0.7% |
| Pennsylvania German | 35 | 5.9% |
| Polish | 19 | 3.2% |
| Russian | 4 | 0.7% |
| Scottish | 27 | 4.5% |
| Slovak | 1 | 0.2% |
| Swedish | 1 | 0.2% |
| Ukrainian | 1 | 0.2% |
| Welsh | 11 | 1.8% | View All 23 Rows |
Immigrants in Millheim borough

| Immigration Origin | # Population | % Population | View All 0 Rows |
Sex and Age in Millheim borough
Sex and Age in Millheim borough
The most populous age groups in Millheim borough are 40 to 44 Years (41 | 12.8%) for men and 45 to 49 Years (37 | 13.3%) for women.
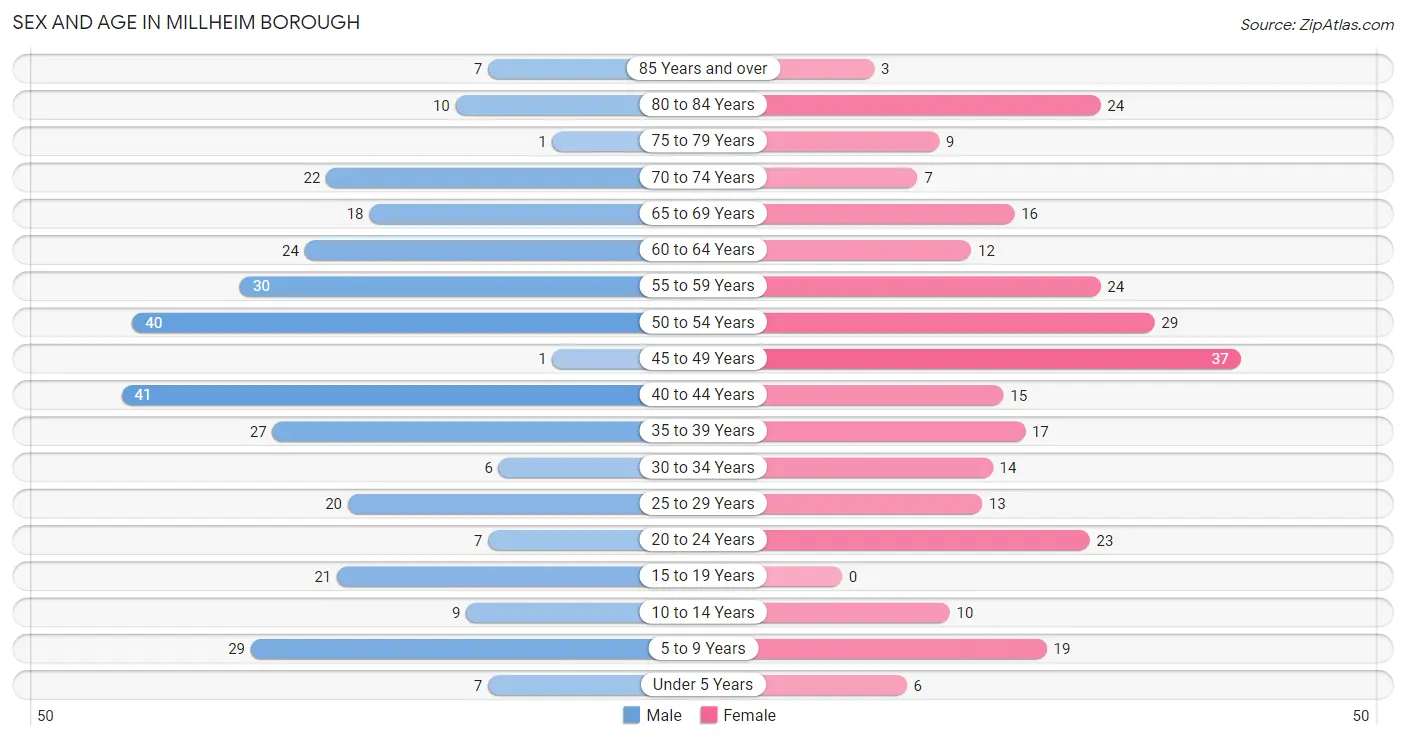
| Age Bracket | Male | Female |
| Under 5 Years | 7 (2.2%) | 6 (2.2%) |
| 5 to 9 Years | 29 (9.1%) | 19 (6.8%) |
| 10 to 14 Years | 9 (2.8%) | 10 (3.6%) |
| 15 to 19 Years | 21 (6.6%) | 0 (0.0%) |
| 20 to 24 Years | 7 (2.2%) | 23 (8.3%) |
| 25 to 29 Years | 20 (6.2%) | 13 (4.7%) |
| 30 to 34 Years | 6 (1.9%) | 14 (5.0%) |
| 35 to 39 Years | 27 (8.4%) | 17 (6.1%) |
| 40 to 44 Years | 41 (12.8%) | 15 (5.4%) |
| 45 to 49 Years | 1 (0.3%) | 37 (13.3%) |
| 50 to 54 Years | 40 (12.5%) | 29 (10.4%) |
| 55 to 59 Years | 30 (9.4%) | 24 (8.6%) |
| 60 to 64 Years | 24 (7.5%) | 12 (4.3%) |
| 65 to 69 Years | 18 (5.6%) | 16 (5.8%) |
| 70 to 74 Years | 22 (6.9%) | 7 (2.5%) |
| 75 to 79 Years | 1 (0.3%) | 9 (3.2%) |
| 80 to 84 Years | 10 (3.1%) | 24 (8.6%) |
| 85 Years and over | 7 (2.2%) | 3 (1.1%) |
| Total | 320 (100.0%) | 278 (100.0%) |
Families and Households in Millheim borough
Median Family Size in Millheim borough
The median family size in Millheim borough is 2.77 persons per family, with married-couple families (127 | 82.5%) accounting for the largest median family size of 2.85 persons per family. On the other hand, single female/mother families (17 | 11.0%) represent the smallest median family size with 2.18 persons per family.
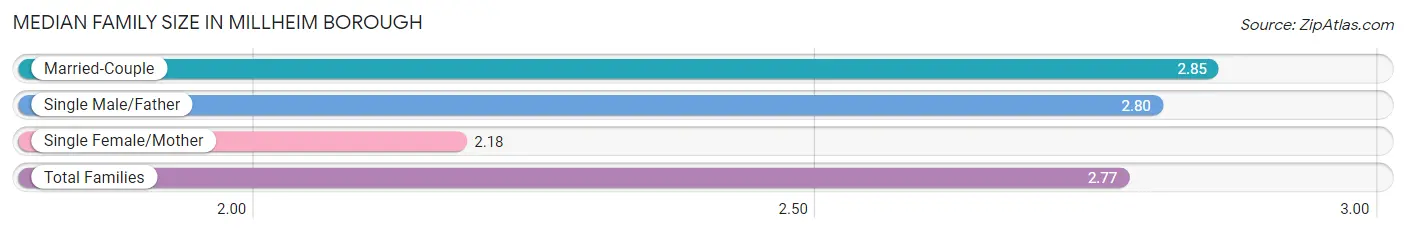
| Family Type | # Families | Family Size |
| Married-Couple | 127 (82.5%) | 2.85 |
| Single Male/Father | 10 (6.5%) | 2.80 |
| Single Female/Mother | 17 (11.0%) | 2.18 |
| Total Families | 154 (100.0%) | 2.77 |
Median Household Size in Millheim borough
The median household size in Millheim borough is 1.90 persons per household, with single male/father households (10 | 3.2%) accounting for the largest median household size of 3.3 persons per household. non-family households (160 | 51.0%) represent the smallest median household size with 1.04 persons per household.
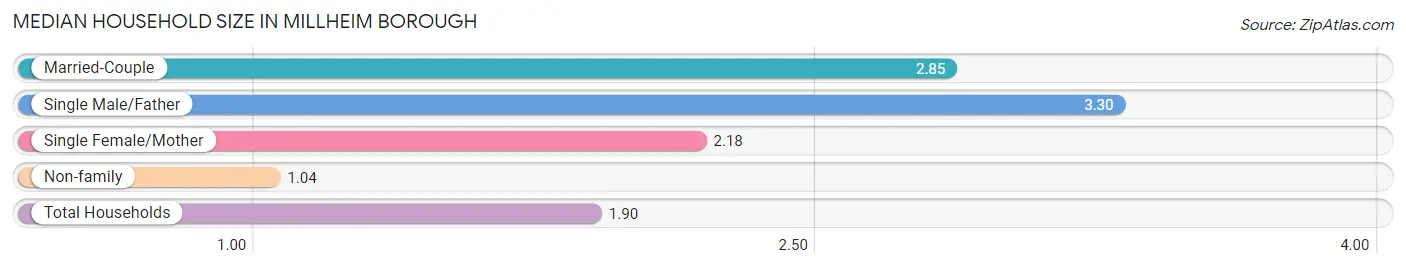
| Household Type | # Households | Household Size |
| Married-Couple | 127 (40.5%) | 2.85 |
| Single Male/Father | 10 (3.2%) | 3.30 |
| Single Female/Mother | 17 (5.4%) | 2.18 |
| Non-family | 160 (51.0%) | 1.04 |
| Total Households | 314 (100.0%) | 1.90 |
Household Size by Marriage Status in Millheim borough
Out of a total of 314 households in Millheim borough, 154 (49.0%) are family households, while 160 (51.0%) are nonfamily households. The most numerous type of family households are 2-person households, comprising 77, and the most common type of nonfamily households are 1-person households, comprising 153.
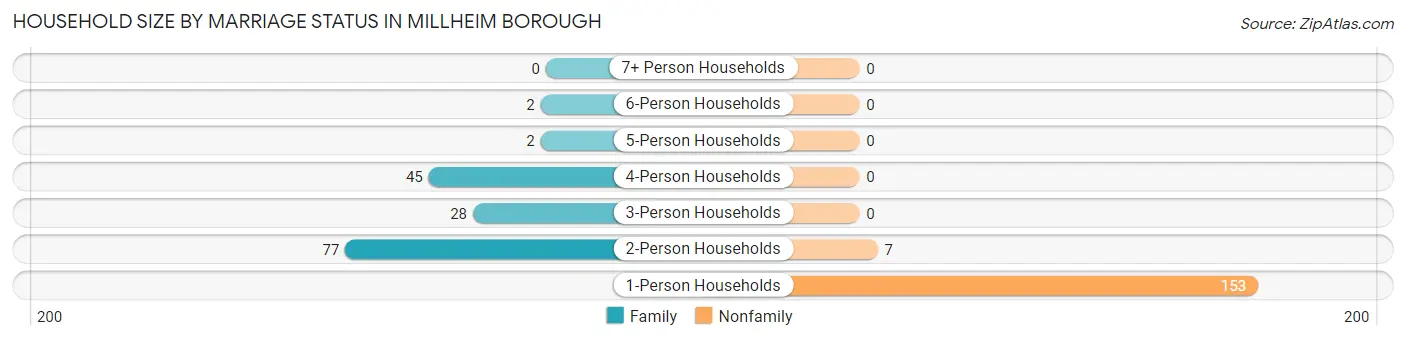
| Household Size | Family Households | Nonfamily Households |
| 1-Person Households | - | 153 (48.7%) |
| 2-Person Households | 77 (24.5%) | 7 (2.2%) |
| 3-Person Households | 28 (8.9%) | 0 (0.0%) |
| 4-Person Households | 45 (14.3%) | 0 (0.0%) |
| 5-Person Households | 2 (0.6%) | 0 (0.0%) |
| 6-Person Households | 2 (0.6%) | 0 (0.0%) |
| 7+ Person Households | 0 (0.0%) | 0 (0.0%) |
| Total | 154 (49.0%) | 160 (51.0%) |
Female Fertility in Millheim borough
Fertility by Age in Millheim borough
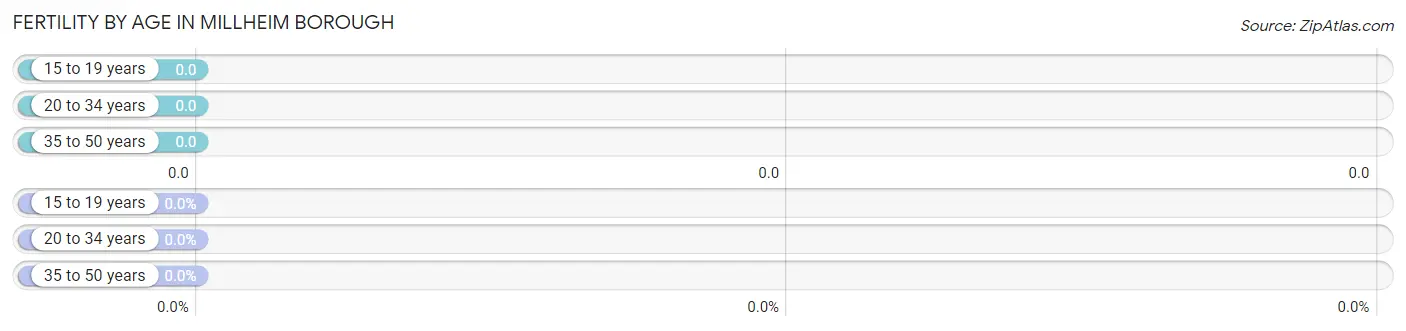
| Age Bracket | Women with Births | Births / 1,000 Women |
| 15 to 19 years | 0 (0.0%) | 0.0 |
| 20 to 34 years | 0 (0.0%) | 0.0 |
| 35 to 50 years | 0 (0.0%) | 0.0 |
| Total | 0 (0.0%) | 0.0 |
Fertility by Age by Marriage Status in Millheim borough
| Age Bracket | Married | Unmarried |
| 15 to 19 years | 0 (0.0%) | 0 (0.0%) |
| 20 to 34 years | 0 (0.0%) | 0 (0.0%) |
| 35 to 50 years | 0 (0.0%) | 0 (0.0%) |
| Total | 0 (0.0%) | 0 (0.0%) |
Fertility by Education in Millheim borough
| Educational Attainment | Women with Births | Births / 1,000 Women |
| Less than High School | 0 (0.0%) | 0.0 |
| High School Diploma | 0 (0.0%) | 0.0 |
| College or Associate's Degree | 0 (0.0%) | 0.0 |
| Bachelor's Degree | 0 (0.0%) | 0.0 |
| Graduate Degree | 0 (0.0%) | 0.0 |
| Total | 0 (0.0%) | 0.0 |
Fertility by Education by Marriage Status in Millheim borough
| Educational Attainment | Married | Unmarried |
| Less than High School | 0 (0.0%) | 0 (0.0%) |
| High School Diploma | 0 (0.0%) | 0 (0.0%) |
| College or Associate's Degree | 0 (0.0%) | 0 (0.0%) |
| Bachelor's Degree | 0 (0.0%) | 0 (0.0%) |
| Graduate Degree | 0 (0.0%) | 0 (0.0%) |
| Total | 0 (0.0%) | 0 (0.0%) |
Employment Characteristics in Millheim borough
Employment by Class of Employer in Millheim borough
Among the 372 employed individuals in Millheim borough, private company employees (250 | 67.2%), not-for-profit organizations (58 | 15.6%), and state government employees (29 | 7.8%) make up the most common classes of employment.
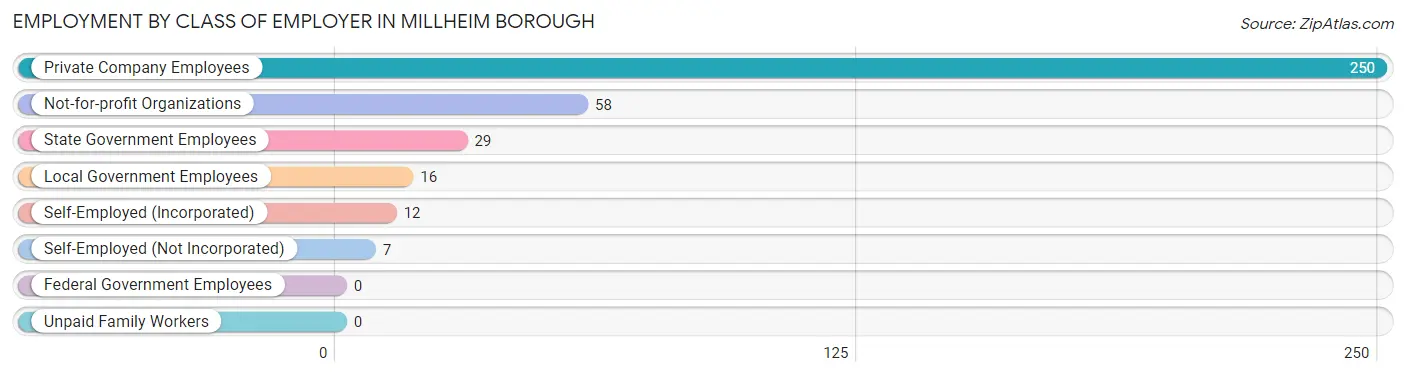
| Employer Class | # Employees | % Employees |
| Private Company Employees | 250 | 67.2% |
| Self-Employed (Incorporated) | 12 | 3.2% |
| Self-Employed (Not Incorporated) | 7 | 1.9% |
| Not-for-profit Organizations | 58 | 15.6% |
| Local Government Employees | 16 | 4.3% |
| State Government Employees | 29 | 7.8% |
| Federal Government Employees | 0 | 0.0% |
| Unpaid Family Workers | 0 | 0.0% |
| Total | 372 | 100.0% |
Employment Status by Age in Millheim borough
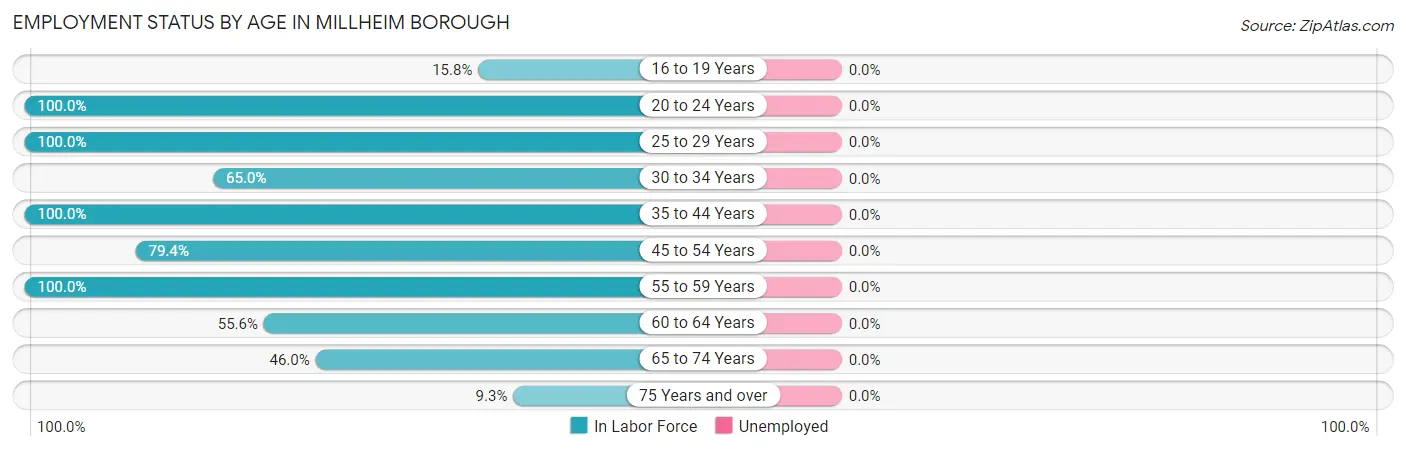
| Age Bracket | In Labor Force | Unemployed |
| 16 to 19 Years | 3 (15.8%) | 0 (0.0%) |
| 20 to 24 Years | 30 (100.0%) | 0 (0.0%) |
| 25 to 29 Years | 33 (100.0%) | 0 (0.0%) |
| 30 to 34 Years | 13 (65.0%) | 0 (0.0%) |
| 35 to 44 Years | 100 (100.0%) | 0 (0.0%) |
| 45 to 54 Years | 85 (79.4%) | 0 (0.0%) |
| 55 to 59 Years | 54 (100.0%) | 0 (0.0%) |
| 60 to 64 Years | 20 (55.6%) | 0 (0.0%) |
| 65 to 74 Years | 29 (46.0%) | 0 (0.0%) |
| 75 Years and over | 5 (9.3%) | 0 (0.0%) |
| Total | 372 (72.1%) | 0 (0.0%) |
Employment Status by Educational Attainment in Millheim borough
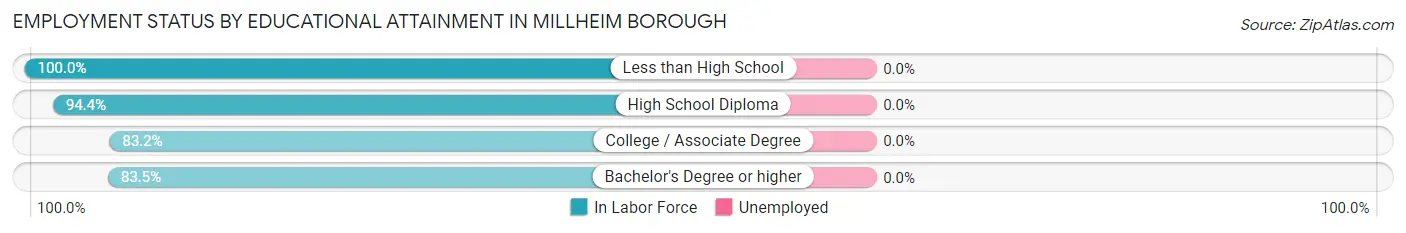
| Educational Attainment | In Labor Force | Unemployed |
| Less than High School | 8 (100.0%) | 0 (0.0%) |
| High School Diploma | 102 (94.4%) | 0 (0.0%) |
| College / Associate Degree | 114 (83.2%) | 0 (0.0%) |
| Bachelor's Degree or higher | 81 (83.5%) | 0 (0.0%) |
| Total | 305 (87.1%) | 0 (0.0%) |
Employment Occupations by Sex in Millheim borough
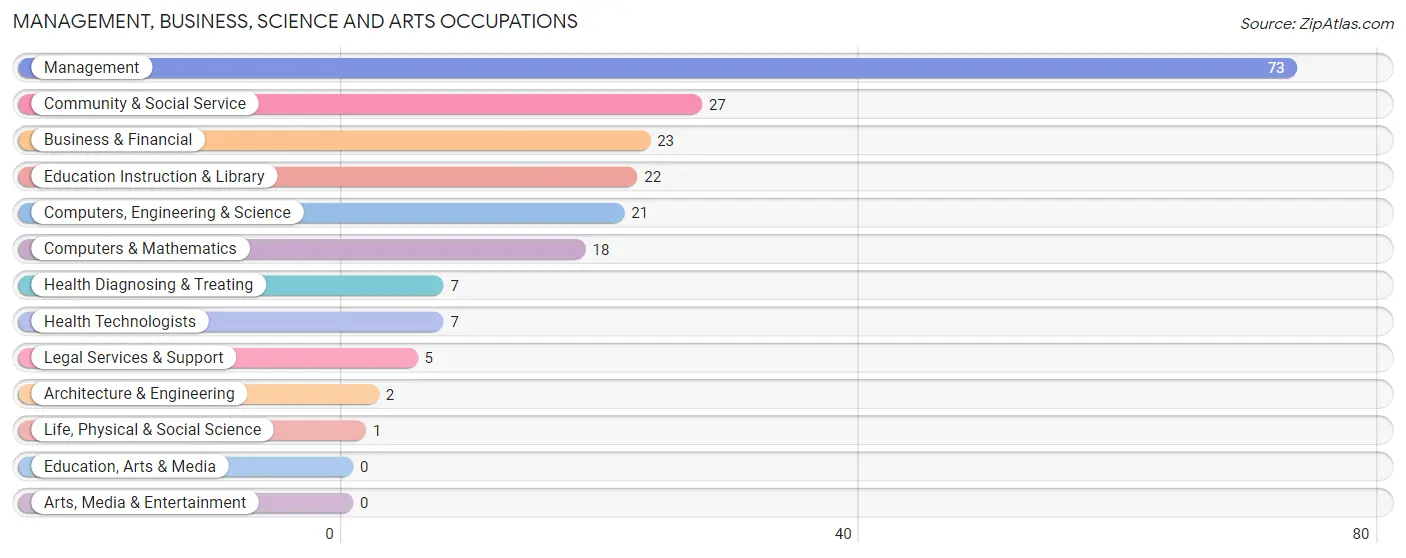
Management, Business, Science and Arts Occupations
The most common Management, Business, Science and Arts occupations in Millheim borough are Management (73 | 19.6%), Community & Social Service (27 | 7.3%), Business & Financial (23 | 6.2%), Education Instruction & Library (22 | 5.9%), and Computers, Engineering & Science (21 | 5.7%).
Management, Business, Science and Arts Occupations by Sex
Within the Management, Business, Science and Arts occupations in Millheim borough, the most male-oriented occupations are Computers & Mathematics (100.0%), Architecture & Engineering (100.0%), and Computers, Engineering & Science (95.2%), while the most female-oriented occupations are Business & Financial (100.0%), Life, Physical & Social Science (100.0%), and Legal Services & Support (100.0%).
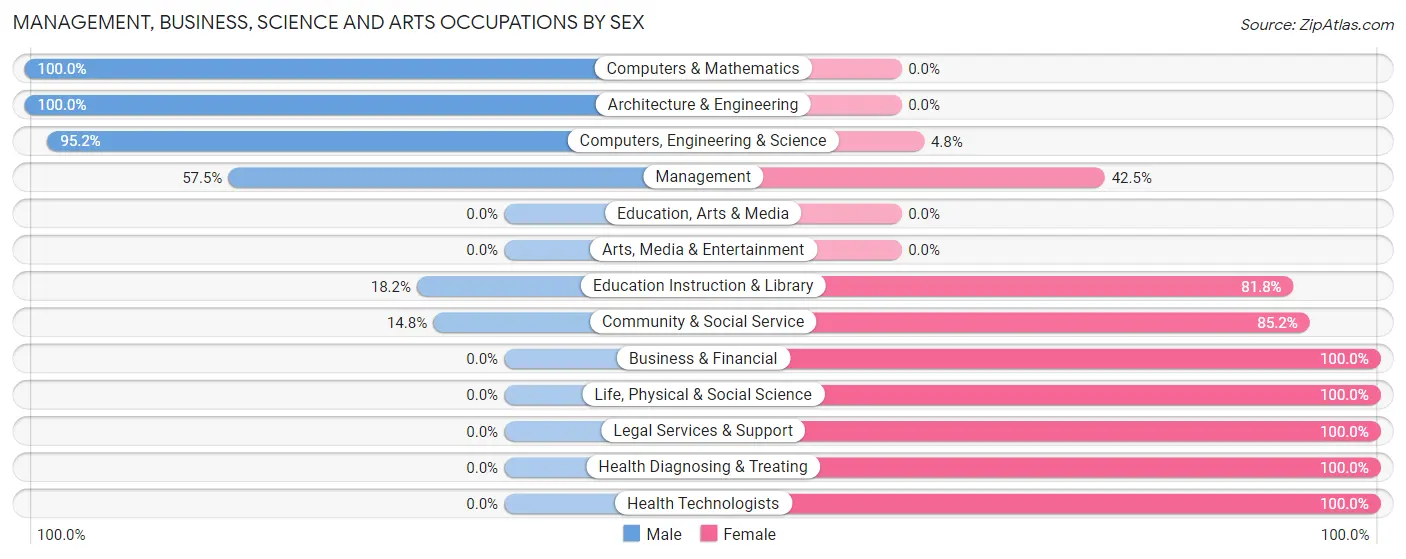
| Occupation | Male | Female |
| Management | 42 (57.5%) | 31 (42.5%) |
| Business & Financial | 0 (0.0%) | 23 (100.0%) |
| Computers, Engineering & Science | 20 (95.2%) | 1 (4.8%) |
| Computers & Mathematics | 18 (100.0%) | 0 (0.0%) |
| Architecture & Engineering | 2 (100.0%) | 0 (0.0%) |
| Life, Physical & Social Science | 0 (0.0%) | 1 (100.0%) |
| Community & Social Service | 4 (14.8%) | 23 (85.2%) |
| Education, Arts & Media | 0 (0.0%) | 0 (0.0%) |
| Legal Services & Support | 0 (0.0%) | 5 (100.0%) |
| Education Instruction & Library | 4 (18.2%) | 18 (81.8%) |
| Arts, Media & Entertainment | 0 (0.0%) | 0 (0.0%) |
| Health Diagnosing & Treating | 0 (0.0%) | 7 (100.0%) |
| Health Technologists | 0 (0.0%) | 7 (100.0%) |
| Total (Category) | 66 (43.7%) | 85 (56.3%) |
| Total (Overall) | 202 (54.3%) | 170 (45.7%) |
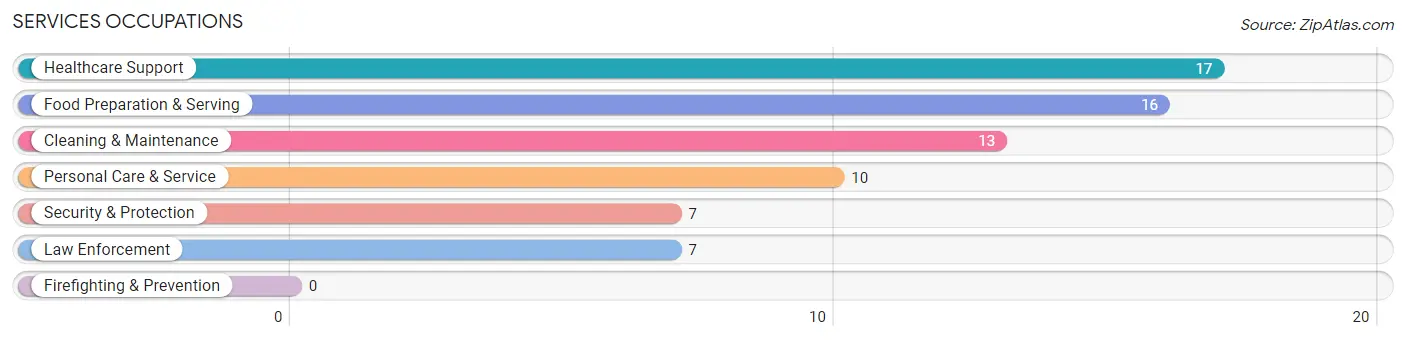
Services Occupations
The most common Services occupations in Millheim borough are Healthcare Support (17 | 4.6%), Food Preparation & Serving (16 | 4.3%), Cleaning & Maintenance (13 | 3.5%), Personal Care & Service (10 | 2.7%), and Security & Protection (7 | 1.9%).
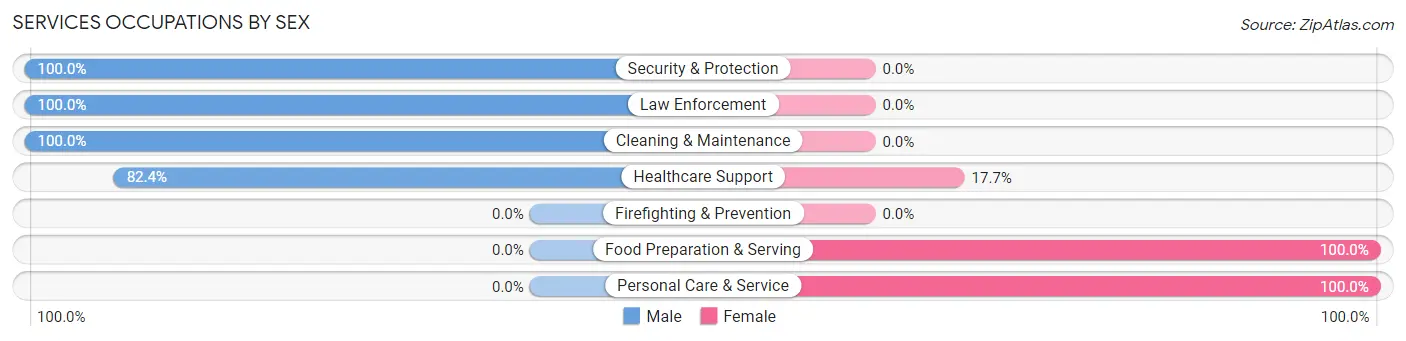
Services Occupations by Sex
Within the Services occupations in Millheim borough, the most male-oriented occupations are Security & Protection (100.0%), Law Enforcement (100.0%), and Cleaning & Maintenance (100.0%), while the most female-oriented occupations are Food Preparation & Serving (100.0%), Personal Care & Service (100.0%), and Healthcare Support (17.6%).
| Occupation | Male | Female |
| Healthcare Support | 14 (82.4%) | 3 (17.6%) |
| Security & Protection | 7 (100.0%) | 0 (0.0%) |
| Firefighting & Prevention | 0 (0.0%) | 0 (0.0%) |
| Law Enforcement | 7 (100.0%) | 0 (0.0%) |
| Food Preparation & Serving | 0 (0.0%) | 16 (100.0%) |
| Cleaning & Maintenance | 13 (100.0%) | 0 (0.0%) |
| Personal Care & Service | 0 (0.0%) | 10 (100.0%) |
| Total (Category) | 34 (54.0%) | 29 (46.0%) |
| Total (Overall) | 202 (54.3%) | 170 (45.7%) |
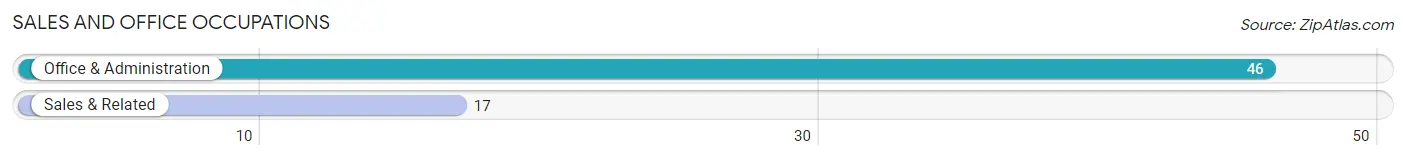
Sales and Office Occupations
The most common Sales and Office occupations in Millheim borough are Office & Administration (46 | 12.4%), and Sales & Related (17 | 4.6%).
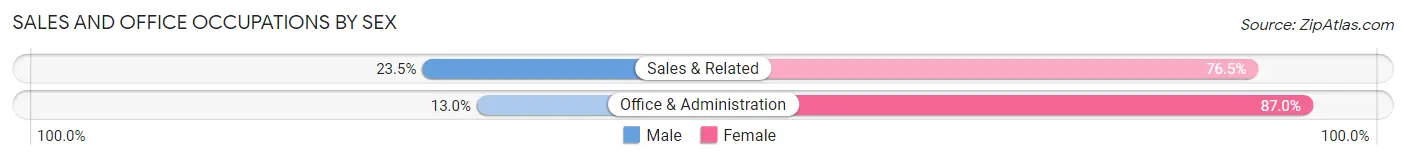
Sales and Office Occupations by Sex
| Occupation | Male | Female |
| Sales & Related | 4 (23.5%) | 13 (76.5%) |
| Office & Administration | 6 (13.0%) | 40 (87.0%) |
| Total (Category) | 10 (15.9%) | 53 (84.1%) |
| Total (Overall) | 202 (54.3%) | 170 (45.7%) |
Natural Resources, Construction and Maintenance Occupations
The most common Natural Resources, Construction and Maintenance occupations in Millheim borough are Construction & Extraction (24 | 6.5%), and Installation, Maintenance & Repair (11 | 3.0%).

Natural Resources, Construction and Maintenance Occupations by Sex
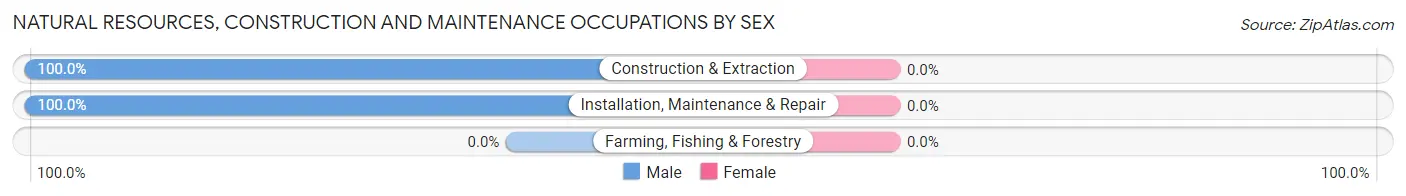
| Occupation | Male | Female |
| Farming, Fishing & Forestry | 0 (0.0%) | 0 (0.0%) |
| Construction & Extraction | 24 (100.0%) | 0 (0.0%) |
| Installation, Maintenance & Repair | 11 (100.0%) | 0 (0.0%) |
| Total (Category) | 35 (100.0%) | 0 (0.0%) |
| Total (Overall) | 202 (54.3%) | 170 (45.7%) |
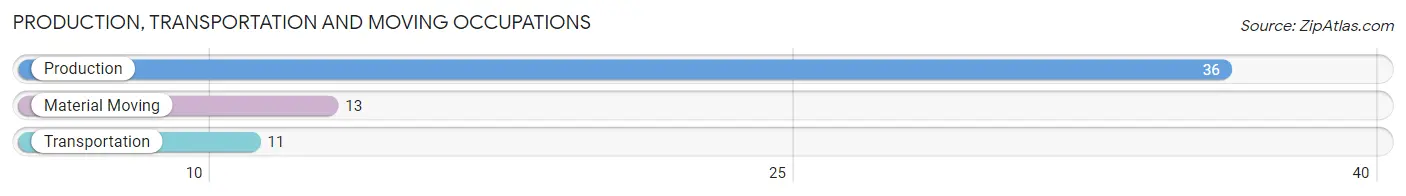
Production, Transportation and Moving Occupations
The most common Production, Transportation and Moving occupations in Millheim borough are Production (36 | 9.7%), Material Moving (13 | 3.5%), and Transportation (11 | 3.0%).
Production, Transportation and Moving Occupations by Sex
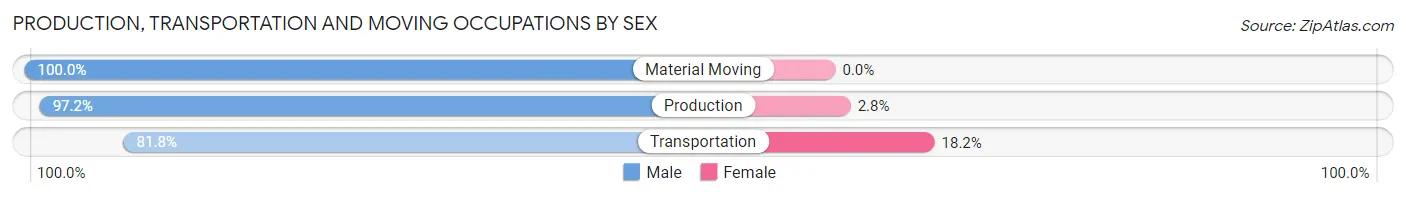
| Occupation | Male | Female |
| Production | 35 (97.2%) | 1 (2.8%) |
| Transportation | 9 (81.8%) | 2 (18.2%) |
| Material Moving | 13 (100.0%) | 0 (0.0%) |
| Total (Category) | 57 (95.0%) | 3 (5.0%) |
| Total (Overall) | 202 (54.3%) | 170 (45.7%) |
Employment Industries by Sex in Millheim borough
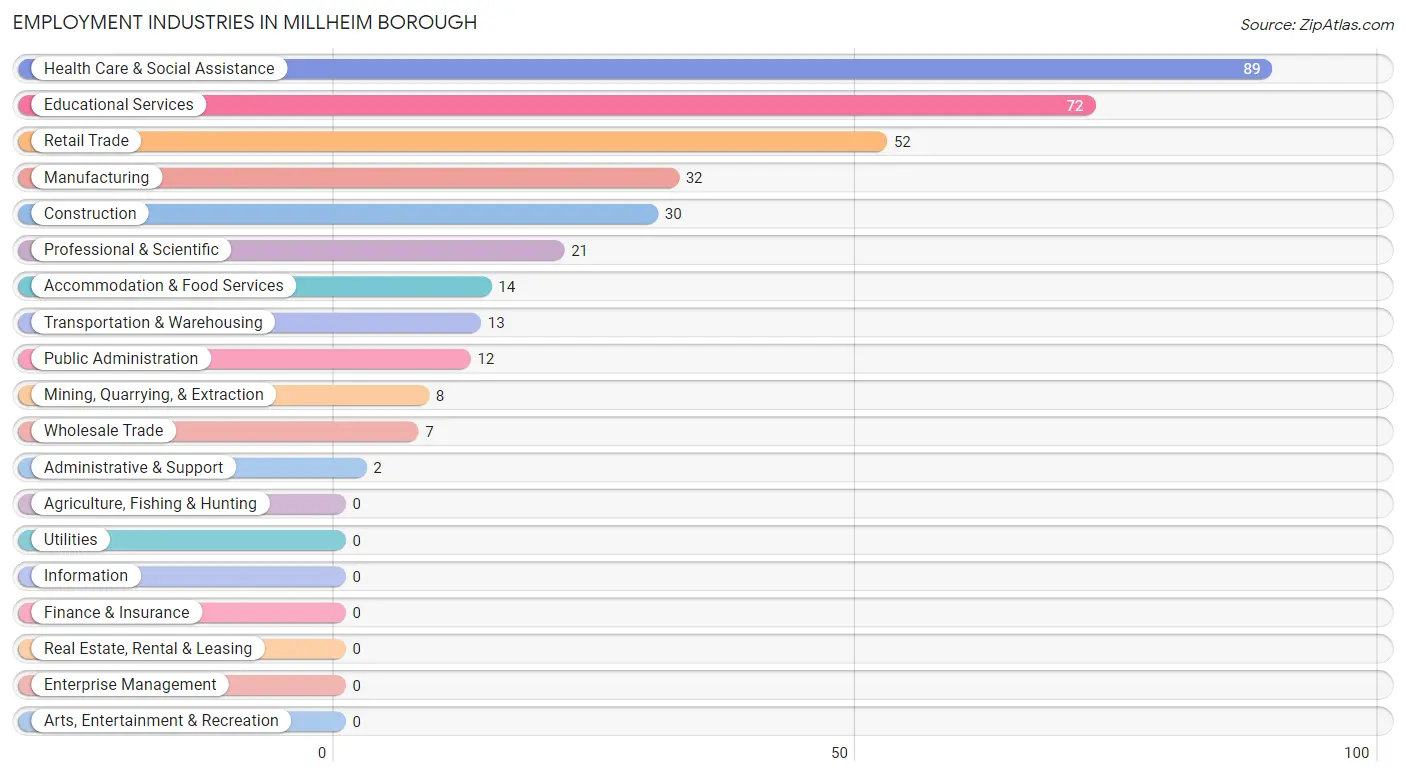
Employment Industries in Millheim borough
The major employment industries in Millheim borough include Health Care & Social Assistance (89 | 23.9%), Educational Services (72 | 19.4%), Retail Trade (52 | 14.0%), Manufacturing (32 | 8.6%), and Construction (30 | 8.1%).
Employment Industries by Sex in Millheim borough
The Millheim borough industries that see more men than women are Mining, Quarrying, & Extraction (100.0%), Construction (100.0%), and Administrative & Support (100.0%), whereas the industries that tend to have a higher number of women are Wholesale Trade (100.0%), Accommodation & Food Services (100.0%), and Educational Services (73.6%).
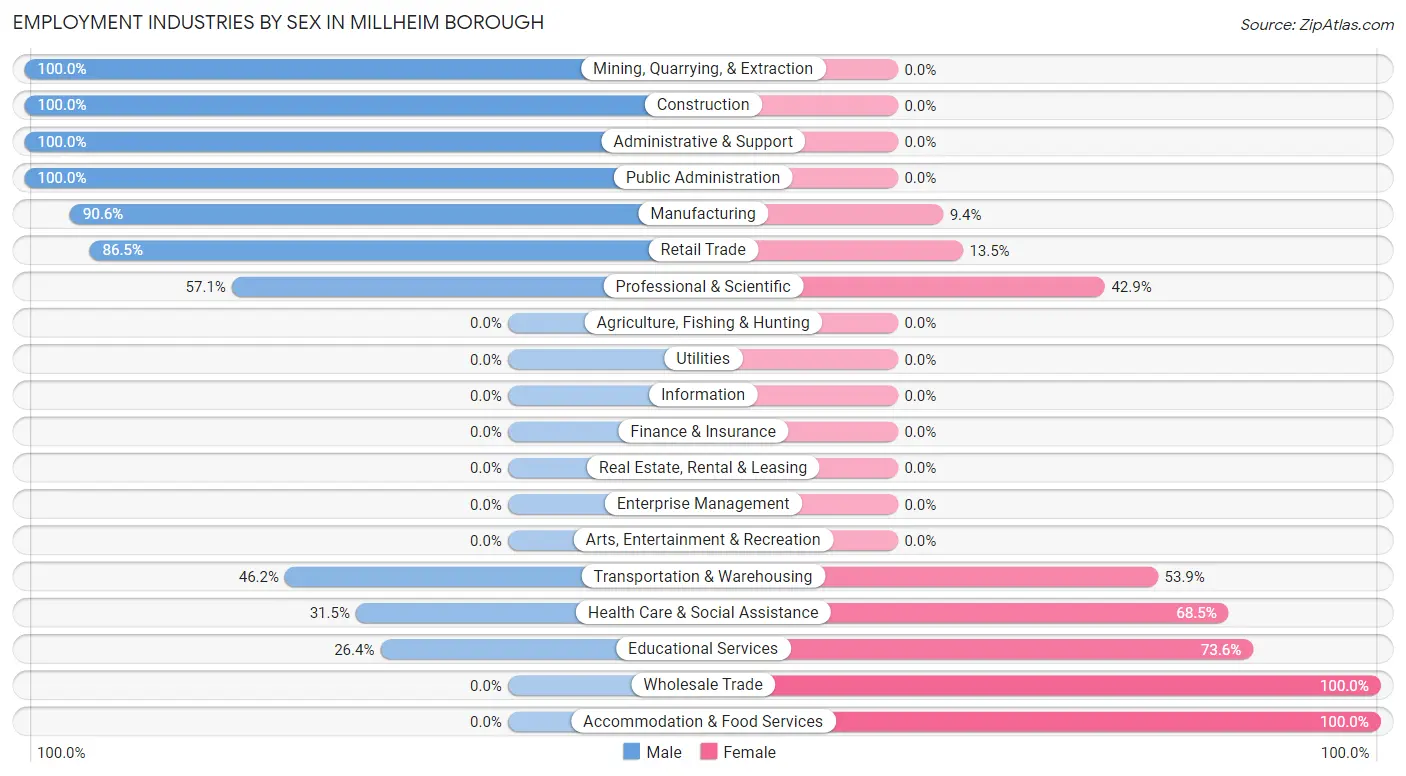
| Industry | Male | Female |
| Agriculture, Fishing & Hunting | 0 (0.0%) | 0 (0.0%) |
| Mining, Quarrying, & Extraction | 8 (100.0%) | 0 (0.0%) |
| Construction | 30 (100.0%) | 0 (0.0%) |
| Manufacturing | 29 (90.6%) | 3 (9.4%) |
| Wholesale Trade | 0 (0.0%) | 7 (100.0%) |
| Retail Trade | 45 (86.5%) | 7 (13.5%) |
| Transportation & Warehousing | 6 (46.2%) | 7 (53.8%) |
| Utilities | 0 (0.0%) | 0 (0.0%) |
| Information | 0 (0.0%) | 0 (0.0%) |
| Finance & Insurance | 0 (0.0%) | 0 (0.0%) |
| Real Estate, Rental & Leasing | 0 (0.0%) | 0 (0.0%) |
| Professional & Scientific | 12 (57.1%) | 9 (42.9%) |
| Enterprise Management | 0 (0.0%) | 0 (0.0%) |
| Administrative & Support | 2 (100.0%) | 0 (0.0%) |
| Educational Services | 19 (26.4%) | 53 (73.6%) |
| Health Care & Social Assistance | 28 (31.5%) | 61 (68.5%) |
| Arts, Entertainment & Recreation | 0 (0.0%) | 0 (0.0%) |
| Accommodation & Food Services | 0 (0.0%) | 14 (100.0%) |
| Public Administration | 12 (100.0%) | 0 (0.0%) |
| Total | 202 (54.3%) | 170 (45.7%) |
Education in Millheim borough
School Enrollment in Millheim borough
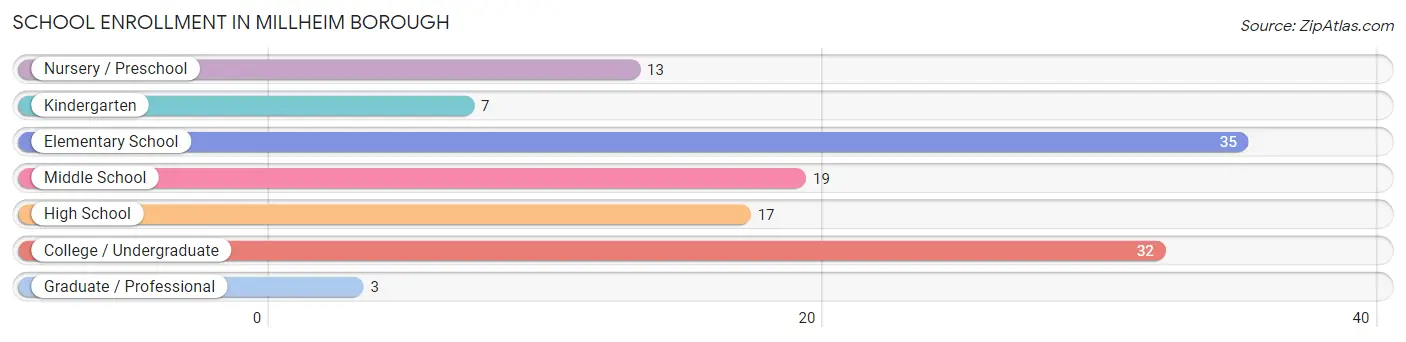
The most common levels of schooling among the 126 students in Millheim borough are elementary school (35 | 27.8%), college / undergraduate (32 | 25.4%), and middle school (19 | 15.1%).
| School Level | # Students | % Students |
| Nursery / Preschool | 13 | 10.3% |
| Kindergarten | 7 | 5.6% |
| Elementary School | 35 | 27.8% |
| Middle School | 19 | 15.1% |
| High School | 17 | 13.5% |
| College / Undergraduate | 32 | 25.4% |
| Graduate / Professional | 3 | 2.4% |
| Total | 126 | 100.0% |
School Enrollment by Age by Funding Source in Millheim borough
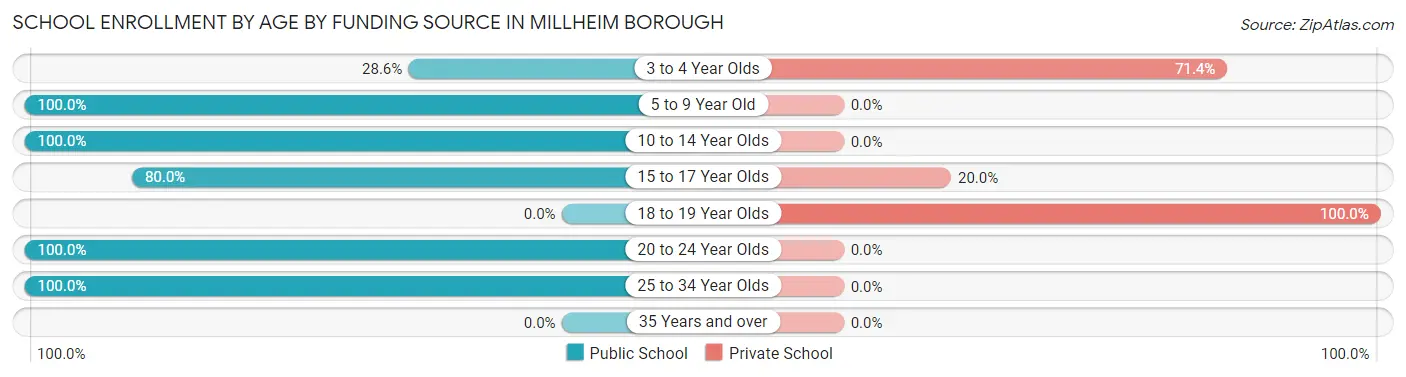
Out of a total of 126 students who are enrolled in schools in Millheim borough, 10 (7.9%) attend a private institution, while the remaining 116 (92.1%) are enrolled in public schools. The age group of 18 to 19 year olds has the highest likelihood of being enrolled in private schools, with 2 (100.0% in the age bracket) enrolled. Conversely, the age group of 5 to 9 year old has the lowest likelihood of being enrolled in a private school, with 48 (100.0% in the age bracket) attending a public institution.
| Age Bracket | Public School | Private School |
| 3 to 4 Year Olds | 2 (28.6%) | 5 (71.4%) |
| 5 to 9 Year Old | 48 (100.0%) | 0 (0.0%) |
| 10 to 14 Year Olds | 19 (100.0%) | 0 (0.0%) |
| 15 to 17 Year Olds | 12 (80.0%) | 3 (20.0%) |
| 18 to 19 Year Olds | 0 (0.0%) | 2 (100.0%) |
| 20 to 24 Year Olds | 16 (100.0%) | 0 (0.0%) |
| 25 to 34 Year Olds | 19 (100.0%) | 0 (0.0%) |
| 35 Years and over | 0 (0.0%) | 0 (0.0%) |
| Total | 116 (92.1%) | 10 (7.9%) |
Educational Attainment by Field of Study in Millheim borough
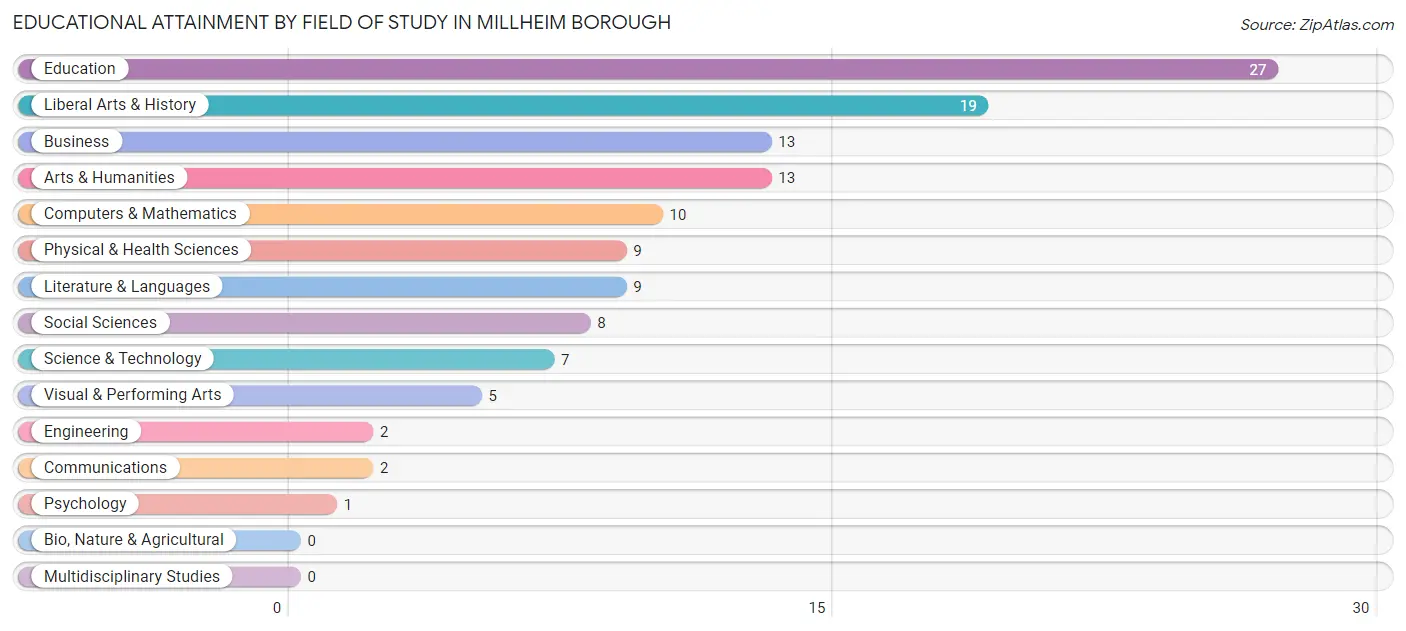
Education (27 | 21.6%), liberal arts & history (19 | 15.2%), business (13 | 10.4%), arts & humanities (13 | 10.4%), and computers & mathematics (10 | 8.0%) are the most common fields of study among 125 individuals in Millheim borough who have obtained a bachelor's degree or higher.
| Field of Study | # Graduates | % Graduates |
| Computers & Mathematics | 10 | 8.0% |
| Bio, Nature & Agricultural | 0 | 0.0% |
| Physical & Health Sciences | 9 | 7.2% |
| Psychology | 1 | 0.8% |
| Social Sciences | 8 | 6.4% |
| Engineering | 2 | 1.6% |
| Multidisciplinary Studies | 0 | 0.0% |
| Science & Technology | 7 | 5.6% |
| Business | 13 | 10.4% |
| Education | 27 | 21.6% |
| Literature & Languages | 9 | 7.2% |
| Liberal Arts & History | 19 | 15.2% |
| Visual & Performing Arts | 5 | 4.0% |
| Communications | 2 | 1.6% |
| Arts & Humanities | 13 | 10.4% |
| Total | 125 | 100.0% |
Transportation & Commute in Millheim borough
Vehicle Availability by Sex in Millheim borough
The most prevalent vehicle ownership categories in Millheim borough are males with 2 vehicles (86, accounting for 42.6%) and females with 2 vehicles (78, making up 50.6%).
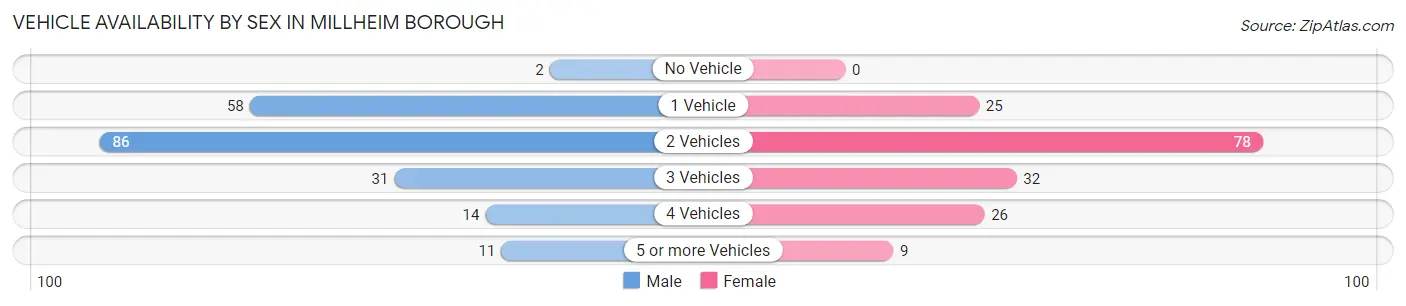
| Vehicles Available | Male | Female |
| No Vehicle | 2 (1.0%) | 0 (0.0%) |
| 1 Vehicle | 58 (28.7%) | 25 (14.7%) |
| 2 Vehicles | 86 (42.6%) | 78 (45.9%) |
| 3 Vehicles | 31 (15.3%) | 32 (18.8%) |
| 4 Vehicles | 14 (6.9%) | 26 (15.3%) |
| 5 or more Vehicles | 11 (5.4%) | 9 (5.3%) |
| Total | 202 (100.0%) | 170 (100.0%) |
Commute Time in Millheim borough
The most frequently occuring commute durations in Millheim borough are 30 to 34 minutes (116 commuters, 32.7%), 45 to 59 minutes (68 commuters, 19.2%), and 35 to 39 minutes (65 commuters, 18.3%).
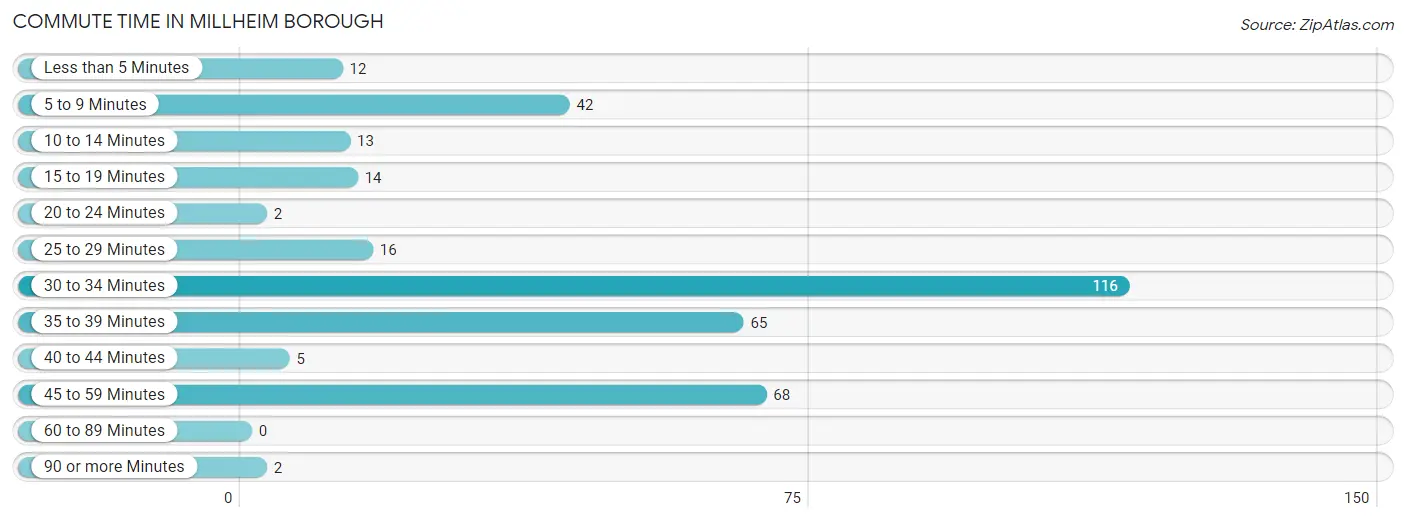
| Commute Time | # Commuters | % Commuters |
| Less than 5 Minutes | 12 | 3.4% |
| 5 to 9 Minutes | 42 | 11.8% |
| 10 to 14 Minutes | 13 | 3.7% |
| 15 to 19 Minutes | 14 | 3.9% |
| 20 to 24 Minutes | 2 | 0.6% |
| 25 to 29 Minutes | 16 | 4.5% |
| 30 to 34 Minutes | 116 | 32.7% |
| 35 to 39 Minutes | 65 | 18.3% |
| 40 to 44 Minutes | 5 | 1.4% |
| 45 to 59 Minutes | 68 | 19.2% |
| 60 to 89 Minutes | 0 | 0.0% |
| 90 or more Minutes | 2 | 0.6% |
Commute Time by Sex in Millheim borough
The most common commute times in Millheim borough are 30 to 34 minutes (50 commuters, 25.6%) for males and 30 to 34 minutes (66 commuters, 41.2%) for females.
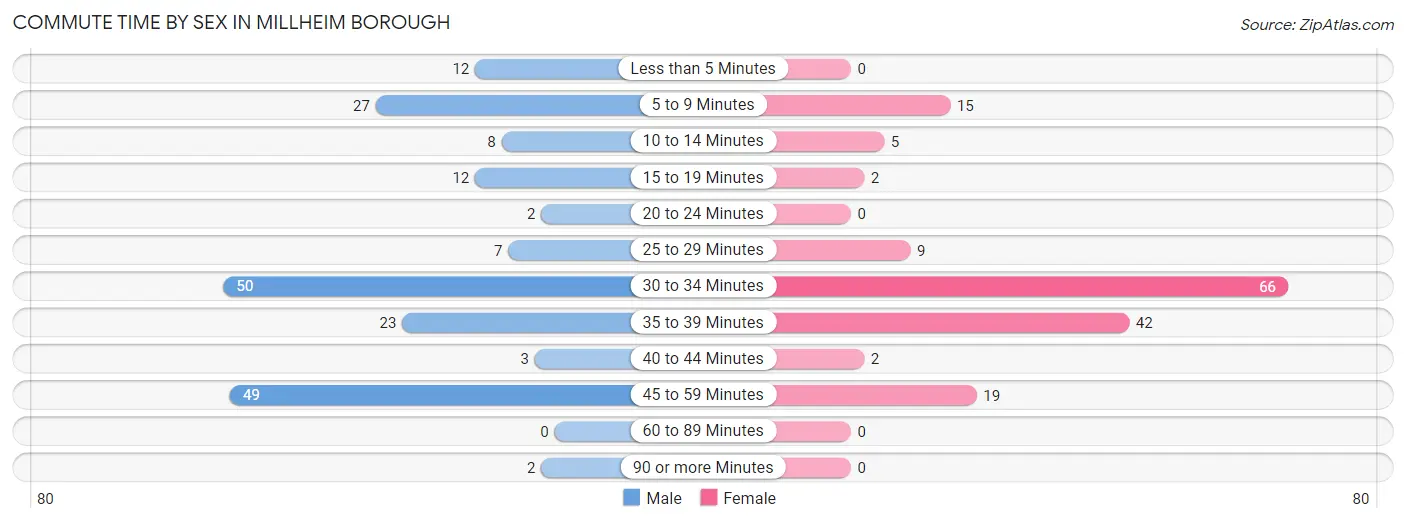
| Commute Time | Male | Female |
| Less than 5 Minutes | 12 (6.1%) | 0 (0.0%) |
| 5 to 9 Minutes | 27 (13.9%) | 15 (9.4%) |
| 10 to 14 Minutes | 8 (4.1%) | 5 (3.1%) |
| 15 to 19 Minutes | 12 (6.1%) | 2 (1.3%) |
| 20 to 24 Minutes | 2 (1.0%) | 0 (0.0%) |
| 25 to 29 Minutes | 7 (3.6%) | 9 (5.6%) |
| 30 to 34 Minutes | 50 (25.6%) | 66 (41.2%) |
| 35 to 39 Minutes | 23 (11.8%) | 42 (26.3%) |
| 40 to 44 Minutes | 3 (1.5%) | 2 (1.3%) |
| 45 to 59 Minutes | 49 (25.1%) | 19 (11.9%) |
| 60 to 89 Minutes | 0 (0.0%) | 0 (0.0%) |
| 90 or more Minutes | 2 (1.0%) | 0 (0.0%) |
Time of Departure to Work by Sex in Millheim borough
The most frequent times of departure to work in Millheim borough are 6:30 AM to 6:59 AM (47, 24.1%) for males and 6:00 AM to 6:29 AM (50, 31.2%) for females.
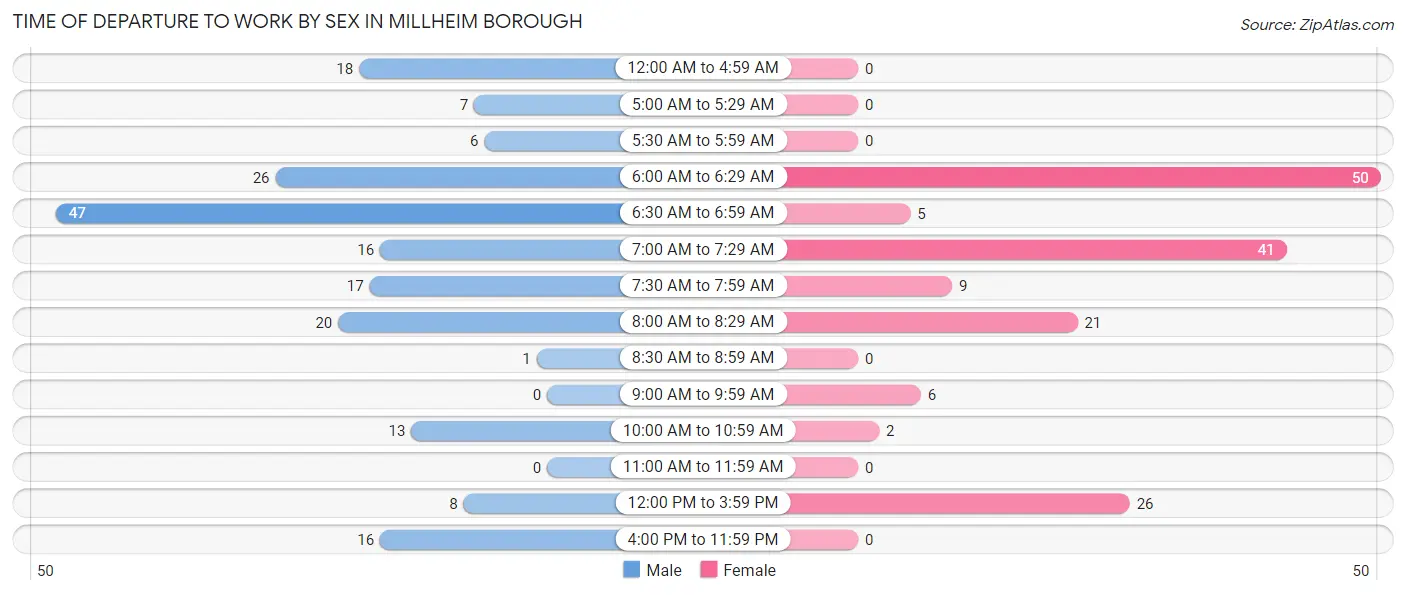
| Time of Departure | Male | Female |
| 12:00 AM to 4:59 AM | 18 (9.2%) | 0 (0.0%) |
| 5:00 AM to 5:29 AM | 7 (3.6%) | 0 (0.0%) |
| 5:30 AM to 5:59 AM | 6 (3.1%) | 0 (0.0%) |
| 6:00 AM to 6:29 AM | 26 (13.3%) | 50 (31.2%) |
| 6:30 AM to 6:59 AM | 47 (24.1%) | 5 (3.1%) |
| 7:00 AM to 7:29 AM | 16 (8.2%) | 41 (25.6%) |
| 7:30 AM to 7:59 AM | 17 (8.7%) | 9 (5.6%) |
| 8:00 AM to 8:29 AM | 20 (10.3%) | 21 (13.1%) |
| 8:30 AM to 8:59 AM | 1 (0.5%) | 0 (0.0%) |
| 9:00 AM to 9:59 AM | 0 (0.0%) | 6 (3.7%) |
| 10:00 AM to 10:59 AM | 13 (6.7%) | 2 (1.3%) |
| 11:00 AM to 11:59 AM | 0 (0.0%) | 0 (0.0%) |
| 12:00 PM to 3:59 PM | 8 (4.1%) | 26 (16.3%) |
| 4:00 PM to 11:59 PM | 16 (8.2%) | 0 (0.0%) |
| Total | 195 (100.0%) | 160 (100.0%) |
Housing Occupancy in Millheim borough
Occupancy by Ownership in Millheim borough
Of the total 314 dwellings in Millheim borough, owner-occupied units account for 257 (81.9%), while renter-occupied units make up 57 (18.1%).
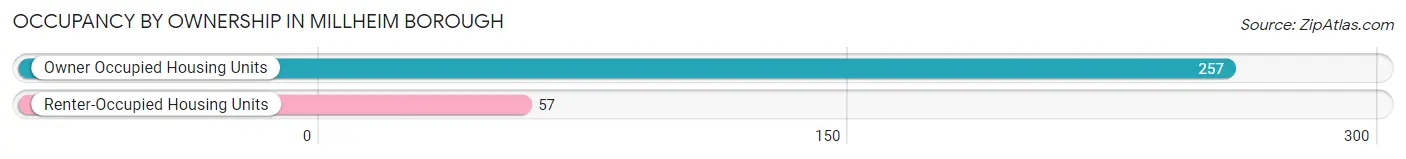
| Occupancy | # Housing Units | % Housing Units |
| Owner Occupied Housing Units | 257 | 81.9% |
| Renter-Occupied Housing Units | 57 | 18.1% |
| Total Occupied Housing Units | 314 | 100.0% |
Occupancy by Household Size in Millheim borough
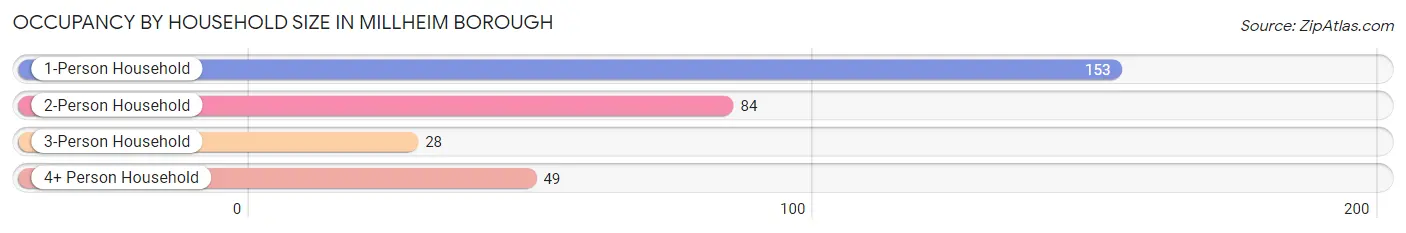
| Household Size | # Housing Units | % Housing Units |
| 1-Person Household | 153 | 48.7% |
| 2-Person Household | 84 | 26.8% |
| 3-Person Household | 28 | 8.9% |
| 4+ Person Household | 49 | 15.6% |
| Total Housing Units | 314 | 100.0% |
Occupancy by Ownership by Household Size in Millheim borough
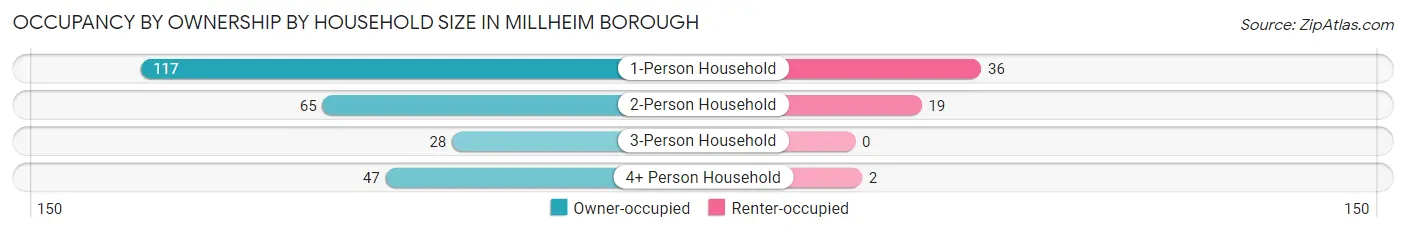
| Household Size | Owner-occupied | Renter-occupied |
| 1-Person Household | 117 (76.5%) | 36 (23.5%) |
| 2-Person Household | 65 (77.4%) | 19 (22.6%) |
| 3-Person Household | 28 (100.0%) | 0 (0.0%) |
| 4+ Person Household | 47 (95.9%) | 2 (4.1%) |
| Total Housing Units | 257 (81.9%) | 57 (18.1%) |
Occupancy by Educational Attainment in Millheim borough
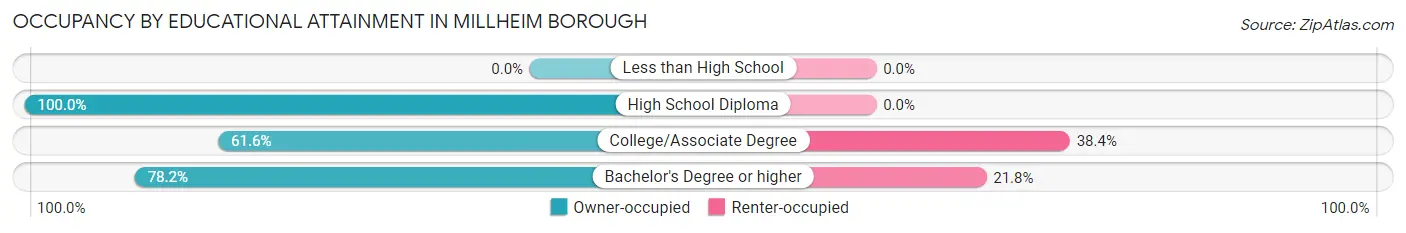
| Household Size | Owner-occupied | Renter-occupied |
| Less than High School | 0 (0.0%) | 0 (0.0%) |
| High School Diploma | 128 (100.0%) | 0 (0.0%) |
| College/Associate Degree | 61 (61.6%) | 38 (38.4%) |
| Bachelor's Degree or higher | 68 (78.2%) | 19 (21.8%) |
Occupancy by Age of Householder in Millheim borough
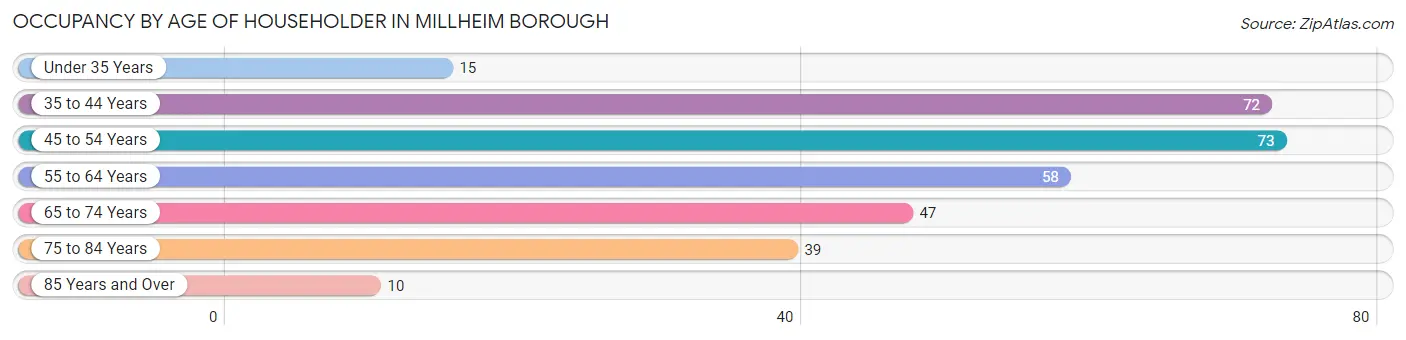
| Age Bracket | # Households | % Households |
| Under 35 Years | 15 | 4.8% |
| 35 to 44 Years | 72 | 22.9% |
| 45 to 54 Years | 73 | 23.3% |
| 55 to 64 Years | 58 | 18.5% |
| 65 to 74 Years | 47 | 15.0% |
| 75 to 84 Years | 39 | 12.4% |
| 85 Years and Over | 10 | 3.2% |
| Total | 314 | 100.0% |
Housing Finances in Millheim borough
Median Income by Occupancy in Millheim borough
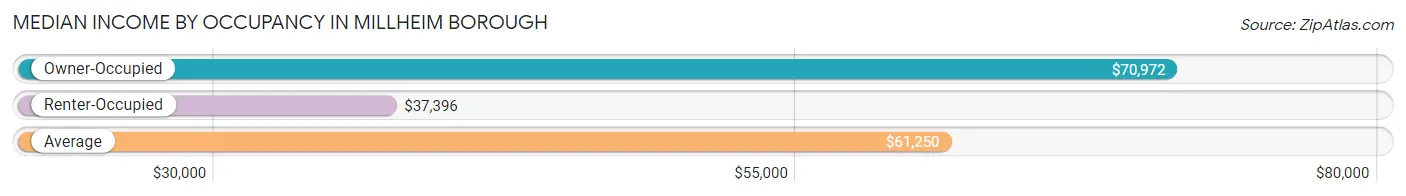
| Occupancy Type | # Households | Median Income |
| Owner-Occupied | 257 (81.9%) | $70,972 |
| Renter-Occupied | 57 (18.1%) | $37,396 |
| Average | 314 (100.0%) | $61,250 |
Occupancy by Householder Income Bracket in Millheim borough
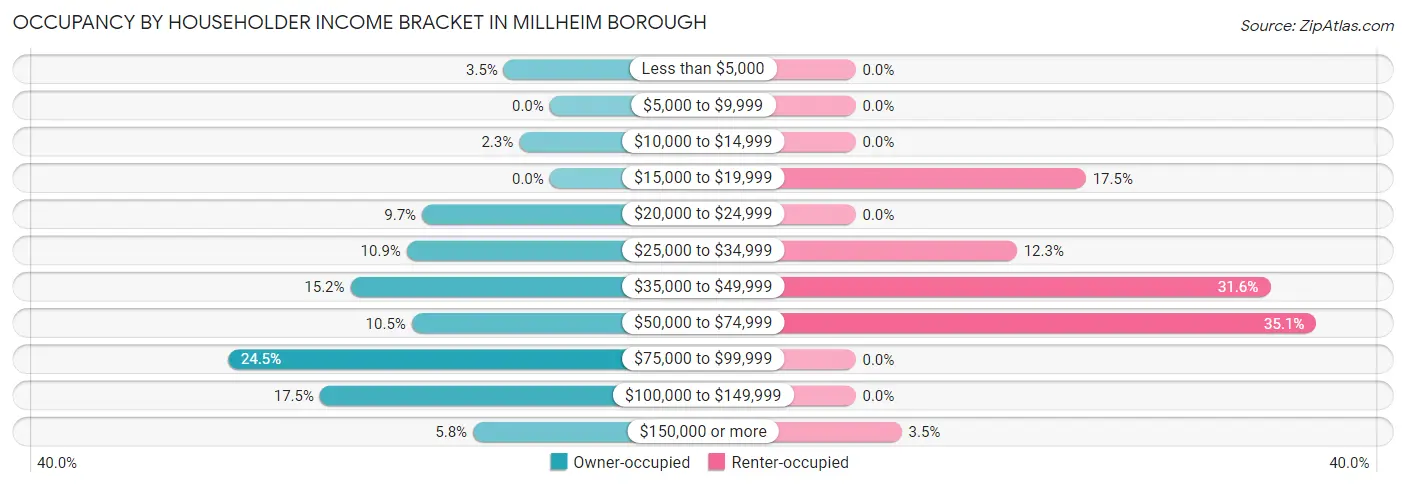
| Income Bracket | Owner-occupied | Renter-occupied |
| Less than $5,000 | 9 (3.5%) | 0 (0.0%) |
| $5,000 to $9,999 | 0 (0.0%) | 0 (0.0%) |
| $10,000 to $14,999 | 6 (2.3%) | 0 (0.0%) |
| $15,000 to $19,999 | 0 (0.0%) | 10 (17.5%) |
| $20,000 to $24,999 | 25 (9.7%) | 0 (0.0%) |
| $25,000 to $34,999 | 28 (10.9%) | 7 (12.3%) |
| $35,000 to $49,999 | 39 (15.2%) | 18 (31.6%) |
| $50,000 to $74,999 | 27 (10.5%) | 20 (35.1%) |
| $75,000 to $99,999 | 63 (24.5%) | 0 (0.0%) |
| $100,000 to $149,999 | 45 (17.5%) | 0 (0.0%) |
| $150,000 or more | 15 (5.8%) | 2 (3.5%) |
| Total | 257 (100.0%) | 57 (100.0%) |
Monthly Housing Cost Tiers in Millheim borough
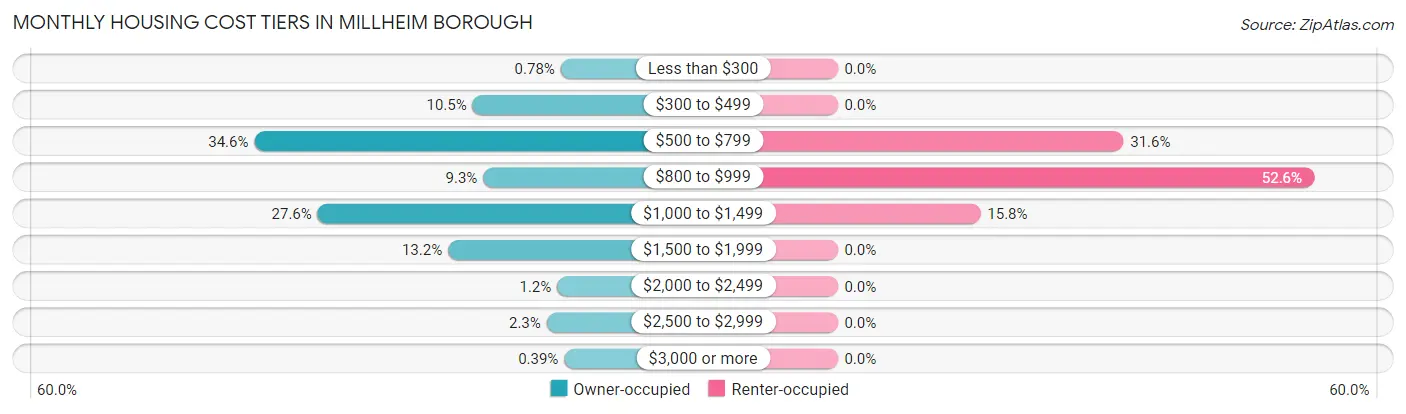
| Monthly Cost | Owner-occupied | Renter-occupied |
| Less than $300 | 2 (0.8%) | 0 (0.0%) |
| $300 to $499 | 27 (10.5%) | 0 (0.0%) |
| $500 to $799 | 89 (34.6%) | 18 (31.6%) |
| $800 to $999 | 24 (9.3%) | 30 (52.6%) |
| $1,000 to $1,499 | 71 (27.6%) | 9 (15.8%) |
| $1,500 to $1,999 | 34 (13.2%) | 0 (0.0%) |
| $2,000 to $2,499 | 3 (1.2%) | 0 (0.0%) |
| $2,500 to $2,999 | 6 (2.3%) | 0 (0.0%) |
| $3,000 or more | 1 (0.4%) | 0 (0.0%) |
| Total | 257 (100.0%) | 57 (100.0%) |
Physical Housing Characteristics in Millheim borough
Housing Structures in Millheim borough
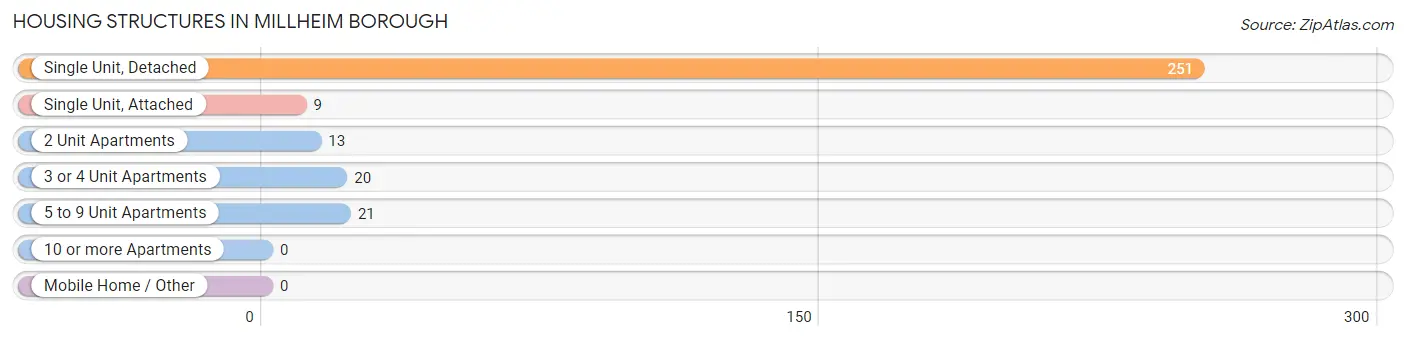
| Structure Type | # Housing Units | % Housing Units |
| Single Unit, Detached | 251 | 79.9% |
| Single Unit, Attached | 9 | 2.9% |
| 2 Unit Apartments | 13 | 4.1% |
| 3 or 4 Unit Apartments | 20 | 6.4% |
| 5 to 9 Unit Apartments | 21 | 6.7% |
| 10 or more Apartments | 0 | 0.0% |
| Mobile Home / Other | 0 | 0.0% |
| Total | 314 | 100.0% |
Housing Structures by Occupancy in Millheim borough
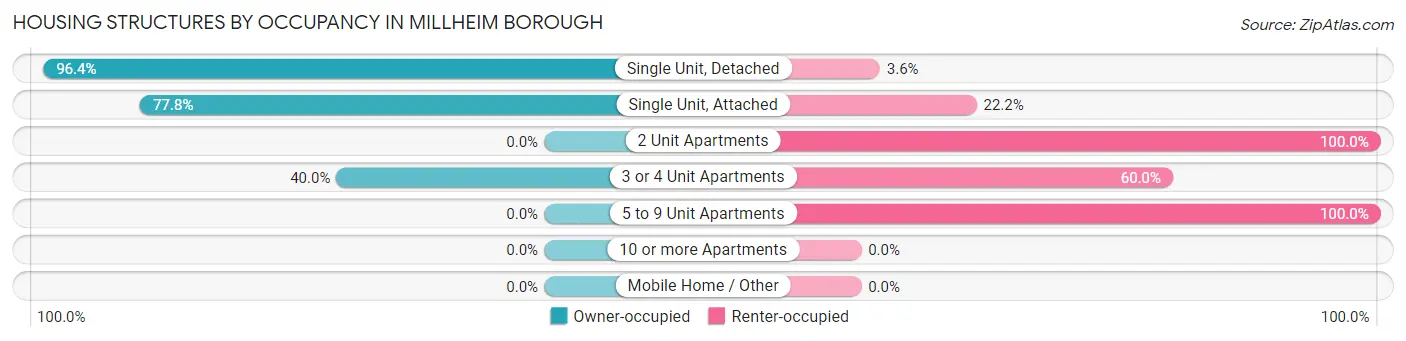
| Structure Type | Owner-occupied | Renter-occupied |
| Single Unit, Detached | 242 (96.4%) | 9 (3.6%) |
| Single Unit, Attached | 7 (77.8%) | 2 (22.2%) |
| 2 Unit Apartments | 0 (0.0%) | 13 (100.0%) |
| 3 or 4 Unit Apartments | 8 (40.0%) | 12 (60.0%) |
| 5 to 9 Unit Apartments | 0 (0.0%) | 21 (100.0%) |
| 10 or more Apartments | 0 (0.0%) | 0 (0.0%) |
| Mobile Home / Other | 0 (0.0%) | 0 (0.0%) |
| Total | 257 (81.9%) | 57 (18.1%) |
Housing Structures by Number of Rooms in Millheim borough
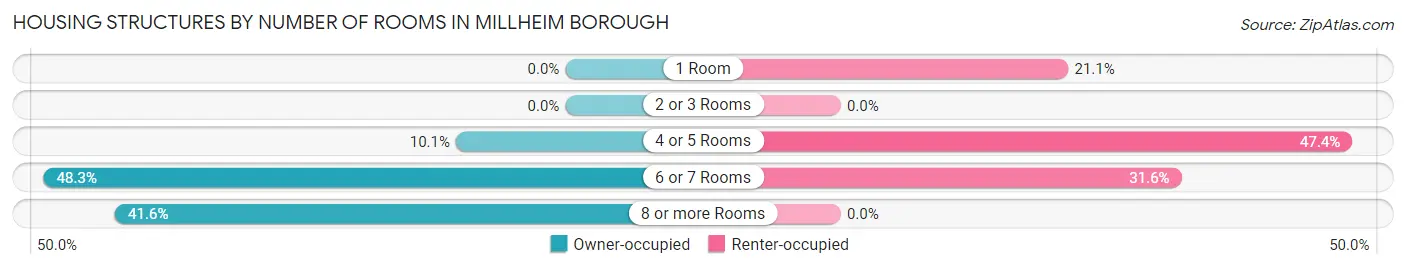
| Number of Rooms | Owner-occupied | Renter-occupied |
| 1 Room | 0 (0.0%) | 12 (21.0%) |
| 2 or 3 Rooms | 0 (0.0%) | 0 (0.0%) |
| 4 or 5 Rooms | 26 (10.1%) | 27 (47.4%) |
| 6 or 7 Rooms | 124 (48.2%) | 18 (31.6%) |
| 8 or more Rooms | 107 (41.6%) | 0 (0.0%) |
| Total | 257 (100.0%) | 57 (100.0%) |
Housing Structure by Heating Type in Millheim borough
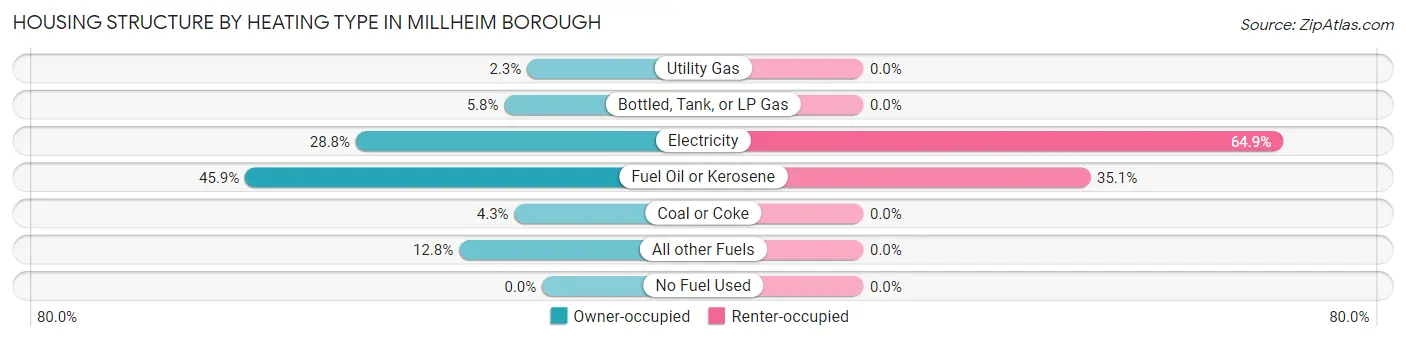
| Heating Type | Owner-occupied | Renter-occupied |
| Utility Gas | 6 (2.3%) | 0 (0.0%) |
| Bottled, Tank, or LP Gas | 15 (5.8%) | 0 (0.0%) |
| Electricity | 74 (28.8%) | 37 (64.9%) |
| Fuel Oil or Kerosene | 118 (45.9%) | 20 (35.1%) |
| Coal or Coke | 11 (4.3%) | 0 (0.0%) |
| All other Fuels | 33 (12.8%) | 0 (0.0%) |
| No Fuel Used | 0 (0.0%) | 0 (0.0%) |
| Total | 257 (100.0%) | 57 (100.0%) |
Household Vehicle Usage in Millheim borough
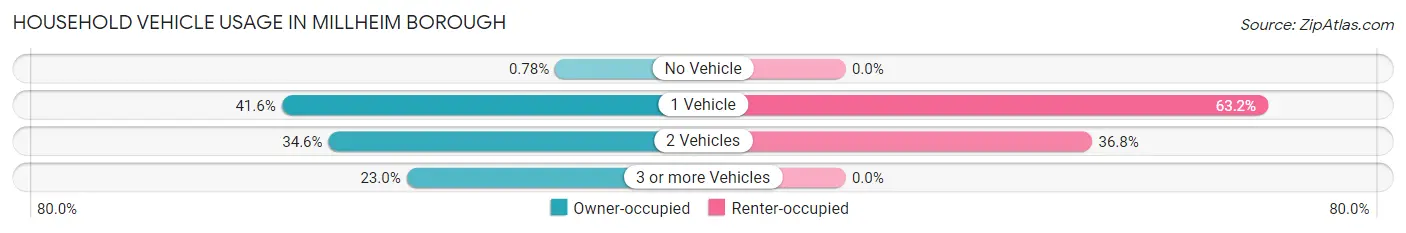
| Vehicles per Household | Owner-occupied | Renter-occupied |
| No Vehicle | 2 (0.8%) | 0 (0.0%) |
| 1 Vehicle | 107 (41.6%) | 36 (63.2%) |
| 2 Vehicles | 89 (34.6%) | 21 (36.8%) |
| 3 or more Vehicles | 59 (23.0%) | 0 (0.0%) |
| Total | 257 (100.0%) | 57 (100.0%) |
Real Estate & Mortgages in Millheim borough
Real Estate and Mortgage Overview in Millheim borough
| Characteristic | Without Mortgage | With Mortgage |
| Housing Units | 138 | 119 |
| Median Property Value | $207,000 | $216,100 |
| Median Household Income | $70,833 | $3 |
| Monthly Housing Costs | $644 | $1 |
| Real Estate Taxes | $2,339 | $11 |
Property Value by Mortgage Status in Millheim borough
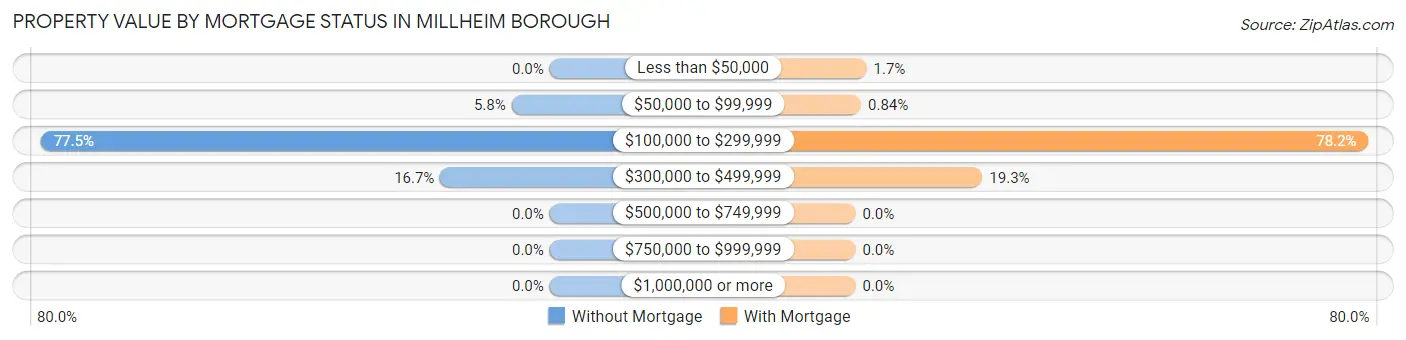
| Property Value | Without Mortgage | With Mortgage |
| Less than $50,000 | 0 (0.0%) | 2 (1.7%) |
| $50,000 to $99,999 | 8 (5.8%) | 1 (0.8%) |
| $100,000 to $299,999 | 107 (77.5%) | 93 (78.1%) |
| $300,000 to $499,999 | 23 (16.7%) | 23 (19.3%) |
| $500,000 to $749,999 | 0 (0.0%) | 0 (0.0%) |
| $750,000 to $999,999 | 0 (0.0%) | 0 (0.0%) |
| $1,000,000 or more | 0 (0.0%) | 0 (0.0%) |
| Total | 138 (100.0%) | 119 (100.0%) |
Household Income by Mortgage Status in Millheim borough
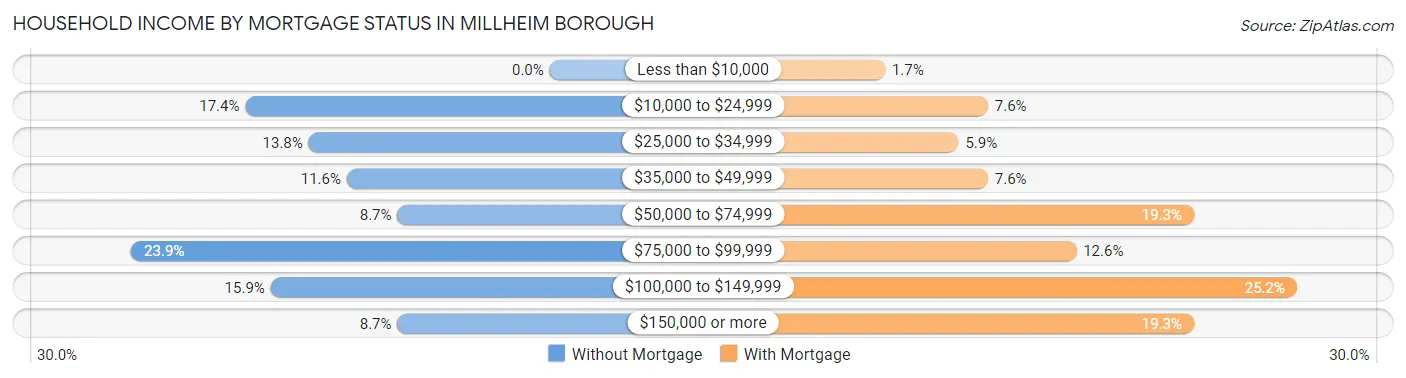
| Household Income | Without Mortgage | With Mortgage |
| Less than $10,000 | 0 (0.0%) | 2 (1.7%) |
| $10,000 to $24,999 | 24 (17.4%) | 9 (7.6%) |
| $25,000 to $34,999 | 19 (13.8%) | 7 (5.9%) |
| $35,000 to $49,999 | 16 (11.6%) | 9 (7.6%) |
| $50,000 to $74,999 | 12 (8.7%) | 23 (19.3%) |
| $75,000 to $99,999 | 33 (23.9%) | 15 (12.6%) |
| $100,000 to $149,999 | 22 (15.9%) | 30 (25.2%) |
| $150,000 or more | 12 (8.7%) | 23 (19.3%) |
| Total | 138 (100.0%) | 119 (100.0%) |
Property Value to Household Income Ratio in Millheim borough
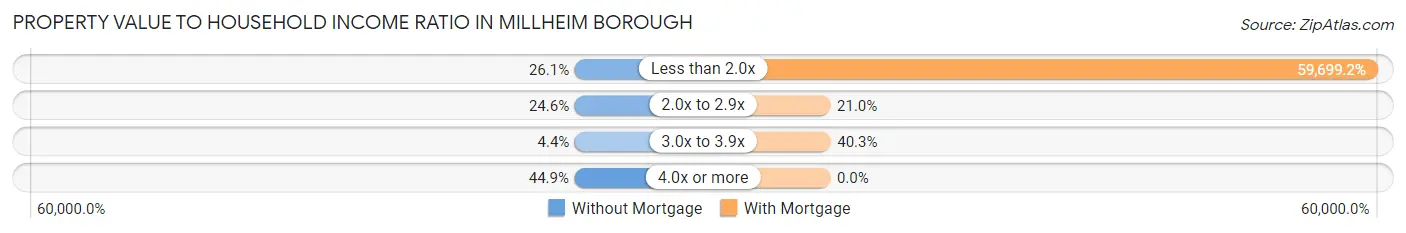
| Value-to-Income Ratio | Without Mortgage | With Mortgage |
| Less than 2.0x | 36 (26.1%) | 71,042 (59,699.2%) |
| 2.0x to 2.9x | 34 (24.6%) | 25 (21.0%) |
| 3.0x to 3.9x | 6 (4.3%) | 48 (40.3%) |
| 4.0x or more | 62 (44.9%) | 0 (0.0%) |
| Total | 138 (100.0%) | 119 (100.0%) |
Real Estate Taxes by Mortgage Status in Millheim borough
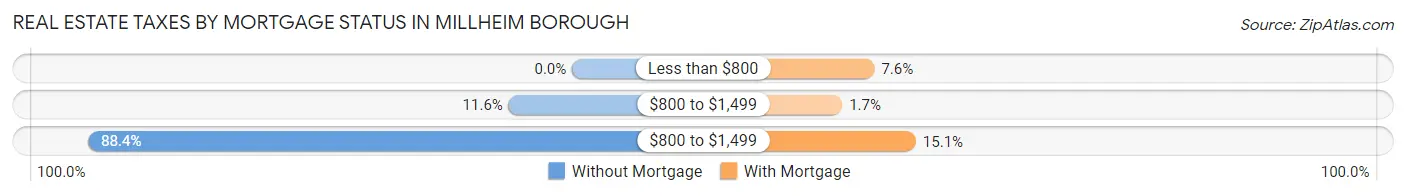
| Property Taxes | Without Mortgage | With Mortgage |
| Less than $800 | 0 (0.0%) | 9 (7.6%) |
| $800 to $1,499 | 16 (11.6%) | 2 (1.7%) |
| $800 to $1,499 | 122 (88.4%) | 18 (15.1%) |
| Total | 138 (100.0%) | 119 (100.0%) |
Health & Disability in Millheim borough
Health Insurance Coverage by Age in Millheim borough
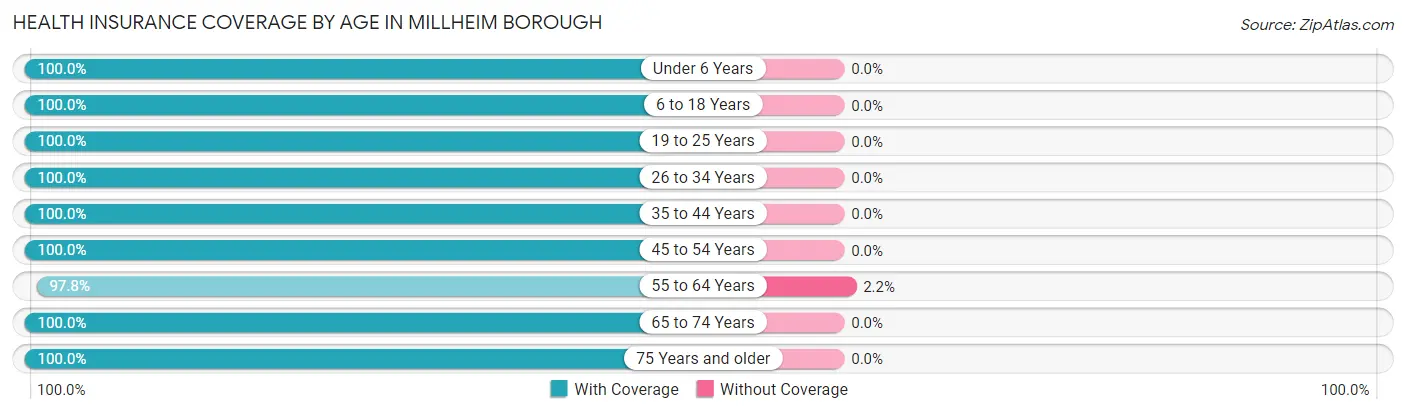
| Age Bracket | With Coverage | Without Coverage |
| Under 6 Years | 20 (100.0%) | 0 (0.0%) |
| 6 to 18 Years | 80 (100.0%) | 0 (0.0%) |
| 19 to 25 Years | 31 (100.0%) | 0 (0.0%) |
| 26 to 34 Years | 53 (100.0%) | 0 (0.0%) |
| 35 to 44 Years | 100 (100.0%) | 0 (0.0%) |
| 45 to 54 Years | 107 (100.0%) | 0 (0.0%) |
| 55 to 64 Years | 88 (97.8%) | 2 (2.2%) |
| 65 to 74 Years | 63 (100.0%) | 0 (0.0%) |
| 75 Years and older | 54 (100.0%) | 0 (0.0%) |
| Total | 596 (99.7%) | 2 (0.3%) |
Health Insurance Coverage by Citizenship Status in Millheim borough
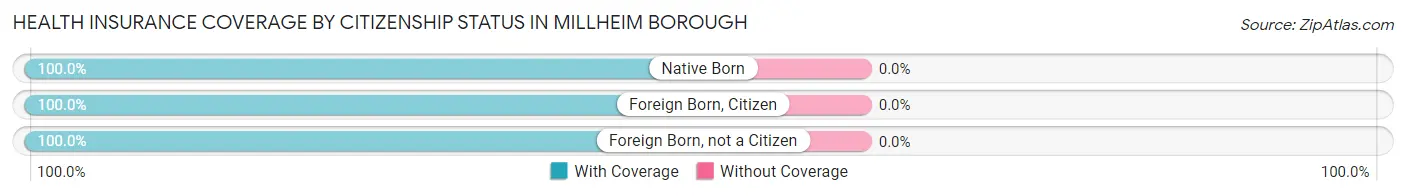
| Citizenship Status | With Coverage | Without Coverage |
| Native Born | 20 (100.0%) | 0 (0.0%) |
| Foreign Born, Citizen | 80 (100.0%) | 0 (0.0%) |
| Foreign Born, not a Citizen | 31 (100.0%) | 0 (0.0%) |
Health Insurance Coverage by Household Income in Millheim borough
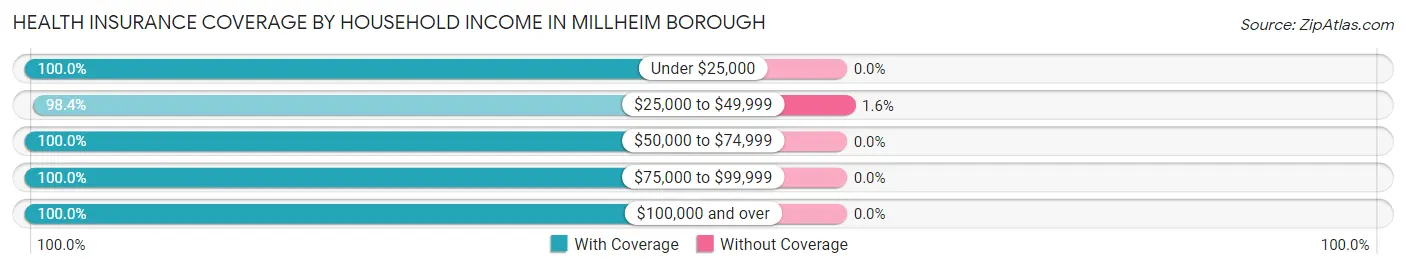
| Household Income | With Coverage | Without Coverage |
| Under $25,000 | 62 (100.0%) | 0 (0.0%) |
| $25,000 to $49,999 | 126 (98.4%) | 2 (1.6%) |
| $50,000 to $74,999 | 68 (100.0%) | 0 (0.0%) |
| $75,000 to $99,999 | 136 (100.0%) | 0 (0.0%) |
| $100,000 and over | 204 (100.0%) | 0 (0.0%) |
Public vs Private Health Insurance Coverage by Age in Millheim borough
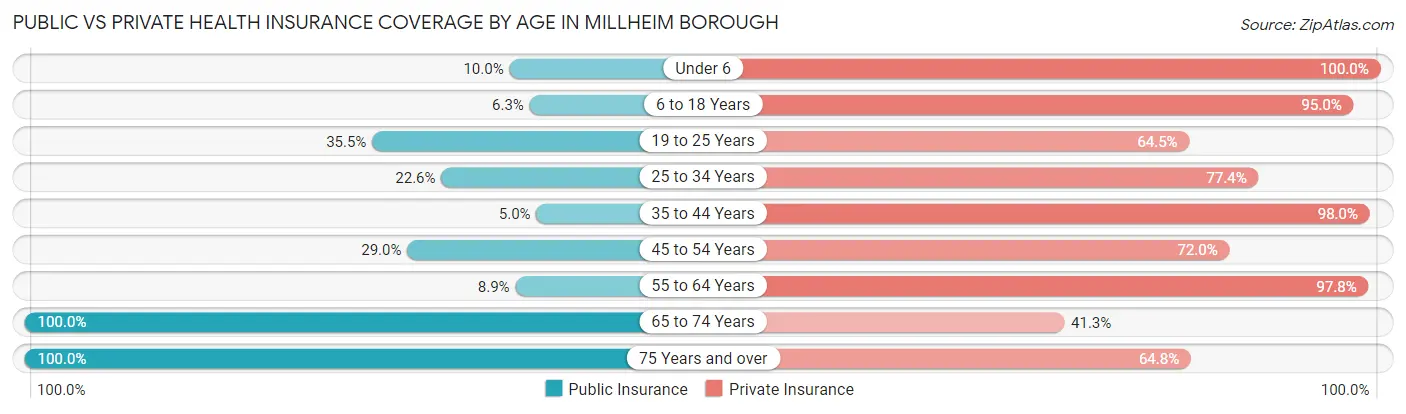
| Age Bracket | Public Insurance | Private Insurance |
| Under 6 | 2 (10.0%) | 20 (100.0%) |
| 6 to 18 Years | 5 (6.2%) | 76 (95.0%) |
| 19 to 25 Years | 11 (35.5%) | 20 (64.5%) |
| 25 to 34 Years | 12 (22.6%) | 41 (77.4%) |
| 35 to 44 Years | 5 (5.0%) | 98 (98.0%) |
| 45 to 54 Years | 31 (29.0%) | 77 (72.0%) |
| 55 to 64 Years | 8 (8.9%) | 88 (97.8%) |
| 65 to 74 Years | 63 (100.0%) | 26 (41.3%) |
| 75 Years and over | 54 (100.0%) | 35 (64.8%) |
| Total | 191 (31.9%) | 481 (80.4%) |
Disability Status by Sex by Age in Millheim borough
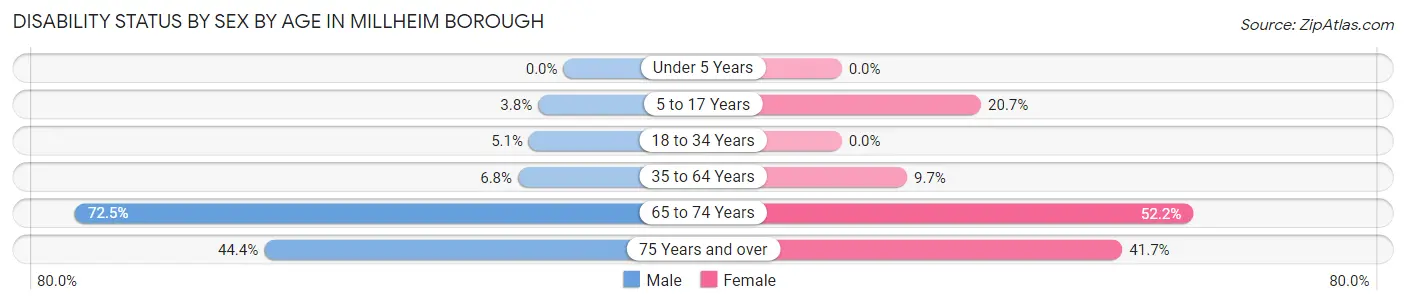
| Age Bracket | Male | Female |
| Under 5 Years | 0 (0.0%) | 0 (0.0%) |
| 5 to 17 Years | 2 (3.8%) | 6 (20.7%) |
| 18 to 34 Years | 2 (5.1%) | 0 (0.0%) |
| 35 to 64 Years | 11 (6.8%) | 13 (9.7%) |
| 65 to 74 Years | 29 (72.5%) | 12 (52.2%) |
| 75 Years and over | 8 (44.4%) | 15 (41.7%) |
Disability Class by Sex by Age in Millheim borough
Disability Class: Hearing Difficulty
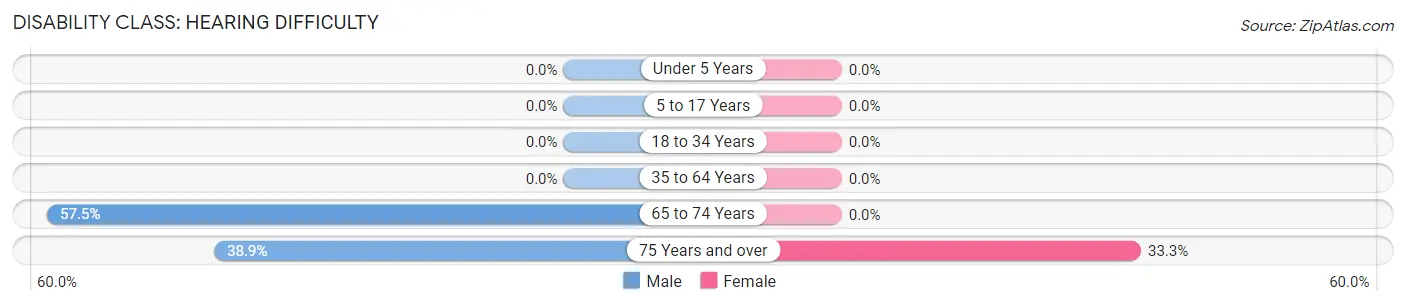
| Age Bracket | Male | Female |
| Under 5 Years | 0 (0.0%) | 0 (0.0%) |
| 5 to 17 Years | 0 (0.0%) | 0 (0.0%) |
| 18 to 34 Years | 0 (0.0%) | 0 (0.0%) |
| 35 to 64 Years | 0 (0.0%) | 0 (0.0%) |
| 65 to 74 Years | 23 (57.5%) | 0 (0.0%) |
| 75 Years and over | 7 (38.9%) | 12 (33.3%) |
Disability Class: Vision Difficulty
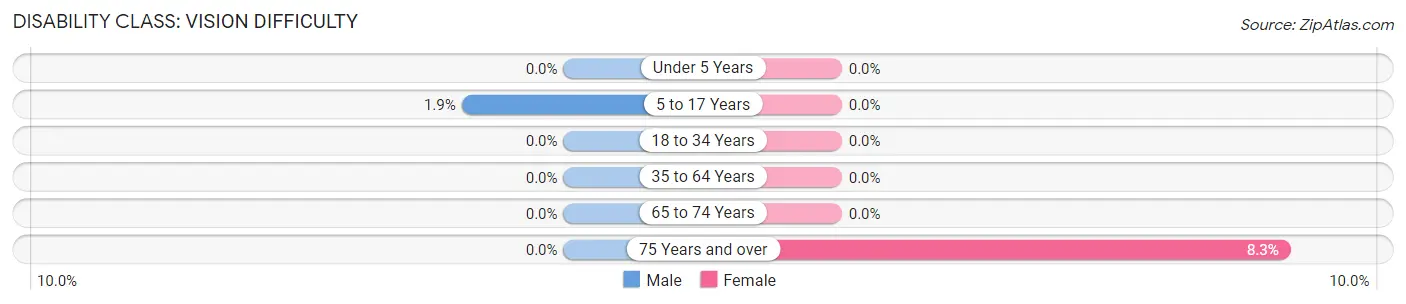
| Age Bracket | Male | Female |
| Under 5 Years | 0 (0.0%) | 0 (0.0%) |
| 5 to 17 Years | 1 (1.9%) | 0 (0.0%) |
| 18 to 34 Years | 0 (0.0%) | 0 (0.0%) |
| 35 to 64 Years | 0 (0.0%) | 0 (0.0%) |
| 65 to 74 Years | 0 (0.0%) | 0 (0.0%) |
| 75 Years and over | 0 (0.0%) | 3 (8.3%) |
Disability Class: Cognitive Difficulty
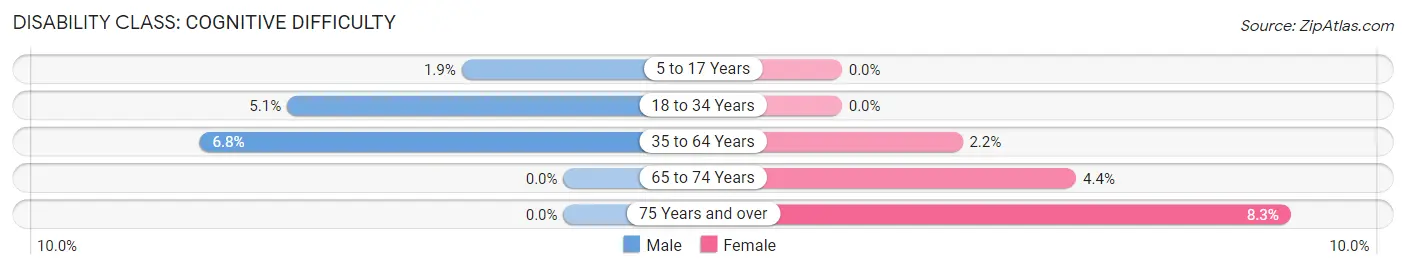
| Age Bracket | Male | Female |
| 5 to 17 Years | 1 (1.9%) | 0 (0.0%) |
| 18 to 34 Years | 2 (5.1%) | 0 (0.0%) |
| 35 to 64 Years | 11 (6.8%) | 3 (2.2%) |
| 65 to 74 Years | 0 (0.0%) | 1 (4.3%) |
| 75 Years and over | 0 (0.0%) | 3 (8.3%) |
Disability Class: Ambulatory Difficulty
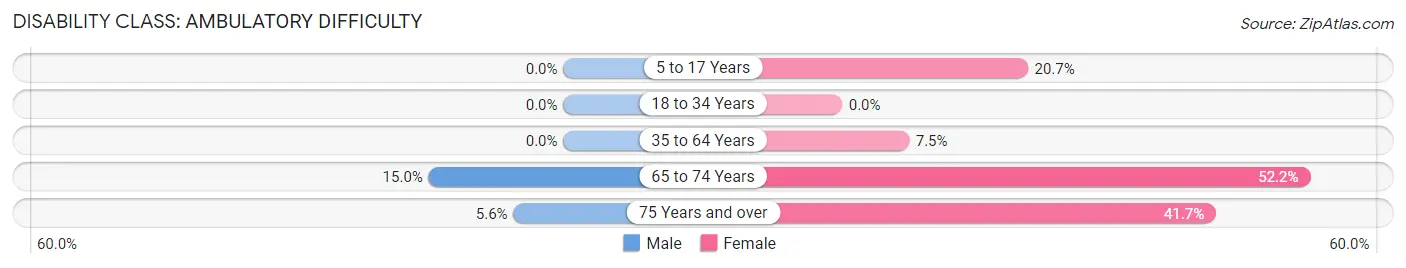
| Age Bracket | Male | Female |
| 5 to 17 Years | 0 (0.0%) | 6 (20.7%) |
| 18 to 34 Years | 0 (0.0%) | 0 (0.0%) |
| 35 to 64 Years | 0 (0.0%) | 10 (7.5%) |
| 65 to 74 Years | 6 (15.0%) | 12 (52.2%) |
| 75 Years and over | 1 (5.6%) | 15 (41.7%) |
Disability Class: Self-Care Difficulty
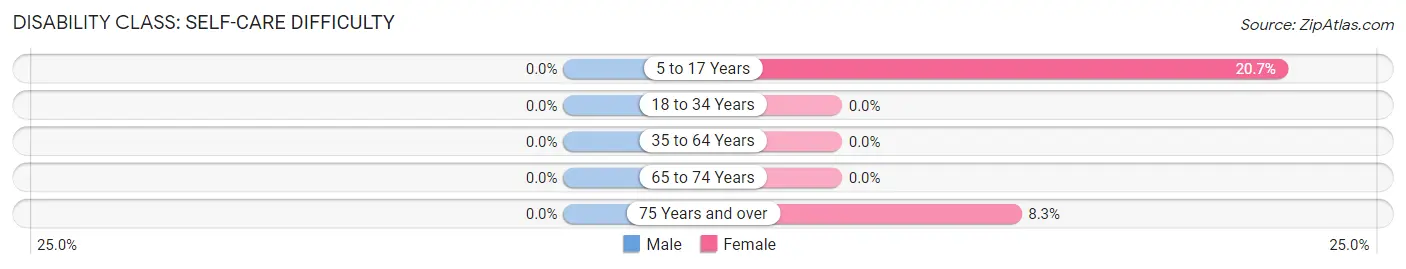
| Age Bracket | Male | Female |
| 5 to 17 Years | 0 (0.0%) | 6 (20.7%) |
| 18 to 34 Years | 0 (0.0%) | 0 (0.0%) |
| 35 to 64 Years | 0 (0.0%) | 0 (0.0%) |
| 65 to 74 Years | 0 (0.0%) | 0 (0.0%) |
| 75 Years and over | 0 (0.0%) | 3 (8.3%) |
Technology Access in Millheim borough
Computing Device Access in Millheim borough
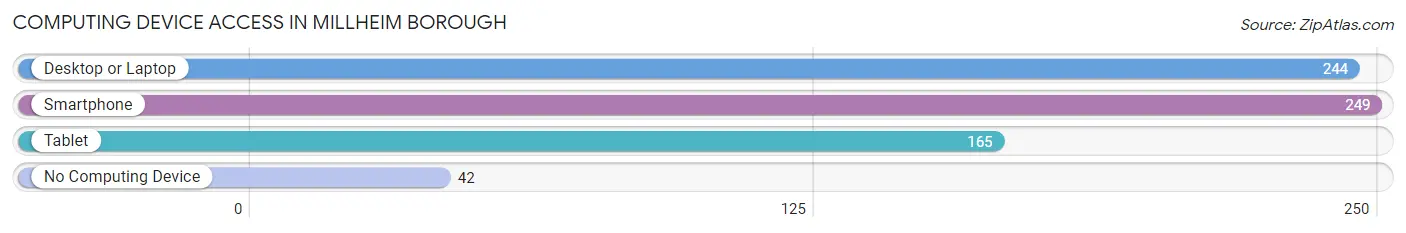
| Device Type | # Households | % Households |
| Desktop or Laptop | 244 | 77.7% |
| Smartphone | 249 | 79.3% |
| Tablet | 165 | 52.5% |
| No Computing Device | 42 | 13.4% |
| Total | 314 | 100.0% |
Internet Access in Millheim borough
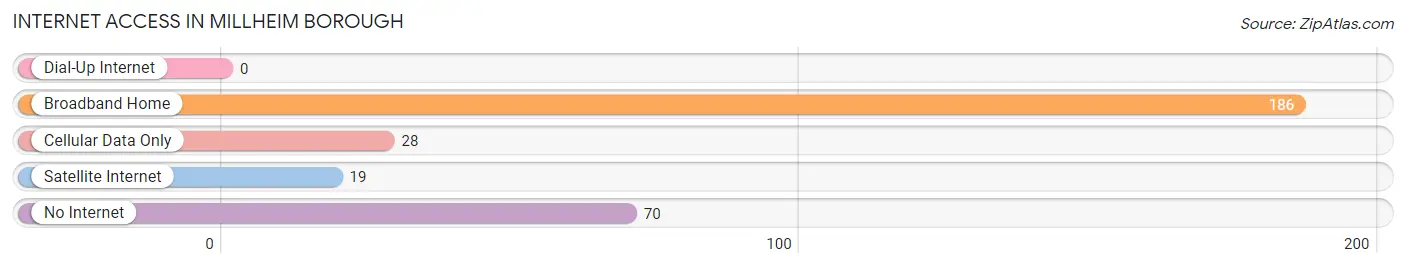
| Internet Type | # Households | % Households |
| Dial-Up Internet | 0 | 0.0% |
| Broadband Home | 186 | 59.2% |
| Cellular Data Only | 28 | 8.9% |
| Satellite Internet | 19 | 6.0% |
| No Internet | 70 | 22.3% |
| Total | 314 | 100.0% |
Millheim borough Summary
Millheim Borough is a small borough located in Centre County, Pennsylvania. It is situated in the heart of the Nittany Valley, approximately 8 miles east of State College and 8 miles west of Lewistown. The borough is surrounded by Penn Township and is home to a population of approximately 1,000 people.
History
Millheim Borough was founded in 1845 by a group of German immigrants who had settled in the area. The name Millheim is derived from the German words “mühle” and “heim”, which mean “mill” and “home” respectively. The original settlers built a grist mill and a saw mill on the banks of the Penns Creek, which provided the foundation for the town’s economy.
In the late 19th century, the town experienced a period of growth and prosperity. The population increased from 500 in 1880 to 1,000 in 1900. During this time, the town was home to a variety of businesses, including a hotel, a bank, a general store, a blacksmith shop, a furniture store, and a shoe store.
In the early 20th century, the town’s economy began to decline as the population decreased and businesses closed. The decline was exacerbated by the Great Depression and World War II. In the 1950s, the town experienced a resurgence as the population began to increase and new businesses opened.
Geography
Millheim Borough is located in the Nittany Valley, which is part of the Ridge and Valley physiographic province. The borough is situated on the banks of the Penns Creek, which flows through the center of town. The terrain is generally flat, with some rolling hills in the surrounding area.
The borough is located in a temperate climate zone, with four distinct seasons. Summers are generally warm and humid, while winters are cold and snowy. The average annual temperature is approximately 50°F (10°C).
Economy
Millheim Borough’s economy is largely based on agriculture and tourism. The town is home to several farms, which produce a variety of crops, including corn, soybeans, hay, and wheat. The town is also home to several wineries, which attract tourists from all over the region.
In addition to agriculture and tourism, the town is home to several small businesses, including a hardware store, a grocery store, a restaurant, and a gas station. The town is also home to a branch of the Centre County Library System.
Demographics
As of the 2010 census, the population of Millheim Borough was 1,039. The racial makeup of the borough was 97.2% White, 0.9% African American, 0.3% Native American, 0.3% Asian, 0.2% from other races, and 0.9% from two or more races. Hispanic or Latino of any race were 0.7% of the population.
The median household income in Millheim Borough was $41,250, and the median family income was $50,000. The per capita income was $20,945. About 8.2% of families and 10.2% of the population were below the poverty line, including 14.3% of those under age 18 and 8.3% of those age 65 or over.
Common Questions
What is Per Capita Income in Millheim borough?
Per Capita income in Millheim borough is $38,415.
What is the Median Family Income in Millheim borough?
Median Family Income in Millheim borough is $91,250.
What is the Median Household income in Millheim borough?
Median Household Income in Millheim borough is $61,250.
What is Income or Wage Gap in Millheim borough?
Income or Wage Gap in Millheim borough is 0.7%.
Women in Millheim borough earn 99.3 cents for every dollar earned by a man.
What is Inequality or Gini Index in Millheim borough?
Inequality or Gini Index in Millheim borough is 0.40.
What is the Total Population of Millheim borough?
Total Population of Millheim borough is 598.
What is the Total Male Population of Millheim borough?
Total Male Population of Millheim borough is 320.
What is the Total Female Population of Millheim borough?
Total Female Population of Millheim borough is 278.
What is the Ratio of Males per 100 Females in Millheim borough?
There are 115.11 Males per 100 Females in Millheim borough.
What is the Ratio of Females per 100 Males in Millheim borough?
There are 86.88 Females per 100 Males in Millheim borough.
What is the Median Population Age in Millheim borough?
Median Population Age in Millheim borough is 48.4 Years.
What is the Average Family Size in Millheim borough
Average Family Size in Millheim borough is 2.8 People.
What is the Average Household Size in Millheim borough
Average Household Size in Millheim borough is 1.9 People.
How Large is the Labor Force in Millheim borough?
There are 372 People in the Labor Forcein in Millheim borough.
What is the Percentage of People in the Labor Force in Millheim borough?
72.1% of People are in the Labor Force in Millheim borough.