Cities with the Lowest Wage/Income Gap (%) in Indiana
RELATED REPORTS & OPTIONS
Lowest Wage/Income Gap (%)
Indiana
Compare Cities
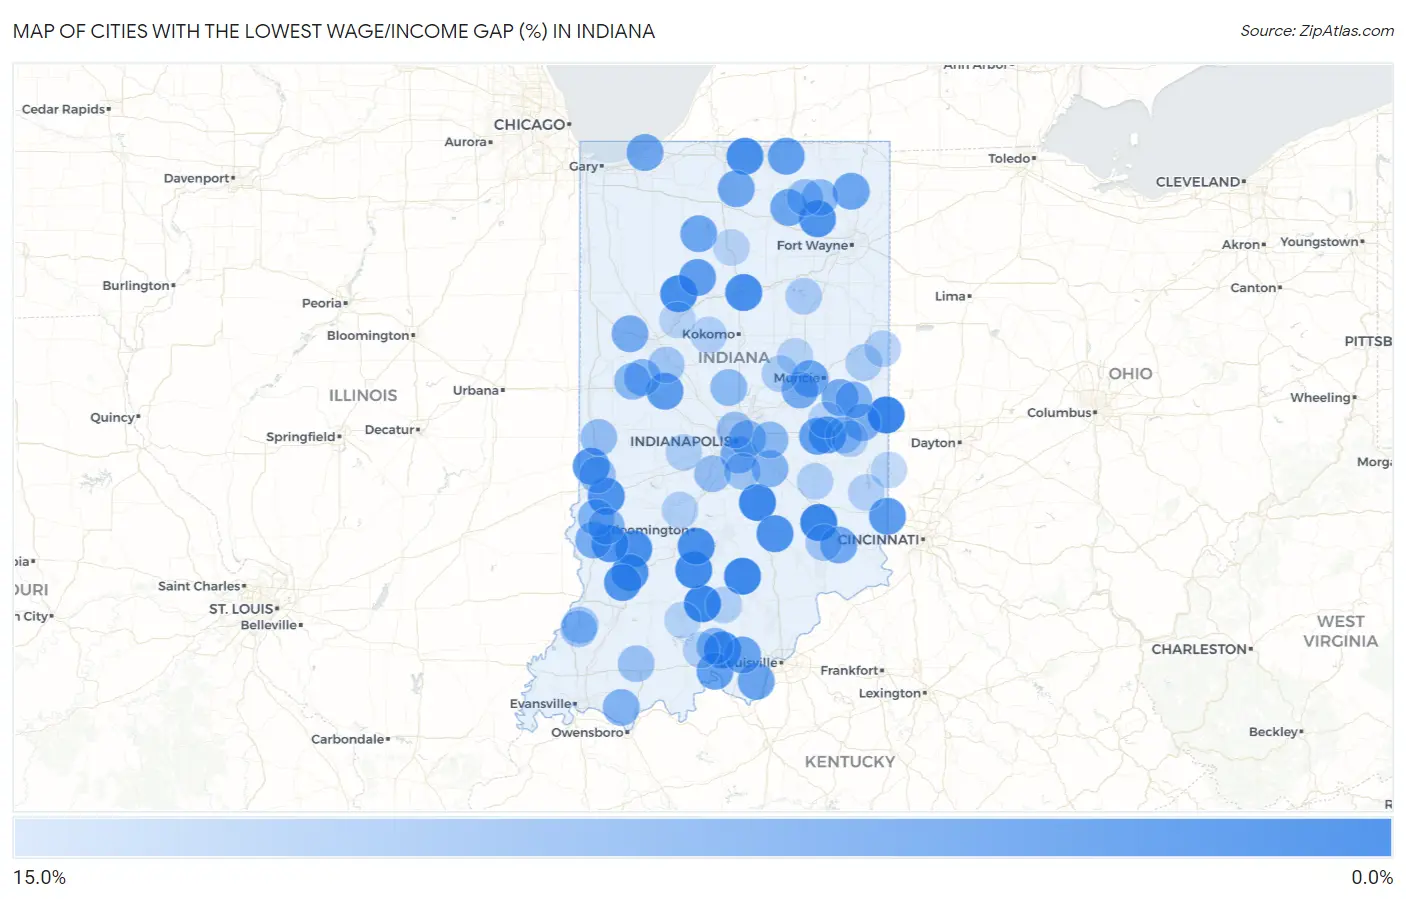
Map of Cities with the Lowest Wage/Income Gap (%) in Indiana
15.0%
0.0%
Cities with the Lowest Wage/Income Gap (%) in Indiana
| City | Wage/Income Gap (%) | vs State | vs National | |
| 1. | Whitewater | 0.42% | 30.9%(-0.305)#1 | 28.0%(-0.276)#91 |
| 2. | Millhousen | 0.64% | 30.9%(-0.303)#2 | 28.0%(-0.273)#154 |
| 3. | Orleans | 0.70% | 30.9%(-0.302)#3 | 28.0%(-0.273)#169 |
| 4. | Otter Lake | 1.0% | 30.9%(-0.299)#4 | 28.0%(-0.270)#261 |
| 5. | Vallonia | 1.2% | 30.9%(-0.297)#5 | 28.0%(-0.268)#307 |
| 6. | Edinburgh | 1.2% | 30.9%(-0.297)#6 | 28.0%(-0.267)#320 |
| 7. | Delaware | 1.3% | 30.9%(-0.296)#7 | 28.0%(-0.267)#327 |
| 8. | Oolitic | 1.5% | 30.9%(-0.294)#8 | 28.0%(-0.265)#392 |
| 9. | Idaville | 1.8% | 30.9%(-0.292)#9 | 28.0%(-0.262)#452 |
| 10. | Milltown | 1.8% | 30.9%(-0.292)#10 | 28.0%(-0.262)#453 |
| 11. | Switz City | 2.4% | 30.9%(-0.285)#11 | 28.0%(-0.256)#598 |
| 12. | Peru | 2.4% | 30.9%(-0.285)#12 | 28.0%(-0.255)#613 |
| 13. | Smithville Sanders | 2.5% | 30.9%(-0.284)#13 | 28.0%(-0.255)#637 |
| 14. | Putnamville | 2.6% | 30.9%(-0.284)#14 | 28.0%(-0.254)#645 |
| 15. | Osceola | 2.7% | 30.9%(-0.282)#15 | 28.0%(-0.253)#674 |
| 16. | Riley | 2.8% | 30.9%(-0.282)#16 | 28.0%(-0.252)#688 |
| 17. | Elizabethtown | 2.9% | 30.9%(-0.280)#17 | 28.0%(-0.251)#737 |
| 18. | Tri Lakes | 3.1% | 30.9%(-0.279)#18 | 28.0%(-0.249)#768 |
| 19. | Elnora | 3.1% | 30.9%(-0.278)#19 | 28.0%(-0.249)#775 |
| 20. | Tippecanoe | 3.4% | 30.9%(-0.275)#20 | 28.0%(-0.246)#863 |
| 21. | Dugger | 3.5% | 30.9%(-0.274)#21 | 28.0%(-0.245)#870 |
| 22. | Plainville | 3.6% | 30.9%(-0.273)#22 | 28.0%(-0.244)#903 |
| 23. | Shepardsville | 3.9% | 30.9%(-0.270)#23 | 28.0%(-0.241)#965 |
| 24. | Enchanted Hills | 4.1% | 30.9%(-0.268)#24 | 28.0%(-0.239)#1,036 |
| 25. | Lewisville | 4.1% | 30.9%(-0.268)#25 | 28.0%(-0.239)#1,043 |
| 26. | West Harrison | 4.4% | 30.9%(-0.266)#26 | 28.0%(-0.236)#1,099 |
| 27. | Darlington | 4.8% | 30.9%(-0.262)#27 | 28.0%(-0.232)#1,193 |
| 28. | Royal Center | 4.9% | 30.9%(-0.260)#28 | 28.0%(-0.230)#1,239 |
| 29. | Middlebury | 5.1% | 30.9%(-0.258)#29 | 28.0%(-0.229)#1,295 |
| 30. | Leavenworth | 5.5% | 30.9%(-0.255)#30 | 28.0%(-0.225)#1,404 |
| 31. | Dunreith | 5.5% | 30.9%(-0.254)#31 | 28.0%(-0.225)#1,408 |
| 32. | Elizabeth | 6.2% | 30.9%(-0.247)#32 | 28.0%(-0.218)#1,577 |
| 33. | Corunna | 6.3% | 30.9%(-0.246)#33 | 28.0%(-0.216)#1,617 |
| 34. | Yorktown | 6.4% | 30.9%(-0.245)#34 | 28.0%(-0.215)#1,637 |
| 35. | North Webster | 6.4% | 30.9%(-0.245)#35 | 28.0%(-0.215)#1,638 |
| 36. | Monterey | 6.5% | 30.9%(-0.244)#36 | 28.0%(-0.215)#1,660 |
| 37. | New Salisbury | 6.6% | 30.9%(-0.244)#37 | 28.0%(-0.214)#1,674 |
| 38. | Bremen | 6.7% | 30.9%(-0.242)#38 | 28.0%(-0.213)#1,716 |
| 39. | Town Of Pines | 7.0% | 30.9%(-0.239)#39 | 28.0%(-0.209)#1,799 |
| 40. | Versailles | 7.0% | 30.9%(-0.239)#40 | 28.0%(-0.209)#1,802 |
| 41. | Chesterfield | 7.7% | 30.9%(-0.232)#41 | 28.0%(-0.203)#1,994 |
| 42. | Blountsville | 7.7% | 30.9%(-0.232)#42 | 28.0%(-0.203)#2,002 |
| 43. | Sullivan | 7.7% | 30.9%(-0.232)#43 | 28.0%(-0.202)#2,017 |
| 44. | Otterbein | 7.8% | 30.9%(-0.231)#44 | 28.0%(-0.202)#2,032 |
| 45. | Greens Fork | 7.8% | 30.9%(-0.231)#45 | 28.0%(-0.202)#2,043 |
| 46. | Homecroft | 7.8% | 30.9%(-0.231)#46 | 28.0%(-0.201)#2,049 |
| 47. | Liberty Center | 8.0% | 30.9%(-0.229)#47 | 28.0%(-0.200)#2,102 |
| 48. | Williamsburg | 8.6% | 30.9%(-0.223)#48 | 28.0%(-0.194)#2,293 |
| 49. | Cloverland | 8.8% | 30.9%(-0.222)#49 | 28.0%(-0.192)#2,329 |
| 50. | Modoc | 9.0% | 30.9%(-0.219)#50 | 28.0%(-0.190)#2,393 |
| 51. | Warren Park | 9.1% | 30.9%(-0.219)#51 | 28.0%(-0.189)#2,419 |
| 52. | Hortonville | 9.1% | 30.9%(-0.218)#52 | 28.0%(-0.188)#2,437 |
| 53. | New Richmond | 9.2% | 30.9%(-0.218)#53 | 28.0%(-0.188)#2,442 |
| 54. | Richland | 9.2% | 30.9%(-0.217)#54 | 28.0%(-0.188)#2,455 |
| 55. | Farmersburg | 9.2% | 30.9%(-0.217)#55 | 28.0%(-0.188)#2,459 |
| 56. | Hymera | 9.3% | 30.9%(-0.216)#56 | 28.0%(-0.187)#2,490 |
| 57. | Marengo | 9.3% | 30.9%(-0.216)#57 | 28.0%(-0.187)#2,499 |
| 58. | Fairland | 9.4% | 30.9%(-0.215)#58 | 28.0%(-0.186)#2,514 |
| 59. | Spring Lake | 9.8% | 30.9%(-0.212)#59 | 28.0%(-0.182)#2,625 |
| 60. | Albion | 10.0% | 30.9%(-0.209)#60 | 28.0%(-0.179)#2,705 |
| 61. | Wingate | 10.1% | 30.9%(-0.208)#61 | 28.0%(-0.179)#2,727 |
| 62. | Sheridan | 10.1% | 30.9%(-0.208)#62 | 28.0%(-0.178)#2,747 |
| 63. | Helmsburg | 10.8% | 30.9%(-0.201)#63 | 28.0%(-0.172)#2,953 |
| 64. | Maples | 10.9% | 30.9%(-0.201)#64 | 28.0%(-0.171)#2,958 |
| 65. | Montezuma | 11.0% | 30.9%(-0.200)#65 | 28.0%(-0.170)#2,993 |
| 66. | North Terre Haute | 11.0% | 30.9%(-0.199)#66 | 28.0%(-0.170)#2,997 |
| 67. | Brooklyn | 11.0% | 30.9%(-0.199)#67 | 28.0%(-0.170)#3,002 |
| 68. | Rockfield | 11.3% | 30.9%(-0.197)#68 | 28.0%(-0.167)#3,083 |
| 69. | Liberty Mills | 11.3% | 30.9%(-0.197)#69 | 28.0%(-0.167)#3,085 |
| 70. | Kimmell | 11.4% | 30.9%(-0.196)#70 | 28.0%(-0.166)#3,123 |
| 71. | Rocky Ripple | 11.4% | 30.9%(-0.195)#71 | 28.0%(-0.166)#3,135 |
| 72. | Gilmer Park | 11.7% | 30.9%(-0.192)#72 | 28.0%(-0.163)#3,225 |
| 73. | Holland | 11.7% | 30.9%(-0.192)#73 | 28.0%(-0.163)#3,228 |
| 74. | Dublin | 11.8% | 30.9%(-0.191)#74 | 28.0%(-0.161)#3,280 |
| 75. | Andersonville | 11.9% | 30.9%(-0.190)#75 | 28.0%(-0.161)#3,302 |
| 76. | Decker | 12.1% | 30.9%(-0.189)#76 | 28.0%(-0.159)#3,356 |
| 77. | New Whiteland | 12.1% | 30.9%(-0.188)#77 | 28.0%(-0.158)#3,388 |
| 78. | Hazleton | 12.2% | 30.9%(-0.187)#78 | 28.0%(-0.157)#3,421 |
| 79. | Stockwell | 12.4% | 30.9%(-0.185)#79 | 28.0%(-0.156)#3,483 |
| 80. | Holton | 12.6% | 30.9%(-0.183)#80 | 28.0%(-0.154)#3,541 |
| 81. | Petersville | 13.3% | 30.9%(-0.176)#81 | 28.0%(-0.146)#3,800 |
| 82. | Mount Etna | 13.5% | 30.9%(-0.174)#82 | 28.0%(-0.145)#3,850 |
| 83. | Ridgeville | 13.6% | 30.9%(-0.173)#83 | 28.0%(-0.144)#3,897 |
| 84. | Frankton | 13.7% | 30.9%(-0.172)#84 | 28.0%(-0.143)#3,926 |
| 85. | Amo | 13.8% | 30.9%(-0.171)#85 | 28.0%(-0.141)#3,974 |
| 86. | Salamonia | 13.9% | 30.9%(-0.171)#86 | 28.0%(-0.141)#3,980 |
| 87. | Milton | 13.9% | 30.9%(-0.170)#87 | 28.0%(-0.140)#4,002 |
| 88. | Campbellsburg | 14.1% | 30.9%(-0.168)#88 | 28.0%(-0.139)#4,048 |
| 89. | Milroy | 14.1% | 30.9%(-0.168)#89 | 28.0%(-0.139)#4,061 |
| 90. | Burlington | 14.1% | 30.9%(-0.168)#90 | 28.0%(-0.138)#4,067 |
| 91. | Stinesville | 14.3% | 30.9%(-0.166)#91 | 28.0%(-0.137)#4,125 |
| 92. | English | 14.3% | 30.9%(-0.166)#92 | 28.0%(-0.137)#4,127 |
| 93. | Brookville | 14.4% | 30.9%(-0.165)#93 | 28.0%(-0.136)#4,161 |
| 94. | Palestine | 14.5% | 30.9%(-0.164)#94 | 28.0%(-0.135)#4,209 |
| 95. | New Castle | 14.6% | 30.9%(-0.163)#95 | 28.0%(-0.134)#4,234 |
| 96. | Summitville | 14.6% | 30.9%(-0.163)#96 | 28.0%(-0.133)#4,240 |
| 97. | West College Corner | 14.7% | 30.9%(-0.162)#97 | 28.0%(-0.133)#4,271 |
| 98. | French Lick | 14.8% | 30.9%(-0.162)#98 | 28.0%(-0.132)#4,283 |
| 99. | Delphi | 14.8% | 30.9%(-0.161)#99 | 28.0%(-0.132)#4,301 |
| 100. | Rochester | 14.9% | 30.9%(-0.160)#100 | 28.0%(-0.131)#4,333 |
Common Questions
What are the Top 10 Cities with the Lowest Wage/Income Gap (%) in Indiana?
Top 10 Cities with the Lowest Wage/Income Gap (%) in Indiana are:
#1
0.42%
#2
0.64%
#3
0.70%
#4
1.2%
#5
1.2%
#6
1.5%
#7
1.8%
#8
1.8%
#9
2.4%
#10
2.4%
What city has the Lowest Wage/Income Gap (%) in Indiana?
Whitewater has the Lowest Wage/Income Gap (%) in Indiana with 0.42%.
What is the Wage / Income Gap in Percentage Terms in the State of Indiana?
Wage / Income Gap in Percentage Terms in Indiana is 30.9%.
What is the Wage / Income Gap in Percentage Terms in the United States?
Wage / Income Gap in Percentage Terms in the United States is 28.0%.