Cities with the Lowest Wage/Income Gap (%) in Vermont
RELATED REPORTS & OPTIONS
Lowest Wage/Income Gap (%)
Vermont
Compare Cities
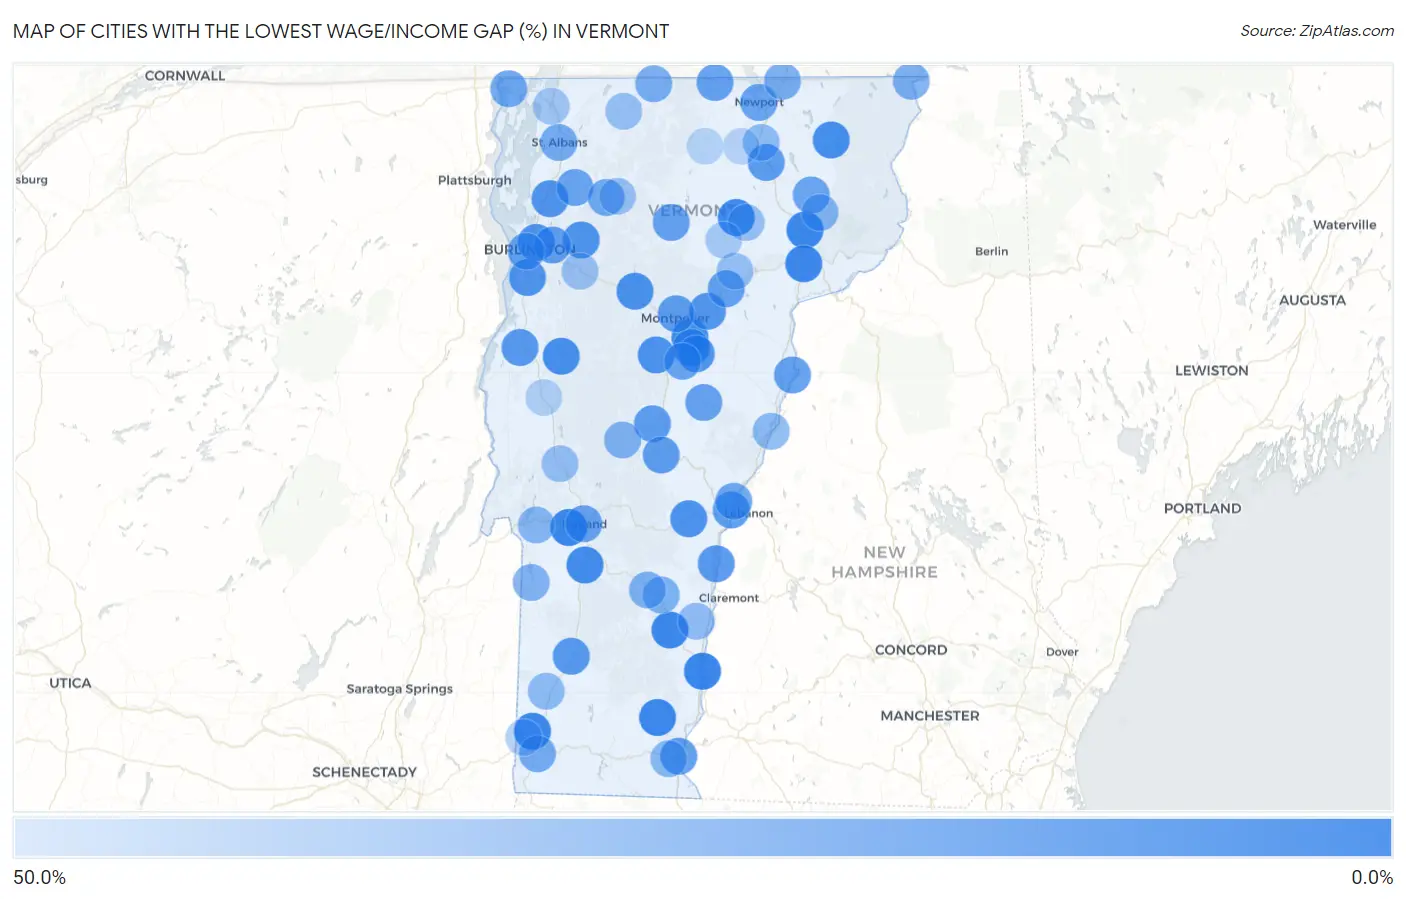
Map of Cities with the Lowest Wage/Income Gap (%) in Vermont
50.0%
0.0%
Cities with the Lowest Wage/Income Gap (%) in Vermont
| City | Wage/Income Gap (%) | vs State | vs National | |
| 1. | Bellows Falls | 0.0075% | 18.3%(-0.183)#1 | 28.0%(-0.280)#2 |
| 2. | Bakersfield | 0.69% | 18.3%(-0.177)#2 | 28.0%(-0.273)#168 |
| 3. | West Rutland | 0.77% | 18.3%(-0.176)#3 | 28.0%(-0.272)#185 |
| 4. | Lyndonville | 0.93% | 18.3%(-0.174)#4 | 28.0%(-0.271)#232 |
| 5. | Chester | 1.2% | 18.3%(-0.171)#5 | 28.0%(-0.267)#322 |
| 6. | South Shaftsbury | 1.3% | 18.3%(-0.171)#6 | 28.0%(-0.267)#330 |
| 7. | Newfane | 1.5% | 18.3%(-0.169)#7 | 28.0%(-0.265)#384 |
| 8. | St Johnsbury | 1.8% | 18.3%(-0.165)#8 | 28.0%(-0.262)#465 |
| 9. | North Clarendon | 2.6% | 18.3%(-0.158)#9 | 28.0%(-0.254)#648 |
| 10. | Greensboro | 3.1% | 18.3%(-0.153)#10 | 28.0%(-0.249)#766 |
| 11. | Barre | 3.7% | 18.3%(-0.147)#11 | 28.0%(-0.243)#915 |
| 12. | Wallingford | 3.7% | 18.3%(-0.146)#12 | 28.0%(-0.243)#930 |
| 13. | New Haven | 4.2% | 18.3%(-0.141)#13 | 28.0%(-0.238)#1,067 |
| 14. | South Hero | 4.3% | 18.3%(-0.141)#14 | 28.0%(-0.237)#1,078 |
| 15. | Island Pond | 4.5% | 18.3%(-0.138)#15 | 28.0%(-0.235)#1,136 |
| 16. | Bristol | 5.3% | 18.3%(-0.130)#16 | 28.0%(-0.227)#1,359 |
| 17. | South Barre | 6.0% | 18.3%(-0.123)#17 | 28.0%(-0.220)#1,533 |
| 18. | Waterbury | 7.1% | 18.3%(-0.113)#18 | 28.0%(-0.209)#1,814 |
| 19. | Winooski | 7.5% | 18.3%(-0.108)#19 | 28.0%(-0.205)#1,947 |
| 20. | Woodstock | 7.9% | 18.3%(-0.105)#20 | 28.0%(-0.201)#2,064 |
| 21. | Northfield | 8.0% | 18.3%(-0.104)#21 | 28.0%(-0.200)#2,086 |
| 22. | Shelburne | 8.2% | 18.3%(-0.102)#22 | 28.0%(-0.198)#2,153 |
| 23. | Milton | 8.3% | 18.3%(-0.100)#23 | 28.0%(-0.196)#2,203 |
| 24. | Jericho | 8.7% | 18.3%(-0.096)#24 | 28.0%(-0.193)#2,321 |
| 25. | Graniteville | 9.2% | 18.3%(-0.092)#25 | 28.0%(-0.188)#2,452 |
| 26. | Plainfield | 9.9% | 18.3%(-0.084)#26 | 28.0%(-0.181)#2,666 |
| 27. | Harmonyville | 10.7% | 18.3%(-0.076)#27 | 28.0%(-0.173)#2,910 |
| 28. | Huntington Center | 10.7% | 18.3%(-0.076)#28 | 28.0%(-0.173)#2,914 |
| 29. | Manchester Center | 11.5% | 18.3%(-0.068)#29 | 28.0%(-0.165)#3,167 |
| 30. | East Poultney | 11.5% | 18.3%(-0.068)#30 | 28.0%(-0.164)#3,174 |
| 31. | Vergennes | 11.8% | 18.3%(-0.065)#31 | 28.0%(-0.162)#3,275 |
| 32. | Windsor | 11.8% | 18.3%(-0.065)#32 | 28.0%(-0.161)#3,282 |
| 33. | Barton | 13.2% | 18.3%(-0.052)#33 | 28.0%(-0.148)#3,743 |
| 34. | White River Junction | 13.3% | 18.3%(-0.051)#34 | 28.0%(-0.147)#3,777 |
| 35. | Randolph | 13.3% | 18.3%(-0.050)#35 | 28.0%(-0.147)#3,797 |
| 36. | Bethel | 13.8% | 18.3%(-0.046)#36 | 28.0%(-0.142)#3,962 |
| 37. | Montpelier | 13.9% | 18.3%(-0.044)#37 | 28.0%(-0.141)#3,998 |
| 38. | Brattleboro | 14.2% | 18.3%(-0.041)#38 | 28.0%(-0.138)#4,105 |
| 39. | Essex Junction | 14.4% | 18.3%(-0.040)#39 | 28.0%(-0.136)#4,152 |
| 40. | Newbury | 15.4% | 18.3%(-0.029)#40 | 28.0%(-0.125)#4,526 |
| 41. | West Pawlet | 15.6% | 18.3%(-0.028)#41 | 28.0%(-0.124)#4,571 |
| 42. | Marshfield | 15.8% | 18.3%(-0.026)#42 | 28.0%(-0.122)#4,679 |
| 43. | Morrisville | 16.2% | 18.3%(-0.021)#43 | 28.0%(-0.117)#4,882 |
| 44. | North Troy | 16.5% | 18.3%(-0.018)#44 | 28.0%(-0.114)#5,014 |
| 45. | Chelsea | 16.7% | 18.3%(-0.016)#45 | 28.0%(-0.113)#5,088 |
| 46. | Rutland | 17.3% | 18.3%(-0.011)#46 | 28.0%(-0.107)#5,300 |
| 47. | South Burlington | 17.5% | 18.3%(-0.008)#47 | 28.0%(-0.104)#5,423 |
| 48. | Williamstown | 17.6% | 18.3%(-0.008)#48 | 28.0%(-0.104)#5,433 |
| 49. | Chittenden | 17.6% | 18.3%(-0.007)#49 | 28.0%(-0.104)#5,455 |
| 50. | Fairfax | 18.0% | 18.3%(-0.004)#50 | 28.0%(-0.100)#5,601 |
| 51. | Lunenburg | 18.4% | 18.3%(+0.001)#51 | 28.0%(-0.096)#5,775 |
| 52. | West Burke | 18.9% | 18.3%(+0.005)#52 | 28.0%(-0.091)#5,977 |
| 53. | Newport | 18.9% | 18.3%(+0.006)#53 | 28.0%(-0.090)#5,990 |
| 54. | Wilder | 19.0% | 18.3%(+0.007)#54 | 28.0%(-0.090)#6,029 |
| 55. | Alburgh | 19.4% | 18.3%(+0.010)#55 | 28.0%(-0.086)#6,185 |
| 56. | Cambridge | 19.8% | 18.3%(+0.015)#56 | 28.0%(-0.081)#6,414 |
| 57. | St. George | 20.3% | 18.3%(+0.020)#57 | 28.0%(-0.076)#6,676 |
| 58. | Killington | 21.6% | 18.3%(+0.033)#58 | 28.0%(-0.063)#7,299 |
| 59. | St Albans | 21.9% | 18.3%(+0.036)#59 | 28.0%(-0.061)#7,432 |
| 60. | Bennington | 22.7% | 18.3%(+0.044)#60 | 28.0%(-0.053)#7,820 |
| 61. | Stamford | 23.0% | 18.3%(+0.046)#61 | 28.0%(-0.050)#7,920 |
| 62. | Derby Line | 23.2% | 18.3%(+0.049)#62 | 28.0%(-0.048)#8,058 |
| 63. | Richford | 23.4% | 18.3%(+0.051)#63 | 28.0%(-0.046)#8,161 |
| 64. | Canaan | 23.9% | 18.3%(+0.056)#64 | 28.0%(-0.041)#8,434 |
| 65. | Middletown Springs | 24.5% | 18.3%(+0.062)#65 | 28.0%(-0.035)#8,726 |
| 66. | Proctorsville | 25.1% | 18.3%(+0.068)#66 | 28.0%(-0.028)#9,081 |
| 67. | Ludlow | 25.9% | 18.3%(+0.075)#67 | 28.0%(-0.021)#9,492 |
| 68. | Bolton | 26.2% | 18.3%(+0.078)#68 | 28.0%(-0.018)#9,654 |
| 69. | Rochester | 26.7% | 18.3%(+0.083)#69 | 28.0%(-0.013)#9,925 |
| 70. | East Burke | 26.9% | 18.3%(+0.086)#70 | 28.0%(-0.010)#10,071 |
| 71. | Wells | 27.2% | 18.3%(+0.089)#71 | 28.0%(-0.008)#10,208 |
| 72. | Castleton | 28.6% | 18.3%(+0.102)#72 | 28.0%(+0.006)#10,951 |
| 73. | West Brattleboro | 29.9% | 18.3%(+0.115)#73 | 28.0%(+0.019)#11,710 |
| 74. | North Hyde Park | 29.9% | 18.3%(+0.116)#74 | 28.0%(+0.020)#11,755 |
| 75. | Bolton Valley | 30.0% | 18.3%(+0.117)#75 | 28.0%(+0.021)#11,814 |
| 76. | Fairlee | 30.3% | 18.3%(+0.120)#76 | 28.0%(+0.023)#11,968 |
| 77. | Pawlet | 30.5% | 18.3%(+0.121)#77 | 28.0%(+0.025)#12,060 |
| 78. | Orleans | 30.7% | 18.3%(+0.124)#78 | 28.0%(+0.028)#12,194 |
| 79. | Arlington | 30.9% | 18.3%(+0.126)#79 | 28.0%(+0.029)#12,274 |
| 80. | East Dorset | 31.0% | 18.3%(+0.126)#80 | 28.0%(+0.030)#12,303 |
| 81. | Springfield | 32.5% | 18.3%(+0.142)#81 | 28.0%(+0.046)#13,157 |
| 82. | Brandon | 33.9% | 18.3%(+0.156)#82 | 28.0%(+0.060)#13,907 |
| 83. | Greensboro Bend | 34.5% | 18.3%(+0.161)#83 | 28.0%(+0.065)#14,187 |
| 84. | Enosburg Falls | 34.7% | 18.3%(+0.163)#84 | 28.0%(+0.067)#14,293 |
| 85. | Underhill Flats | 34.8% | 18.3%(+0.164)#85 | 28.0%(+0.068)#14,362 |
| 86. | Huntington | 35.0% | 18.3%(+0.167)#86 | 28.0%(+0.070)#14,491 |
| 87. | Cabot | 35.1% | 18.3%(+0.168)#87 | 28.0%(+0.071)#14,552 |
| 88. | South Lincoln | 35.5% | 18.3%(+0.171)#88 | 28.0%(+0.075)#14,747 |
| 89. | Richmond | 35.7% | 18.3%(+0.174)#89 | 28.0%(+0.077)#14,862 |
| 90. | Jeffersonville | 35.9% | 18.3%(+0.175)#90 | 28.0%(+0.079)#14,945 |
| 91. | Hartford | 36.3% | 18.3%(+0.179)#91 | 28.0%(+0.083)#15,144 |
| 92. | Danby | 37.0% | 18.3%(+0.186)#92 | 28.0%(+0.090)#15,512 |
| 93. | Swanton | 37.7% | 18.3%(+0.193)#93 | 28.0%(+0.097)#15,895 |
| 94. | Hardwick | 40.5% | 18.3%(+0.221)#94 | 28.0%(+0.125)#17,164 |
| 95. | Sutton | 40.6% | 18.3%(+0.223)#95 | 28.0%(+0.127)#17,232 |
| 96. | North Bennington | 41.7% | 18.3%(+0.233)#96 | 28.0%(+0.137)#17,680 |
| 97. | Proctor | 42.8% | 18.3%(+0.244)#97 | 28.0%(+0.148)#18,137 |
| 98. | Middlebury | 43.2% | 18.3%(+0.248)#98 | 28.0%(+0.152)#18,322 |
| 99. | Lowell | 45.7% | 18.3%(+0.274)#99 | 28.0%(+0.177)#19,320 |
| 100. | Irasburg | 46.4% | 18.3%(+0.280)#100 | 28.0%(+0.184)#19,567 |
1
2Common Questions
What are the Top 10 Cities with the Lowest Wage/Income Gap (%) in Vermont?
Top 10 Cities with the Lowest Wage/Income Gap (%) in Vermont are:
#1
0.0075%
#2
0.77%
#3
0.93%
#4
1.2%
#5
1.3%
#6
1.5%
#7
1.8%
#8
3.1%
#9
3.7%
#10
3.7%
What city has the Lowest Wage/Income Gap (%) in Vermont?
Bellows Falls has the Lowest Wage/Income Gap (%) in Vermont with 0.0075%.
What is the Wage / Income Gap in Percentage Terms in the State of Vermont?
Wage / Income Gap in Percentage Terms in Vermont is 18.3%.
What is the Wage / Income Gap in Percentage Terms in the United States?
Wage / Income Gap in Percentage Terms in the United States is 28.0%.