Cities with the Lowest Wage/Income Gap (%) in the United States
RELATED REPORTS & OPTIONS
Lowest Wage/Income Gap (%)
United States
Compare Cities
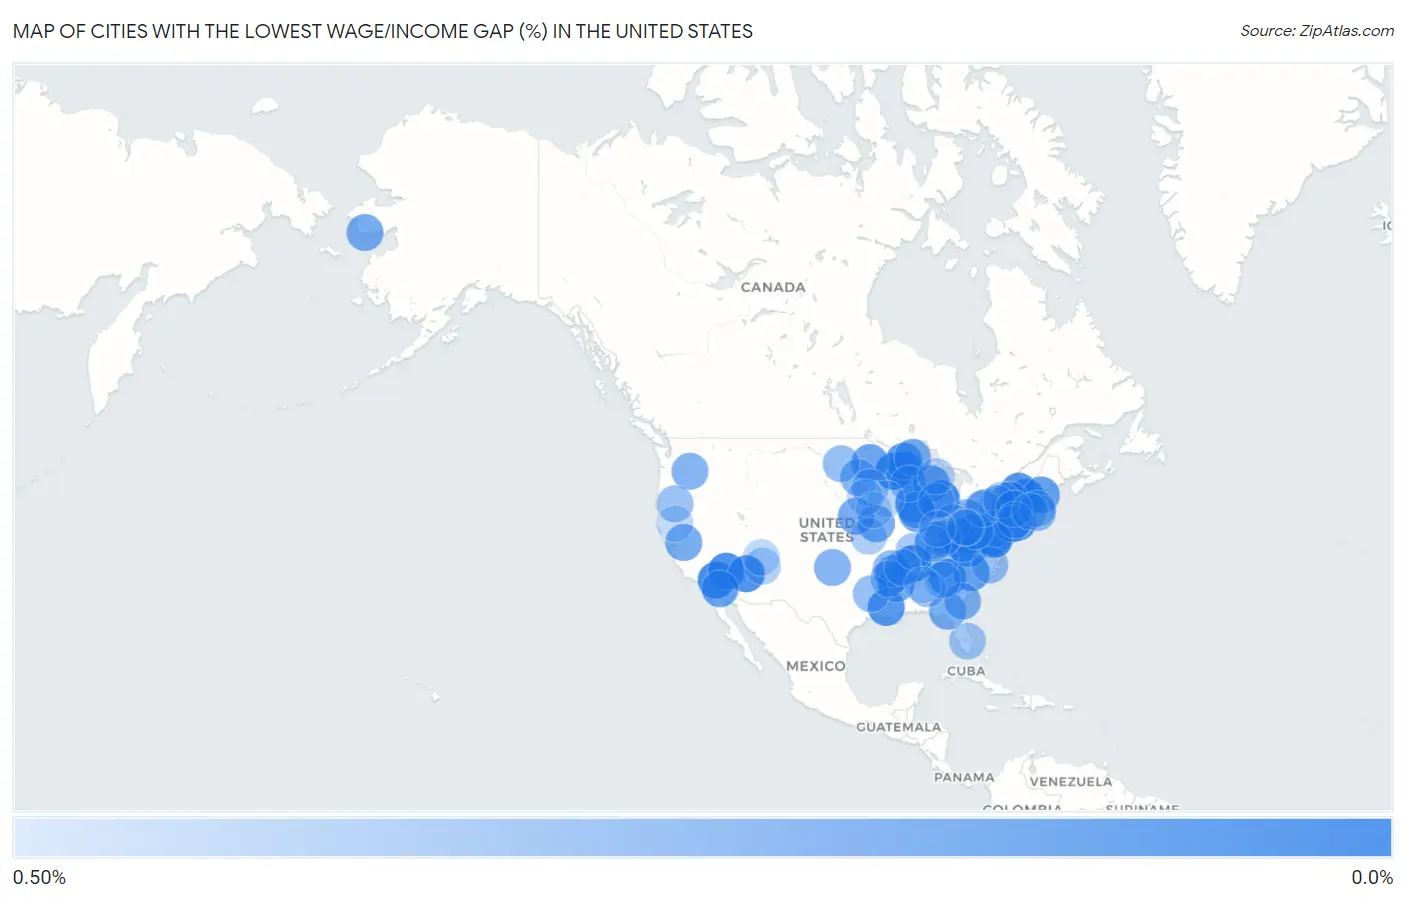
Map of Cities with the Lowest Wage/Income Gap (%) in the United States
0.50%
0.0%
Cities with the Lowest Wage/Income Gap (%) in the United States
| City | Wage/Income Gap (%) | vs State | vs National | |
| 1. | Monticello | 0.0034% | 22.6%(-0.226)#1 | 28.0%(-0.280)#1 |
| 2. | Bellows Falls | 0.0075% | 18.3%(-0.183)#1 | 28.0%(-0.280)#2 |
| 3. | Andover Borough | 0.012% | 29.5%(-0.294)#1 | 28.0%(-0.280)#3 |
| 4. | Huntingdon | 0.019% | 26.7%(-0.267)#1 | 28.0%(-0.280)#4 |
| 5. | Hilltop | 0.030% | 28.0%(-0.279)#1 | 28.0%(-0.280)#5 |
| 6. | Island Park | 0.038% | 22.6%(-0.226)#2 | 28.0%(-0.279)#6 |
| 7. | Twentynine Palms | 0.039% | 25.7%(-0.256)#1 | 28.0%(-0.279)#7 |
| 8. | Ripley | 0.040% | 31.9%(-0.318)#1 | 28.0%(-0.279)#8 |
| 9. | Elsie | 0.047% | 31.6%(-0.316)#1 | 28.0%(-0.279)#9 |
| 10. | Winter | 0.049% | 29.4%(-0.294)#1 | 28.0%(-0.279)#10 |
| 11. | Bullhead City | 0.062% | 22.5%(-0.225)#1 | 28.0%(-0.279)#11 |
| 12. | Sedona | 0.063% | 22.5%(-0.225)#2 | 28.0%(-0.279)#12 |
| 13. | Running Y Ranch | 0.063% | 26.6%(-0.265)#1 | 28.0%(-0.279)#13 |
| 14. | Kingston | 0.066% | 22.6%(-0.226)#3 | 28.0%(-0.279)#14 |
| 15. | Woodruff | 0.074% | 29.4%(-0.293)#2 | 28.0%(-0.279)#15 |
| 16. | Lily Lake | 0.074% | 29.4%(-0.293)#3 | 28.0%(-0.279)#16 |
| 17. | Mount Airy | 0.087% | 25.8%(-0.257)#1 | 28.0%(-0.279)#17 |
| 18. | Ticonderoga | 0.090% | 22.6%(-0.225)#4 | 28.0%(-0.279)#18 |
| 19. | Saugerties South | 0.093% | 22.6%(-0.225)#5 | 28.0%(-0.279)#19 |
| 20. | Evergreen | 0.093% | 37.0%(-0.369)#1 | 28.0%(-0.279)#20 |
| 21. | Forest Hills Borough | 0.10% | 30.8%(-0.307)#1 | 28.0%(-0.279)#21 |
| 22. | Calverton | 0.11% | 21.9%(-0.218)#1 | 28.0%(-0.279)#22 |
| 23. | Salem | 0.12% | 31.9%(-0.318)#2 | 28.0%(-0.279)#23 |
| 24. | White Pine | 0.13% | 31.6%(-0.315)#2 | 28.0%(-0.279)#24 |
| 25. | Wadesboro | 0.13% | 24.5%(-0.244)#1 | 28.0%(-0.279)#25 |
| 26. | Ronceverte | 0.13% | 31.9%(-0.317)#3 | 28.0%(-0.279)#26 |
| 27. | Calipatria | 0.15% | 25.7%(-0.255)#2 | 28.0%(-0.278)#27 |
| 28. | Old Orchard Beach | 0.15% | 25.0%(-0.249)#1 | 28.0%(-0.278)#28 |
| 29. | Wheatley | 0.15% | 26.0%(-0.258)#1 | 28.0%(-0.278)#29 |
| 30. | White Cliffs | 0.15% | 25.7%(-0.255)#1 | 28.0%(-0.278)#30 |
| 31. | Interlochen | 0.15% | 31.6%(-0.315)#3 | 28.0%(-0.278)#31 |
| 32. | Pine River | 0.17% | 26.2%(-0.261)#1 | 28.0%(-0.278)#32 |
| 33. | Olympia Fields | 0.17% | 29.6%(-0.294)#1 | 28.0%(-0.278)#33 |
| 34. | Boyle | 0.18% | 30.5%(-0.303)#1 | 28.0%(-0.278)#34 |
| 35. | Hyde Park | 0.18% | 25.7%(-0.255)#2 | 28.0%(-0.278)#35 |
| 36. | Princeton | 0.19% | 27.1%(-0.269)#1 | 28.0%(-0.278)#36 |
| 37. | Nome | 0.19% | 24.7%(-0.245)#1 | 28.0%(-0.278)#37 |
| 38. | Yutan | 0.20% | 29.0%(-0.288)#1 | 28.0%(-0.278)#38 |
| 39. | Pine Grove | 0.20% | 25.7%(-0.255)#3 | 28.0%(-0.278)#39 |
| 40. | Madison | 0.20% | 22.6%(-0.224)#1 | 28.0%(-0.278)#40 |
| 41. | Lake Linden | 0.20% | 31.6%(-0.314)#4 | 28.0%(-0.278)#41 |
| 42. | Fort Plain | 0.21% | 22.6%(-0.224)#6 | 28.0%(-0.278)#42 |
| 43. | Brock Hall | 0.21% | 21.9%(-0.217)#2 | 28.0%(-0.278)#43 |
| 44. | Riceboro | 0.22% | 25.8%(-0.255)#2 | 28.0%(-0.278)#44 |
| 45. | Forest Park | 0.23% | 29.6%(-0.293)#2 | 28.0%(-0.277)#45 |
| 46. | Cuba | 0.24% | 22.6%(-0.224)#7 | 28.0%(-0.277)#46 |
| 47. | Valley View Cdp York County | 0.24% | 30.8%(-0.306)#2 | 28.0%(-0.277)#47 |
| 48. | Boardman | 0.24% | 26.6%(-0.263)#2 | 28.0%(-0.277)#48 |
| 49. | Holloway | 0.24% | 26.2%(-0.260)#2 | 28.0%(-0.277)#49 |
| 50. | Strong City | 0.24% | 31.4%(-0.311)#1 | 28.0%(-0.277)#50 |
| 51. | Saegertown Borough | 0.25% | 30.8%(-0.306)#3 | 28.0%(-0.277)#51 |
| 52. | Lansing | 0.26% | 22.6%(-0.224)#8 | 28.0%(-0.277)#52 |
| 53. | Kingston | 0.26% | 29.5%(-0.292)#2 | 28.0%(-0.277)#53 |
| 54. | Mattapoisett Center | 0.26% | 26.8%(-0.265)#1 | 28.0%(-0.277)#54 |
| 55. | Churchill | 0.27% | 29.0%(-0.287)#1 | 28.0%(-0.277)#55 |
| 56. | Milton | 0.27% | 28.4%(-0.281)#1 | 28.0%(-0.277)#56 |
| 57. | Bradford | 0.28% | 26.0%(-0.257)#2 | 28.0%(-0.277)#57 |
| 58. | Huntsville | 0.29% | 26.7%(-0.264)#2 | 28.0%(-0.277)#58 |
| 59. | New Salem | 0.29% | 30.8%(-0.305)#4 | 28.0%(-0.277)#59 |
| 60. | Dickey | 0.29% | 30.5%(-0.302)#1 | 28.0%(-0.277)#60 |
| 61. | Big Falls | 0.30% | 29.4%(-0.291)#4 | 28.0%(-0.277)#61 |
| 62. | Scottsville | 0.30% | 29.4%(-0.291)#1 | 28.0%(-0.277)#62 |
| 63. | Courtland | 0.30% | 26.2%(-0.259)#3 | 28.0%(-0.277)#63 |
| 64. | Tarboro | 0.30% | 24.5%(-0.242)#2 | 28.0%(-0.277)#64 |
| 65. | East Bank | 0.30% | 31.9%(-0.316)#4 | 28.0%(-0.277)#65 |
| 66. | South Amboy | 0.30% | 29.5%(-0.292)#3 | 28.0%(-0.277)#66 |
| 67. | Fort Washington | 0.31% | 21.9%(-0.216)#3 | 28.0%(-0.277)#67 |
| 68. | Brandonville | 0.31% | 31.9%(-0.316)#5 | 28.0%(-0.277)#68 |
| 69. | Chiloquin | 0.31% | 26.6%(-0.263)#3 | 28.0%(-0.277)#69 |
| 70. | Oak Grove | 0.31% | 34.0%(-0.337)#1 | 28.0%(-0.277)#70 |
| 71. | North Pembroke | 0.32% | 26.8%(-0.264)#2 | 28.0%(-0.277)#71 |
| 72. | Wabbaseka | 0.32% | 26.0%(-0.256)#3 | 28.0%(-0.277)#72 |
| 73. | Candlewood Lake | 0.33% | 29.0%(-0.286)#2 | 28.0%(-0.277)#73 |
| 74. | Del Dios | 0.33% | 25.7%(-0.253)#4 | 28.0%(-0.277)#74 |
| 75. | Belle Glade | 0.33% | 22.6%(-0.222)#2 | 28.0%(-0.276)#75 |
| 76. | Williamsburg | 0.34% | 29.0%(-0.286)#3 | 28.0%(-0.276)#76 |
| 77. | Moscow | 0.34% | 29.0%(-0.286)#4 | 28.0%(-0.276)#77 |
| 78. | Cave In Rock | 0.35% | 29.6%(-0.292)#3 | 28.0%(-0.276)#78 |
| 79. | Lansing | 0.36% | 29.0%(-0.286)#5 | 28.0%(-0.276)#79 |
| 80. | Wellington | 0.37% | 28.4%(-0.280)#2 | 28.0%(-0.276)#80 |
| 81. | Cumming | 0.37% | 25.8%(-0.254)#3 | 28.0%(-0.276)#81 |
| 82. | North Kansas City | 0.37% | 27.1%(-0.267)#2 | 28.0%(-0.276)#82 |
| 83. | Ganado | 0.39% | 22.5%(-0.222)#3 | 28.0%(-0.276)#83 |
| 84. | Sunfield | 0.40% | 31.6%(-0.312)#5 | 28.0%(-0.276)#84 |
| 85. | Allegany | 0.40% | 22.6%(-0.222)#9 | 28.0%(-0.276)#85 |
| 86. | Garland | 0.40% | 26.7%(-0.263)#3 | 28.0%(-0.276)#86 |
| 87. | Petoskey | 0.40% | 31.6%(-0.312)#6 | 28.0%(-0.276)#87 |
| 88. | Manlius | 0.41% | 22.6%(-0.222)#10 | 28.0%(-0.276)#88 |
| 89. | Lawler | 0.41% | 29.9%(-0.295)#1 | 28.0%(-0.276)#89 |
| 90. | Bethesda | 0.42% | 29.0%(-0.285)#6 | 28.0%(-0.276)#90 |
| 91. | Whitewater | 0.42% | 30.9%(-0.305)#1 | 28.0%(-0.276)#91 |
| 92. | Rock Point | 0.42% | 22.5%(-0.221)#4 | 28.0%(-0.276)#92 |
| 93. | West Hurley | 0.43% | 22.6%(-0.222)#11 | 28.0%(-0.276)#93 |
| 94. | Dickens | 0.43% | 29.9%(-0.295)#2 | 28.0%(-0.276)#94 |
| 95. | Holden Lakes | 0.44% | 22.6%(-0.221)#3 | 28.0%(-0.275)#95 |
| 96. | Edgewater | 0.44% | 34.0%(-0.336)#2 | 28.0%(-0.275)#96 |
| 97. | Shingletown | 0.44% | 25.7%(-0.252)#5 | 28.0%(-0.275)#97 |
| 98. | Hackensack | 0.44% | 29.5%(-0.290)#4 | 28.0%(-0.275)#98 |
| 99. | East Brooklyn | 0.44% | 27.8%(-0.274)#1 | 28.0%(-0.275)#99 |
| 100. | Luther | 0.44% | 29.9%(-0.295)#3 | 28.0%(-0.275)#100 |
Common Questions
What are the Top 10 Cities with the Lowest Wage/Income Gap (%) in the United States?
Top 10 Cities with the Lowest Wage/Income Gap (%) in the United States are:
#1
0.0034%
#2
0.0075%
#3
0.019%
#4
0.038%
#5
0.039%
#6
0.040%
#7
0.047%
#8
0.049%
#9
0.062%
#10
0.063%
What city has the Lowest Wage/Income Gap (%) in the United States?
Monticello has the Lowest Wage/Income Gap (%) in the United States with 0.0034%.
What is the Wage / Income Gap in Percentage Terms in the United States?
Wage / Income Gap in Percentage Terms in the United States is 28.0%.