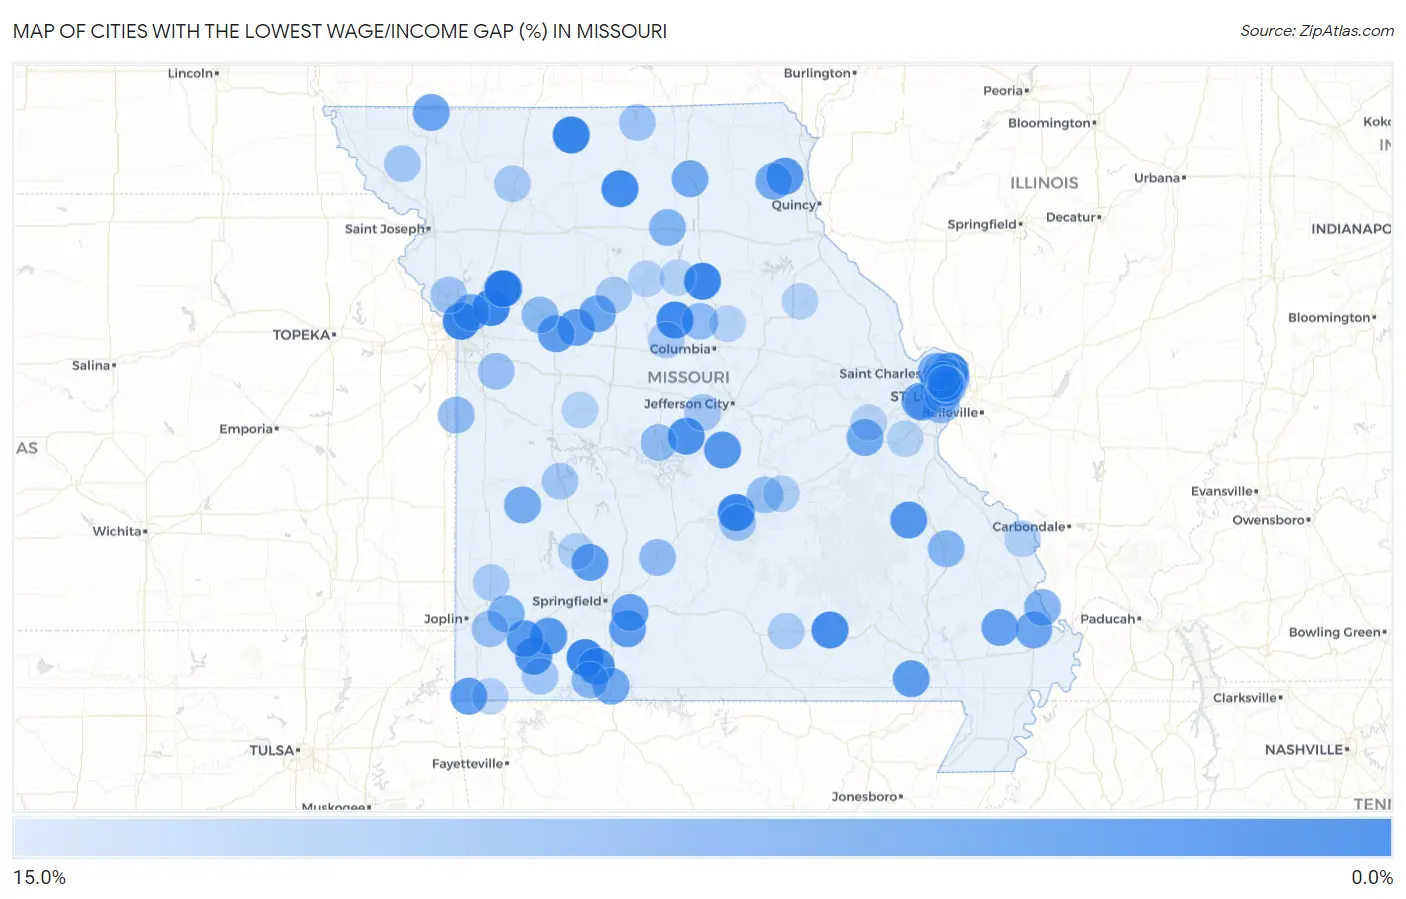
Cities with the Lowest Wage/Income Gap (%) in Missouri
RELATED REPORTS & OPTIONS
Lowest Wage/Income Gap (%)
Missouri
Compare Cities
Map of Cities with the Lowest Wage/Income Gap (%) in Missouri
15.0%
0.0%
Cities with the Lowest Wage/Income Gap (%) in Missouri
| City | Wage/Income Gap (%) | vs State | vs National | |
| 1. | Princeton | 0.19% | 27.1%(-0.269)#1 | 28.0%(-0.278)#36 |
| 2. | North Kansas City | 0.37% | 27.1%(-0.267)#2 | 28.0%(-0.276)#82 |
| 3. | Galena | 0.46% | 27.1%(-0.266)#3 | 28.0%(-0.275)#101 |
| 4. | Missouri City | 0.52% | 27.1%(-0.266)#4 | 28.0%(-0.275)#119 |
| 5. | Moberly | 0.60% | 27.1%(-0.265)#5 | 28.0%(-0.274)#136 |
| 6. | St Robert | 0.61% | 27.1%(-0.265)#6 | 28.0%(-0.274)#142 |
| 7. | Crystal Lakes | 0.75% | 27.1%(-0.263)#7 | 28.0%(-0.272)#181 |
| 8. | Fayette | 0.90% | 27.1%(-0.262)#8 | 28.0%(-0.271)#223 |
| 9. | Ferguson | 0.92% | 27.1%(-0.262)#9 | 28.0%(-0.271)#229 |
| 10. | Sycamore Hills | 0.94% | 27.1%(-0.261)#10 | 28.0%(-0.270)#238 |
| 11. | Browning | 1.0% | 27.1%(-0.260)#11 | 28.0%(-0.269)#265 |
| 12. | Black Jack | 1.1% | 27.1%(-0.260)#12 | 28.0%(-0.269)#275 |
| 13. | Reeds Spring | 1.3% | 27.1%(-0.257)#13 | 28.0%(-0.266)#347 |
| 14. | Winona | 1.4% | 27.1%(-0.257)#14 | 28.0%(-0.266)#365 |
| 15. | Purdy | 1.9% | 27.1%(-0.252)#15 | 28.0%(-0.261)#478 |
| 16. | Eldon | 2.0% | 27.1%(-0.251)#16 | 28.0%(-0.260)#492 |
| 17. | Bismarck | 2.6% | 27.1%(-0.245)#17 | 28.0%(-0.254)#649 |
| 18. | Monticello | 2.7% | 27.1%(-0.244)#18 | 28.0%(-0.253)#675 |
| 19. | Raintree Plantation | 2.7% | 27.1%(-0.243)#19 | 28.0%(-0.252)#686 |
| 20. | St Elizabeth | 2.8% | 27.1%(-0.243)#20 | 28.0%(-0.252)#697 |
| 21. | Verona | 2.8% | 27.1%(-0.243)#21 | 28.0%(-0.252)#704 |
| 22. | Pierce City | 2.8% | 27.1%(-0.242)#22 | 28.0%(-0.251)#715 |
| 23. | Hanley Hills | 3.1% | 27.1%(-0.240)#23 | 28.0%(-0.249)#776 |
| 24. | Noel | 3.1% | 27.1%(-0.239)#24 | 28.0%(-0.249)#785 |
| 25. | Dellwood | 3.1% | 27.1%(-0.239)#25 | 28.0%(-0.248)#790 |
| 26. | Morrisville | 3.3% | 27.1%(-0.237)#26 | 28.0%(-0.246)#837 |
| 27. | Fairdealing | 3.3% | 27.1%(-0.237)#27 | 28.0%(-0.246)#838 |
| 28. | Sparta | 3.3% | 27.1%(-0.237)#28 | 28.0%(-0.246)#840 |
| 29. | Alma | 3.5% | 27.1%(-0.236)#29 | 28.0%(-0.245)#875 |
| 30. | Higginsville | 3.5% | 27.1%(-0.235)#30 | 28.0%(-0.245)#878 |
| 31. | St John | 3.7% | 27.1%(-0.234)#31 | 28.0%(-0.243)#923 |
| 32. | Rogersville | 3.8% | 27.1%(-0.232)#32 | 28.0%(-0.242)#956 |
| 33. | Edmundson | 3.9% | 27.1%(-0.231)#33 | 28.0%(-0.240)#984 |
| 34. | Bell City | 4.0% | 27.1%(-0.231)#34 | 28.0%(-0.240)#993 |
| 35. | Homestead | 4.1% | 27.1%(-0.230)#35 | 28.0%(-0.239)#1,024 |
| 36. | Winchester | 4.2% | 27.1%(-0.229)#36 | 28.0%(-0.238)#1,058 |
| 37. | Overland | 4.2% | 27.1%(-0.229)#37 | 28.0%(-0.238)#1,059 |
| 38. | Hopkins | 4.3% | 27.1%(-0.228)#38 | 28.0%(-0.237)#1,080 |
| 39. | Charlack | 4.4% | 27.1%(-0.227)#39 | 28.0%(-0.236)#1,108 |
| 40. | Malta Bend | 4.5% | 27.1%(-0.226)#40 | 28.0%(-0.235)#1,127 |
| 41. | Blodgett | 4.7% | 27.1%(-0.224)#41 | 28.0%(-0.233)#1,172 |
| 42. | St Clair | 5.0% | 27.1%(-0.221)#42 | 28.0%(-0.230)#1,240 |
| 43. | Claycomo | 5.0% | 27.1%(-0.221)#43 | 28.0%(-0.230)#1,251 |
| 44. | Lake St. Clair | 5.0% | 27.1%(-0.221)#44 | 28.0%(-0.230)#1,254 |
| 45. | Lewistown | 5.0% | 27.1%(-0.221)#45 | 28.0%(-0.230)#1,257 |
| 46. | Hollister | 5.1% | 27.1%(-0.220)#46 | 28.0%(-0.229)#1,289 |
| 47. | Millard | 5.2% | 27.1%(-0.219)#47 | 28.0%(-0.228)#1,303 |
| 48. | El Dorado Springs | 5.4% | 27.1%(-0.217)#48 | 28.0%(-0.226)#1,378 |
| 49. | Castle Point | 5.5% | 27.1%(-0.216)#49 | 28.0%(-0.225)#1,402 |
| 50. | Hazelwood | 5.5% | 27.1%(-0.216)#50 | 28.0%(-0.225)#1,417 |
| 51. | Greendale | 5.6% | 27.1%(-0.215)#51 | 28.0%(-0.224)#1,427 |
| 52. | Reeds | 5.9% | 27.1%(-0.212)#52 | 28.0%(-0.221)#1,499 |
| 53. | Commerce | 6.0% | 27.1%(-0.211)#53 | 28.0%(-0.220)#1,531 |
| 54. | Hillsdale | 6.2% | 27.1%(-0.209)#54 | 28.0%(-0.218)#1,588 |
| 55. | New Cambria | 6.4% | 27.1%(-0.207)#55 | 28.0%(-0.216)#1,626 |
| 56. | Junction City | 6.5% | 27.1%(-0.205)#56 | 28.0%(-0.214)#1,668 |
| 57. | Kimberling City | 7.1% | 27.1%(-0.200)#57 | 28.0%(-0.209)#1,807 |
| 58. | Lexington | 7.1% | 27.1%(-0.200)#58 | 28.0%(-0.209)#1,809 |
| 59. | Drexel | 7.2% | 27.1%(-0.199)#59 | 28.0%(-0.208)#1,853 |
| 60. | Conway | 7.3% | 27.1%(-0.198)#60 | 28.0%(-0.207)#1,868 |
| 61. | Calverton Park | 7.3% | 27.1%(-0.198)#61 | 28.0%(-0.207)#1,884 |
| 62. | Marlborough | 7.4% | 27.1%(-0.196)#62 | 28.0%(-0.206)#1,921 |
| 63. | Harrisburg | 7.5% | 27.1%(-0.196)#63 | 28.0%(-0.205)#1,934 |
| 64. | Manchester | 7.6% | 27.1%(-0.195)#64 | 28.0%(-0.204)#1,978 |
| 65. | Gravois Mills | 7.7% | 27.1%(-0.194)#65 | 28.0%(-0.203)#1,993 |
| 66. | Diamond | 8.0% | 27.1%(-0.191)#66 | 28.0%(-0.200)#2,101 |
| 67. | Doolittle | 8.0% | 27.1%(-0.190)#67 | 28.0%(-0.199)#2,112 |
| 68. | Baldwin Park | 8.1% | 27.1%(-0.190)#68 | 28.0%(-0.199)#2,135 |
| 69. | Fort Leonard Wood | 8.2% | 27.1%(-0.189)#69 | 28.0%(-0.198)#2,156 |
| 70. | Ferrelview | 8.5% | 27.1%(-0.186)#70 | 28.0%(-0.195)#2,253 |
| 71. | Unionville | 8.5% | 27.1%(-0.186)#71 | 28.0%(-0.195)#2,268 |
| 72. | Pagedale | 8.7% | 27.1%(-0.184)#72 | 28.0%(-0.193)#2,310 |
| 73. | Blue Summit | 8.8% | 27.1%(-0.183)#73 | 28.0%(-0.192)#2,333 |
| 74. | Russellville | 8.8% | 27.1%(-0.183)#74 | 28.0%(-0.192)#2,342 |
| 75. | Cassville | 8.9% | 27.1%(-0.182)#75 | 28.0%(-0.191)#2,360 |
| 76. | Osceola | 8.9% | 27.1%(-0.182)#76 | 28.0%(-0.191)#2,368 |
| 77. | Maitland | 8.9% | 27.1%(-0.181)#77 | 28.0%(-0.191)#2,381 |
| 78. | Miami | 9.3% | 27.1%(-0.178)#78 | 28.0%(-0.187)#2,488 |
| 79. | Pattonsburg | 9.3% | 27.1%(-0.178)#79 | 28.0%(-0.187)#2,498 |
| 80. | Northwoods | 9.3% | 27.1%(-0.177)#80 | 28.0%(-0.186)#2,506 |
| 81. | Richmond Heights | 9.3% | 27.1%(-0.177)#81 | 28.0%(-0.186)#2,508 |
| 82. | Florissant | 9.4% | 27.1%(-0.177)#82 | 28.0%(-0.186)#2,531 |
| 83. | Franklin | 9.5% | 27.1%(-0.176)#83 | 28.0%(-0.185)#2,542 |
| 84. | Jasper | 9.5% | 27.1%(-0.176)#84 | 28.0%(-0.185)#2,547 |
| 85. | Pasadena Park | 9.7% | 27.1%(-0.174)#85 | 28.0%(-0.183)#2,612 |
| 86. | Mountain View | 9.8% | 27.1%(-0.173)#86 | 28.0%(-0.182)#2,629 |
| 87. | Kinloch | 9.8% | 27.1%(-0.173)#87 | 28.0%(-0.182)#2,633 |
| 88. | Rolla | 9.8% | 27.1%(-0.173)#88 | 28.0%(-0.182)#2,650 |
| 89. | Frohna | 10.1% | 27.1%(-0.170)#89 | 28.0%(-0.179)#2,734 |
| 90. | Farber | 10.2% | 27.1%(-0.169)#90 | 28.0%(-0.178)#2,756 |
| 91. | Jane | 10.2% | 27.1%(-0.169)#91 | 28.0%(-0.178)#2,757 |
| 92. | Keytesville | 10.2% | 27.1%(-0.168)#92 | 28.0%(-0.177)#2,783 |
| 93. | Aldrich | 10.3% | 27.1%(-0.168)#93 | 28.0%(-0.177)#2,786 |
| 94. | Cedar Hill Lakes | 10.3% | 27.1%(-0.168)#94 | 28.0%(-0.177)#2,805 |
| 95. | New Hamburg | 10.3% | 27.1%(-0.168)#95 | 28.0%(-0.177)#2,815 |
| 96. | Hallsville | 10.4% | 27.1%(-0.167)#96 | 28.0%(-0.176)#2,822 |
| 97. | Windsor | 10.4% | 27.1%(-0.167)#97 | 28.0%(-0.176)#2,825 |
| 98. | Clifton Hill | 10.4% | 27.1%(-0.167)#98 | 28.0%(-0.176)#2,838 |
| 99. | Bellerive Acres | 10.4% | 27.1%(-0.166)#99 | 28.0%(-0.175)#2,844 |
| 100. | Union | 10.6% | 27.1%(-0.165)#100 | 28.0%(-0.174)#2,868 |
Common Questions
What are the Top 10 Cities with the Lowest Wage/Income Gap (%) in Missouri?
Top 10 Cities with the Lowest Wage/Income Gap (%) in Missouri are:
#1
0.19%
#2
0.37%
#3
0.46%
#4
0.52%
#5
0.60%
#6
0.61%
#7
0.75%
#8
0.90%
#9
0.92%
#10
0.94%
What city has the Lowest Wage/Income Gap (%) in Missouri?
Princeton has the Lowest Wage/Income Gap (%) in Missouri with 0.19%.
What is the Wage / Income Gap in Percentage Terms in the State of Missouri?
Wage / Income Gap in Percentage Terms in Missouri is 27.1%.
What is the Wage / Income Gap in Percentage Terms in the United States?
Wage / Income Gap in Percentage Terms in the United States is 28.0%.