South Heights borough, PA Map & Demographics
South Heights borough Overview
$39,266
PER CAPITA INCOME
$84,318
AVG FAMILY INCOME
$63,750
AVG HOUSEHOLD INCOME
2.3%
WAGE / INCOME GAP [ % ]
97.7¢/ $1
WAGE / INCOME GAP [ $ ]
0.38
INEQUALITY / GINI INDEX
333
TOTAL POPULATION
151
MALE POPULATION
182
FEMALE POPULATION
82.97
MALES / 100 FEMALES
120.53
FEMALES / 100 MALES
50.0
MEDIAN AGE
2.7
AVG FAMILY SIZE
1.9
AVG HOUSEHOLD SIZE
205
LABOR FORCE [ PEOPLE ]
63.5%
PERCENT IN LABOR FORCE
Income in South Heights borough
Income Overview in South Heights borough
Per Capita Income in South Heights borough is $39,266, while median incomes of families and households are $84,318 and $63,750 respectively.
| Characteristic | Number | Measure |
| Per Capita Income | 333 | $39,266 |
| Median Family Income | 84 | $84,318 |
| Mean Family Income | 84 | $97,256 |
| Median Household Income | 174 | $63,750 |
| Mean Household Income | 174 | $71,870 |
| Income Deficit | 84 | $0 |
| Wage / Income Gap (%) | 333 | 2.31% |
| Wage / Income Gap ($) | 333 | 97.69¢ per $1 |
| Gini / Inequality Index | 333 | 0.38 |
Earnings by Sex in South Heights borough
Average Earnings in South Heights borough are $44,327, $44,135 for men and $45,179 for women, a difference of 2.3%.
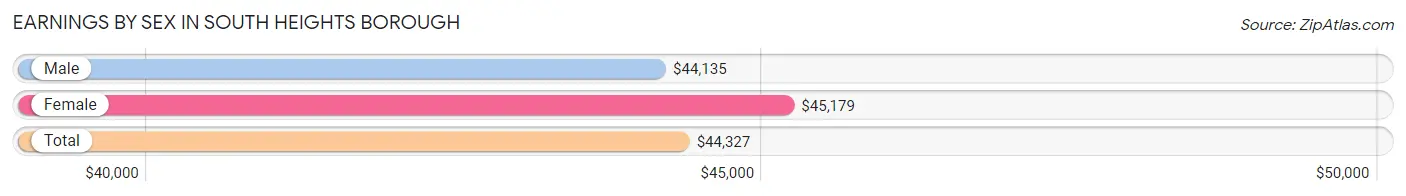
| Sex | Number | Average Earnings |
| Male | 111 (48.9%) | $44,135 |
| Female | 116 (51.1%) | $45,179 |
| Total | 227 (100.0%) | $44,327 |
Earnings by Sex by Income Bracket in South Heights borough
The most common earnings brackets in South Heights borough are $55,000 to $64,999 for men (28 | 25.2%) and $75,000 to $99,999 for women (20 | 17.2%).
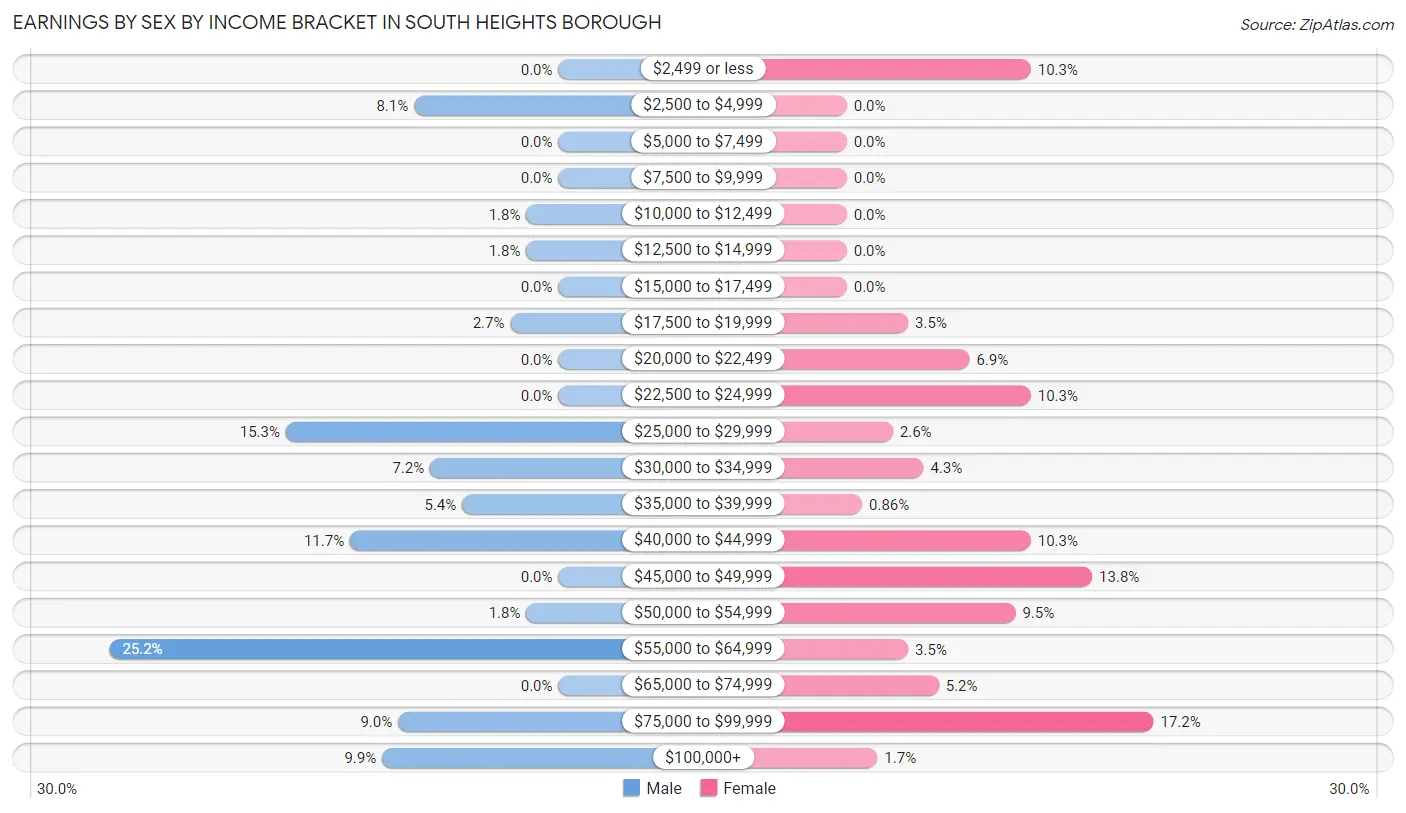
| Income | Male | Female |
| $2,499 or less | 0 (0.0%) | 12 (10.3%) |
| $2,500 to $4,999 | 9 (8.1%) | 0 (0.0%) |
| $5,000 to $7,499 | 0 (0.0%) | 0 (0.0%) |
| $7,500 to $9,999 | 0 (0.0%) | 0 (0.0%) |
| $10,000 to $12,499 | 2 (1.8%) | 0 (0.0%) |
| $12,500 to $14,999 | 2 (1.8%) | 0 (0.0%) |
| $15,000 to $17,499 | 0 (0.0%) | 0 (0.0%) |
| $17,500 to $19,999 | 3 (2.7%) | 4 (3.5%) |
| $20,000 to $22,499 | 0 (0.0%) | 8 (6.9%) |
| $22,500 to $24,999 | 0 (0.0%) | 12 (10.3%) |
| $25,000 to $29,999 | 17 (15.3%) | 3 (2.6%) |
| $30,000 to $34,999 | 8 (7.2%) | 5 (4.3%) |
| $35,000 to $39,999 | 6 (5.4%) | 1 (0.9%) |
| $40,000 to $44,999 | 13 (11.7%) | 12 (10.3%) |
| $45,000 to $49,999 | 0 (0.0%) | 16 (13.8%) |
| $50,000 to $54,999 | 2 (1.8%) | 11 (9.5%) |
| $55,000 to $64,999 | 28 (25.2%) | 4 (3.5%) |
| $65,000 to $74,999 | 0 (0.0%) | 6 (5.2%) |
| $75,000 to $99,999 | 10 (9.0%) | 20 (17.2%) |
| $100,000+ | 11 (9.9%) | 2 (1.7%) |
| Total | 111 (100.0%) | 116 (100.0%) |
Earnings by Sex by Educational Attainment in South Heights borough
Average earnings in South Heights borough are $47,500 for men and $46,250 for women, a difference of 2.6%. Men with an educational attainment of college or associate's degree enjoy the highest average annual earnings of $59,063, while those with bachelor's degree education earn the least with $43,636. Women with an educational attainment of bachelor's degree earn the most with the average annual earnings of $69,583, while those with college or associate's degree education have the smallest earnings of $46,563.
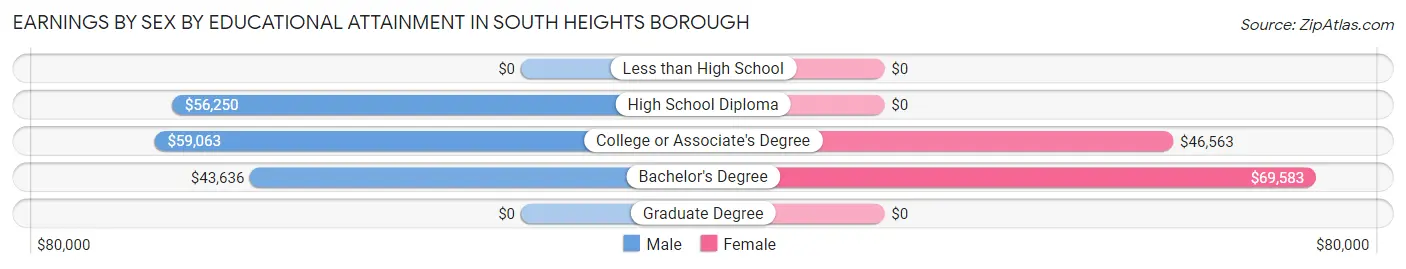
| Educational Attainment | Male Income | Female Income |
| Less than High School | - | - |
| High School Diploma | $56,250 | $0 |
| College or Associate's Degree | $59,063 | $46,563 |
| Bachelor's Degree | $43,636 | $69,583 |
| Graduate Degree | - | - |
| Total | $47,500 | $46,250 |
Family Income in South Heights borough
Family Income Brackets in South Heights borough
According to the South Heights borough family income data, there are 21 families falling into the $100,000 to $149,999 income range, which is the most common income bracket and makes up 25.0% of all families.
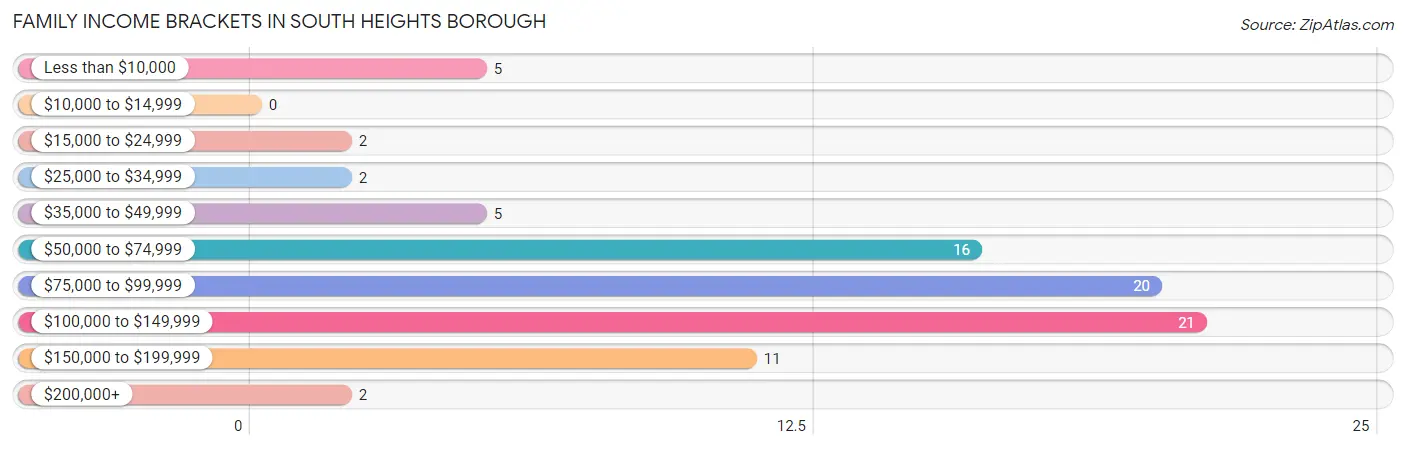
| Income Bracket | # Families | % Families |
| Less than $10,000 | 5 | 6.0% |
| $10,000 to $14,999 | 0 | 0.0% |
| $15,000 to $24,999 | 2 | 2.4% |
| $25,000 to $34,999 | 2 | 2.4% |
| $35,000 to $49,999 | 5 | 6.0% |
| $50,000 to $74,999 | 16 | 19.0% |
| $75,000 to $99,999 | 20 | 23.8% |
| $100,000 to $149,999 | 21 | 25.0% |
| $150,000 to $199,999 | 11 | 13.1% |
| $200,000+ | 2 | 2.4% |
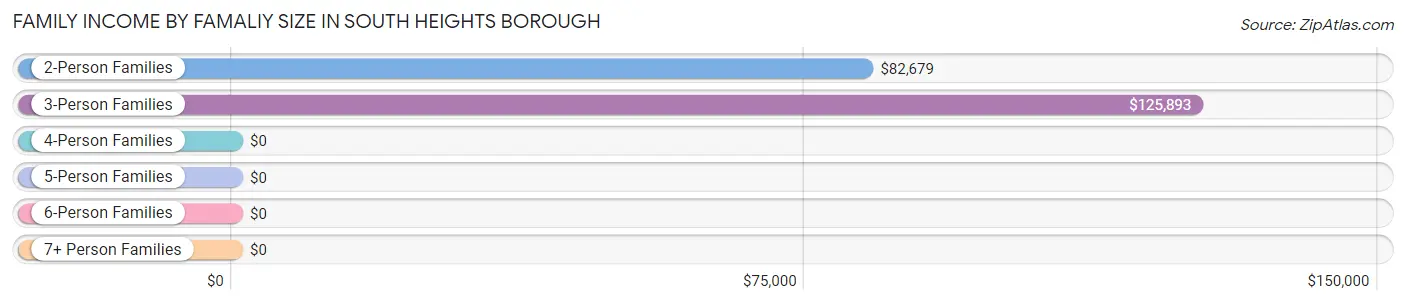
Family Income by Famaliy Size in South Heights borough
3-person families (27 | 32.1%) account for the highest median family income in South Heights borough with $125,893 per family, while 3-person families (27 | 32.1%) have the highest median income of $41,964 per family member.
| Income Bracket | # Families | Median Income |
| 2-Person Families | 49 (58.3%) | $82,679 |
| 3-Person Families | 27 (32.1%) | $125,893 |
| 4-Person Families | 8 (9.5%) | $0 |
| 5-Person Families | 0 (0.0%) | $0 |
| 6-Person Families | 0 (0.0%) | $0 |
| 7+ Person Families | 0 (0.0%) | $0 |
| Total | 84 (100.0%) | $84,318 |
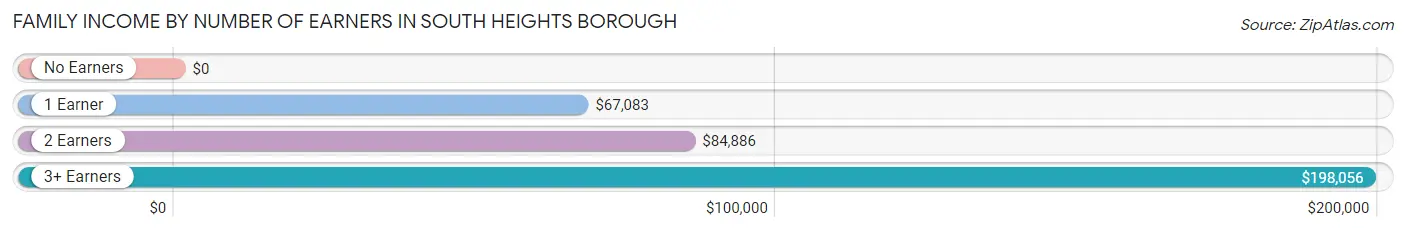
Family Income by Number of Earners in South Heights borough
| Number of Earners | # Families | Median Income |
| No Earners | 16 (19.1%) | $0 |
| 1 Earner | 17 (20.2%) | $67,083 |
| 2 Earners | 33 (39.3%) | $84,886 |
| 3+ Earners | 18 (21.4%) | $198,056 |
| Total | 84 (100.0%) | $84,318 |
Household Income in South Heights borough
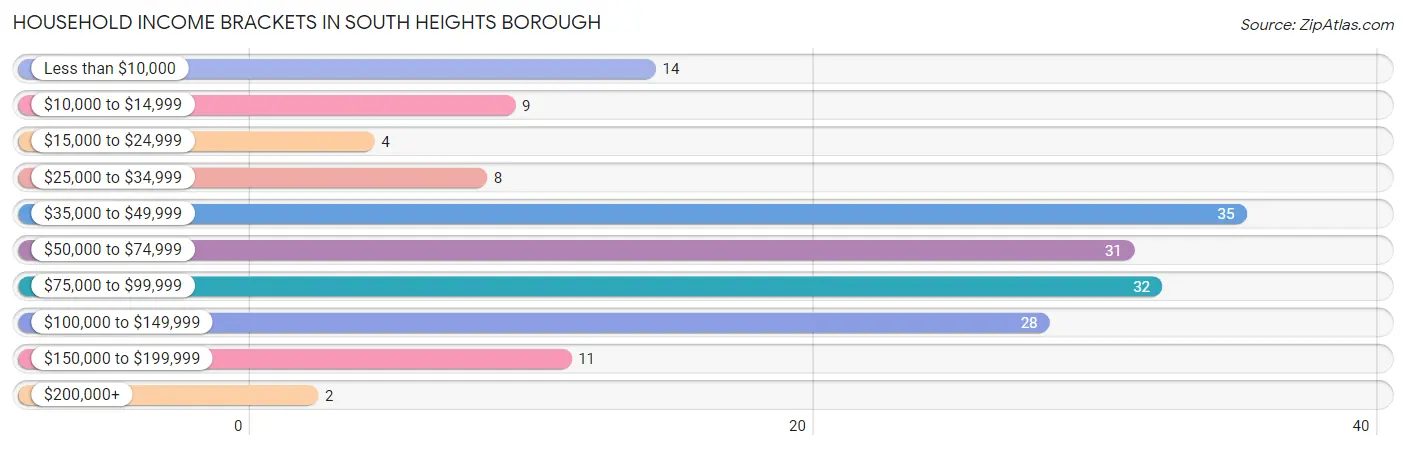
Household Income Brackets in South Heights borough
With 35 households falling in the category, the $35,000 to $49,999 income range is the most frequent in South Heights borough, accounting for 20.1% of all households. In contrast, only 2 households (1.1%) fall into the $200,000+ income bracket, making it the least populous group.
| Income Bracket | # Households | % Households |
| Less than $10,000 | 14 | 8.0% |
| $10,000 to $14,999 | 9 | 5.2% |
| $15,000 to $24,999 | 4 | 2.3% |
| $25,000 to $34,999 | 8 | 4.6% |
| $35,000 to $49,999 | 35 | 20.1% |
| $50,000 to $74,999 | 31 | 17.8% |
| $75,000 to $99,999 | 32 | 18.4% |
| $100,000 to $149,999 | 28 | 16.1% |
| $150,000 to $199,999 | 11 | 6.3% |
| $200,000+ | 2 | 1.1% |
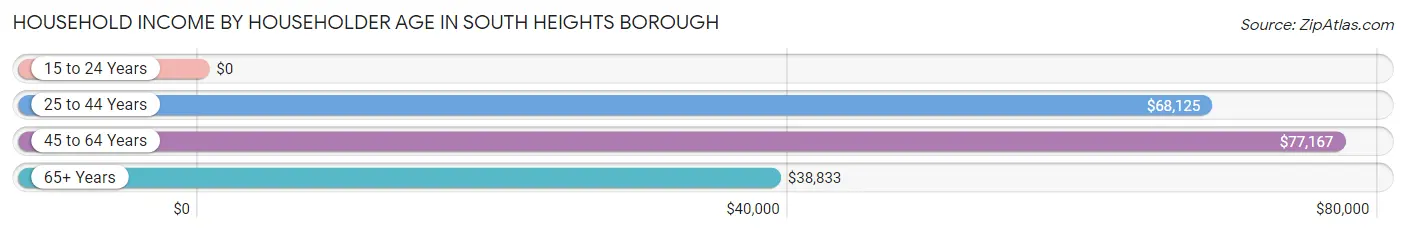
Household Income by Householder Age in South Heights borough
The median household income in South Heights borough is $63,750, with the highest median household income of $77,167 found in the 45 to 64 years age bracket for the primary householder. A total of 88 households (50.6%) fall into this category. Meanwhile, the 15 to 24 years age bracket for the primary householder has the lowest median household income of $0, with 9 households (5.2%) in this group.
| Income Bracket | # Households | Median Income |
| 15 to 24 Years | 9 (5.2%) | $0 |
| 25 to 44 Years | 33 (19.0%) | $68,125 |
| 45 to 64 Years | 88 (50.6%) | $77,167 |
| 65+ Years | 44 (25.3%) | $38,833 |
| Total | 174 (100.0%) | $63,750 |
Poverty in South Heights borough
Income Below Poverty by Sex and Age in South Heights borough
With 8.0% poverty level for males and 17.6% for females among the residents of South Heights borough, 25 to 34 year old males and 35 to 44 year old females are the most vulnerable to poverty, with 7 males (23.3%) and 2 females (50.0%) in their respective age groups living below the poverty level.
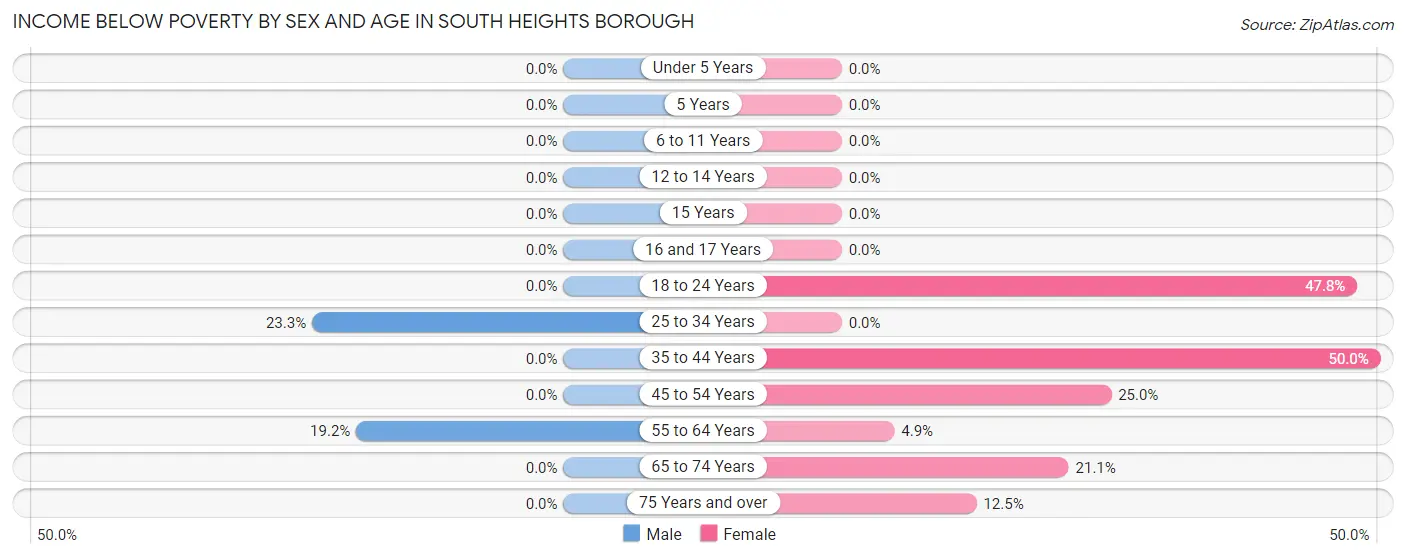
| Age Bracket | Male | Female |
| Under 5 Years | 0 (0.0%) | 0 (0.0%) |
| 5 Years | 0 (0.0%) | 0 (0.0%) |
| 6 to 11 Years | 0 (0.0%) | 0 (0.0%) |
| 12 to 14 Years | 0 (0.0%) | 0 (0.0%) |
| 15 Years | 0 (0.0%) | 0 (0.0%) |
| 16 and 17 Years | 0 (0.0%) | 0 (0.0%) |
| 18 to 24 Years | 0 (0.0%) | 11 (47.8%) |
| 25 to 34 Years | 7 (23.3%) | 0 (0.0%) |
| 35 to 44 Years | 0 (0.0%) | 2 (50.0%) |
| 45 to 54 Years | 0 (0.0%) | 10 (25.0%) |
| 55 to 64 Years | 5 (19.2%) | 2 (4.9%) |
| 65 to 74 Years | 0 (0.0%) | 4 (21.0%) |
| 75 Years and over | 0 (0.0%) | 3 (12.5%) |
| Total | 12 (8.0%) | 32 (17.6%) |
Income Above Poverty by Sex and Age in South Heights borough
According to the poverty statistics in South Heights borough, males aged under 5 years and females aged 6 to 11 years are the age groups that are most secure financially, with 100.0% of males and 100.0% of females in these age groups living above the poverty line.
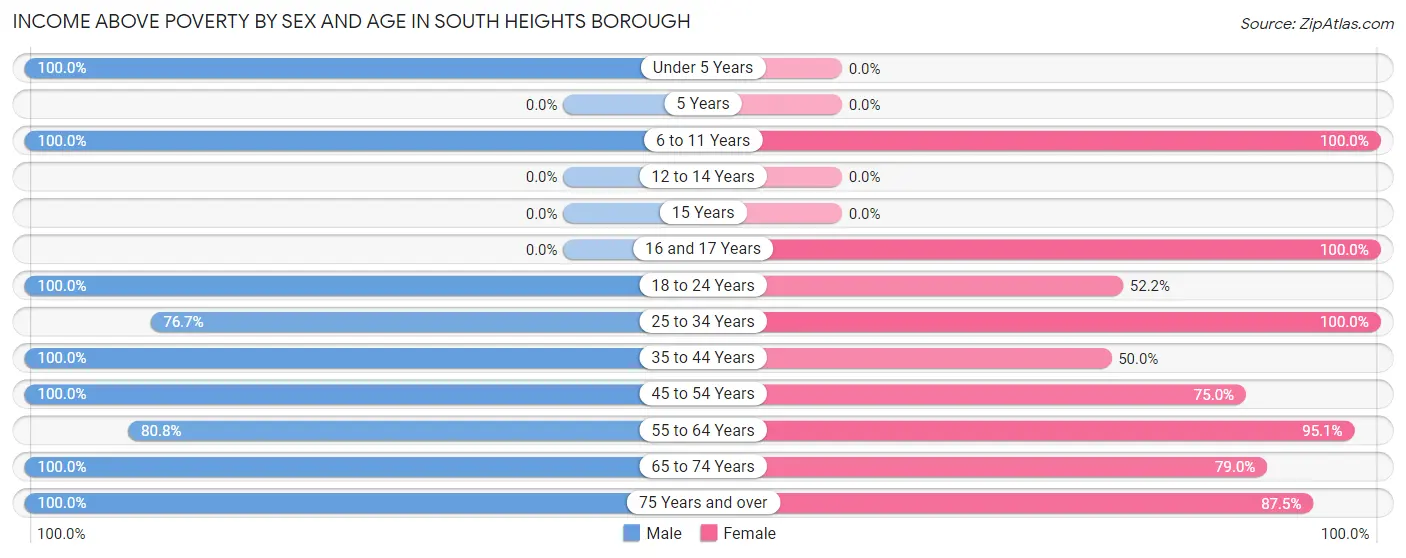
| Age Bracket | Male | Female |
| Under 5 Years | 5 (100.0%) | 0 (0.0%) |
| 5 Years | 0 (0.0%) | 0 (0.0%) |
| 6 to 11 Years | 2 (100.0%) | 3 (100.0%) |
| 12 to 14 Years | 0 (0.0%) | 0 (0.0%) |
| 15 Years | 0 (0.0%) | 0 (0.0%) |
| 16 and 17 Years | 0 (0.0%) | 6 (100.0%) |
| 18 to 24 Years | 13 (100.0%) | 12 (52.2%) |
| 25 to 34 Years | 23 (76.7%) | 22 (100.0%) |
| 35 to 44 Years | 7 (100.0%) | 2 (50.0%) |
| 45 to 54 Years | 45 (100.0%) | 30 (75.0%) |
| 55 to 64 Years | 21 (80.8%) | 39 (95.1%) |
| 65 to 74 Years | 16 (100.0%) | 15 (78.9%) |
| 75 Years and over | 7 (100.0%) | 21 (87.5%) |
| Total | 139 (92.0%) | 150 (82.4%) |
Income Below Poverty Among Married-Couple Families in South Heights borough
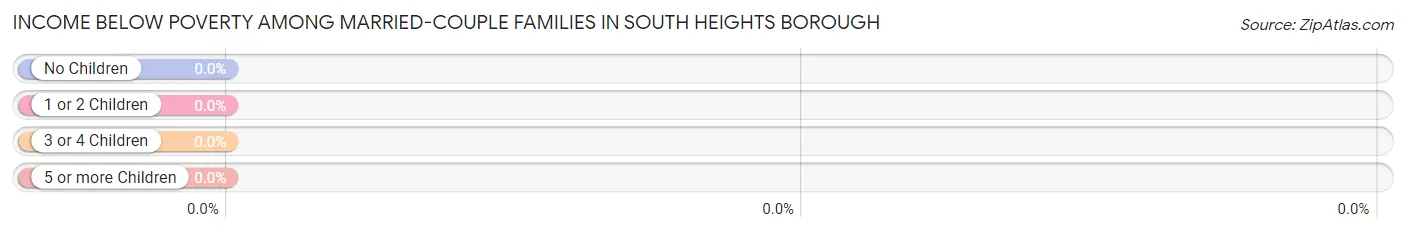
| Children | Above Poverty | Below Poverty |
| No Children | 62 (100.0%) | 0 (0.0%) |
| 1 or 2 Children | 8 (100.0%) | 0 (0.0%) |
| 3 or 4 Children | 0 (0.0%) | 0 (0.0%) |
| 5 or more Children | 0 (0.0%) | 0 (0.0%) |
| Total | 70 (100.0%) | 0 (0.0%) |
Income Below Poverty Among Single-Parent Households in South Heights borough
According to the poverty data in South Heights borough, 71.4% or 5 single-father households and 28.6% or 2 single-mother households are living below the poverty line. Among single-father households, those with no children have the highest poverty rate, with 5 households (100.0%) experiencing poverty. Likewise, among single-mother households, those with no children have the highest poverty rate, with 2 households (28.6%) falling below the poverty line.
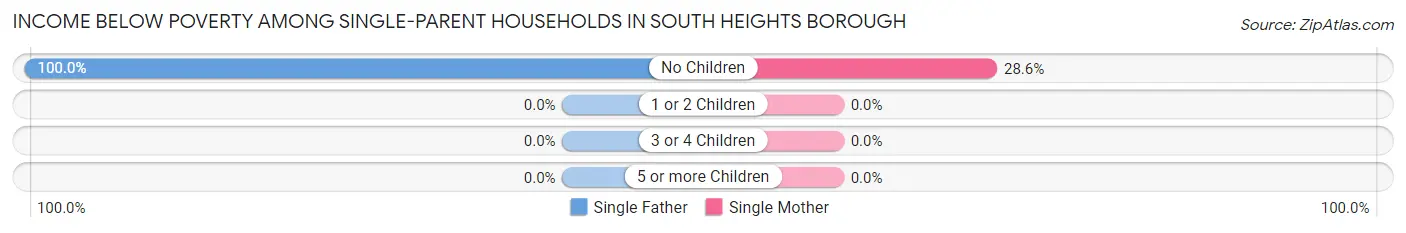
| Children | Single Father | Single Mother |
| No Children | 5 (100.0%) | 2 (28.6%) |
| 1 or 2 Children | 0 (0.0%) | 0 (0.0%) |
| 3 or 4 Children | 0 (0.0%) | 0 (0.0%) |
| 5 or more Children | 0 (0.0%) | 0 (0.0%) |
| Total | 5 (71.4%) | 2 (28.6%) |
Income Below Poverty Among Married-Couple vs Single-Parent Households in South Heights borough
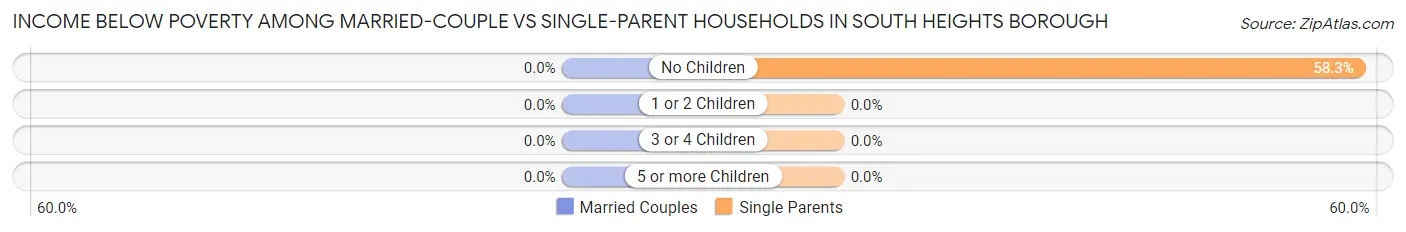
| Children | Married-Couple Families | Single-Parent Households |
| No Children | 0 (0.0%) | 7 (58.3%) |
| 1 or 2 Children | 0 (0.0%) | 0 (0.0%) |
| 3 or 4 Children | 0 (0.0%) | 0 (0.0%) |
| 5 or more Children | 0 (0.0%) | 0 (0.0%) |
| Total | 0 (0.0%) | 7 (50.0%) |
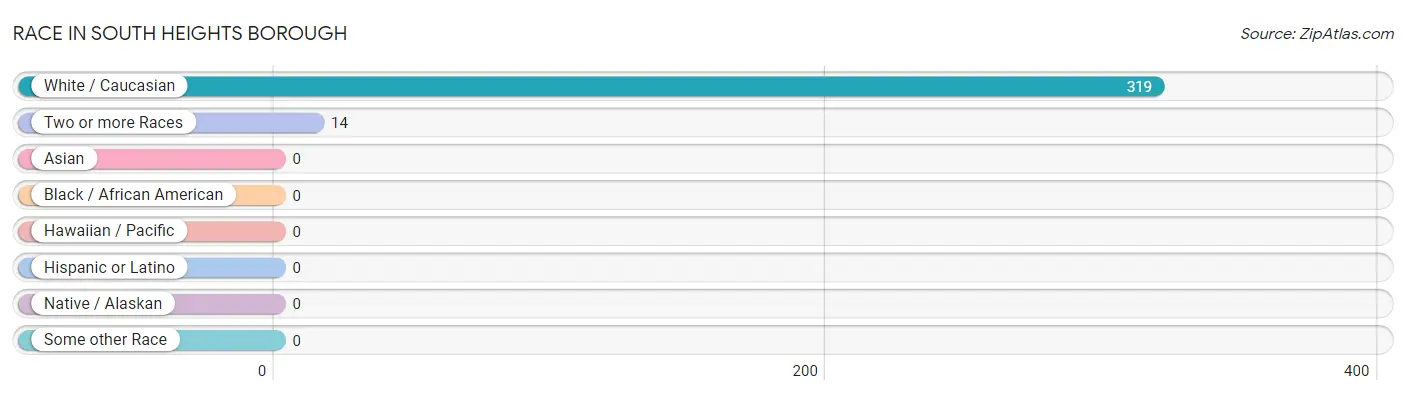
Race in South Heights borough
The most populous races in South Heights borough are White / Caucasian (319 | 95.8%), and Two or more Races (14 | 4.2%).
| Race | # Population | % Population |
| Asian | 0 | 0.0% |
| Black / African American | 0 | 0.0% |
| Hawaiian / Pacific | 0 | 0.0% |
| Hispanic or Latino | 0 | 0.0% |
| Native / Alaskan | 0 | 0.0% |
| White / Caucasian | 319 | 95.8% |
| Two or more Races | 14 | 4.2% |
| Some other Race | 0 | 0.0% |
| Total | 333 | 100.0% |
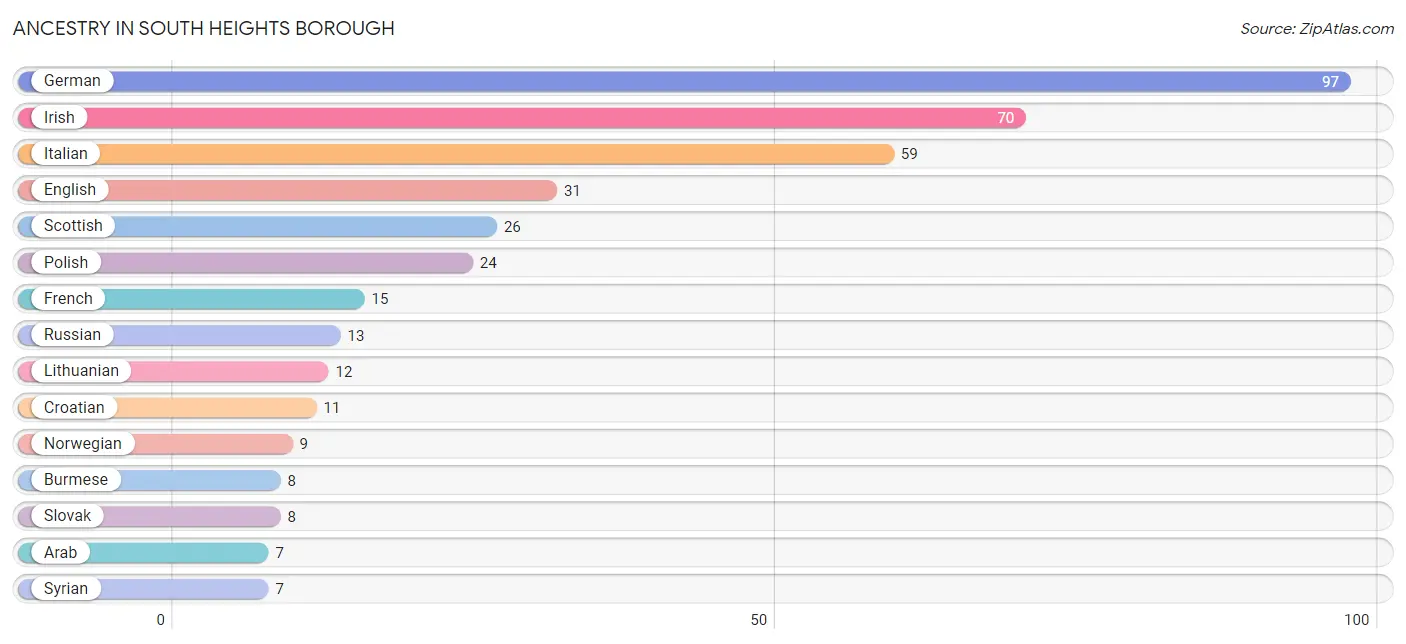
Ancestry in South Heights borough
The most populous ancestries reported in South Heights borough are German (97 | 29.1%), Irish (70 | 21.0%), Italian (59 | 17.7%), English (31 | 9.3%), and Scottish (26 | 7.8%), together accounting for 85.0% of all South Heights borough residents.
| Ancestry | # Population | % Population |
| American | 6 | 1.8% |
| Arab | 7 | 2.1% |
| Burmese | 8 | 2.4% |
| Croatian | 11 | 3.3% |
| Dutch | 5 | 1.5% |
| Eastern European | 1 | 0.3% |
| English | 31 | 9.3% |
| European | 3 | 0.9% |
| French | 15 | 4.5% |
| German | 97 | 29.1% |
| Greek | 2 | 0.6% |
| Hungarian | 1 | 0.3% |
| Irish | 70 | 21.0% |
| Italian | 59 | 17.7% |
| Lithuanian | 12 | 3.6% |
| Norwegian | 9 | 2.7% |
| Polish | 24 | 7.2% |
| Portuguese | 2 | 0.6% |
| Russian | 13 | 3.9% |
| Scotch-Irish | 5 | 1.5% |
| Scottish | 26 | 7.8% |
| Serbian | 4 | 1.2% |
| Sioux | 1 | 0.3% |
| Slovak | 8 | 2.4% |
| Swiss | 1 | 0.3% |
| Syrian | 7 | 2.1% |
| Welsh | 3 | 0.9% | View All 27 Rows |
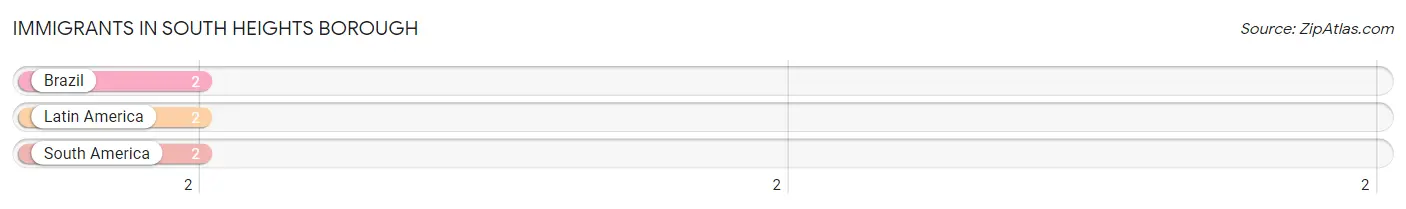
Immigrants in South Heights borough
The most numerous immigrant groups reported in South Heights borough came from Brazil (2 | 0.6%), Latin America (2 | 0.6%), and South America (2 | 0.6%), together accounting for 1.8% of all South Heights borough residents.
| Immigration Origin | # Population | % Population |
| Brazil | 2 | 0.6% |
| Latin America | 2 | 0.6% |
| South America | 2 | 0.6% | View All 3 Rows |
Sex and Age in South Heights borough
Sex and Age in South Heights borough
The most populous age groups in South Heights borough are 50 to 54 Years (23 | 15.2%) for men and 55 to 59 Years (36 | 19.8%) for women.
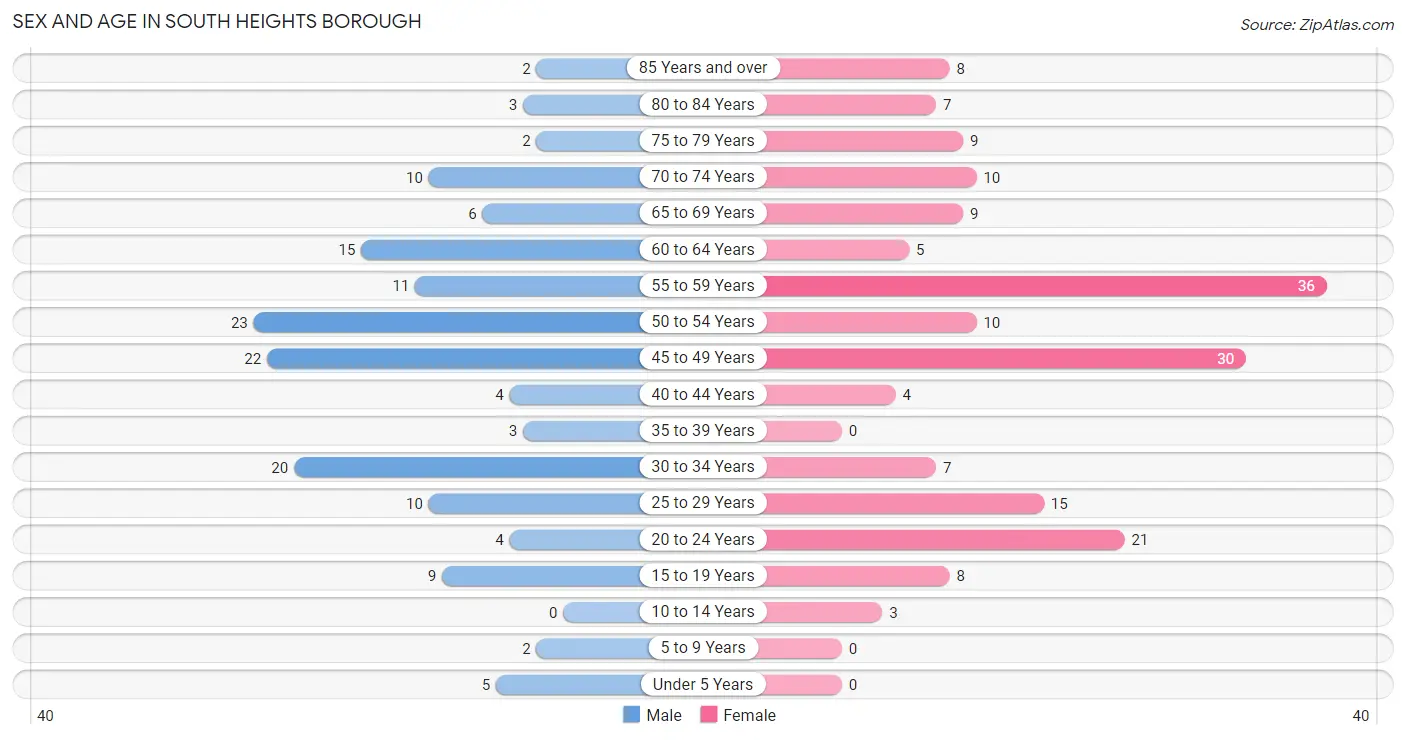
| Age Bracket | Male | Female |
| Under 5 Years | 5 (3.3%) | 0 (0.0%) |
| 5 to 9 Years | 2 (1.3%) | 0 (0.0%) |
| 10 to 14 Years | 0 (0.0%) | 3 (1.7%) |
| 15 to 19 Years | 9 (6.0%) | 8 (4.4%) |
| 20 to 24 Years | 4 (2.6%) | 21 (11.5%) |
| 25 to 29 Years | 10 (6.6%) | 15 (8.2%) |
| 30 to 34 Years | 20 (13.3%) | 7 (3.8%) |
| 35 to 39 Years | 3 (2.0%) | 0 (0.0%) |
| 40 to 44 Years | 4 (2.6%) | 4 (2.2%) |
| 45 to 49 Years | 22 (14.6%) | 30 (16.5%) |
| 50 to 54 Years | 23 (15.2%) | 10 (5.5%) |
| 55 to 59 Years | 11 (7.3%) | 36 (19.8%) |
| 60 to 64 Years | 15 (9.9%) | 5 (2.8%) |
| 65 to 69 Years | 6 (4.0%) | 9 (5.0%) |
| 70 to 74 Years | 10 (6.6%) | 10 (5.5%) |
| 75 to 79 Years | 2 (1.3%) | 9 (5.0%) |
| 80 to 84 Years | 3 (2.0%) | 7 (3.8%) |
| 85 Years and over | 2 (1.3%) | 8 (4.4%) |
| Total | 151 (100.0%) | 182 (100.0%) |
Families and Households in South Heights borough
Median Family Size in South Heights borough
The median family size in South Heights borough is 2.67 persons per family, with single male/father families (7 | 8.3%) accounting for the largest median family size of 3.29 persons per family. On the other hand, single female/mother families (7 | 8.3%) represent the smallest median family size with 2.00 persons per family.
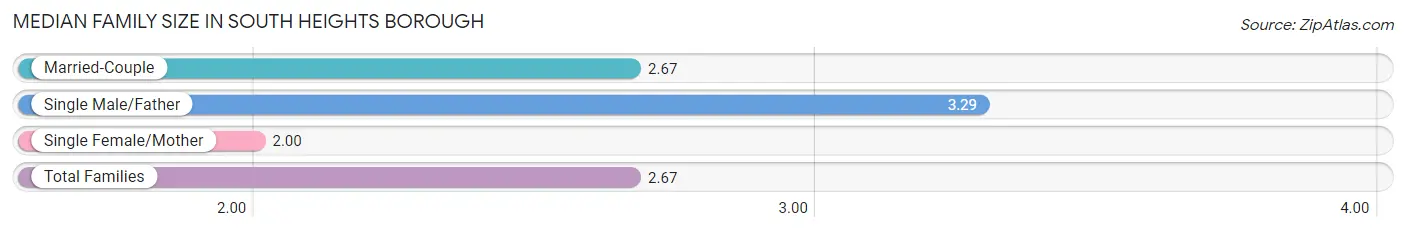
| Family Type | # Families | Family Size |
| Married-Couple | 70 (83.3%) | 2.67 |
| Single Male/Father | 7 (8.3%) | 3.29 |
| Single Female/Mother | 7 (8.3%) | 2.00 |
| Total Families | 84 (100.0%) | 2.67 |
Median Household Size in South Heights borough
The median household size in South Heights borough is 1.91 persons per household, with single male/father households (7 | 4.0%) accounting for the largest median household size of 3.29 persons per household. non-family households (90 | 51.7%) represent the smallest median household size with 1.21 persons per household.
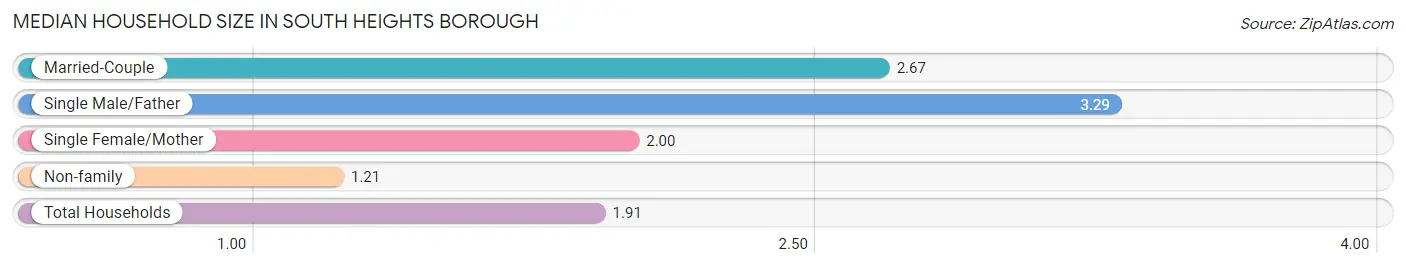
| Household Type | # Households | Household Size |
| Married-Couple | 70 (40.2%) | 2.67 |
| Single Male/Father | 7 (4.0%) | 3.29 |
| Single Female/Mother | 7 (4.0%) | 2.00 |
| Non-family | 90 (51.7%) | 1.21 |
| Total Households | 174 (100.0%) | 1.91 |
Household Size by Marriage Status in South Heights borough
Out of a total of 174 households in South Heights borough, 84 (48.3%) are family households, while 90 (51.7%) are nonfamily households. The most numerous type of family households are 2-person households, comprising 49, and the most common type of nonfamily households are 1-person households, comprising 75.
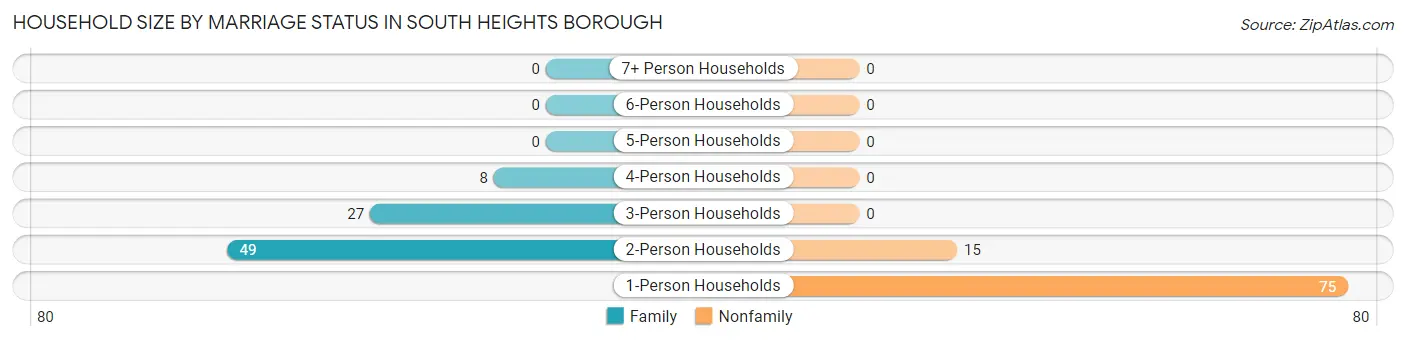
| Household Size | Family Households | Nonfamily Households |
| 1-Person Households | - | 75 (43.1%) |
| 2-Person Households | 49 (28.2%) | 15 (8.6%) |
| 3-Person Households | 27 (15.5%) | 0 (0.0%) |
| 4-Person Households | 8 (4.6%) | 0 (0.0%) |
| 5-Person Households | 0 (0.0%) | 0 (0.0%) |
| 6-Person Households | 0 (0.0%) | 0 (0.0%) |
| 7+ Person Households | 0 (0.0%) | 0 (0.0%) |
| Total | 84 (48.3%) | 90 (51.7%) |
Female Fertility in South Heights borough
Fertility by Age in South Heights borough
| Age Bracket | Women with Births | Births / 1,000 Women |
| 15 to 19 years | 0 (0.0%) | 0.0 |
| 20 to 34 years | 0 (0.0%) | 0.0 |
| 35 to 50 years | 0 (0.0%) | 0.0 |
| Total | 0 (0.0%) | 0.0 |
Fertility by Age by Marriage Status in South Heights borough
| Age Bracket | Married | Unmarried |
| 15 to 19 years | 0 (0.0%) | 0 (0.0%) |
| 20 to 34 years | 0 (0.0%) | 0 (0.0%) |
| 35 to 50 years | 0 (0.0%) | 0 (0.0%) |
| Total | 0 (0.0%) | 0 (0.0%) |
Fertility by Education in South Heights borough
| Educational Attainment | Women with Births | Births / 1,000 Women |
| Less than High School | 0 (0.0%) | 0.0 |
| High School Diploma | 0 (0.0%) | 0.0 |
| College or Associate's Degree | 0 (0.0%) | 0.0 |
| Bachelor's Degree | 0 (0.0%) | 0.0 |
| Graduate Degree | 0 (0.0%) | 0.0 |
| Total | 0 (0.0%) | 0.0 |
Fertility by Education by Marriage Status in South Heights borough
| Educational Attainment | Married | Unmarried |
| Less than High School | 0 (0.0%) | 0 (0.0%) |
| High School Diploma | 0 (0.0%) | 0 (0.0%) |
| College or Associate's Degree | 0 (0.0%) | 0 (0.0%) |
| Bachelor's Degree | 0 (0.0%) | 0 (0.0%) |
| Graduate Degree | 0 (0.0%) | 0 (0.0%) |
| Total | 0 (0.0%) | 0 (0.0%) |
Employment Characteristics in South Heights borough
Employment by Class of Employer in South Heights borough
Among the 196 employed individuals in South Heights borough, private company employees (177 | 90.3%), not-for-profit organizations (15 | 7.6%), and local government employees (2 | 1.0%) make up the most common classes of employment.
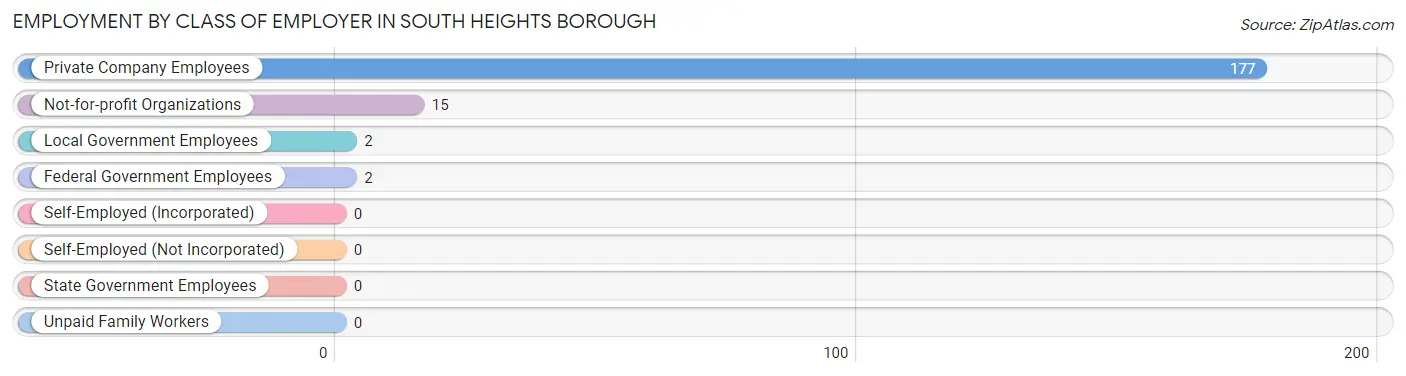
| Employer Class | # Employees | % Employees |
| Private Company Employees | 177 | 90.3% |
| Self-Employed (Incorporated) | 0 | 0.0% |
| Self-Employed (Not Incorporated) | 0 | 0.0% |
| Not-for-profit Organizations | 15 | 7.6% |
| Local Government Employees | 2 | 1.0% |
| State Government Employees | 0 | 0.0% |
| Federal Government Employees | 2 | 1.0% |
| Unpaid Family Workers | 0 | 0.0% |
| Total | 196 | 100.0% |
Employment Status by Age in South Heights borough
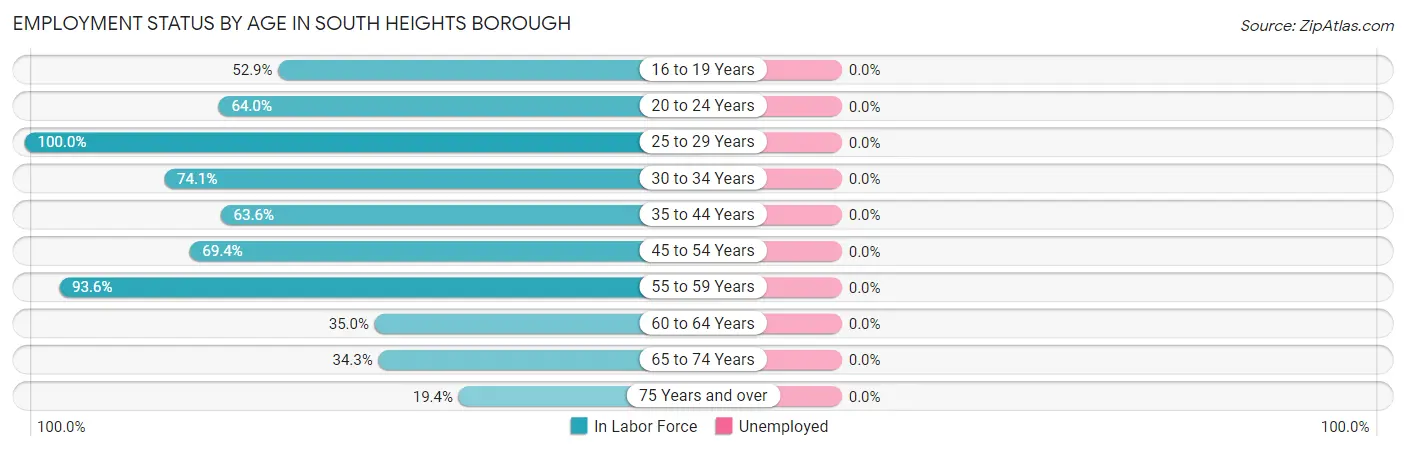
| Age Bracket | In Labor Force | Unemployed |
| 16 to 19 Years | 9 (52.9%) | 0 (0.0%) |
| 20 to 24 Years | 16 (64.0%) | 0 (0.0%) |
| 25 to 29 Years | 25 (100.0%) | 0 (0.0%) |
| 30 to 34 Years | 20 (74.1%) | 0 (0.0%) |
| 35 to 44 Years | 7 (63.6%) | 0 (0.0%) |
| 45 to 54 Years | 59 (69.4%) | 0 (0.0%) |
| 55 to 59 Years | 44 (93.6%) | 0 (0.0%) |
| 60 to 64 Years | 7 (35.0%) | 0 (0.0%) |
| 65 to 74 Years | 12 (34.3%) | 0 (0.0%) |
| 75 Years and over | 6 (19.4%) | 0 (0.0%) |
| Total | 205 (63.5%) | 0 (0.0%) |
Employment Status by Educational Attainment in South Heights borough
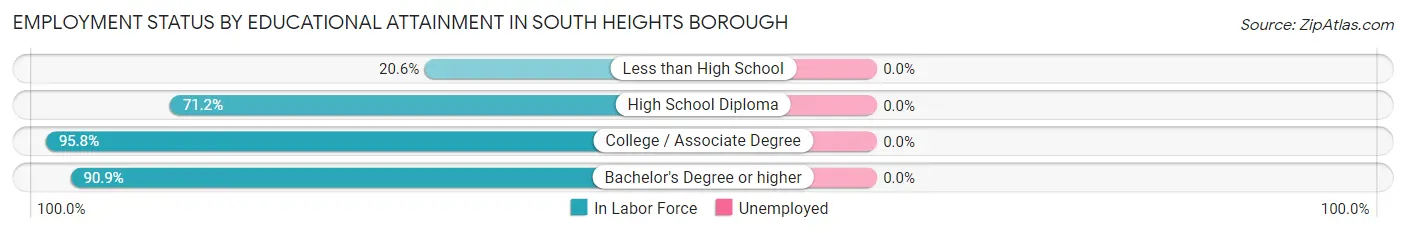
| Educational Attainment | In Labor Force | Unemployed |
| Less than High School | 7 (20.6%) | 0 (0.0%) |
| High School Diploma | 47 (71.2%) | 0 (0.0%) |
| College / Associate Degree | 68 (95.8%) | 0 (0.0%) |
| Bachelor's Degree or higher | 40 (90.9%) | 0 (0.0%) |
| Total | 162 (75.3%) | 0 (0.0%) |
Employment Occupations by Sex in South Heights borough
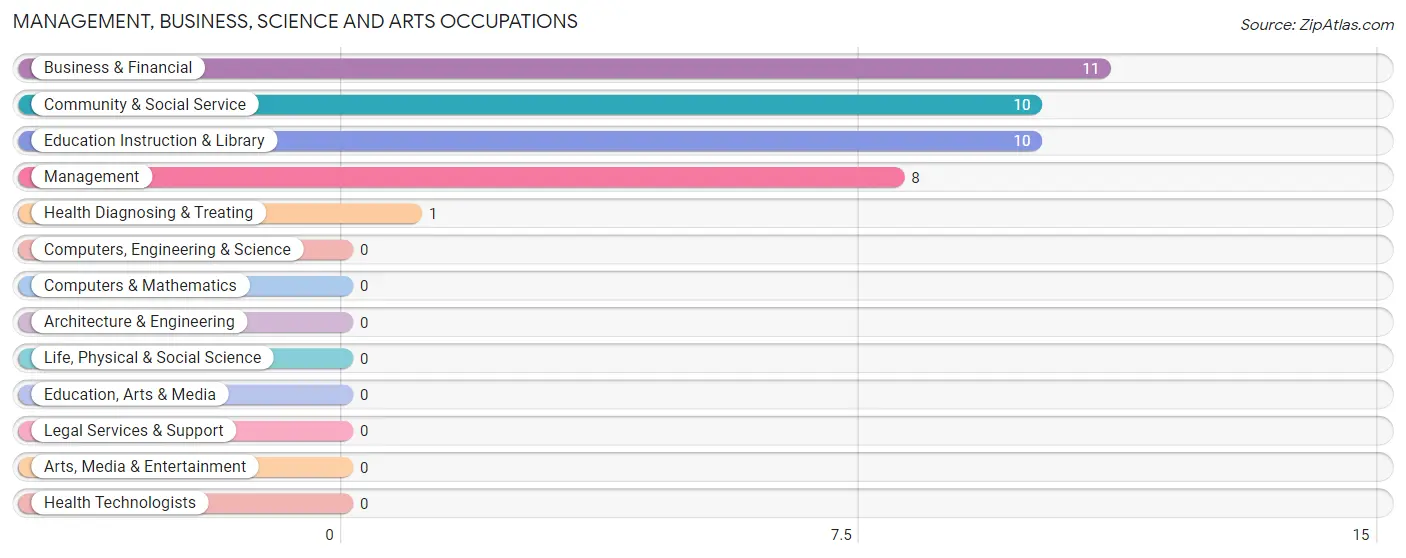
Management, Business, Science and Arts Occupations
The most common Management, Business, Science and Arts occupations in South Heights borough are Business & Financial (11 | 5.4%), Community & Social Service (10 | 4.9%), Education Instruction & Library (10 | 4.9%), Management (8 | 3.9%), and Health Diagnosing & Treating (1 | 0.5%).
Management, Business, Science and Arts Occupations by Sex
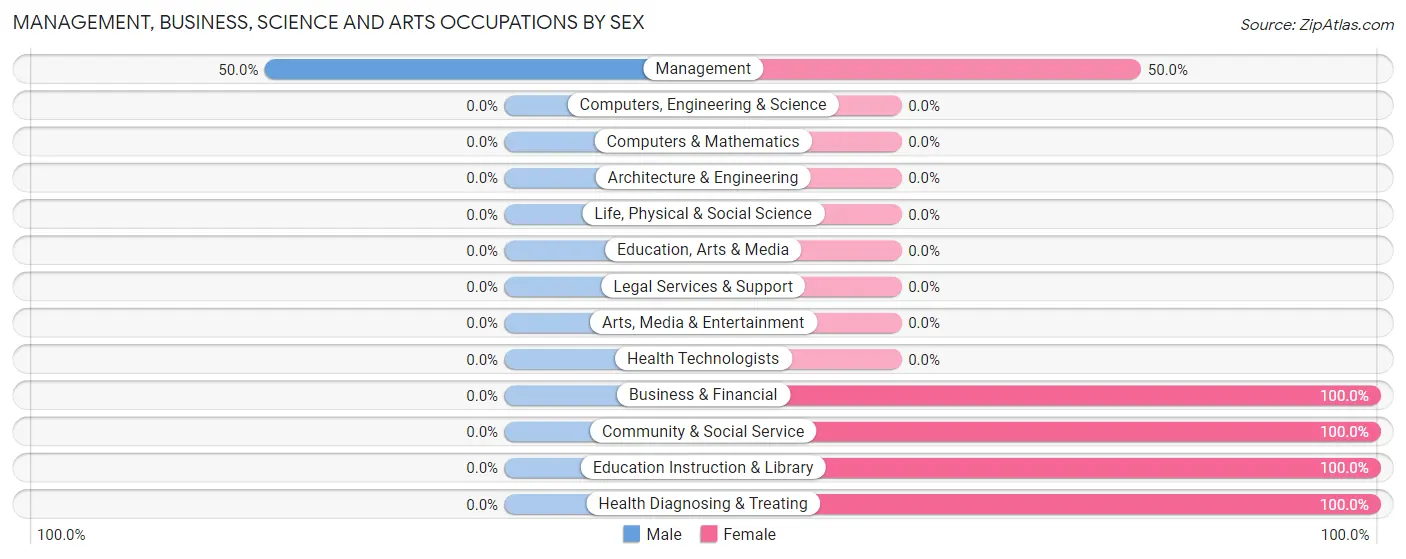
| Occupation | Male | Female |
| Management | 4 (50.0%) | 4 (50.0%) |
| Business & Financial | 0 (0.0%) | 11 (100.0%) |
| Computers, Engineering & Science | 0 (0.0%) | 0 (0.0%) |
| Computers & Mathematics | 0 (0.0%) | 0 (0.0%) |
| Architecture & Engineering | 0 (0.0%) | 0 (0.0%) |
| Life, Physical & Social Science | 0 (0.0%) | 0 (0.0%) |
| Community & Social Service | 0 (0.0%) | 10 (100.0%) |
| Education, Arts & Media | 0 (0.0%) | 0 (0.0%) |
| Legal Services & Support | 0 (0.0%) | 0 (0.0%) |
| Education Instruction & Library | 0 (0.0%) | 10 (100.0%) |
| Arts, Media & Entertainment | 0 (0.0%) | 0 (0.0%) |
| Health Diagnosing & Treating | 0 (0.0%) | 1 (100.0%) |
| Health Technologists | 0 (0.0%) | 0 (0.0%) |
| Total (Category) | 4 (13.3%) | 26 (86.7%) |
| Total (Overall) | 101 (49.3%) | 104 (50.7%) |
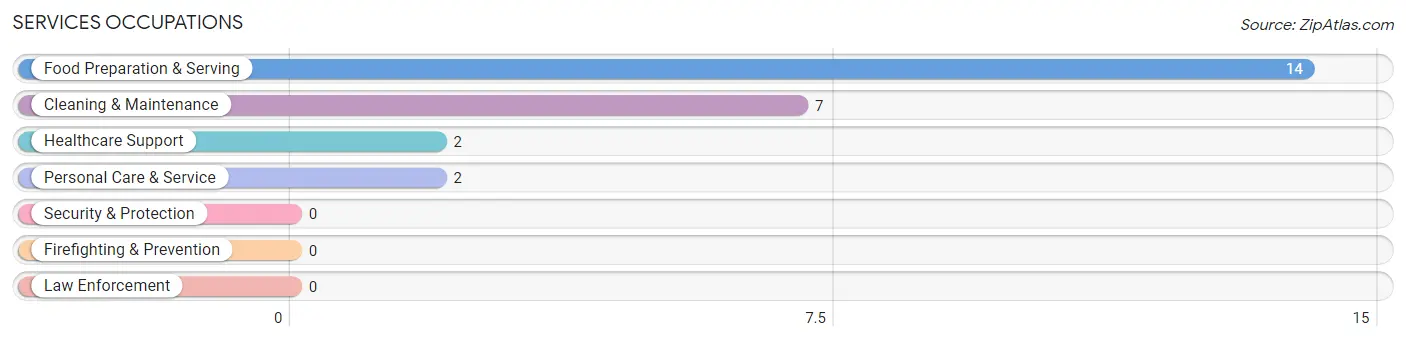
Services Occupations
The most common Services occupations in South Heights borough are Food Preparation & Serving (14 | 6.8%), Cleaning & Maintenance (7 | 3.4%), Healthcare Support (2 | 1.0%), and Personal Care & Service (2 | 1.0%).
Services Occupations by Sex
Within the Services occupations in South Heights borough, the most male-oriented occupations are Cleaning & Maintenance (100.0%), Healthcare Support (50.0%), and Food Preparation & Serving (35.7%), while the most female-oriented occupations are Personal Care & Service (100.0%), Food Preparation & Serving (64.3%), and Healthcare Support (50.0%).
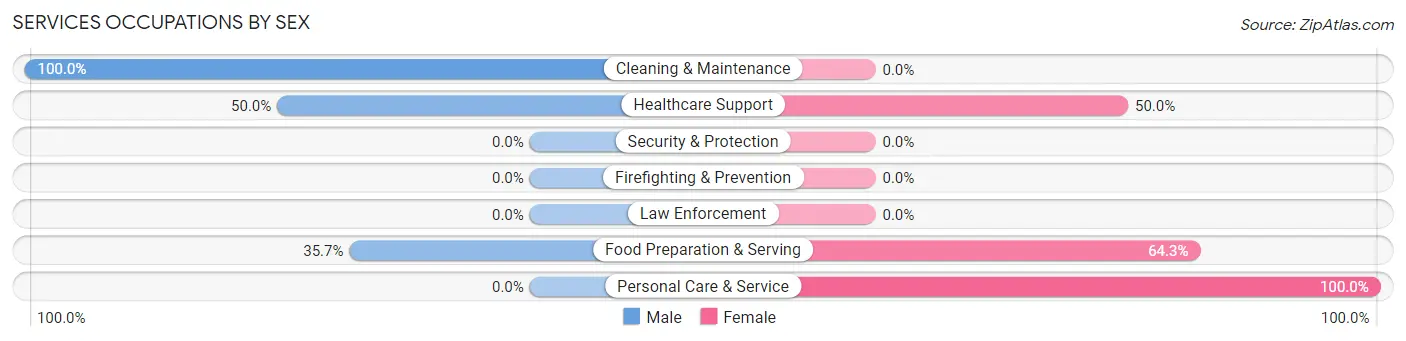
| Occupation | Male | Female |
| Healthcare Support | 1 (50.0%) | 1 (50.0%) |
| Security & Protection | 0 (0.0%) | 0 (0.0%) |
| Firefighting & Prevention | 0 (0.0%) | 0 (0.0%) |
| Law Enforcement | 0 (0.0%) | 0 (0.0%) |
| Food Preparation & Serving | 5 (35.7%) | 9 (64.3%) |
| Cleaning & Maintenance | 7 (100.0%) | 0 (0.0%) |
| Personal Care & Service | 0 (0.0%) | 2 (100.0%) |
| Total (Category) | 13 (52.0%) | 12 (48.0%) |
| Total (Overall) | 101 (49.3%) | 104 (50.7%) |
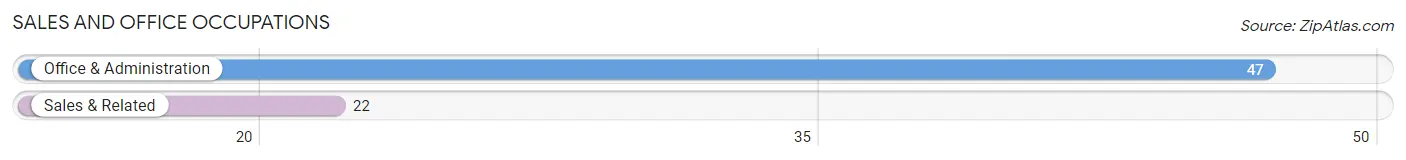
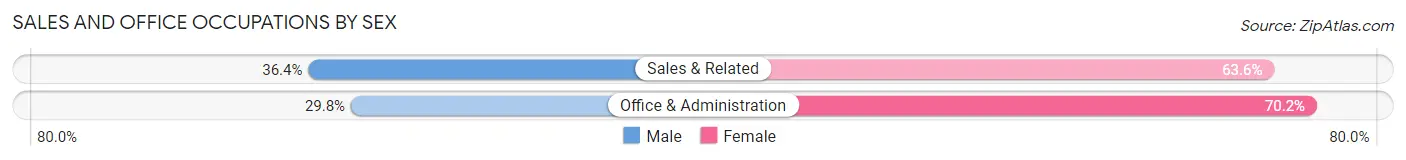
Sales and Office Occupations
The most common Sales and Office occupations in South Heights borough are Office & Administration (47 | 22.9%), and Sales & Related (22 | 10.7%).
Sales and Office Occupations by Sex
| Occupation | Male | Female |
| Sales & Related | 8 (36.4%) | 14 (63.6%) |
| Office & Administration | 14 (29.8%) | 33 (70.2%) |
| Total (Category) | 22 (31.9%) | 47 (68.1%) |
| Total (Overall) | 101 (49.3%) | 104 (50.7%) |
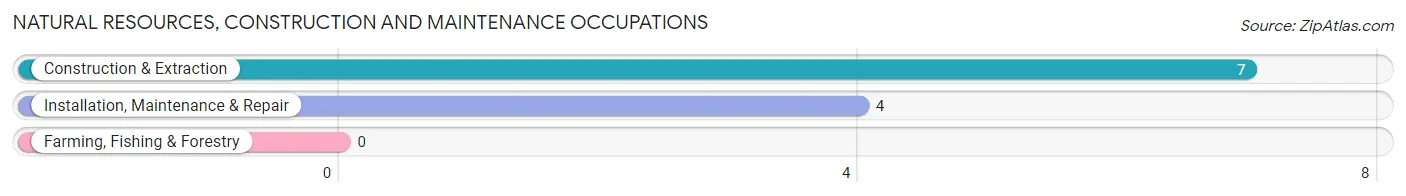
Natural Resources, Construction and Maintenance Occupations
The most common Natural Resources, Construction and Maintenance occupations in South Heights borough are Construction & Extraction (7 | 3.4%), and Installation, Maintenance & Repair (4 | 1.9%).
Natural Resources, Construction and Maintenance Occupations by Sex
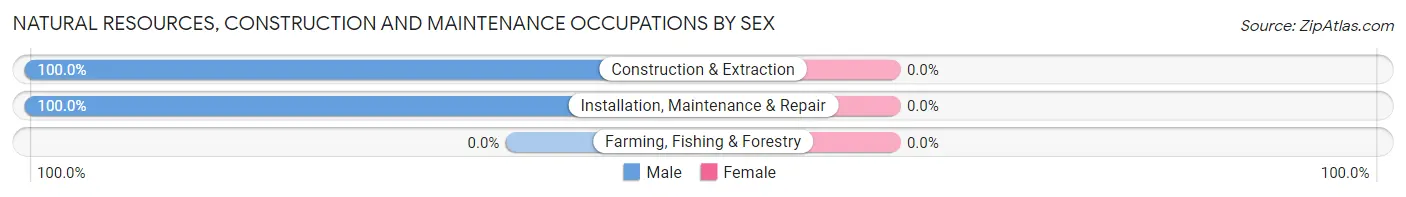
| Occupation | Male | Female |
| Farming, Fishing & Forestry | 0 (0.0%) | 0 (0.0%) |
| Construction & Extraction | 7 (100.0%) | 0 (0.0%) |
| Installation, Maintenance & Repair | 4 (100.0%) | 0 (0.0%) |
| Total (Category) | 11 (100.0%) | 0 (0.0%) |
| Total (Overall) | 101 (49.3%) | 104 (50.7%) |
Production, Transportation and Moving Occupations
The most common Production, Transportation and Moving occupations in South Heights borough are Material Moving (46 | 22.4%), Production (20 | 9.8%), and Transportation (4 | 1.9%).
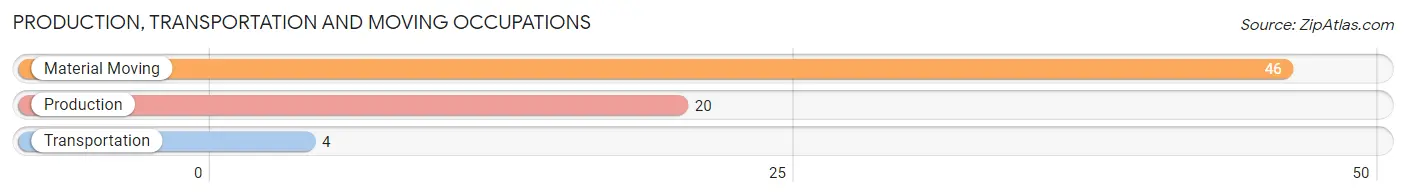
Production, Transportation and Moving Occupations by Sex
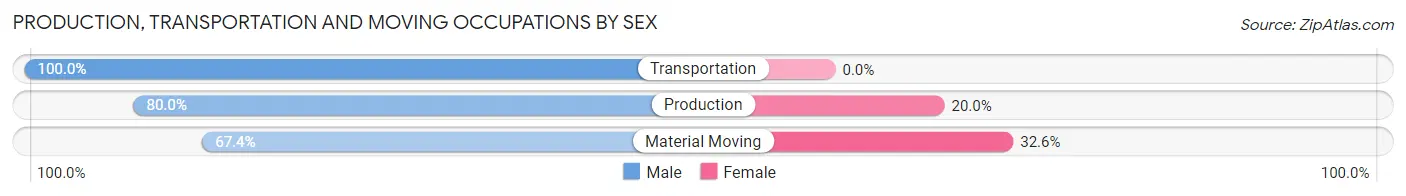
| Occupation | Male | Female |
| Production | 16 (80.0%) | 4 (20.0%) |
| Transportation | 4 (100.0%) | 0 (0.0%) |
| Material Moving | 31 (67.4%) | 15 (32.6%) |
| Total (Category) | 51 (72.9%) | 19 (27.1%) |
| Total (Overall) | 101 (49.3%) | 104 (50.7%) |
Employment Industries by Sex in South Heights borough
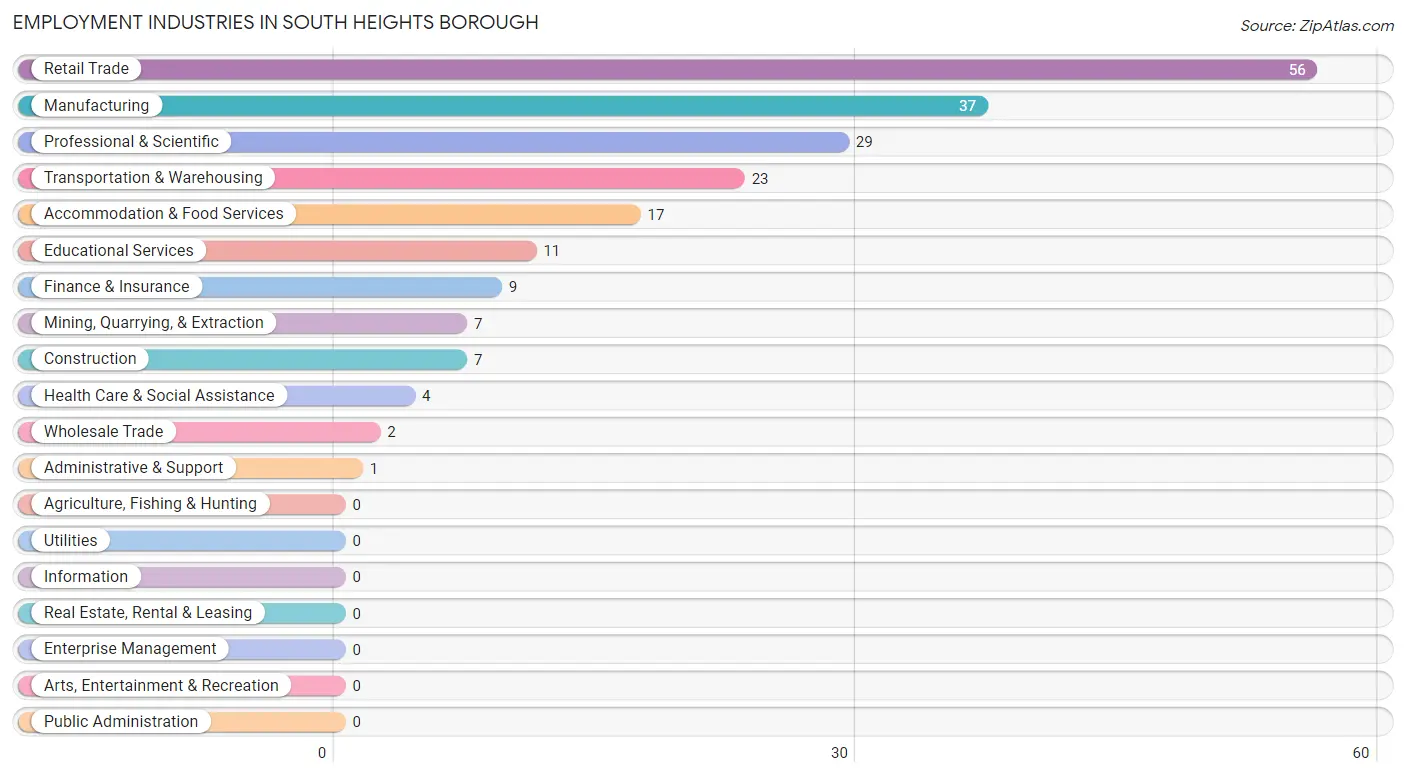
Employment Industries in South Heights borough
The major employment industries in South Heights borough include Retail Trade (56 | 27.3%), Manufacturing (37 | 18.0%), Professional & Scientific (29 | 14.1%), Transportation & Warehousing (23 | 11.2%), and Accommodation & Food Services (17 | 8.3%).
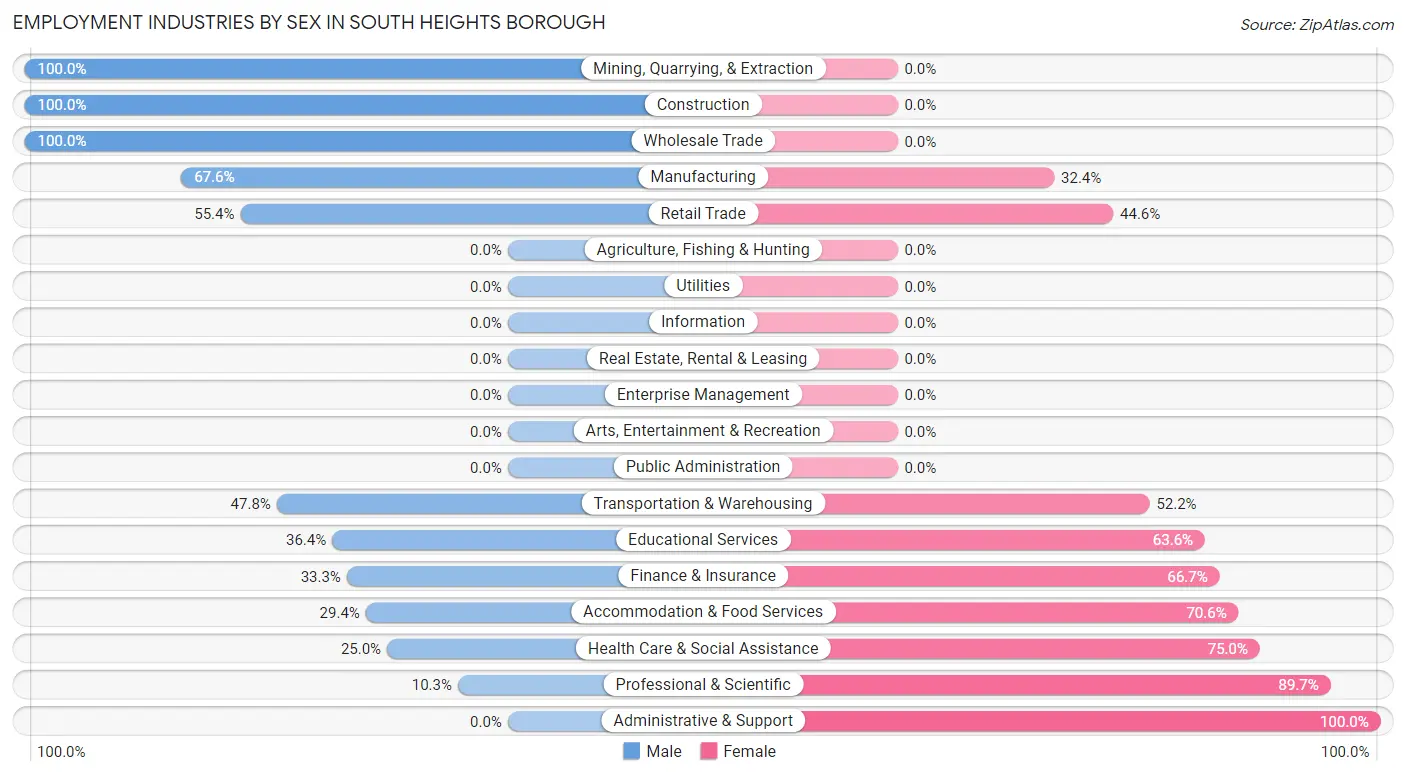
Employment Industries by Sex in South Heights borough
The South Heights borough industries that see more men than women are Mining, Quarrying, & Extraction (100.0%), Construction (100.0%), and Wholesale Trade (100.0%), whereas the industries that tend to have a higher number of women are Administrative & Support (100.0%), Professional & Scientific (89.7%), and Health Care & Social Assistance (75.0%).
| Industry | Male | Female |
| Agriculture, Fishing & Hunting | 0 (0.0%) | 0 (0.0%) |
| Mining, Quarrying, & Extraction | 7 (100.0%) | 0 (0.0%) |
| Construction | 7 (100.0%) | 0 (0.0%) |
| Manufacturing | 25 (67.6%) | 12 (32.4%) |
| Wholesale Trade | 2 (100.0%) | 0 (0.0%) |
| Retail Trade | 31 (55.4%) | 25 (44.6%) |
| Transportation & Warehousing | 11 (47.8%) | 12 (52.2%) |
| Utilities | 0 (0.0%) | 0 (0.0%) |
| Information | 0 (0.0%) | 0 (0.0%) |
| Finance & Insurance | 3 (33.3%) | 6 (66.7%) |
| Real Estate, Rental & Leasing | 0 (0.0%) | 0 (0.0%) |
| Professional & Scientific | 3 (10.3%) | 26 (89.7%) |
| Enterprise Management | 0 (0.0%) | 0 (0.0%) |
| Administrative & Support | 0 (0.0%) | 1 (100.0%) |
| Educational Services | 4 (36.4%) | 7 (63.6%) |
| Health Care & Social Assistance | 1 (25.0%) | 3 (75.0%) |
| Arts, Entertainment & Recreation | 0 (0.0%) | 0 (0.0%) |
| Accommodation & Food Services | 5 (29.4%) | 12 (70.6%) |
| Public Administration | 0 (0.0%) | 0 (0.0%) |
| Total | 101 (49.3%) | 104 (50.7%) |
Education in South Heights borough
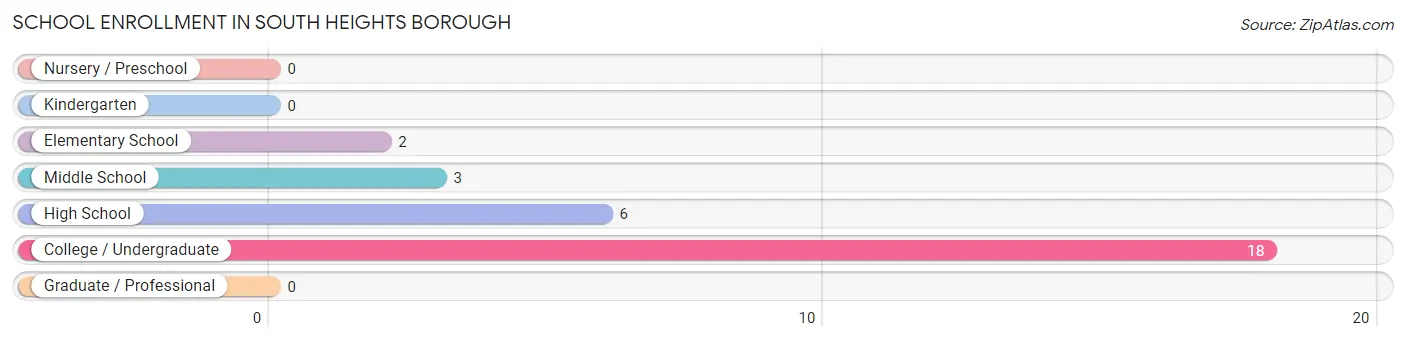
School Enrollment in South Heights borough
The most common levels of schooling among the 29 students in South Heights borough are college / undergraduate (18 | 62.1%), high school (6 | 20.7%), and middle school (3 | 10.3%).
| School Level | # Students | % Students |
| Nursery / Preschool | 0 | 0.0% |
| Kindergarten | 0 | 0.0% |
| Elementary School | 2 | 6.9% |
| Middle School | 3 | 10.3% |
| High School | 6 | 20.7% |
| College / Undergraduate | 18 | 62.1% |
| Graduate / Professional | 0 | 0.0% |
| Total | 29 | 100.0% |
School Enrollment by Age by Funding Source in South Heights borough
Out of a total of 29 students who are enrolled in schools in South Heights borough, 5 (17.2%) attend a private institution, while the remaining 24 (82.8%) are enrolled in public schools. The age group of 25 to 34 year olds has the highest likelihood of being enrolled in private schools, with 5 (55.6% in the age bracket) enrolled. Conversely, the age group of 5 to 9 year old has the lowest likelihood of being enrolled in a private school, with 2 (100.0% in the age bracket) attending a public institution.
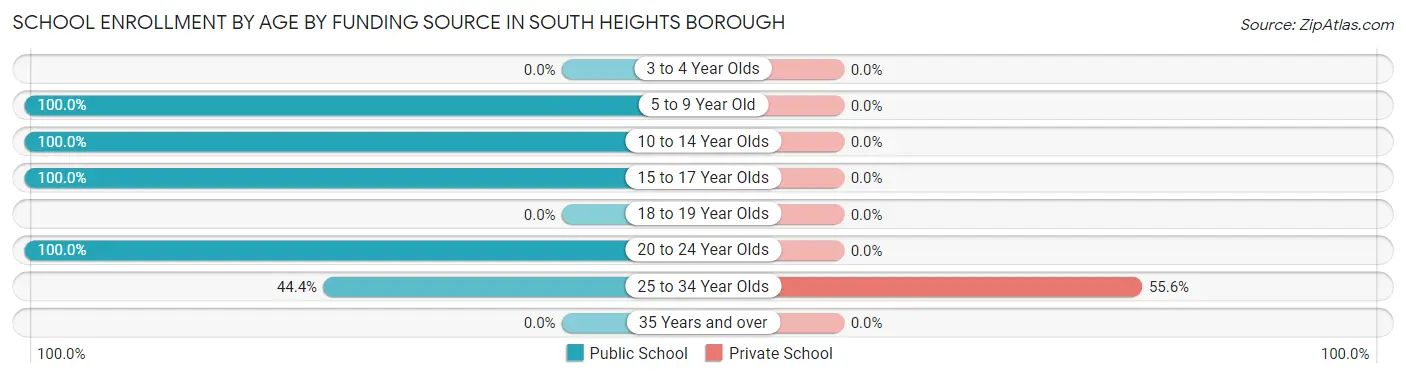
| Age Bracket | Public School | Private School |
| 3 to 4 Year Olds | 0 (0.0%) | 0 (0.0%) |
| 5 to 9 Year Old | 2 (100.0%) | 0 (0.0%) |
| 10 to 14 Year Olds | 3 (100.0%) | 0 (0.0%) |
| 15 to 17 Year Olds | 6 (100.0%) | 0 (0.0%) |
| 18 to 19 Year Olds | 0 (0.0%) | 0 (0.0%) |
| 20 to 24 Year Olds | 9 (100.0%) | 0 (0.0%) |
| 25 to 34 Year Olds | 4 (44.4%) | 5 (55.6%) |
| 35 Years and over | 0 (0.0%) | 0 (0.0%) |
| Total | 24 (82.8%) | 5 (17.2%) |
Educational Attainment by Field of Study in South Heights borough
Business (27 | 56.2%), education (14 | 29.2%), engineering (2 | 4.2%), visual & performing arts (2 | 4.2%), and arts & humanities (2 | 4.2%) are the most common fields of study among 48 individuals in South Heights borough who have obtained a bachelor's degree or higher.
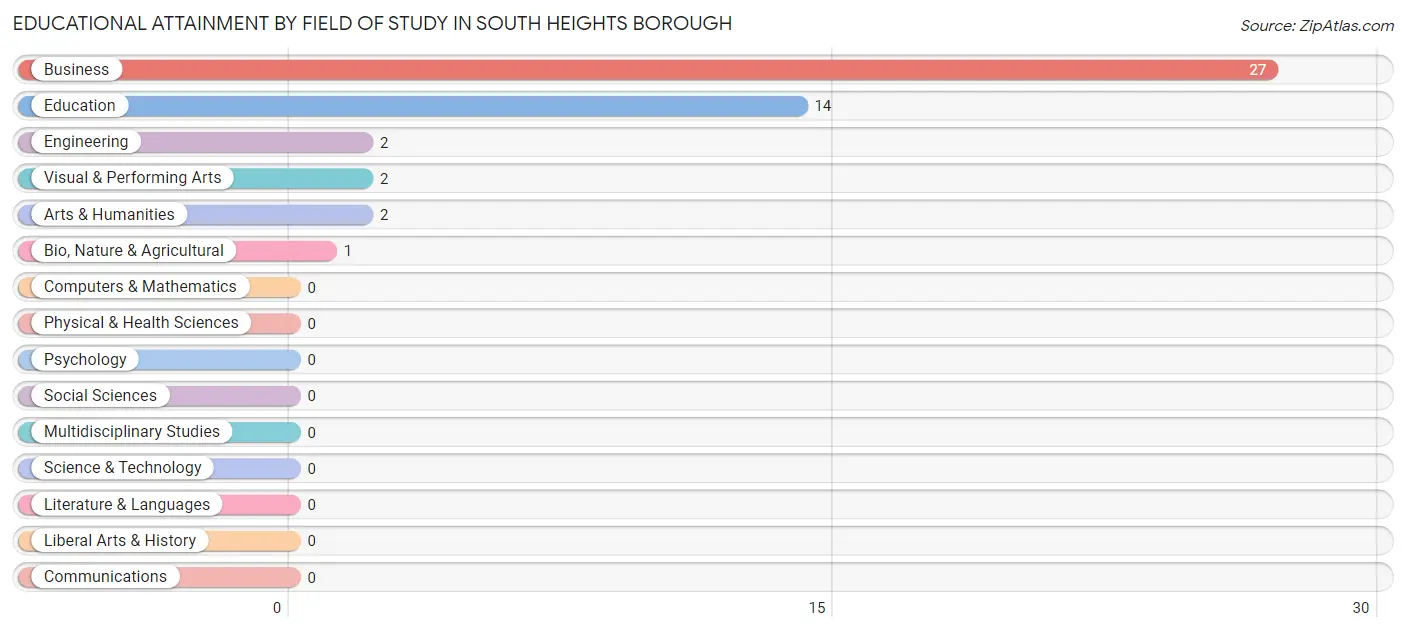
| Field of Study | # Graduates | % Graduates |
| Computers & Mathematics | 0 | 0.0% |
| Bio, Nature & Agricultural | 1 | 2.1% |
| Physical & Health Sciences | 0 | 0.0% |
| Psychology | 0 | 0.0% |
| Social Sciences | 0 | 0.0% |
| Engineering | 2 | 4.2% |
| Multidisciplinary Studies | 0 | 0.0% |
| Science & Technology | 0 | 0.0% |
| Business | 27 | 56.2% |
| Education | 14 | 29.2% |
| Literature & Languages | 0 | 0.0% |
| Liberal Arts & History | 0 | 0.0% |
| Visual & Performing Arts | 2 | 4.2% |
| Communications | 0 | 0.0% |
| Arts & Humanities | 2 | 4.2% |
| Total | 48 | 100.0% |
Transportation & Commute in South Heights borough
Vehicle Availability by Sex in South Heights borough
The most prevalent vehicle ownership categories in South Heights borough are males with 2 vehicles (31, accounting for 33.7%) and females with 2 vehicles (31, making up 29.8%).
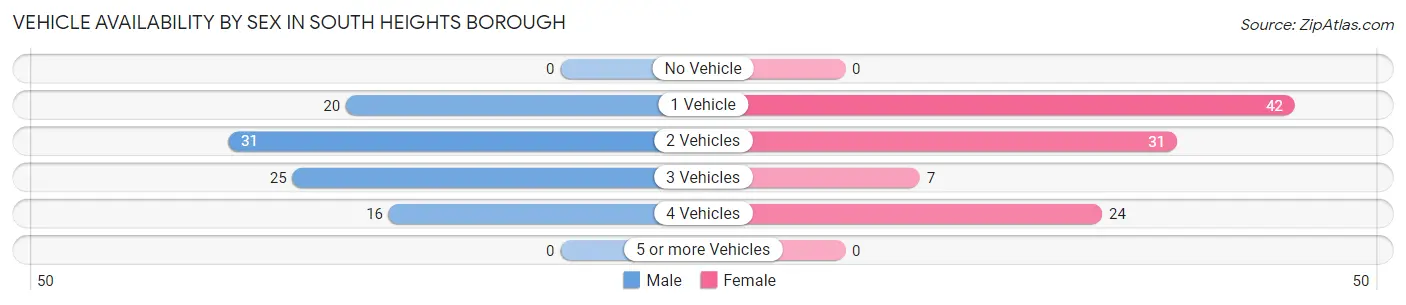
| Vehicles Available | Male | Female |
| No Vehicle | 0 (0.0%) | 0 (0.0%) |
| 1 Vehicle | 20 (21.7%) | 42 (40.4%) |
| 2 Vehicles | 31 (33.7%) | 31 (29.8%) |
| 3 Vehicles | 25 (27.2%) | 7 (6.7%) |
| 4 Vehicles | 16 (17.4%) | 24 (23.1%) |
| 5 or more Vehicles | 0 (0.0%) | 0 (0.0%) |
| Total | 92 (100.0%) | 104 (100.0%) |
Commute Time in South Heights borough
The most frequently occuring commute durations in South Heights borough are 20 to 24 minutes (52 commuters, 28.9%), 15 to 19 minutes (32 commuters, 17.8%), and 10 to 14 minutes (28 commuters, 15.6%).
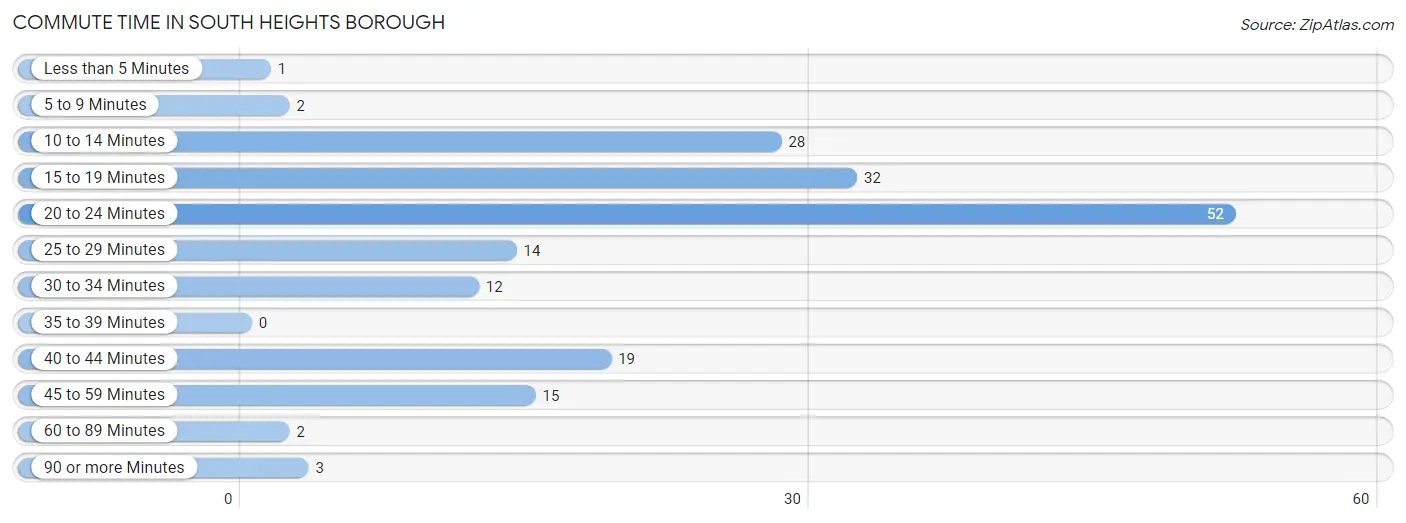
| Commute Time | # Commuters | % Commuters |
| Less than 5 Minutes | 1 | 0.6% |
| 5 to 9 Minutes | 2 | 1.1% |
| 10 to 14 Minutes | 28 | 15.6% |
| 15 to 19 Minutes | 32 | 17.8% |
| 20 to 24 Minutes | 52 | 28.9% |
| 25 to 29 Minutes | 14 | 7.8% |
| 30 to 34 Minutes | 12 | 6.7% |
| 35 to 39 Minutes | 0 | 0.0% |
| 40 to 44 Minutes | 19 | 10.6% |
| 45 to 59 Minutes | 15 | 8.3% |
| 60 to 89 Minutes | 2 | 1.1% |
| 90 or more Minutes | 3 | 1.7% |
Commute Time by Sex in South Heights borough
The most common commute times in South Heights borough are 10 to 14 minutes (21 commuters, 23.6%) for males and 20 to 24 minutes (42 commuters, 46.2%) for females.
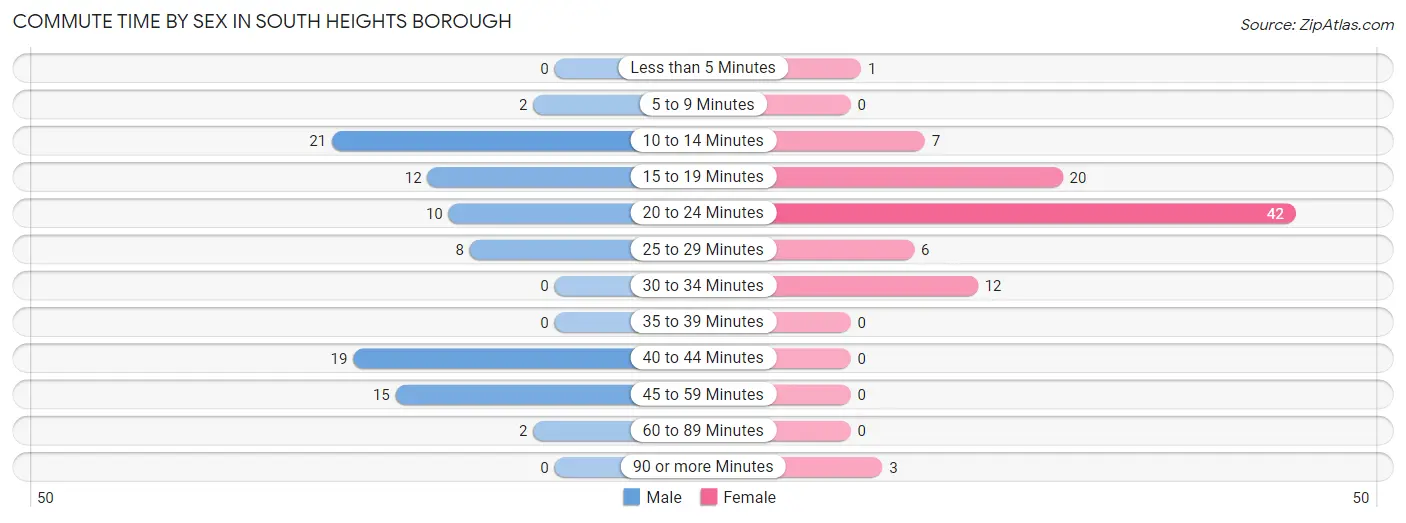
| Commute Time | Male | Female |
| Less than 5 Minutes | 0 (0.0%) | 1 (1.1%) |
| 5 to 9 Minutes | 2 (2.2%) | 0 (0.0%) |
| 10 to 14 Minutes | 21 (23.6%) | 7 (7.7%) |
| 15 to 19 Minutes | 12 (13.5%) | 20 (22.0%) |
| 20 to 24 Minutes | 10 (11.2%) | 42 (46.2%) |
| 25 to 29 Minutes | 8 (9.0%) | 6 (6.6%) |
| 30 to 34 Minutes | 0 (0.0%) | 12 (13.2%) |
| 35 to 39 Minutes | 0 (0.0%) | 0 (0.0%) |
| 40 to 44 Minutes | 19 (21.3%) | 0 (0.0%) |
| 45 to 59 Minutes | 15 (16.9%) | 0 (0.0%) |
| 60 to 89 Minutes | 2 (2.2%) | 0 (0.0%) |
| 90 or more Minutes | 0 (0.0%) | 3 (3.3%) |
Time of Departure to Work by Sex in South Heights borough
The most frequent times of departure to work in South Heights borough are 9:00 AM to 9:59 AM (14, 15.7%) for males and 7:00 AM to 7:29 AM (50, 54.9%) for females.
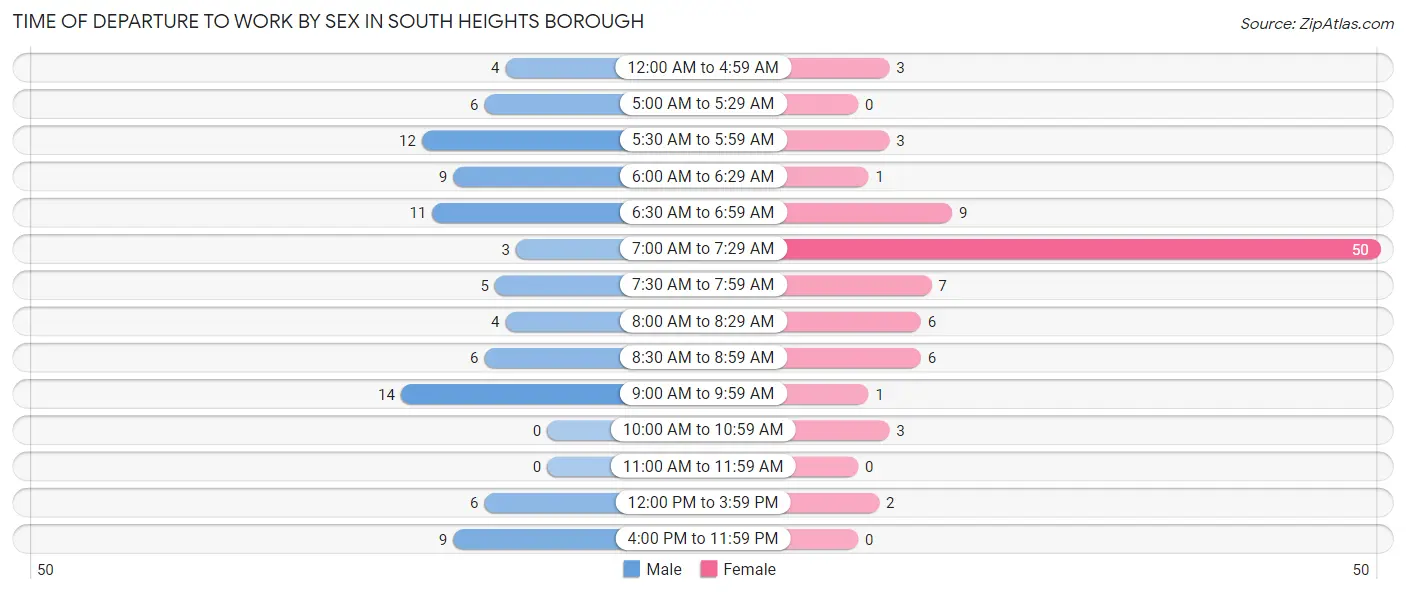
| Time of Departure | Male | Female |
| 12:00 AM to 4:59 AM | 4 (4.5%) | 3 (3.3%) |
| 5:00 AM to 5:29 AM | 6 (6.7%) | 0 (0.0%) |
| 5:30 AM to 5:59 AM | 12 (13.5%) | 3 (3.3%) |
| 6:00 AM to 6:29 AM | 9 (10.1%) | 1 (1.1%) |
| 6:30 AM to 6:59 AM | 11 (12.4%) | 9 (9.9%) |
| 7:00 AM to 7:29 AM | 3 (3.4%) | 50 (54.9%) |
| 7:30 AM to 7:59 AM | 5 (5.6%) | 7 (7.7%) |
| 8:00 AM to 8:29 AM | 4 (4.5%) | 6 (6.6%) |
| 8:30 AM to 8:59 AM | 6 (6.7%) | 6 (6.6%) |
| 9:00 AM to 9:59 AM | 14 (15.7%) | 1 (1.1%) |
| 10:00 AM to 10:59 AM | 0 (0.0%) | 3 (3.3%) |
| 11:00 AM to 11:59 AM | 0 (0.0%) | 0 (0.0%) |
| 12:00 PM to 3:59 PM | 6 (6.7%) | 2 (2.2%) |
| 4:00 PM to 11:59 PM | 9 (10.1%) | 0 (0.0%) |
| Total | 89 (100.0%) | 91 (100.0%) |
Housing Occupancy in South Heights borough
Occupancy by Ownership in South Heights borough
Of the total 174 dwellings in South Heights borough, owner-occupied units account for 124 (71.3%), while renter-occupied units make up 50 (28.7%).
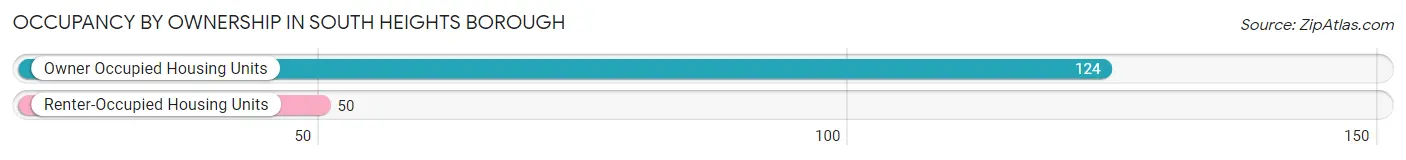
| Occupancy | # Housing Units | % Housing Units |
| Owner Occupied Housing Units | 124 | 71.3% |
| Renter-Occupied Housing Units | 50 | 28.7% |
| Total Occupied Housing Units | 174 | 100.0% |
Occupancy by Household Size in South Heights borough
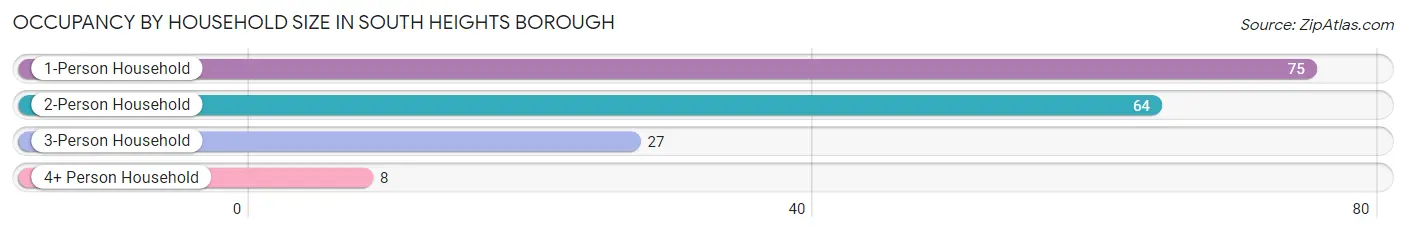
| Household Size | # Housing Units | % Housing Units |
| 1-Person Household | 75 | 43.1% |
| 2-Person Household | 64 | 36.8% |
| 3-Person Household | 27 | 15.5% |
| 4+ Person Household | 8 | 4.6% |
| Total Housing Units | 174 | 100.0% |
Occupancy by Ownership by Household Size in South Heights borough
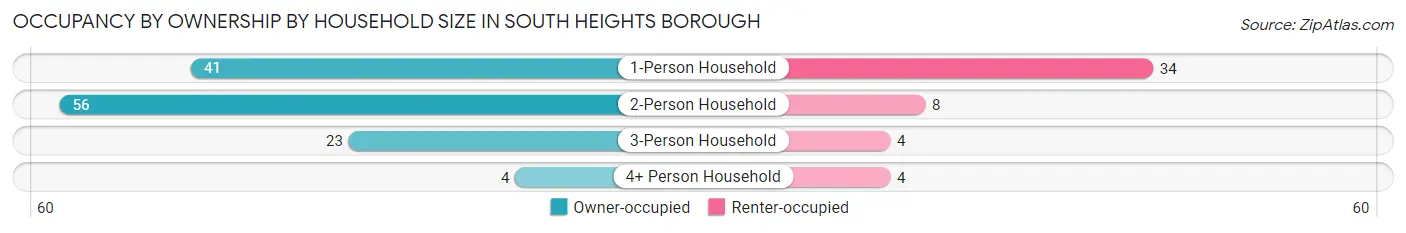
| Household Size | Owner-occupied | Renter-occupied |
| 1-Person Household | 41 (54.7%) | 34 (45.3%) |
| 2-Person Household | 56 (87.5%) | 8 (12.5%) |
| 3-Person Household | 23 (85.2%) | 4 (14.8%) |
| 4+ Person Household | 4 (50.0%) | 4 (50.0%) |
| Total Housing Units | 124 (71.3%) | 50 (28.7%) |
Occupancy by Educational Attainment in South Heights borough
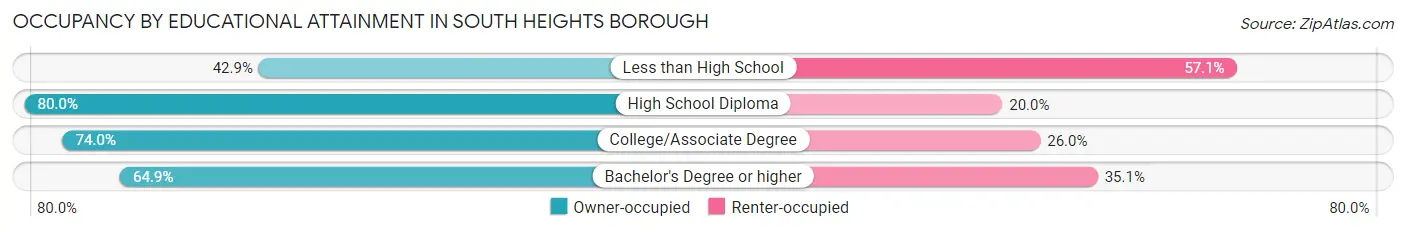
| Household Size | Owner-occupied | Renter-occupied |
| Less than High School | 6 (42.9%) | 8 (57.1%) |
| High School Diploma | 40 (80.0%) | 10 (20.0%) |
| College/Associate Degree | 54 (74.0%) | 19 (26.0%) |
| Bachelor's Degree or higher | 24 (64.9%) | 13 (35.1%) |
Occupancy by Age of Householder in South Heights borough
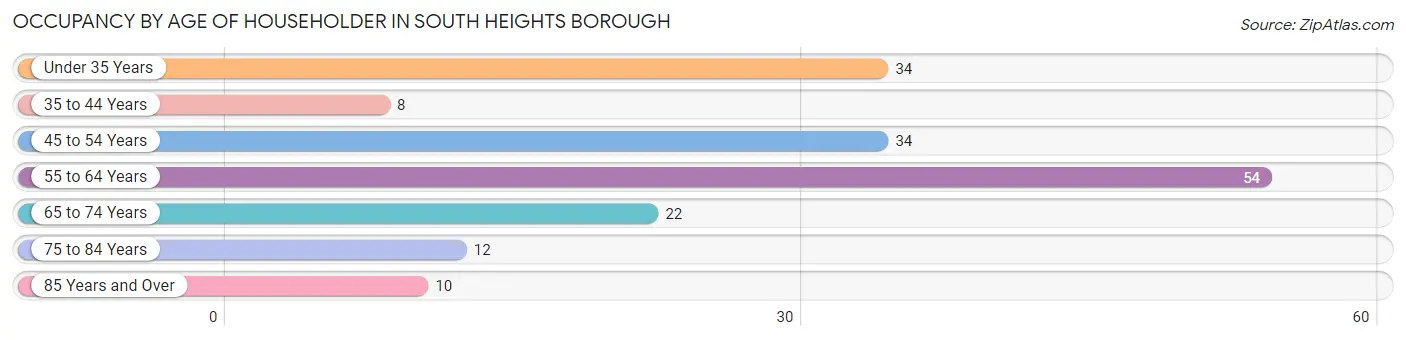
| Age Bracket | # Households | % Households |
| Under 35 Years | 34 | 19.5% |
| 35 to 44 Years | 8 | 4.6% |
| 45 to 54 Years | 34 | 19.5% |
| 55 to 64 Years | 54 | 31.0% |
| 65 to 74 Years | 22 | 12.6% |
| 75 to 84 Years | 12 | 6.9% |
| 85 Years and Over | 10 | 5.8% |
| Total | 174 | 100.0% |
Housing Finances in South Heights borough
Median Income by Occupancy in South Heights borough
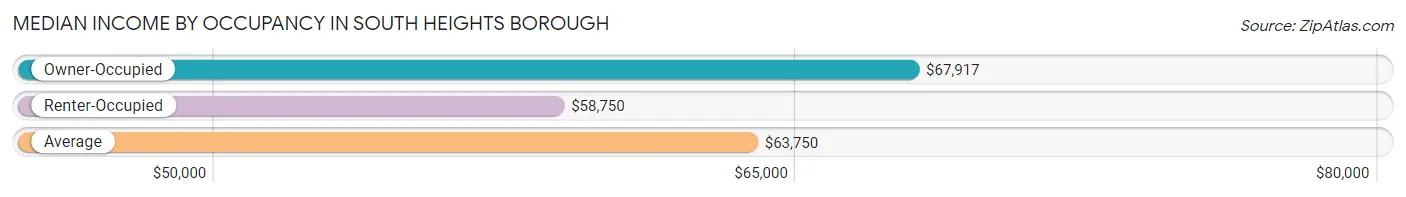
| Occupancy Type | # Households | Median Income |
| Owner-Occupied | 124 (71.3%) | $67,917 |
| Renter-Occupied | 50 (28.7%) | $58,750 |
| Average | 174 (100.0%) | $63,750 |
Occupancy by Householder Income Bracket in South Heights borough
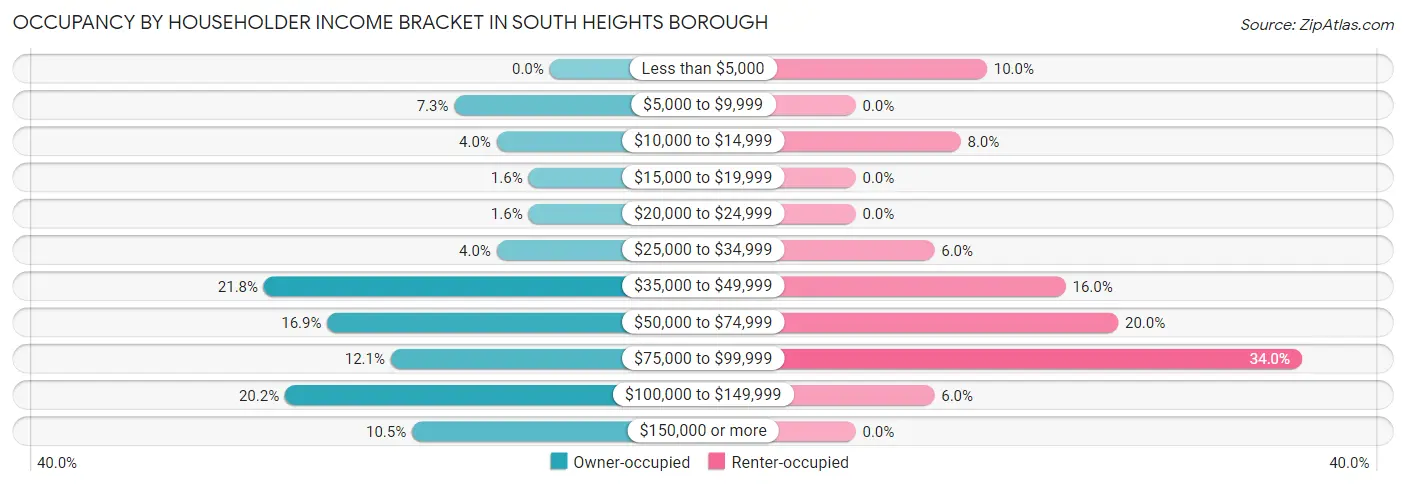
| Income Bracket | Owner-occupied | Renter-occupied |
| Less than $5,000 | 0 (0.0%) | 5 (10.0%) |
| $5,000 to $9,999 | 9 (7.3%) | 0 (0.0%) |
| $10,000 to $14,999 | 5 (4.0%) | 4 (8.0%) |
| $15,000 to $19,999 | 2 (1.6%) | 0 (0.0%) |
| $20,000 to $24,999 | 2 (1.6%) | 0 (0.0%) |
| $25,000 to $34,999 | 5 (4.0%) | 3 (6.0%) |
| $35,000 to $49,999 | 27 (21.8%) | 8 (16.0%) |
| $50,000 to $74,999 | 21 (16.9%) | 10 (20.0%) |
| $75,000 to $99,999 | 15 (12.1%) | 17 (34.0%) |
| $100,000 to $149,999 | 25 (20.2%) | 3 (6.0%) |
| $150,000 or more | 13 (10.5%) | 0 (0.0%) |
| Total | 124 (100.0%) | 50 (100.0%) |
Monthly Housing Cost Tiers in South Heights borough
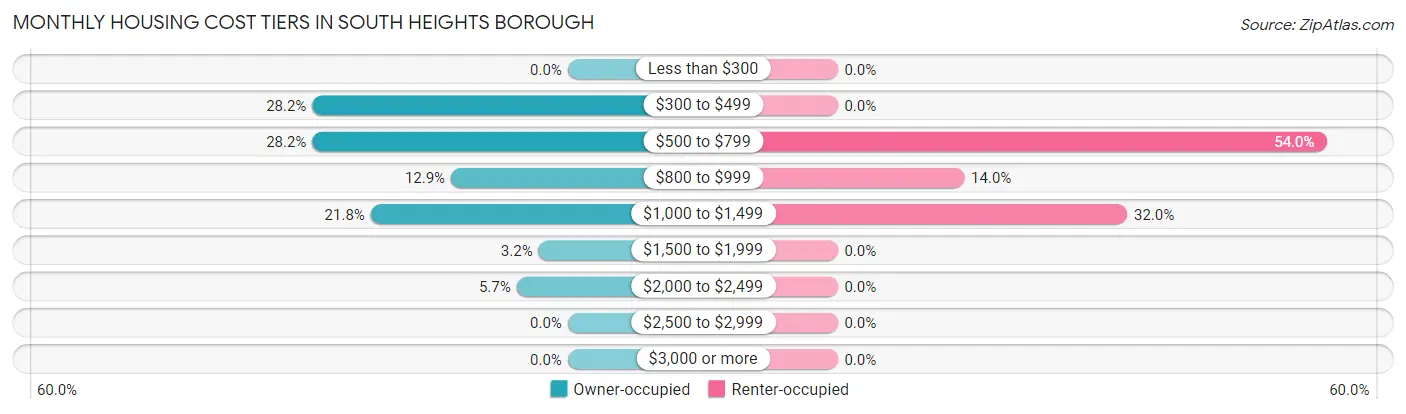
| Monthly Cost | Owner-occupied | Renter-occupied |
| Less than $300 | 0 (0.0%) | 0 (0.0%) |
| $300 to $499 | 35 (28.2%) | 0 (0.0%) |
| $500 to $799 | 35 (28.2%) | 27 (54.0%) |
| $800 to $999 | 16 (12.9%) | 7 (14.0%) |
| $1,000 to $1,499 | 27 (21.8%) | 16 (32.0%) |
| $1,500 to $1,999 | 4 (3.2%) | 0 (0.0%) |
| $2,000 to $2,499 | 7 (5.7%) | 0 (0.0%) |
| $2,500 to $2,999 | 0 (0.0%) | 0 (0.0%) |
| $3,000 or more | 0 (0.0%) | 0 (0.0%) |
| Total | 124 (100.0%) | 50 (100.0%) |
Physical Housing Characteristics in South Heights borough
Housing Structures in South Heights borough
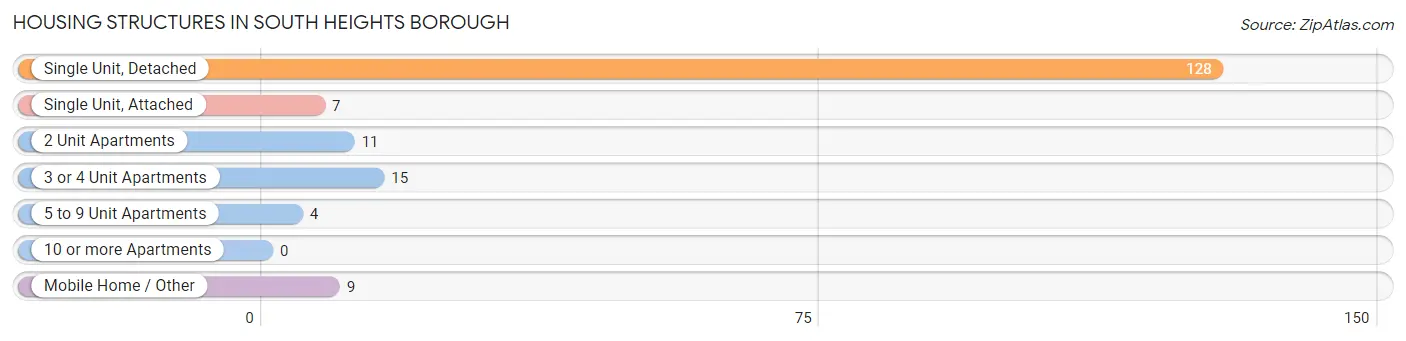
| Structure Type | # Housing Units | % Housing Units |
| Single Unit, Detached | 128 | 73.6% |
| Single Unit, Attached | 7 | 4.0% |
| 2 Unit Apartments | 11 | 6.3% |
| 3 or 4 Unit Apartments | 15 | 8.6% |
| 5 to 9 Unit Apartments | 4 | 2.3% |
| 10 or more Apartments | 0 | 0.0% |
| Mobile Home / Other | 9 | 5.2% |
| Total | 174 | 100.0% |
Housing Structures by Occupancy in South Heights borough
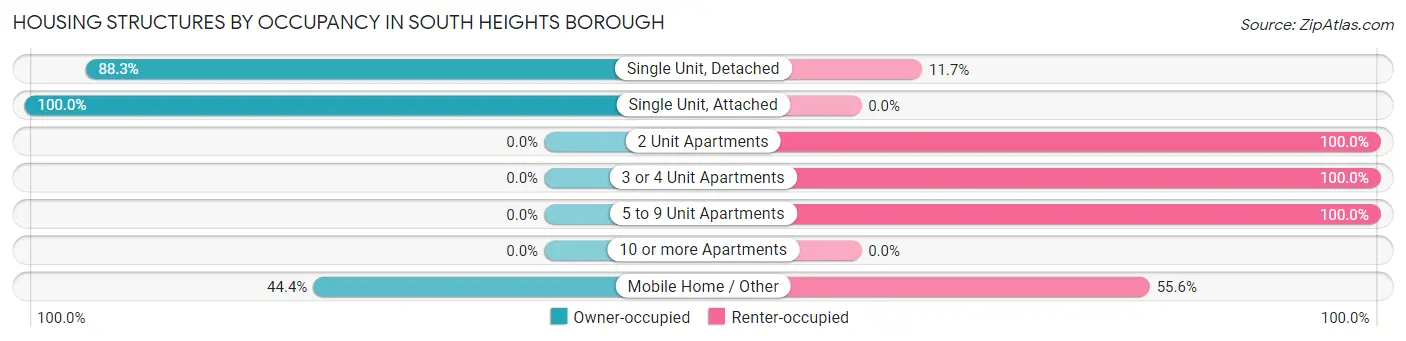
| Structure Type | Owner-occupied | Renter-occupied |
| Single Unit, Detached | 113 (88.3%) | 15 (11.7%) |
| Single Unit, Attached | 7 (100.0%) | 0 (0.0%) |
| 2 Unit Apartments | 0 (0.0%) | 11 (100.0%) |
| 3 or 4 Unit Apartments | 0 (0.0%) | 15 (100.0%) |
| 5 to 9 Unit Apartments | 0 (0.0%) | 4 (100.0%) |
| 10 or more Apartments | 0 (0.0%) | 0 (0.0%) |
| Mobile Home / Other | 4 (44.4%) | 5 (55.6%) |
| Total | 124 (71.3%) | 50 (28.7%) |
Housing Structures by Number of Rooms in South Heights borough
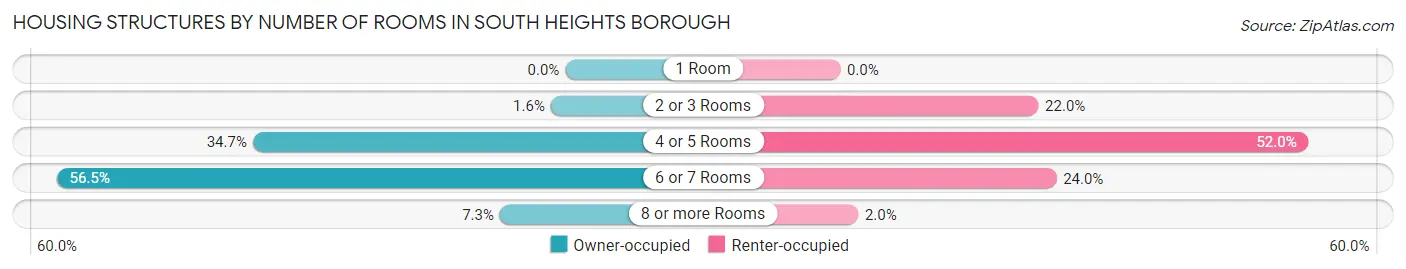
| Number of Rooms | Owner-occupied | Renter-occupied |
| 1 Room | 0 (0.0%) | 0 (0.0%) |
| 2 or 3 Rooms | 2 (1.6%) | 11 (22.0%) |
| 4 or 5 Rooms | 43 (34.7%) | 26 (52.0%) |
| 6 or 7 Rooms | 70 (56.5%) | 12 (24.0%) |
| 8 or more Rooms | 9 (7.3%) | 1 (2.0%) |
| Total | 124 (100.0%) | 50 (100.0%) |
Housing Structure by Heating Type in South Heights borough
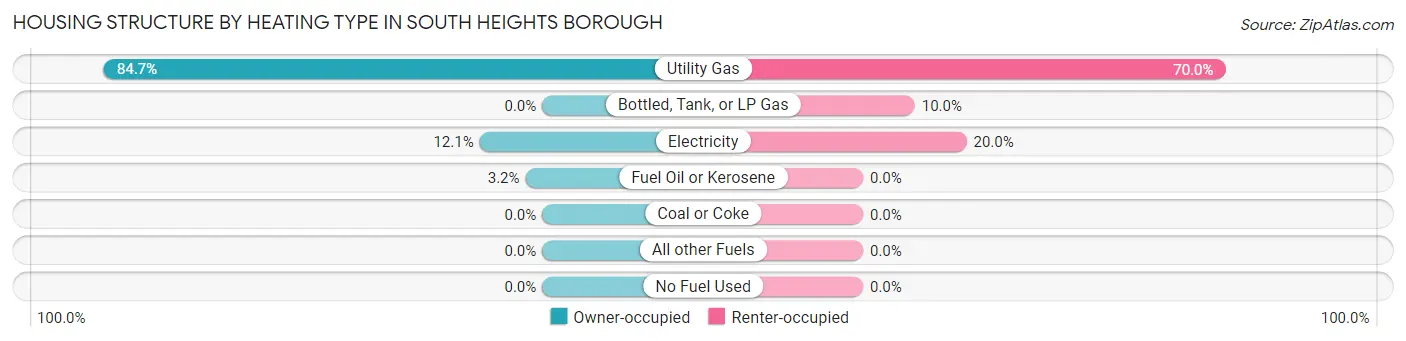
| Heating Type | Owner-occupied | Renter-occupied |
| Utility Gas | 105 (84.7%) | 35 (70.0%) |
| Bottled, Tank, or LP Gas | 0 (0.0%) | 5 (10.0%) |
| Electricity | 15 (12.1%) | 10 (20.0%) |
| Fuel Oil or Kerosene | 4 (3.2%) | 0 (0.0%) |
| Coal or Coke | 0 (0.0%) | 0 (0.0%) |
| All other Fuels | 0 (0.0%) | 0 (0.0%) |
| No Fuel Used | 0 (0.0%) | 0 (0.0%) |
| Total | 124 (100.0%) | 50 (100.0%) |
Household Vehicle Usage in South Heights borough
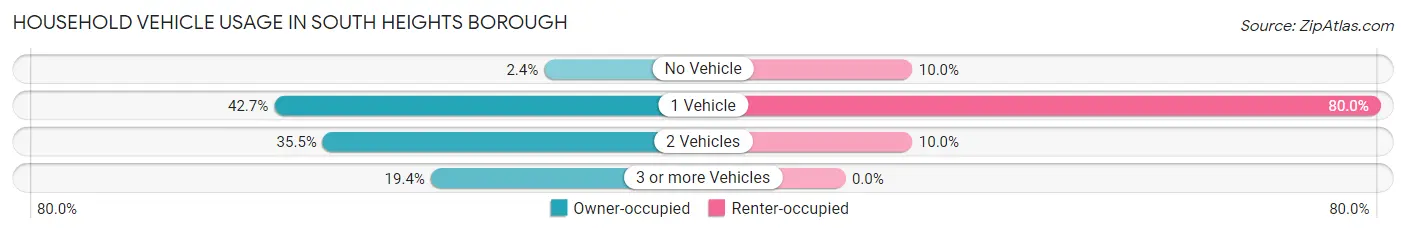
| Vehicles per Household | Owner-occupied | Renter-occupied |
| No Vehicle | 3 (2.4%) | 5 (10.0%) |
| 1 Vehicle | 53 (42.7%) | 40 (80.0%) |
| 2 Vehicles | 44 (35.5%) | 5 (10.0%) |
| 3 or more Vehicles | 24 (19.4%) | 0 (0.0%) |
| Total | 124 (100.0%) | 50 (100.0%) |
Real Estate & Mortgages in South Heights borough
Real Estate and Mortgage Overview in South Heights borough
| Characteristic | Without Mortgage | With Mortgage |
| Housing Units | 60 | 64 |
| Median Property Value | $122,100 | $127,100 |
| Median Household Income | $43,333 | $2 |
| Monthly Housing Costs | $455 | $0 |
| Real Estate Taxes | $1,833 | $1 |
Property Value by Mortgage Status in South Heights borough
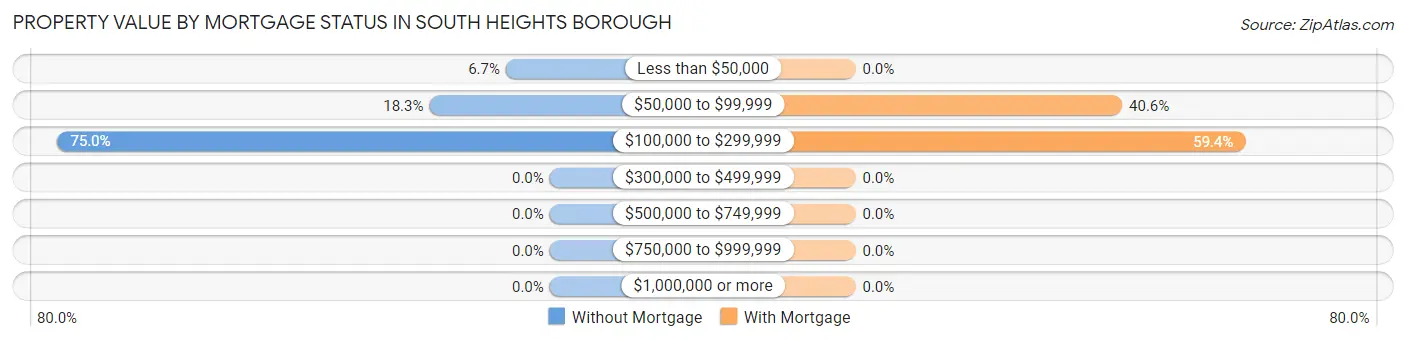
| Property Value | Without Mortgage | With Mortgage |
| Less than $50,000 | 4 (6.7%) | 0 (0.0%) |
| $50,000 to $99,999 | 11 (18.3%) | 26 (40.6%) |
| $100,000 to $299,999 | 45 (75.0%) | 38 (59.4%) |
| $300,000 to $499,999 | 0 (0.0%) | 0 (0.0%) |
| $500,000 to $749,999 | 0 (0.0%) | 0 (0.0%) |
| $750,000 to $999,999 | 0 (0.0%) | 0 (0.0%) |
| $1,000,000 or more | 0 (0.0%) | 0 (0.0%) |
| Total | 60 (100.0%) | 64 (100.0%) |
Household Income by Mortgage Status in South Heights borough
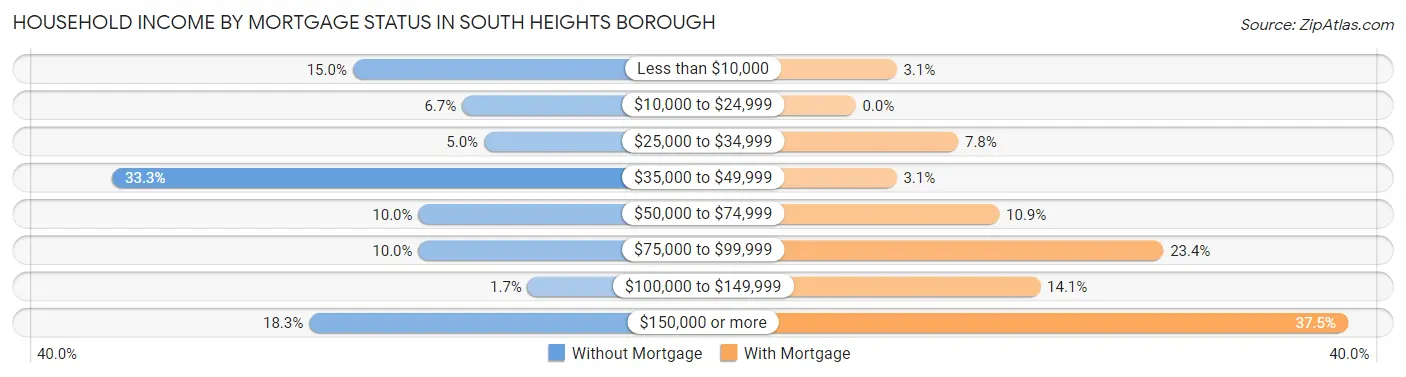
| Household Income | Without Mortgage | With Mortgage |
| Less than $10,000 | 9 (15.0%) | 2 (3.1%) |
| $10,000 to $24,999 | 4 (6.7%) | 0 (0.0%) |
| $25,000 to $34,999 | 3 (5.0%) | 5 (7.8%) |
| $35,000 to $49,999 | 20 (33.3%) | 2 (3.1%) |
| $50,000 to $74,999 | 6 (10.0%) | 7 (10.9%) |
| $75,000 to $99,999 | 6 (10.0%) | 15 (23.4%) |
| $100,000 to $149,999 | 1 (1.7%) | 9 (14.1%) |
| $150,000 or more | 11 (18.3%) | 24 (37.5%) |
| Total | 60 (100.0%) | 64 (100.0%) |
Property Value to Household Income Ratio in South Heights borough
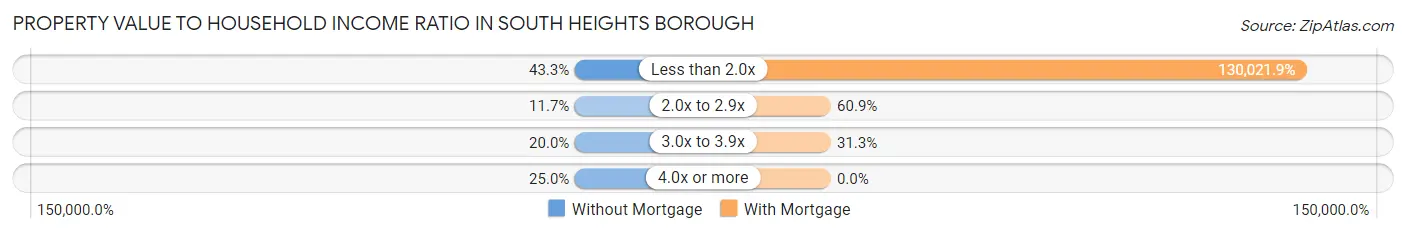
| Value-to-Income Ratio | Without Mortgage | With Mortgage |
| Less than 2.0x | 26 (43.3%) | 83,214 (130,021.9%) |
| 2.0x to 2.9x | 7 (11.7%) | 39 (60.9%) |
| 3.0x to 3.9x | 12 (20.0%) | 20 (31.2%) |
| 4.0x or more | 15 (25.0%) | 0 (0.0%) |
| Total | 60 (100.0%) | 64 (100.0%) |
Real Estate Taxes by Mortgage Status in South Heights borough
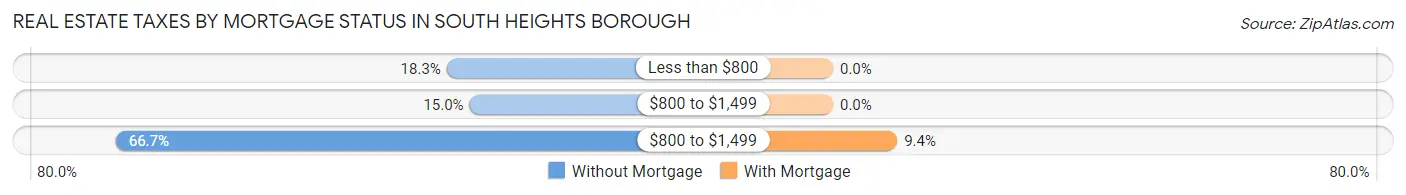
| Property Taxes | Without Mortgage | With Mortgage |
| Less than $800 | 11 (18.3%) | 0 (0.0%) |
| $800 to $1,499 | 9 (15.0%) | 0 (0.0%) |
| $800 to $1,499 | 40 (66.7%) | 6 (9.4%) |
| Total | 60 (100.0%) | 64 (100.0%) |
Health & Disability in South Heights borough
Health Insurance Coverage by Age in South Heights borough
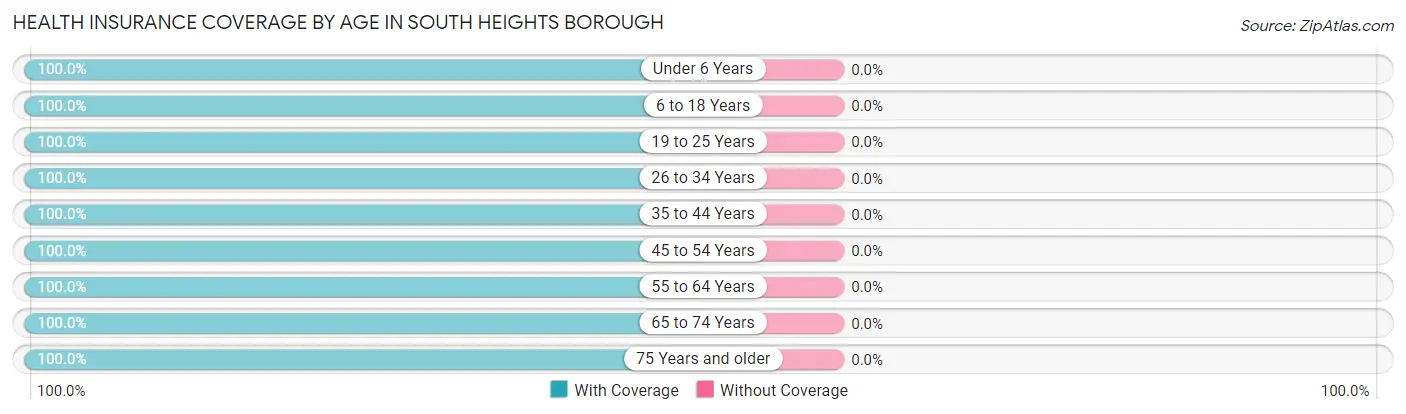
| Age Bracket | With Coverage | Without Coverage |
| Under 6 Years | 5 (100.0%) | 0 (0.0%) |
| 6 to 18 Years | 11 (100.0%) | 0 (0.0%) |
| 19 to 25 Years | 39 (100.0%) | 0 (0.0%) |
| 26 to 34 Years | 49 (100.0%) | 0 (0.0%) |
| 35 to 44 Years | 11 (100.0%) | 0 (0.0%) |
| 45 to 54 Years | 85 (100.0%) | 0 (0.0%) |
| 55 to 64 Years | 67 (100.0%) | 0 (0.0%) |
| 65 to 74 Years | 35 (100.0%) | 0 (0.0%) |
| 75 Years and older | 31 (100.0%) | 0 (0.0%) |
| Total | 333 (100.0%) | 0 (0.0%) |
Health Insurance Coverage by Citizenship Status in South Heights borough
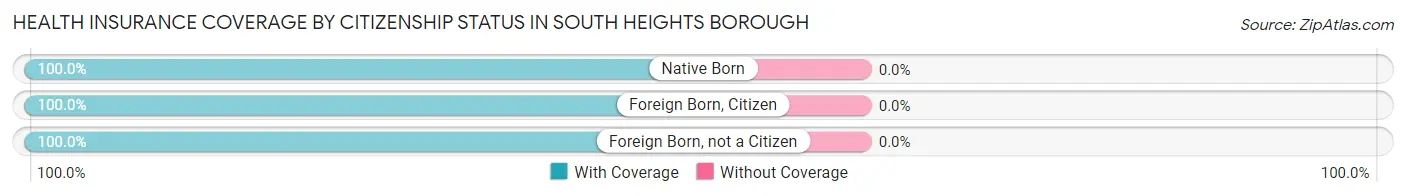
| Citizenship Status | With Coverage | Without Coverage |
| Native Born | 5 (100.0%) | 0 (0.0%) |
| Foreign Born, Citizen | 11 (100.0%) | 0 (0.0%) |
| Foreign Born, not a Citizen | 39 (100.0%) | 0 (0.0%) |
Health Insurance Coverage by Household Income in South Heights borough
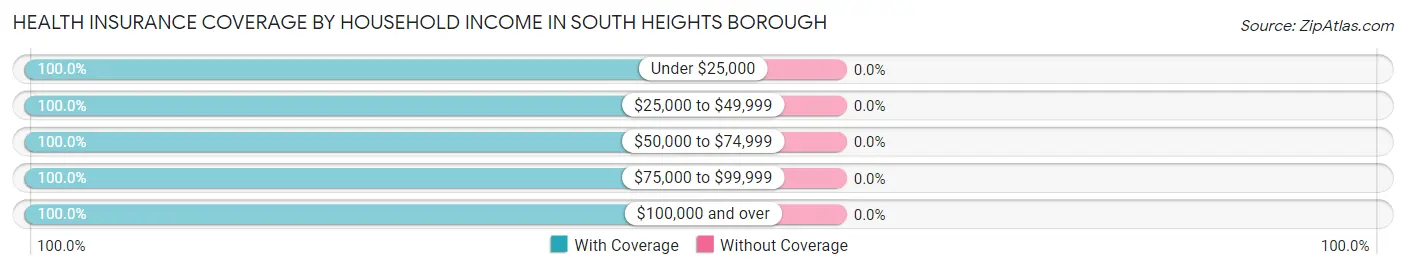
| Household Income | With Coverage | Without Coverage |
| Under $25,000 | 36 (100.0%) | 0 (0.0%) |
| $25,000 to $49,999 | 58 (100.0%) | 0 (0.0%) |
| $50,000 to $74,999 | 61 (100.0%) | 0 (0.0%) |
| $75,000 to $99,999 | 65 (100.0%) | 0 (0.0%) |
| $100,000 and over | 113 (100.0%) | 0 (0.0%) |
Public vs Private Health Insurance Coverage by Age in South Heights borough
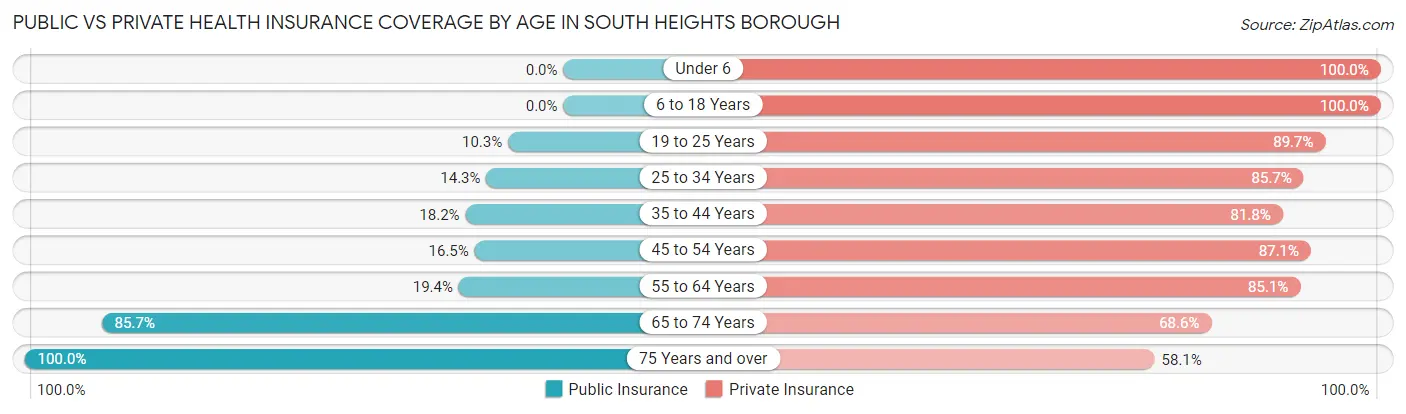
| Age Bracket | Public Insurance | Private Insurance |
| Under 6 | 0 (0.0%) | 5 (100.0%) |
| 6 to 18 Years | 0 (0.0%) | 11 (100.0%) |
| 19 to 25 Years | 4 (10.3%) | 35 (89.7%) |
| 25 to 34 Years | 7 (14.3%) | 42 (85.7%) |
| 35 to 44 Years | 2 (18.2%) | 9 (81.8%) |
| 45 to 54 Years | 14 (16.5%) | 74 (87.1%) |
| 55 to 64 Years | 13 (19.4%) | 57 (85.1%) |
| 65 to 74 Years | 30 (85.7%) | 24 (68.6%) |
| 75 Years and over | 31 (100.0%) | 18 (58.1%) |
| Total | 101 (30.3%) | 275 (82.6%) |
Disability Status by Sex by Age in South Heights borough
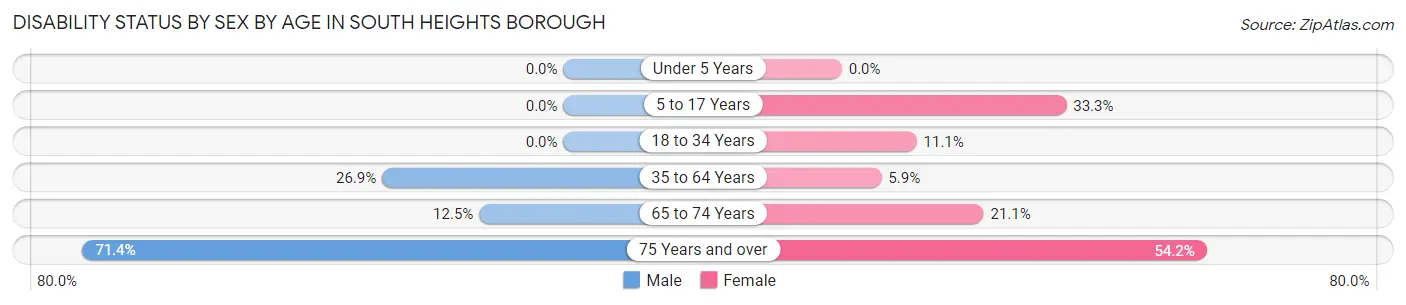
| Age Bracket | Male | Female |
| Under 5 Years | 0 (0.0%) | 0 (0.0%) |
| 5 to 17 Years | 0 (0.0%) | 3 (33.3%) |
| 18 to 34 Years | 0 (0.0%) | 5 (11.1%) |
| 35 to 64 Years | 21 (26.9%) | 5 (5.9%) |
| 65 to 74 Years | 2 (12.5%) | 4 (21.0%) |
| 75 Years and over | 5 (71.4%) | 13 (54.2%) |
Disability Class by Sex by Age in South Heights borough
Disability Class: Hearing Difficulty
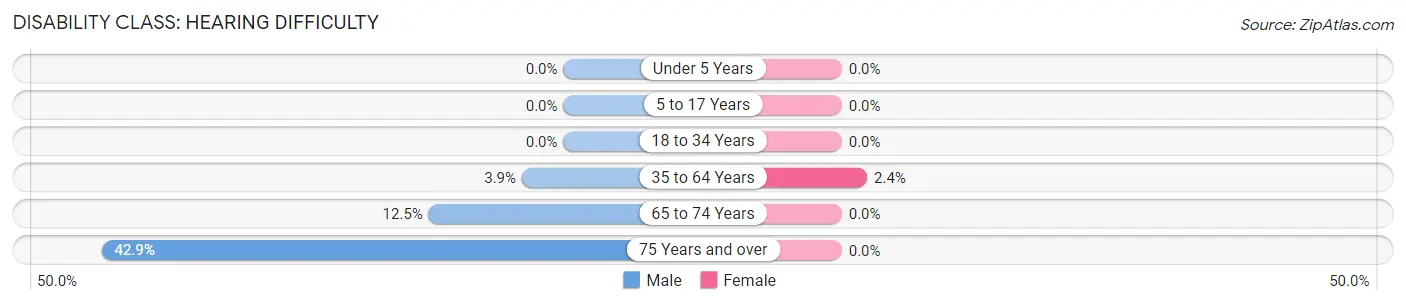
| Age Bracket | Male | Female |
| Under 5 Years | 0 (0.0%) | 0 (0.0%) |
| 5 to 17 Years | 0 (0.0%) | 0 (0.0%) |
| 18 to 34 Years | 0 (0.0%) | 0 (0.0%) |
| 35 to 64 Years | 3 (3.8%) | 2 (2.4%) |
| 65 to 74 Years | 2 (12.5%) | 0 (0.0%) |
| 75 Years and over | 3 (42.9%) | 0 (0.0%) |
Disability Class: Vision Difficulty
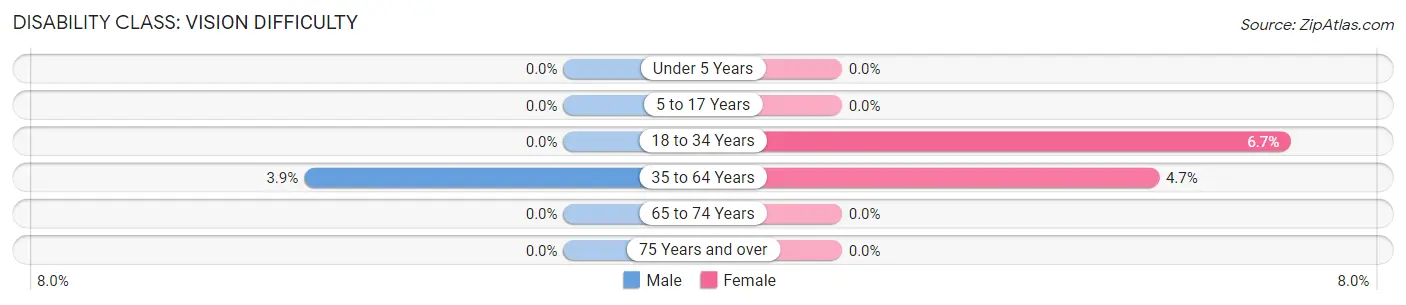
| Age Bracket | Male | Female |
| Under 5 Years | 0 (0.0%) | 0 (0.0%) |
| 5 to 17 Years | 0 (0.0%) | 0 (0.0%) |
| 18 to 34 Years | 0 (0.0%) | 3 (6.7%) |
| 35 to 64 Years | 3 (3.8%) | 4 (4.7%) |
| 65 to 74 Years | 0 (0.0%) | 0 (0.0%) |
| 75 Years and over | 0 (0.0%) | 0 (0.0%) |
Disability Class: Cognitive Difficulty
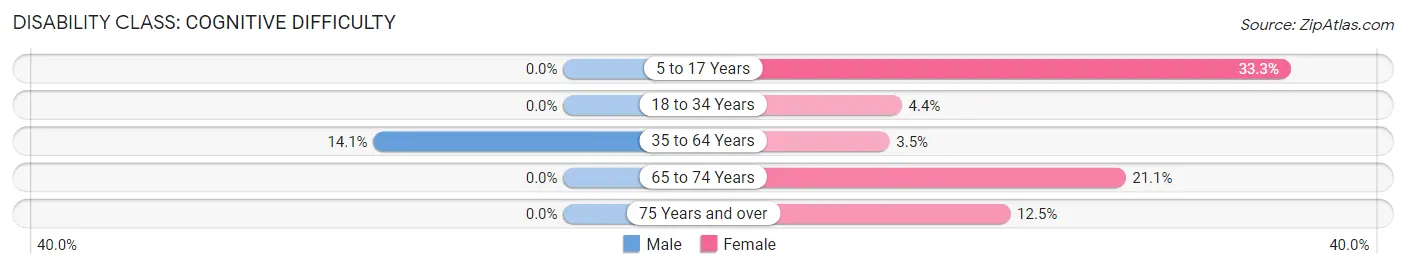
| Age Bracket | Male | Female |
| 5 to 17 Years | 0 (0.0%) | 3 (33.3%) |
| 18 to 34 Years | 0 (0.0%) | 2 (4.4%) |
| 35 to 64 Years | 11 (14.1%) | 3 (3.5%) |
| 65 to 74 Years | 0 (0.0%) | 4 (21.0%) |
| 75 Years and over | 0 (0.0%) | 3 (12.5%) |
Disability Class: Ambulatory Difficulty
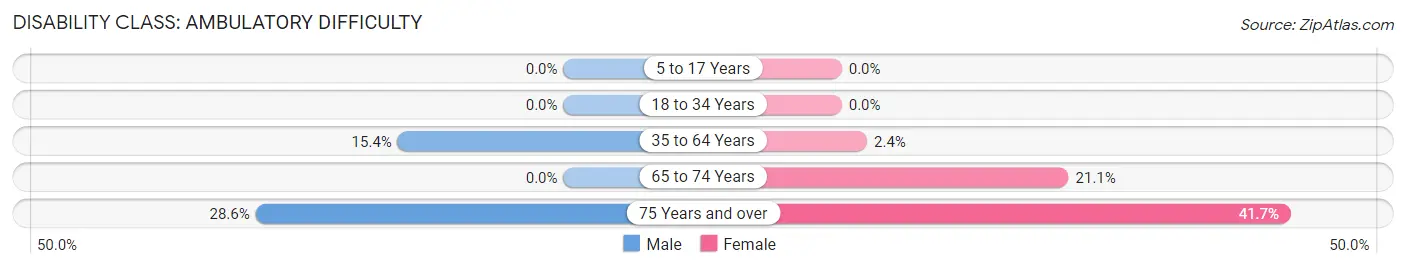
| Age Bracket | Male | Female |
| 5 to 17 Years | 0 (0.0%) | 0 (0.0%) |
| 18 to 34 Years | 0 (0.0%) | 0 (0.0%) |
| 35 to 64 Years | 12 (15.4%) | 2 (2.4%) |
| 65 to 74 Years | 0 (0.0%) | 4 (21.0%) |
| 75 Years and over | 2 (28.6%) | 10 (41.7%) |
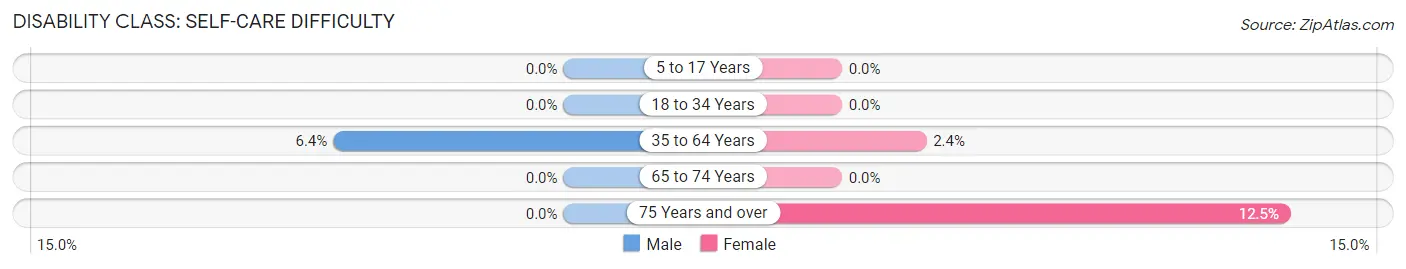
Disability Class: Self-Care Difficulty
| Age Bracket | Male | Female |
| 5 to 17 Years | 0 (0.0%) | 0 (0.0%) |
| 18 to 34 Years | 0 (0.0%) | 0 (0.0%) |
| 35 to 64 Years | 5 (6.4%) | 2 (2.4%) |
| 65 to 74 Years | 0 (0.0%) | 0 (0.0%) |
| 75 Years and over | 0 (0.0%) | 3 (12.5%) |
Technology Access in South Heights borough
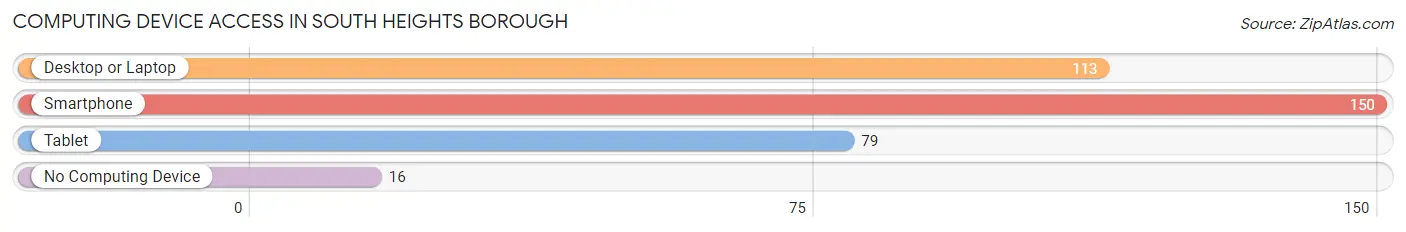
Computing Device Access in South Heights borough
| Device Type | # Households | % Households |
| Desktop or Laptop | 113 | 64.9% |
| Smartphone | 150 | 86.2% |
| Tablet | 79 | 45.4% |
| No Computing Device | 16 | 9.2% |
| Total | 174 | 100.0% |
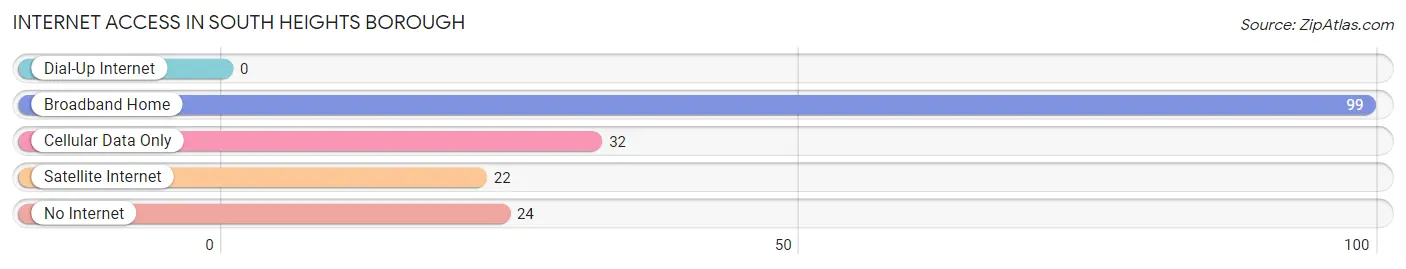
Internet Access in South Heights borough
| Internet Type | # Households | % Households |
| Dial-Up Internet | 0 | 0.0% |
| Broadband Home | 99 | 56.9% |
| Cellular Data Only | 32 | 18.4% |
| Satellite Internet | 22 | 12.6% |
| No Internet | 24 | 13.8% |
| Total | 174 | 100.0% |
South Heights borough Summary
South Heights Borough is a small borough located in Beaver County, Pennsylvania. It is situated along the Ohio River, just south of the city of Beaver. The borough has a population of 1,845 as of the 2010 census.
History
South Heights Borough was founded in 1876, when the area was still part of Beaver County. The borough was named after the South Heights area of Beaver, which was located just south of the borough. The area was originally settled by German immigrants in the early 1800s. The first post office in the area was established in 1876, and the first school was built in 1877.
The borough was incorporated in 1891, and the first mayor was elected in 1892. The borough was home to several industries, including a brickyard, a sawmill, and a tannery. The borough also had a thriving agricultural industry, with many farms located in the area.
In the early 1900s, the borough began to experience a population boom, as many people moved to the area to take advantage of the growing industrial and agricultural opportunities. The population peaked in the 1950s, when the borough had a population of over 3,000.
Geography
South Heights Borough is located in Beaver County, Pennsylvania. It is situated along the Ohio River, just south of the city of Beaver. The borough has a total area of 1.2 square miles, all of which is land. The borough is bordered by the boroughs of Rochester and Monaca to the north, and the townships of Brighton and Potter to the south.
The borough is located in the Appalachian Plateau region of Pennsylvania. The terrain is mostly flat, with some rolling hills. The climate is humid continental, with hot summers and cold winters.
Economy
The economy of South Heights Borough is largely based on manufacturing and agriculture. The borough is home to several manufacturing companies, including a steel mill, a paper mill, and a plastics factory. The borough also has a thriving agricultural industry, with many farms located in the area.
The borough also has a growing tourism industry, with many visitors coming to the area to take advantage of the nearby rivers and lakes. The borough is also home to several parks and recreational areas, including the South Heights Borough Park and the Beaver River Trail.
Demographics
As of the 2010 census, the population of South Heights Borough was 1,845. The racial makeup of the borough was 97.3% White, 0.9% African American, 0.2% Native American, 0.3% Asian, and 1.3% from other races. Hispanic or Latino of any race were 1.3% of the population.
The median household income in the borough was $41,250, and the median family income was $50,000. The per capita income was $20,845. About 11.3% of families and 14.2% of the population were below the poverty line, including 19.2% of those under age 18 and 8.3% of those age 65 or over.
Common Questions
What is Per Capita Income in South Heights borough?
Per Capita income in South Heights borough is $39,266.
What is the Median Family Income in South Heights borough?
Median Family Income in South Heights borough is $84,318.
What is the Median Household income in South Heights borough?
Median Household Income in South Heights borough is $63,750.
What is Income or Wage Gap in South Heights borough?
Income or Wage Gap in South Heights borough is 2.3%.
Women in South Heights borough earn 97.7 cents for every dollar earned by a man.
What is Inequality or Gini Index in South Heights borough?
Inequality or Gini Index in South Heights borough is 0.38.
What is the Total Population of South Heights borough?
Total Population of South Heights borough is 333.
What is the Total Male Population of South Heights borough?
Total Male Population of South Heights borough is 151.
What is the Total Female Population of South Heights borough?
Total Female Population of South Heights borough is 182.
What is the Ratio of Males per 100 Females in South Heights borough?
There are 82.97 Males per 100 Females in South Heights borough.
What is the Ratio of Females per 100 Males in South Heights borough?
There are 120.53 Females per 100 Males in South Heights borough.
What is the Median Population Age in South Heights borough?
Median Population Age in South Heights borough is 50.0 Years.
What is the Average Family Size in South Heights borough
Average Family Size in South Heights borough is 2.7 People.
What is the Average Household Size in South Heights borough
Average Household Size in South Heights borough is 1.9 People.
How Large is the Labor Force in South Heights borough?
There are 205 People in the Labor Forcein in South Heights borough.
What is the Percentage of People in the Labor Force in South Heights borough?
63.5% of People are in the Labor Force in South Heights borough.