Port Clinton borough, PA Map & Demographics
Port Clinton borough Overview
$27,629
PER CAPITA INCOME
$80,000
AVG FAMILY INCOME
$68,750
AVG HOUSEHOLD INCOME
2.1%
WAGE / INCOME GAP [ % ]
97.9¢/ $1
WAGE / INCOME GAP [ $ ]
0.31
INEQUALITY / GINI INDEX
354
TOTAL POPULATION
197
MALE POPULATION
157
FEMALE POPULATION
125.48
MALES / 100 FEMALES
79.70
FEMALES / 100 MALES
33.3
MEDIAN AGE
3.5
AVG FAMILY SIZE
2.8
AVG HOUSEHOLD SIZE
173
LABOR FORCE [ PEOPLE ]
62.9%
PERCENT IN LABOR FORCE
14.5%
UNEMPLOYMENT RATE
Income in Port Clinton borough
Income Overview in Port Clinton borough
Per Capita Income in Port Clinton borough is $27,629, while median incomes of families and households are $80,000 and $68,750 respectively.
| Characteristic | Number | Measure |
| Per Capita Income | 354 | $27,629 |
| Median Family Income | 80 | $80,000 |
| Mean Family Income | 80 | $87,105 |
| Median Household Income | 126 | $68,750 |
| Mean Household Income | 126 | $77,177 |
| Income Deficit | 80 | $0 |
| Wage / Income Gap (%) | 354 | 2.05% |
| Wage / Income Gap ($) | 354 | 97.95¢ per $1 |
| Gini / Inequality Index | 354 | 0.31 |
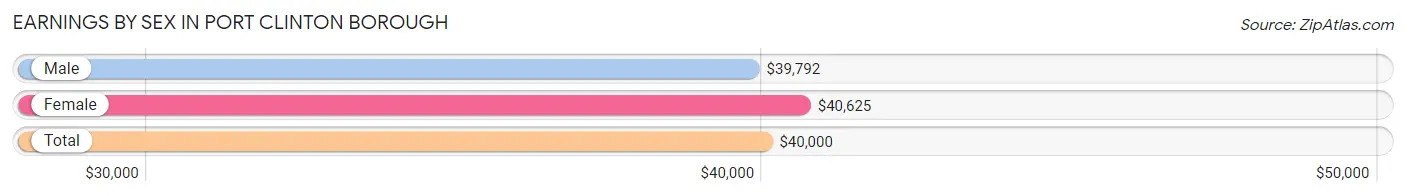
Earnings by Sex in Port Clinton borough
Average Earnings in Port Clinton borough are $40,000, $39,792 for men and $40,625 for women, a difference of 2.1%.
| Sex | Number | Average Earnings |
| Male | 103 (60.6%) | $39,792 |
| Female | 67 (39.4%) | $40,625 |
| Total | 170 (100.0%) | $40,000 |
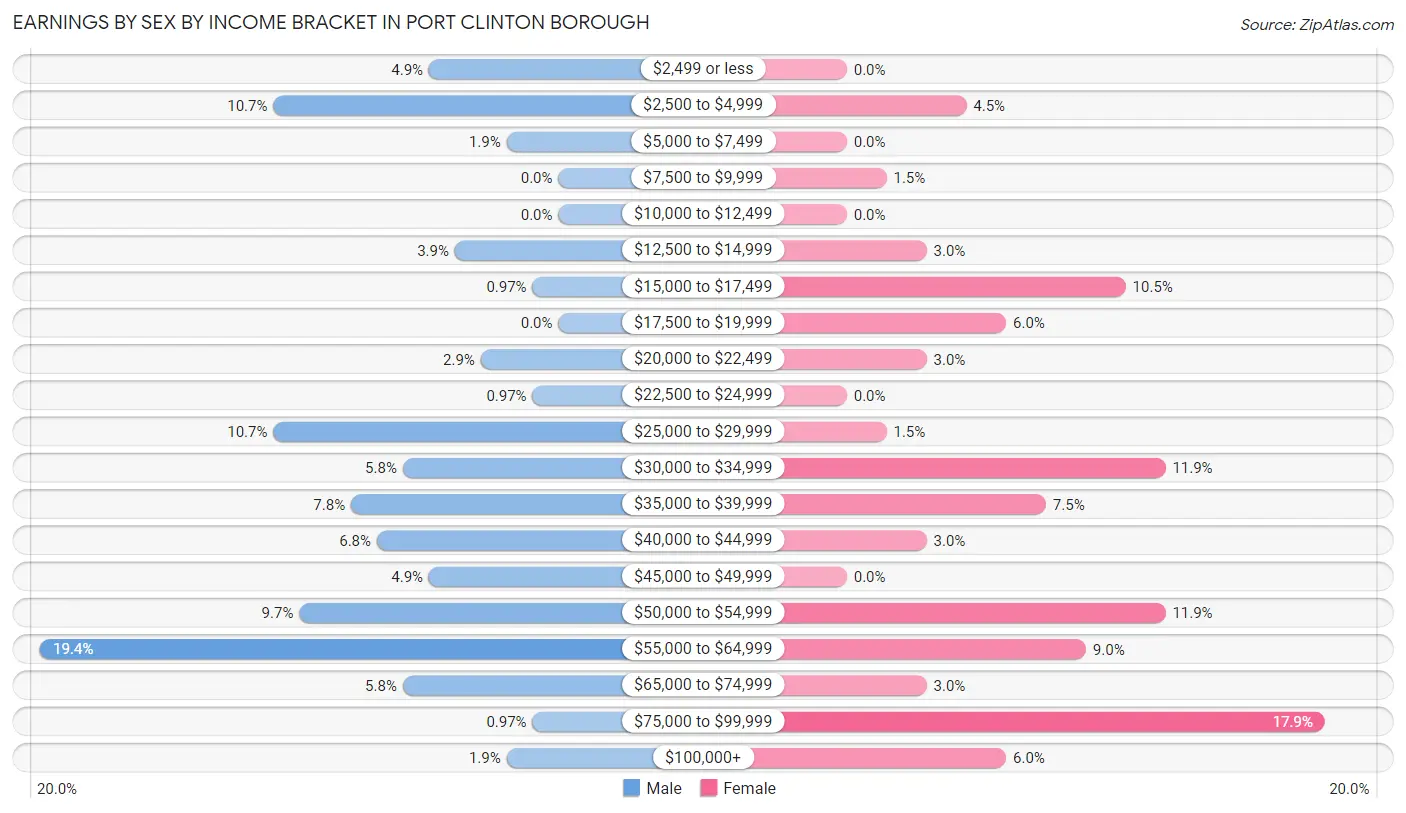
Earnings by Sex by Income Bracket in Port Clinton borough
The most common earnings brackets in Port Clinton borough are $55,000 to $64,999 for men (20 | 19.4%) and $75,000 to $99,999 for women (12 | 17.9%).
| Income | Male | Female |
| $2,499 or less | 5 (4.9%) | 0 (0.0%) |
| $2,500 to $4,999 | 11 (10.7%) | 3 (4.5%) |
| $5,000 to $7,499 | 2 (1.9%) | 0 (0.0%) |
| $7,500 to $9,999 | 0 (0.0%) | 1 (1.5%) |
| $10,000 to $12,499 | 0 (0.0%) | 0 (0.0%) |
| $12,500 to $14,999 | 4 (3.9%) | 2 (3.0%) |
| $15,000 to $17,499 | 1 (1.0%) | 7 (10.4%) |
| $17,500 to $19,999 | 0 (0.0%) | 4 (6.0%) |
| $20,000 to $22,499 | 3 (2.9%) | 2 (3.0%) |
| $22,500 to $24,999 | 1 (1.0%) | 0 (0.0%) |
| $25,000 to $29,999 | 11 (10.7%) | 1 (1.5%) |
| $30,000 to $34,999 | 6 (5.8%) | 8 (11.9%) |
| $35,000 to $39,999 | 8 (7.8%) | 5 (7.5%) |
| $40,000 to $44,999 | 7 (6.8%) | 2 (3.0%) |
| $45,000 to $49,999 | 5 (4.9%) | 0 (0.0%) |
| $50,000 to $54,999 | 10 (9.7%) | 8 (11.9%) |
| $55,000 to $64,999 | 20 (19.4%) | 6 (9.0%) |
| $65,000 to $74,999 | 6 (5.8%) | 2 (3.0%) |
| $75,000 to $99,999 | 1 (1.0%) | 12 (17.9%) |
| $100,000+ | 2 (1.9%) | 4 (6.0%) |
| Total | 103 (100.0%) | 67 (100.0%) |
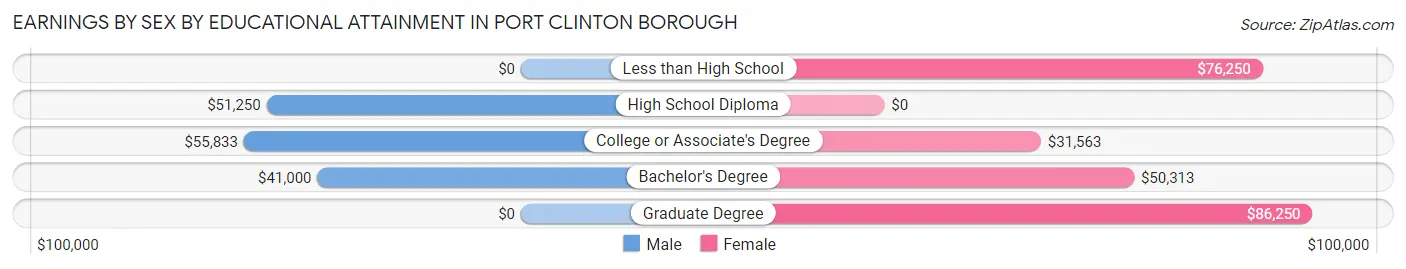
Earnings by Sex by Educational Attainment in Port Clinton borough
Average earnings in Port Clinton borough are $46,000 for men and $51,458 for women, a difference of 10.6%. Men with an educational attainment of college or associate's degree enjoy the highest average annual earnings of $55,833, while those with bachelor's degree education earn the least with $41,000. Women with an educational attainment of graduate degree earn the most with the average annual earnings of $86,250, while those with college or associate's degree education have the smallest earnings of $31,563.
| Educational Attainment | Male Income | Female Income |
| Less than High School | - | - |
| High School Diploma | $51,250 | $0 |
| College or Associate's Degree | $55,833 | $31,563 |
| Bachelor's Degree | $41,000 | $50,313 |
| Graduate Degree | - | - |
| Total | $46,000 | $51,458 |
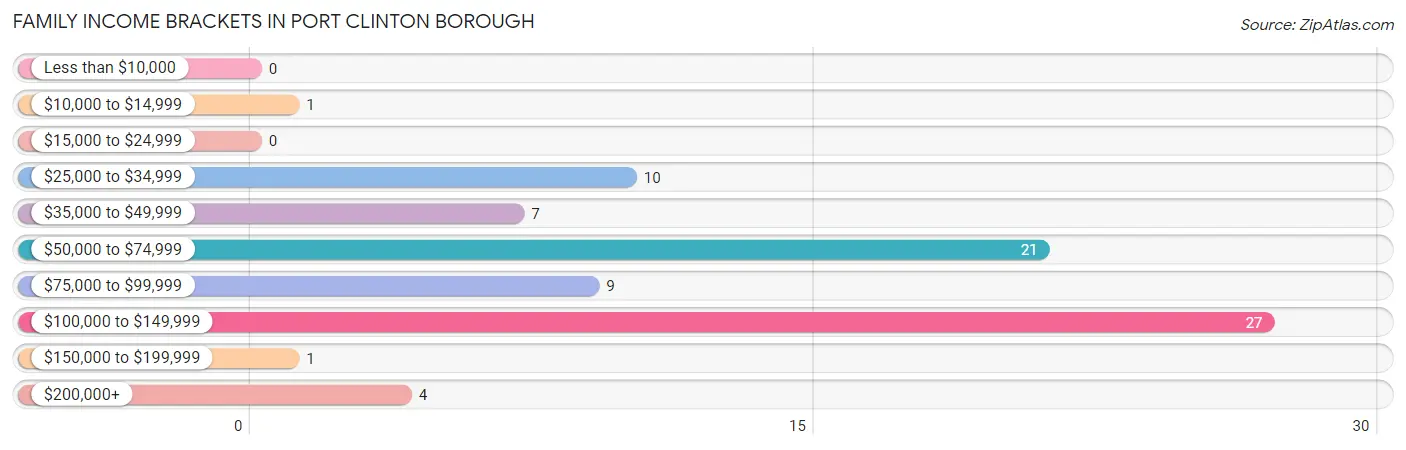
Family Income in Port Clinton borough
Family Income Brackets in Port Clinton borough
According to the Port Clinton borough family income data, there are 27 families falling into the $100,000 to $149,999 income range, which is the most common income bracket and makes up 33.8% of all families.
| Income Bracket | # Families | % Families |
| Less than $10,000 | 0 | 0.0% |
| $10,000 to $14,999 | 1 | 1.3% |
| $15,000 to $24,999 | 0 | 0.0% |
| $25,000 to $34,999 | 10 | 12.5% |
| $35,000 to $49,999 | 7 | 8.8% |
| $50,000 to $74,999 | 21 | 26.3% |
| $75,000 to $99,999 | 9 | 11.3% |
| $100,000 to $149,999 | 27 | 33.8% |
| $150,000 to $199,999 | 1 | 1.3% |
| $200,000+ | 4 | 5.0% |
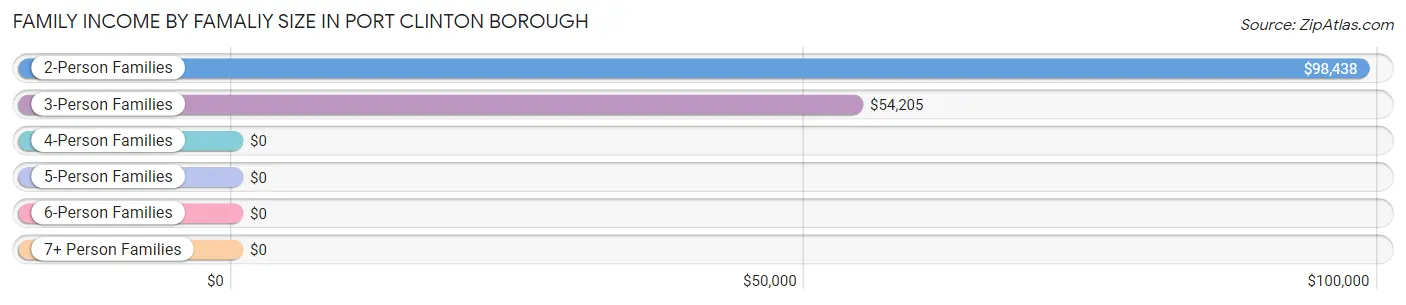
Family Income by Famaliy Size in Port Clinton borough
2-person families (33 | 41.2%) account for the highest median family income in Port Clinton borough with $98,438 per family, while 2-person families (33 | 41.2%) have the highest median income of $49,219 per family member.
| Income Bracket | # Families | Median Income |
| 2-Person Families | 33 (41.2%) | $98,438 |
| 3-Person Families | 31 (38.8%) | $54,205 |
| 4-Person Families | 1 (1.3%) | $0 |
| 5-Person Families | 6 (7.5%) | $0 |
| 6-Person Families | 8 (10.0%) | $0 |
| 7+ Person Families | 1 (1.3%) | $0 |
| Total | 80 (100.0%) | $80,000 |
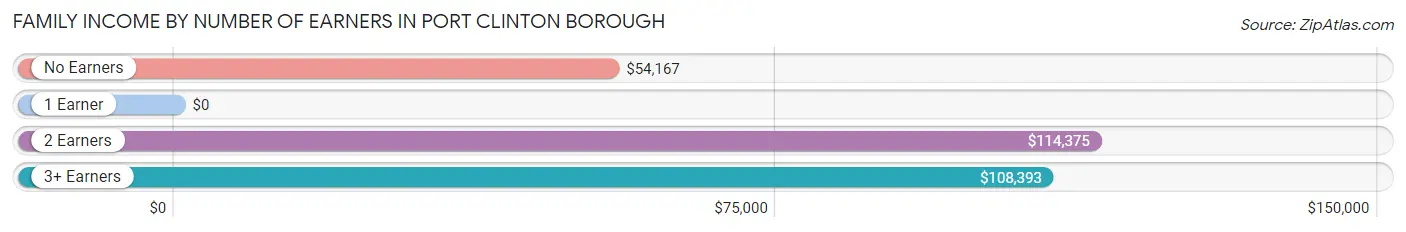
Family Income by Number of Earners in Port Clinton borough
| Number of Earners | # Families | Median Income |
| No Earners | 18 (22.5%) | $54,167 |
| 1 Earner | 22 (27.5%) | $0 |
| 2 Earners | 25 (31.2%) | $114,375 |
| 3+ Earners | 15 (18.8%) | $108,393 |
| Total | 80 (100.0%) | $80,000 |
Household Income in Port Clinton borough
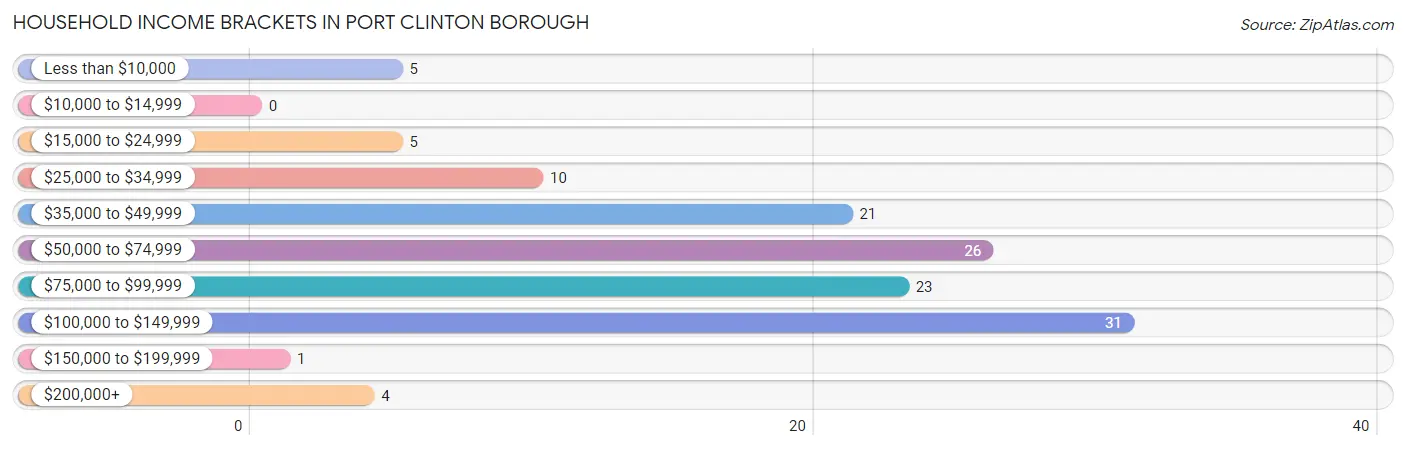
Household Income Brackets in Port Clinton borough
With 31 households falling in the category, the $100,000 to $149,999 income range is the most frequent in Port Clinton borough, accounting for 24.6% of all households.
| Income Bracket | # Households | % Households |
| Less than $10,000 | 5 | 4.0% |
| $10,000 to $14,999 | 0 | 0.0% |
| $15,000 to $24,999 | 5 | 4.0% |
| $25,000 to $34,999 | 10 | 7.9% |
| $35,000 to $49,999 | 21 | 16.7% |
| $50,000 to $74,999 | 26 | 20.6% |
| $75,000 to $99,999 | 23 | 18.3% |
| $100,000 to $149,999 | 31 | 24.6% |
| $150,000 to $199,999 | 1 | 0.8% |
| $200,000+ | 4 | 3.2% |
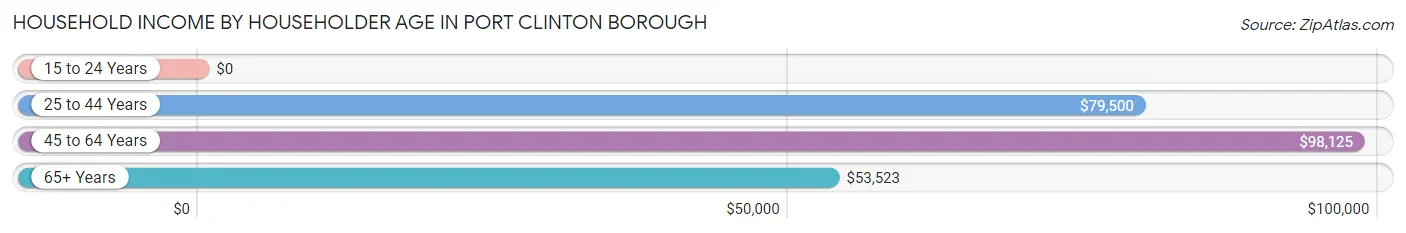
Household Income by Householder Age in Port Clinton borough
The median household income in Port Clinton borough is $68,750, with the highest median household income of $98,125 found in the 45 to 64 years age bracket for the primary householder. A total of 40 households (31.8%) fall into this category. Meanwhile, the 15 to 24 years age bracket for the primary householder has the lowest median household income of $0, with 5 households (4.0%) in this group.
| Income Bracket | # Households | Median Income |
| 15 to 24 Years | 5 (4.0%) | $0 |
| 25 to 44 Years | 44 (34.9%) | $79,500 |
| 45 to 64 Years | 40 (31.8%) | $98,125 |
| 65+ Years | 37 (29.4%) | $53,523 |
| Total | 126 (100.0%) | $68,750 |
Poverty in Port Clinton borough
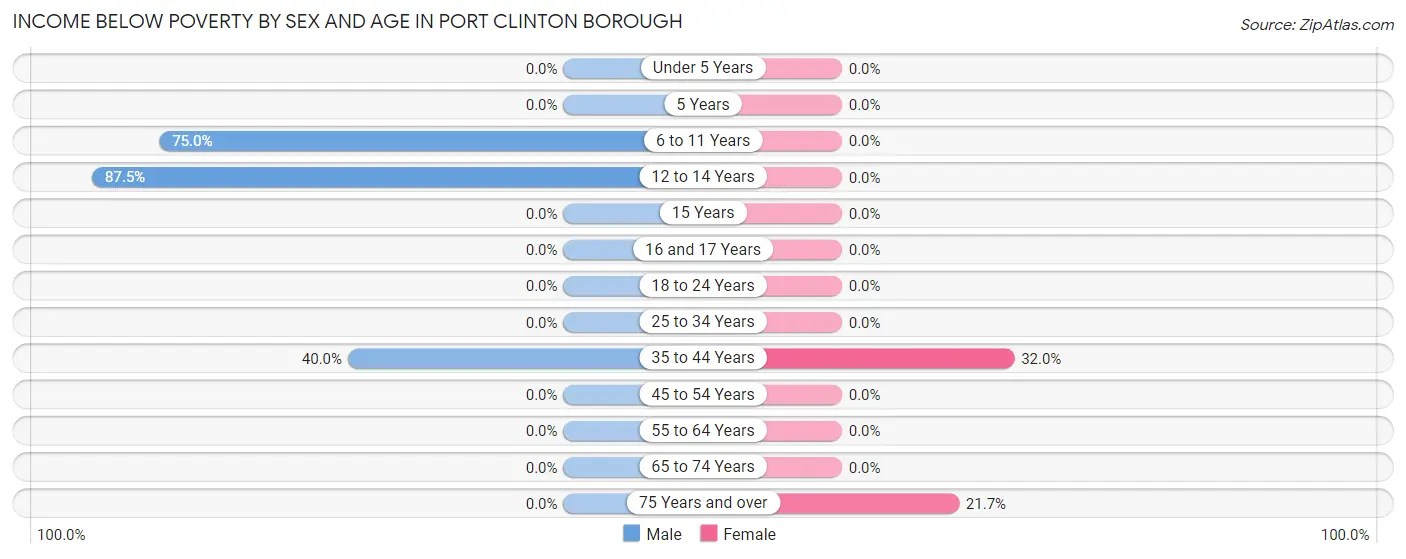
Income Below Poverty by Sex and Age in Port Clinton borough
With 13.2% poverty level for males and 8.3% for females among the residents of Port Clinton borough, 12 to 14 year old males and 35 to 44 year old females are the most vulnerable to poverty, with 14 males (87.5%) and 8 females (32.0%) in their respective age groups living below the poverty level.
| Age Bracket | Male | Female |
| Under 5 Years | 0 (0.0%) | 0 (0.0%) |
| 5 Years | 0 (0.0%) | 0 (0.0%) |
| 6 to 11 Years | 6 (75.0%) | 0 (0.0%) |
| 12 to 14 Years | 14 (87.5%) | 0 (0.0%) |
| 15 Years | 0 (0.0%) | 0 (0.0%) |
| 16 and 17 Years | 0 (0.0%) | 0 (0.0%) |
| 18 to 24 Years | 0 (0.0%) | 0 (0.0%) |
| 25 to 34 Years | 0 (0.0%) | 0 (0.0%) |
| 35 to 44 Years | 6 (40.0%) | 8 (32.0%) |
| 45 to 54 Years | 0 (0.0%) | 0 (0.0%) |
| 55 to 64 Years | 0 (0.0%) | 0 (0.0%) |
| 65 to 74 Years | 0 (0.0%) | 0 (0.0%) |
| 75 Years and over | 0 (0.0%) | 5 (21.7%) |
| Total | 26 (13.2%) | 13 (8.3%) |
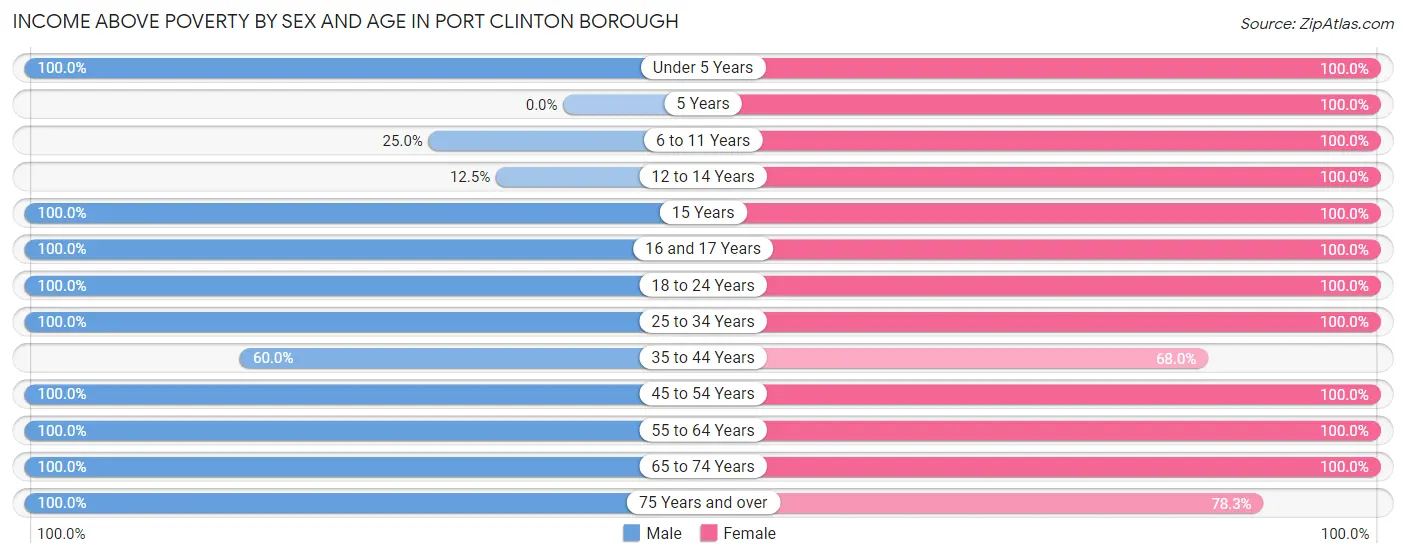
Income Above Poverty by Sex and Age in Port Clinton borough
According to the poverty statistics in Port Clinton borough, males aged under 5 years and females aged under 5 years are the age groups that are most secure financially, with 100.0% of males and 100.0% of females in these age groups living above the poverty line.
| Age Bracket | Male | Female |
| Under 5 Years | 17 (100.0%) | 13 (100.0%) |
| 5 Years | 0 (0.0%) | 2 (100.0%) |
| 6 to 11 Years | 2 (25.0%) | 6 (100.0%) |
| 12 to 14 Years | 2 (12.5%) | 5 (100.0%) |
| 15 Years | 10 (100.0%) | 2 (100.0%) |
| 16 and 17 Years | 13 (100.0%) | 2 (100.0%) |
| 18 to 24 Years | 35 (100.0%) | 8 (100.0%) |
| 25 to 34 Years | 23 (100.0%) | 23 (100.0%) |
| 35 to 44 Years | 9 (60.0%) | 17 (68.0%) |
| 45 to 54 Years | 16 (100.0%) | 3 (100.0%) |
| 55 to 64 Years | 25 (100.0%) | 27 (100.0%) |
| 65 to 74 Years | 7 (100.0%) | 18 (100.0%) |
| 75 Years and over | 12 (100.0%) | 18 (78.3%) |
| Total | 171 (86.8%) | 144 (91.7%) |
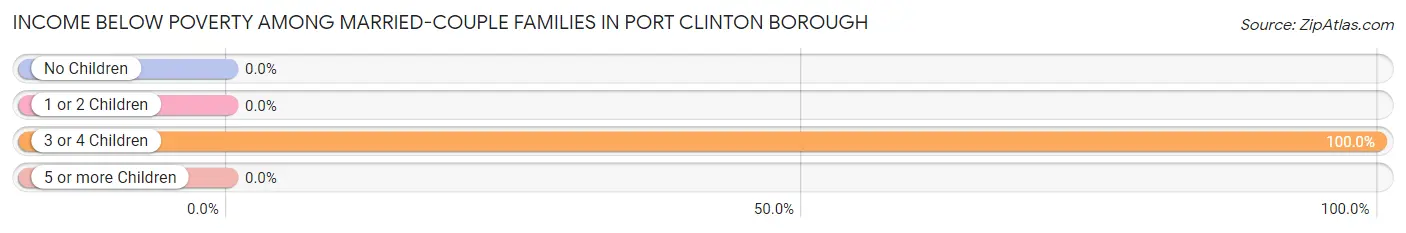
Income Below Poverty Among Married-Couple Families in Port Clinton borough
The poverty statistics for married-couple families in Port Clinton borough show that 9.8% or 6 of the total 61 families live below the poverty line. Families with 3 or 4 children have the highest poverty rate of 100.0%, comprising of 6 families. On the other hand, families with no children have the lowest poverty rate of 0.0%, which includes 0 families.
| Children | Above Poverty | Below Poverty |
| No Children | 33 (100.0%) | 0 (0.0%) |
| 1 or 2 Children | 22 (100.0%) | 0 (0.0%) |
| 3 or 4 Children | 0 (0.0%) | 6 (100.0%) |
| 5 or more Children | 0 (0.0%) | 0 (0.0%) |
| Total | 55 (90.2%) | 6 (9.8%) |
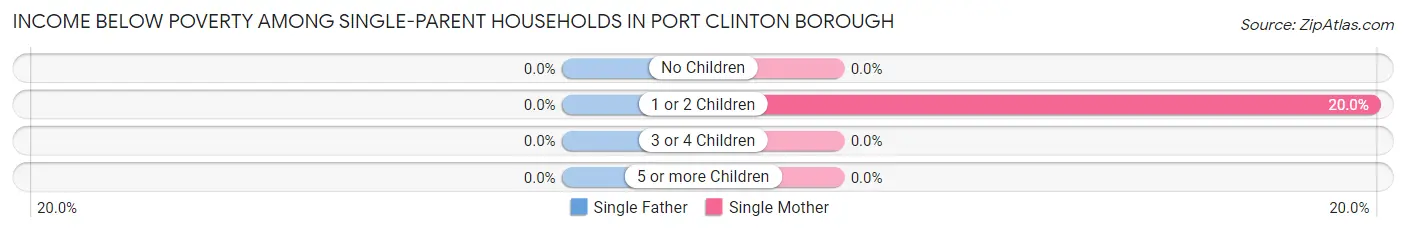
Income Below Poverty Among Single-Parent Households in Port Clinton borough
| Children | Single Father | Single Mother |
| No Children | 0 (0.0%) | 0 (0.0%) |
| 1 or 2 Children | 0 (0.0%) | 1 (20.0%) |
| 3 or 4 Children | 0 (0.0%) | 0 (0.0%) |
| 5 or more Children | 0 (0.0%) | 0 (0.0%) |
| Total | 0 (0.0%) | 1 (8.3%) |
Income Below Poverty Among Married-Couple vs Single-Parent Households in Port Clinton borough
The poverty data for Port Clinton borough shows that 6 of the married-couple family households (9.8%) and 1 of the single-parent households (5.3%) are living below the poverty level. Within the married-couple family households, those with 3 or 4 children have the highest poverty rate, with 6 households (100.0%) falling below the poverty line. Among the single-parent households, those with 1 or 2 children have the highest poverty rate, with 1 household (14.3%) living below poverty.
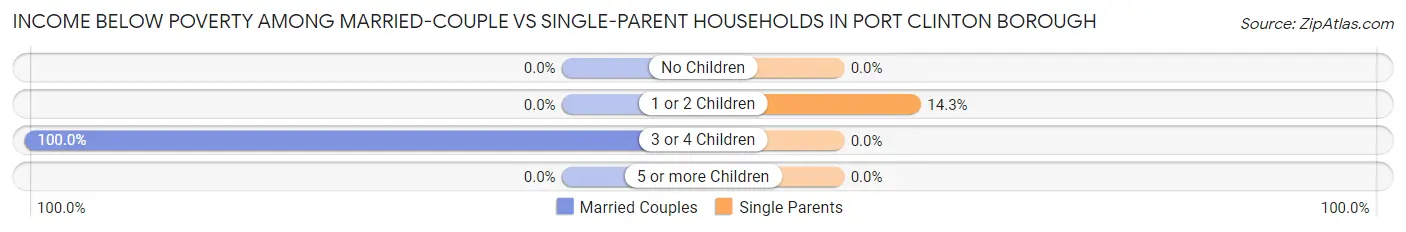
| Children | Married-Couple Families | Single-Parent Households |
| No Children | 0 (0.0%) | 0 (0.0%) |
| 1 or 2 Children | 0 (0.0%) | 1 (14.3%) |
| 3 or 4 Children | 6 (100.0%) | 0 (0.0%) |
| 5 or more Children | 0 (0.0%) | 0 (0.0%) |
| Total | 6 (9.8%) | 1 (5.3%) |
Race in Port Clinton borough
The most populous races in Port Clinton borough are White / Caucasian (322 | 91.0%), Two or more Races (28 | 7.9%), and Hispanic or Latino (7 | 2.0%).
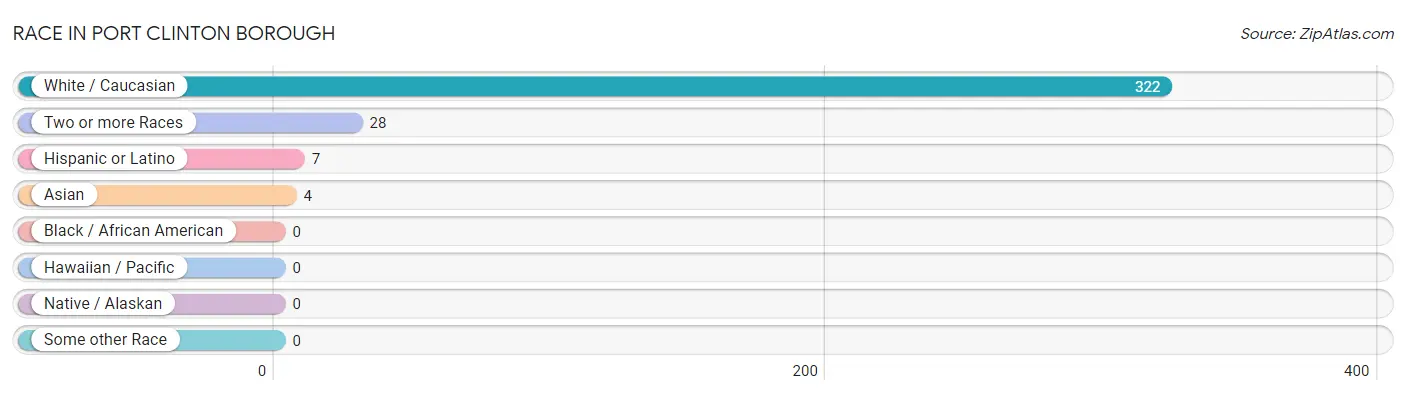
| Race | # Population | % Population |
| Asian | 4 | 1.1% |
| Black / African American | 0 | 0.0% |
| Hawaiian / Pacific | 0 | 0.0% |
| Hispanic or Latino | 7 | 2.0% |
| Native / Alaskan | 0 | 0.0% |
| White / Caucasian | 322 | 91.0% |
| Two or more Races | 28 | 7.9% |
| Some other Race | 0 | 0.0% |
| Total | 354 | 100.0% |
Ancestry in Port Clinton borough
The most populous ancestries reported in Port Clinton borough are German (155 | 43.8%), Irish (85 | 24.0%), Korean (27 | 7.6%), Welsh (26 | 7.3%), and European (12 | 3.4%), together accounting for 86.2% of all Port Clinton borough residents.
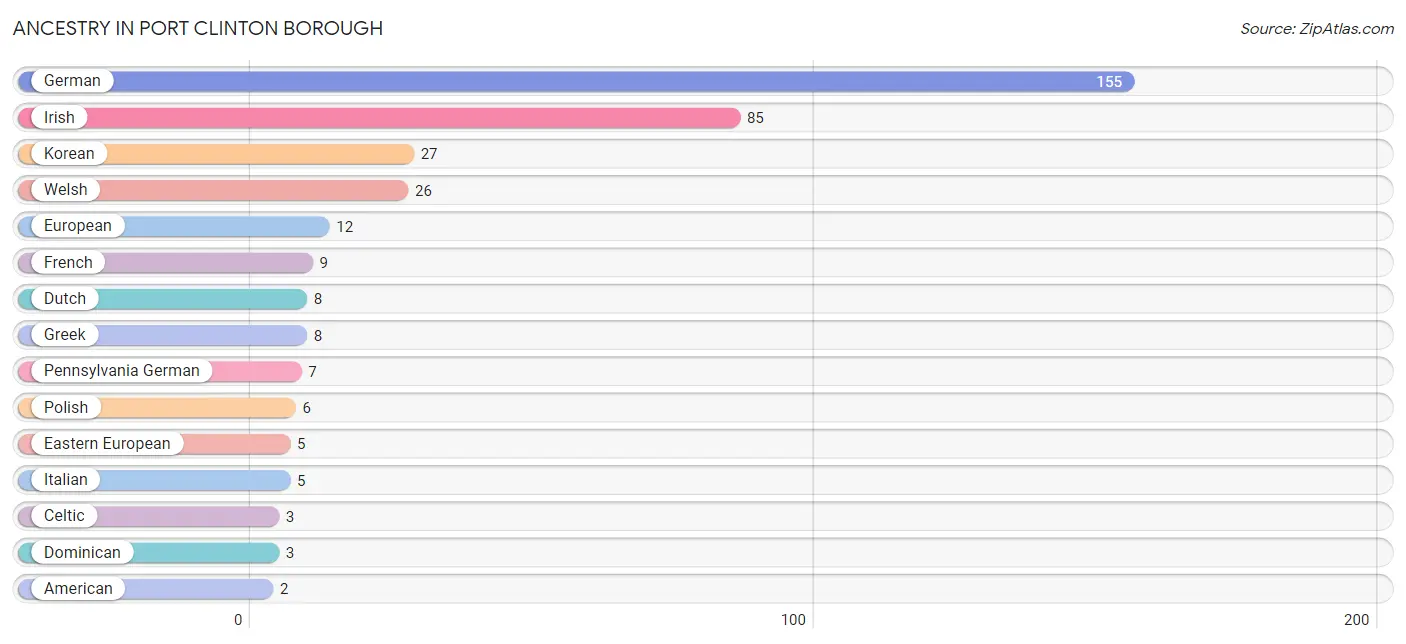
| Ancestry | # Population | % Population |
| American | 2 | 0.6% |
| Celtic | 3 | 0.9% |
| Dominican | 3 | 0.9% |
| Dutch | 8 | 2.3% |
| Eastern European | 5 | 1.4% |
| English | 1 | 0.3% |
| European | 12 | 3.4% |
| French | 9 | 2.5% |
| German | 155 | 43.8% |
| Greek | 8 | 2.3% |
| Irish | 85 | 24.0% |
| Italian | 5 | 1.4% |
| Korean | 27 | 7.6% |
| Lithuanian | 1 | 0.3% |
| Mexican | 2 | 0.6% |
| Pennsylvania German | 7 | 2.0% |
| Polish | 6 | 1.7% |
| Puerto Rican | 2 | 0.6% |
| Scottish | 1 | 0.3% |
| Slovak | 1 | 0.3% |
| Swiss | 1 | 0.3% |
| Welsh | 26 | 7.3% | View All 22 Rows |
Immigrants in Port Clinton borough
The most numerous immigrant groups reported in Port Clinton borough came from Asia (4 | 1.1%), Philippines (4 | 1.1%), and South Eastern Asia (4 | 1.1%), together accounting for 3.4% of all Port Clinton borough residents.
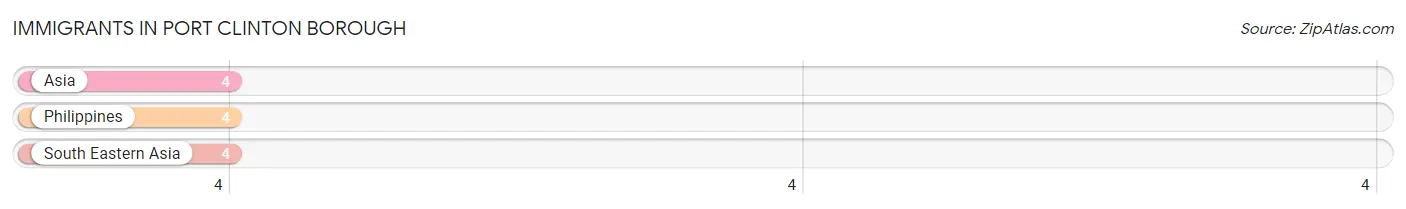
| Immigration Origin | # Population | % Population |
| Asia | 4 | 1.1% |
| Philippines | 4 | 1.1% |
| South Eastern Asia | 4 | 1.1% | View All 3 Rows |
Sex and Age in Port Clinton borough
Sex and Age in Port Clinton borough
The most populous age groups in Port Clinton borough are 15 to 19 Years (30 | 15.2%) for men and 55 to 59 Years (22 | 14.0%) for women.
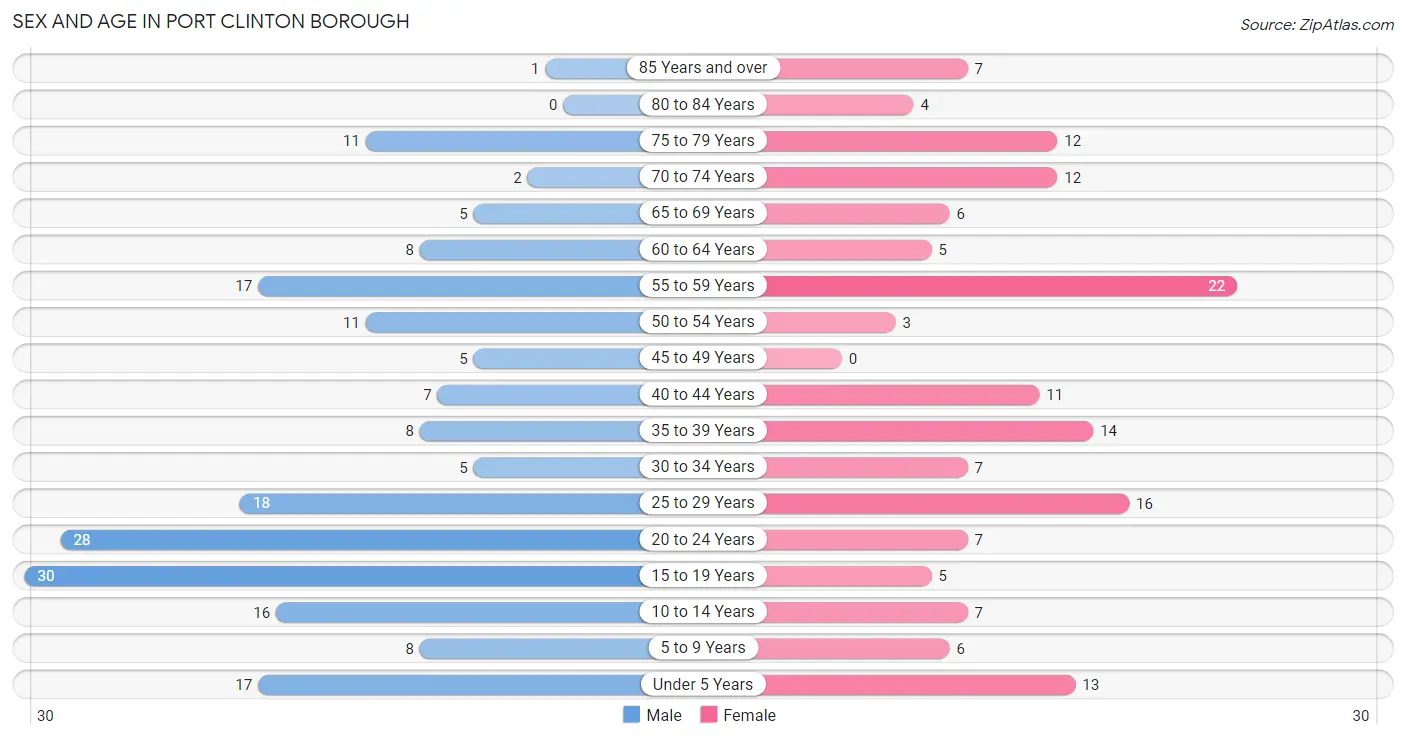
| Age Bracket | Male | Female |
| Under 5 Years | 17 (8.6%) | 13 (8.3%) |
| 5 to 9 Years | 8 (4.1%) | 6 (3.8%) |
| 10 to 14 Years | 16 (8.1%) | 7 (4.5%) |
| 15 to 19 Years | 30 (15.2%) | 5 (3.2%) |
| 20 to 24 Years | 28 (14.2%) | 7 (4.5%) |
| 25 to 29 Years | 18 (9.1%) | 16 (10.2%) |
| 30 to 34 Years | 5 (2.5%) | 7 (4.5%) |
| 35 to 39 Years | 8 (4.1%) | 14 (8.9%) |
| 40 to 44 Years | 7 (3.5%) | 11 (7.0%) |
| 45 to 49 Years | 5 (2.5%) | 0 (0.0%) |
| 50 to 54 Years | 11 (5.6%) | 3 (1.9%) |
| 55 to 59 Years | 17 (8.6%) | 22 (14.0%) |
| 60 to 64 Years | 8 (4.1%) | 5 (3.2%) |
| 65 to 69 Years | 5 (2.5%) | 6 (3.8%) |
| 70 to 74 Years | 2 (1.0%) | 12 (7.6%) |
| 75 to 79 Years | 11 (5.6%) | 12 (7.6%) |
| 80 to 84 Years | 0 (0.0%) | 4 (2.5%) |
| 85 Years and over | 1 (0.5%) | 7 (4.5%) |
| Total | 197 (100.0%) | 157 (100.0%) |
Families and Households in Port Clinton borough
Median Family Size in Port Clinton borough
The median family size in Port Clinton borough is 3.55 persons per family, with single female/mother families (12 | 15.0%) accounting for the largest median family size of 5.25 persons per family. On the other hand, single male/father families (7 | 8.7%) represent the smallest median family size with 2.86 persons per family.
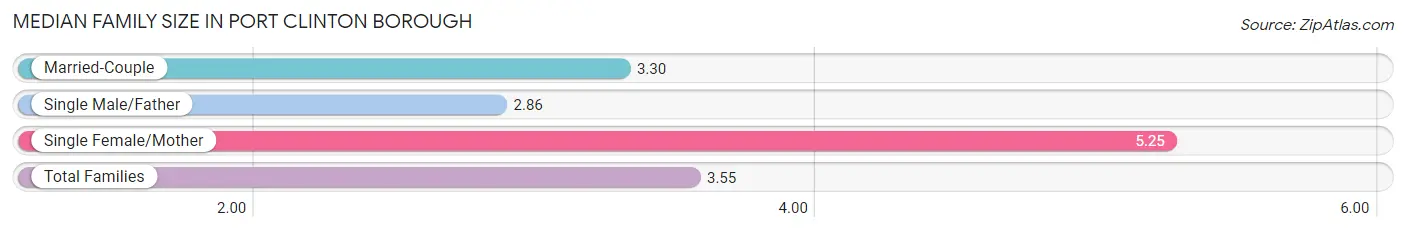
| Family Type | # Families | Family Size |
| Married-Couple | 61 (76.2%) | 3.30 |
| Single Male/Father | 7 (8.7%) | 2.86 |
| Single Female/Mother | 12 (15.0%) | 5.25 |
| Total Families | 80 (100.0%) | 3.55 |
Median Household Size in Port Clinton borough
The median household size in Port Clinton borough is 2.81 persons per household, with single female/mother households (12 | 9.5%) accounting for the largest median household size of 5.5 persons per household. non-family households (46 | 36.5%) represent the smallest median household size with 1.41 persons per household.
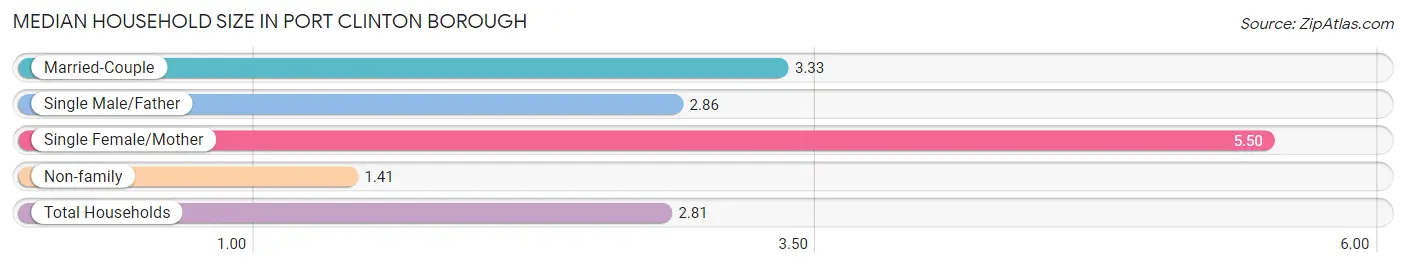
| Household Type | # Households | Household Size |
| Married-Couple | 61 (48.4%) | 3.33 |
| Single Male/Father | 7 (5.6%) | 2.86 |
| Single Female/Mother | 12 (9.5%) | 5.50 |
| Non-family | 46 (36.5%) | 1.41 |
| Total Households | 126 (100.0%) | 2.81 |
Household Size by Marriage Status in Port Clinton borough
Out of a total of 126 households in Port Clinton borough, 80 (63.5%) are family households, while 46 (36.5%) are nonfamily households. The most numerous type of family households are 3-person households, comprising 34, and the most common type of nonfamily households are 1-person households, comprising 26.
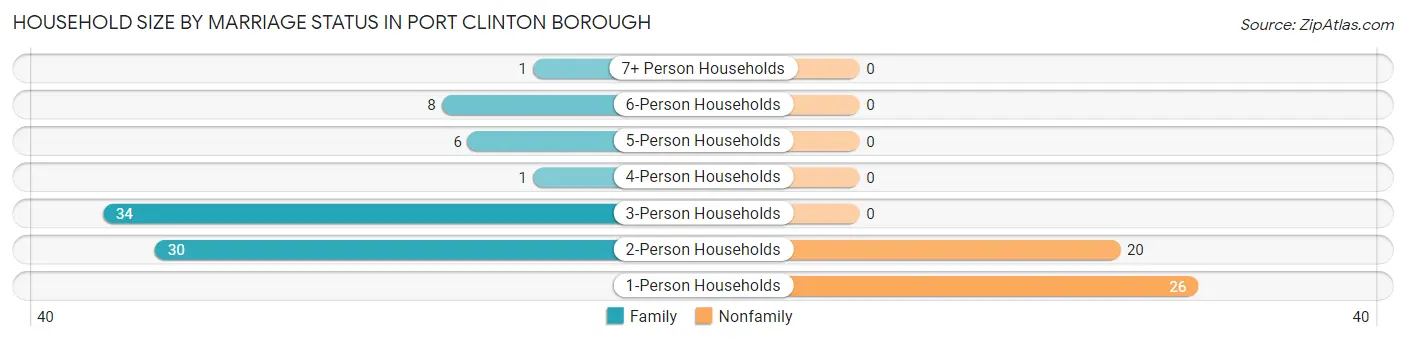
| Household Size | Family Households | Nonfamily Households |
| 1-Person Households | - | 26 (20.6%) |
| 2-Person Households | 30 (23.8%) | 20 (15.9%) |
| 3-Person Households | 34 (27.0%) | 0 (0.0%) |
| 4-Person Households | 1 (0.8%) | 0 (0.0%) |
| 5-Person Households | 6 (4.8%) | 0 (0.0%) |
| 6-Person Households | 8 (6.4%) | 0 (0.0%) |
| 7+ Person Households | 1 (0.8%) | 0 (0.0%) |
| Total | 80 (63.5%) | 46 (36.5%) |
Female Fertility in Port Clinton borough
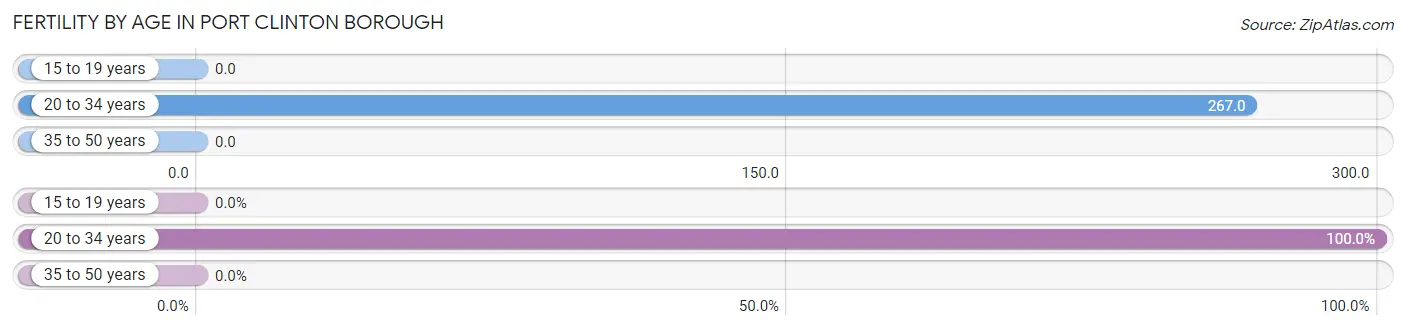
Fertility by Age in Port Clinton borough
Average fertility rate in Port Clinton borough is 129.0 births per 1,000 women. Women in the age bracket of 20 to 34 years have the highest fertility rate with 267.0 births per 1,000 women. Women in the age bracket of 20 to 34 years acount for 100.0% of all women with births.
| Age Bracket | Women with Births | Births / 1,000 Women |
| 15 to 19 years | 0 (0.0%) | 0.0 |
| 20 to 34 years | 8 (100.0%) | 267.0 |
| 35 to 50 years | 0 (0.0%) | 0.0 |
| Total | 8 (100.0%) | 129.0 |
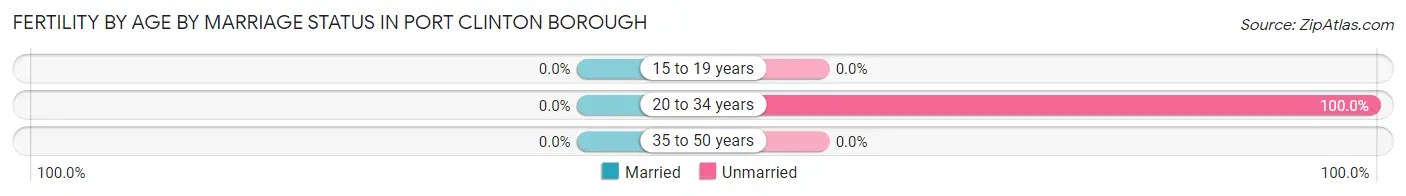
Fertility by Age by Marriage Status in Port Clinton borough
| Age Bracket | Married | Unmarried |
| 15 to 19 years | 0 (0.0%) | 0 (0.0%) |
| 20 to 34 years | 0 (0.0%) | 8 (100.0%) |
| 35 to 50 years | 0 (0.0%) | 0 (0.0%) |
| Total | 0 (0.0%) | 8 (100.0%) |
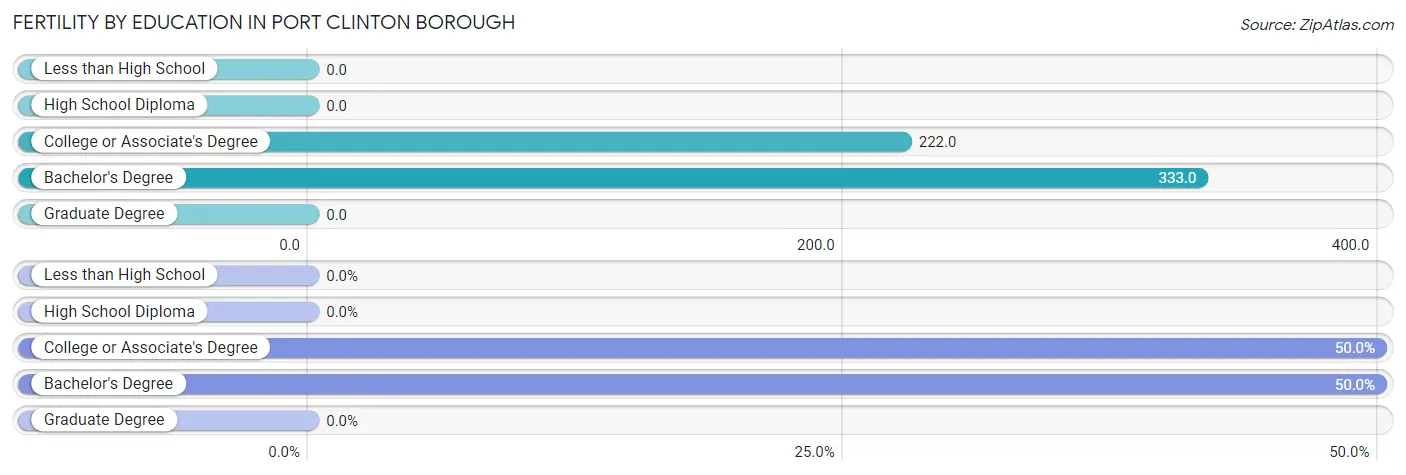
Fertility by Education in Port Clinton borough
| Educational Attainment | Women with Births | Births / 1,000 Women |
| Less than High School | 0 (0.0%) | 0.0 |
| High School Diploma | 0 (0.0%) | 0.0 |
| College or Associate's Degree | 4 (50.0%) | 222.0 |
| Bachelor's Degree | 4 (50.0%) | 333.0 |
| Graduate Degree | 0 (0.0%) | 0.0 |
| Total | 8 (100.0%) | 129.0 |
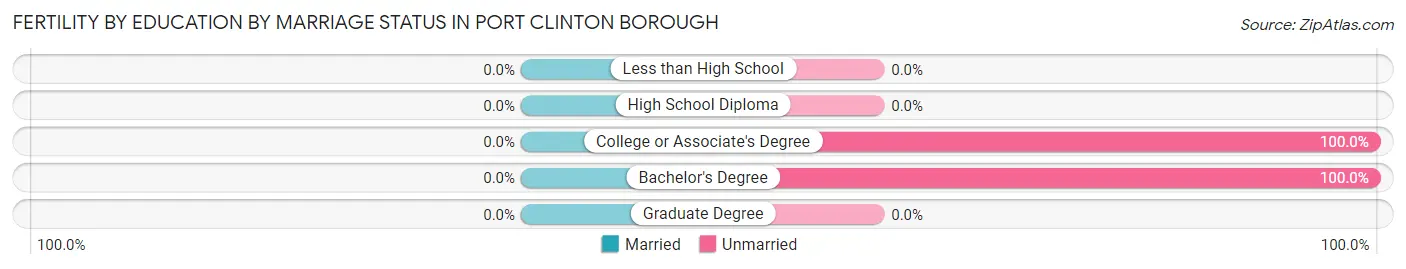
Fertility by Education by Marriage Status in Port Clinton borough
| Educational Attainment | Married | Unmarried |
| Less than High School | 0 (0.0%) | 0 (0.0%) |
| High School Diploma | 0 (0.0%) | 0 (0.0%) |
| College or Associate's Degree | 0 (0.0%) | 4 (100.0%) |
| Bachelor's Degree | 0 (0.0%) | 4 (100.0%) |
| Graduate Degree | 0 (0.0%) | 0 (0.0%) |
| Total | 0 (0.0%) | 8 (100.0%) |
Employment Characteristics in Port Clinton borough
Employment by Class of Employer in Port Clinton borough
Among the 147 employed individuals in Port Clinton borough, private company employees (114 | 77.5%), local government employees (12 | 8.2%), and not-for-profit organizations (7 | 4.8%) make up the most common classes of employment.
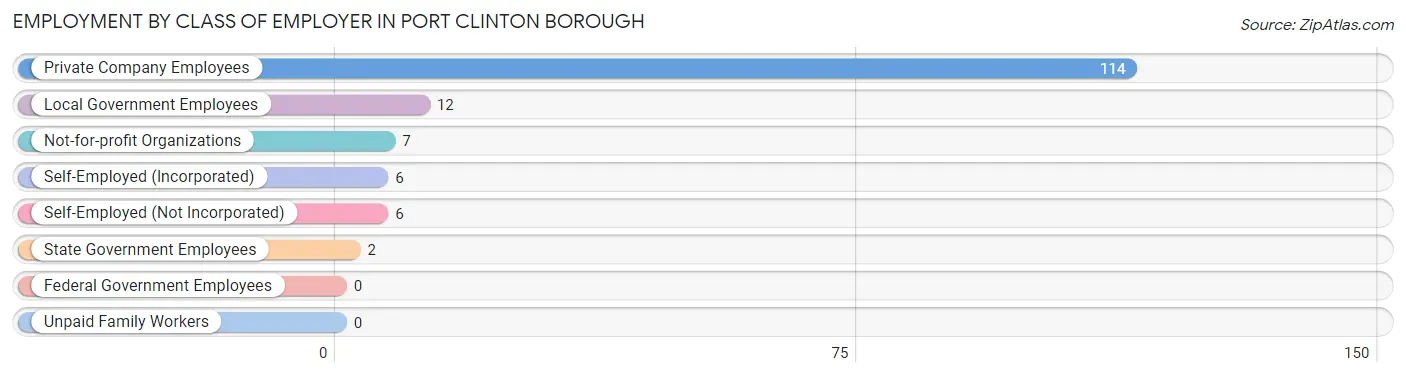
| Employer Class | # Employees | % Employees |
| Private Company Employees | 114 | 77.5% |
| Self-Employed (Incorporated) | 6 | 4.1% |
| Self-Employed (Not Incorporated) | 6 | 4.1% |
| Not-for-profit Organizations | 7 | 4.8% |
| Local Government Employees | 12 | 8.2% |
| State Government Employees | 2 | 1.4% |
| Federal Government Employees | 0 | 0.0% |
| Unpaid Family Workers | 0 | 0.0% |
| Total | 147 | 100.0% |
Employment Status by Age in Port Clinton borough
According to the labor force statistics for Port Clinton borough, out of the total population over 16 years of age (275), 62.9% or 173 individuals are in the labor force, with 14.5% or 25 of them unemployed. The age group with the highest labor force participation rate is 25 to 29 years, with 100.0% or 34 individuals in the labor force. Within the labor force, the 65 to 74 years age range has the highest percentage of unemployed individuals, with 33.3% or 2 of them being unemployed.
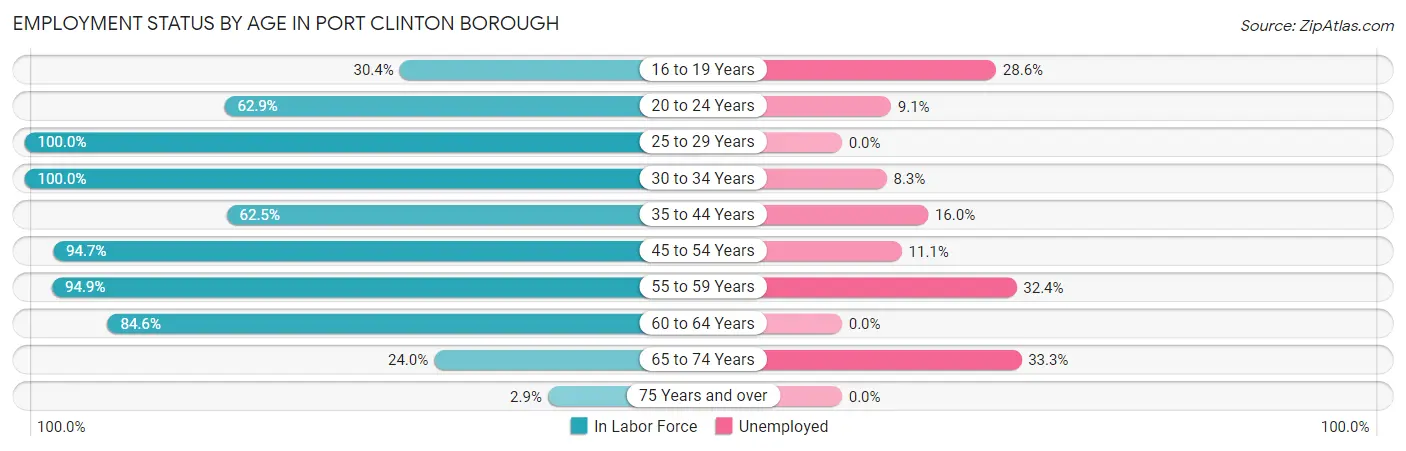
| Age Bracket | In Labor Force | Unemployed |
| 16 to 19 Years | 7 (30.4%) | 2 (28.6%) |
| 20 to 24 Years | 22 (62.9%) | 2 (9.1%) |
| 25 to 29 Years | 34 (100.0%) | 0 (0.0%) |
| 30 to 34 Years | 12 (100.0%) | 1 (8.3%) |
| 35 to 44 Years | 25 (62.5%) | 4 (16.0%) |
| 45 to 54 Years | 18 (94.7%) | 2 (11.1%) |
| 55 to 59 Years | 37 (94.9%) | 12 (32.4%) |
| 60 to 64 Years | 11 (84.6%) | 0 (0.0%) |
| 65 to 74 Years | 6 (24.0%) | 2 (33.3%) |
| 75 Years and over | 1 (2.9%) | 0 (0.0%) |
| Total | 173 (62.9%) | 25 (14.5%) |
Employment Status by Educational Attainment in Port Clinton borough
According to labor force statistics for Port Clinton borough, 87.3% of individuals (137) out of the total population between 25 and 64 years of age (157) are in the labor force, with 13.9% or 19 of them being unemployed. The group with the highest labor force participation rate are those with the educational attainment of bachelor's degree or higher, with 97.5% or 39 individuals in the labor force. Within the labor force, individuals with college / associate degree education have the highest percentage of unemployment, with 36.6% or 15 of them being unemployed.
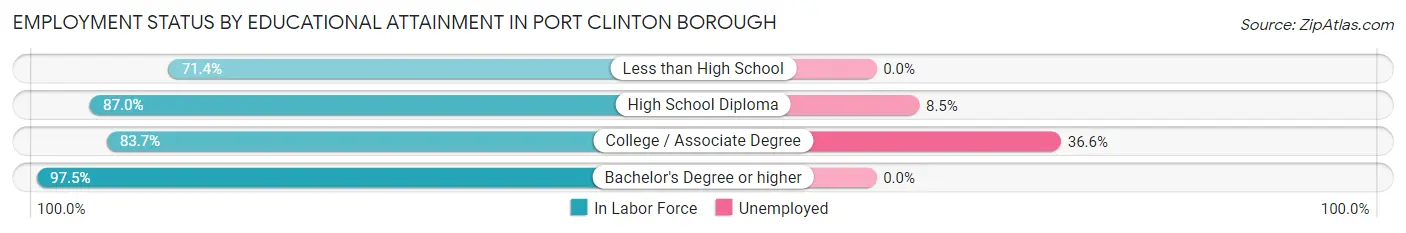
| Educational Attainment | In Labor Force | Unemployed |
| Less than High School | 10 (71.4%) | 0 (0.0%) |
| High School Diploma | 47 (87.0%) | 5 (8.5%) |
| College / Associate Degree | 41 (83.7%) | 18 (36.6%) |
| Bachelor's Degree or higher | 39 (97.5%) | 0 (0.0%) |
| Total | 137 (87.3%) | 22 (13.9%) |
Employment Occupations by Sex in Port Clinton borough
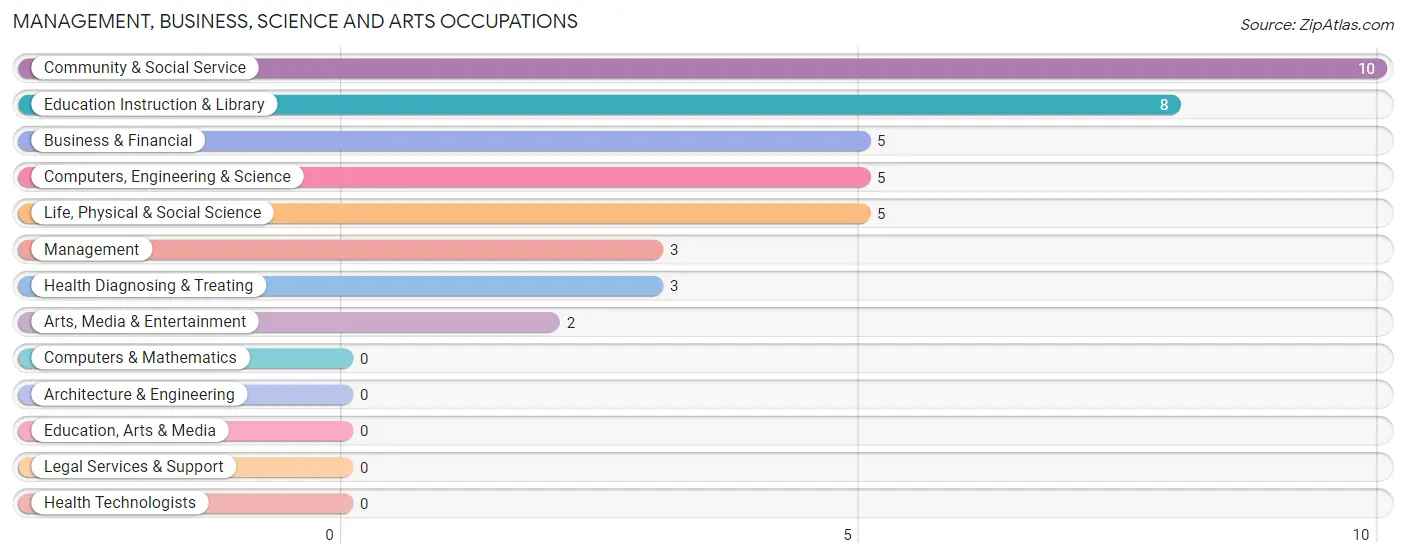
Management, Business, Science and Arts Occupations
The most common Management, Business, Science and Arts occupations in Port Clinton borough are Community & Social Service (10 | 6.8%), Education Instruction & Library (8 | 5.4%), Business & Financial (5 | 3.4%), Computers, Engineering & Science (5 | 3.4%), and Life, Physical & Social Science (5 | 3.4%).
Management, Business, Science and Arts Occupations by Sex
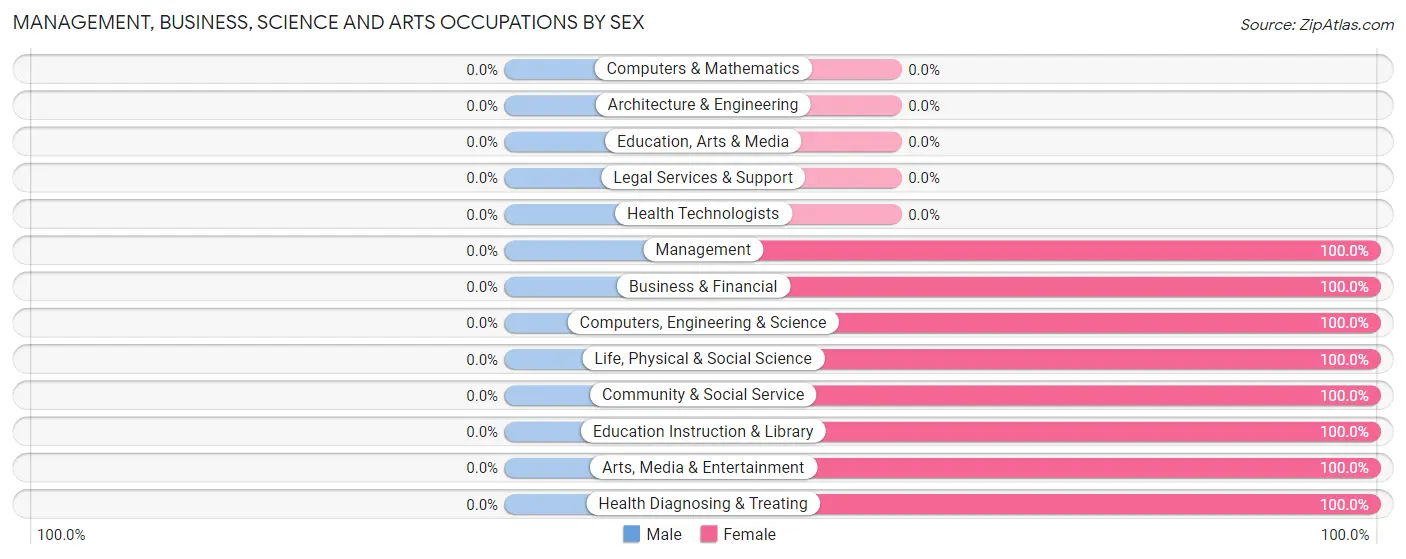
| Occupation | Male | Female |
| Management | 0 (0.0%) | 3 (100.0%) |
| Business & Financial | 0 (0.0%) | 5 (100.0%) |
| Computers, Engineering & Science | 0 (0.0%) | 5 (100.0%) |
| Computers & Mathematics | 0 (0.0%) | 0 (0.0%) |
| Architecture & Engineering | 0 (0.0%) | 0 (0.0%) |
| Life, Physical & Social Science | 0 (0.0%) | 5 (100.0%) |
| Community & Social Service | 0 (0.0%) | 10 (100.0%) |
| Education, Arts & Media | 0 (0.0%) | 0 (0.0%) |
| Legal Services & Support | 0 (0.0%) | 0 (0.0%) |
| Education Instruction & Library | 0 (0.0%) | 8 (100.0%) |
| Arts, Media & Entertainment | 0 (0.0%) | 2 (100.0%) |
| Health Diagnosing & Treating | 0 (0.0%) | 3 (100.0%) |
| Health Technologists | 0 (0.0%) | 0 (0.0%) |
| Total (Category) | 0 (0.0%) | 26 (100.0%) |
| Total (Overall) | 85 (57.4%) | 63 (42.6%) |
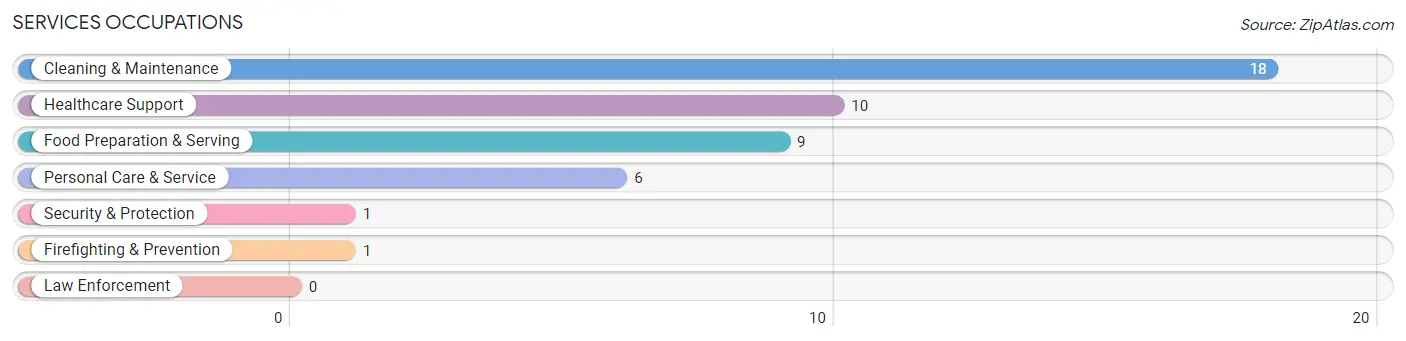
Services Occupations
The most common Services occupations in Port Clinton borough are Cleaning & Maintenance (18 | 12.2%), Healthcare Support (10 | 6.8%), Food Preparation & Serving (9 | 6.1%), Personal Care & Service (6 | 4.1%), and Security & Protection (1 | 0.7%).
Services Occupations by Sex
Within the Services occupations in Port Clinton borough, the most male-oriented occupations are Security & Protection (100.0%), Firefighting & Prevention (100.0%), and Cleaning & Maintenance (88.9%), while the most female-oriented occupations are Personal Care & Service (100.0%), Healthcare Support (80.0%), and Food Preparation & Serving (55.6%).
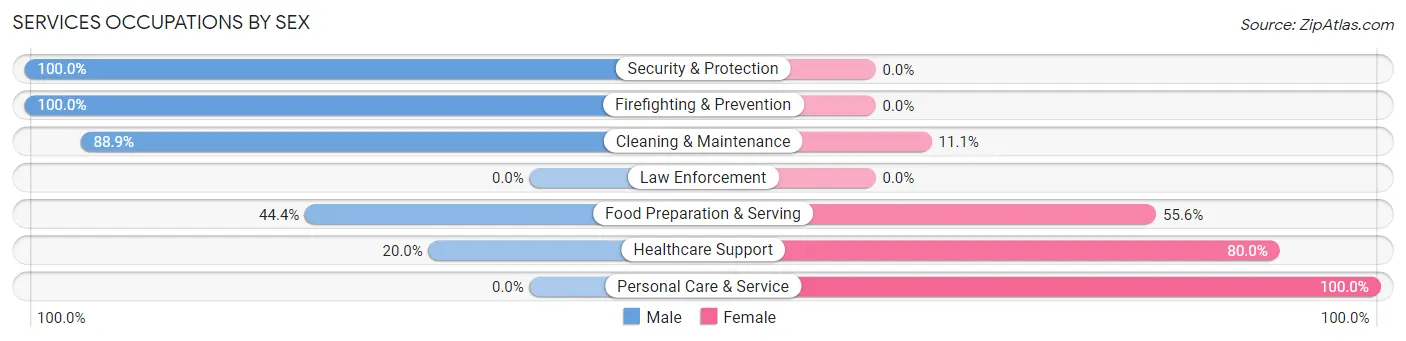
| Occupation | Male | Female |
| Healthcare Support | 2 (20.0%) | 8 (80.0%) |
| Security & Protection | 1 (100.0%) | 0 (0.0%) |
| Firefighting & Prevention | 1 (100.0%) | 0 (0.0%) |
| Law Enforcement | 0 (0.0%) | 0 (0.0%) |
| Food Preparation & Serving | 4 (44.4%) | 5 (55.6%) |
| Cleaning & Maintenance | 16 (88.9%) | 2 (11.1%) |
| Personal Care & Service | 0 (0.0%) | 6 (100.0%) |
| Total (Category) | 23 (52.3%) | 21 (47.7%) |
| Total (Overall) | 85 (57.4%) | 63 (42.6%) |
Sales and Office Occupations
The most common Sales and Office occupations in Port Clinton borough are Office & Administration (13 | 8.8%), and Sales & Related (4 | 2.7%).
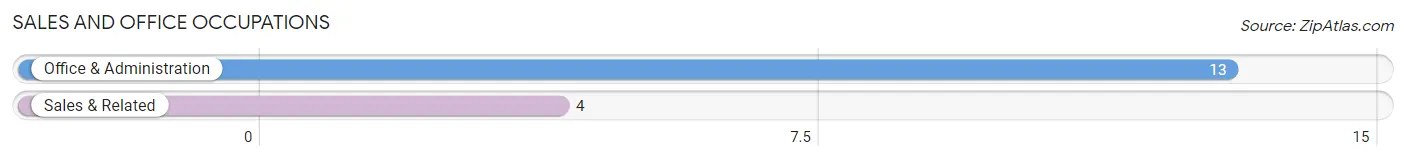
Sales and Office Occupations by Sex

| Occupation | Male | Female |
| Sales & Related | 3 (75.0%) | 1 (25.0%) |
| Office & Administration | 5 (38.5%) | 8 (61.5%) |
| Total (Category) | 8 (47.1%) | 9 (52.9%) |
| Total (Overall) | 85 (57.4%) | 63 (42.6%) |
Natural Resources, Construction and Maintenance Occupations
The most common Natural Resources, Construction and Maintenance occupations in Port Clinton borough are Installation, Maintenance & Repair (13 | 8.8%), and Construction & Extraction (9 | 6.1%).
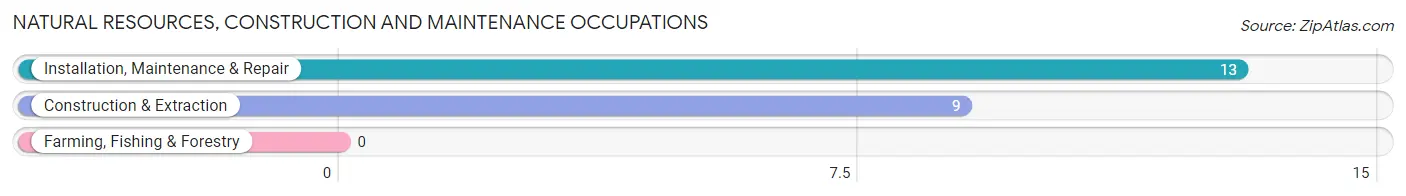
Natural Resources, Construction and Maintenance Occupations by Sex

| Occupation | Male | Female |
| Farming, Fishing & Forestry | 0 (0.0%) | 0 (0.0%) |
| Construction & Extraction | 9 (100.0%) | 0 (0.0%) |
| Installation, Maintenance & Repair | 13 (100.0%) | 0 (0.0%) |
| Total (Category) | 22 (100.0%) | 0 (0.0%) |
| Total (Overall) | 85 (57.4%) | 63 (42.6%) |
Production, Transportation and Moving Occupations
The most common Production, Transportation and Moving occupations in Port Clinton borough are Production (20 | 13.5%), Material Moving (14 | 9.5%), and Transportation (5 | 3.4%).
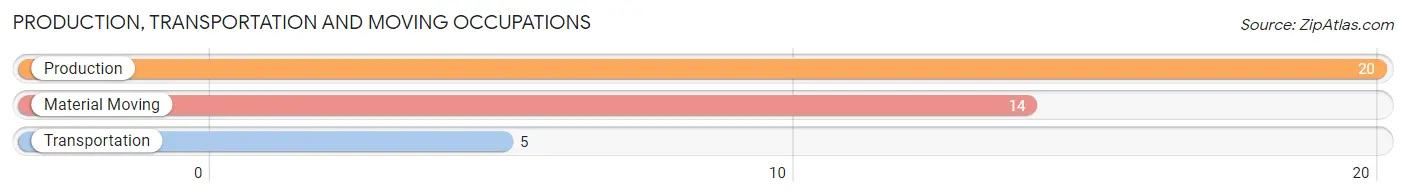
Production, Transportation and Moving Occupations by Sex
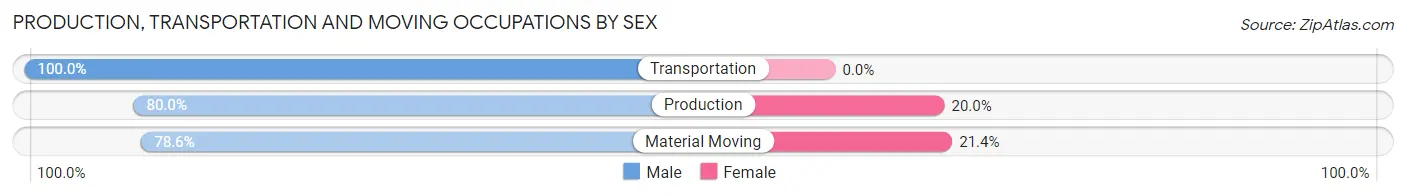
| Occupation | Male | Female |
| Production | 16 (80.0%) | 4 (20.0%) |
| Transportation | 5 (100.0%) | 0 (0.0%) |
| Material Moving | 11 (78.6%) | 3 (21.4%) |
| Total (Category) | 32 (82.1%) | 7 (17.9%) |
| Total (Overall) | 85 (57.4%) | 63 (42.6%) |
Employment Industries by Sex in Port Clinton borough
Employment Industries in Port Clinton borough
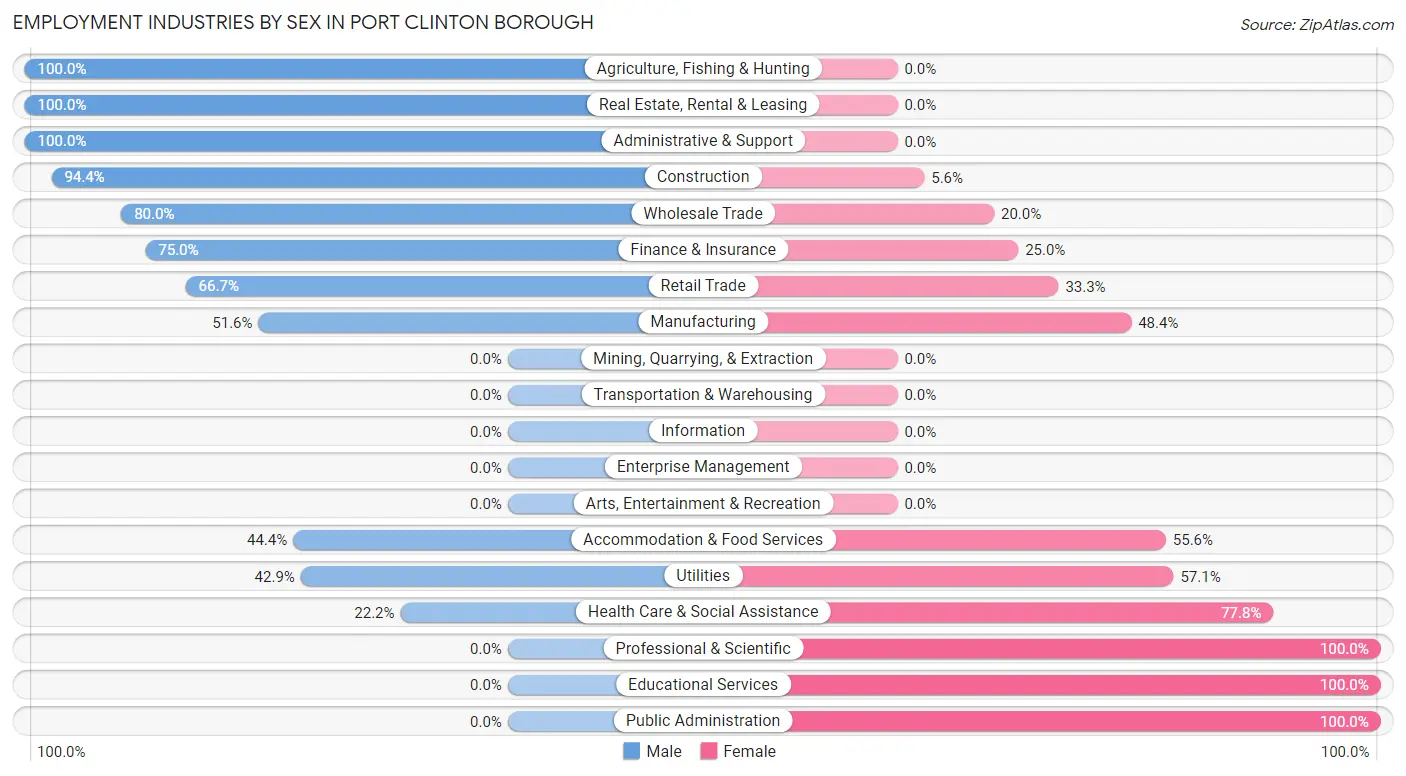
The major employment industries in Port Clinton borough include Manufacturing (31 | 20.9%), Construction (18 | 12.2%), Retail Trade (18 | 12.2%), Educational Services (13 | 8.8%), and Health Care & Social Assistance (9 | 6.1%).
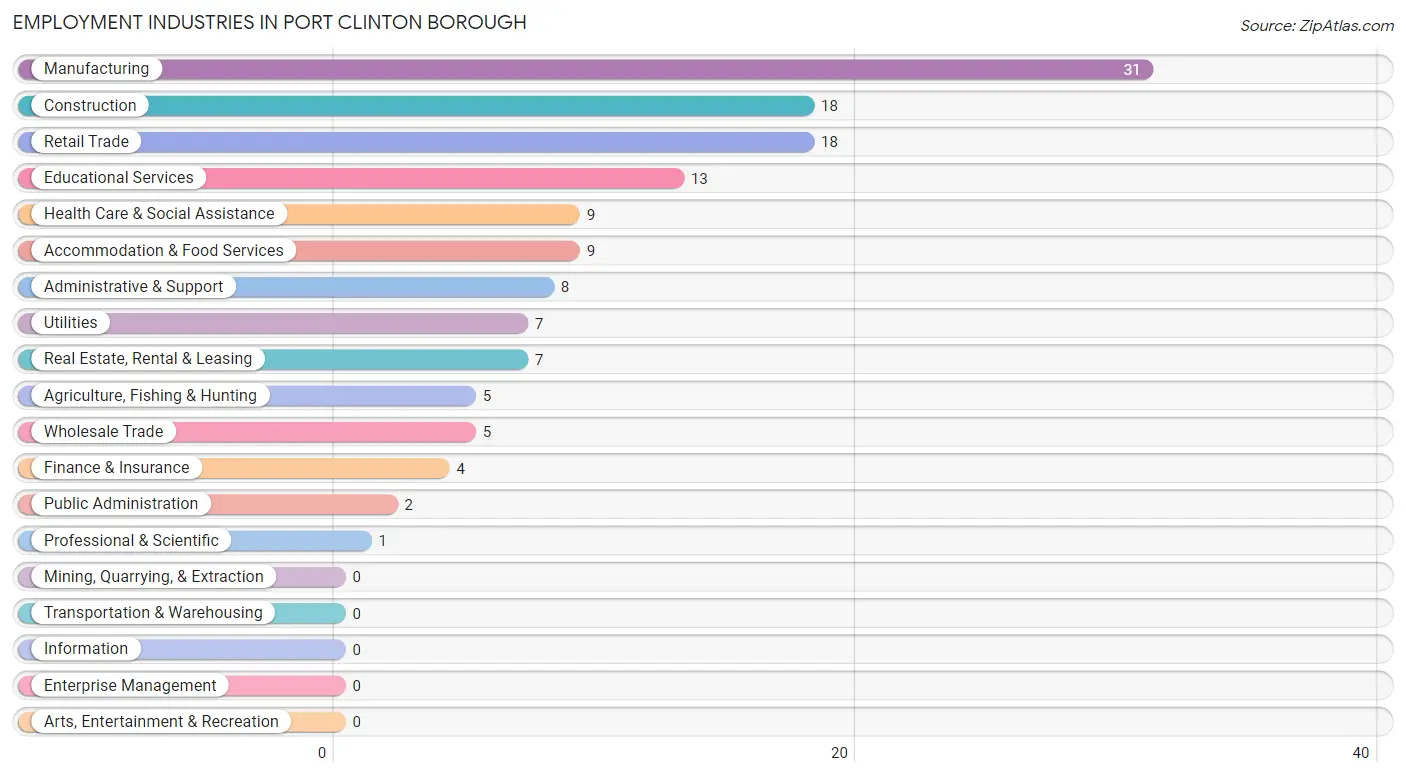
Employment Industries by Sex in Port Clinton borough
The Port Clinton borough industries that see more men than women are Agriculture, Fishing & Hunting (100.0%), Real Estate, Rental & Leasing (100.0%), and Administrative & Support (100.0%), whereas the industries that tend to have a higher number of women are Professional & Scientific (100.0%), Educational Services (100.0%), and Public Administration (100.0%).
| Industry | Male | Female |
| Agriculture, Fishing & Hunting | 5 (100.0%) | 0 (0.0%) |
| Mining, Quarrying, & Extraction | 0 (0.0%) | 0 (0.0%) |
| Construction | 17 (94.4%) | 1 (5.6%) |
| Manufacturing | 16 (51.6%) | 15 (48.4%) |
| Wholesale Trade | 4 (80.0%) | 1 (20.0%) |
| Retail Trade | 12 (66.7%) | 6 (33.3%) |
| Transportation & Warehousing | 0 (0.0%) | 0 (0.0%) |
| Utilities | 3 (42.9%) | 4 (57.1%) |
| Information | 0 (0.0%) | 0 (0.0%) |
| Finance & Insurance | 3 (75.0%) | 1 (25.0%) |
| Real Estate, Rental & Leasing | 7 (100.0%) | 0 (0.0%) |
| Professional & Scientific | 0 (0.0%) | 1 (100.0%) |
| Enterprise Management | 0 (0.0%) | 0 (0.0%) |
| Administrative & Support | 8 (100.0%) | 0 (0.0%) |
| Educational Services | 0 (0.0%) | 13 (100.0%) |
| Health Care & Social Assistance | 2 (22.2%) | 7 (77.8%) |
| Arts, Entertainment & Recreation | 0 (0.0%) | 0 (0.0%) |
| Accommodation & Food Services | 4 (44.4%) | 5 (55.6%) |
| Public Administration | 0 (0.0%) | 2 (100.0%) |
| Total | 85 (57.4%) | 63 (42.6%) |
Education in Port Clinton borough
School Enrollment in Port Clinton borough
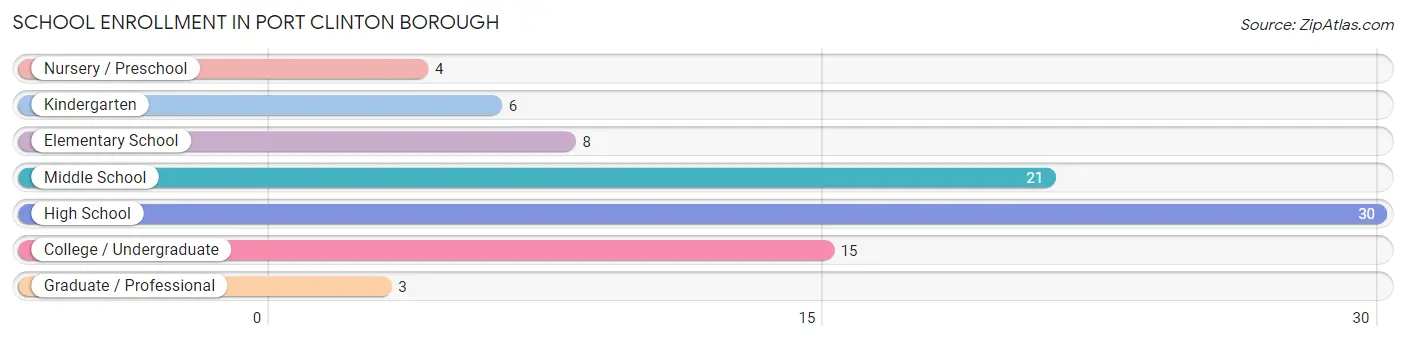
The most common levels of schooling among the 87 students in Port Clinton borough are high school (30 | 34.5%), middle school (21 | 24.1%), and college / undergraduate (15 | 17.2%).
| School Level | # Students | % Students |
| Nursery / Preschool | 4 | 4.6% |
| Kindergarten | 6 | 6.9% |
| Elementary School | 8 | 9.2% |
| Middle School | 21 | 24.1% |
| High School | 30 | 34.5% |
| College / Undergraduate | 15 | 17.2% |
| Graduate / Professional | 3 | 3.5% |
| Total | 87 | 100.0% |
School Enrollment by Age by Funding Source in Port Clinton borough
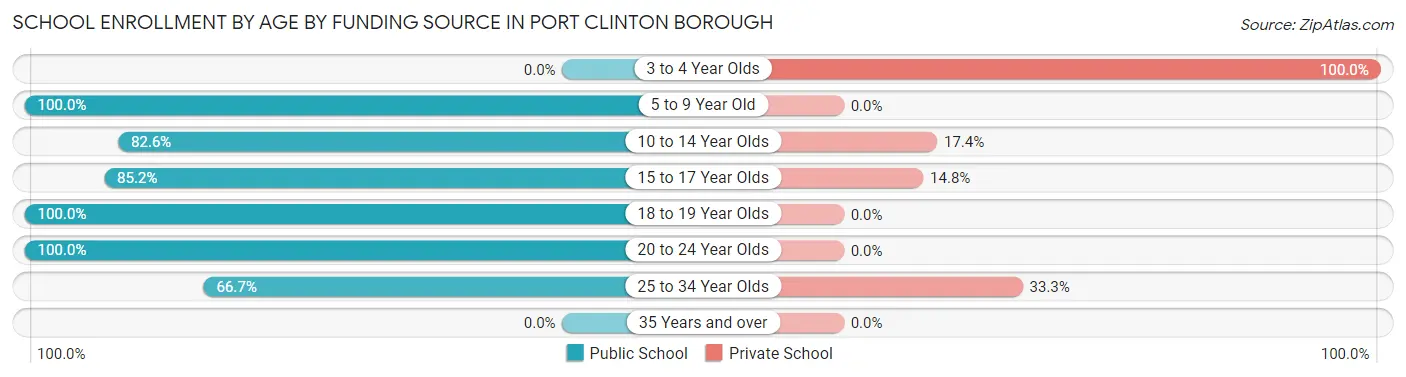
Out of a total of 87 students who are enrolled in schools in Port Clinton borough, 11 (12.6%) attend a private institution, while the remaining 76 (87.4%) are enrolled in public schools. The age group of 3 to 4 year olds has the highest likelihood of being enrolled in private schools, with 2 (100.0% in the age bracket) enrolled. Conversely, the age group of 5 to 9 year old has the lowest likelihood of being enrolled in a private school, with 14 (100.0% in the age bracket) attending a public institution.
| Age Bracket | Public School | Private School |
| 3 to 4 Year Olds | 0 (0.0%) | 2 (100.0%) |
| 5 to 9 Year Old | 14 (100.0%) | 0 (0.0%) |
| 10 to 14 Year Olds | 19 (82.6%) | 4 (17.4%) |
| 15 to 17 Year Olds | 23 (85.2%) | 4 (14.8%) |
| 18 to 19 Year Olds | 5 (100.0%) | 0 (0.0%) |
| 20 to 24 Year Olds | 13 (100.0%) | 0 (0.0%) |
| 25 to 34 Year Olds | 2 (66.7%) | 1 (33.3%) |
| 35 Years and over | 0 (0.0%) | 0 (0.0%) |
| Total | 76 (87.4%) | 11 (12.6%) |
Educational Attainment by Field of Study in Port Clinton borough
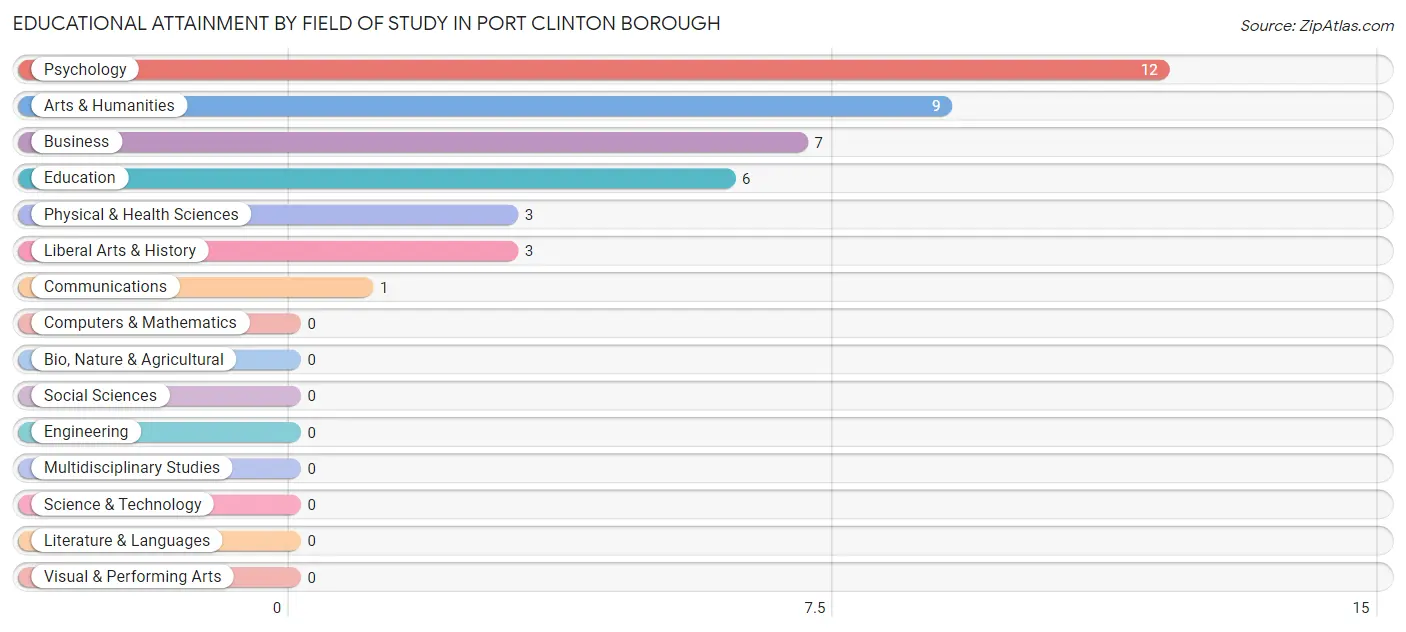
Psychology (12 | 29.3%), arts & humanities (9 | 22.0%), business (7 | 17.1%), education (6 | 14.6%), and physical & health sciences (3 | 7.3%) are the most common fields of study among 41 individuals in Port Clinton borough who have obtained a bachelor's degree or higher.
| Field of Study | # Graduates | % Graduates |
| Computers & Mathematics | 0 | 0.0% |
| Bio, Nature & Agricultural | 0 | 0.0% |
| Physical & Health Sciences | 3 | 7.3% |
| Psychology | 12 | 29.3% |
| Social Sciences | 0 | 0.0% |
| Engineering | 0 | 0.0% |
| Multidisciplinary Studies | 0 | 0.0% |
| Science & Technology | 0 | 0.0% |
| Business | 7 | 17.1% |
| Education | 6 | 14.6% |
| Literature & Languages | 0 | 0.0% |
| Liberal Arts & History | 3 | 7.3% |
| Visual & Performing Arts | 0 | 0.0% |
| Communications | 1 | 2.4% |
| Arts & Humanities | 9 | 22.0% |
| Total | 41 | 100.0% |
Transportation & Commute in Port Clinton borough
Vehicle Availability by Sex in Port Clinton borough
The most prevalent vehicle ownership categories in Port Clinton borough are males with 3 vehicles (27, accounting for 32.1%) and females with 3 vehicles (20, making up 42.9%).
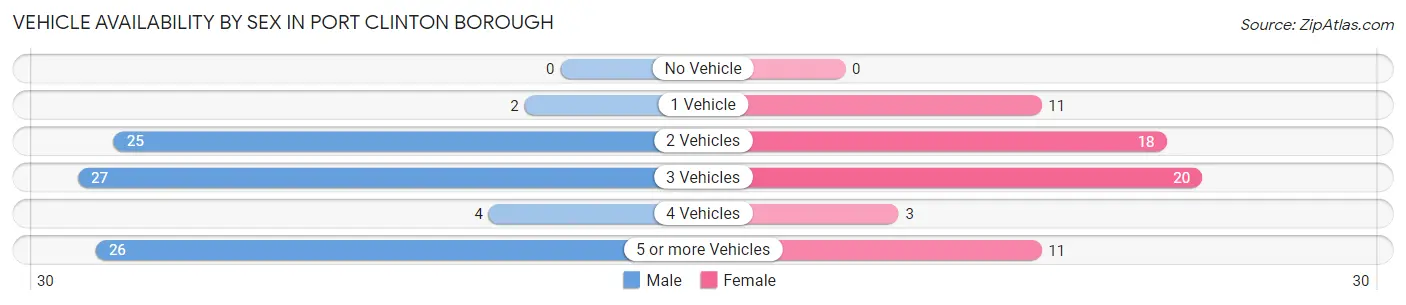
| Vehicles Available | Male | Female |
| No Vehicle | 0 (0.0%) | 0 (0.0%) |
| 1 Vehicle | 2 (2.4%) | 11 (17.5%) |
| 2 Vehicles | 25 (29.8%) | 18 (28.6%) |
| 3 Vehicles | 27 (32.1%) | 20 (31.8%) |
| 4 Vehicles | 4 (4.8%) | 3 (4.8%) |
| 5 or more Vehicles | 26 (30.9%) | 11 (17.5%) |
| Total | 84 (100.0%) | 63 (100.0%) |
Commute Time in Port Clinton borough
The most frequently occuring commute durations in Port Clinton borough are 35 to 39 minutes (27 commuters, 18.4%), 5 to 9 minutes (20 commuters, 13.6%), and 25 to 29 minutes (18 commuters, 12.2%).
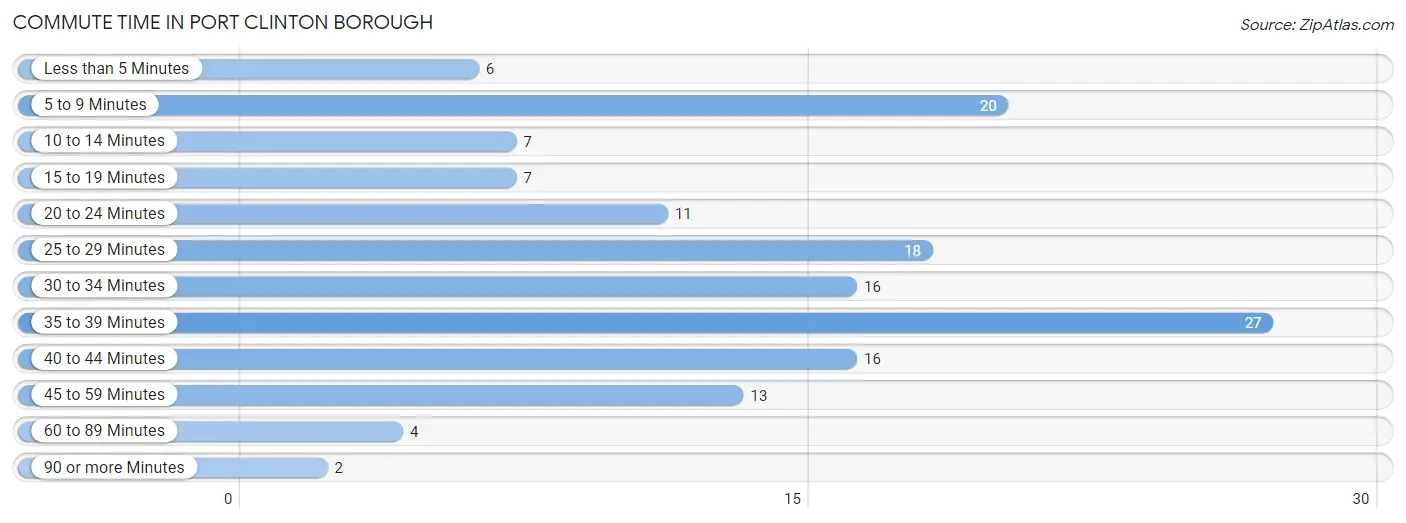
| Commute Time | # Commuters | % Commuters |
| Less than 5 Minutes | 6 | 4.1% |
| 5 to 9 Minutes | 20 | 13.6% |
| 10 to 14 Minutes | 7 | 4.8% |
| 15 to 19 Minutes | 7 | 4.8% |
| 20 to 24 Minutes | 11 | 7.5% |
| 25 to 29 Minutes | 18 | 12.2% |
| 30 to 34 Minutes | 16 | 10.9% |
| 35 to 39 Minutes | 27 | 18.4% |
| 40 to 44 Minutes | 16 | 10.9% |
| 45 to 59 Minutes | 13 | 8.8% |
| 60 to 89 Minutes | 4 | 2.7% |
| 90 or more Minutes | 2 | 1.4% |
Commute Time by Sex in Port Clinton borough
The most common commute times in Port Clinton borough are 35 to 39 minutes (15 commuters, 17.9%) for males and 35 to 39 minutes (12 commuters, 19.1%) for females.
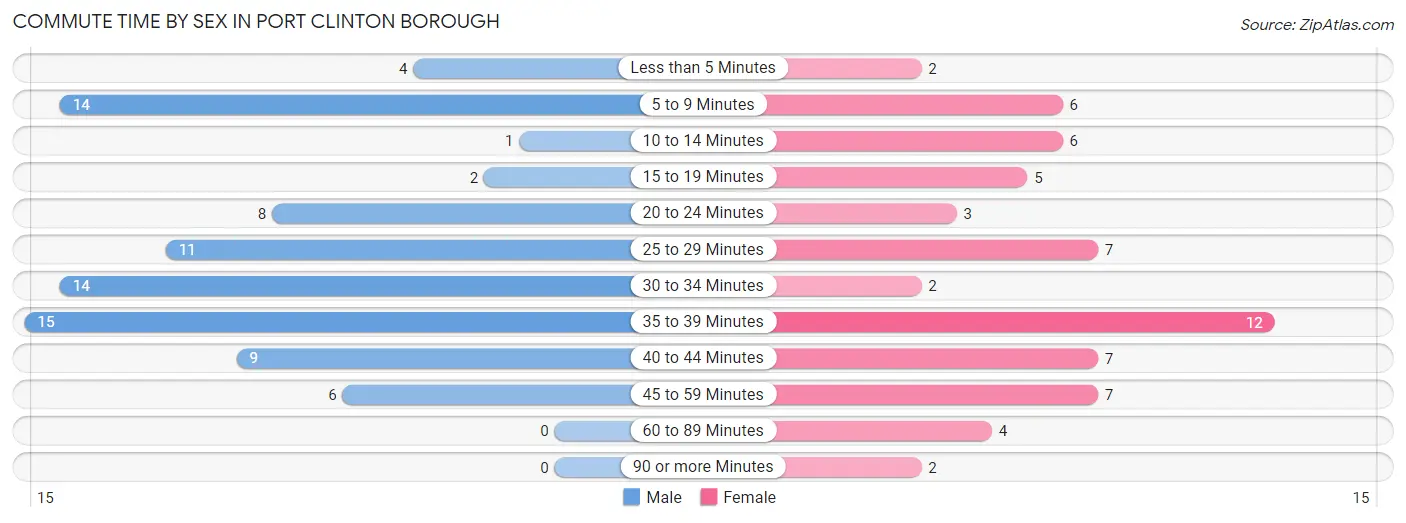
| Commute Time | Male | Female |
| Less than 5 Minutes | 4 (4.8%) | 2 (3.2%) |
| 5 to 9 Minutes | 14 (16.7%) | 6 (9.5%) |
| 10 to 14 Minutes | 1 (1.2%) | 6 (9.5%) |
| 15 to 19 Minutes | 2 (2.4%) | 5 (7.9%) |
| 20 to 24 Minutes | 8 (9.5%) | 3 (4.8%) |
| 25 to 29 Minutes | 11 (13.1%) | 7 (11.1%) |
| 30 to 34 Minutes | 14 (16.7%) | 2 (3.2%) |
| 35 to 39 Minutes | 15 (17.9%) | 12 (19.1%) |
| 40 to 44 Minutes | 9 (10.7%) | 7 (11.1%) |
| 45 to 59 Minutes | 6 (7.1%) | 7 (11.1%) |
| 60 to 89 Minutes | 0 (0.0%) | 4 (6.4%) |
| 90 or more Minutes | 0 (0.0%) | 2 (3.2%) |
Time of Departure to Work by Sex in Port Clinton borough
The most frequent times of departure to work in Port Clinton borough are 4:00 PM to 11:59 PM (18, 21.4%) for males and 7:30 AM to 7:59 AM (14, 22.2%) for females.
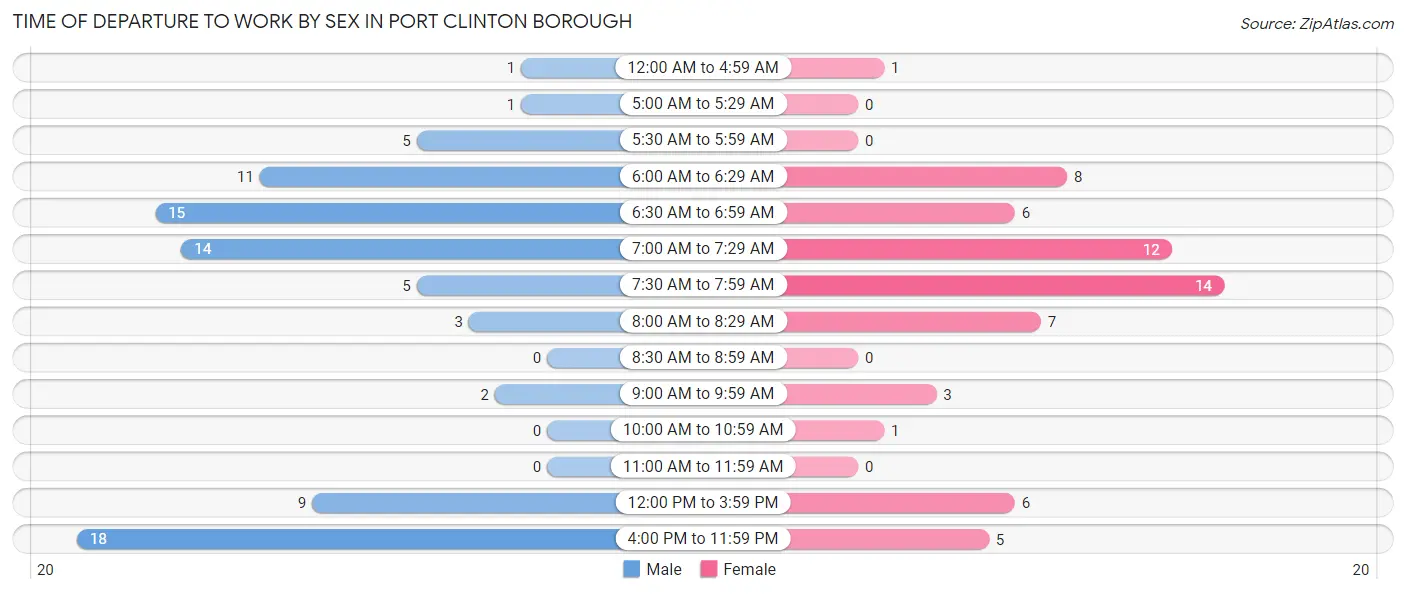
| Time of Departure | Male | Female |
| 12:00 AM to 4:59 AM | 1 (1.2%) | 1 (1.6%) |
| 5:00 AM to 5:29 AM | 1 (1.2%) | 0 (0.0%) |
| 5:30 AM to 5:59 AM | 5 (5.9%) | 0 (0.0%) |
| 6:00 AM to 6:29 AM | 11 (13.1%) | 8 (12.7%) |
| 6:30 AM to 6:59 AM | 15 (17.9%) | 6 (9.5%) |
| 7:00 AM to 7:29 AM | 14 (16.7%) | 12 (19.1%) |
| 7:30 AM to 7:59 AM | 5 (5.9%) | 14 (22.2%) |
| 8:00 AM to 8:29 AM | 3 (3.6%) | 7 (11.1%) |
| 8:30 AM to 8:59 AM | 0 (0.0%) | 0 (0.0%) |
| 9:00 AM to 9:59 AM | 2 (2.4%) | 3 (4.8%) |
| 10:00 AM to 10:59 AM | 0 (0.0%) | 1 (1.6%) |
| 11:00 AM to 11:59 AM | 0 (0.0%) | 0 (0.0%) |
| 12:00 PM to 3:59 PM | 9 (10.7%) | 6 (9.5%) |
| 4:00 PM to 11:59 PM | 18 (21.4%) | 5 (7.9%) |
| Total | 84 (100.0%) | 63 (100.0%) |
Housing Occupancy in Port Clinton borough
Occupancy by Ownership in Port Clinton borough
Of the total 126 dwellings in Port Clinton borough, owner-occupied units account for 94 (74.6%), while renter-occupied units make up 32 (25.4%).
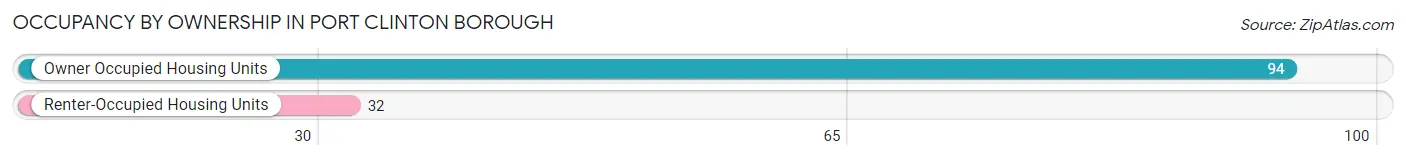
| Occupancy | # Housing Units | % Housing Units |
| Owner Occupied Housing Units | 94 | 74.6% |
| Renter-Occupied Housing Units | 32 | 25.4% |
| Total Occupied Housing Units | 126 | 100.0% |
Occupancy by Household Size in Port Clinton borough
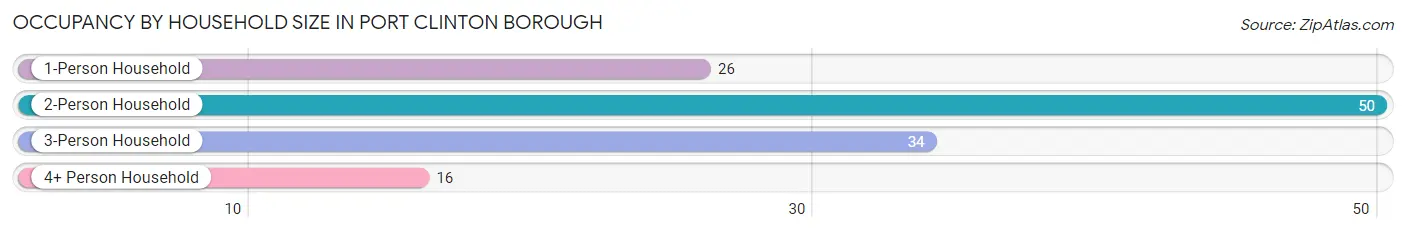
| Household Size | # Housing Units | % Housing Units |
| 1-Person Household | 26 | 20.6% |
| 2-Person Household | 50 | 39.7% |
| 3-Person Household | 34 | 27.0% |
| 4+ Person Household | 16 | 12.7% |
| Total Housing Units | 126 | 100.0% |
Occupancy by Ownership by Household Size in Port Clinton borough
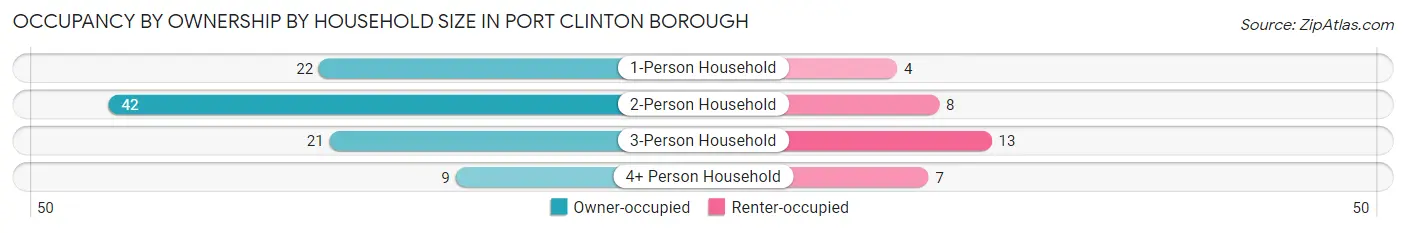
| Household Size | Owner-occupied | Renter-occupied |
| 1-Person Household | 22 (84.6%) | 4 (15.4%) |
| 2-Person Household | 42 (84.0%) | 8 (16.0%) |
| 3-Person Household | 21 (61.8%) | 13 (38.2%) |
| 4+ Person Household | 9 (56.2%) | 7 (43.8%) |
| Total Housing Units | 94 (74.6%) | 32 (25.4%) |
Occupancy by Educational Attainment in Port Clinton borough
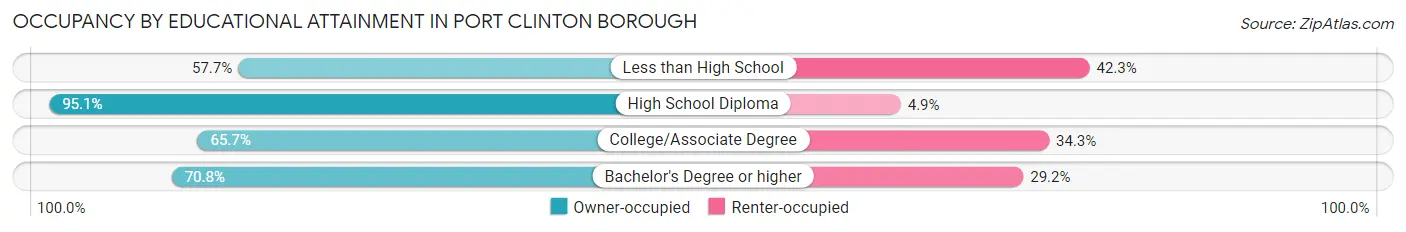
| Household Size | Owner-occupied | Renter-occupied |
| Less than High School | 15 (57.7%) | 11 (42.3%) |
| High School Diploma | 39 (95.1%) | 2 (4.9%) |
| College/Associate Degree | 23 (65.7%) | 12 (34.3%) |
| Bachelor's Degree or higher | 17 (70.8%) | 7 (29.2%) |
Occupancy by Age of Householder in Port Clinton borough
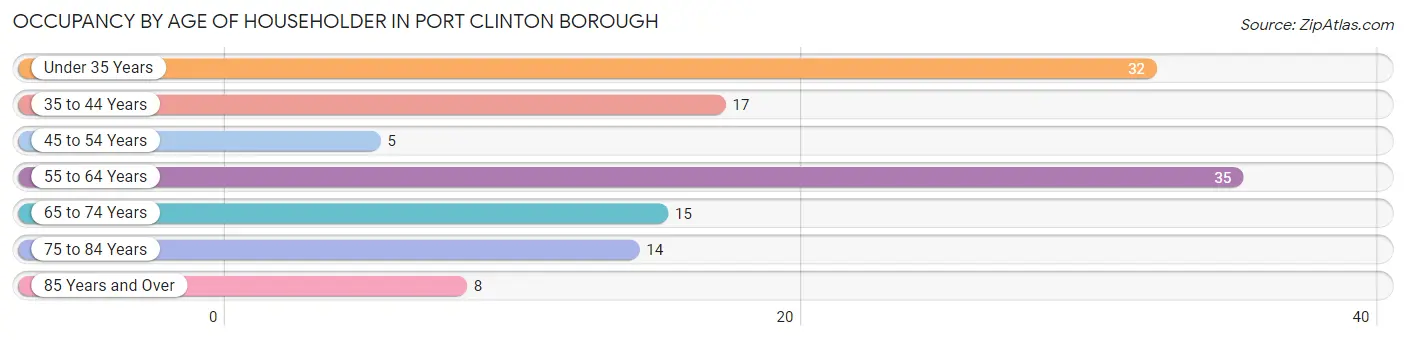
| Age Bracket | # Households | % Households |
| Under 35 Years | 32 | 25.4% |
| 35 to 44 Years | 17 | 13.5% |
| 45 to 54 Years | 5 | 4.0% |
| 55 to 64 Years | 35 | 27.8% |
| 65 to 74 Years | 15 | 11.9% |
| 75 to 84 Years | 14 | 11.1% |
| 85 Years and Over | 8 | 6.4% |
| Total | 126 | 100.0% |
Housing Finances in Port Clinton borough
Median Income by Occupancy in Port Clinton borough
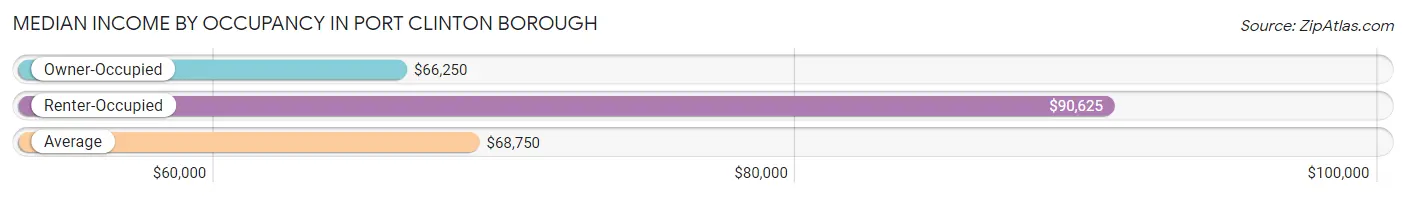
| Occupancy Type | # Households | Median Income |
| Owner-Occupied | 94 (74.6%) | $66,250 |
| Renter-Occupied | 32 (25.4%) | $90,625 |
| Average | 126 (100.0%) | $68,750 |
Occupancy by Householder Income Bracket in Port Clinton borough
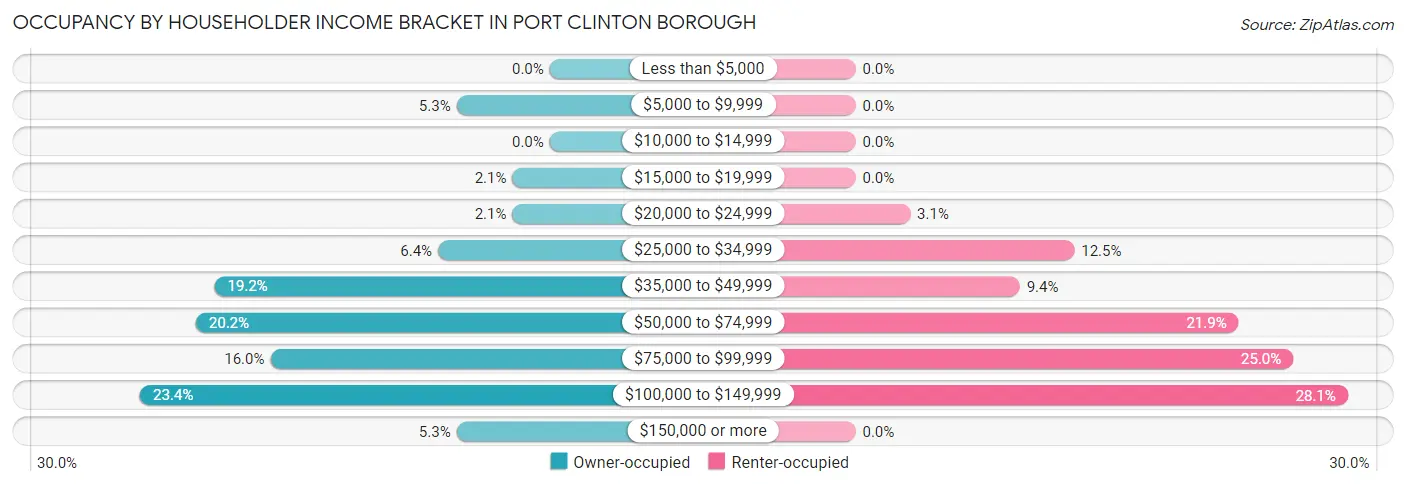
| Income Bracket | Owner-occupied | Renter-occupied |
| Less than $5,000 | 0 (0.0%) | 0 (0.0%) |
| $5,000 to $9,999 | 5 (5.3%) | 0 (0.0%) |
| $10,000 to $14,999 | 0 (0.0%) | 0 (0.0%) |
| $15,000 to $19,999 | 2 (2.1%) | 0 (0.0%) |
| $20,000 to $24,999 | 2 (2.1%) | 1 (3.1%) |
| $25,000 to $34,999 | 6 (6.4%) | 4 (12.5%) |
| $35,000 to $49,999 | 18 (19.2%) | 3 (9.4%) |
| $50,000 to $74,999 | 19 (20.2%) | 7 (21.9%) |
| $75,000 to $99,999 | 15 (16.0%) | 8 (25.0%) |
| $100,000 to $149,999 | 22 (23.4%) | 9 (28.1%) |
| $150,000 or more | 5 (5.3%) | 0 (0.0%) |
| Total | 94 (100.0%) | 32 (100.0%) |
Monthly Housing Cost Tiers in Port Clinton borough
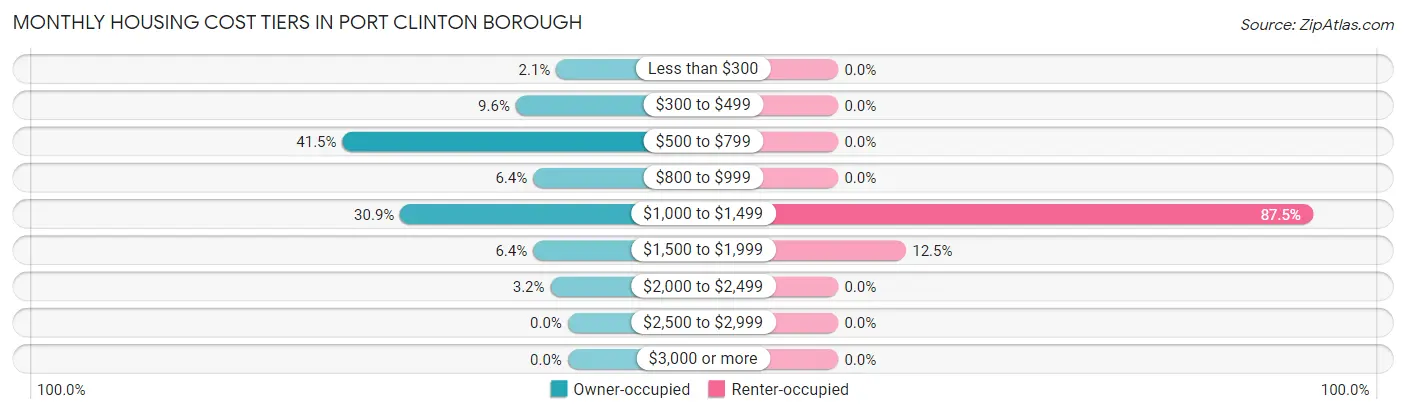
| Monthly Cost | Owner-occupied | Renter-occupied |
| Less than $300 | 2 (2.1%) | 0 (0.0%) |
| $300 to $499 | 9 (9.6%) | 0 (0.0%) |
| $500 to $799 | 39 (41.5%) | 0 (0.0%) |
| $800 to $999 | 6 (6.4%) | 0 (0.0%) |
| $1,000 to $1,499 | 29 (30.8%) | 28 (87.5%) |
| $1,500 to $1,999 | 6 (6.4%) | 4 (12.5%) |
| $2,000 to $2,499 | 3 (3.2%) | 0 (0.0%) |
| $2,500 to $2,999 | 0 (0.0%) | 0 (0.0%) |
| $3,000 or more | 0 (0.0%) | 0 (0.0%) |
| Total | 94 (100.0%) | 32 (100.0%) |
Physical Housing Characteristics in Port Clinton borough
Housing Structures in Port Clinton borough
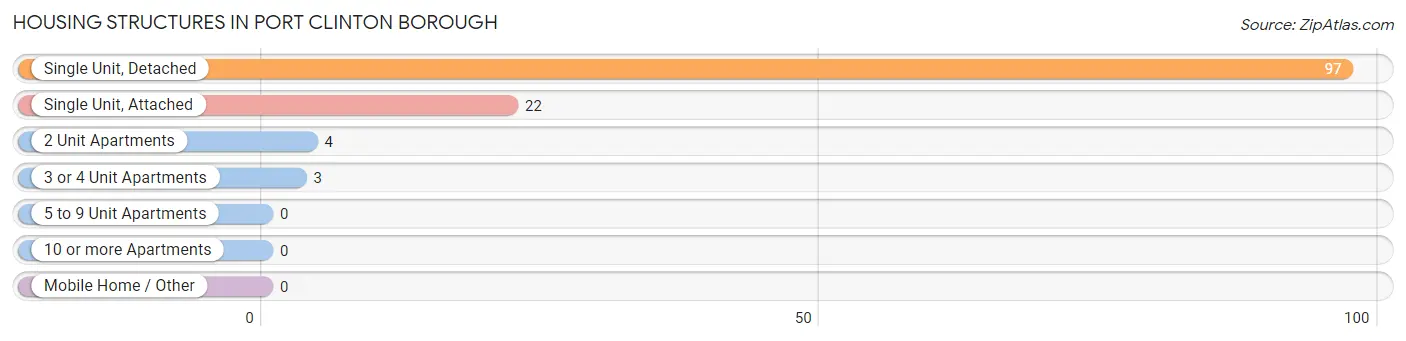
| Structure Type | # Housing Units | % Housing Units |
| Single Unit, Detached | 97 | 77.0% |
| Single Unit, Attached | 22 | 17.5% |
| 2 Unit Apartments | 4 | 3.2% |
| 3 or 4 Unit Apartments | 3 | 2.4% |
| 5 to 9 Unit Apartments | 0 | 0.0% |
| 10 or more Apartments | 0 | 0.0% |
| Mobile Home / Other | 0 | 0.0% |
| Total | 126 | 100.0% |
Housing Structures by Occupancy in Port Clinton borough
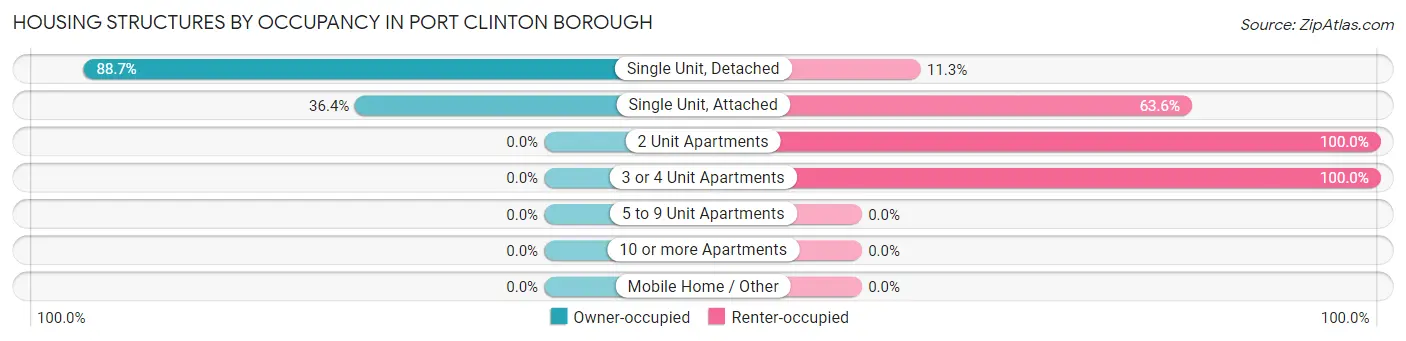
| Structure Type | Owner-occupied | Renter-occupied |
| Single Unit, Detached | 86 (88.7%) | 11 (11.3%) |
| Single Unit, Attached | 8 (36.4%) | 14 (63.6%) |
| 2 Unit Apartments | 0 (0.0%) | 4 (100.0%) |
| 3 or 4 Unit Apartments | 0 (0.0%) | 3 (100.0%) |
| 5 to 9 Unit Apartments | 0 (0.0%) | 0 (0.0%) |
| 10 or more Apartments | 0 (0.0%) | 0 (0.0%) |
| Mobile Home / Other | 0 (0.0%) | 0 (0.0%) |
| Total | 94 (74.6%) | 32 (25.4%) |
Housing Structures by Number of Rooms in Port Clinton borough
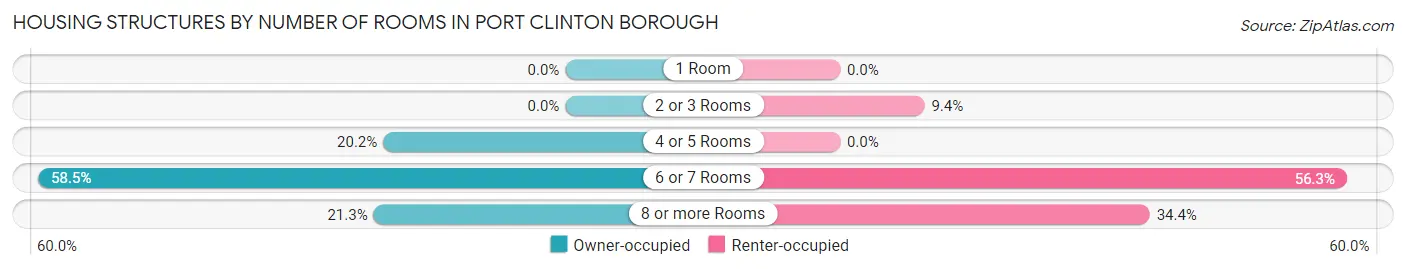
| Number of Rooms | Owner-occupied | Renter-occupied |
| 1 Room | 0 (0.0%) | 0 (0.0%) |
| 2 or 3 Rooms | 0 (0.0%) | 3 (9.4%) |
| 4 or 5 Rooms | 19 (20.2%) | 0 (0.0%) |
| 6 or 7 Rooms | 55 (58.5%) | 18 (56.2%) |
| 8 or more Rooms | 20 (21.3%) | 11 (34.4%) |
| Total | 94 (100.0%) | 32 (100.0%) |
Housing Structure by Heating Type in Port Clinton borough
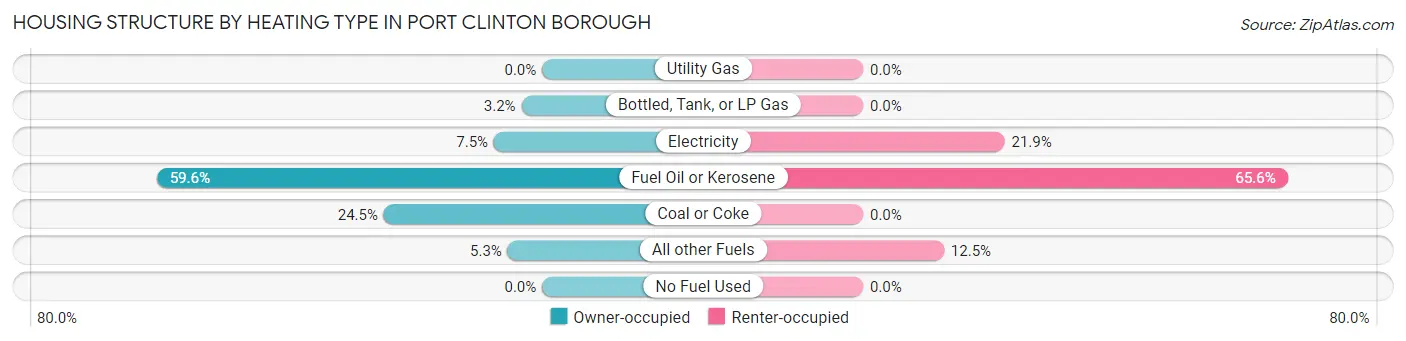
| Heating Type | Owner-occupied | Renter-occupied |
| Utility Gas | 0 (0.0%) | 0 (0.0%) |
| Bottled, Tank, or LP Gas | 3 (3.2%) | 0 (0.0%) |
| Electricity | 7 (7.4%) | 7 (21.9%) |
| Fuel Oil or Kerosene | 56 (59.6%) | 21 (65.6%) |
| Coal or Coke | 23 (24.5%) | 0 (0.0%) |
| All other Fuels | 5 (5.3%) | 4 (12.5%) |
| No Fuel Used | 0 (0.0%) | 0 (0.0%) |
| Total | 94 (100.0%) | 32 (100.0%) |
Household Vehicle Usage in Port Clinton borough
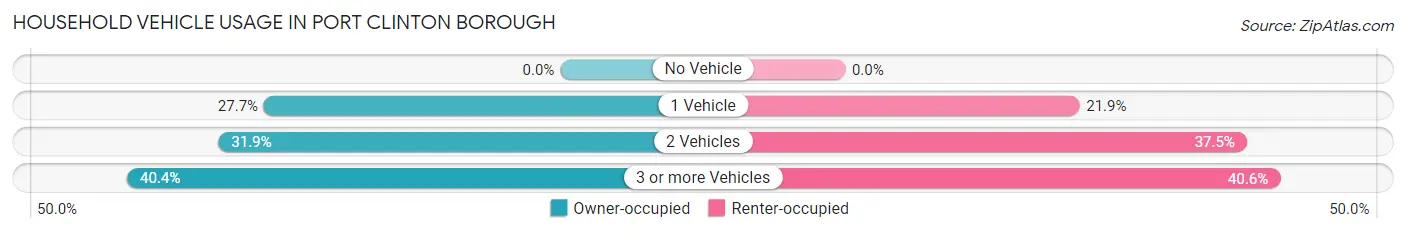
| Vehicles per Household | Owner-occupied | Renter-occupied |
| No Vehicle | 0 (0.0%) | 0 (0.0%) |
| 1 Vehicle | 26 (27.7%) | 7 (21.9%) |
| 2 Vehicles | 30 (31.9%) | 12 (37.5%) |
| 3 or more Vehicles | 38 (40.4%) | 13 (40.6%) |
| Total | 94 (100.0%) | 32 (100.0%) |
Real Estate & Mortgages in Port Clinton borough
Real Estate and Mortgage Overview in Port Clinton borough
| Characteristic | Without Mortgage | With Mortgage |
| Housing Units | 49 | 45 |
| Median Property Value | $116,100 | $123,400 |
| Median Household Income | $53,438 | $4 |
| Monthly Housing Costs | $624 | $0 |
| Real Estate Taxes | $2,000 | $0 |
Property Value by Mortgage Status in Port Clinton borough
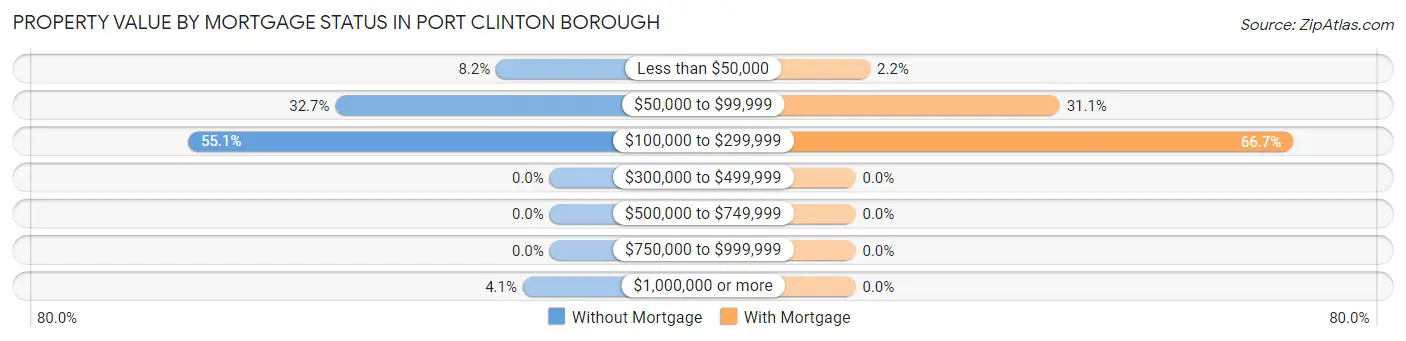
| Property Value | Without Mortgage | With Mortgage |
| Less than $50,000 | 4 (8.2%) | 1 (2.2%) |
| $50,000 to $99,999 | 16 (32.7%) | 14 (31.1%) |
| $100,000 to $299,999 | 27 (55.1%) | 30 (66.7%) |
| $300,000 to $499,999 | 0 (0.0%) | 0 (0.0%) |
| $500,000 to $749,999 | 0 (0.0%) | 0 (0.0%) |
| $750,000 to $999,999 | 0 (0.0%) | 0 (0.0%) |
| $1,000,000 or more | 2 (4.1%) | 0 (0.0%) |
| Total | 49 (100.0%) | 45 (100.0%) |
Household Income by Mortgage Status in Port Clinton borough
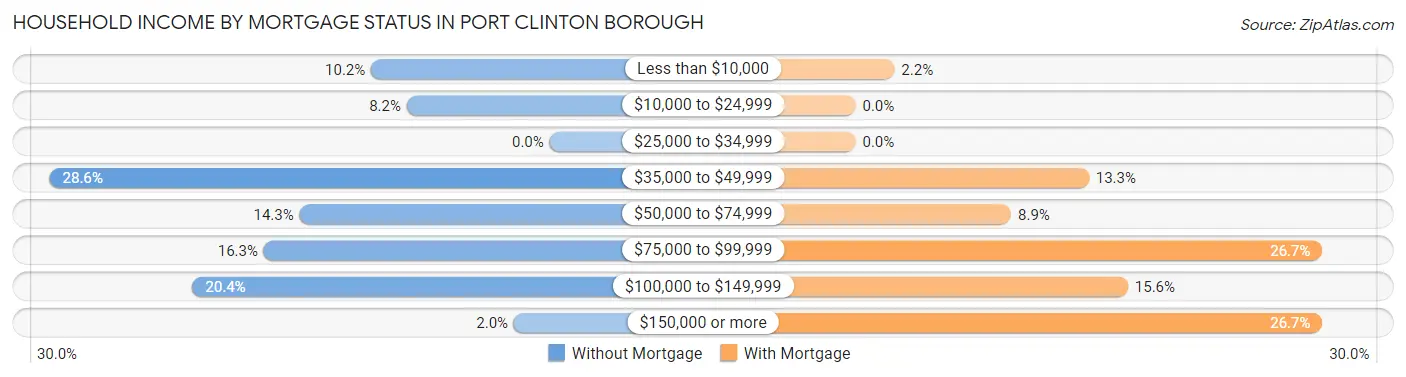
| Household Income | Without Mortgage | With Mortgage |
| Less than $10,000 | 5 (10.2%) | 1 (2.2%) |
| $10,000 to $24,999 | 4 (8.2%) | 0 (0.0%) |
| $25,000 to $34,999 | 0 (0.0%) | 0 (0.0%) |
| $35,000 to $49,999 | 14 (28.6%) | 6 (13.3%) |
| $50,000 to $74,999 | 7 (14.3%) | 4 (8.9%) |
| $75,000 to $99,999 | 8 (16.3%) | 12 (26.7%) |
| $100,000 to $149,999 | 10 (20.4%) | 7 (15.6%) |
| $150,000 or more | 1 (2.0%) | 12 (26.7%) |
| Total | 49 (100.0%) | 45 (100.0%) |
Property Value to Household Income Ratio in Port Clinton borough
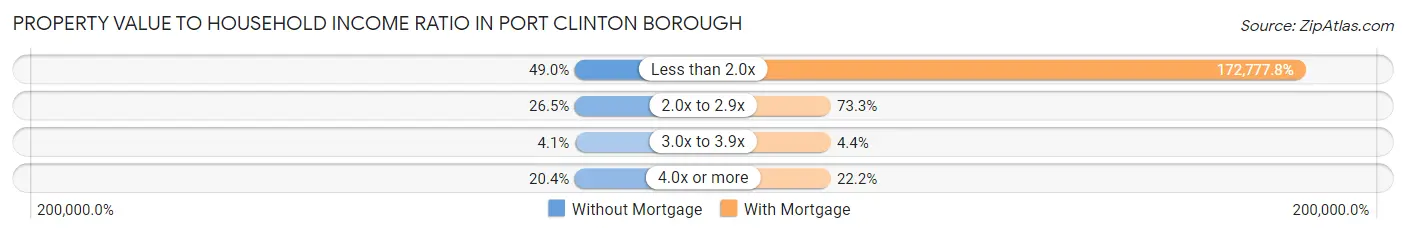
| Value-to-Income Ratio | Without Mortgage | With Mortgage |
| Less than 2.0x | 24 (49.0%) | 77,750 (172,777.8%) |
| 2.0x to 2.9x | 13 (26.5%) | 33 (73.3%) |
| 3.0x to 3.9x | 2 (4.1%) | 2 (4.4%) |
| 4.0x or more | 10 (20.4%) | 10 (22.2%) |
| Total | 49 (100.0%) | 45 (100.0%) |
Real Estate Taxes by Mortgage Status in Port Clinton borough
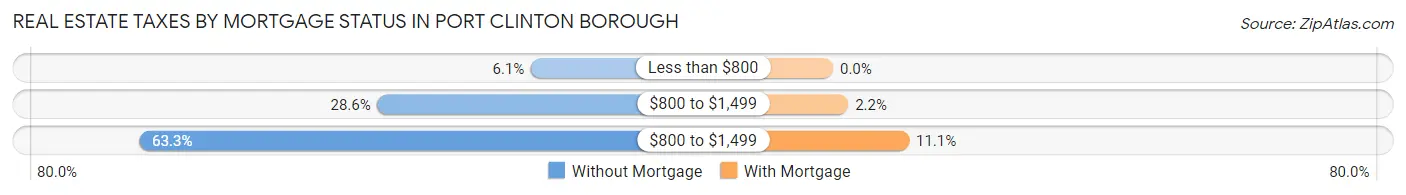
| Property Taxes | Without Mortgage | With Mortgage |
| Less than $800 | 3 (6.1%) | 0 (0.0%) |
| $800 to $1,499 | 14 (28.6%) | 1 (2.2%) |
| $800 to $1,499 | 31 (63.3%) | 5 (11.1%) |
| Total | 49 (100.0%) | 45 (100.0%) |
Health & Disability in Port Clinton borough
Health Insurance Coverage by Age in Port Clinton borough
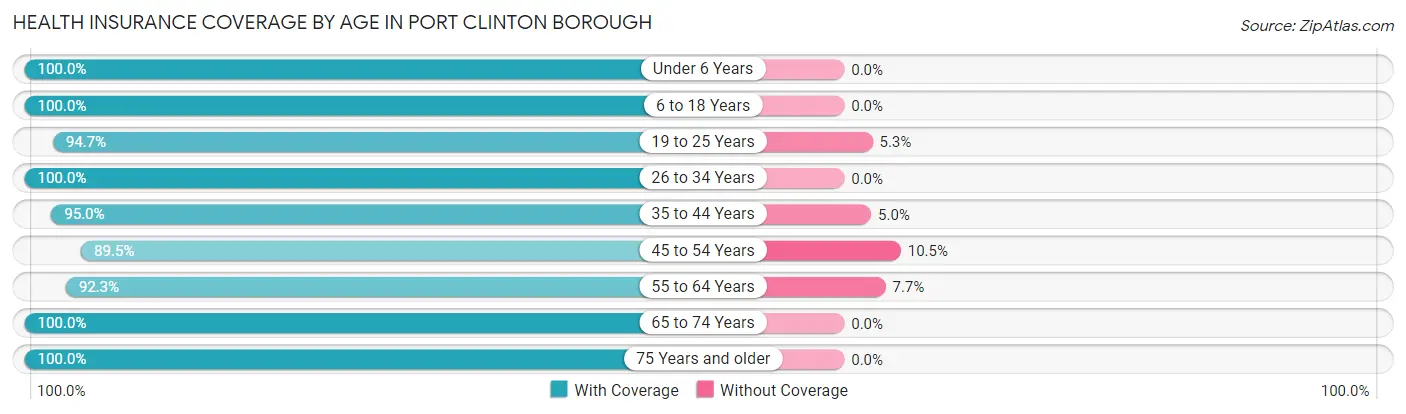
| Age Bracket | With Coverage | Without Coverage |
| Under 6 Years | 32 (100.0%) | 0 (0.0%) |
| 6 to 18 Years | 68 (100.0%) | 0 (0.0%) |
| 19 to 25 Years | 36 (94.7%) | 2 (5.3%) |
| 26 to 34 Years | 45 (100.0%) | 0 (0.0%) |
| 35 to 44 Years | 38 (95.0%) | 2 (5.0%) |
| 45 to 54 Years | 17 (89.5%) | 2 (10.5%) |
| 55 to 64 Years | 48 (92.3%) | 4 (7.7%) |
| 65 to 74 Years | 25 (100.0%) | 0 (0.0%) |
| 75 Years and older | 35 (100.0%) | 0 (0.0%) |
| Total | 344 (97.2%) | 10 (2.8%) |
Health Insurance Coverage by Citizenship Status in Port Clinton borough
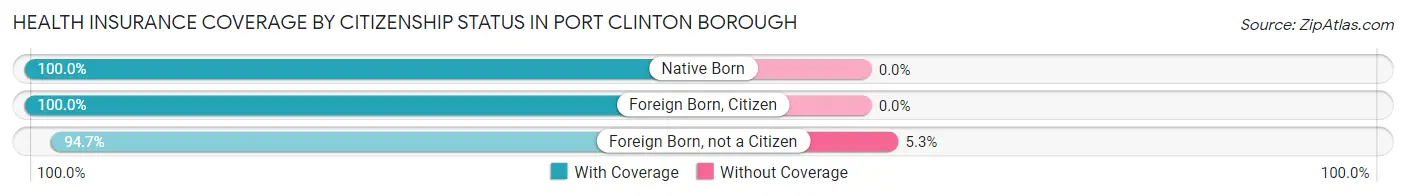
| Citizenship Status | With Coverage | Without Coverage |
| Native Born | 32 (100.0%) | 0 (0.0%) |
| Foreign Born, Citizen | 68 (100.0%) | 0 (0.0%) |
| Foreign Born, not a Citizen | 36 (94.7%) | 2 (5.3%) |
Health Insurance Coverage by Household Income in Port Clinton borough
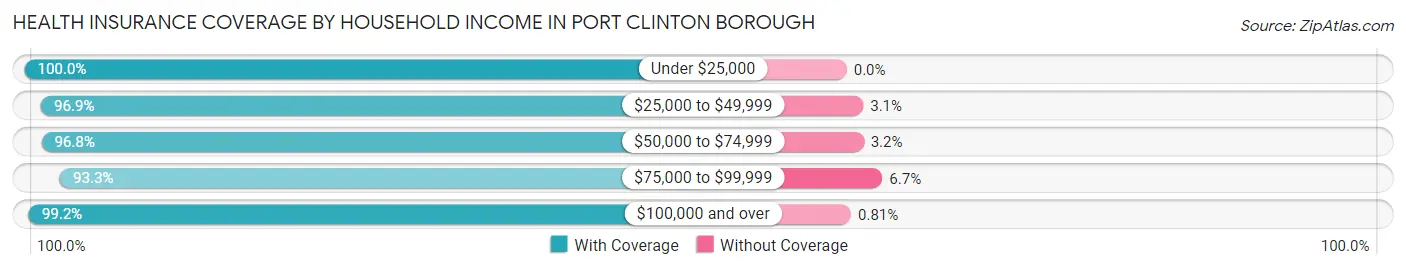
| Household Income | With Coverage | Without Coverage |
| Under $25,000 | 10 (100.0%) | 0 (0.0%) |
| $25,000 to $49,999 | 94 (96.9%) | 3 (3.1%) |
| $50,000 to $74,999 | 61 (96.8%) | 2 (3.2%) |
| $75,000 to $99,999 | 56 (93.3%) | 4 (6.7%) |
| $100,000 and over | 123 (99.2%) | 1 (0.8%) |
Public vs Private Health Insurance Coverage by Age in Port Clinton borough
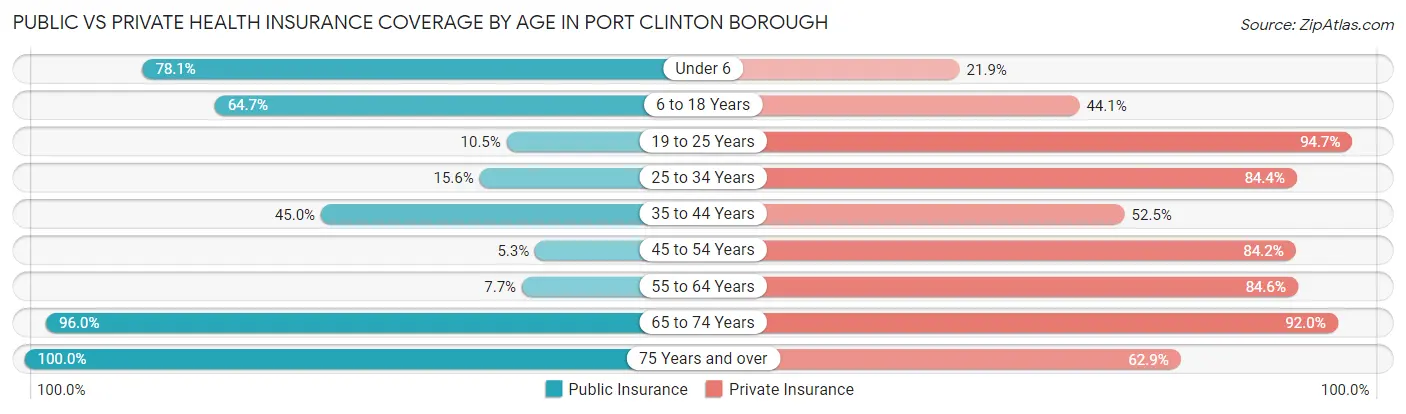
| Age Bracket | Public Insurance | Private Insurance |
| Under 6 | 25 (78.1%) | 7 (21.9%) |
| 6 to 18 Years | 44 (64.7%) | 30 (44.1%) |
| 19 to 25 Years | 4 (10.5%) | 36 (94.7%) |
| 25 to 34 Years | 7 (15.6%) | 38 (84.4%) |
| 35 to 44 Years | 18 (45.0%) | 21 (52.5%) |
| 45 to 54 Years | 1 (5.3%) | 16 (84.2%) |
| 55 to 64 Years | 4 (7.7%) | 44 (84.6%) |
| 65 to 74 Years | 24 (96.0%) | 23 (92.0%) |
| 75 Years and over | 35 (100.0%) | 22 (62.9%) |
| Total | 162 (45.8%) | 237 (66.9%) |
Disability Status by Sex by Age in Port Clinton borough
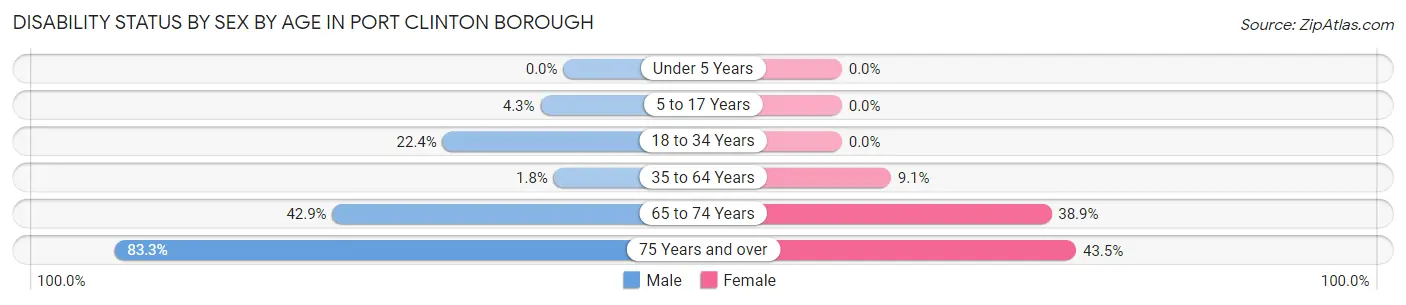
| Age Bracket | Male | Female |
| Under 5 Years | 0 (0.0%) | 0 (0.0%) |
| 5 to 17 Years | 2 (4.3%) | 0 (0.0%) |
| 18 to 34 Years | 13 (22.4%) | 0 (0.0%) |
| 35 to 64 Years | 1 (1.8%) | 5 (9.1%) |
| 65 to 74 Years | 3 (42.9%) | 7 (38.9%) |
| 75 Years and over | 10 (83.3%) | 10 (43.5%) |
Disability Class by Sex by Age in Port Clinton borough
Disability Class: Hearing Difficulty
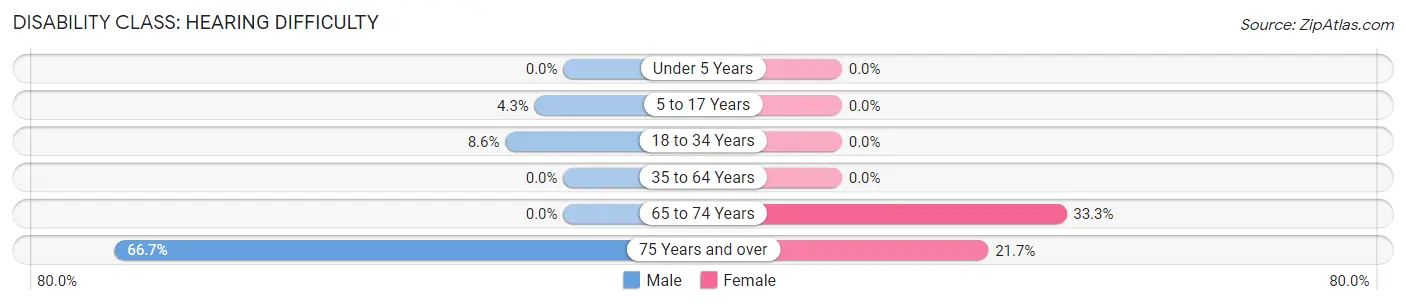
| Age Bracket | Male | Female |
| Under 5 Years | 0 (0.0%) | 0 (0.0%) |
| 5 to 17 Years | 2 (4.3%) | 0 (0.0%) |
| 18 to 34 Years | 5 (8.6%) | 0 (0.0%) |
| 35 to 64 Years | 0 (0.0%) | 0 (0.0%) |
| 65 to 74 Years | 0 (0.0%) | 6 (33.3%) |
| 75 Years and over | 8 (66.7%) | 5 (21.7%) |
Disability Class: Vision Difficulty
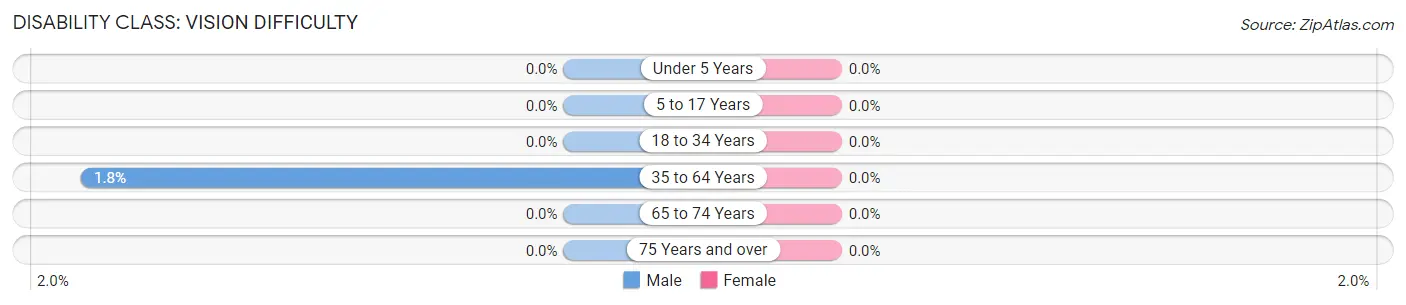
| Age Bracket | Male | Female |
| Under 5 Years | 0 (0.0%) | 0 (0.0%) |
| 5 to 17 Years | 0 (0.0%) | 0 (0.0%) |
| 18 to 34 Years | 0 (0.0%) | 0 (0.0%) |
| 35 to 64 Years | 1 (1.8%) | 0 (0.0%) |
| 65 to 74 Years | 0 (0.0%) | 0 (0.0%) |
| 75 Years and over | 0 (0.0%) | 0 (0.0%) |
Disability Class: Cognitive Difficulty
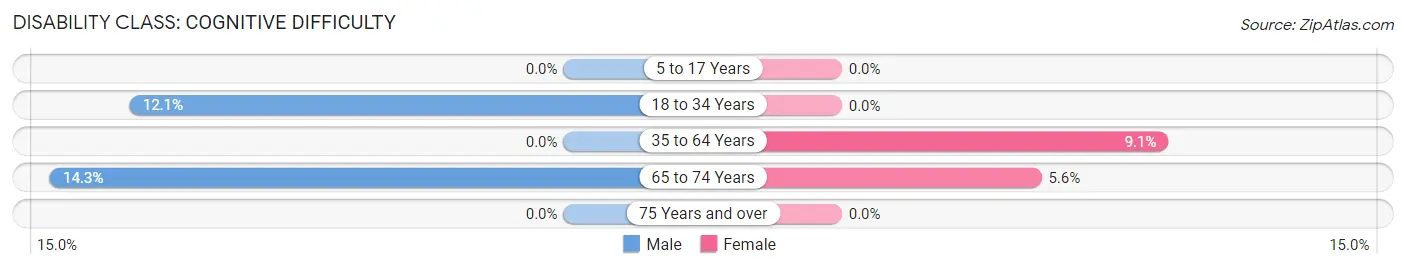
| Age Bracket | Male | Female |
| 5 to 17 Years | 0 (0.0%) | 0 (0.0%) |
| 18 to 34 Years | 7 (12.1%) | 0 (0.0%) |
| 35 to 64 Years | 0 (0.0%) | 5 (9.1%) |
| 65 to 74 Years | 1 (14.3%) | 1 (5.6%) |
| 75 Years and over | 0 (0.0%) | 0 (0.0%) |
Disability Class: Ambulatory Difficulty
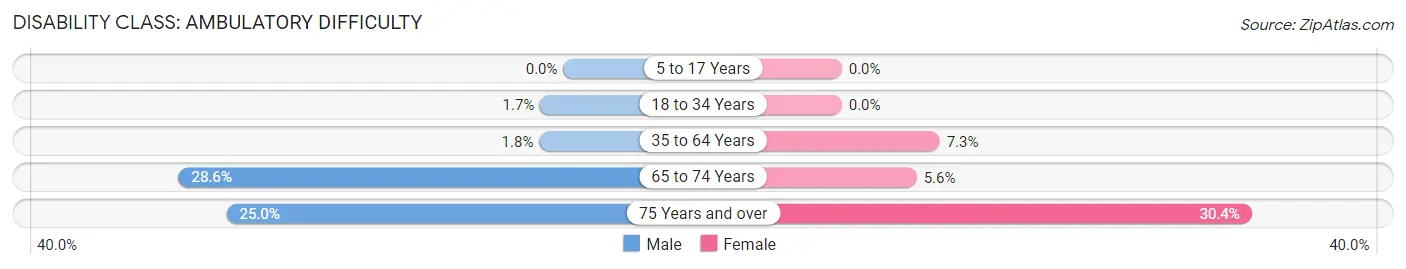
| Age Bracket | Male | Female |
| 5 to 17 Years | 0 (0.0%) | 0 (0.0%) |
| 18 to 34 Years | 1 (1.7%) | 0 (0.0%) |
| 35 to 64 Years | 1 (1.8%) | 4 (7.3%) |
| 65 to 74 Years | 2 (28.6%) | 1 (5.6%) |
| 75 Years and over | 3 (25.0%) | 7 (30.4%) |
Disability Class: Self-Care Difficulty
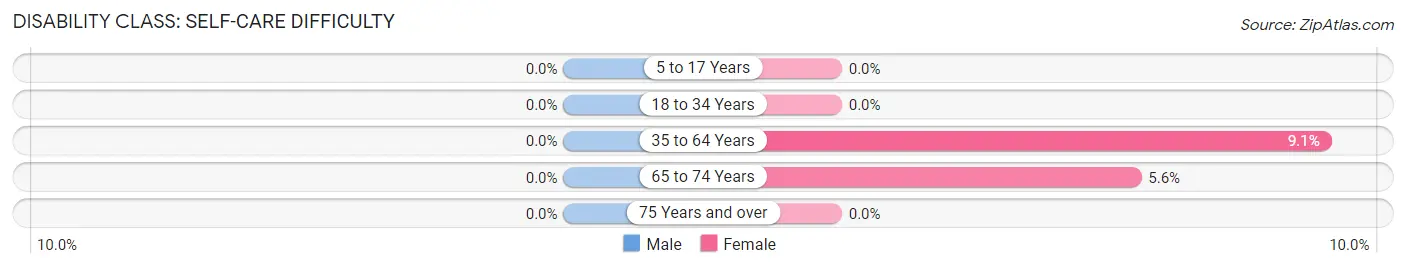
| Age Bracket | Male | Female |
| 5 to 17 Years | 0 (0.0%) | 0 (0.0%) |
| 18 to 34 Years | 0 (0.0%) | 0 (0.0%) |
| 35 to 64 Years | 0 (0.0%) | 5 (9.1%) |
| 65 to 74 Years | 0 (0.0%) | 1 (5.6%) |
| 75 Years and over | 0 (0.0%) | 0 (0.0%) |
Technology Access in Port Clinton borough
Computing Device Access in Port Clinton borough
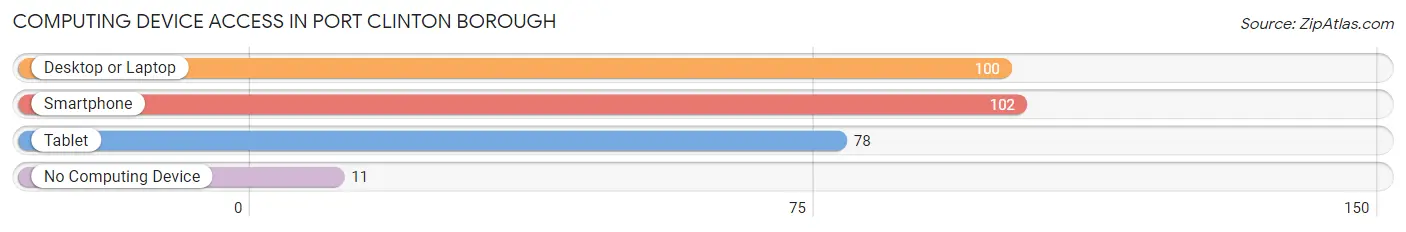
| Device Type | # Households | % Households |
| Desktop or Laptop | 100 | 79.4% |
| Smartphone | 102 | 80.9% |
| Tablet | 78 | 61.9% |
| No Computing Device | 11 | 8.7% |
| Total | 126 | 100.0% |
Internet Access in Port Clinton borough
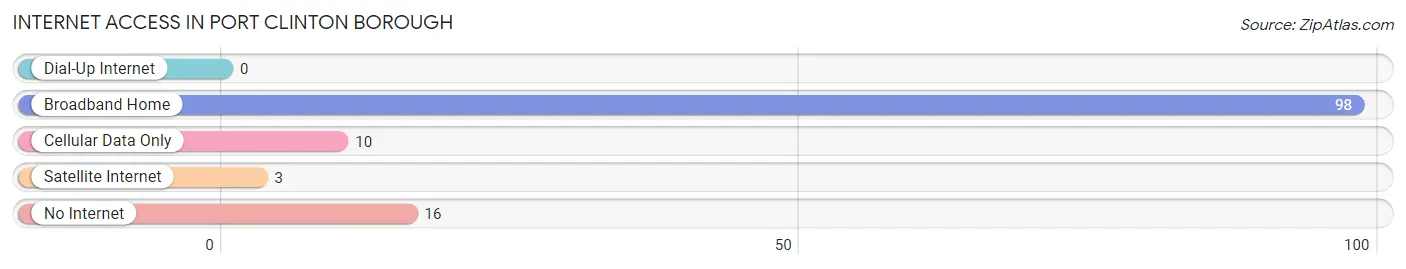
| Internet Type | # Households | % Households |
| Dial-Up Internet | 0 | 0.0% |
| Broadband Home | 98 | 77.8% |
| Cellular Data Only | 10 | 7.9% |
| Satellite Internet | 3 | 2.4% |
| No Internet | 16 | 12.7% |
| Total | 126 | 100.0% |
Port Clinton borough Summary
Introduction
Port Clinton Borough is a small borough located in Schuylkill County, Pennsylvania. It is situated in the southeastern corner of the county, along the Schuylkill River. The borough is home to a population of approximately 1,000 people, and is part of the Pottsville Metropolitan Statistical Area. The borough is known for its rich history, its scenic views, and its vibrant economy.
History
Port Clinton Borough was founded in 1845 by a group of German immigrants. The borough was named after the nearby Port Clinton, which was a port on the Schuylkill River. The borough was originally a farming community, and the first settlers were mostly farmers. As the years passed, the borough grew and developed into a small industrial town. The first industry in the borough was a sawmill, which was built in 1848. This sawmill was followed by a gristmill, a tannery, and a brickyard.
In the late 19th century, the borough experienced a period of rapid growth. This growth was due to the construction of the Schuylkill Canal, which connected the borough to the larger cities of Philadelphia and Reading. The canal also allowed for the transportation of coal and other goods to and from the borough.
The borough continued to grow and develop throughout the 20th century. In the 1950s, the borough experienced a period of population growth, as many people moved to the borough from other parts of the county. This population growth led to the construction of new homes and businesses in the borough.
Geography
Port Clinton Borough is located in the southeastern corner of Schuylkill County, Pennsylvania. The borough is situated along the Schuylkill River, and is bordered by the boroughs of Cressona, Schuylkill Haven, and Orwigsburg. The borough is located approximately 10 miles south of Pottsville, the county seat.
The borough has a total area of 0.7 square miles, all of which is land. The borough is located in a hilly region, and is surrounded by forests and farmland. The borough is home to several small creeks, including the Little Schuylkill River, which flows through the borough.
Economy
Port Clinton Borough has a vibrant economy. The borough is home to several small businesses, including restaurants, retail stores, and service providers. The borough is also home to several manufacturing companies, including a paper mill and a metal fabrication plant.
The borough is also home to several tourist attractions, including the Schuylkill Canal, which is a popular destination for boaters and fishermen. The borough is also home to several parks, including the Port Clinton Borough Park, which is a popular destination for picnics and outdoor activities.
Demographics
As of the 2010 census, the population of Port Clinton Borough was 1,000. The population is predominantly white (97.2%), with a small percentage of African Americans (1.2%) and Hispanics (1.6%). The median household income in the borough is $41,250, and the median age is 43.
Conclusion
Port Clinton Borough is a small borough located in Schuylkill County, Pennsylvania. The borough is known for its rich history, its scenic views, and its vibrant economy. The borough is home to a population of approximately 1,000 people, and is predominantly white. The borough is home to several small businesses, manufacturing companies, and tourist attractions. The median household income in the borough is $41,250, and the median age is 43.
Common Questions
What is Per Capita Income in Port Clinton borough?
Per Capita income in Port Clinton borough is $27,629.
What is the Median Family Income in Port Clinton borough?
Median Family Income in Port Clinton borough is $80,000.
What is the Median Household income in Port Clinton borough?
Median Household Income in Port Clinton borough is $68,750.
What is Income or Wage Gap in Port Clinton borough?
Income or Wage Gap in Port Clinton borough is 2.1%.
Women in Port Clinton borough earn 97.9 cents for every dollar earned by a man.
What is Inequality or Gini Index in Port Clinton borough?
Inequality or Gini Index in Port Clinton borough is 0.31.
What is the Total Population of Port Clinton borough?
Total Population of Port Clinton borough is 354.
What is the Total Male Population of Port Clinton borough?
Total Male Population of Port Clinton borough is 197.
What is the Total Female Population of Port Clinton borough?
Total Female Population of Port Clinton borough is 157.
What is the Ratio of Males per 100 Females in Port Clinton borough?
There are 125.48 Males per 100 Females in Port Clinton borough.
What is the Ratio of Females per 100 Males in Port Clinton borough?
There are 79.70 Females per 100 Males in Port Clinton borough.
What is the Median Population Age in Port Clinton borough?
Median Population Age in Port Clinton borough is 33.3 Years.
What is the Average Family Size in Port Clinton borough
Average Family Size in Port Clinton borough is 3.5 People.
What is the Average Household Size in Port Clinton borough
Average Household Size in Port Clinton borough is 2.8 People.
How Large is the Labor Force in Port Clinton borough?
There are 173 People in the Labor Forcein in Port Clinton borough.
What is the Percentage of People in the Labor Force in Port Clinton borough?
62.9% of People are in the Labor Force in Port Clinton borough.
What is the Unemployment Rate in Port Clinton borough?
Unemployment Rate in Port Clinton borough is 14.5%.