Cities with the Lowest Wage/Income Gap (%) in Tennessee
RELATED REPORTS & OPTIONS
Lowest Wage/Income Gap (%)
Tennessee
Compare Cities
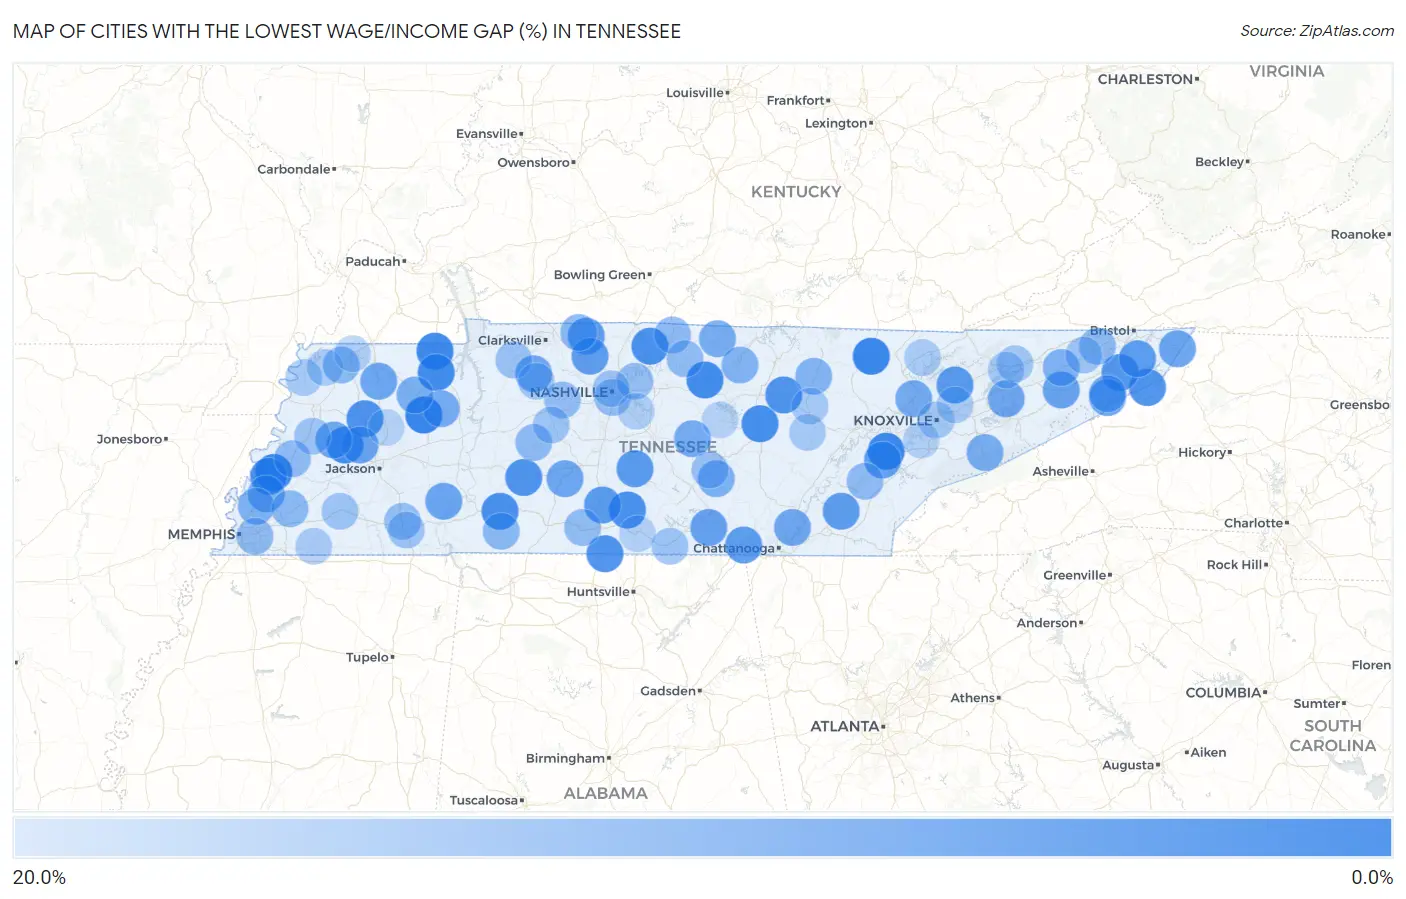
Map of Cities with the Lowest Wage/Income Gap (%) in Tennessee
20.0%
0.0%
Cities with the Lowest Wage/Income Gap (%) in Tennessee
| City | Wage/Income Gap (%) | vs State | vs National | |
| 1. | Huntingdon | 0.019% | 26.7%(-0.267)#1 | 28.0%(-0.280)#4 |
| 2. | Huntsville | 0.29% | 26.7%(-0.264)#2 | 28.0%(-0.277)#58 |
| 3. | Garland | 0.40% | 26.7%(-0.263)#3 | 28.0%(-0.276)#86 |
| 4. | Loudon | 0.56% | 26.7%(-0.262)#4 | 28.0%(-0.274)#129 |
| 5. | Puryear | 0.93% | 26.7%(-0.258)#5 | 28.0%(-0.270)#234 |
| 6. | Paris | 1.6% | 26.7%(-0.252)#6 | 28.0%(-0.264)#396 |
| 7. | South Carthage | 1.6% | 26.7%(-0.251)#7 | 28.0%(-0.264)#405 |
| 8. | Sparta | 1.7% | 26.7%(-0.251)#8 | 28.0%(-0.263)#426 |
| 9. | Alamo | 1.8% | 26.7%(-0.250)#9 | 28.0%(-0.262)#451 |
| 10. | Bon Air | 2.1% | 26.7%(-0.247)#10 | 28.0%(-0.259)#513 |
| 11. | Waynesboro | 2.3% | 26.7%(-0.244)#11 | 28.0%(-0.257)#574 |
| 12. | Petersburg | 2.3% | 26.7%(-0.244)#12 | 28.0%(-0.256)#583 |
| 13. | Graball | 2.8% | 26.7%(-0.239)#13 | 28.0%(-0.252)#703 |
| 14. | Burlison | 2.9% | 26.7%(-0.238)#14 | 28.0%(-0.251)#726 |
| 15. | Trenton | 3.0% | 26.7%(-0.237)#15 | 28.0%(-0.250)#755 |
| 16. | Ardmore | 3.2% | 26.7%(-0.235)#16 | 28.0%(-0.248)#802 |
| 17. | Hohenwald | 3.3% | 26.7%(-0.234)#17 | 28.0%(-0.247)#830 |
| 18. | Roan Mountain | 3.4% | 26.7%(-0.233)#18 | 28.0%(-0.246)#855 |
| 19. | Monterey | 3.5% | 26.7%(-0.233)#19 | 28.0%(-0.245)#868 |
| 20. | Pine Crest | 4.3% | 26.7%(-0.224)#20 | 28.0%(-0.237)#1,086 |
| 21. | Unionville | 4.7% | 26.7%(-0.220)#21 | 28.0%(-0.233)#1,175 |
| 22. | Luttrell | 4.9% | 26.7%(-0.219)#22 | 28.0%(-0.231)#1,220 |
| 23. | Cornersville | 4.9% | 26.7%(-0.218)#23 | 28.0%(-0.231)#1,228 |
| 24. | Hunter | 5.2% | 26.7%(-0.216)#24 | 28.0%(-0.228)#1,302 |
| 25. | Cedar Hill | 5.3% | 26.7%(-0.215)#25 | 28.0%(-0.227)#1,344 |
| 26. | Jasper | 5.3% | 26.7%(-0.214)#26 | 28.0%(-0.227)#1,360 |
| 27. | Calhoun | 5.3% | 26.7%(-0.214)#27 | 28.0%(-0.226)#1,362 |
| 28. | Rocky Top | 5.5% | 26.7%(-0.212)#28 | 28.0%(-0.225)#1,420 |
| 29. | Coopertown | 5.6% | 26.7%(-0.211)#29 | 28.0%(-0.223)#1,450 |
| 30. | Philadelphia | 6.0% | 26.7%(-0.207)#30 | 28.0%(-0.220)#1,538 |
| 31. | Sewanee | 6.5% | 26.7%(-0.202)#31 | 28.0%(-0.215)#1,652 |
| 32. | Greeneville | 6.9% | 26.7%(-0.199)#32 | 28.0%(-0.211)#1,750 |
| 33. | Gadsden | 7.1% | 26.7%(-0.197)#33 | 28.0%(-0.209)#1,803 |
| 34. | Banner Hill | 7.2% | 26.7%(-0.196)#34 | 28.0%(-0.208)#1,839 |
| 35. | Saltillo | 7.3% | 26.7%(-0.195)#35 | 28.0%(-0.207)#1,863 |
| 36. | Mountain City | 7.3% | 26.7%(-0.194)#36 | 28.0%(-0.207)#1,877 |
| 37. | Sharon | 7.4% | 26.7%(-0.193)#37 | 28.0%(-0.206)#1,922 |
| 38. | Mount Pleasant | 7.6% | 26.7%(-0.191)#38 | 28.0%(-0.204)#1,973 |
| 39. | White Pine | 7.7% | 26.7%(-0.190)#39 | 28.0%(-0.203)#2,005 |
| 40. | Slayden | 7.7% | 26.7%(-0.190)#40 | 28.0%(-0.202)#2,021 |
| 41. | Maury City | 7.9% | 26.7%(-0.189)#41 | 28.0%(-0.201)#2,058 |
| 42. | Middle Valley | 8.0% | 26.7%(-0.188)#42 | 28.0%(-0.200)#2,085 |
| 43. | Clinton | 8.4% | 26.7%(-0.183)#43 | 28.0%(-0.195)#2,239 |
| 44. | Hollow Rock | 8.7% | 26.7%(-0.181)#44 | 28.0%(-0.193)#2,307 |
| 45. | Woodbury | 8.9% | 26.7%(-0.179)#45 | 28.0%(-0.191)#2,359 |
| 46. | Red Boiling Springs | 9.0% | 26.7%(-0.177)#46 | 28.0%(-0.190)#2,396 |
| 47. | Munford | 9.0% | 26.7%(-0.177)#47 | 28.0%(-0.190)#2,397 |
| 48. | Erwin | 9.2% | 26.7%(-0.176)#48 | 28.0%(-0.188)#2,445 |
| 49. | Gatlinburg | 9.2% | 26.7%(-0.175)#49 | 28.0%(-0.188)#2,467 |
| 50. | Mckenzie | 9.5% | 26.7%(-0.172)#50 | 28.0%(-0.185)#2,559 |
| 51. | Viola | 10.1% | 26.7%(-0.167)#51 | 28.0%(-0.179)#2,716 |
| 52. | Baileyton | 10.1% | 26.7%(-0.167)#52 | 28.0%(-0.179)#2,720 |
| 53. | Millington | 10.2% | 26.7%(-0.166)#53 | 28.0%(-0.178)#2,762 |
| 54. | Grimsley | 10.7% | 26.7%(-0.160)#54 | 28.0%(-0.172)#2,929 |
| 55. | Gainesboro | 10.9% | 26.7%(-0.158)#55 | 28.0%(-0.170)#2,987 |
| 56. | Troy | 11.7% | 26.7%(-0.150)#56 | 28.0%(-0.163)#3,235 |
| 57. | Collinwood | 11.7% | 26.7%(-0.150)#57 | 28.0%(-0.163)#3,244 |
| 58. | Adams | 11.9% | 26.7%(-0.149)#58 | 28.0%(-0.161)#3,293 |
| 59. | Gallaway | 12.1% | 26.7%(-0.146)#59 | 28.0%(-0.159)#3,374 |
| 60. | Centerville | 12.3% | 26.7%(-0.144)#60 | 28.0%(-0.157)#3,450 |
| 61. | Colonial Heights | 12.4% | 26.7%(-0.143)#61 | 28.0%(-0.156)#3,493 |
| 62. | Westmoreland | 12.5% | 26.7%(-0.143)#62 | 28.0%(-0.155)#3,513 |
| 63. | Niota | 12.5% | 26.7%(-0.142)#63 | 28.0%(-0.155)#3,521 |
| 64. | Henning | 12.5% | 26.7%(-0.142)#64 | 28.0%(-0.154)#3,534 |
| 65. | Memphis | 12.8% | 26.7%(-0.140)#65 | 28.0%(-0.152)#3,611 |
| 66. | Hartsville Trousdale County | 12.8% | 26.7%(-0.139)#66 | 28.0%(-0.152)#3,618 |
| 67. | Pulaski | 13.0% | 26.7%(-0.138)#67 | 28.0%(-0.150)#3,676 |
| 68. | White Bluff | 13.1% | 26.7%(-0.136)#68 | 28.0%(-0.149)#3,724 |
| 69. | Berry Hill | 13.2% | 26.7%(-0.136)#69 | 28.0%(-0.148)#3,744 |
| 70. | Green Hill | 13.4% | 26.7%(-0.133)#70 | 28.0%(-0.146)#3,829 |
| 71. | Bethel Springs | 13.7% | 26.7%(-0.131)#71 | 28.0%(-0.143)#3,913 |
| 72. | Morrison | 13.9% | 26.7%(-0.128)#72 | 28.0%(-0.141)#3,995 |
| 73. | Cumberland City | 14.2% | 26.7%(-0.126)#73 | 28.0%(-0.138)#4,077 |
| 74. | Gates | 14.3% | 26.7%(-0.124)#74 | 28.0%(-0.137)#4,133 |
| 75. | Selmer | 14.4% | 26.7%(-0.124)#75 | 28.0%(-0.136)#4,160 |
| 76. | Nashville | 14.4% | 26.7%(-0.124)#76 | 28.0%(-0.136)#4,162 |
| 77. | Huntland | 14.4% | 26.7%(-0.123)#77 | 28.0%(-0.136)#4,171 |
| 78. | Bon Aqua Junction | 14.4% | 26.7%(-0.123)#78 | 28.0%(-0.135)#4,183 |
| 79. | Whiteville | 14.5% | 26.7%(-0.122)#79 | 28.0%(-0.135)#4,214 |
| 80. | Fall Branch | 14.7% | 26.7%(-0.121)#80 | 28.0%(-0.133)#4,253 |
| 81. | Vanleer | 14.9% | 26.7%(-0.118)#81 | 28.0%(-0.130)#4,356 |
| 82. | Mooresburg | 15.3% | 26.7%(-0.115)#82 | 28.0%(-0.127)#4,471 |
| 83. | Knoxville | 15.5% | 26.7%(-0.112)#83 | 28.0%(-0.124)#4,561 |
| 84. | Lake Tansi | 15.8% | 26.7%(-0.109)#84 | 28.0%(-0.122)#4,687 |
| 85. | Bowman | 16.0% | 26.7%(-0.107)#85 | 28.0%(-0.119)#4,784 |
| 86. | Ridgely | 16.1% | 26.7%(-0.107)#86 | 28.0%(-0.119)#4,791 |
| 87. | Bean Station | 16.1% | 26.7%(-0.107)#87 | 28.0%(-0.119)#4,792 |
| 88. | Rarity Bay | 16.2% | 26.7%(-0.105)#88 | 28.0%(-0.118)#4,863 |
| 89. | Moscow | 16.2% | 26.7%(-0.105)#89 | 28.0%(-0.118)#4,869 |
| 90. | Mascot | 16.5% | 26.7%(-0.102)#90 | 28.0%(-0.114)#5,010 |
| 91. | Hornbeak | 16.5% | 26.7%(-0.102)#91 | 28.0%(-0.114)#5,013 |
| 92. | Fincastle | 16.6% | 26.7%(-0.101)#92 | 28.0%(-0.114)#5,037 |
| 93. | Union City | 17.0% | 26.7%(-0.097)#93 | 28.0%(-0.110)#5,189 |
| 94. | La Vergne | 17.1% | 26.7%(-0.097)#94 | 28.0%(-0.109)#5,206 |
| 95. | Cosby | 17.3% | 26.7%(-0.094)#95 | 28.0%(-0.107)#5,311 |
| 96. | Louisville | 17.5% | 26.7%(-0.092)#96 | 28.0%(-0.105)#5,403 |
| 97. | Fayetteville | 17.5% | 26.7%(-0.092)#97 | 28.0%(-0.105)#5,406 |
| 98. | Valley Forge | 17.9% | 26.7%(-0.089)#98 | 28.0%(-0.101)#5,555 |
| 99. | Smithville | 17.9% | 26.7%(-0.088)#99 | 28.0%(-0.101)#5,566 |
| 100. | Milan | 18.0% | 26.7%(-0.087)#100 | 28.0%(-0.100)#5,613 |
Common Questions
What are the Top 10 Cities with the Lowest Wage/Income Gap (%) in Tennessee?
Top 10 Cities with the Lowest Wage/Income Gap (%) in Tennessee are:
#1
0.019%
#2
0.29%
#3
0.40%
#4
0.56%
#5
0.93%
#6
1.6%
#7
1.6%
#8
1.7%
#9
1.8%
#10
2.3%
What city has the Lowest Wage/Income Gap (%) in Tennessee?
Huntingdon has the Lowest Wage/Income Gap (%) in Tennessee with 0.019%.
What is the Wage / Income Gap in Percentage Terms in the State of Tennessee?
Wage / Income Gap in Percentage Terms in Tennessee is 26.7%.
What is the Wage / Income Gap in Percentage Terms in the United States?
Wage / Income Gap in Percentage Terms in the United States is 28.0%.