Ramblewood, PA Map & Demographics
Ramblewood Map
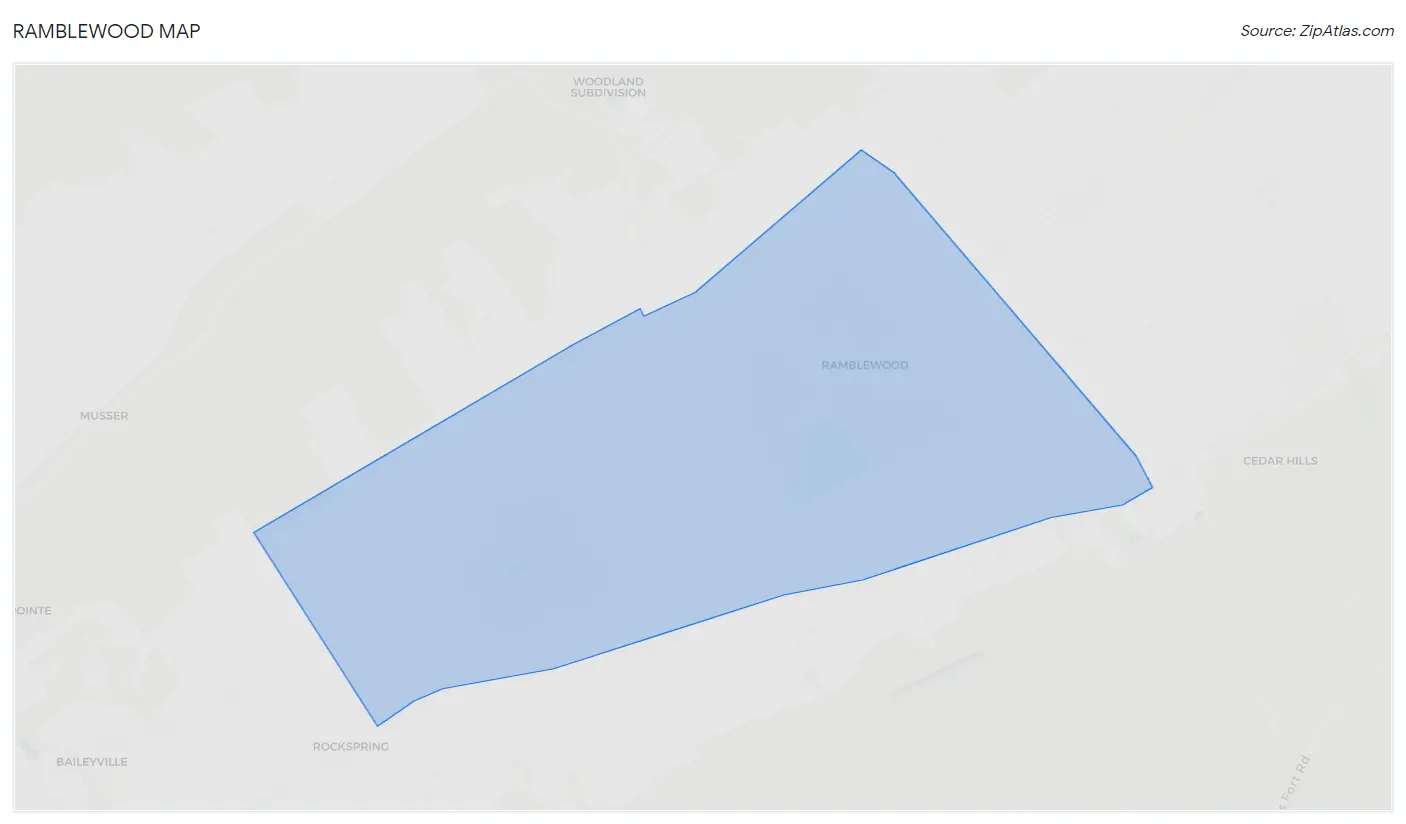
Ramblewood Overview
$41,301
PER CAPITA INCOME
$79,297
AVG FAMILY INCOME
$77,656
AVG HOUSEHOLD INCOME
1.6%
WAGE / INCOME GAP [ % ]
98.4¢/ $1
WAGE / INCOME GAP [ $ ]
0.32
INEQUALITY / GINI INDEX
607
TOTAL POPULATION
297
MALE POPULATION
310
FEMALE POPULATION
95.81
MALES / 100 FEMALES
104.38
FEMALES / 100 MALES
55.5
MEDIAN AGE
2.9
AVG FAMILY SIZE
2.1
AVG HOUSEHOLD SIZE
368
LABOR FORCE [ PEOPLE ]
62.0%
PERCENT IN LABOR FORCE
Income in Ramblewood
Income Overview in Ramblewood
Per Capita Income in Ramblewood is $41,301, while median incomes of families and households are $79,297 and $77,656 respectively.
| Characteristic | Number | Measure |
| Per Capita Income | 607 | $41,301 |
| Median Family Income | 149 | $79,297 |
| Mean Family Income | 149 | $95,434 |
| Median Household Income | 282 | $77,656 |
| Mean Household Income | 282 | $86,000 |
| Income Deficit | 149 | $0 |
| Wage / Income Gap (%) | 607 | 1.56% |
| Wage / Income Gap ($) | 607 | 98.44¢ per $1 |
| Gini / Inequality Index | 607 | 0.32 |
Earnings by Sex in Ramblewood
Average Earnings in Ramblewood are $37,218, $37,569 for men and $36,982 for women, a difference of 1.6%.
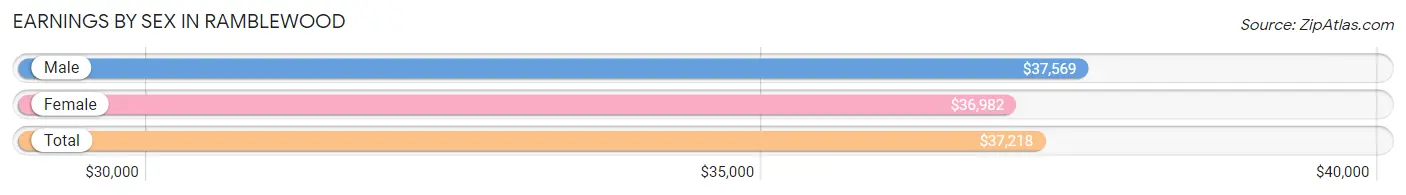
| Sex | Number | Average Earnings |
| Male | 211 (52.7%) | $37,569 |
| Female | 189 (47.2%) | $36,982 |
| Total | 400 (100.0%) | $37,218 |
Earnings by Sex by Income Bracket in Ramblewood
The most common earnings brackets in Ramblewood are $35,000 to $39,999 for men (48 | 22.8%) and $75,000 to $99,999 for women (57 | 30.2%).
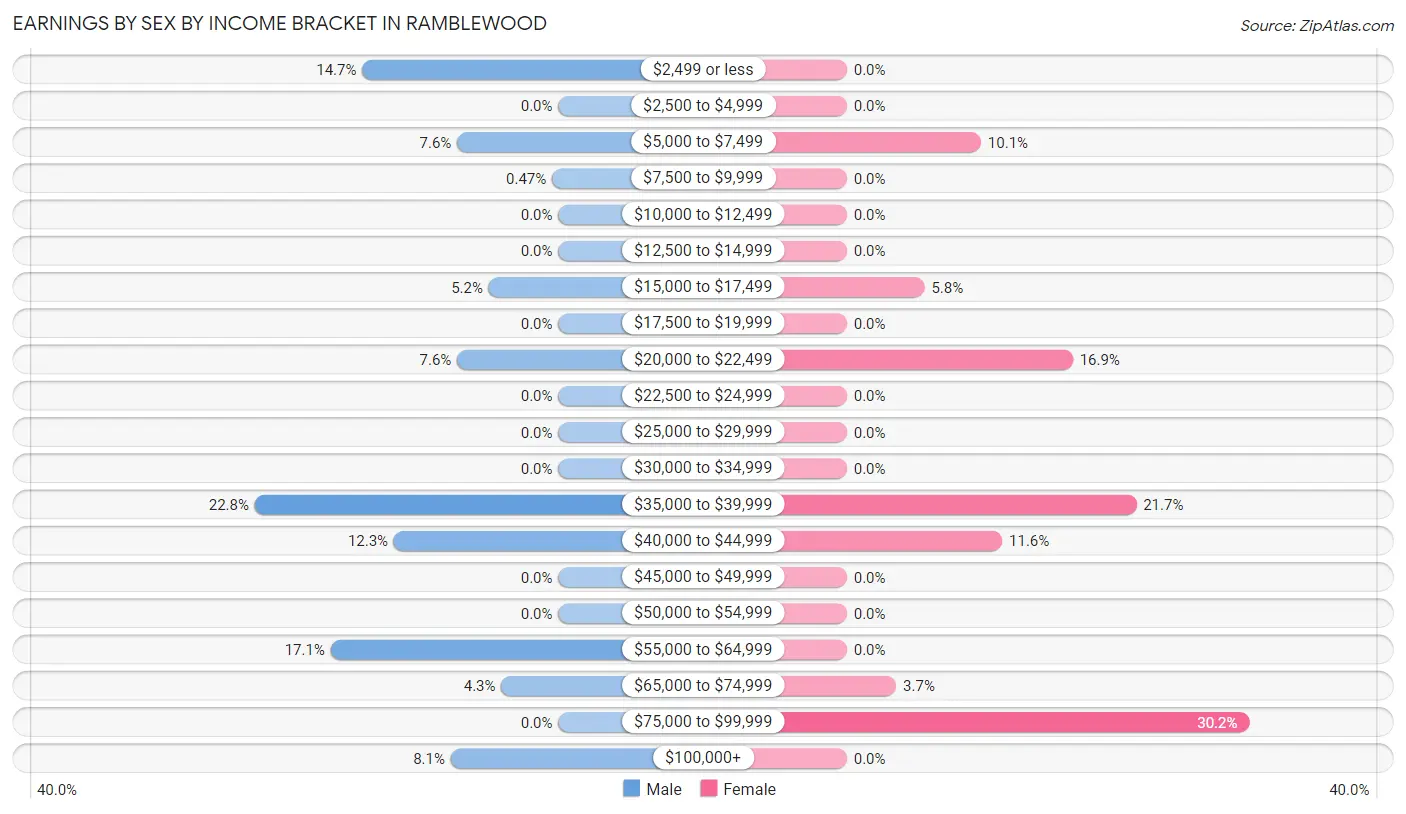
| Income | Male | Female |
| $2,499 or less | 31 (14.7%) | 0 (0.0%) |
| $2,500 to $4,999 | 0 (0.0%) | 0 (0.0%) |
| $5,000 to $7,499 | 16 (7.6%) | 19 (10.1%) |
| $7,500 to $9,999 | 1 (0.5%) | 0 (0.0%) |
| $10,000 to $12,499 | 0 (0.0%) | 0 (0.0%) |
| $12,500 to $14,999 | 0 (0.0%) | 0 (0.0%) |
| $15,000 to $17,499 | 11 (5.2%) | 11 (5.8%) |
| $17,500 to $19,999 | 0 (0.0%) | 0 (0.0%) |
| $20,000 to $22,499 | 16 (7.6%) | 32 (16.9%) |
| $22,500 to $24,999 | 0 (0.0%) | 0 (0.0%) |
| $25,000 to $29,999 | 0 (0.0%) | 0 (0.0%) |
| $30,000 to $34,999 | 0 (0.0%) | 0 (0.0%) |
| $35,000 to $39,999 | 48 (22.8%) | 41 (21.7%) |
| $40,000 to $44,999 | 26 (12.3%) | 22 (11.6%) |
| $45,000 to $49,999 | 0 (0.0%) | 0 (0.0%) |
| $50,000 to $54,999 | 0 (0.0%) | 0 (0.0%) |
| $55,000 to $64,999 | 36 (17.1%) | 0 (0.0%) |
| $65,000 to $74,999 | 9 (4.3%) | 7 (3.7%) |
| $75,000 to $99,999 | 0 (0.0%) | 57 (30.2%) |
| $100,000+ | 17 (8.1%) | 0 (0.0%) |
| Total | 211 (100.0%) | 189 (100.0%) |
Earnings by Sex by Educational Attainment in Ramblewood
Average earnings in Ramblewood are $39,931 for men and $40,521 for women, a difference of 1.5%. Men with an educational attainment of high school diploma enjoy the highest average annual earnings of $37,250, while those with high school diploma education earn the least with $37,250. Women with an educational attainment of bachelor's degree earn the most with the average annual earnings of $75,729, while those with bachelor's degree education have the smallest earnings of $75,729.
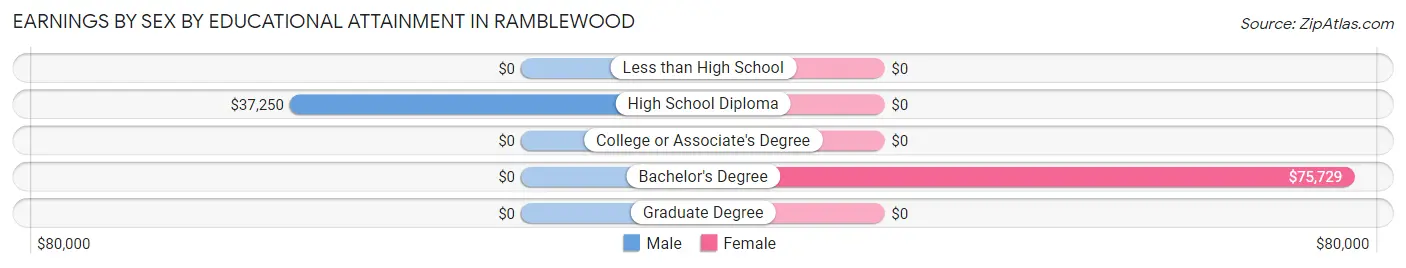
| Educational Attainment | Male Income | Female Income |
| Less than High School | - | - |
| High School Diploma | $37,250 | $0 |
| College or Associate's Degree | - | - |
| Bachelor's Degree | - | - |
| Graduate Degree | - | - |
| Total | $39,931 | $40,521 |
Family Income in Ramblewood
Family Income Brackets in Ramblewood
According to the Ramblewood family income data, there are 38 families falling into the $150,000 to $199,999 income range, which is the most common income bracket and makes up 25.5% of all families.
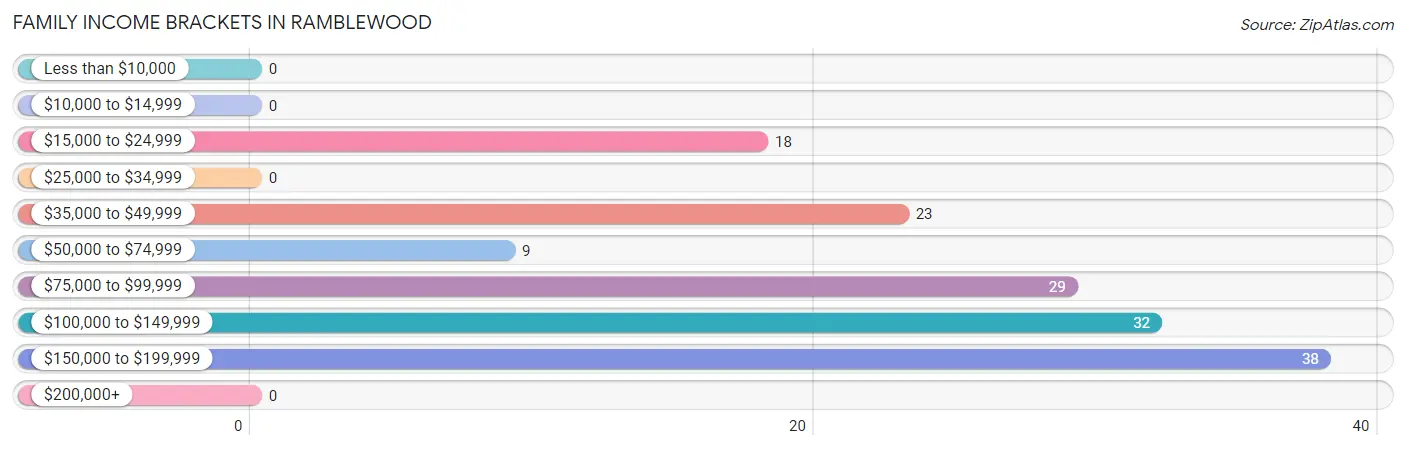
| Income Bracket | # Families | % Families |
| Less than $10,000 | 0 | 0.0% |
| $10,000 to $14,999 | 0 | 0.0% |
| $15,000 to $24,999 | 18 | 12.1% |
| $25,000 to $34,999 | 0 | 0.0% |
| $35,000 to $49,999 | 23 | 15.4% |
| $50,000 to $74,999 | 9 | 6.0% |
| $75,000 to $99,999 | 29 | 19.5% |
| $100,000 to $149,999 | 32 | 21.5% |
| $150,000 to $199,999 | 38 | 25.5% |
| $200,000+ | 0 | 0.0% |
Family Income by Famaliy Size in Ramblewood
2-person families (87 | 58.4%) account for the highest median family income in Ramblewood with $79,297 per family, while 2-person families (87 | 58.4%) have the highest median income of $39,648 per family member.
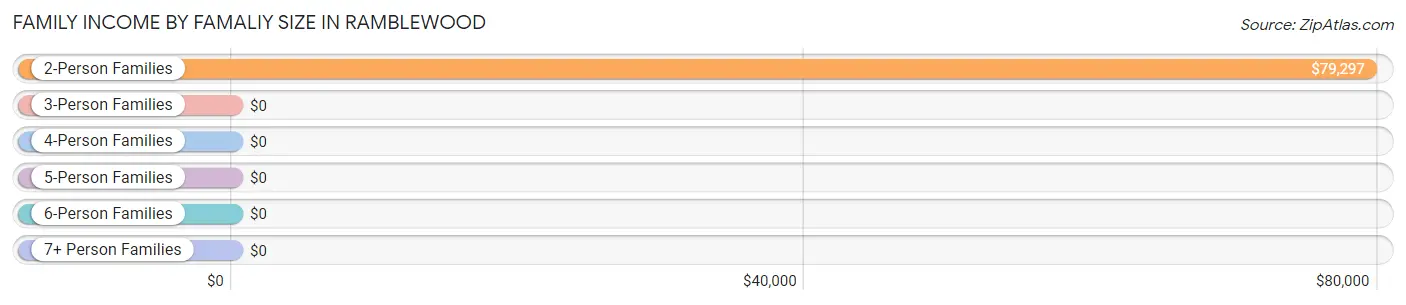
| Income Bracket | # Families | Median Income |
| 2-Person Families | 87 (58.4%) | $79,297 |
| 3-Person Families | 13 (8.7%) | $0 |
| 4-Person Families | 25 (16.8%) | $0 |
| 5-Person Families | 24 (16.1%) | $0 |
| 6-Person Families | 0 (0.0%) | $0 |
| 7+ Person Families | 0 (0.0%) | $0 |
| Total | 149 (100.0%) | $79,297 |
Family Income by Number of Earners in Ramblewood
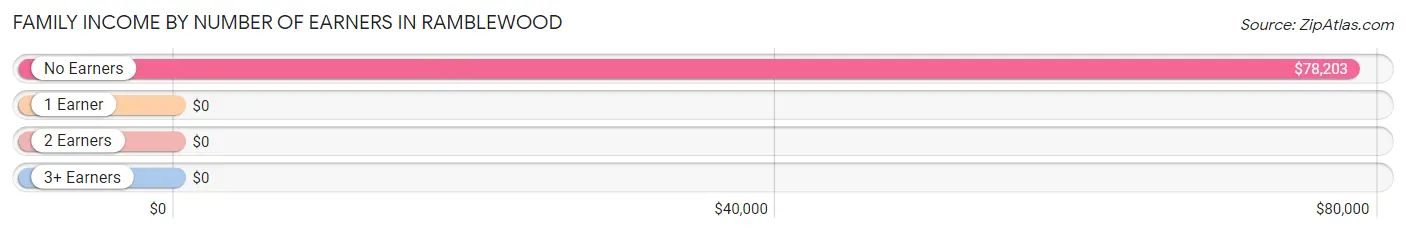
| Number of Earners | # Families | Median Income |
| No Earners | 51 (34.2%) | $78,203 |
| 1 Earner | 11 (7.4%) | $0 |
| 2 Earners | 56 (37.6%) | $0 |
| 3+ Earners | 31 (20.8%) | $0 |
| Total | 149 (100.0%) | $79,297 |
Household Income in Ramblewood
Household Income Brackets in Ramblewood
With 78 households falling in the category, the $100,000 to $149,999 income range is the most frequent in Ramblewood, accounting for 27.7% of all households.
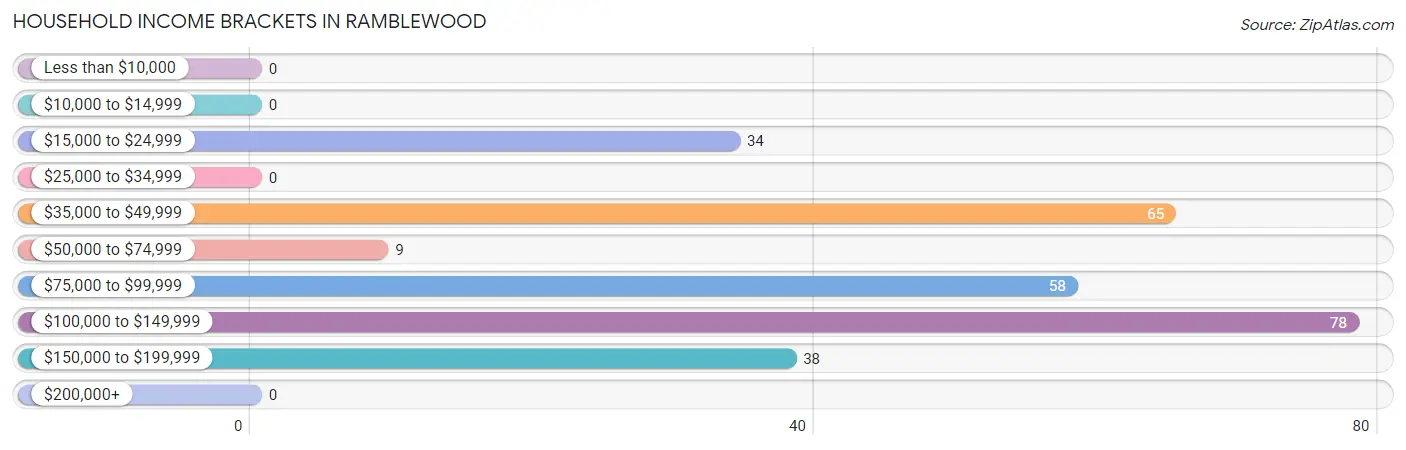
| Income Bracket | # Households | % Households |
| Less than $10,000 | 0 | 0.0% |
| $10,000 to $14,999 | 0 | 0.0% |
| $15,000 to $24,999 | 34 | 12.1% |
| $25,000 to $34,999 | 0 | 0.0% |
| $35,000 to $49,999 | 65 | 23.0% |
| $50,000 to $74,999 | 9 | 3.2% |
| $75,000 to $99,999 | 58 | 20.6% |
| $100,000 to $149,999 | 78 | 27.7% |
| $150,000 to $199,999 | 38 | 13.5% |
| $200,000+ | 0 | 0.0% |
Household Income by Householder Age in Ramblewood
The median household income in Ramblewood is $77,656, with the highest median household income of $135,688 found in the 45 to 64 years age bracket for the primary householder. A total of 77 households (27.3%) fall into this category. Meanwhile, the 15 to 24 years age bracket for the primary householder has the lowest median household income of $0, with 26 households (9.2%) in this group.
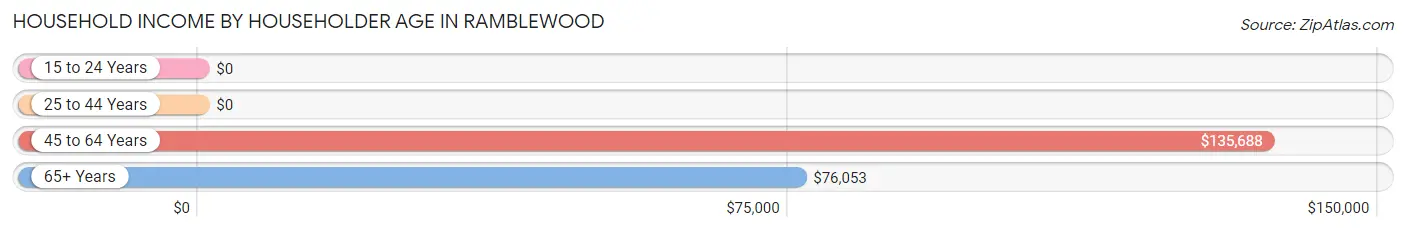
| Income Bracket | # Households | Median Income |
| 15 to 24 Years | 26 (9.2%) | $0 |
| 25 to 44 Years | 21 (7.4%) | $0 |
| 45 to 64 Years | 77 (27.3%) | $135,688 |
| 65+ Years | 158 (56.0%) | $76,053 |
| Total | 282 (100.0%) | $77,656 |
Poverty in Ramblewood
Income Below Poverty by Sex and Age in Ramblewood
With 6.1% poverty level for males and 20.3% for females among the residents of Ramblewood, 65 to 74 year old males and 16 and 17 year old females are the most vulnerable to poverty, with 18 males (14.4%) and 19 females (100.0%) in their respective age groups living below the poverty level.
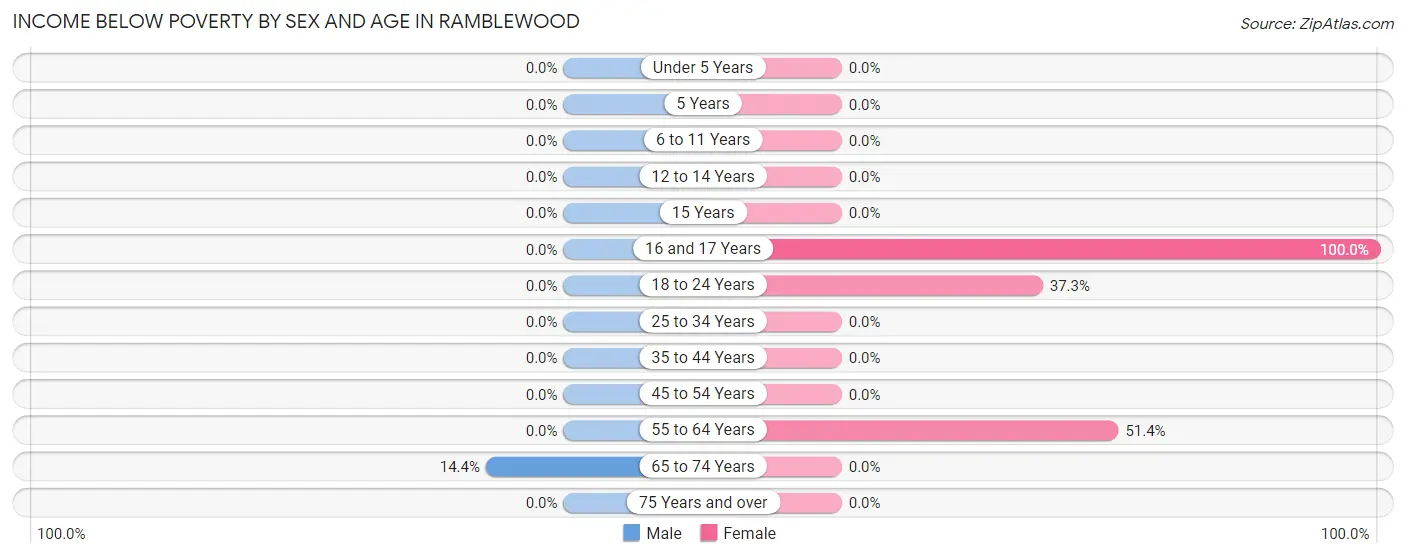
| Age Bracket | Male | Female |
| Under 5 Years | 0 (0.0%) | 0 (0.0%) |
| 5 Years | 0 (0.0%) | 0 (0.0%) |
| 6 to 11 Years | 0 (0.0%) | 0 (0.0%) |
| 12 to 14 Years | 0 (0.0%) | 0 (0.0%) |
| 15 Years | 0 (0.0%) | 0 (0.0%) |
| 16 and 17 Years | 0 (0.0%) | 19 (100.0%) |
| 18 to 24 Years | 0 (0.0%) | 25 (37.3%) |
| 25 to 34 Years | 0 (0.0%) | 0 (0.0%) |
| 35 to 44 Years | 0 (0.0%) | 0 (0.0%) |
| 45 to 54 Years | 0 (0.0%) | 0 (0.0%) |
| 55 to 64 Years | 0 (0.0%) | 19 (51.3%) |
| 65 to 74 Years | 18 (14.4%) | 0 (0.0%) |
| 75 Years and over | 0 (0.0%) | 0 (0.0%) |
| Total | 18 (6.1%) | 63 (20.3%) |
Income Above Poverty by Sex and Age in Ramblewood
According to the poverty statistics in Ramblewood, males aged 12 to 14 years and females aged 25 to 34 years are the age groups that are most secure financially, with 100.0% of males and 100.0% of females in these age groups living above the poverty line.
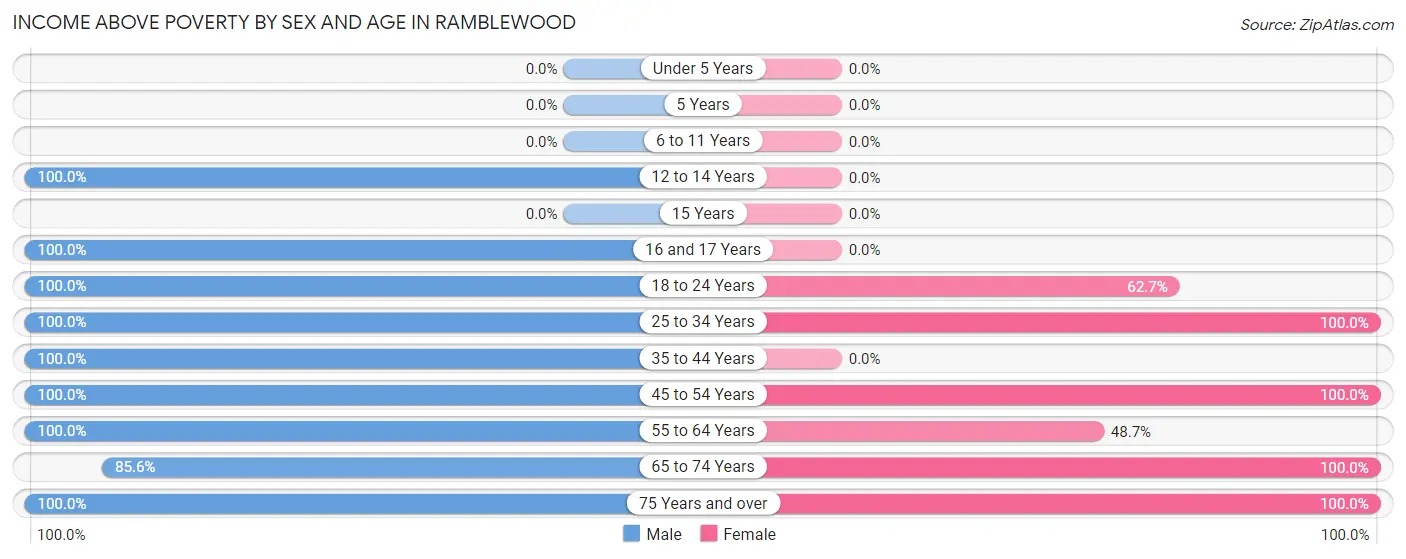
| Age Bracket | Male | Female |
| Under 5 Years | 0 (0.0%) | 0 (0.0%) |
| 5 Years | 0 (0.0%) | 0 (0.0%) |
| 6 to 11 Years | 0 (0.0%) | 0 (0.0%) |
| 12 to 14 Years | 13 (100.0%) | 0 (0.0%) |
| 15 Years | 0 (0.0%) | 0 (0.0%) |
| 16 and 17 Years | 13 (100.0%) | 0 (0.0%) |
| 18 to 24 Years | 25 (100.0%) | 42 (62.7%) |
| 25 to 34 Years | 20 (100.0%) | 48 (100.0%) |
| 35 to 44 Years | 18 (100.0%) | 0 (0.0%) |
| 45 to 54 Years | 11 (100.0%) | 57 (100.0%) |
| 55 to 64 Years | 42 (100.0%) | 18 (48.6%) |
| 65 to 74 Years | 107 (85.6%) | 53 (100.0%) |
| 75 Years and over | 30 (100.0%) | 29 (100.0%) |
| Total | 279 (93.9%) | 247 (79.7%) |
Income Below Poverty Among Married-Couple Families in Ramblewood
The poverty statistics for married-couple families in Ramblewood show that 15.8% or 18 of the total 114 families live below the poverty line. Families with 1 or 2 children have the highest poverty rate of 100.0%, comprising of 18 families. On the other hand, families with no children have the lowest poverty rate of 0.0%, which includes 0 families.
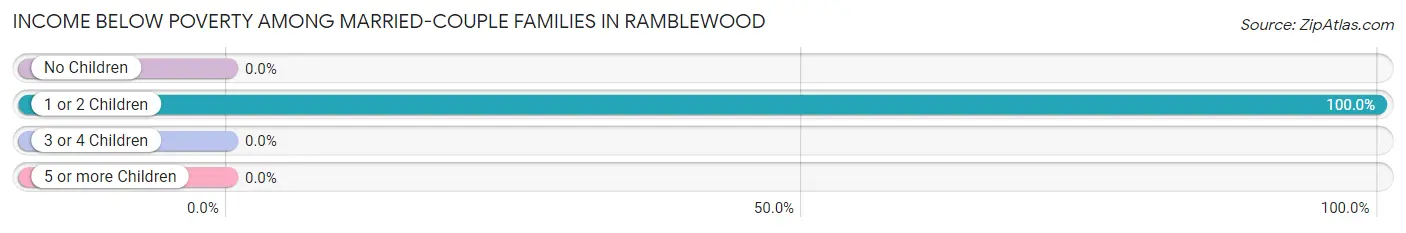
| Children | Above Poverty | Below Poverty |
| No Children | 96 (100.0%) | 0 (0.0%) |
| 1 or 2 Children | 0 (0.0%) | 18 (100.0%) |
| 3 or 4 Children | 0 (0.0%) | 0 (0.0%) |
| 5 or more Children | 0 (0.0%) | 0 (0.0%) |
| Total | 96 (84.2%) | 18 (15.8%) |
Income Below Poverty Among Single-Parent Households in Ramblewood
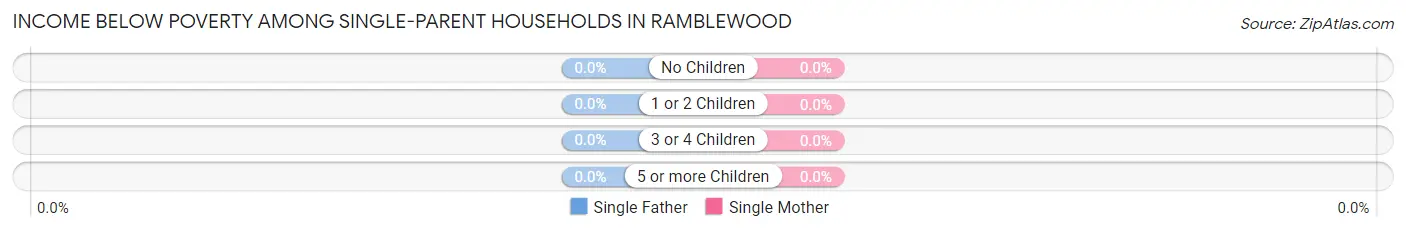
| Children | Single Father | Single Mother |
| No Children | 0 (0.0%) | 0 (0.0%) |
| 1 or 2 Children | 0 (0.0%) | 0 (0.0%) |
| 3 or 4 Children | 0 (0.0%) | 0 (0.0%) |
| 5 or more Children | 0 (0.0%) | 0 (0.0%) |
| Total | 0 (0.0%) | 0 (0.0%) |
Income Below Poverty Among Married-Couple vs Single-Parent Households in Ramblewood
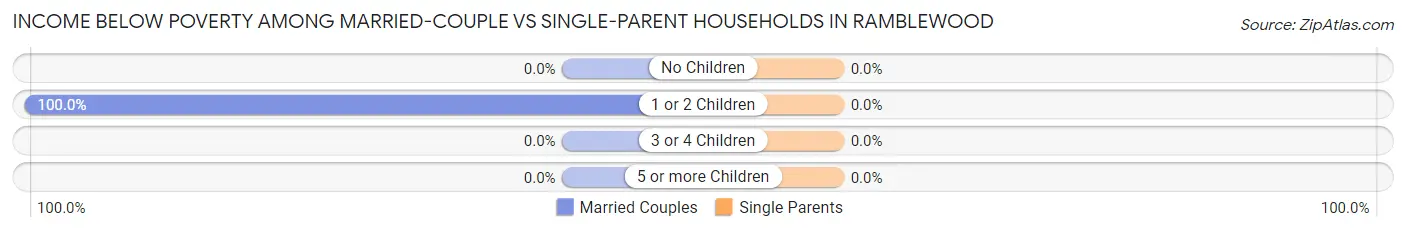
| Children | Married-Couple Families | Single-Parent Households |
| No Children | 0 (0.0%) | 0 (0.0%) |
| 1 or 2 Children | 18 (100.0%) | 0 (0.0%) |
| 3 or 4 Children | 0 (0.0%) | 0 (0.0%) |
| 5 or more Children | 0 (0.0%) | 0 (0.0%) |
| Total | 18 (15.8%) | 0 (0.0%) |
Race in Ramblewood
The most populous races in Ramblewood are White / Caucasian (600 | 98.9%), and Black / African American (7 | 1.1%).
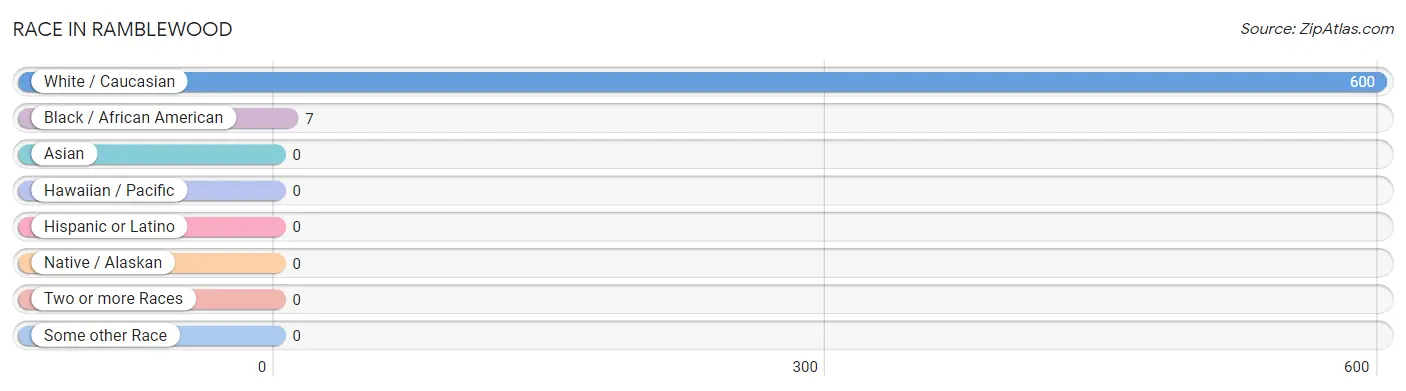
| Race | # Population | % Population |
| Asian | 0 | 0.0% |
| Black / African American | 7 | 1.1% |
| Hawaiian / Pacific | 0 | 0.0% |
| Hispanic or Latino | 0 | 0.0% |
| Native / Alaskan | 0 | 0.0% |
| White / Caucasian | 600 | 98.9% |
| Two or more Races | 0 | 0.0% |
| Some other Race | 0 | 0.0% |
| Total | 607 | 100.0% |
Ancestry in Ramblewood
The most populous ancestries reported in Ramblewood are German (249 | 41.0%), English (111 | 18.3%), American (97 | 16.0%), British (40 | 6.6%), and Irish (28 | 4.6%), together accounting for 86.5% of all Ramblewood residents.
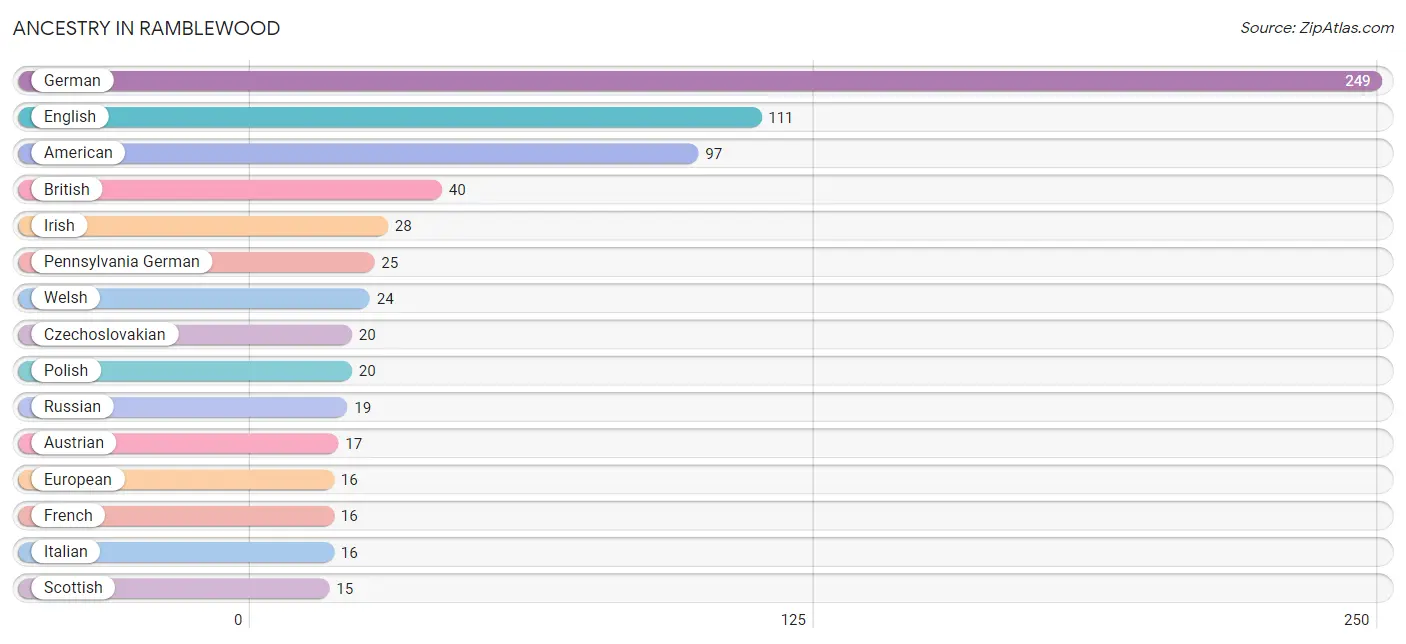
| Ancestry | # Population | % Population |
| American | 97 | 16.0% |
| Austrian | 17 | 2.8% |
| British | 40 | 6.6% |
| Czechoslovakian | 20 | 3.3% |
| English | 111 | 18.3% |
| European | 16 | 2.6% |
| French | 16 | 2.6% |
| German | 249 | 41.0% |
| Haitian | 7 | 1.1% |
| Irish | 28 | 4.6% |
| Italian | 16 | 2.6% |
| Pennsylvania German | 25 | 4.1% |
| Polish | 20 | 3.3% |
| Russian | 19 | 3.1% |
| Scotch-Irish | 11 | 1.8% |
| Scottish | 15 | 2.5% |
| Welsh | 24 | 4.0% | View All 17 Rows |
Immigrants in Ramblewood
The most numerous immigrant groups reported in Ramblewood came from Asia (18 | 3.0%), China (18 | 3.0%), and Eastern Asia (18 | 3.0%), together accounting for 8.9% of all Ramblewood residents.
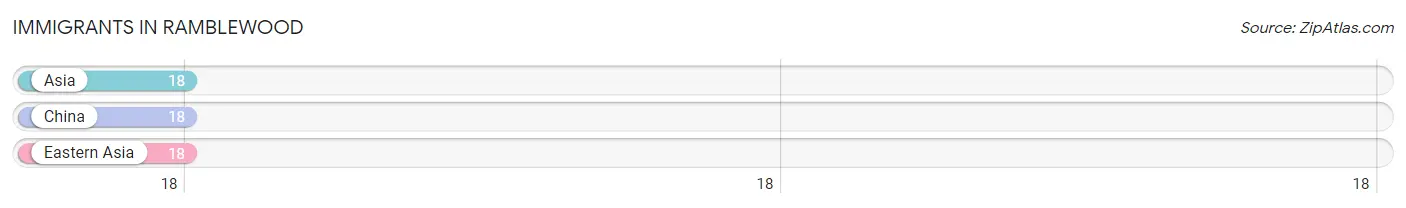
| Immigration Origin | # Population | % Population |
| Asia | 18 | 3.0% |
| China | 18 | 3.0% |
| Eastern Asia | 18 | 3.0% | View All 3 Rows |
Sex and Age in Ramblewood
Sex and Age in Ramblewood
The most populous age groups in Ramblewood are 65 to 69 Years (94 | 31.7%) for men and 20 to 24 Years (67 | 21.6%) for women.
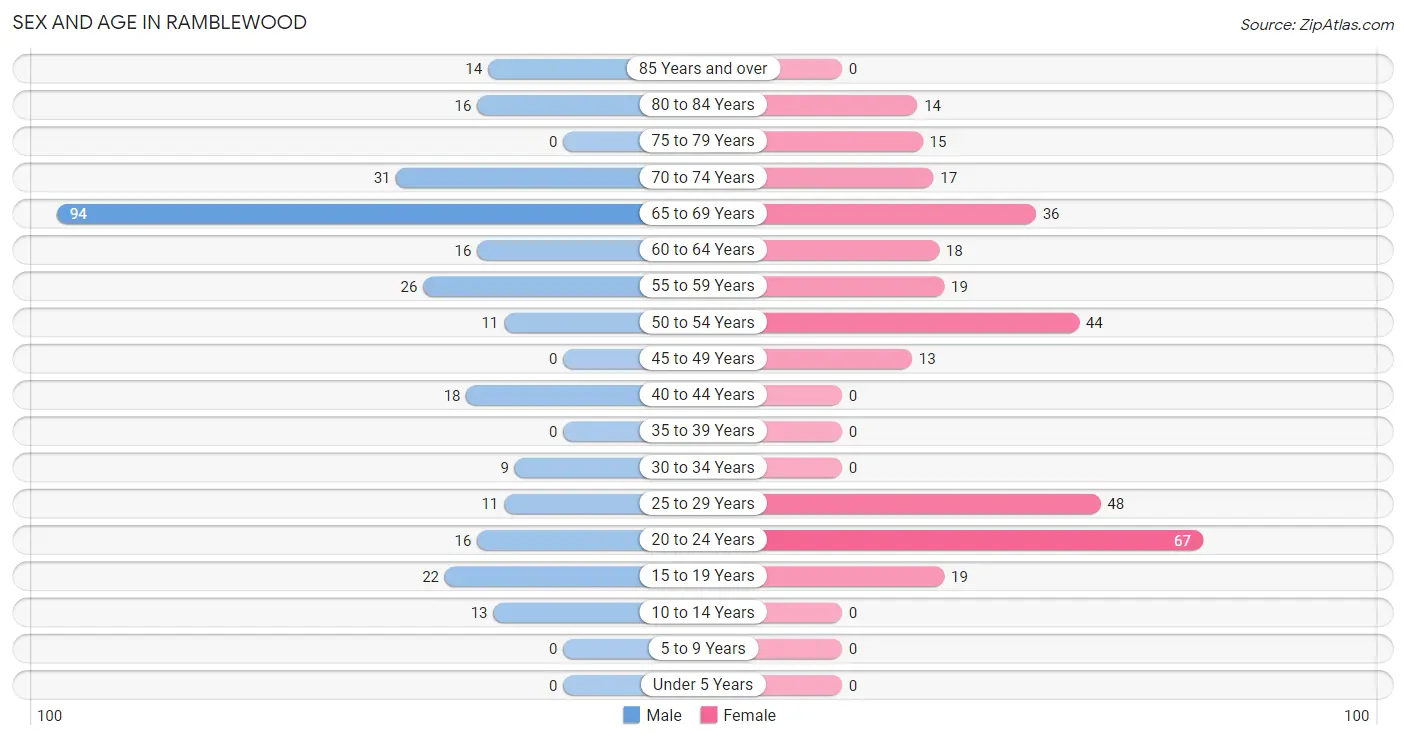
| Age Bracket | Male | Female |
| Under 5 Years | 0 (0.0%) | 0 (0.0%) |
| 5 to 9 Years | 0 (0.0%) | 0 (0.0%) |
| 10 to 14 Years | 13 (4.4%) | 0 (0.0%) |
| 15 to 19 Years | 22 (7.4%) | 19 (6.1%) |
| 20 to 24 Years | 16 (5.4%) | 67 (21.6%) |
| 25 to 29 Years | 11 (3.7%) | 48 (15.5%) |
| 30 to 34 Years | 9 (3.0%) | 0 (0.0%) |
| 35 to 39 Years | 0 (0.0%) | 0 (0.0%) |
| 40 to 44 Years | 18 (6.1%) | 0 (0.0%) |
| 45 to 49 Years | 0 (0.0%) | 13 (4.2%) |
| 50 to 54 Years | 11 (3.7%) | 44 (14.2%) |
| 55 to 59 Years | 26 (8.7%) | 19 (6.1%) |
| 60 to 64 Years | 16 (5.4%) | 18 (5.8%) |
| 65 to 69 Years | 94 (31.7%) | 36 (11.6%) |
| 70 to 74 Years | 31 (10.4%) | 17 (5.5%) |
| 75 to 79 Years | 0 (0.0%) | 15 (4.8%) |
| 80 to 84 Years | 16 (5.4%) | 14 (4.5%) |
| 85 Years and over | 14 (4.7%) | 0 (0.0%) |
| Total | 297 (100.0%) | 310 (100.0%) |
Families and Households in Ramblewood
Median Family Size in Ramblewood
The median family size in Ramblewood is 2.87 persons per family, with married-couple families (114 | 76.5%) accounting for the largest median family size of 2.92 persons per family. On the other hand, single male/father families (11 | 7.4%) represent the smallest median family size with 2.45 persons per family.
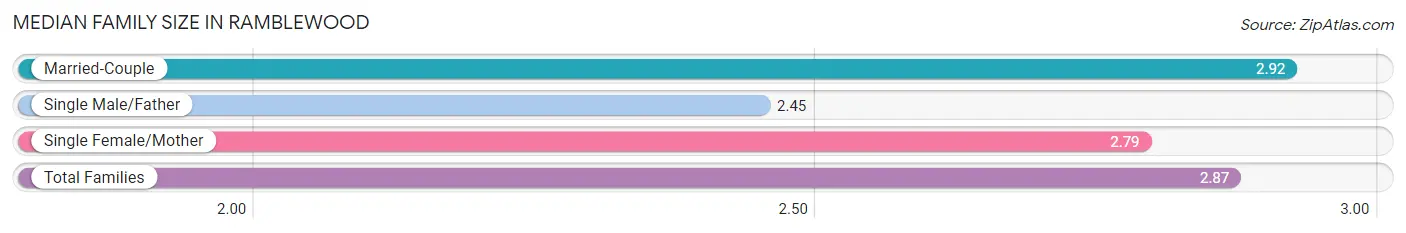
| Family Type | # Families | Family Size |
| Married-Couple | 114 (76.5%) | 2.92 |
| Single Male/Father | 11 (7.4%) | 2.45 |
| Single Female/Mother | 24 (16.1%) | 2.79 |
| Total Families | 149 (100.0%) | 2.87 |
Median Household Size in Ramblewood
The median household size in Ramblewood is 2.15 persons per household, with married-couple households (114 | 40.4%) accounting for the largest median household size of 2.92 persons per household. non-family households (133 | 47.2%) represent the smallest median household size with 1.35 persons per household.
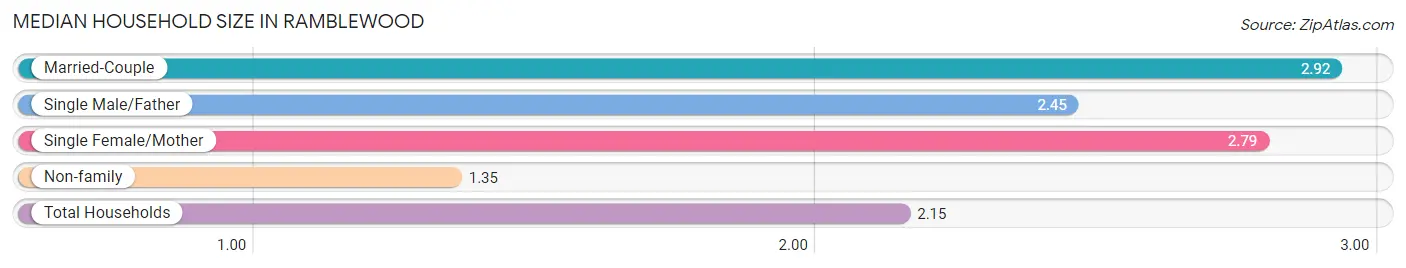
| Household Type | # Households | Household Size |
| Married-Couple | 114 (40.4%) | 2.92 |
| Single Male/Father | 11 (3.9%) | 2.45 |
| Single Female/Mother | 24 (8.5%) | 2.79 |
| Non-family | 133 (47.2%) | 1.35 |
| Total Households | 282 (100.0%) | 2.15 |
Household Size by Marriage Status in Ramblewood
Out of a total of 282 households in Ramblewood, 149 (52.8%) are family households, while 133 (47.2%) are nonfamily households. The most numerous type of family households are 2-person households, comprising 87, and the most common type of nonfamily households are 1-person households, comprising 94.
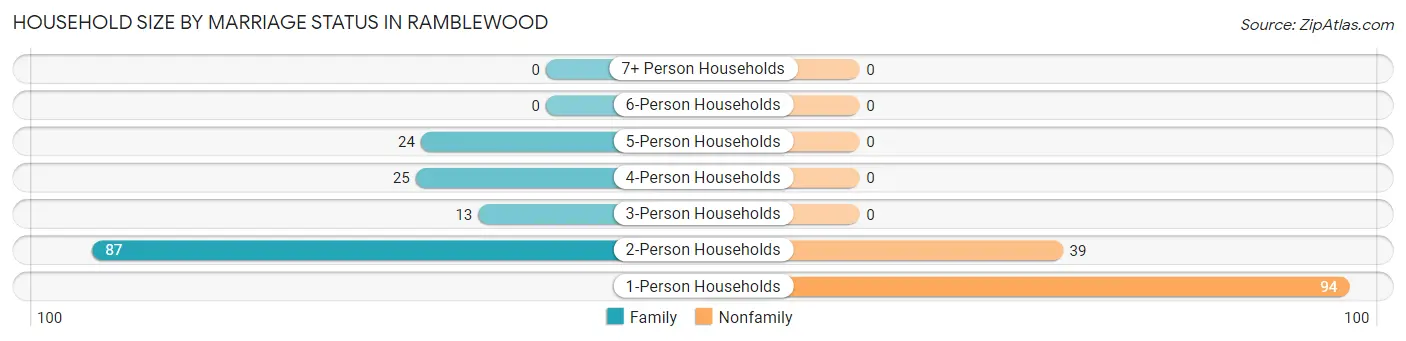
| Household Size | Family Households | Nonfamily Households |
| 1-Person Households | - | 94 (33.3%) |
| 2-Person Households | 87 (30.8%) | 39 (13.8%) |
| 3-Person Households | 13 (4.6%) | 0 (0.0%) |
| 4-Person Households | 25 (8.9%) | 0 (0.0%) |
| 5-Person Households | 24 (8.5%) | 0 (0.0%) |
| 6-Person Households | 0 (0.0%) | 0 (0.0%) |
| 7+ Person Households | 0 (0.0%) | 0 (0.0%) |
| Total | 149 (52.8%) | 133 (47.2%) |
Female Fertility in Ramblewood
Fertility by Age in Ramblewood
| Age Bracket | Women with Births | Births / 1,000 Women |
| 15 to 19 years | 0 (0.0%) | 0.0 |
| 20 to 34 years | 0 (0.0%) | 0.0 |
| 35 to 50 years | 0 (0.0%) | 0.0 |
| Total | 0 (0.0%) | 0.0 |
Fertility by Age by Marriage Status in Ramblewood
| Age Bracket | Married | Unmarried |
| 15 to 19 years | 0 (0.0%) | 0 (0.0%) |
| 20 to 34 years | 0 (0.0%) | 0 (0.0%) |
| 35 to 50 years | 0 (0.0%) | 0 (0.0%) |
| Total | 0 (0.0%) | 0 (0.0%) |
Fertility by Education in Ramblewood
| Educational Attainment | Women with Births | Births / 1,000 Women |
| Less than High School | 0 (0.0%) | 0.0 |
| High School Diploma | 0 (0.0%) | 0.0 |
| College or Associate's Degree | 0 (0.0%) | 0.0 |
| Bachelor's Degree | 0 (0.0%) | 0.0 |
| Graduate Degree | 0 (0.0%) | 0.0 |
| Total | 0 (0.0%) | 0.0 |
Fertility by Education by Marriage Status in Ramblewood
| Educational Attainment | Married | Unmarried |
| Less than High School | 0 (0.0%) | 0 (0.0%) |
| High School Diploma | 0 (0.0%) | 0 (0.0%) |
| College or Associate's Degree | 0 (0.0%) | 0 (0.0%) |
| Bachelor's Degree | 0 (0.0%) | 0 (0.0%) |
| Graduate Degree | 0 (0.0%) | 0 (0.0%) |
| Total | 0 (0.0%) | 0 (0.0%) |
Employment Characteristics in Ramblewood
Employment by Class of Employer in Ramblewood
Among the 339 employed individuals in Ramblewood, private company employees (263 | 77.6%), not-for-profit organizations (45 | 13.3%), and local government employees (31 | 9.1%) make up the most common classes of employment.
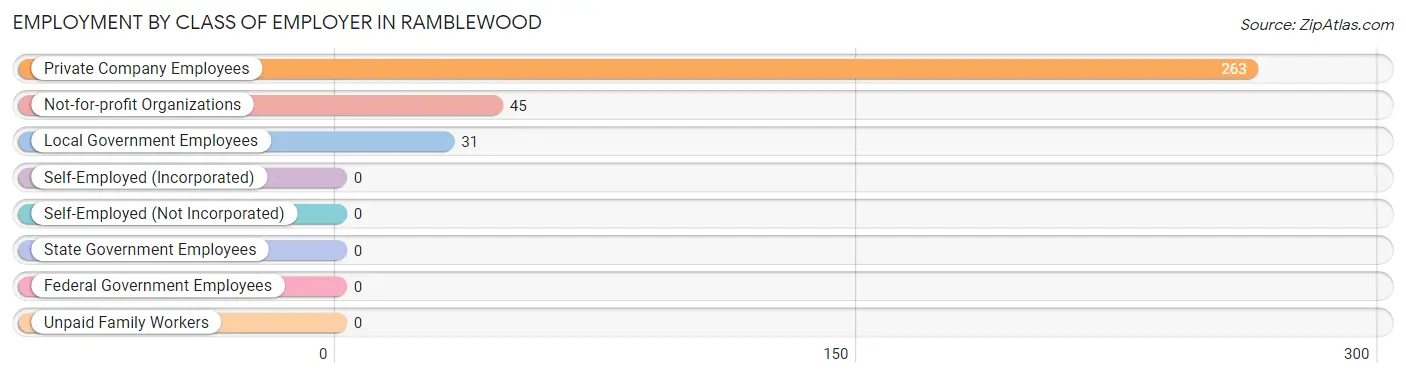
| Employer Class | # Employees | % Employees |
| Private Company Employees | 263 | 77.6% |
| Self-Employed (Incorporated) | 0 | 0.0% |
| Self-Employed (Not Incorporated) | 0 | 0.0% |
| Not-for-profit Organizations | 45 | 13.3% |
| Local Government Employees | 31 | 9.1% |
| State Government Employees | 0 | 0.0% |
| Federal Government Employees | 0 | 0.0% |
| Unpaid Family Workers | 0 | 0.0% |
| Total | 339 | 100.0% |
Employment Status by Age in Ramblewood
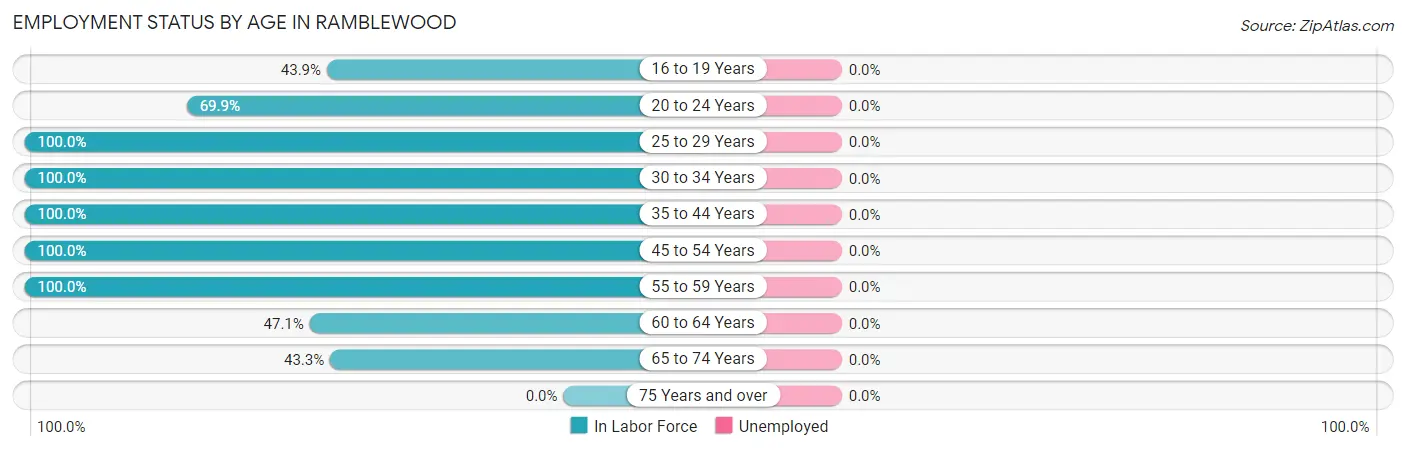
| Age Bracket | In Labor Force | Unemployed |
| 16 to 19 Years | 18 (43.9%) | 0 (0.0%) |
| 20 to 24 Years | 58 (69.9%) | 0 (0.0%) |
| 25 to 29 Years | 59 (100.0%) | 0 (0.0%) |
| 30 to 34 Years | 9 (100.0%) | 0 (0.0%) |
| 35 to 44 Years | 18 (100.0%) | 0 (0.0%) |
| 45 to 54 Years | 68 (100.0%) | 0 (0.0%) |
| 55 to 59 Years | 45 (100.0%) | 0 (0.0%) |
| 60 to 64 Years | 16 (47.1%) | 0 (0.0%) |
| 65 to 74 Years | 77 (43.3%) | 0 (0.0%) |
| 75 Years and over | 0 (0.0%) | 0 (0.0%) |
| Total | 368 (62.0%) | 0 (0.0%) |
Employment Status by Educational Attainment in Ramblewood
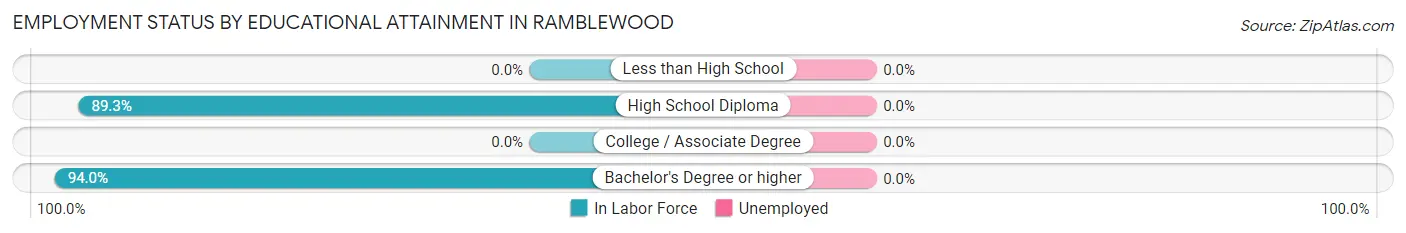
| Educational Attainment | In Labor Force | Unemployed |
| Less than High School | 0 (0.0%) | 0 (0.0%) |
| High School Diploma | 75 (89.3%) | 0 (0.0%) |
| College / Associate Degree | 0 (0.0%) | 0 (0.0%) |
| Bachelor's Degree or higher | 140 (94.0%) | 0 (0.0%) |
| Total | 215 (92.3%) | 0 (0.0%) |
Employment Occupations by Sex in Ramblewood
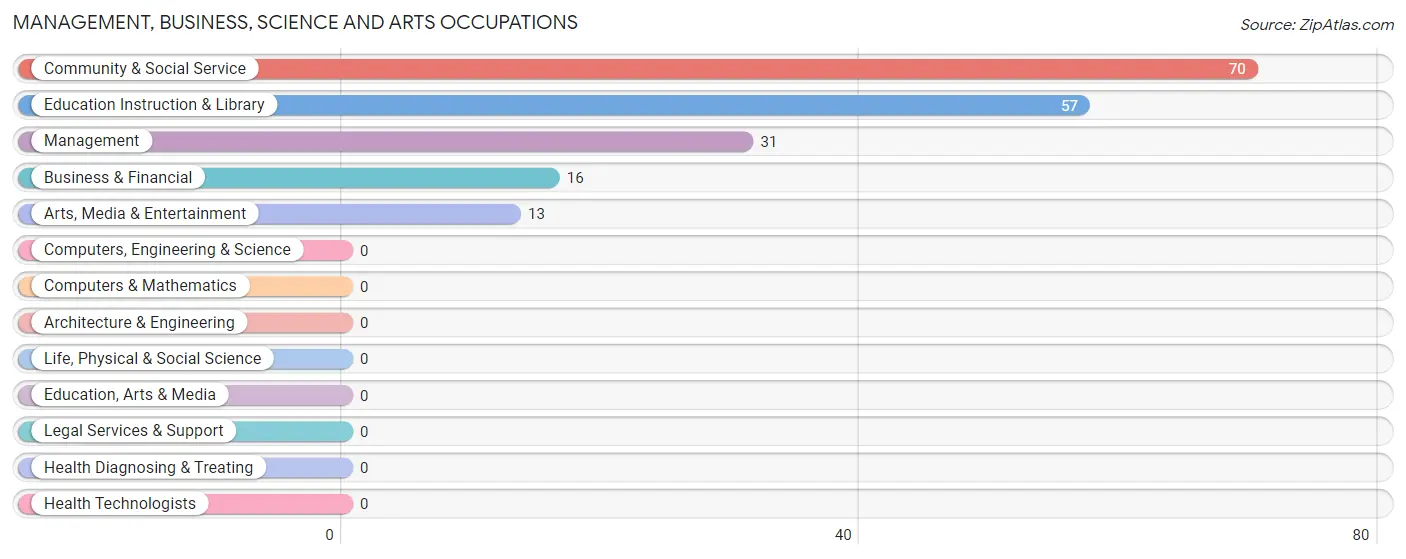
Management, Business, Science and Arts Occupations
The most common Management, Business, Science and Arts occupations in Ramblewood are Community & Social Service (70 | 19.0%), Education Instruction & Library (57 | 15.5%), Management (31 | 8.4%), Business & Financial (16 | 4.3%), and Arts, Media & Entertainment (13 | 3.5%).
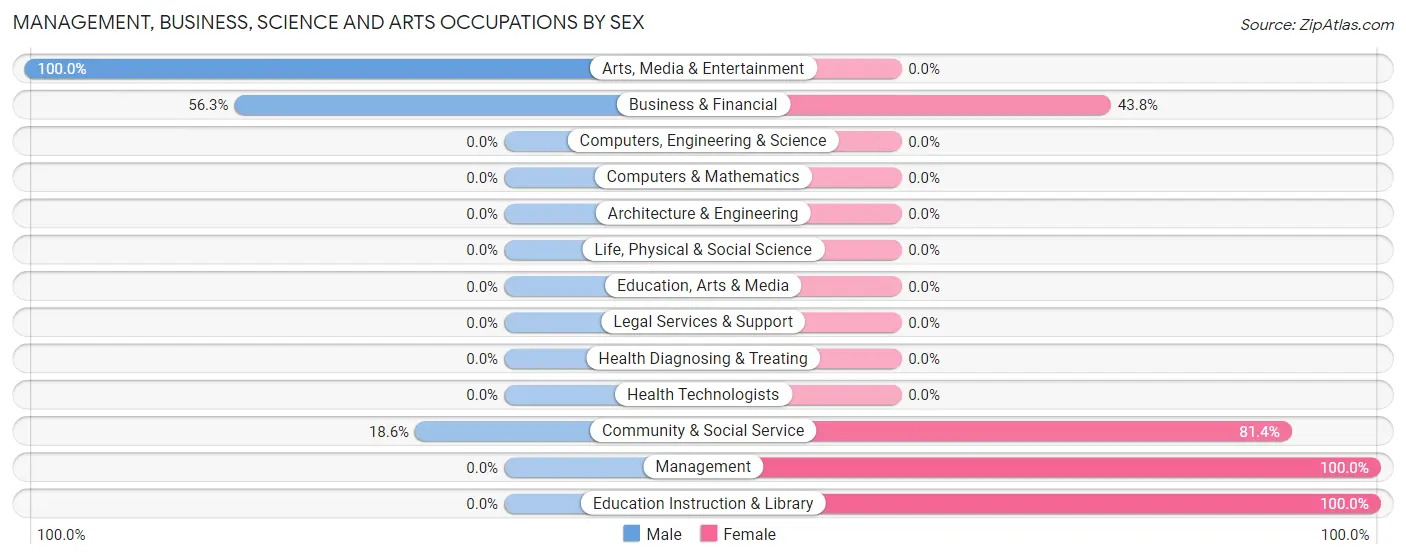
Management, Business, Science and Arts Occupations by Sex
Within the Management, Business, Science and Arts occupations in Ramblewood, the most male-oriented occupations are Arts, Media & Entertainment (100.0%), Business & Financial (56.2%), and Community & Social Service (18.6%), while the most female-oriented occupations are Management (100.0%), Education Instruction & Library (100.0%), and Community & Social Service (81.4%).
| Occupation | Male | Female |
| Management | 0 (0.0%) | 31 (100.0%) |
| Business & Financial | 9 (56.2%) | 7 (43.8%) |
| Computers, Engineering & Science | 0 (0.0%) | 0 (0.0%) |
| Computers & Mathematics | 0 (0.0%) | 0 (0.0%) |
| Architecture & Engineering | 0 (0.0%) | 0 (0.0%) |
| Life, Physical & Social Science | 0 (0.0%) | 0 (0.0%) |
| Community & Social Service | 13 (18.6%) | 57 (81.4%) |
| Education, Arts & Media | 0 (0.0%) | 0 (0.0%) |
| Legal Services & Support | 0 (0.0%) | 0 (0.0%) |
| Education Instruction & Library | 0 (0.0%) | 57 (100.0%) |
| Arts, Media & Entertainment | 13 (100.0%) | 0 (0.0%) |
| Health Diagnosing & Treating | 0 (0.0%) | 0 (0.0%) |
| Health Technologists | 0 (0.0%) | 0 (0.0%) |
| Total (Category) | 22 (18.8%) | 95 (81.2%) |
| Total (Overall) | 179 (48.6%) | 189 (51.4%) |
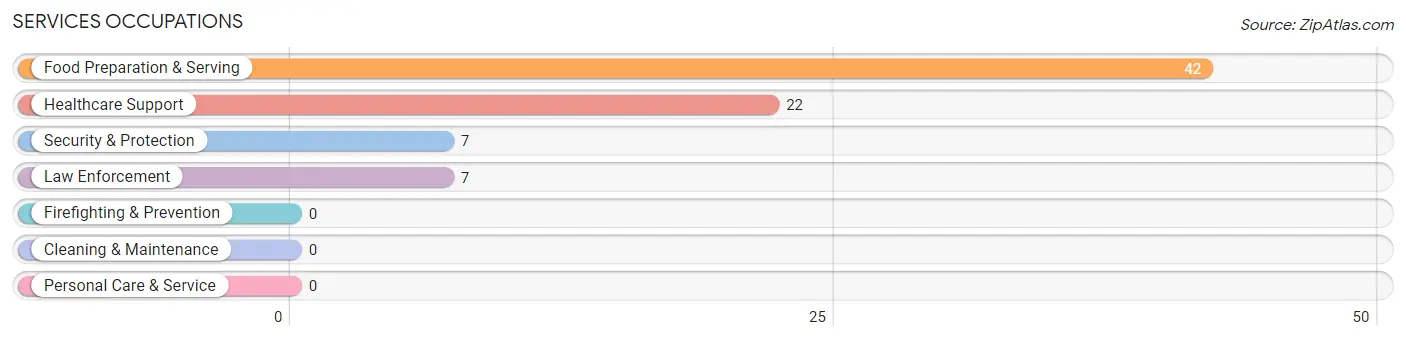
Services Occupations
The most common Services occupations in Ramblewood are Food Preparation & Serving (42 | 11.4%), Healthcare Support (22 | 6.0%), Security & Protection (7 | 1.9%), and Law Enforcement (7 | 1.9%).
Services Occupations by Sex
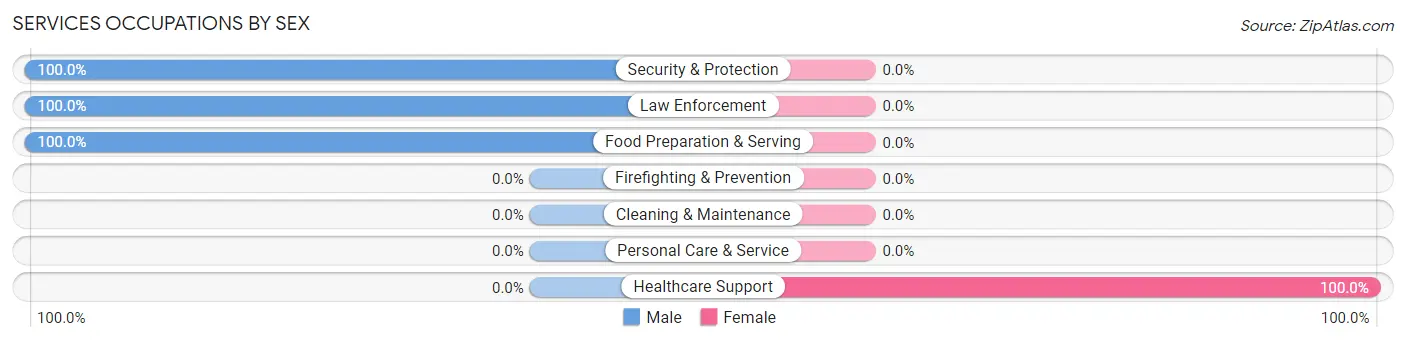
| Occupation | Male | Female |
| Healthcare Support | 0 (0.0%) | 22 (100.0%) |
| Security & Protection | 7 (100.0%) | 0 (0.0%) |
| Firefighting & Prevention | 0 (0.0%) | 0 (0.0%) |
| Law Enforcement | 7 (100.0%) | 0 (0.0%) |
| Food Preparation & Serving | 42 (100.0%) | 0 (0.0%) |
| Cleaning & Maintenance | 0 (0.0%) | 0 (0.0%) |
| Personal Care & Service | 0 (0.0%) | 0 (0.0%) |
| Total (Category) | 49 (69.0%) | 22 (31.0%) |
| Total (Overall) | 179 (48.6%) | 189 (51.4%) |
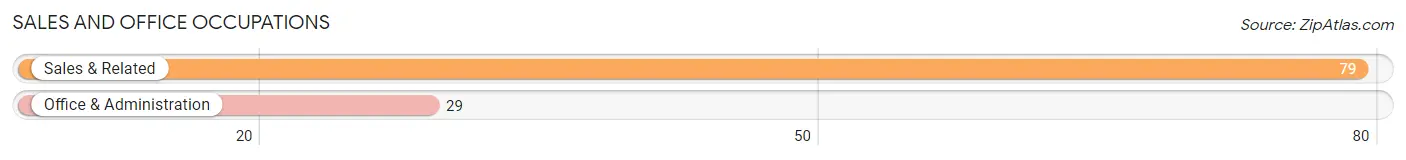
Sales and Office Occupations
The most common Sales and Office occupations in Ramblewood are Sales & Related (79 | 21.5%), and Office & Administration (29 | 7.9%).
Sales and Office Occupations by Sex
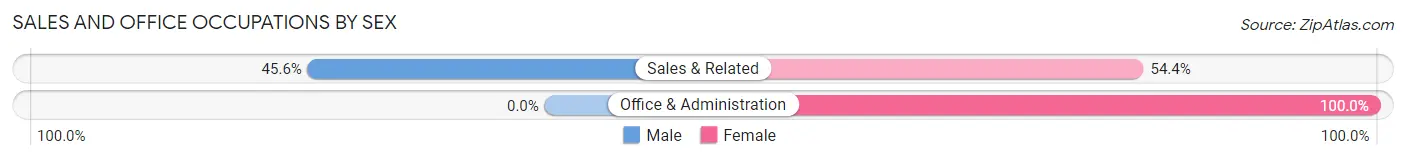
| Occupation | Male | Female |
| Sales & Related | 36 (45.6%) | 43 (54.4%) |
| Office & Administration | 0 (0.0%) | 29 (100.0%) |
| Total (Category) | 36 (33.3%) | 72 (66.7%) |
| Total (Overall) | 179 (48.6%) | 189 (51.4%) |
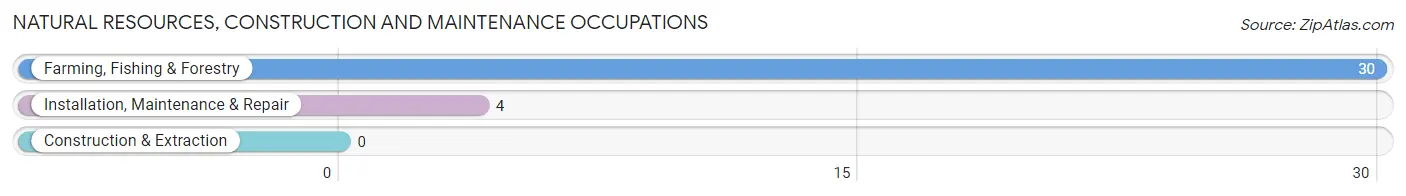
Natural Resources, Construction and Maintenance Occupations
The most common Natural Resources, Construction and Maintenance occupations in Ramblewood are Farming, Fishing & Forestry (30 | 8.2%), and Installation, Maintenance & Repair (4 | 1.1%).
Natural Resources, Construction and Maintenance Occupations by Sex
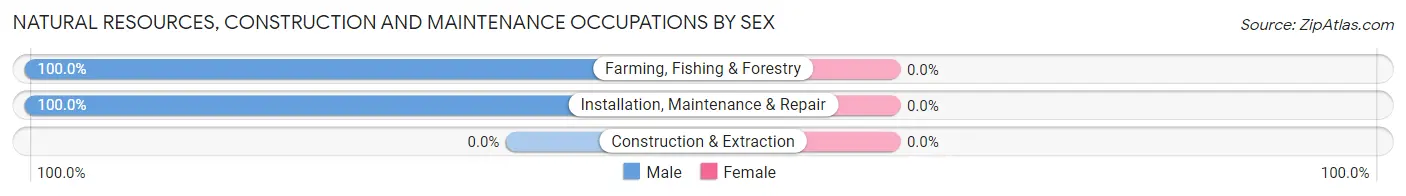
| Occupation | Male | Female |
| Farming, Fishing & Forestry | 30 (100.0%) | 0 (0.0%) |
| Construction & Extraction | 0 (0.0%) | 0 (0.0%) |
| Installation, Maintenance & Repair | 4 (100.0%) | 0 (0.0%) |
| Total (Category) | 34 (100.0%) | 0 (0.0%) |
| Total (Overall) | 179 (48.6%) | 189 (51.4%) |
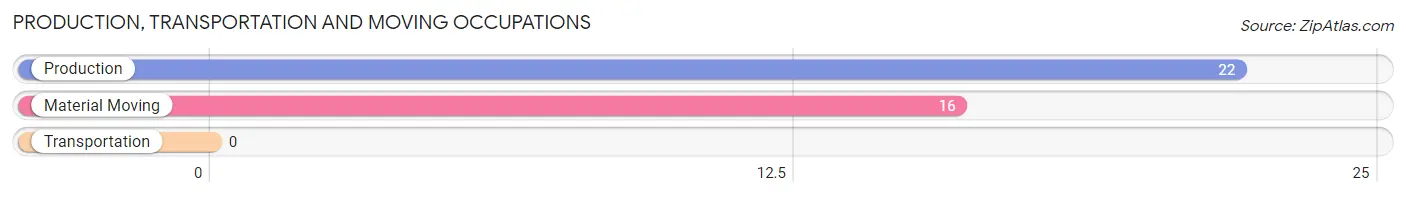
Production, Transportation and Moving Occupations
The most common Production, Transportation and Moving occupations in Ramblewood are Production (22 | 6.0%), and Material Moving (16 | 4.3%).
Production, Transportation and Moving Occupations by Sex
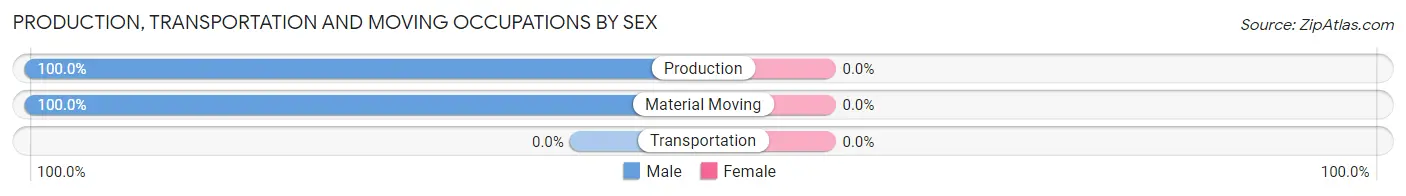
| Occupation | Male | Female |
| Production | 22 (100.0%) | 0 (0.0%) |
| Transportation | 0 (0.0%) | 0 (0.0%) |
| Material Moving | 16 (100.0%) | 0 (0.0%) |
| Total (Category) | 38 (100.0%) | 0 (0.0%) |
| Total (Overall) | 179 (48.6%) | 189 (51.4%) |
Employment Industries by Sex in Ramblewood
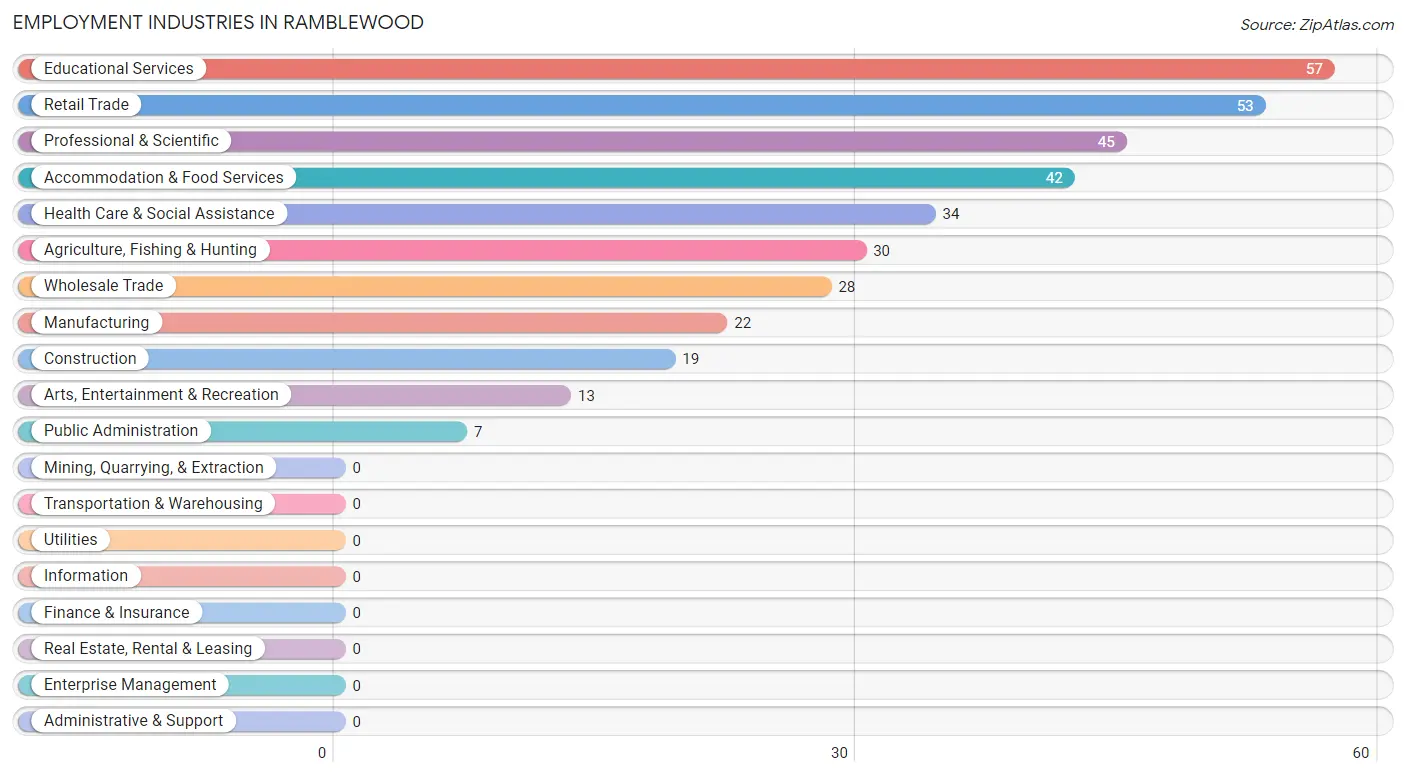
Employment Industries in Ramblewood
The major employment industries in Ramblewood include Educational Services (57 | 15.5%), Retail Trade (53 | 14.4%), Professional & Scientific (45 | 12.2%), Accommodation & Food Services (42 | 11.4%), and Health Care & Social Assistance (34 | 9.2%).
Employment Industries by Sex in Ramblewood
The Ramblewood industries that see more men than women are Agriculture, Fishing & Hunting (100.0%), Manufacturing (100.0%), and Arts, Entertainment & Recreation (100.0%), whereas the industries that tend to have a higher number of women are Construction (100.0%), Educational Services (100.0%), and Health Care & Social Assistance (100.0%).
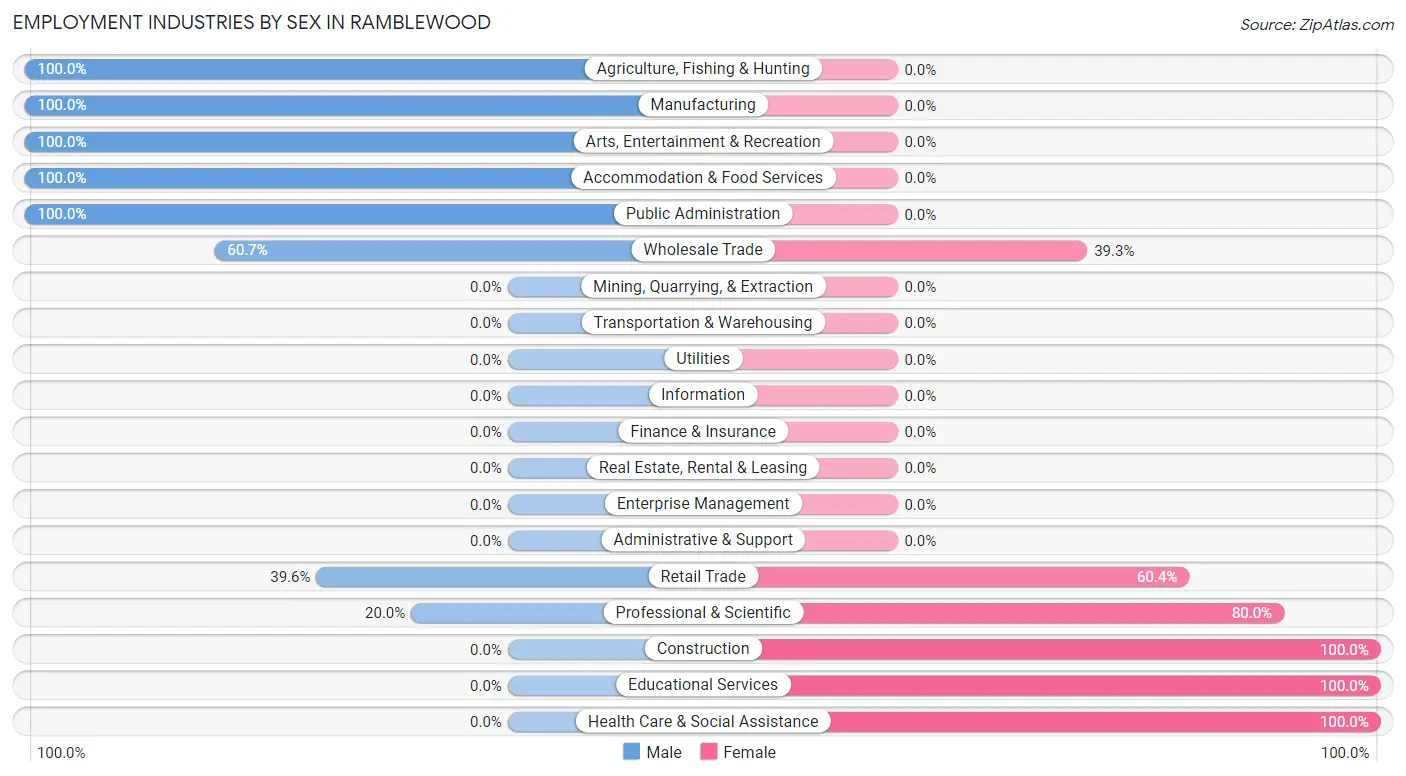
| Industry | Male | Female |
| Agriculture, Fishing & Hunting | 30 (100.0%) | 0 (0.0%) |
| Mining, Quarrying, & Extraction | 0 (0.0%) | 0 (0.0%) |
| Construction | 0 (0.0%) | 19 (100.0%) |
| Manufacturing | 22 (100.0%) | 0 (0.0%) |
| Wholesale Trade | 17 (60.7%) | 11 (39.3%) |
| Retail Trade | 21 (39.6%) | 32 (60.4%) |
| Transportation & Warehousing | 0 (0.0%) | 0 (0.0%) |
| Utilities | 0 (0.0%) | 0 (0.0%) |
| Information | 0 (0.0%) | 0 (0.0%) |
| Finance & Insurance | 0 (0.0%) | 0 (0.0%) |
| Real Estate, Rental & Leasing | 0 (0.0%) | 0 (0.0%) |
| Professional & Scientific | 9 (20.0%) | 36 (80.0%) |
| Enterprise Management | 0 (0.0%) | 0 (0.0%) |
| Administrative & Support | 0 (0.0%) | 0 (0.0%) |
| Educational Services | 0 (0.0%) | 57 (100.0%) |
| Health Care & Social Assistance | 0 (0.0%) | 34 (100.0%) |
| Arts, Entertainment & Recreation | 13 (100.0%) | 0 (0.0%) |
| Accommodation & Food Services | 42 (100.0%) | 0 (0.0%) |
| Public Administration | 7 (100.0%) | 0 (0.0%) |
| Total | 179 (48.6%) | 189 (51.4%) |
Education in Ramblewood
School Enrollment in Ramblewood
The most common levels of schooling among the 74 students in Ramblewood are high school (32 | 43.2%), college / undergraduate (29 | 39.2%), and middle school (13 | 17.6%).
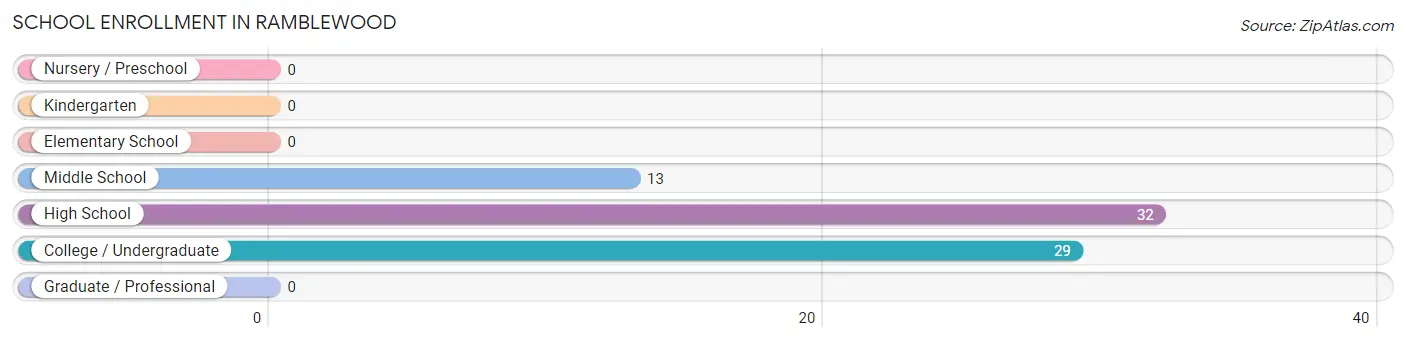
| School Level | # Students | % Students |
| Nursery / Preschool | 0 | 0.0% |
| Kindergarten | 0 | 0.0% |
| Elementary School | 0 | 0.0% |
| Middle School | 13 | 17.6% |
| High School | 32 | 43.2% |
| College / Undergraduate | 29 | 39.2% |
| Graduate / Professional | 0 | 0.0% |
| Total | 74 | 100.0% |
School Enrollment by Age by Funding Source in Ramblewood
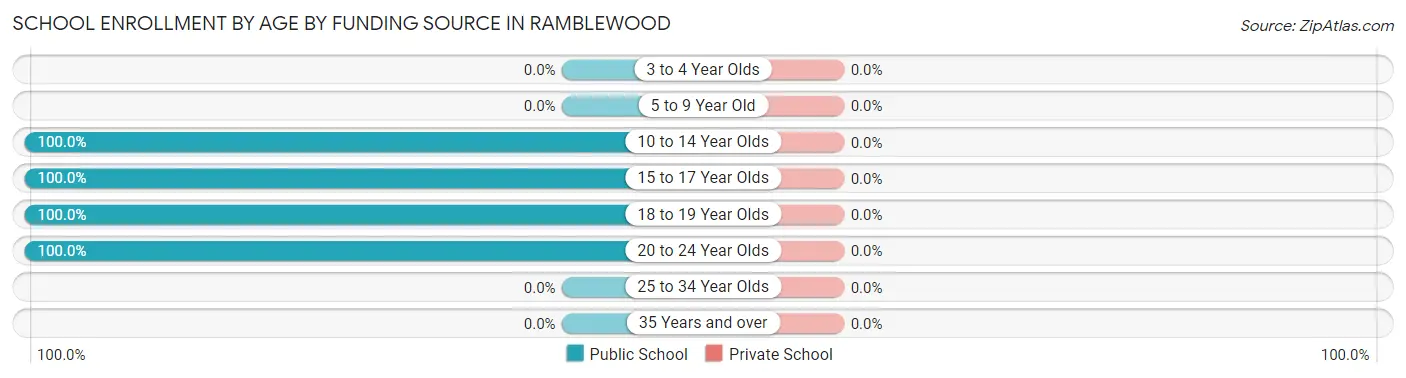
| Age Bracket | Public School | Private School |
| 3 to 4 Year Olds | 0 (0.0%) | 0 (0.0%) |
| 5 to 9 Year Old | 0 (0.0%) | 0 (0.0%) |
| 10 to 14 Year Olds | 13 (100.0%) | 0 (0.0%) |
| 15 to 17 Year Olds | 32 (100.0%) | 0 (0.0%) |
| 18 to 19 Year Olds | 4 (100.0%) | 0 (0.0%) |
| 20 to 24 Year Olds | 25 (100.0%) | 0 (0.0%) |
| 25 to 34 Year Olds | 0 (0.0%) | 0 (0.0%) |
| 35 Years and over | 0 (0.0%) | 0 (0.0%) |
| Total | 74 (100.0%) | 0 (0.0%) |
Educational Attainment by Field of Study in Ramblewood
Education (38 | 16.7%), psychology (33 | 14.5%), science & technology (31 | 13.6%), social sciences (29 | 12.7%), and literature & languages (24 | 10.5%) are the most common fields of study among 228 individuals in Ramblewood who have obtained a bachelor's degree or higher.
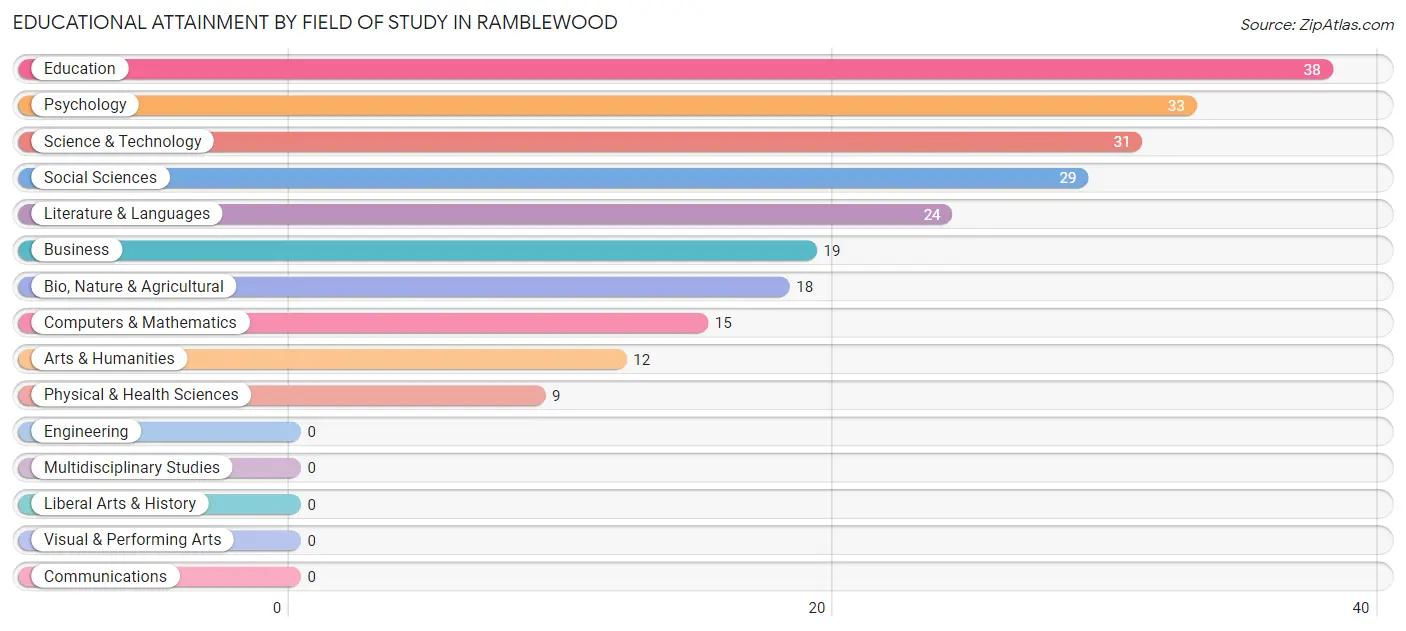
| Field of Study | # Graduates | % Graduates |
| Computers & Mathematics | 15 | 6.6% |
| Bio, Nature & Agricultural | 18 | 7.9% |
| Physical & Health Sciences | 9 | 4.0% |
| Psychology | 33 | 14.5% |
| Social Sciences | 29 | 12.7% |
| Engineering | 0 | 0.0% |
| Multidisciplinary Studies | 0 | 0.0% |
| Science & Technology | 31 | 13.6% |
| Business | 19 | 8.3% |
| Education | 38 | 16.7% |
| Literature & Languages | 24 | 10.5% |
| Liberal Arts & History | 0 | 0.0% |
| Visual & Performing Arts | 0 | 0.0% |
| Communications | 0 | 0.0% |
| Arts & Humanities | 12 | 5.3% |
| Total | 228 | 100.0% |
Transportation & Commute in Ramblewood
Vehicle Availability by Sex in Ramblewood
The most prevalent vehicle ownership categories in Ramblewood are males with 3 vehicles (94, accounting for 52.5%) and females with 3 vehicles (66, making up 58.8%).
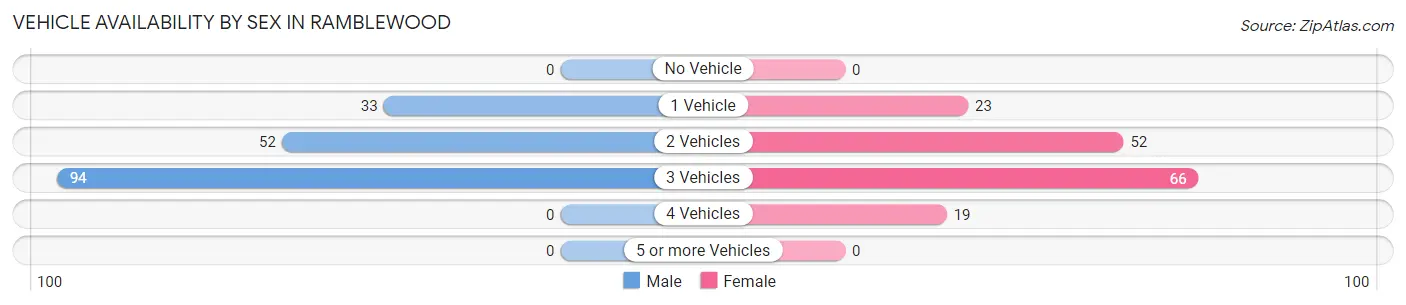
| Vehicles Available | Male | Female |
| No Vehicle | 0 (0.0%) | 0 (0.0%) |
| 1 Vehicle | 33 (18.4%) | 23 (14.4%) |
| 2 Vehicles | 52 (29.0%) | 52 (32.5%) |
| 3 Vehicles | 94 (52.5%) | 66 (41.2%) |
| 4 Vehicles | 0 (0.0%) | 19 (11.9%) |
| 5 or more Vehicles | 0 (0.0%) | 0 (0.0%) |
| Total | 179 (100.0%) | 160 (100.0%) |
Commute Time in Ramblewood
The most frequently occuring commute durations in Ramblewood are 10 to 14 minutes (109 commuters, 35.7%), 20 to 24 minutes (71 commuters, 23.3%), and 15 to 19 minutes (52 commuters, 17.1%).
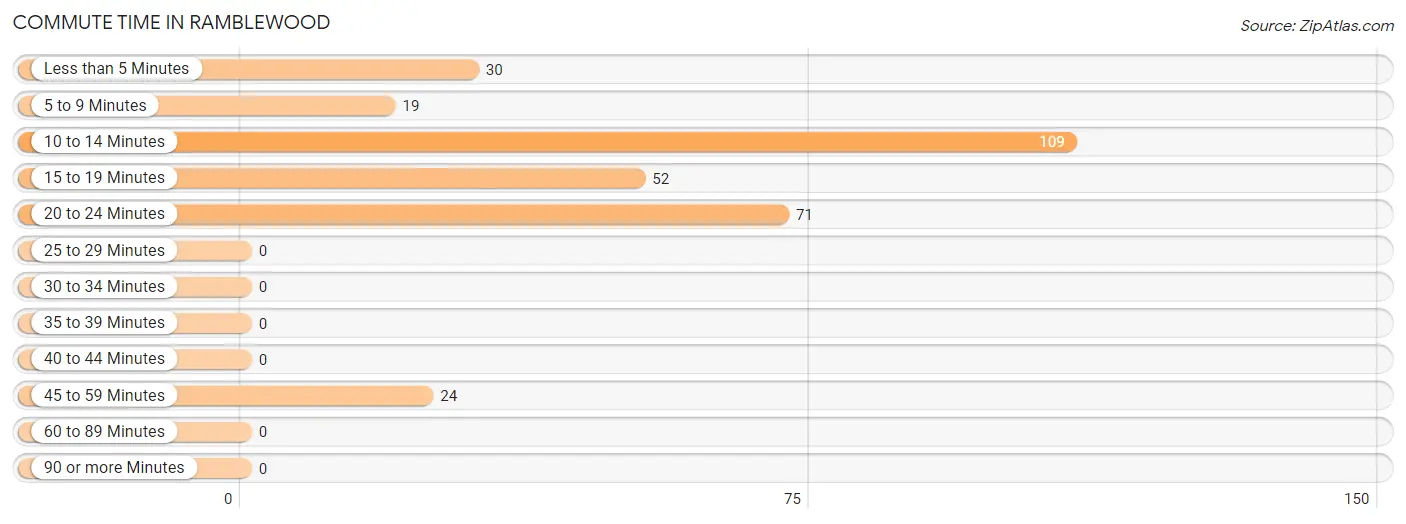
| Commute Time | # Commuters | % Commuters |
| Less than 5 Minutes | 30 | 9.8% |
| 5 to 9 Minutes | 19 | 6.2% |
| 10 to 14 Minutes | 109 | 35.7% |
| 15 to 19 Minutes | 52 | 17.1% |
| 20 to 24 Minutes | 71 | 23.3% |
| 25 to 29 Minutes | 0 | 0.0% |
| 30 to 34 Minutes | 0 | 0.0% |
| 35 to 39 Minutes | 0 | 0.0% |
| 40 to 44 Minutes | 0 | 0.0% |
| 45 to 59 Minutes | 24 | 7.9% |
| 60 to 89 Minutes | 0 | 0.0% |
| 90 or more Minutes | 0 | 0.0% |
Commute Time by Sex in Ramblewood
The most common commute times in Ramblewood are 10 to 14 minutes (57 commuters, 37.5%) for males and 20 to 24 minutes (58 commuters, 37.9%) for females.
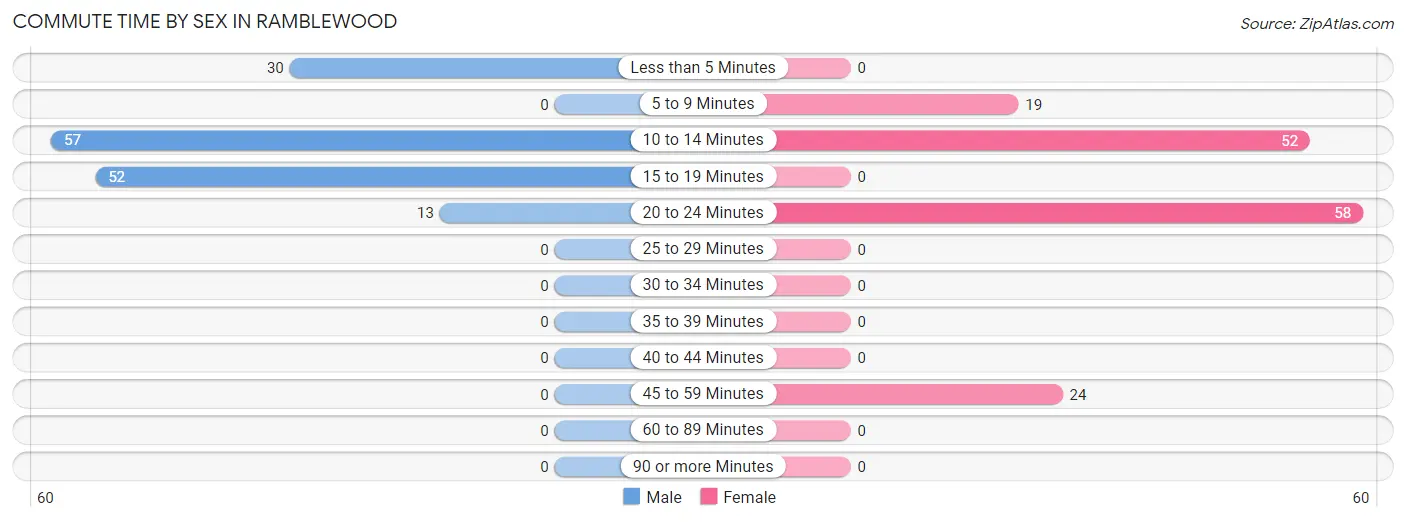
| Commute Time | Male | Female |
| Less than 5 Minutes | 30 (19.7%) | 0 (0.0%) |
| 5 to 9 Minutes | 0 (0.0%) | 19 (12.4%) |
| 10 to 14 Minutes | 57 (37.5%) | 52 (34.0%) |
| 15 to 19 Minutes | 52 (34.2%) | 0 (0.0%) |
| 20 to 24 Minutes | 13 (8.6%) | 58 (37.9%) |
| 25 to 29 Minutes | 0 (0.0%) | 0 (0.0%) |
| 30 to 34 Minutes | 0 (0.0%) | 0 (0.0%) |
| 35 to 39 Minutes | 0 (0.0%) | 0 (0.0%) |
| 40 to 44 Minutes | 0 (0.0%) | 0 (0.0%) |
| 45 to 59 Minutes | 0 (0.0%) | 24 (15.7%) |
| 60 to 89 Minutes | 0 (0.0%) | 0 (0.0%) |
| 90 or more Minutes | 0 (0.0%) | 0 (0.0%) |
Time of Departure to Work by Sex in Ramblewood
The most frequent times of departure to work in Ramblewood are 4:00 PM to 11:59 PM (42, 27.6%) for males and 7:30 AM to 7:59 AM (32, 20.9%) for females.
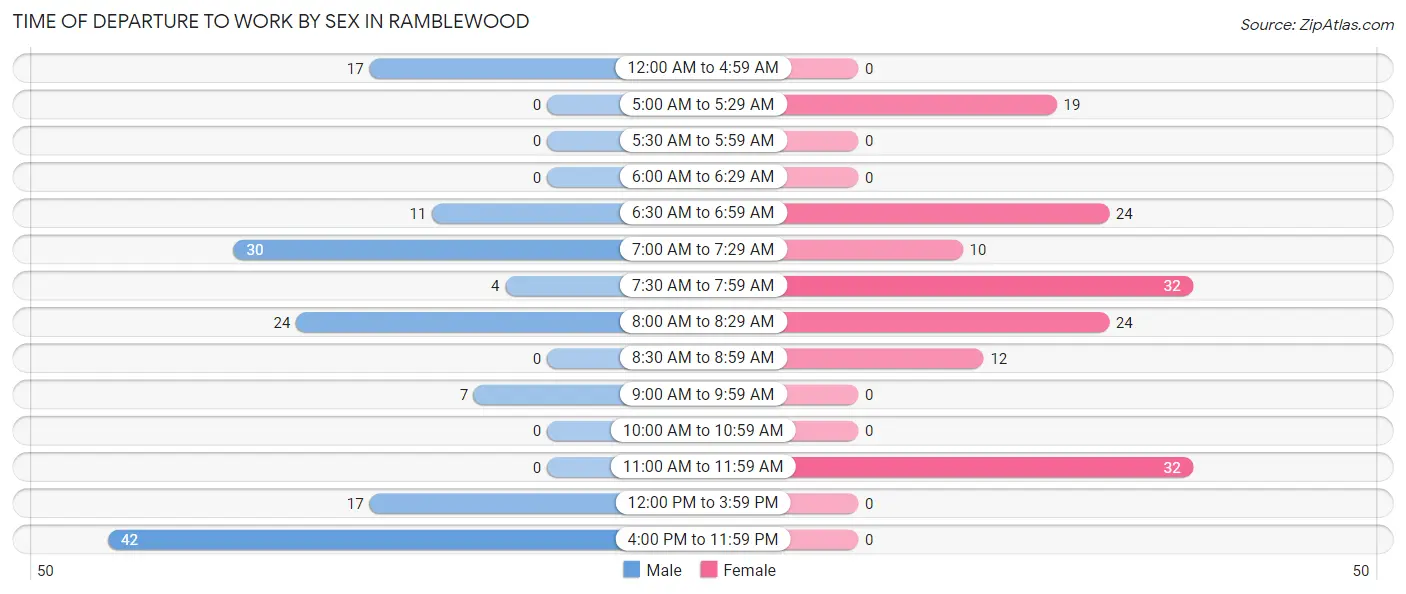
| Time of Departure | Male | Female |
| 12:00 AM to 4:59 AM | 17 (11.2%) | 0 (0.0%) |
| 5:00 AM to 5:29 AM | 0 (0.0%) | 19 (12.4%) |
| 5:30 AM to 5:59 AM | 0 (0.0%) | 0 (0.0%) |
| 6:00 AM to 6:29 AM | 0 (0.0%) | 0 (0.0%) |
| 6:30 AM to 6:59 AM | 11 (7.2%) | 24 (15.7%) |
| 7:00 AM to 7:29 AM | 30 (19.7%) | 10 (6.5%) |
| 7:30 AM to 7:59 AM | 4 (2.6%) | 32 (20.9%) |
| 8:00 AM to 8:29 AM | 24 (15.8%) | 24 (15.7%) |
| 8:30 AM to 8:59 AM | 0 (0.0%) | 12 (7.8%) |
| 9:00 AM to 9:59 AM | 7 (4.6%) | 0 (0.0%) |
| 10:00 AM to 10:59 AM | 0 (0.0%) | 0 (0.0%) |
| 11:00 AM to 11:59 AM | 0 (0.0%) | 32 (20.9%) |
| 12:00 PM to 3:59 PM | 17 (11.2%) | 0 (0.0%) |
| 4:00 PM to 11:59 PM | 42 (27.6%) | 0 (0.0%) |
| Total | 152 (100.0%) | 153 (100.0%) |
Housing Occupancy in Ramblewood
Occupancy by Ownership in Ramblewood
Of the total 282 dwellings in Ramblewood, owner-occupied units account for 227 (80.5%), while renter-occupied units make up 55 (19.5%).
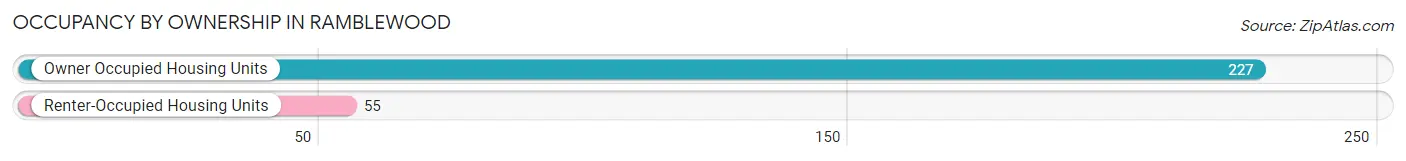
| Occupancy | # Housing Units | % Housing Units |
| Owner Occupied Housing Units | 227 | 80.5% |
| Renter-Occupied Housing Units | 55 | 19.5% |
| Total Occupied Housing Units | 282 | 100.0% |
Occupancy by Household Size in Ramblewood
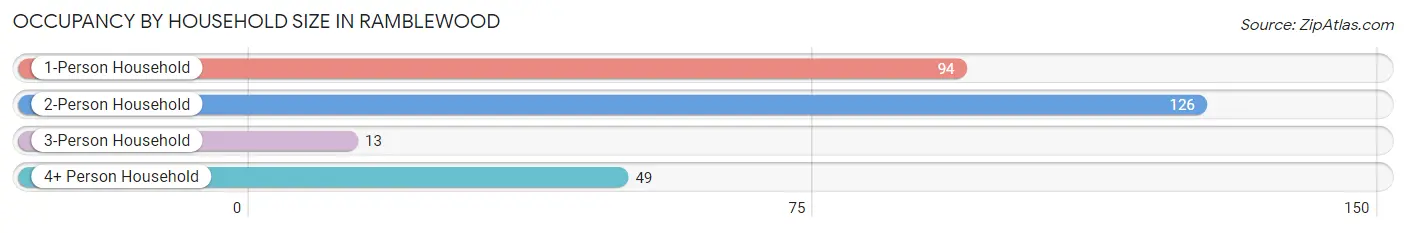
| Household Size | # Housing Units | % Housing Units |
| 1-Person Household | 94 | 33.3% |
| 2-Person Household | 126 | 44.7% |
| 3-Person Household | 13 | 4.6% |
| 4+ Person Household | 49 | 17.4% |
| Total Housing Units | 282 | 100.0% |
Occupancy by Ownership by Household Size in Ramblewood
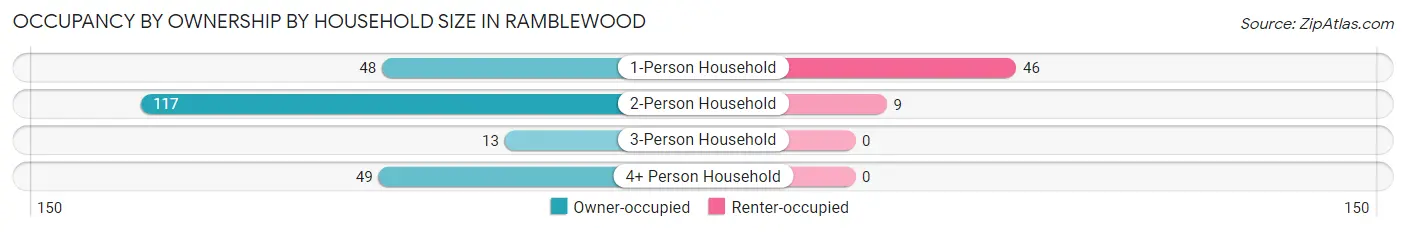
| Household Size | Owner-occupied | Renter-occupied |
| 1-Person Household | 48 (51.1%) | 46 (48.9%) |
| 2-Person Household | 117 (92.9%) | 9 (7.1%) |
| 3-Person Household | 13 (100.0%) | 0 (0.0%) |
| 4+ Person Household | 49 (100.0%) | 0 (0.0%) |
| Total Housing Units | 227 (80.5%) | 55 (19.5%) |
Occupancy by Educational Attainment in Ramblewood
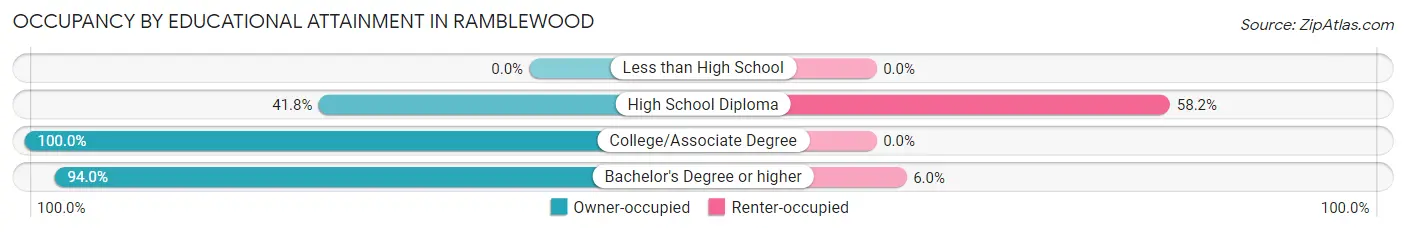
| Household Size | Owner-occupied | Renter-occupied |
| Less than High School | 0 (0.0%) | 0 (0.0%) |
| High School Diploma | 33 (41.8%) | 46 (58.2%) |
| College/Associate Degree | 52 (100.0%) | 0 (0.0%) |
| Bachelor's Degree or higher | 142 (94.0%) | 9 (6.0%) |
Occupancy by Age of Householder in Ramblewood
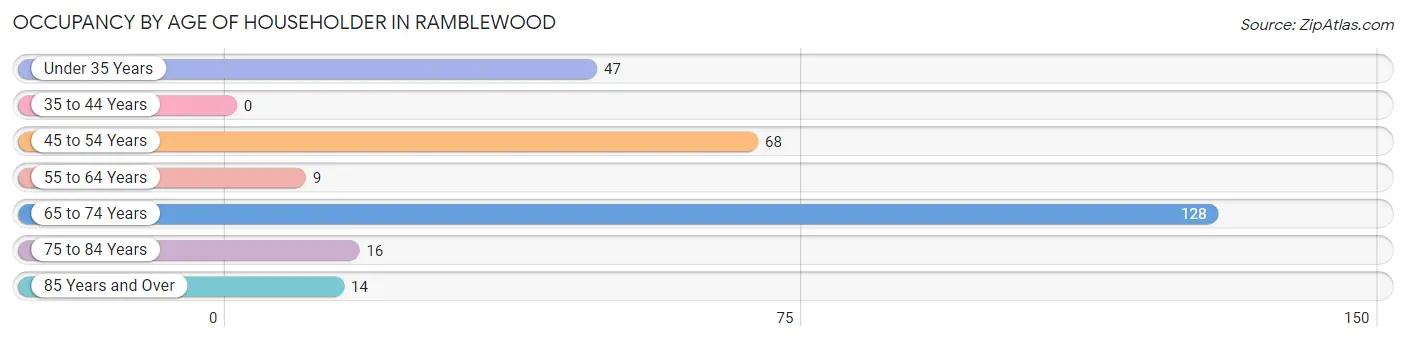
| Age Bracket | # Households | % Households |
| Under 35 Years | 47 | 16.7% |
| 35 to 44 Years | 0 | 0.0% |
| 45 to 54 Years | 68 | 24.1% |
| 55 to 64 Years | 9 | 3.2% |
| 65 to 74 Years | 128 | 45.4% |
| 75 to 84 Years | 16 | 5.7% |
| 85 Years and Over | 14 | 5.0% |
| Total | 282 | 100.0% |
Housing Finances in Ramblewood
Median Income by Occupancy in Ramblewood
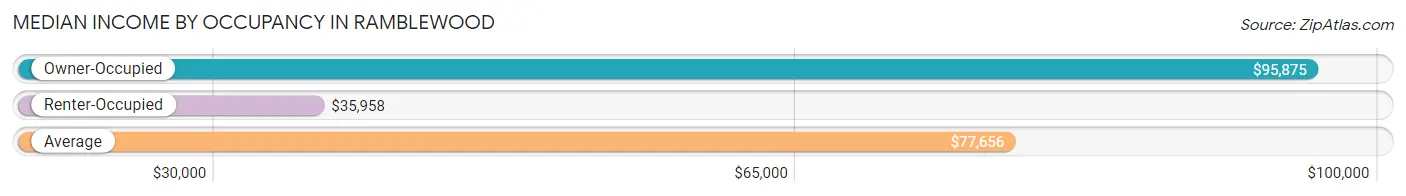
| Occupancy Type | # Households | Median Income |
| Owner-Occupied | 227 (80.5%) | $95,875 |
| Renter-Occupied | 55 (19.5%) | $35,958 |
| Average | 282 (100.0%) | $77,656 |
Occupancy by Householder Income Bracket in Ramblewood
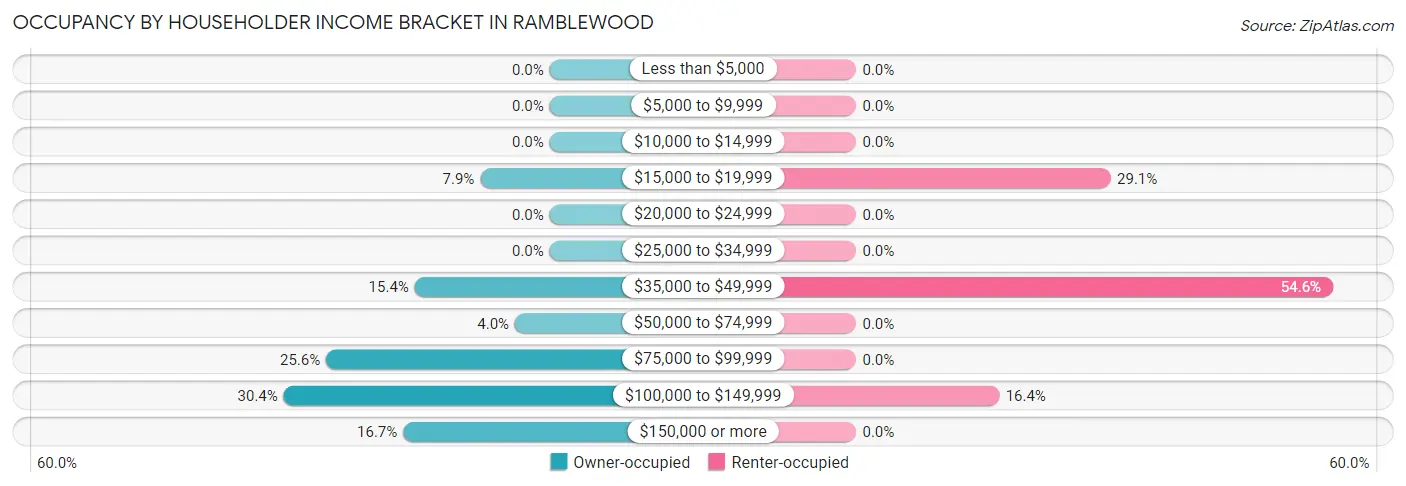
| Income Bracket | Owner-occupied | Renter-occupied |
| Less than $5,000 | 0 (0.0%) | 0 (0.0%) |
| $5,000 to $9,999 | 0 (0.0%) | 0 (0.0%) |
| $10,000 to $14,999 | 0 (0.0%) | 0 (0.0%) |
| $15,000 to $19,999 | 18 (7.9%) | 16 (29.1%) |
| $20,000 to $24,999 | 0 (0.0%) | 0 (0.0%) |
| $25,000 to $34,999 | 0 (0.0%) | 0 (0.0%) |
| $35,000 to $49,999 | 35 (15.4%) | 30 (54.5%) |
| $50,000 to $74,999 | 9 (4.0%) | 0 (0.0%) |
| $75,000 to $99,999 | 58 (25.6%) | 0 (0.0%) |
| $100,000 to $149,999 | 69 (30.4%) | 9 (16.4%) |
| $150,000 or more | 38 (16.7%) | 0 (0.0%) |
| Total | 227 (100.0%) | 55 (100.0%) |
Monthly Housing Cost Tiers in Ramblewood
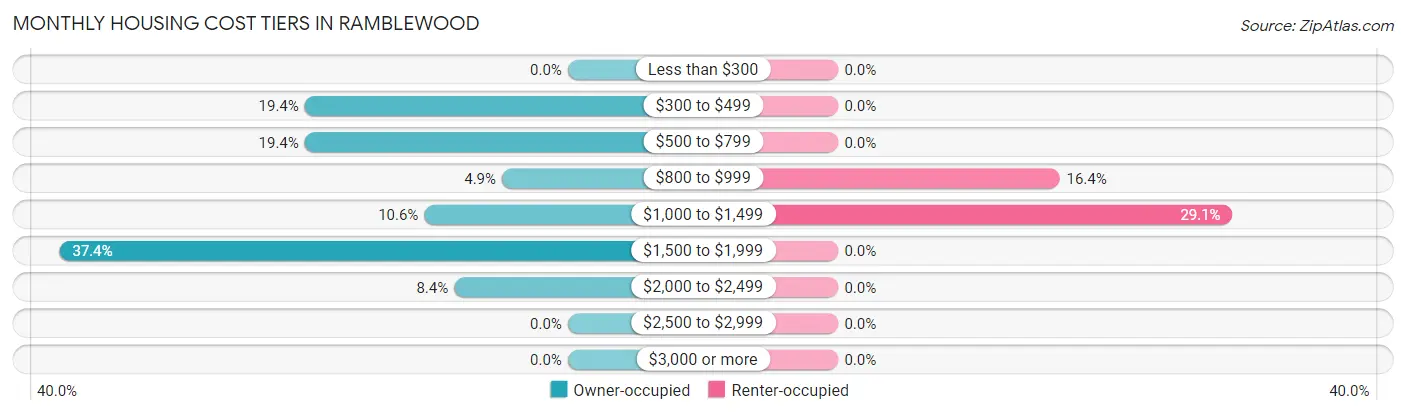
| Monthly Cost | Owner-occupied | Renter-occupied |
| Less than $300 | 0 (0.0%) | 0 (0.0%) |
| $300 to $499 | 44 (19.4%) | 0 (0.0%) |
| $500 to $799 | 44 (19.4%) | 0 (0.0%) |
| $800 to $999 | 11 (4.9%) | 9 (16.4%) |
| $1,000 to $1,499 | 24 (10.6%) | 16 (29.1%) |
| $1,500 to $1,999 | 85 (37.4%) | 0 (0.0%) |
| $2,000 to $2,499 | 19 (8.4%) | 0 (0.0%) |
| $2,500 to $2,999 | 0 (0.0%) | 0 (0.0%) |
| $3,000 or more | 0 (0.0%) | 0 (0.0%) |
| Total | 227 (100.0%) | 55 (100.0%) |
Physical Housing Characteristics in Ramblewood
Housing Structures in Ramblewood
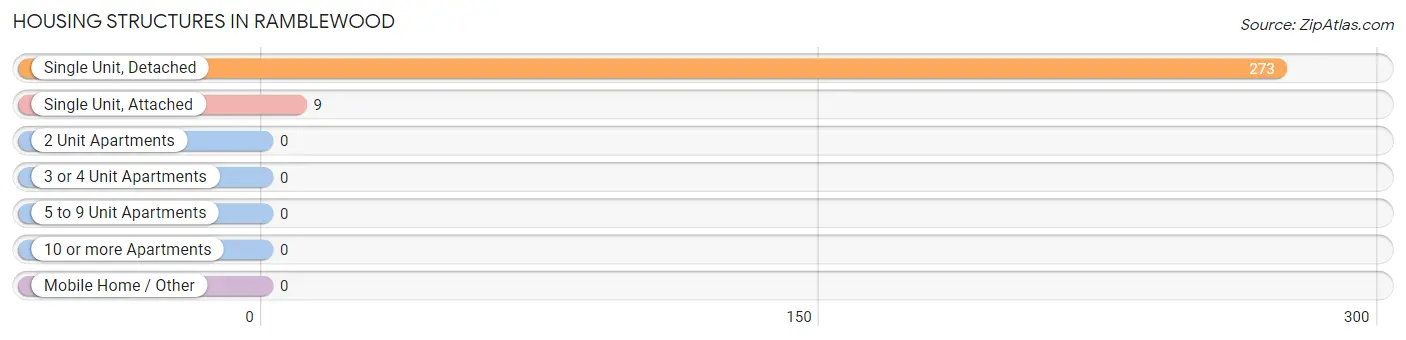
| Structure Type | # Housing Units | % Housing Units |
| Single Unit, Detached | 273 | 96.8% |
| Single Unit, Attached | 9 | 3.2% |
| 2 Unit Apartments | 0 | 0.0% |
| 3 or 4 Unit Apartments | 0 | 0.0% |
| 5 to 9 Unit Apartments | 0 | 0.0% |
| 10 or more Apartments | 0 | 0.0% |
| Mobile Home / Other | 0 | 0.0% |
| Total | 282 | 100.0% |
Housing Structures by Occupancy in Ramblewood
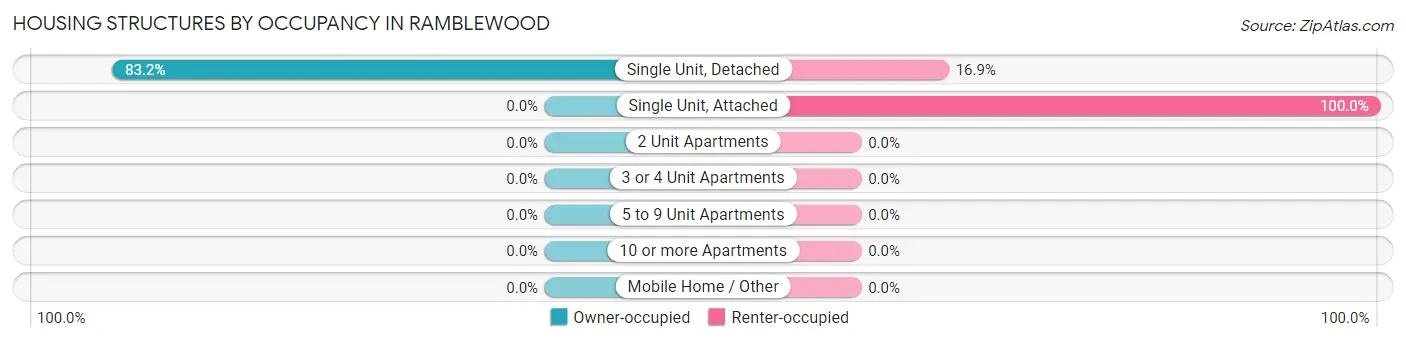
| Structure Type | Owner-occupied | Renter-occupied |
| Single Unit, Detached | 227 (83.2%) | 46 (16.9%) |
| Single Unit, Attached | 0 (0.0%) | 9 (100.0%) |
| 2 Unit Apartments | 0 (0.0%) | 0 (0.0%) |
| 3 or 4 Unit Apartments | 0 (0.0%) | 0 (0.0%) |
| 5 to 9 Unit Apartments | 0 (0.0%) | 0 (0.0%) |
| 10 or more Apartments | 0 (0.0%) | 0 (0.0%) |
| Mobile Home / Other | 0 (0.0%) | 0 (0.0%) |
| Total | 227 (80.5%) | 55 (19.5%) |
Housing Structures by Number of Rooms in Ramblewood
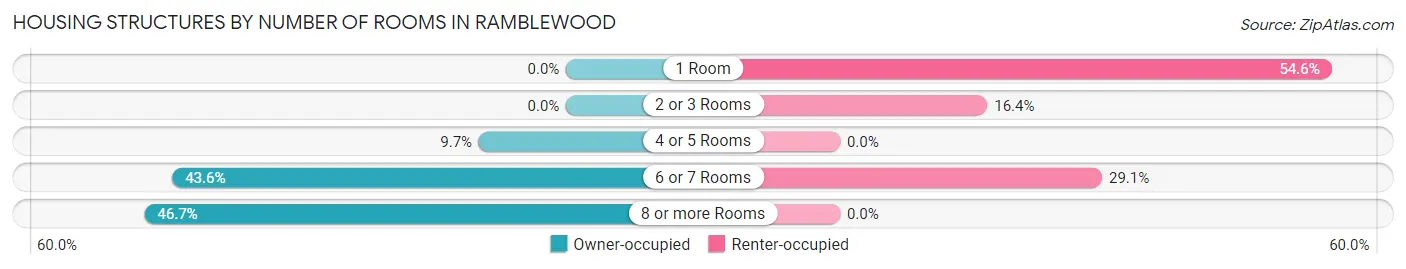
| Number of Rooms | Owner-occupied | Renter-occupied |
| 1 Room | 0 (0.0%) | 30 (54.5%) |
| 2 or 3 Rooms | 0 (0.0%) | 9 (16.4%) |
| 4 or 5 Rooms | 22 (9.7%) | 0 (0.0%) |
| 6 or 7 Rooms | 99 (43.6%) | 16 (29.1%) |
| 8 or more Rooms | 106 (46.7%) | 0 (0.0%) |
| Total | 227 (100.0%) | 55 (100.0%) |
Housing Structure by Heating Type in Ramblewood
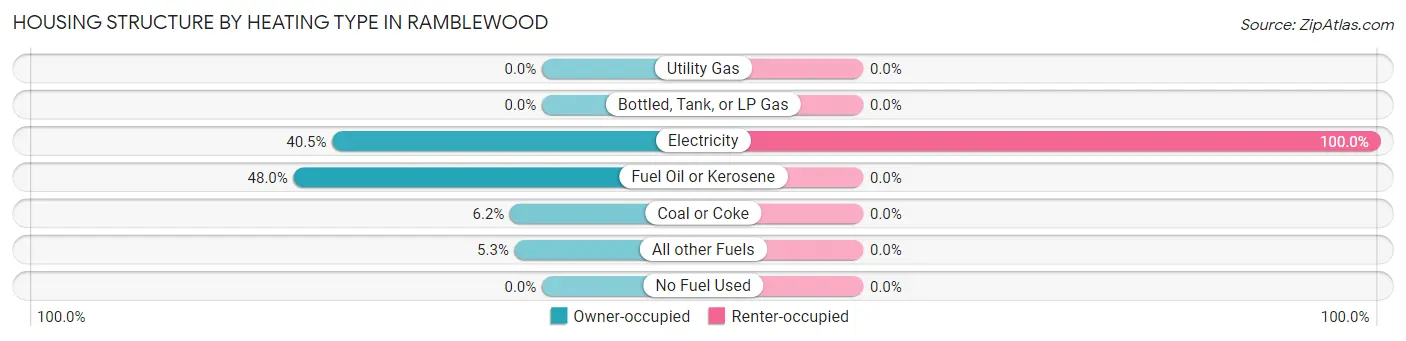
| Heating Type | Owner-occupied | Renter-occupied |
| Utility Gas | 0 (0.0%) | 0 (0.0%) |
| Bottled, Tank, or LP Gas | 0 (0.0%) | 0 (0.0%) |
| Electricity | 92 (40.5%) | 55 (100.0%) |
| Fuel Oil or Kerosene | 109 (48.0%) | 0 (0.0%) |
| Coal or Coke | 14 (6.2%) | 0 (0.0%) |
| All other Fuels | 12 (5.3%) | 0 (0.0%) |
| No Fuel Used | 0 (0.0%) | 0 (0.0%) |
| Total | 227 (100.0%) | 55 (100.0%) |
Household Vehicle Usage in Ramblewood
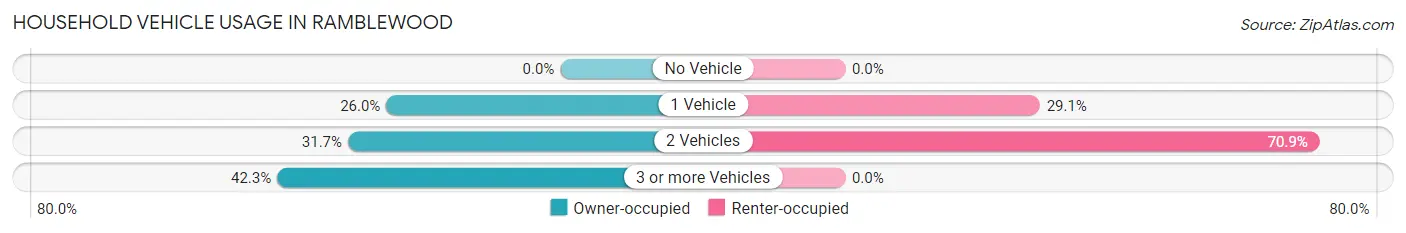
| Vehicles per Household | Owner-occupied | Renter-occupied |
| No Vehicle | 0 (0.0%) | 0 (0.0%) |
| 1 Vehicle | 59 (26.0%) | 16 (29.1%) |
| 2 Vehicles | 72 (31.7%) | 39 (70.9%) |
| 3 or more Vehicles | 96 (42.3%) | 0 (0.0%) |
| Total | 227 (100.0%) | 55 (100.0%) |
Real Estate & Mortgages in Ramblewood
Real Estate and Mortgage Overview in Ramblewood
| Characteristic | Without Mortgage | With Mortgage |
| Housing Units | 111 | 116 |
| Median Property Value | $287,000 | $232,700 |
| Median Household Income | $78,359 | $24 |
| Monthly Housing Costs | $626 | $0 |
| Real Estate Taxes | $3,261 | $0 |
Property Value by Mortgage Status in Ramblewood
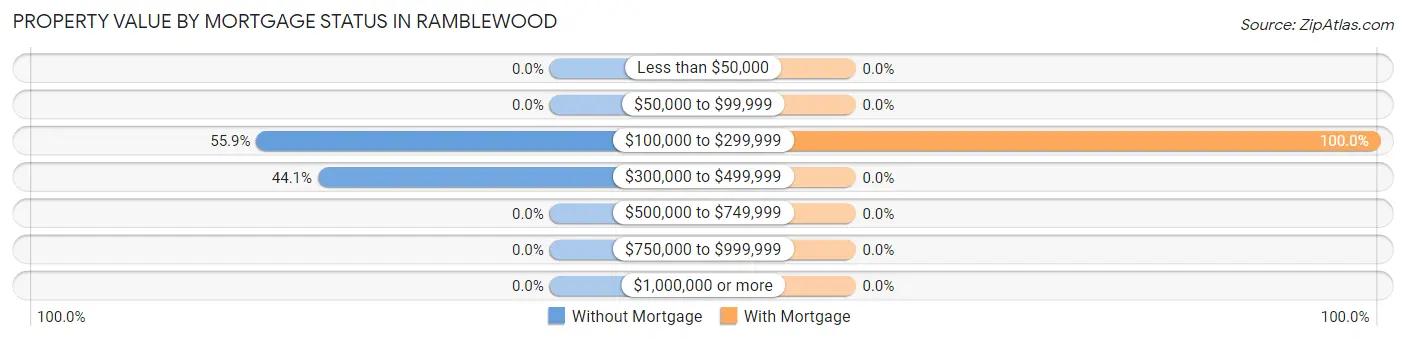
| Property Value | Without Mortgage | With Mortgage |
| Less than $50,000 | 0 (0.0%) | 0 (0.0%) |
| $50,000 to $99,999 | 0 (0.0%) | 0 (0.0%) |
| $100,000 to $299,999 | 62 (55.9%) | 116 (100.0%) |
| $300,000 to $499,999 | 49 (44.1%) | 0 (0.0%) |
| $500,000 to $749,999 | 0 (0.0%) | 0 (0.0%) |
| $750,000 to $999,999 | 0 (0.0%) | 0 (0.0%) |
| $1,000,000 or more | 0 (0.0%) | 0 (0.0%) |
| Total | 111 (100.0%) | 116 (100.0%) |
Household Income by Mortgage Status in Ramblewood
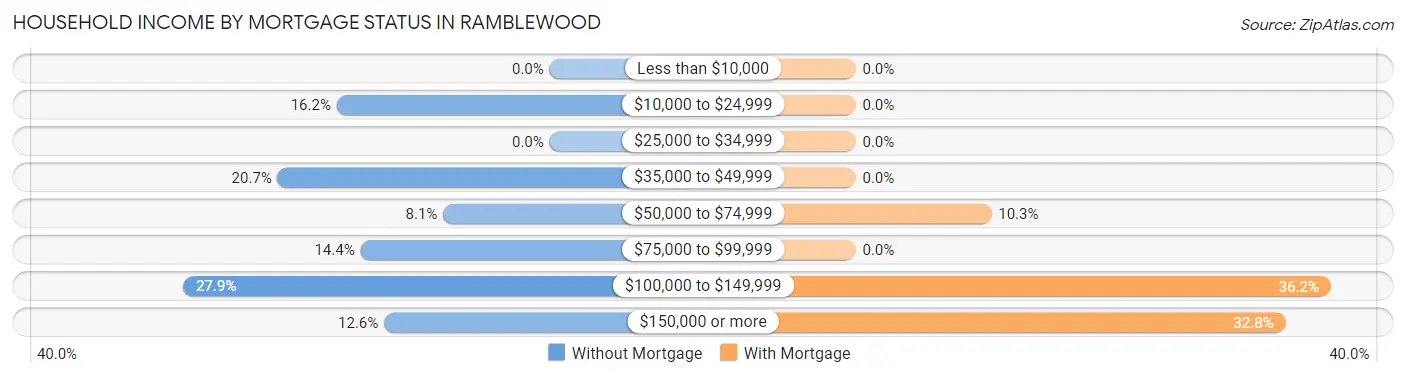
| Household Income | Without Mortgage | With Mortgage |
| Less than $10,000 | 0 (0.0%) | 0 (0.0%) |
| $10,000 to $24,999 | 18 (16.2%) | 0 (0.0%) |
| $25,000 to $34,999 | 0 (0.0%) | 0 (0.0%) |
| $35,000 to $49,999 | 23 (20.7%) | 0 (0.0%) |
| $50,000 to $74,999 | 9 (8.1%) | 12 (10.3%) |
| $75,000 to $99,999 | 16 (14.4%) | 0 (0.0%) |
| $100,000 to $149,999 | 31 (27.9%) | 42 (36.2%) |
| $150,000 or more | 14 (12.6%) | 38 (32.8%) |
| Total | 111 (100.0%) | 116 (100.0%) |
Property Value to Household Income Ratio in Ramblewood
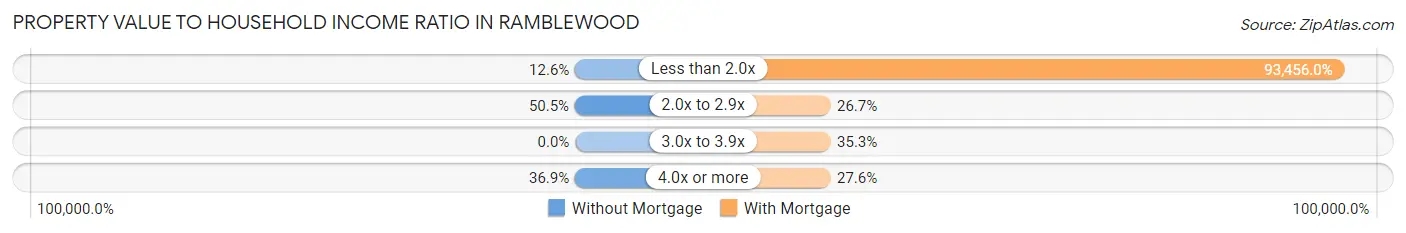
| Value-to-Income Ratio | Without Mortgage | With Mortgage |
| Less than 2.0x | 14 (12.6%) | 108,409 (93,456.0%) |
| 2.0x to 2.9x | 56 (50.4%) | 31 (26.7%) |
| 3.0x to 3.9x | 0 (0.0%) | 41 (35.3%) |
| 4.0x or more | 41 (36.9%) | 32 (27.6%) |
| Total | 111 (100.0%) | 116 (100.0%) |
Real Estate Taxes by Mortgage Status in Ramblewood
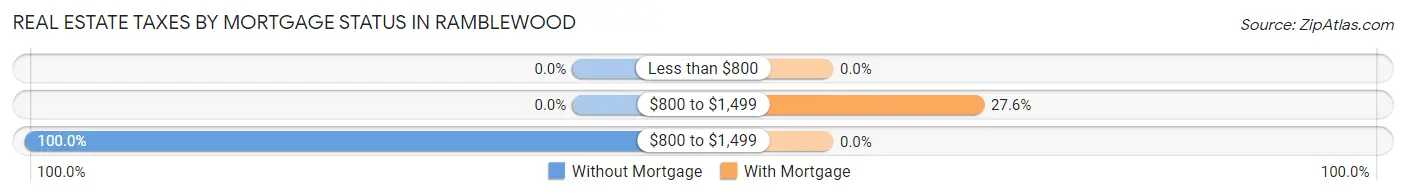
| Property Taxes | Without Mortgage | With Mortgage |
| Less than $800 | 0 (0.0%) | 0 (0.0%) |
| $800 to $1,499 | 0 (0.0%) | 32 (27.6%) |
| $800 to $1,499 | 111 (100.0%) | 0 (0.0%) |
| Total | 111 (100.0%) | 116 (100.0%) |
Health & Disability in Ramblewood
Health Insurance Coverage by Age in Ramblewood
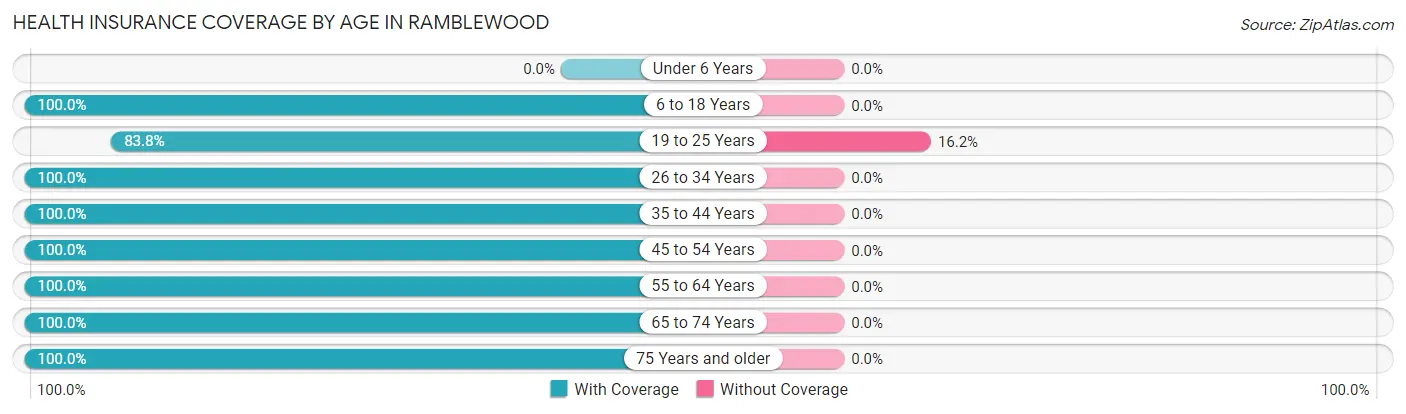
| Age Bracket | With Coverage | Without Coverage |
| Under 6 Years | 0 (0.0%) | 0 (0.0%) |
| 6 to 18 Years | 45 (100.0%) | 0 (0.0%) |
| 19 to 25 Years | 83 (83.8%) | 16 (16.2%) |
| 26 to 34 Years | 61 (100.0%) | 0 (0.0%) |
| 35 to 44 Years | 18 (100.0%) | 0 (0.0%) |
| 45 to 54 Years | 68 (100.0%) | 0 (0.0%) |
| 55 to 64 Years | 79 (100.0%) | 0 (0.0%) |
| 65 to 74 Years | 178 (100.0%) | 0 (0.0%) |
| 75 Years and older | 59 (100.0%) | 0 (0.0%) |
| Total | 591 (97.4%) | 16 (2.6%) |
Health Insurance Coverage by Citizenship Status in Ramblewood
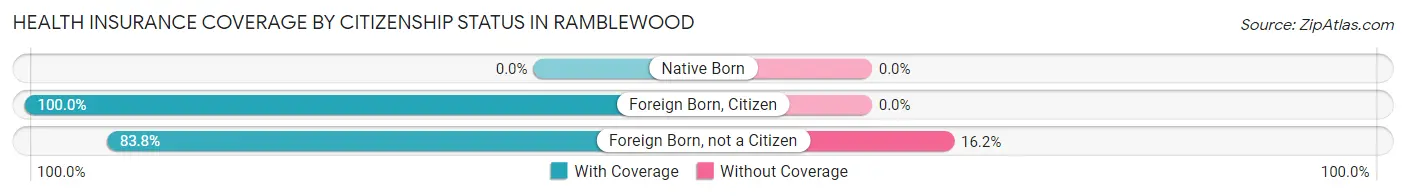
| Citizenship Status | With Coverage | Without Coverage |
| Native Born | 0 (0.0%) | 0 (0.0%) |
| Foreign Born, Citizen | 45 (100.0%) | 0 (0.0%) |
| Foreign Born, not a Citizen | 83 (83.8%) | 16 (16.2%) |
Health Insurance Coverage by Household Income in Ramblewood
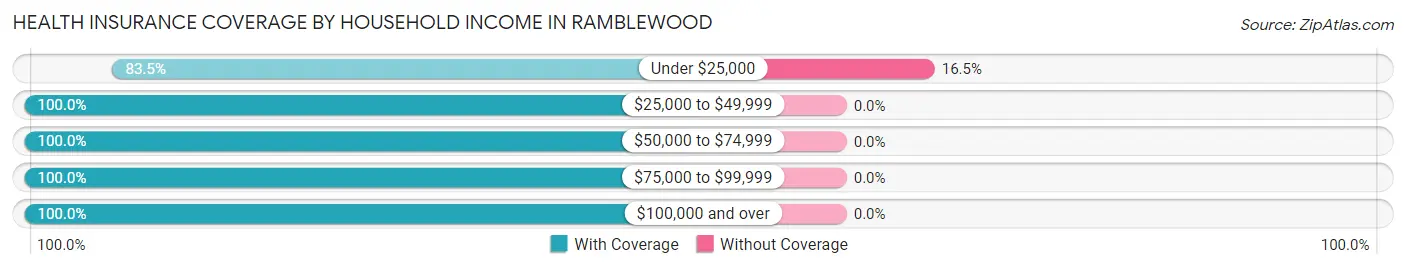
| Household Income | With Coverage | Without Coverage |
| Under $25,000 | 81 (83.5%) | 16 (16.5%) |
| $25,000 to $49,999 | 95 (100.0%) | 0 (0.0%) |
| $50,000 to $74,999 | 17 (100.0%) | 0 (0.0%) |
| $75,000 to $99,999 | 110 (100.0%) | 0 (0.0%) |
| $100,000 and over | 288 (100.0%) | 0 (0.0%) |
Public vs Private Health Insurance Coverage by Age in Ramblewood
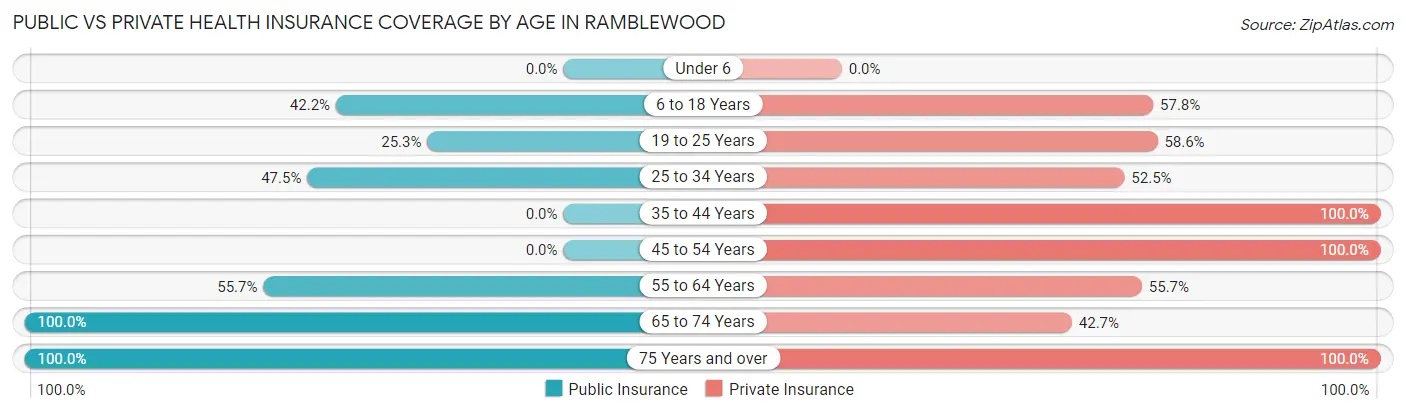
| Age Bracket | Public Insurance | Private Insurance |
| Under 6 | 0 (0.0%) | 0 (0.0%) |
| 6 to 18 Years | 19 (42.2%) | 26 (57.8%) |
| 19 to 25 Years | 25 (25.3%) | 58 (58.6%) |
| 25 to 34 Years | 29 (47.5%) | 32 (52.5%) |
| 35 to 44 Years | 0 (0.0%) | 18 (100.0%) |
| 45 to 54 Years | 0 (0.0%) | 68 (100.0%) |
| 55 to 64 Years | 44 (55.7%) | 44 (55.7%) |
| 65 to 74 Years | 178 (100.0%) | 76 (42.7%) |
| 75 Years and over | 59 (100.0%) | 59 (100.0%) |
| Total | 354 (58.3%) | 381 (62.8%) |
Disability Status by Sex by Age in Ramblewood
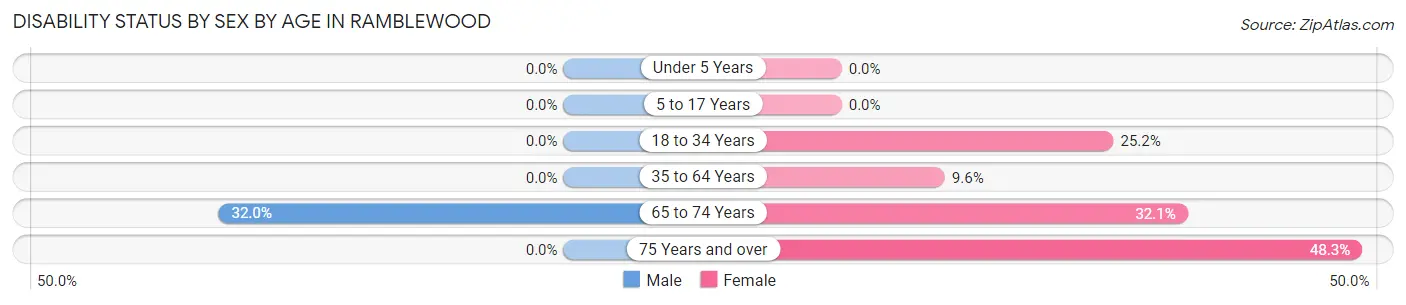
| Age Bracket | Male | Female |
| Under 5 Years | 0 (0.0%) | 0 (0.0%) |
| 5 to 17 Years | 0 (0.0%) | 0 (0.0%) |
| 18 to 34 Years | 0 (0.0%) | 29 (25.2%) |
| 35 to 64 Years | 0 (0.0%) | 9 (9.6%) |
| 65 to 74 Years | 40 (32.0%) | 17 (32.1%) |
| 75 Years and over | 0 (0.0%) | 14 (48.3%) |
Disability Class by Sex by Age in Ramblewood
Disability Class: Hearing Difficulty
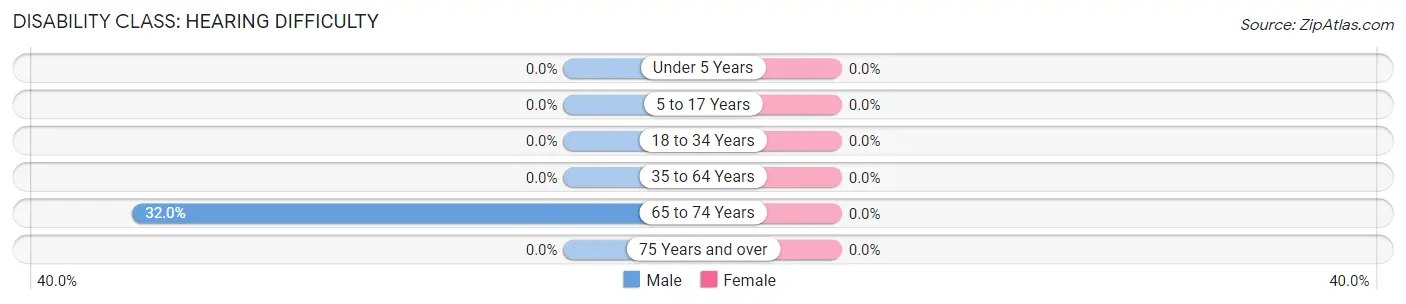
| Age Bracket | Male | Female |
| Under 5 Years | 0 (0.0%) | 0 (0.0%) |
| 5 to 17 Years | 0 (0.0%) | 0 (0.0%) |
| 18 to 34 Years | 0 (0.0%) | 0 (0.0%) |
| 35 to 64 Years | 0 (0.0%) | 0 (0.0%) |
| 65 to 74 Years | 40 (32.0%) | 0 (0.0%) |
| 75 Years and over | 0 (0.0%) | 0 (0.0%) |
Disability Class: Vision Difficulty
| Age Bracket | Male | Female |
| Under 5 Years | 0 (0.0%) | 0 (0.0%) |
| 5 to 17 Years | 0 (0.0%) | 0 (0.0%) |
| 18 to 34 Years | 0 (0.0%) | 0 (0.0%) |
| 35 to 64 Years | 0 (0.0%) | 0 (0.0%) |
| 65 to 74 Years | 0 (0.0%) | 0 (0.0%) |
| 75 Years and over | 0 (0.0%) | 0 (0.0%) |
Disability Class: Cognitive Difficulty
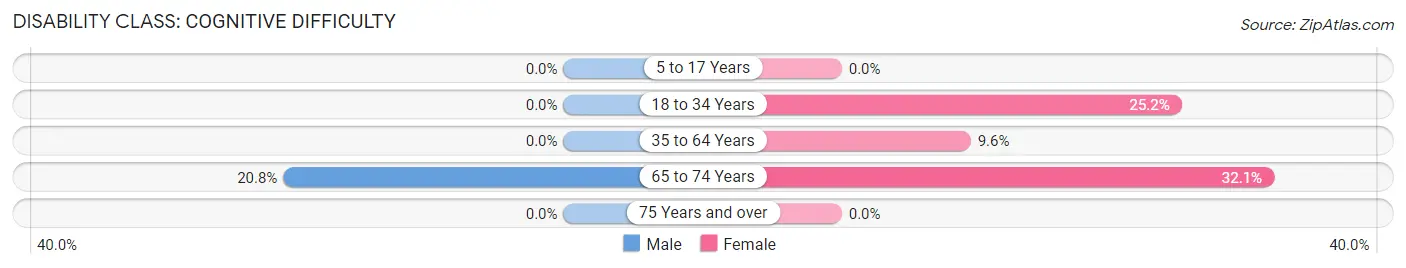
| Age Bracket | Male | Female |
| 5 to 17 Years | 0 (0.0%) | 0 (0.0%) |
| 18 to 34 Years | 0 (0.0%) | 29 (25.2%) |
| 35 to 64 Years | 0 (0.0%) | 9 (9.6%) |
| 65 to 74 Years | 26 (20.8%) | 17 (32.1%) |
| 75 Years and over | 0 (0.0%) | 0 (0.0%) |
Disability Class: Ambulatory Difficulty
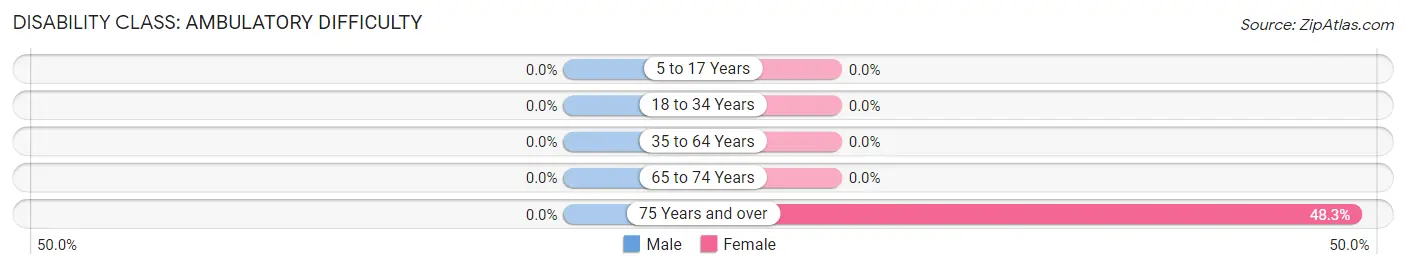
| Age Bracket | Male | Female |
| 5 to 17 Years | 0 (0.0%) | 0 (0.0%) |
| 18 to 34 Years | 0 (0.0%) | 0 (0.0%) |
| 35 to 64 Years | 0 (0.0%) | 0 (0.0%) |
| 65 to 74 Years | 0 (0.0%) | 0 (0.0%) |
| 75 Years and over | 0 (0.0%) | 14 (48.3%) |
Disability Class: Self-Care Difficulty
| Age Bracket | Male | Female |
| 5 to 17 Years | 0 (0.0%) | 0 (0.0%) |
| 18 to 34 Years | 0 (0.0%) | 0 (0.0%) |
| 35 to 64 Years | 0 (0.0%) | 0 (0.0%) |
| 65 to 74 Years | 0 (0.0%) | 0 (0.0%) |
| 75 Years and over | 0 (0.0%) | 0 (0.0%) |
Technology Access in Ramblewood
Computing Device Access in Ramblewood
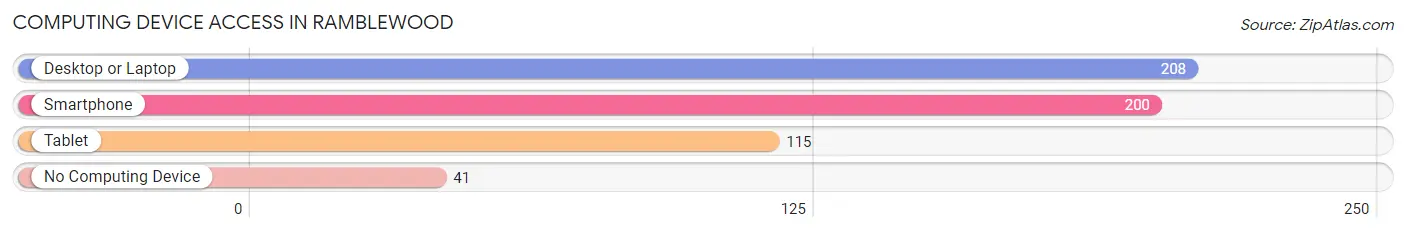
| Device Type | # Households | % Households |
| Desktop or Laptop | 208 | 73.8% |
| Smartphone | 200 | 70.9% |
| Tablet | 115 | 40.8% |
| No Computing Device | 41 | 14.5% |
| Total | 282 | 100.0% |
Internet Access in Ramblewood
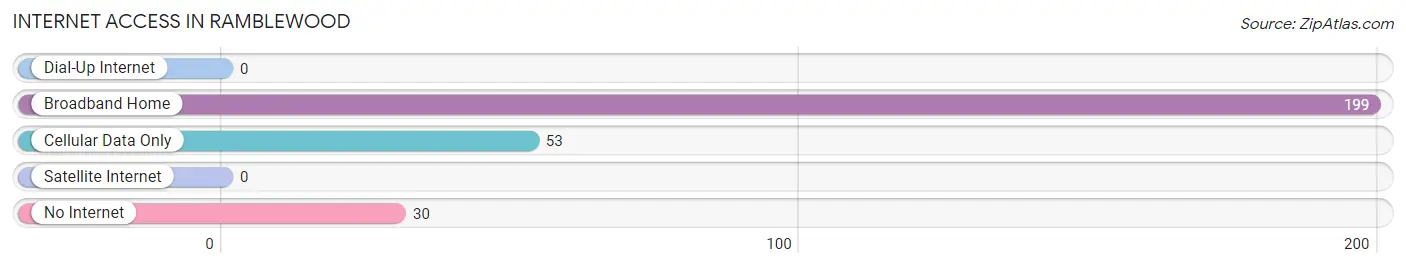
| Internet Type | # Households | % Households |
| Dial-Up Internet | 0 | 0.0% |
| Broadband Home | 199 | 70.6% |
| Cellular Data Only | 53 | 18.8% |
| Satellite Internet | 0 | 0.0% |
| No Internet | 30 | 10.6% |
| Total | 282 | 100.0% |
Ramblewood Summary
Ramblewood, Pennsylvania is a small borough located in the southeastern corner of the state. It is situated in the heart of the Lehigh Valley, a region of Pennsylvania known for its rich history and culture. The borough is home to a population of just over 1,000 people, making it one of the smallest municipalities in the state.
Geography
Ramblewood is located in the Lehigh Valley region of Pennsylvania, which is situated in the southeastern corner of the state. The borough is bordered by the cities of Allentown and Bethlehem to the north, and the townships of Lower Macungie and Upper Macungie to the east. The borough is situated on the banks of the Lehigh River, which flows through the center of the borough. The terrain of the borough is mostly flat, with some rolling hills in the northern and eastern parts of the borough.
Economy
The economy of Ramblewood is largely based on the service industry. The borough is home to a variety of small businesses, including restaurants, retail stores, and professional services. The borough is also home to a number of manufacturing companies, including a paper mill and a steel mill. The borough is also home to a number of small farms, which produce a variety of crops, including corn, wheat, and soybeans.
Demographics
As of the 2010 census, the population of Ramblewood was 1,072. The racial makeup of the borough was 94.3% White, 1.2% African American, 0.3% Native American, 0.7% Asian, 0.1% Pacific Islander, 1.7% from other races, and 1.9% from two or more races. Hispanic or Latino of any race were 4.2% of the population.
The median household income in Ramblewood was $45,938, and the median family income was $51,938. The per capita income for the borough was $20,938. About 8.3% of families and 10.2% of the population were below the poverty line, including 14.3% of those under age 18 and 6.2% of those age 65 or over.
History
Ramblewood was first settled in the late 1700s by a group of German immigrants. The borough was officially incorporated in 1845, and was named after the nearby Ramblewood Creek. The borough was originally a farming community, and the local economy was largely based on the production of wheat, corn, and other crops.
In the late 1800s, the borough began to experience a period of growth and development. The Lehigh Valley Railroad was built through the borough in 1871, and the borough became a popular destination for tourists and vacationers. The borough also experienced a period of industrial growth, with the construction of a paper mill and a steel mill in the late 1800s.
The borough continued to experience growth and development throughout the 20th century. The borough was home to a number of small businesses, and the local economy was largely based on the service industry. The borough also experienced a period of population growth, with the population increasing from 1,000 in 1950 to 1,072 in 2010.
Today, Ramblewood is a small borough with a population of just over 1,000 people. The borough is home to a variety of small businesses, and the local economy is largely based on the service industry. The borough is also home to a number of manufacturing companies, and the local farms produce a variety of crops. The borough is also a popular destination for tourists and vacationers, and is known for its rich history and culture.
Common Questions
What is Per Capita Income in Ramblewood?
Per Capita income in Ramblewood is $41,301.
What is the Median Family Income in Ramblewood?
Median Family Income in Ramblewood is $79,297.
What is the Median Household income in Ramblewood?
Median Household Income in Ramblewood is $77,656.
What is Income or Wage Gap in Ramblewood?
Income or Wage Gap in Ramblewood is 1.6%.
Women in Ramblewood earn 98.4 cents for every dollar earned by a man.
What is Inequality or Gini Index in Ramblewood?
Inequality or Gini Index in Ramblewood is 0.32.
What is the Total Population of Ramblewood?
Total Population of Ramblewood is 607.
What is the Total Male Population of Ramblewood?
Total Male Population of Ramblewood is 297.
What is the Total Female Population of Ramblewood?
Total Female Population of Ramblewood is 310.
What is the Ratio of Males per 100 Females in Ramblewood?
There are 95.81 Males per 100 Females in Ramblewood.
What is the Ratio of Females per 100 Males in Ramblewood?
There are 104.38 Females per 100 Males in Ramblewood.
What is the Median Population Age in Ramblewood?
Median Population Age in Ramblewood is 55.5 Years.
What is the Average Family Size in Ramblewood
Average Family Size in Ramblewood is 2.9 People.
What is the Average Household Size in Ramblewood
Average Household Size in Ramblewood is 2.1 People.
How Large is the Labor Force in Ramblewood?
There are 368 People in the Labor Forcein in Ramblewood.
What is the Percentage of People in the Labor Force in Ramblewood?
62.0% of People are in the Labor Force in Ramblewood.