Punxsutawney borough, PA Map & Demographics
Punxsutawney borough Overview
$29,486
PER CAPITA INCOME
$66,125
AVG FAMILY INCOME
$43,160
AVG HOUSEHOLD INCOME
5.3%
WAGE / INCOME GAP [ % ]
94.7¢/ $1
WAGE / INCOME GAP [ $ ]
$12,406
FAMILY INCOME DEFICIT
0.48
INEQUALITY / GINI INDEX
5,730
TOTAL POPULATION
2,821
MALE POPULATION
2,909
FEMALE POPULATION
96.97
MALES / 100 FEMALES
103.12
FEMALES / 100 MALES
46.2
MEDIAN AGE
2.9
AVG FAMILY SIZE
2.2
AVG HOUSEHOLD SIZE
2,563
LABOR FORCE [ PEOPLE ]
53.9%
PERCENT IN LABOR FORCE
5.3%
UNEMPLOYMENT RATE
Income in Punxsutawney borough
Income Overview in Punxsutawney borough
Per Capita Income in Punxsutawney borough is $29,486, while median incomes of families and households are $66,125 and $43,160 respectively.
| Characteristic | Number | Measure |
| Per Capita Income | 5,730 | $29,486 |
| Median Family Income | 1,381 | $66,125 |
| Mean Family Income | 1,381 | $83,469 |
| Median Household Income | 2,578 | $43,160 |
| Mean Household Income | 2,578 | $62,616 |
| Income Deficit | 1,381 | $12,406 |
| Wage / Income Gap (%) | 5,730 | 5.33% |
| Wage / Income Gap ($) | 5,730 | 94.67¢ per $1 |
| Gini / Inequality Index | 5,730 | 0.48 |
Earnings by Sex in Punxsutawney borough
Average Earnings in Punxsutawney borough are $32,880, $32,098 for men and $33,904 for women, a difference of 5.3%.
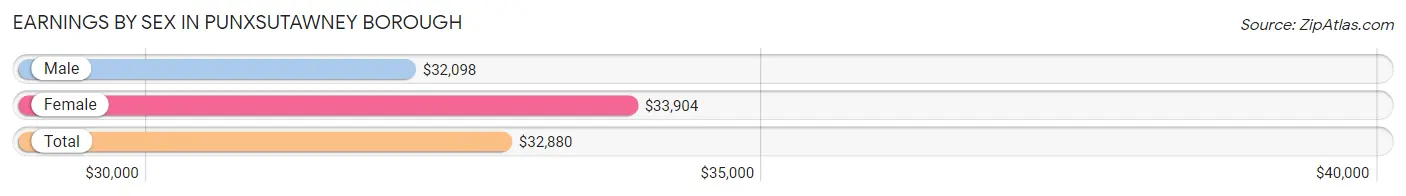
| Sex | Number | Average Earnings |
| Male | 1,519 (57.7%) | $32,098 |
| Female | 1,113 (42.3%) | $33,904 |
| Total | 2,632 (100.0%) | $32,880 |
Earnings by Sex by Income Bracket in Punxsutawney borough
The most common earnings brackets in Punxsutawney borough are $30,000 to $34,999 for men (209 | 13.8%) and $30,000 to $34,999 for women (122 | 11.0%).
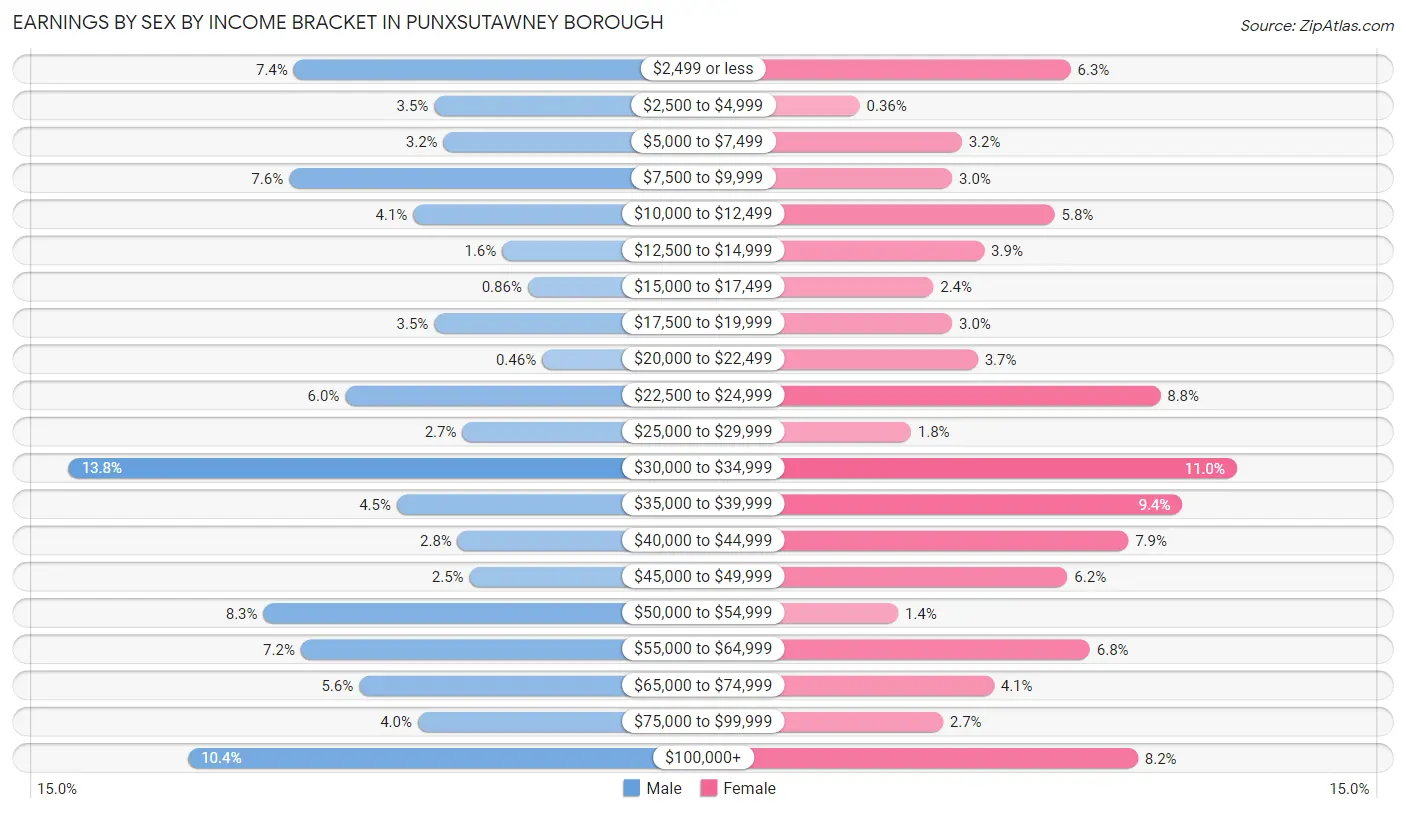
| Income | Male | Female |
| $2,499 or less | 113 (7.4%) | 70 (6.3%) |
| $2,500 to $4,999 | 53 (3.5%) | 4 (0.4%) |
| $5,000 to $7,499 | 49 (3.2%) | 36 (3.2%) |
| $7,500 to $9,999 | 115 (7.6%) | 33 (3.0%) |
| $10,000 to $12,499 | 62 (4.1%) | 65 (5.8%) |
| $12,500 to $14,999 | 24 (1.6%) | 43 (3.9%) |
| $15,000 to $17,499 | 13 (0.9%) | 27 (2.4%) |
| $17,500 to $19,999 | 53 (3.5%) | 33 (3.0%) |
| $20,000 to $22,499 | 7 (0.5%) | 41 (3.7%) |
| $22,500 to $24,999 | 91 (6.0%) | 98 (8.8%) |
| $25,000 to $29,999 | 41 (2.7%) | 20 (1.8%) |
| $30,000 to $34,999 | 209 (13.8%) | 122 (11.0%) |
| $35,000 to $39,999 | 69 (4.5%) | 105 (9.4%) |
| $40,000 to $44,999 | 43 (2.8%) | 88 (7.9%) |
| $45,000 to $49,999 | 38 (2.5%) | 69 (6.2%) |
| $50,000 to $54,999 | 126 (8.3%) | 16 (1.4%) |
| $55,000 to $64,999 | 110 (7.2%) | 76 (6.8%) |
| $65,000 to $74,999 | 85 (5.6%) | 46 (4.1%) |
| $75,000 to $99,999 | 60 (4.0%) | 30 (2.7%) |
| $100,000+ | 158 (10.4%) | 91 (8.2%) |
| Total | 1,519 (100.0%) | 1,113 (100.0%) |
Earnings by Sex by Educational Attainment in Punxsutawney borough
Average earnings in Punxsutawney borough are $36,514 for men and $37,606 for women, a difference of 2.9%. Men with an educational attainment of graduate degree enjoy the highest average annual earnings of $81,420, while those with high school diploma education earn the least with $31,178. Women with an educational attainment of graduate degree earn the most with the average annual earnings of $75,577, while those with high school diploma education have the smallest earnings of $21,500.
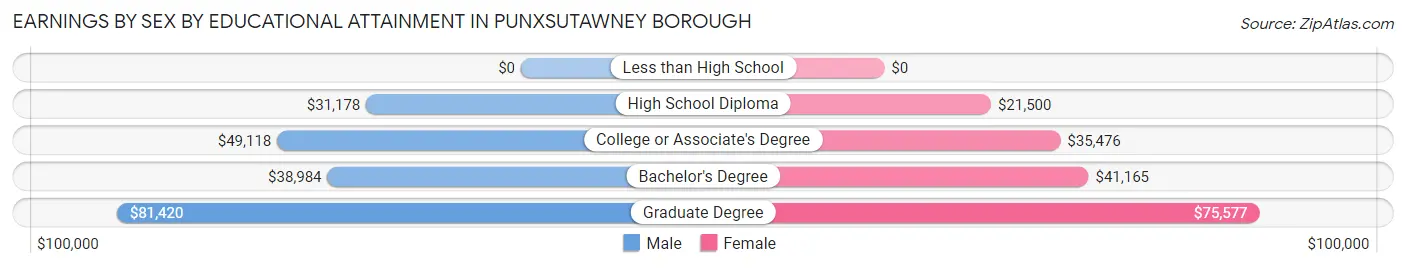
| Educational Attainment | Male Income | Female Income |
| Less than High School | - | - |
| High School Diploma | $31,178 | $21,500 |
| College or Associate's Degree | $49,118 | $35,476 |
| Bachelor's Degree | $38,984 | $41,165 |
| Graduate Degree | $81,420 | $75,577 |
| Total | $36,514 | $37,606 |
Family Income in Punxsutawney borough
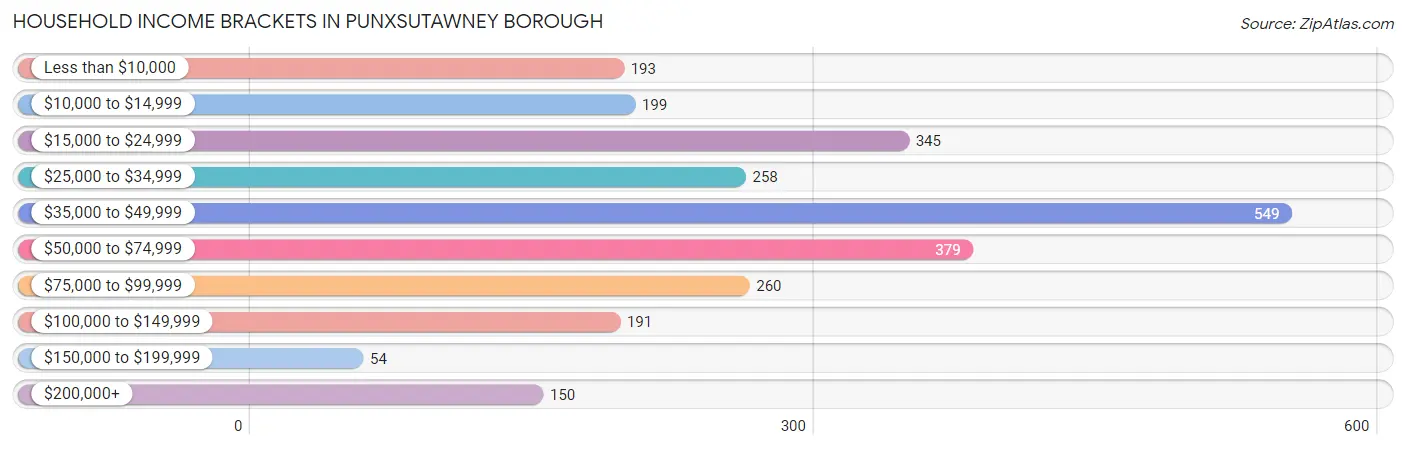
Family Income Brackets in Punxsutawney borough
According to the Punxsutawney borough family income data, there are 308 families falling into the $35,000 to $49,999 income range, which is the most common income bracket and makes up 22.3% of all families. Conversely, the $150,000 to $199,999 income bracket is the least frequent group with only 43 families (3.1%) belonging to this category.
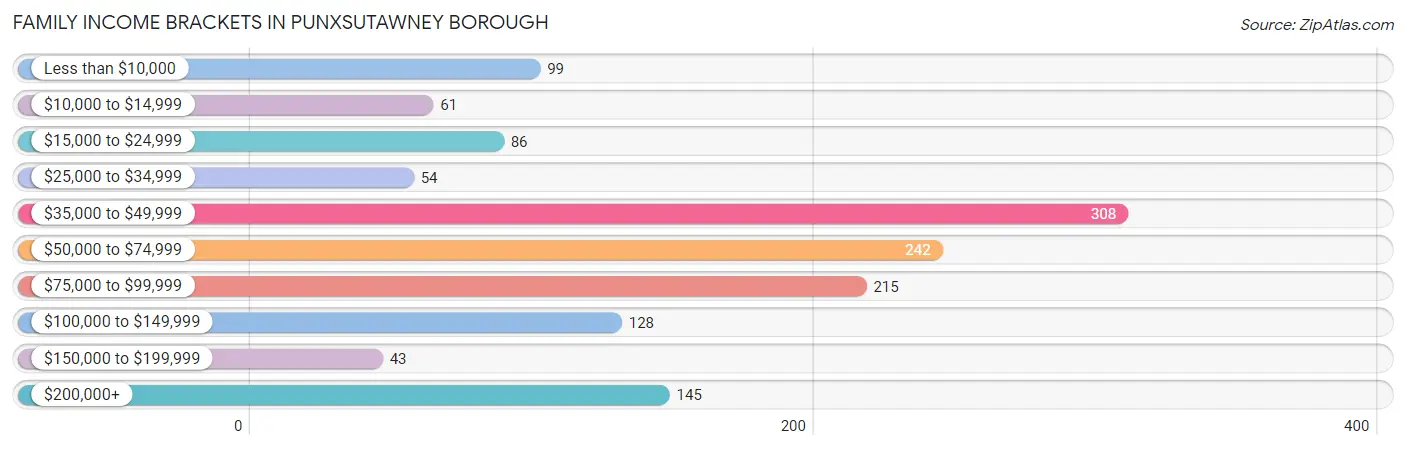
| Income Bracket | # Families | % Families |
| Less than $10,000 | 99 | 7.2% |
| $10,000 to $14,999 | 61 | 4.4% |
| $15,000 to $24,999 | 86 | 6.2% |
| $25,000 to $34,999 | 54 | 3.9% |
| $35,000 to $49,999 | 308 | 22.3% |
| $50,000 to $74,999 | 242 | 17.5% |
| $75,000 to $99,999 | 215 | 15.6% |
| $100,000 to $149,999 | 128 | 9.3% |
| $150,000 to $199,999 | 43 | 3.1% |
| $200,000+ | 145 | 10.5% |
Family Income by Famaliy Size in Punxsutawney borough
3-person families (277 | 20.1%) account for the highest median family income in Punxsutawney borough with $73,221 per family, while 2-person families (821 | 59.5%) have the highest median income of $24,825 per family member.
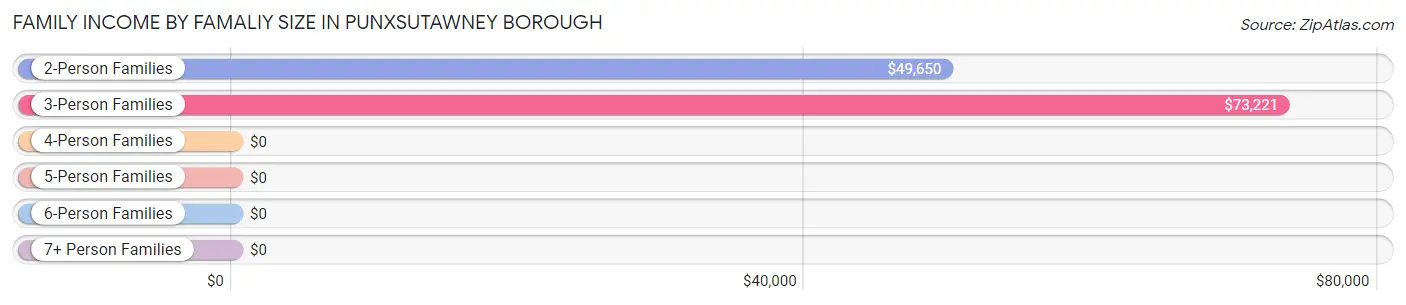
| Income Bracket | # Families | Median Income |
| 2-Person Families | 821 (59.5%) | $49,650 |
| 3-Person Families | 277 (20.1%) | $73,221 |
| 4-Person Families | 153 (11.1%) | $0 |
| 5-Person Families | 46 (3.3%) | $0 |
| 6-Person Families | 36 (2.6%) | $0 |
| 7+ Person Families | 48 (3.5%) | $0 |
| Total | 1,381 (100.0%) | $66,125 |
Family Income by Number of Earners in Punxsutawney borough
The median family income in Punxsutawney borough is $66,125, with families comprising 3+ earners (136) having the highest median family income of $242,813, while families with no earners (327) have the lowest median family income of $41,250, accounting for 9.9% and 23.7% of families, respectively.
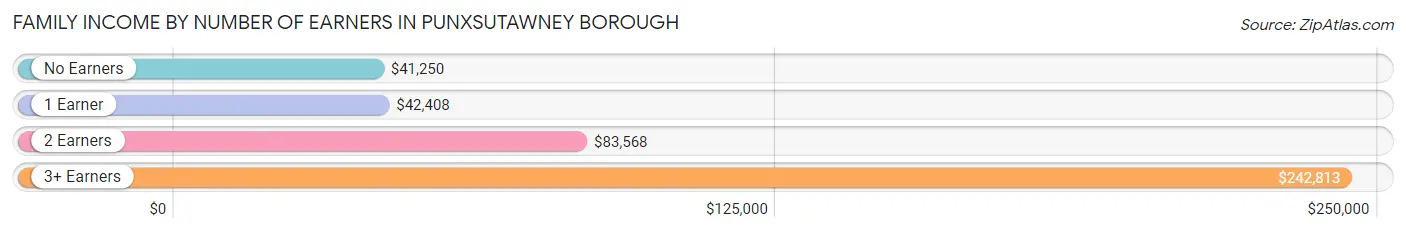
| Number of Earners | # Families | Median Income |
| No Earners | 327 (23.7%) | $41,250 |
| 1 Earner | 545 (39.5%) | $42,408 |
| 2 Earners | 373 (27.0%) | $83,568 |
| 3+ Earners | 136 (9.9%) | $242,813 |
| Total | 1,381 (100.0%) | $66,125 |
Household Income in Punxsutawney borough
Household Income Brackets in Punxsutawney borough
With 549 households falling in the category, the $35,000 to $49,999 income range is the most frequent in Punxsutawney borough, accounting for 21.3% of all households. In contrast, only 54 households (2.1%) fall into the $150,000 to $199,999 income bracket, making it the least populous group.
| Income Bracket | # Households | % Households |
| Less than $10,000 | 193 | 7.5% |
| $10,000 to $14,999 | 199 | 7.7% |
| $15,000 to $24,999 | 345 | 13.4% |
| $25,000 to $34,999 | 258 | 10.0% |
| $35,000 to $49,999 | 549 | 21.3% |
| $50,000 to $74,999 | 379 | 14.7% |
| $75,000 to $99,999 | 260 | 10.1% |
| $100,000 to $149,999 | 191 | 7.4% |
| $150,000 to $199,999 | 54 | 2.1% |
| $200,000+ | 150 | 5.8% |
Household Income by Householder Age in Punxsutawney borough
The median household income in Punxsutawney borough is $43,160, with the highest median household income of $65,446 found in the 45 to 64 years age bracket for the primary householder. A total of 789 households (30.6%) fall into this category. Meanwhile, the 15 to 24 years age bracket for the primary householder has the lowest median household income of $33,958, with 79 households (3.1%) in this group.
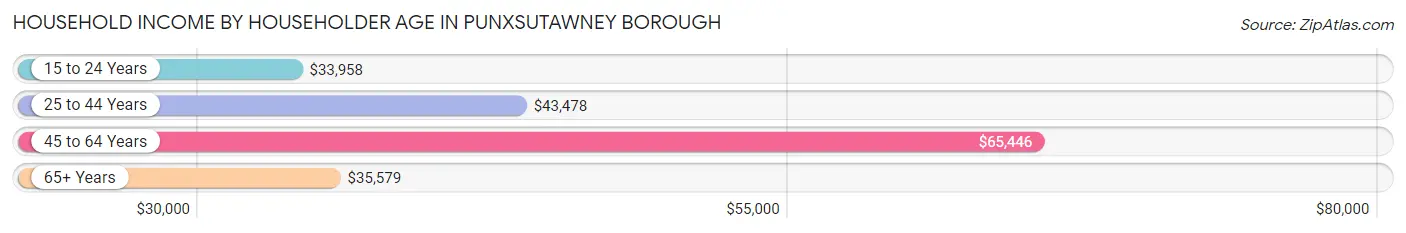
| Income Bracket | # Households | Median Income |
| 15 to 24 Years | 79 (3.1%) | $33,958 |
| 25 to 44 Years | 636 (24.7%) | $43,478 |
| 45 to 64 Years | 789 (30.6%) | $65,446 |
| 65+ Years | 1,074 (41.7%) | $35,579 |
| Total | 2,578 (100.0%) | $43,160 |
Poverty in Punxsutawney borough
Income Below Poverty by Sex and Age in Punxsutawney borough
With 16.7% poverty level for males and 22.6% for females among the residents of Punxsutawney borough, under 5 year old males and 5 year old females are the most vulnerable to poverty, with 63 males (55.7%) and 28 females (100.0%) in their respective age groups living below the poverty level.
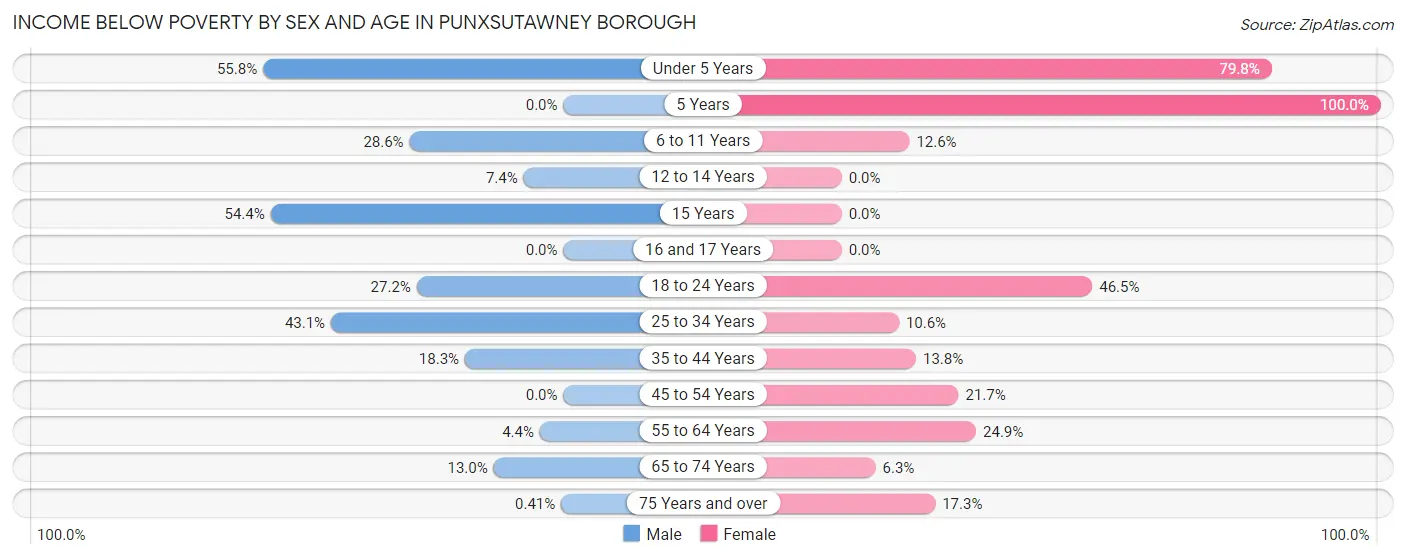
| Age Bracket | Male | Female |
| Under 5 Years | 63 (55.7%) | 138 (79.8%) |
| 5 Years | 0 (0.0%) | 28 (100.0%) |
| 6 to 11 Years | 38 (28.6%) | 25 (12.6%) |
| 12 to 14 Years | 15 (7.4%) | 0 (0.0%) |
| 15 Years | 25 (54.3%) | 0 (0.0%) |
| 16 and 17 Years | 0 (0.0%) | 0 (0.0%) |
| 18 to 24 Years | 64 (27.2%) | 113 (46.5%) |
| 25 to 34 Years | 132 (43.1%) | 14 (10.6%) |
| 35 to 44 Years | 59 (18.3%) | 51 (13.8%) |
| 45 to 54 Years | 0 (0.0%) | 70 (21.7%) |
| 55 to 64 Years | 18 (4.4%) | 91 (24.9%) |
| 65 to 74 Years | 43 (13.0%) | 28 (6.3%) |
| 75 Years and over | 1 (0.4%) | 77 (17.3%) |
| Total | 458 (16.7%) | 635 (22.6%) |
Income Above Poverty by Sex and Age in Punxsutawney borough
According to the poverty statistics in Punxsutawney borough, males aged 5 years and females aged 12 to 14 years are the age groups that are most secure financially, with 100.0% of males and 100.0% of females in these age groups living above the poverty line.
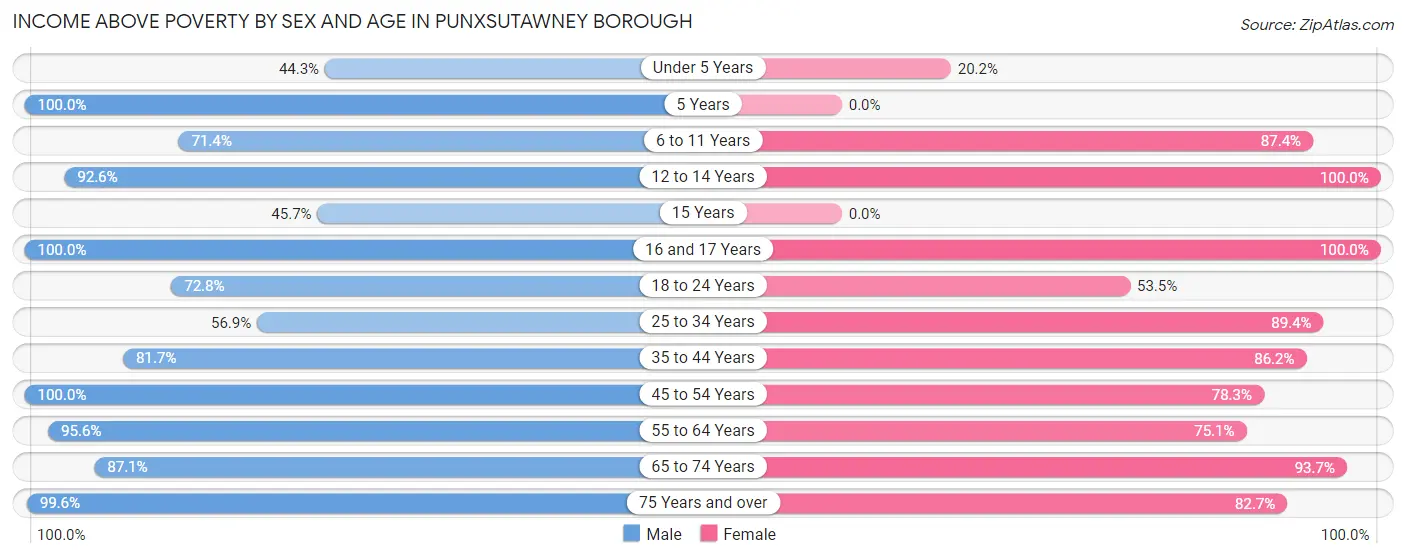
| Age Bracket | Male | Female |
| Under 5 Years | 50 (44.3%) | 35 (20.2%) |
| 5 Years | 12 (100.0%) | 0 (0.0%) |
| 6 to 11 Years | 95 (71.4%) | 174 (87.4%) |
| 12 to 14 Years | 188 (92.6%) | 44 (100.0%) |
| 15 Years | 21 (45.7%) | 0 (0.0%) |
| 16 and 17 Years | 97 (100.0%) | 40 (100.0%) |
| 18 to 24 Years | 171 (72.8%) | 130 (53.5%) |
| 25 to 34 Years | 174 (56.9%) | 118 (89.4%) |
| 35 to 44 Years | 264 (81.7%) | 319 (86.2%) |
| 45 to 54 Years | 291 (100.0%) | 253 (78.3%) |
| 55 to 64 Years | 394 (95.6%) | 274 (75.1%) |
| 65 to 74 Years | 289 (87.1%) | 418 (93.7%) |
| 75 Years and over | 242 (99.6%) | 367 (82.7%) |
| Total | 2,288 (83.3%) | 2,172 (77.4%) |
Income Below Poverty Among Married-Couple Families in Punxsutawney borough
The poverty statistics for married-couple families in Punxsutawney borough show that 4.5% or 46 of the total 1,019 families live below the poverty line. Families with 1 or 2 children have the highest poverty rate of 7.0%, comprising of 14 families. On the other hand, families with 3 or 4 children have the lowest poverty rate of 0.0%, which includes 0 families.
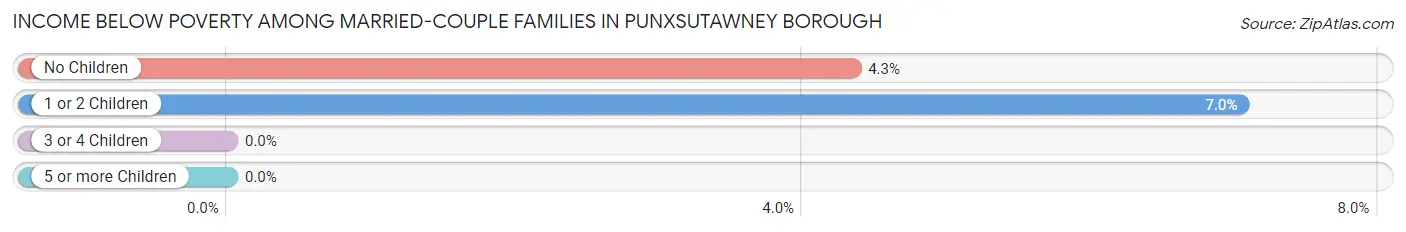
| Children | Above Poverty | Below Poverty |
| No Children | 706 (95.7%) | 32 (4.3%) |
| 1 or 2 Children | 185 (93.0%) | 14 (7.0%) |
| 3 or 4 Children | 34 (100.0%) | 0 (0.0%) |
| 5 or more Children | 48 (100.0%) | 0 (0.0%) |
| Total | 973 (95.5%) | 46 (4.5%) |
Income Below Poverty Among Single-Parent Households in Punxsutawney borough
According to the poverty data in Punxsutawney borough, 81.6% or 71 single-father households and 36.4% or 100 single-mother households are living below the poverty line. Among single-father households, those with 1 or 2 children have the highest poverty rate, with 6 households (100.0%) experiencing poverty. Likewise, among single-mother households, those with no children have the highest poverty rate, with 43 households (38.7%) falling below the poverty line.
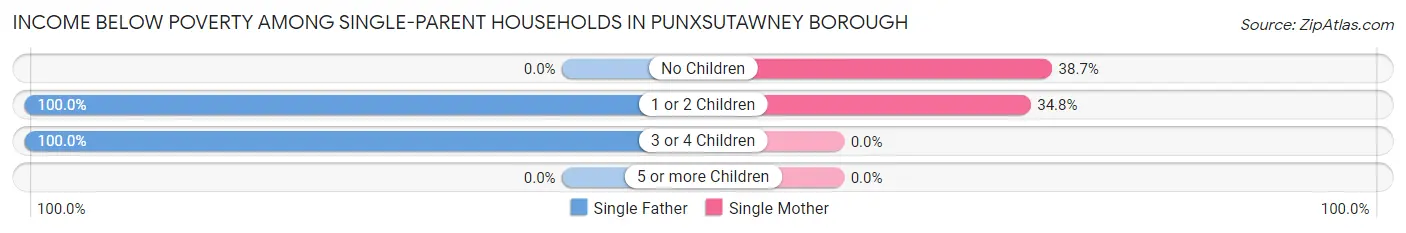
| Children | Single Father | Single Mother |
| No Children | 0 (0.0%) | 43 (38.7%) |
| 1 or 2 Children | 6 (100.0%) | 57 (34.8%) |
| 3 or 4 Children | 65 (100.0%) | 0 (0.0%) |
| 5 or more Children | 0 (0.0%) | 0 (0.0%) |
| Total | 71 (81.6%) | 100 (36.4%) |
Income Below Poverty Among Married-Couple vs Single-Parent Households in Punxsutawney borough
The poverty data for Punxsutawney borough shows that 46 of the married-couple family households (4.5%) and 171 of the single-parent households (47.2%) are living below the poverty level. Within the married-couple family households, those with 1 or 2 children have the highest poverty rate, with 14 households (7.0%) falling below the poverty line. Among the single-parent households, those with 3 or 4 children have the highest poverty rate, with 65 household (100.0%) living below poverty.
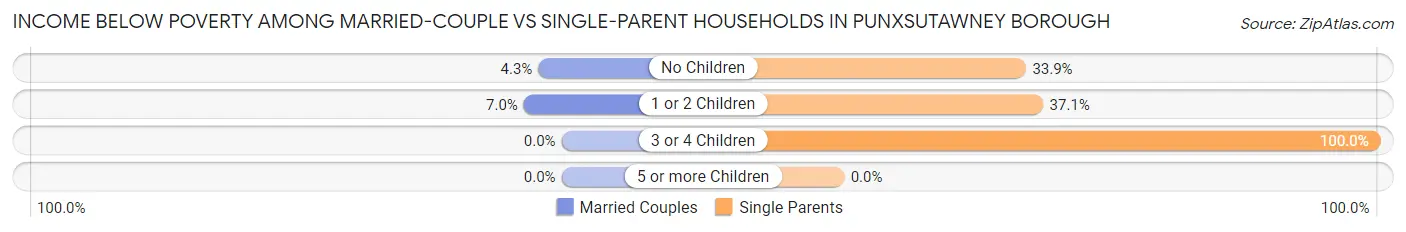
| Children | Married-Couple Families | Single-Parent Households |
| No Children | 32 (4.3%) | 43 (33.9%) |
| 1 or 2 Children | 14 (7.0%) | 63 (37.1%) |
| 3 or 4 Children | 0 (0.0%) | 65 (100.0%) |
| 5 or more Children | 0 (0.0%) | 0 (0.0%) |
| Total | 46 (4.5%) | 171 (47.2%) |
Race in Punxsutawney borough
The most populous races in Punxsutawney borough are White / Caucasian (5,561 | 97.1%), Asian (78 | 1.4%), and Hispanic or Latino (48 | 0.8%).
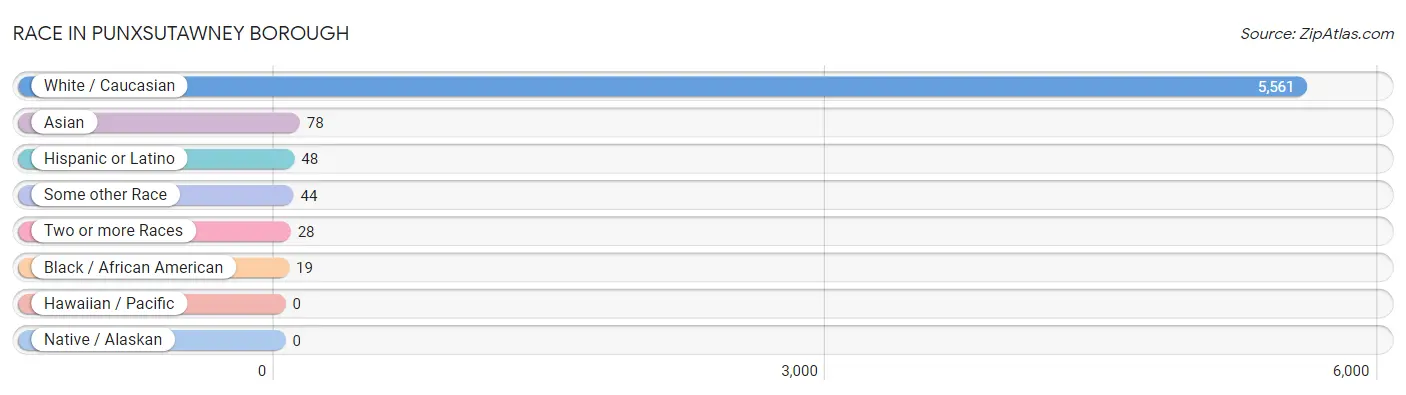
| Race | # Population | % Population |
| Asian | 78 | 1.4% |
| Black / African American | 19 | 0.3% |
| Hawaiian / Pacific | 0 | 0.0% |
| Hispanic or Latino | 48 | 0.8% |
| Native / Alaskan | 0 | 0.0% |
| White / Caucasian | 5,561 | 97.1% |
| Two or more Races | 28 | 0.5% |
| Some other Race | 44 | 0.8% |
| Total | 5,730 | 100.0% |
Ancestry in Punxsutawney borough
The most populous ancestries reported in Punxsutawney borough are German (1,249 | 21.8%), Irish (800 | 14.0%), Italian (731 | 12.8%), English (374 | 6.5%), and American (297 | 5.2%), together accounting for 60.2% of all Punxsutawney borough residents.
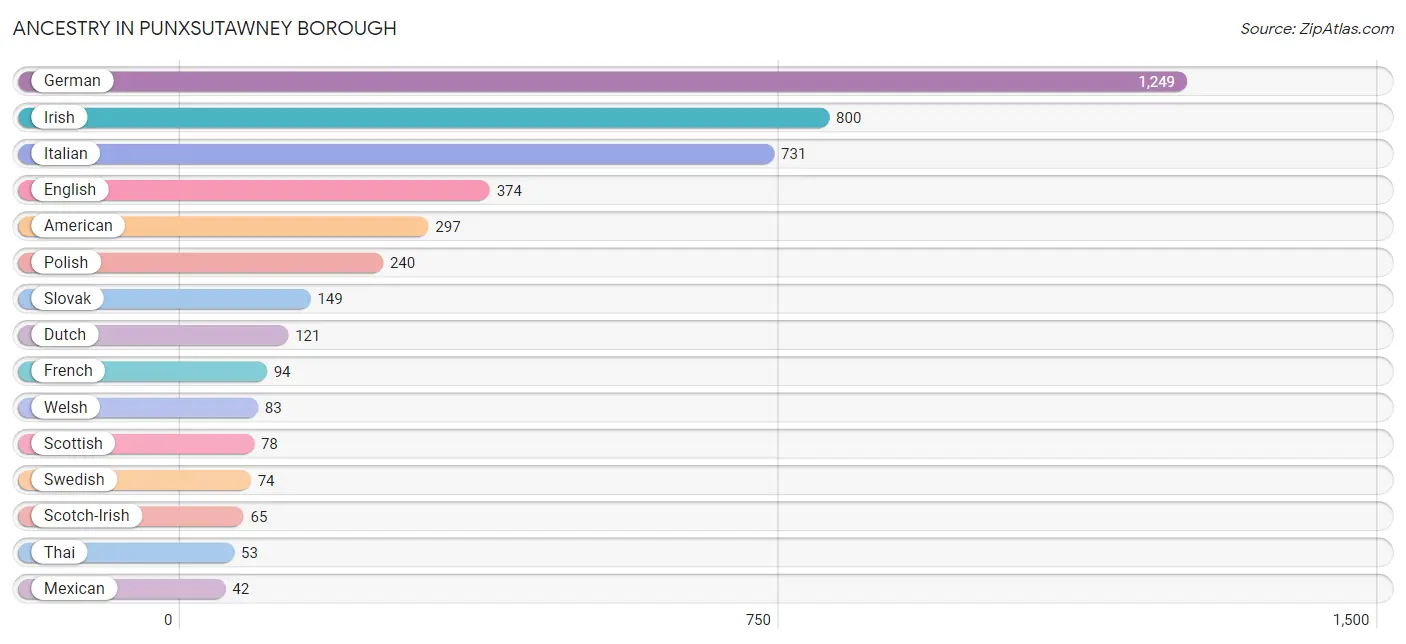
| Ancestry | # Population | % Population |
| American | 297 | 5.2% |
| Arab | 2 | 0.0% |
| Austrian | 10 | 0.2% |
| British | 30 | 0.5% |
| Burmese | 25 | 0.4% |
| Canadian | 2 | 0.0% |
| Central American | 4 | 0.1% |
| Czech | 4 | 0.1% |
| Czechoslovakian | 7 | 0.1% |
| Dutch | 121 | 2.1% |
| Eastern European | 18 | 0.3% |
| English | 374 | 6.5% |
| European | 1 | 0.0% |
| French | 94 | 1.6% |
| French Canadian | 7 | 0.1% |
| German | 1,249 | 21.8% |
| Guatemalan | 4 | 0.1% |
| Hungarian | 33 | 0.6% |
| Irish | 800 | 14.0% |
| Italian | 731 | 12.8% |
| Jamaican | 1 | 0.0% |
| Lithuanian | 24 | 0.4% |
| Mexican | 42 | 0.7% |
| Northern European | 13 | 0.2% |
| Norwegian | 17 | 0.3% |
| Pennsylvania German | 5 | 0.1% |
| Polish | 240 | 4.2% |
| Puerto Rican | 2 | 0.0% |
| Russian | 7 | 0.1% |
| Scandinavian | 9 | 0.2% |
| Scotch-Irish | 65 | 1.1% |
| Scottish | 78 | 1.4% |
| Slavic | 30 | 0.5% |
| Slovak | 149 | 2.6% |
| Swedish | 74 | 1.3% |
| Swiss | 24 | 0.4% |
| Thai | 53 | 0.9% |
| Welsh | 83 | 1.5% | View All 38 Rows |
Immigrants in Punxsutawney borough
The most numerous immigrant groups reported in Punxsutawney borough came from Asia (39 | 0.7%), Eastern Asia (25 | 0.4%), Korea (25 | 0.4%), Pakistan (14 | 0.2%), and South Central Asia (14 | 0.2%), together accounting for 2.0% of all Punxsutawney borough residents.
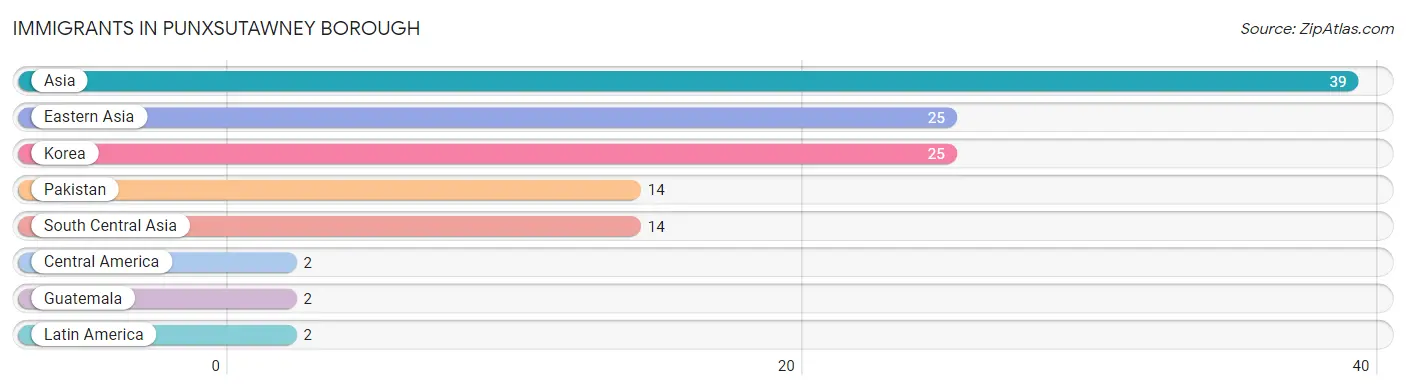
| Immigration Origin | # Population | % Population |
| Asia | 39 | 0.7% |
| Central America | 2 | 0.0% |
| Eastern Asia | 25 | 0.4% |
| Guatemala | 2 | 0.0% |
| Korea | 25 | 0.4% |
| Latin America | 2 | 0.0% |
| Pakistan | 14 | 0.2% |
| South Central Asia | 14 | 0.2% | View All 8 Rows |
Sex and Age in Punxsutawney borough
Sex and Age in Punxsutawney borough
The most populous age groups in Punxsutawney borough are 60 to 64 Years (247 | 8.8%) for men and 65 to 69 Years (273 | 9.4%) for women.
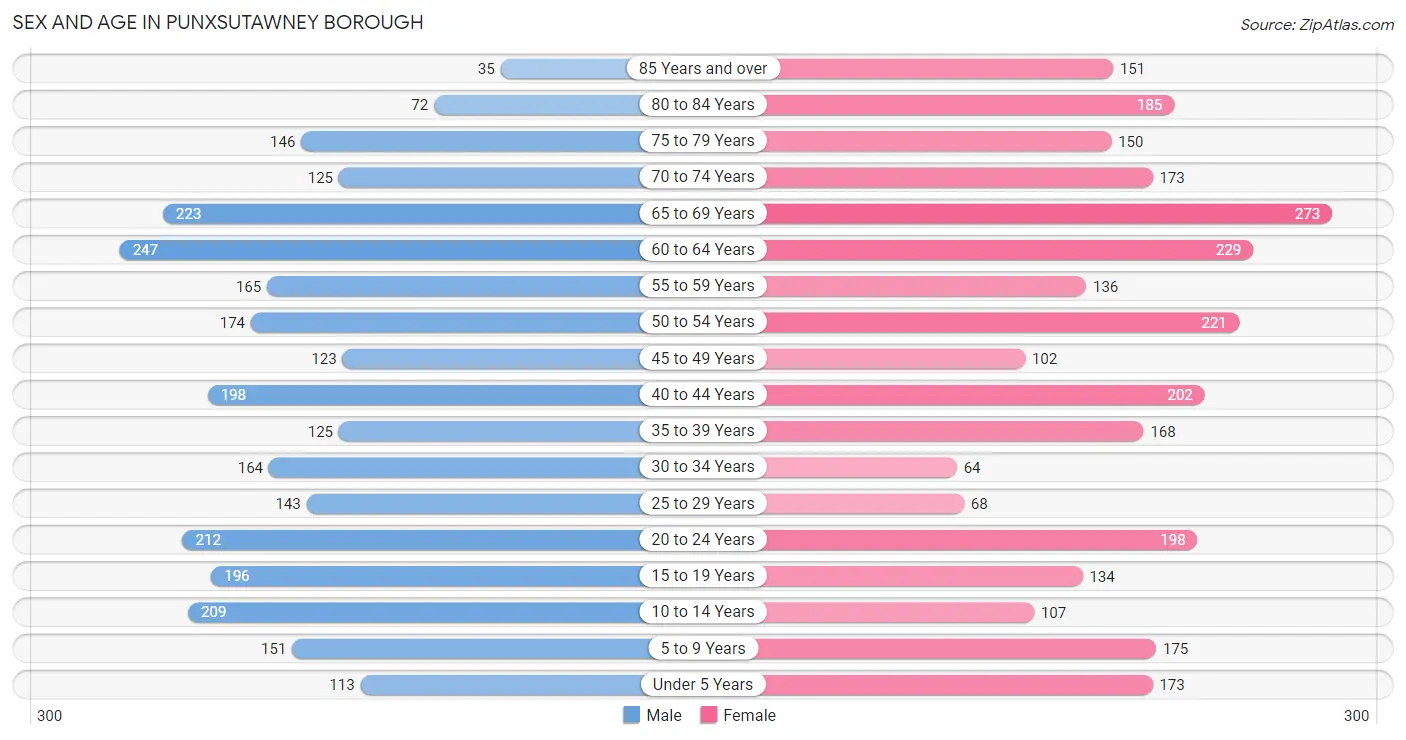
| Age Bracket | Male | Female |
| Under 5 Years | 113 (4.0%) | 173 (5.9%) |
| 5 to 9 Years | 151 (5.3%) | 175 (6.0%) |
| 10 to 14 Years | 209 (7.4%) | 107 (3.7%) |
| 15 to 19 Years | 196 (7.0%) | 134 (4.6%) |
| 20 to 24 Years | 212 (7.5%) | 198 (6.8%) |
| 25 to 29 Years | 143 (5.1%) | 68 (2.3%) |
| 30 to 34 Years | 164 (5.8%) | 64 (2.2%) |
| 35 to 39 Years | 125 (4.4%) | 168 (5.8%) |
| 40 to 44 Years | 198 (7.0%) | 202 (6.9%) |
| 45 to 49 Years | 123 (4.4%) | 102 (3.5%) |
| 50 to 54 Years | 174 (6.2%) | 221 (7.6%) |
| 55 to 59 Years | 165 (5.9%) | 136 (4.7%) |
| 60 to 64 Years | 247 (8.8%) | 229 (7.9%) |
| 65 to 69 Years | 223 (7.9%) | 273 (9.4%) |
| 70 to 74 Years | 125 (4.4%) | 173 (5.9%) |
| 75 to 79 Years | 146 (5.2%) | 150 (5.2%) |
| 80 to 84 Years | 72 (2.5%) | 185 (6.4%) |
| 85 Years and over | 35 (1.2%) | 151 (5.2%) |
| Total | 2,821 (100.0%) | 2,909 (100.0%) |
Families and Households in Punxsutawney borough
Median Family Size in Punxsutawney borough
The median family size in Punxsutawney borough is 2.92 persons per family, with single male/father families (87 | 6.3%) accounting for the largest median family size of 3.63 persons per family. On the other hand, single female/mother families (275 | 19.9%) represent the smallest median family size with 2.52 persons per family.
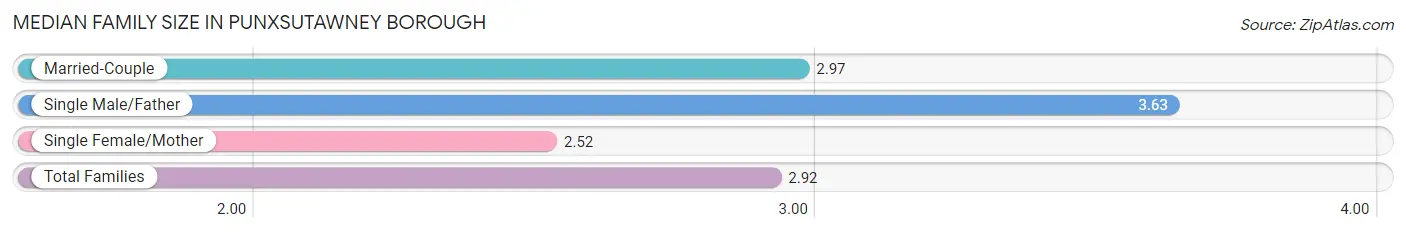
| Family Type | # Families | Family Size |
| Married-Couple | 1,019 (73.8%) | 2.97 |
| Single Male/Father | 87 (6.3%) | 3.63 |
| Single Female/Mother | 275 (19.9%) | 2.52 |
| Total Families | 1,381 (100.0%) | 2.92 |
Median Household Size in Punxsutawney borough
The median household size in Punxsutawney borough is 2.16 persons per household, with single male/father households (87 | 3.4%) accounting for the largest median household size of 4.91 persons per household. non-family households (1,197 | 46.4%) represent the smallest median household size with 1.14 persons per household.
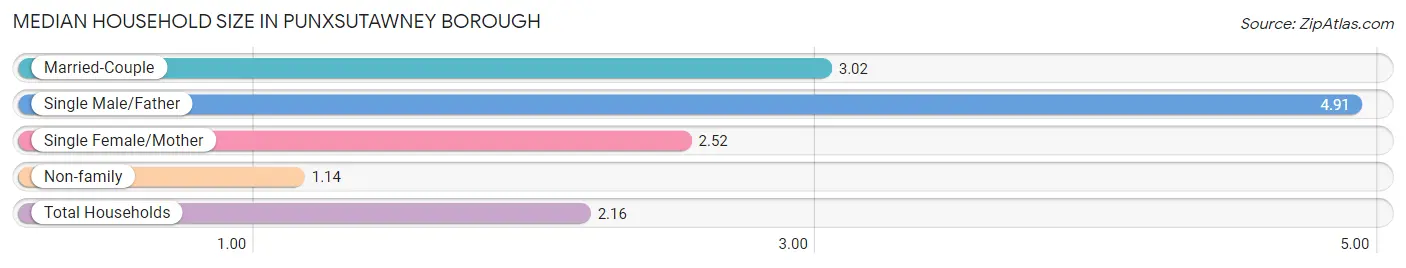
| Household Type | # Households | Household Size |
| Married-Couple | 1,019 (39.5%) | 3.02 |
| Single Male/Father | 87 (3.4%) | 4.91 |
| Single Female/Mother | 275 (10.7%) | 2.52 |
| Non-family | 1,197 (46.4%) | 1.14 |
| Total Households | 2,578 (100.0%) | 2.16 |
Household Size by Marriage Status in Punxsutawney borough
Out of a total of 2,578 households in Punxsutawney borough, 1,381 (53.6%) are family households, while 1,197 (46.4%) are nonfamily households. The most numerous type of family households are 2-person households, comprising 799, and the most common type of nonfamily households are 1-person households, comprising 1,068.
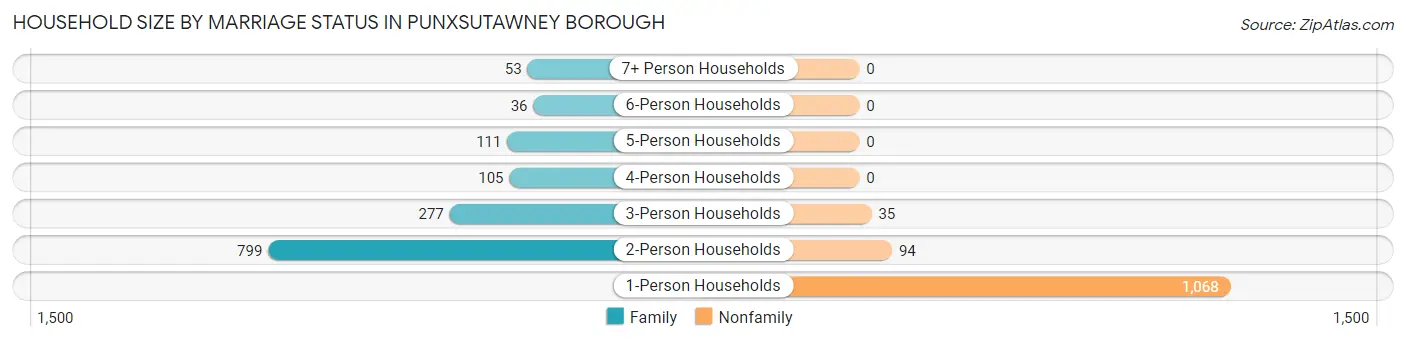
| Household Size | Family Households | Nonfamily Households |
| 1-Person Households | - | 1,068 (41.4%) |
| 2-Person Households | 799 (31.0%) | 94 (3.6%) |
| 3-Person Households | 277 (10.7%) | 35 (1.4%) |
| 4-Person Households | 105 (4.1%) | 0 (0.0%) |
| 5-Person Households | 111 (4.3%) | 0 (0.0%) |
| 6-Person Households | 36 (1.4%) | 0 (0.0%) |
| 7+ Person Households | 53 (2.1%) | 0 (0.0%) |
| Total | 1,381 (53.6%) | 1,197 (46.4%) |
Female Fertility in Punxsutawney borough
Fertility by Age in Punxsutawney borough
Average fertility rate in Punxsutawney borough is 86.0 births per 1,000 women. Women in the age bracket of 20 to 34 years have the highest fertility rate with 252.0 births per 1,000 women. Women in the age bracket of 20 to 34 years acount for 100.0% of all women with births.
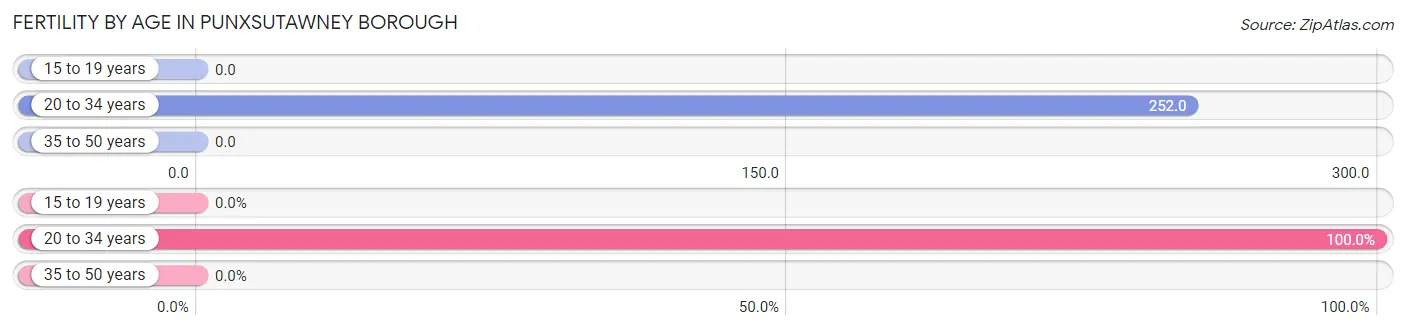
| Age Bracket | Women with Births | Births / 1,000 Women |
| 15 to 19 years | 0 (0.0%) | 0.0 |
| 20 to 34 years | 83 (100.0%) | 252.0 |
| 35 to 50 years | 0 (0.0%) | 0.0 |
| Total | 83 (100.0%) | 86.0 |
Fertility by Age by Marriage Status in Punxsutawney borough

| Age Bracket | Married | Unmarried |
| 15 to 19 years | 0 (0.0%) | 0 (0.0%) |
| 20 to 34 years | 0 (0.0%) | 83 (100.0%) |
| 35 to 50 years | 0 (0.0%) | 0 (0.0%) |
| Total | 0 (0.0%) | 83 (100.0%) |
Fertility by Education in Punxsutawney borough
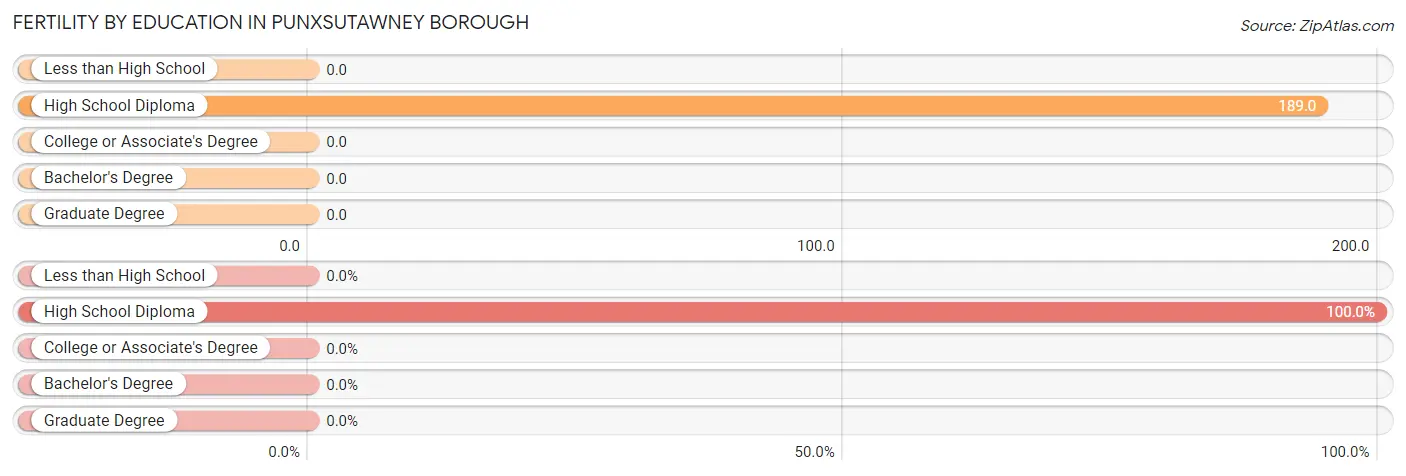
| Educational Attainment | Women with Births | Births / 1,000 Women |
| Less than High School | 0 (0.0%) | 0.0 |
| High School Diploma | 83 (100.0%) | 189.0 |
| College or Associate's Degree | 0 (0.0%) | 0.0 |
| Bachelor's Degree | 0 (0.0%) | 0.0 |
| Graduate Degree | 0 (0.0%) | 0.0 |
| Total | 83 (100.0%) | 86.0 |
Fertility by Education by Marriage Status in Punxsutawney borough
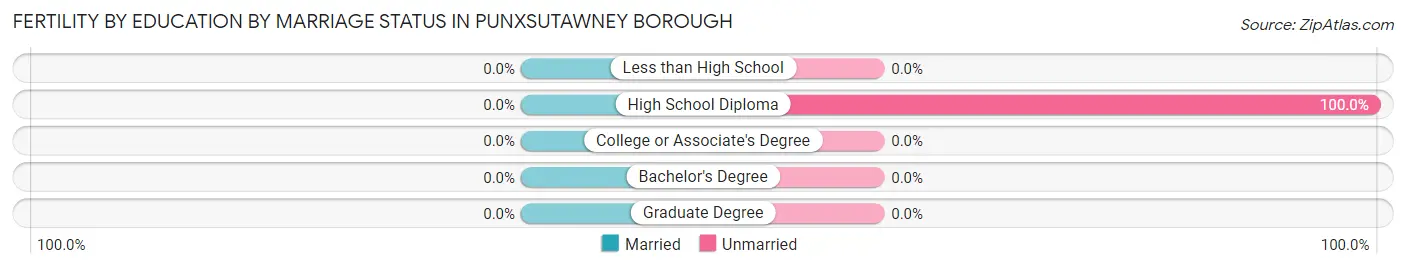
| Educational Attainment | Married | Unmarried |
| Less than High School | 0 (0.0%) | 0 (0.0%) |
| High School Diploma | 0 (0.0%) | 83 (100.0%) |
| College or Associate's Degree | 0 (0.0%) | 0 (0.0%) |
| Bachelor's Degree | 0 (0.0%) | 0 (0.0%) |
| Graduate Degree | 0 (0.0%) | 0 (0.0%) |
| Total | 0 (0.0%) | 83 (100.0%) |
Employment Characteristics in Punxsutawney borough
Employment by Class of Employer in Punxsutawney borough
Among the 2,394 employed individuals in Punxsutawney borough, private company employees (1,794 | 74.9%), not-for-profit organizations (342 | 14.3%), and self-employed (not incorporated) (136 | 5.7%) make up the most common classes of employment.
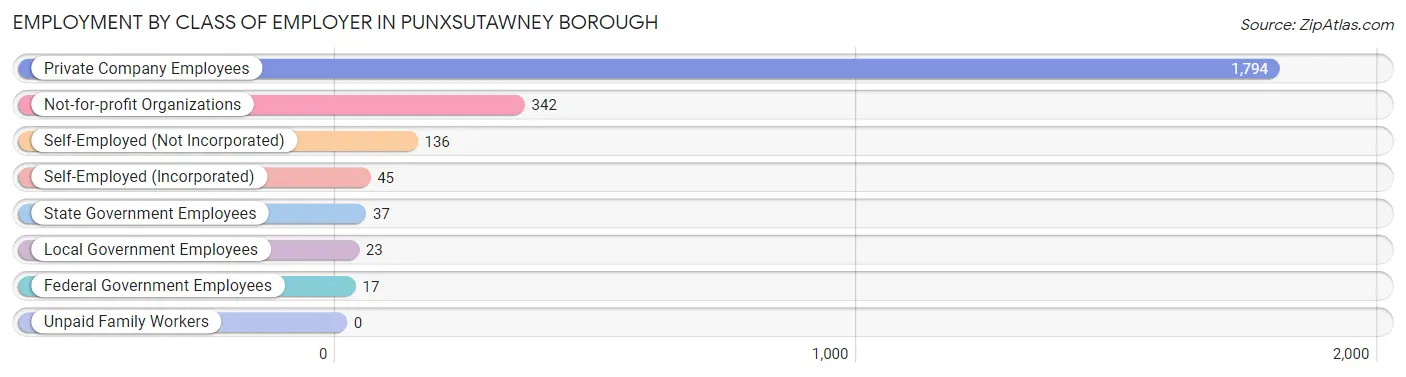
| Employer Class | # Employees | % Employees |
| Private Company Employees | 1,794 | 74.9% |
| Self-Employed (Incorporated) | 45 | 1.9% |
| Self-Employed (Not Incorporated) | 136 | 5.7% |
| Not-for-profit Organizations | 342 | 14.3% |
| Local Government Employees | 23 | 1.0% |
| State Government Employees | 37 | 1.5% |
| Federal Government Employees | 17 | 0.7% |
| Unpaid Family Workers | 0 | 0.0% |
| Total | 2,394 | 100.0% |
Employment Status by Age in Punxsutawney borough
According to the labor force statistics for Punxsutawney borough, out of the total population over 16 years of age (4,756), 53.9% or 2,563 individuals are in the labor force, with 5.3% or 136 of them unemployed. The age group with the highest labor force participation rate is 35 to 44 years, with 90.5% or 627 individuals in the labor force. Within the labor force, the 16 to 19 years age range has the highest percentage of unemployed individuals, with 25.0% or 29 of them being unemployed.
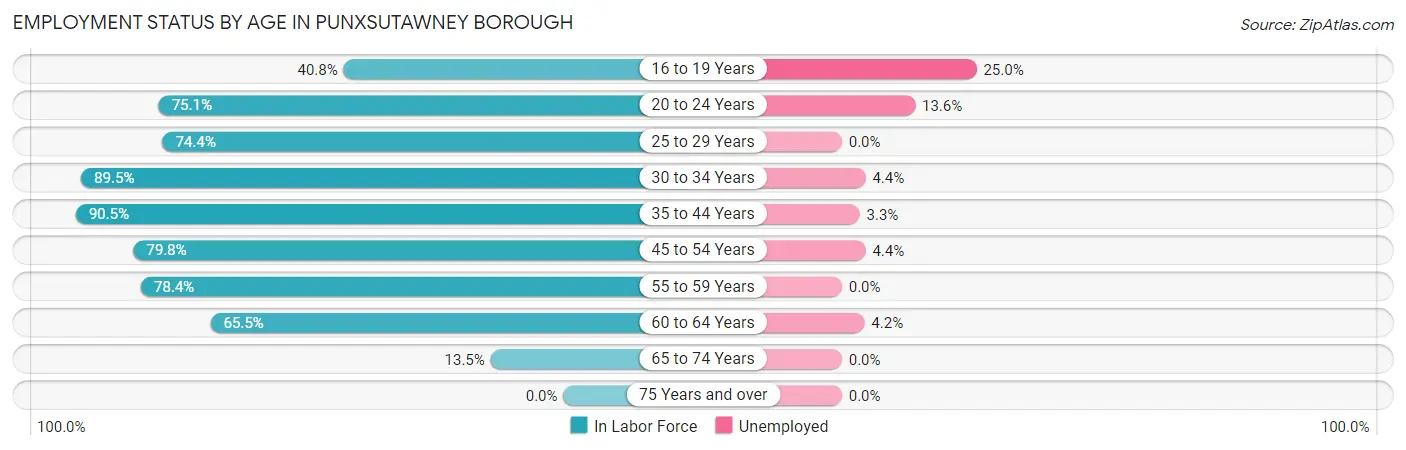
| Age Bracket | In Labor Force | Unemployed |
| 16 to 19 Years | 116 (40.8%) | 29 (25.0%) |
| 20 to 24 Years | 308 (75.1%) | 42 (13.6%) |
| 25 to 29 Years | 157 (74.4%) | 0 (0.0%) |
| 30 to 34 Years | 204 (89.5%) | 9 (4.4%) |
| 35 to 44 Years | 627 (90.5%) | 21 (3.3%) |
| 45 to 54 Years | 495 (79.8%) | 22 (4.4%) |
| 55 to 59 Years | 236 (78.4%) | 0 (0.0%) |
| 60 to 64 Years | 312 (65.5%) | 13 (4.2%) |
| 65 to 74 Years | 107 (13.5%) | 0 (0.0%) |
| 75 Years and over | 0 (0.0%) | 0 (0.0%) |
| Total | 2,563 (53.9%) | 136 (5.3%) |
Employment Status by Educational Attainment in Punxsutawney borough
According to labor force statistics for Punxsutawney borough, 80.3% of individuals (2,031) out of the total population between 25 and 64 years of age (2,529) are in the labor force, with 3.2% or 65 of them being unemployed. The group with the highest labor force participation rate are those with the educational attainment of bachelor's degree or higher, with 88.8% or 478 individuals in the labor force. Within the labor force, individuals with bachelor's degree or higher education have the highest percentage of unemployment, with 6.5% or 31 of them being unemployed.
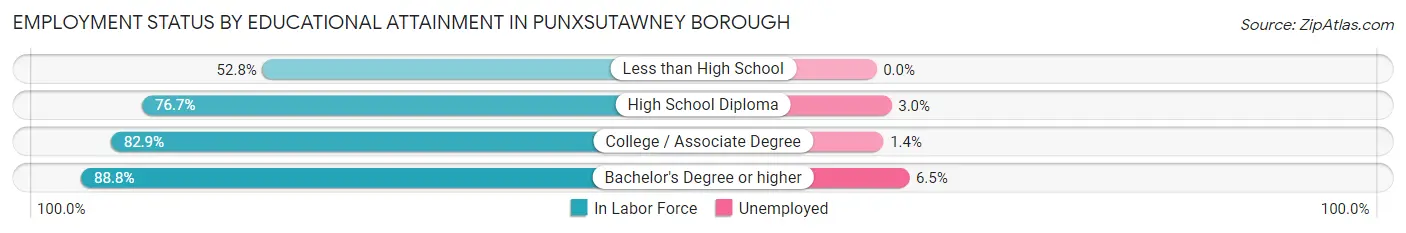
| Educational Attainment | In Labor Force | Unemployed |
| Less than High School | 57 (52.8%) | 0 (0.0%) |
| High School Diploma | 805 (76.7%) | 31 (3.0%) |
| College / Associate Degree | 691 (82.9%) | 12 (1.4%) |
| Bachelor's Degree or higher | 478 (88.8%) | 35 (6.5%) |
| Total | 2,031 (80.3%) | 81 (3.2%) |
Employment Occupations by Sex in Punxsutawney borough
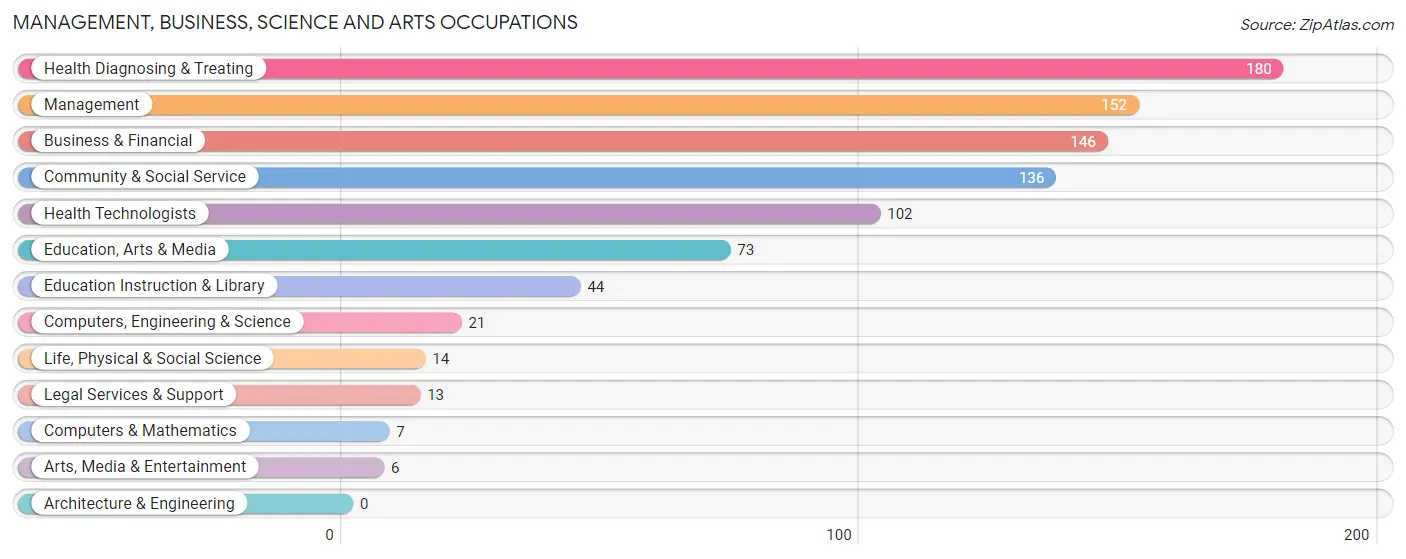
Management, Business, Science and Arts Occupations
The most common Management, Business, Science and Arts occupations in Punxsutawney borough are Health Diagnosing & Treating (180 | 7.4%), Management (152 | 6.3%), Business & Financial (146 | 6.0%), Community & Social Service (136 | 5.6%), and Health Technologists (102 | 4.2%).
Management, Business, Science and Arts Occupations by Sex
Within the Management, Business, Science and Arts occupations in Punxsutawney borough, the most male-oriented occupations are Computers, Engineering & Science (100.0%), Computers & Mathematics (100.0%), and Life, Physical & Social Science (100.0%), while the most female-oriented occupations are Legal Services & Support (100.0%), Business & Financial (80.8%), and Education, Arts & Media (74.0%).
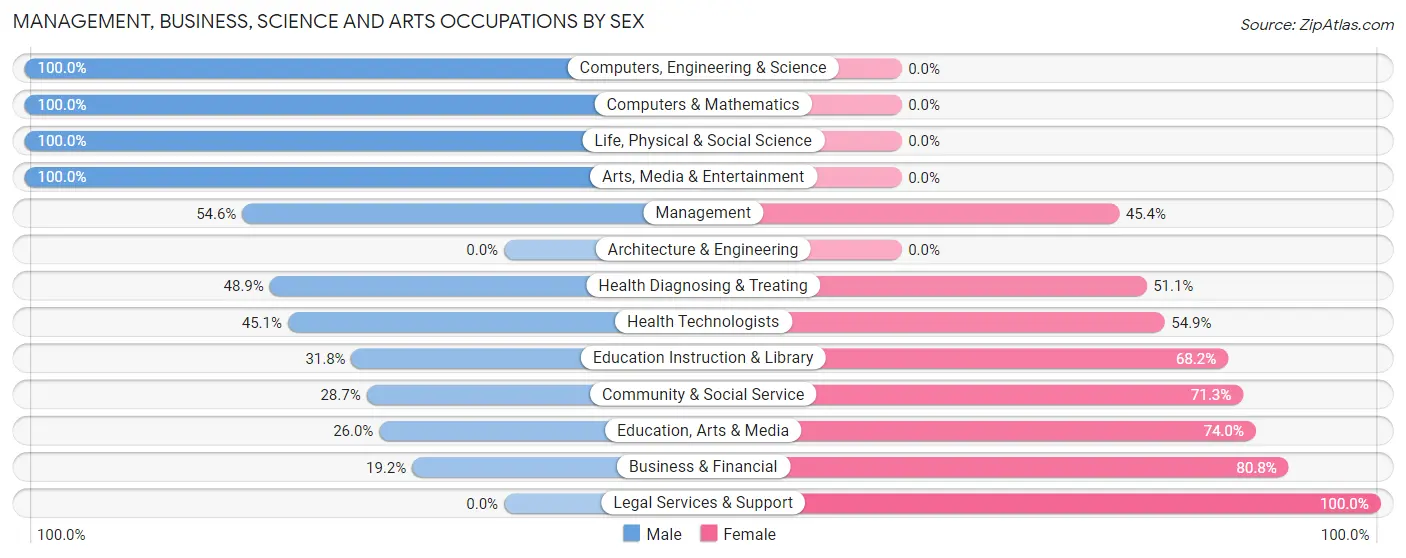
| Occupation | Male | Female |
| Management | 83 (54.6%) | 69 (45.4%) |
| Business & Financial | 28 (19.2%) | 118 (80.8%) |
| Computers, Engineering & Science | 21 (100.0%) | 0 (0.0%) |
| Computers & Mathematics | 7 (100.0%) | 0 (0.0%) |
| Architecture & Engineering | 0 (0.0%) | 0 (0.0%) |
| Life, Physical & Social Science | 14 (100.0%) | 0 (0.0%) |
| Community & Social Service | 39 (28.7%) | 97 (71.3%) |
| Education, Arts & Media | 19 (26.0%) | 54 (74.0%) |
| Legal Services & Support | 0 (0.0%) | 13 (100.0%) |
| Education Instruction & Library | 14 (31.8%) | 30 (68.2%) |
| Arts, Media & Entertainment | 6 (100.0%) | 0 (0.0%) |
| Health Diagnosing & Treating | 88 (48.9%) | 92 (51.1%) |
| Health Technologists | 46 (45.1%) | 56 (54.9%) |
| Total (Category) | 259 (40.8%) | 376 (59.2%) |
| Total (Overall) | 1,391 (57.3%) | 1,035 (42.7%) |
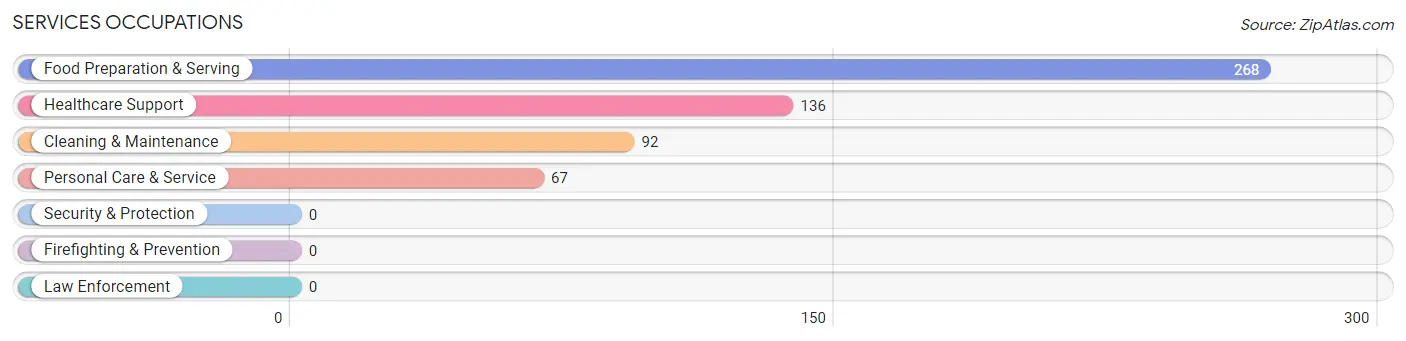
Services Occupations
The most common Services occupations in Punxsutawney borough are Food Preparation & Serving (268 | 11.1%), Healthcare Support (136 | 5.6%), Cleaning & Maintenance (92 | 3.8%), and Personal Care & Service (67 | 2.8%).
Services Occupations by Sex
Within the Services occupations in Punxsutawney borough, the most male-oriented occupations are Personal Care & Service (100.0%), Food Preparation & Serving (64.9%), and Cleaning & Maintenance (33.7%), while the most female-oriented occupations are Healthcare Support (87.5%), Cleaning & Maintenance (66.3%), and Food Preparation & Serving (35.1%).
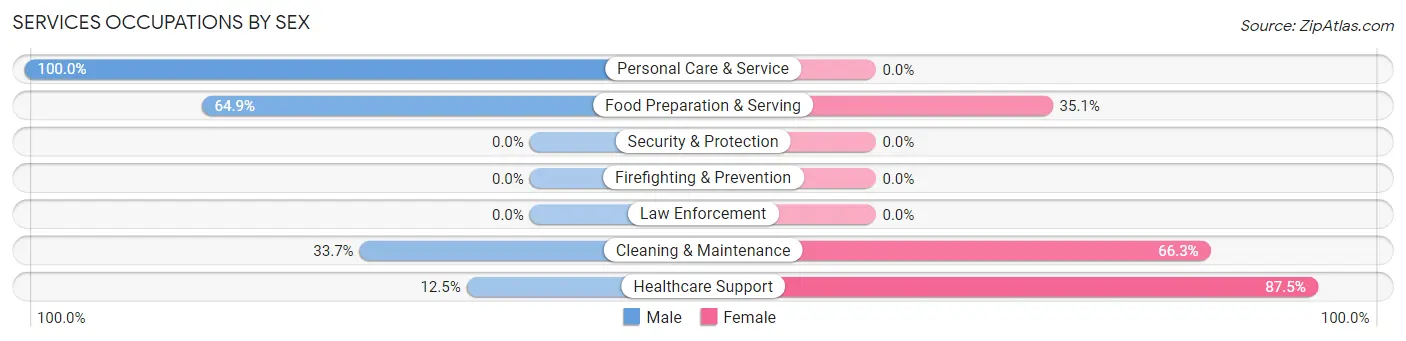
| Occupation | Male | Female |
| Healthcare Support | 17 (12.5%) | 119 (87.5%) |
| Security & Protection | 0 (0.0%) | 0 (0.0%) |
| Firefighting & Prevention | 0 (0.0%) | 0 (0.0%) |
| Law Enforcement | 0 (0.0%) | 0 (0.0%) |
| Food Preparation & Serving | 174 (64.9%) | 94 (35.1%) |
| Cleaning & Maintenance | 31 (33.7%) | 61 (66.3%) |
| Personal Care & Service | 67 (100.0%) | 0 (0.0%) |
| Total (Category) | 289 (51.3%) | 274 (48.7%) |
| Total (Overall) | 1,391 (57.3%) | 1,035 (42.7%) |
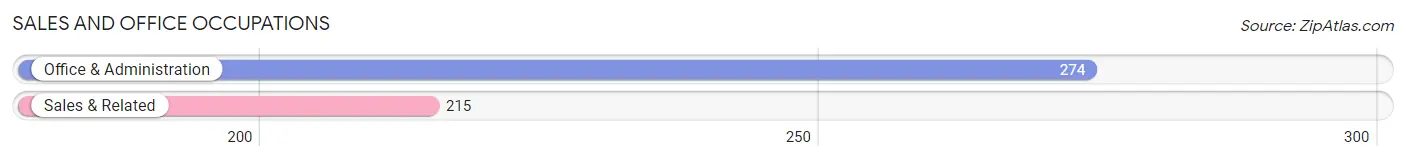
Sales and Office Occupations
The most common Sales and Office occupations in Punxsutawney borough are Office & Administration (274 | 11.3%), and Sales & Related (215 | 8.9%).
Sales and Office Occupations by Sex
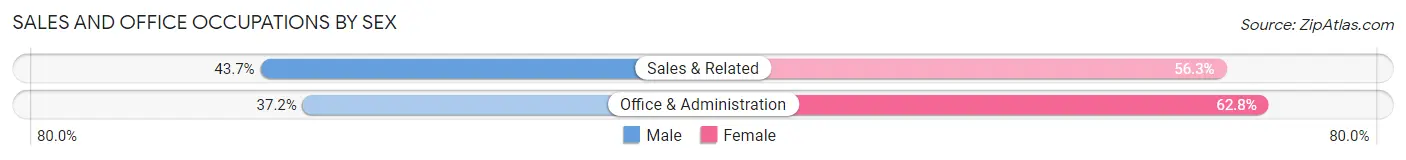
| Occupation | Male | Female |
| Sales & Related | 94 (43.7%) | 121 (56.3%) |
| Office & Administration | 102 (37.2%) | 172 (62.8%) |
| Total (Category) | 196 (40.1%) | 293 (59.9%) |
| Total (Overall) | 1,391 (57.3%) | 1,035 (42.7%) |
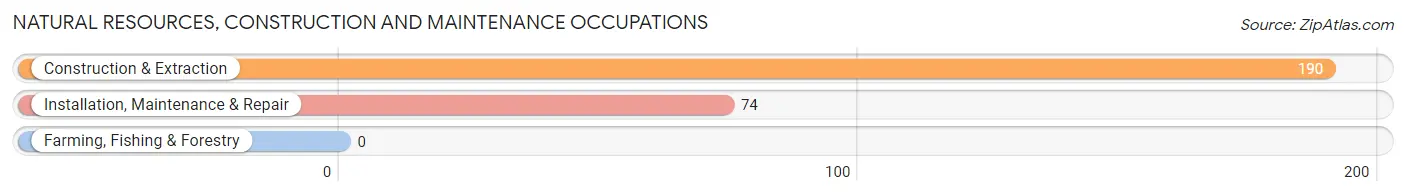
Natural Resources, Construction and Maintenance Occupations
The most common Natural Resources, Construction and Maintenance occupations in Punxsutawney borough are Construction & Extraction (190 | 7.8%), and Installation, Maintenance & Repair (74 | 3.0%).
Natural Resources, Construction and Maintenance Occupations by Sex
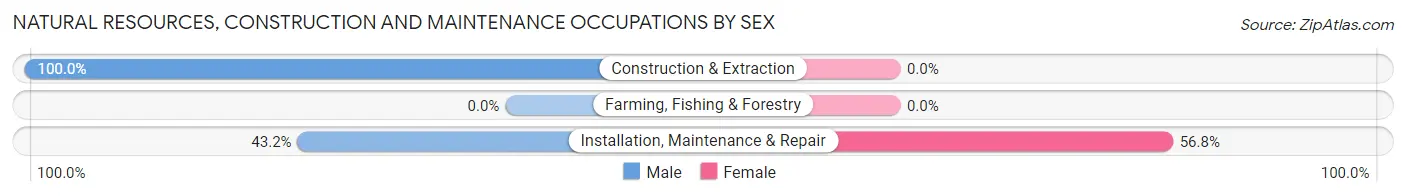
| Occupation | Male | Female |
| Farming, Fishing & Forestry | 0 (0.0%) | 0 (0.0%) |
| Construction & Extraction | 190 (100.0%) | 0 (0.0%) |
| Installation, Maintenance & Repair | 32 (43.2%) | 42 (56.8%) |
| Total (Category) | 222 (84.1%) | 42 (15.9%) |
| Total (Overall) | 1,391 (57.3%) | 1,035 (42.7%) |
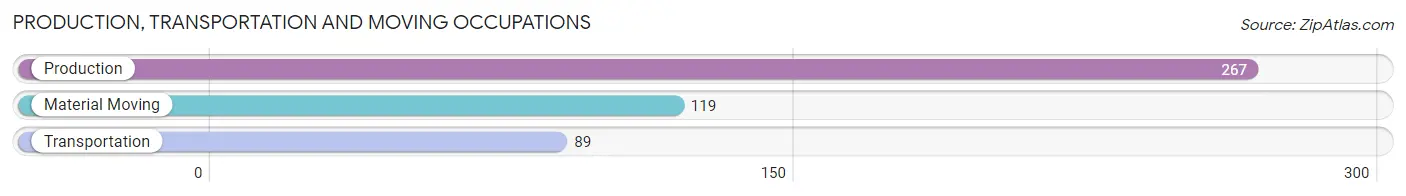
Production, Transportation and Moving Occupations
The most common Production, Transportation and Moving occupations in Punxsutawney borough are Production (267 | 11.0%), Material Moving (119 | 4.9%), and Transportation (89 | 3.7%).
Production, Transportation and Moving Occupations by Sex
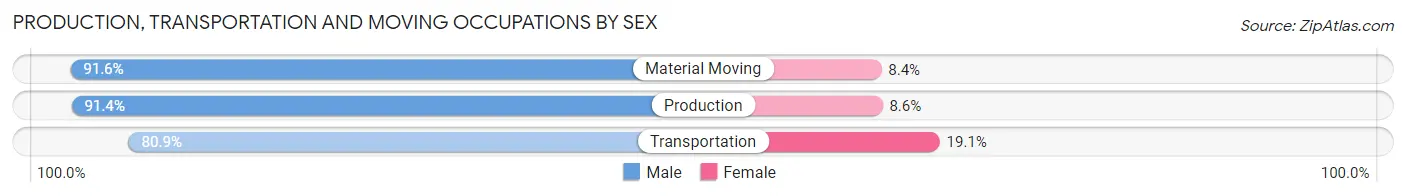
| Occupation | Male | Female |
| Production | 244 (91.4%) | 23 (8.6%) |
| Transportation | 72 (80.9%) | 17 (19.1%) |
| Material Moving | 109 (91.6%) | 10 (8.4%) |
| Total (Category) | 425 (89.5%) | 50 (10.5%) |
| Total (Overall) | 1,391 (57.3%) | 1,035 (42.7%) |
Employment Industries by Sex in Punxsutawney borough
Employment Industries in Punxsutawney borough
The major employment industries in Punxsutawney borough include Health Care & Social Assistance (490 | 20.2%), Manufacturing (421 | 17.3%), Accommodation & Food Services (302 | 12.4%), Retail Trade (245 | 10.1%), and Construction (121 | 5.0%).
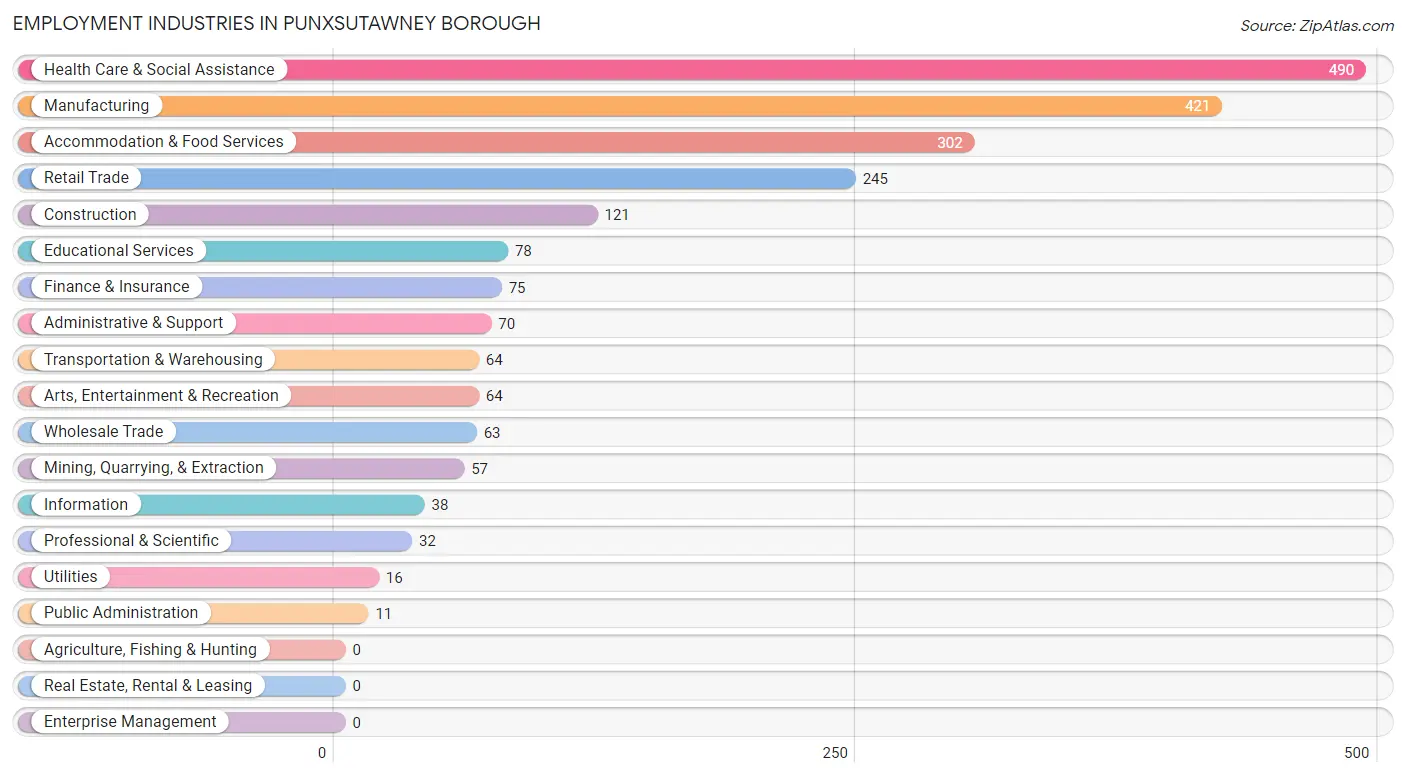
Employment Industries by Sex in Punxsutawney borough
The Punxsutawney borough industries that see more men than women are Mining, Quarrying, & Extraction (100.0%), Construction (100.0%), and Wholesale Trade (100.0%), whereas the industries that tend to have a higher number of women are Public Administration (100.0%), Health Care & Social Assistance (78.4%), and Finance & Insurance (72.0%).
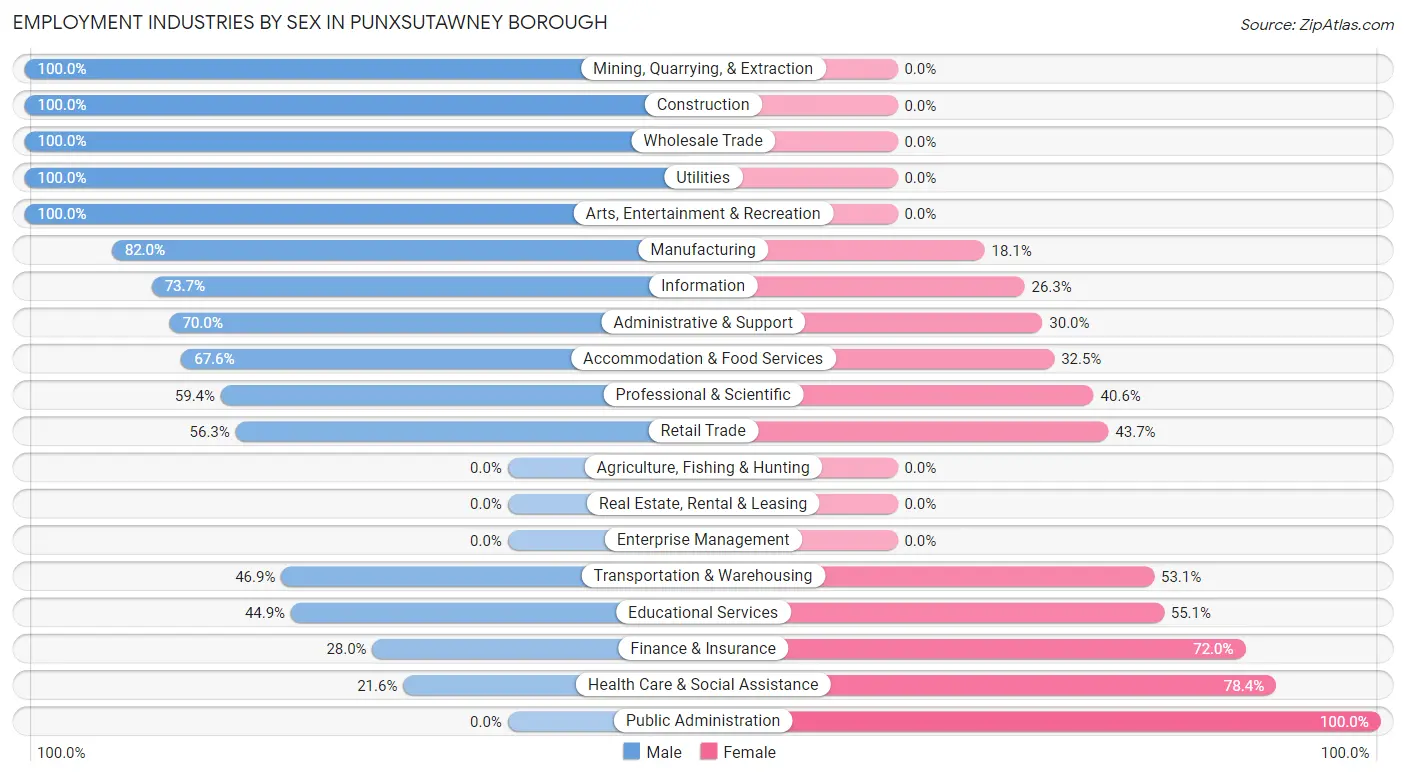
| Industry | Male | Female |
| Agriculture, Fishing & Hunting | 0 (0.0%) | 0 (0.0%) |
| Mining, Quarrying, & Extraction | 57 (100.0%) | 0 (0.0%) |
| Construction | 121 (100.0%) | 0 (0.0%) |
| Manufacturing | 345 (82.0%) | 76 (18.0%) |
| Wholesale Trade | 63 (100.0%) | 0 (0.0%) |
| Retail Trade | 138 (56.3%) | 107 (43.7%) |
| Transportation & Warehousing | 30 (46.9%) | 34 (53.1%) |
| Utilities | 16 (100.0%) | 0 (0.0%) |
| Information | 28 (73.7%) | 10 (26.3%) |
| Finance & Insurance | 21 (28.0%) | 54 (72.0%) |
| Real Estate, Rental & Leasing | 0 (0.0%) | 0 (0.0%) |
| Professional & Scientific | 19 (59.4%) | 13 (40.6%) |
| Enterprise Management | 0 (0.0%) | 0 (0.0%) |
| Administrative & Support | 49 (70.0%) | 21 (30.0%) |
| Educational Services | 35 (44.9%) | 43 (55.1%) |
| Health Care & Social Assistance | 106 (21.6%) | 384 (78.4%) |
| Arts, Entertainment & Recreation | 64 (100.0%) | 0 (0.0%) |
| Accommodation & Food Services | 204 (67.5%) | 98 (32.5%) |
| Public Administration | 0 (0.0%) | 11 (100.0%) |
| Total | 1,391 (57.3%) | 1,035 (42.7%) |
Education in Punxsutawney borough
School Enrollment in Punxsutawney borough
The most common levels of schooling among the 1,070 students in Punxsutawney borough are high school (315 | 29.4%), elementary school (287 | 26.8%), and college / undergraduate (156 | 14.6%).
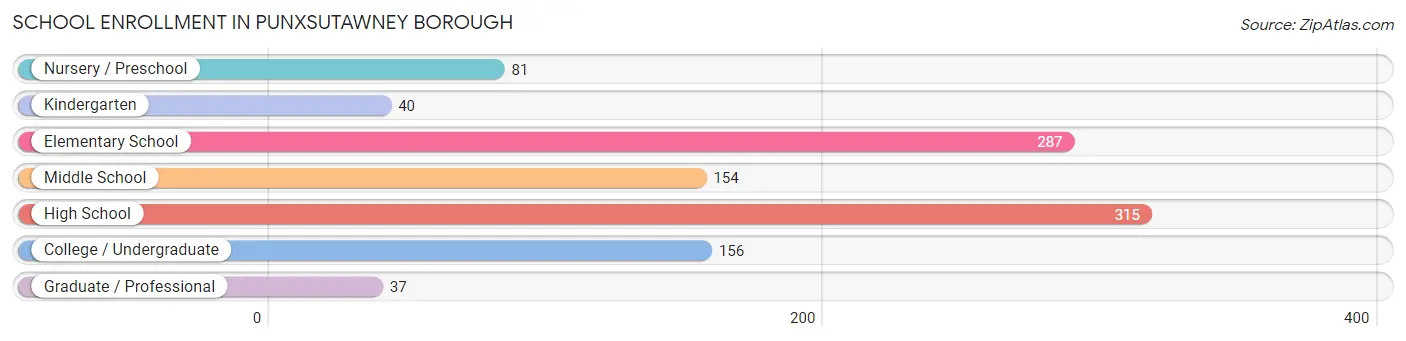
| School Level | # Students | % Students |
| Nursery / Preschool | 81 | 7.6% |
| Kindergarten | 40 | 3.7% |
| Elementary School | 287 | 26.8% |
| Middle School | 154 | 14.4% |
| High School | 315 | 29.4% |
| College / Undergraduate | 156 | 14.6% |
| Graduate / Professional | 37 | 3.5% |
| Total | 1,070 | 100.0% |
School Enrollment by Age by Funding Source in Punxsutawney borough
Out of a total of 1,070 students who are enrolled in schools in Punxsutawney borough, 86 (8.0%) attend a private institution, while the remaining 984 (92.0%) are enrolled in public schools. The age group of 20 to 24 year olds has the highest likelihood of being enrolled in private schools, with 34 (53.1% in the age bracket) enrolled. Conversely, the age group of 3 to 4 year olds has the lowest likelihood of being enrolled in a private school, with 69 (100.0% in the age bracket) attending a public institution.
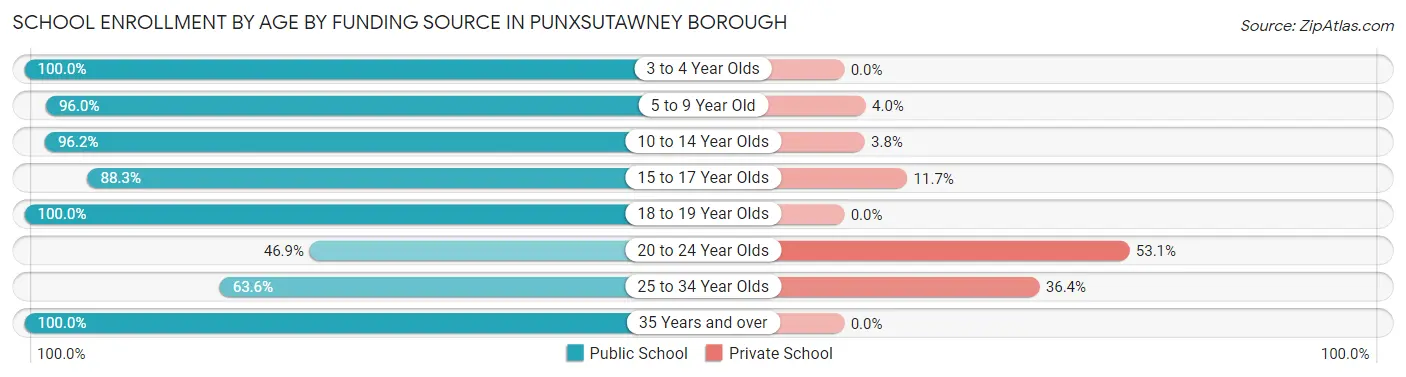
| Age Bracket | Public School | Private School |
| 3 to 4 Year Olds | 69 (100.0%) | 0 (0.0%) |
| 5 to 9 Year Old | 313 (96.0%) | 13 (4.0%) |
| 10 to 14 Year Olds | 304 (96.2%) | 12 (3.8%) |
| 15 to 17 Year Olds | 143 (88.3%) | 19 (11.7%) |
| 18 to 19 Year Olds | 95 (100.0%) | 0 (0.0%) |
| 20 to 24 Year Olds | 30 (46.9%) | 34 (53.1%) |
| 25 to 34 Year Olds | 14 (63.6%) | 8 (36.4%) |
| 35 Years and over | 16 (100.0%) | 0 (0.0%) |
| Total | 984 (92.0%) | 86 (8.0%) |
Educational Attainment by Field of Study in Punxsutawney borough
Education (256 | 28.9%), business (192 | 21.6%), science & technology (102 | 11.5%), social sciences (64 | 7.2%), and liberal arts & history (59 | 6.7%) are the most common fields of study among 887 individuals in Punxsutawney borough who have obtained a bachelor's degree or higher.
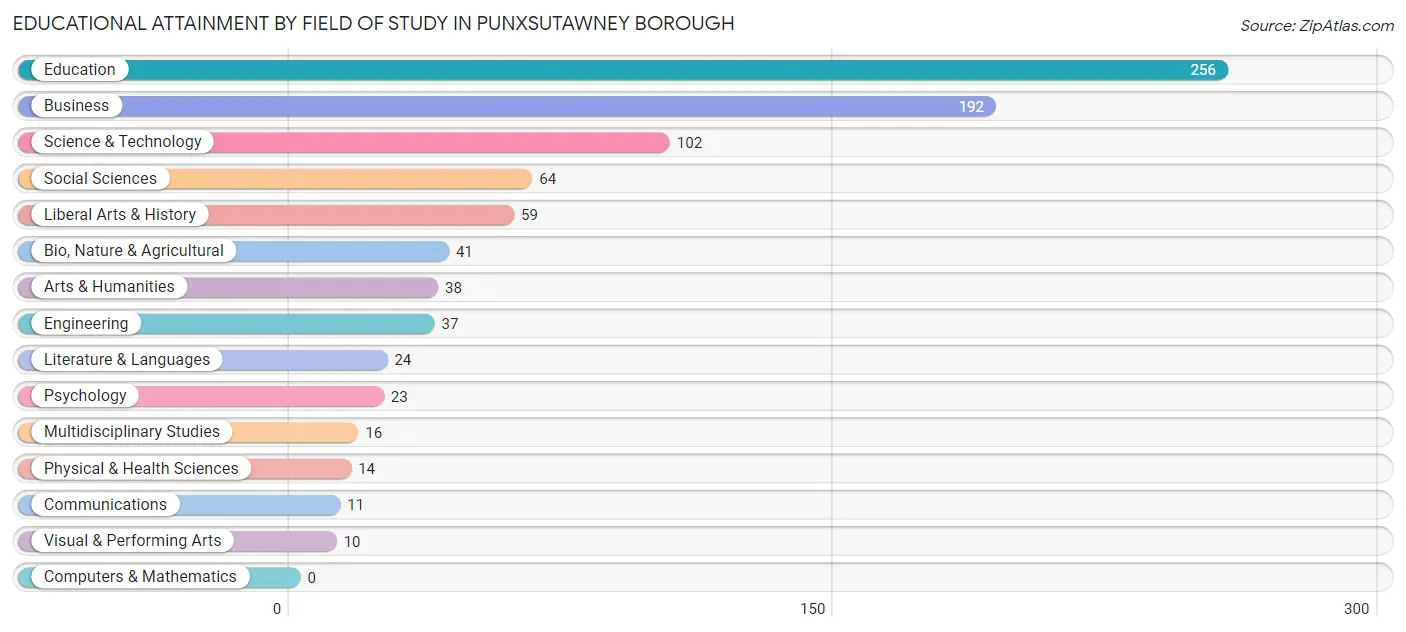
| Field of Study | # Graduates | % Graduates |
| Computers & Mathematics | 0 | 0.0% |
| Bio, Nature & Agricultural | 41 | 4.6% |
| Physical & Health Sciences | 14 | 1.6% |
| Psychology | 23 | 2.6% |
| Social Sciences | 64 | 7.2% |
| Engineering | 37 | 4.2% |
| Multidisciplinary Studies | 16 | 1.8% |
| Science & Technology | 102 | 11.5% |
| Business | 192 | 21.6% |
| Education | 256 | 28.9% |
| Literature & Languages | 24 | 2.7% |
| Liberal Arts & History | 59 | 6.7% |
| Visual & Performing Arts | 10 | 1.1% |
| Communications | 11 | 1.2% |
| Arts & Humanities | 38 | 4.3% |
| Total | 887 | 100.0% |
Transportation & Commute in Punxsutawney borough
Vehicle Availability by Sex in Punxsutawney borough
The most prevalent vehicle ownership categories in Punxsutawney borough are males with 2 vehicles (544, accounting for 40.2%) and females with 2 vehicles (470, making up 54.2%).
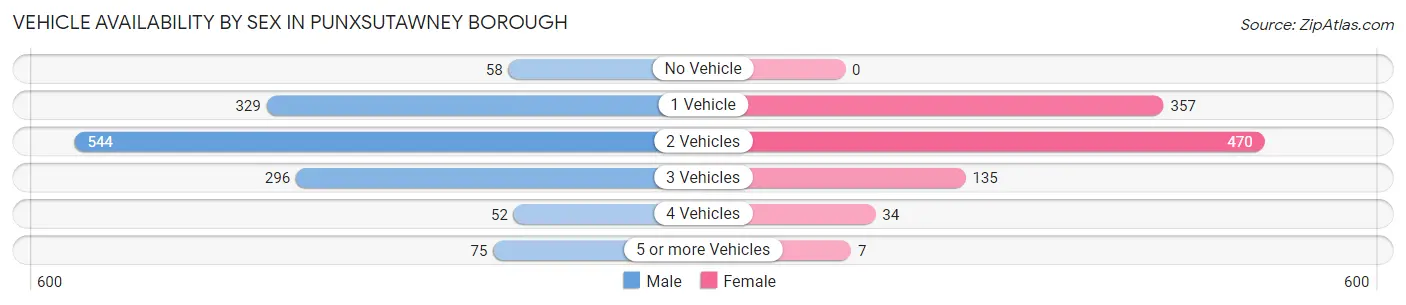
| Vehicles Available | Male | Female |
| No Vehicle | 58 (4.3%) | 0 (0.0%) |
| 1 Vehicle | 329 (24.3%) | 357 (35.6%) |
| 2 Vehicles | 544 (40.2%) | 470 (46.9%) |
| 3 Vehicles | 296 (21.9%) | 135 (13.5%) |
| 4 Vehicles | 52 (3.8%) | 34 (3.4%) |
| 5 or more Vehicles | 75 (5.5%) | 7 (0.7%) |
| Total | 1,354 (100.0%) | 1,003 (100.0%) |
Commute Time in Punxsutawney borough
The most frequently occuring commute durations in Punxsutawney borough are 5 to 9 minutes (668 commuters, 28.7%), 30 to 34 minutes (286 commuters, 12.3%), and 45 to 59 minutes (271 commuters, 11.6%).
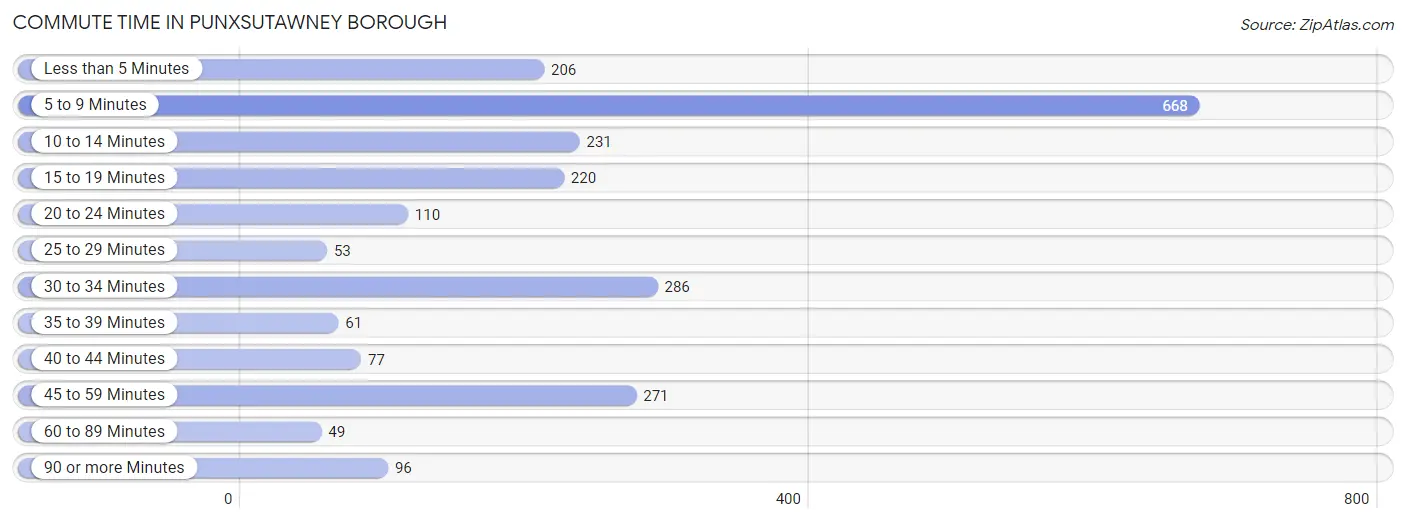
| Commute Time | # Commuters | % Commuters |
| Less than 5 Minutes | 206 | 8.8% |
| 5 to 9 Minutes | 668 | 28.7% |
| 10 to 14 Minutes | 231 | 9.9% |
| 15 to 19 Minutes | 220 | 9.5% |
| 20 to 24 Minutes | 110 | 4.7% |
| 25 to 29 Minutes | 53 | 2.3% |
| 30 to 34 Minutes | 286 | 12.3% |
| 35 to 39 Minutes | 61 | 2.6% |
| 40 to 44 Minutes | 77 | 3.3% |
| 45 to 59 Minutes | 271 | 11.6% |
| 60 to 89 Minutes | 49 | 2.1% |
| 90 or more Minutes | 96 | 4.1% |
Commute Time by Sex in Punxsutawney borough
The most common commute times in Punxsutawney borough are 5 to 9 minutes (345 commuters, 26.1%) for males and 5 to 9 minutes (323 commuters, 32.2%) for females.
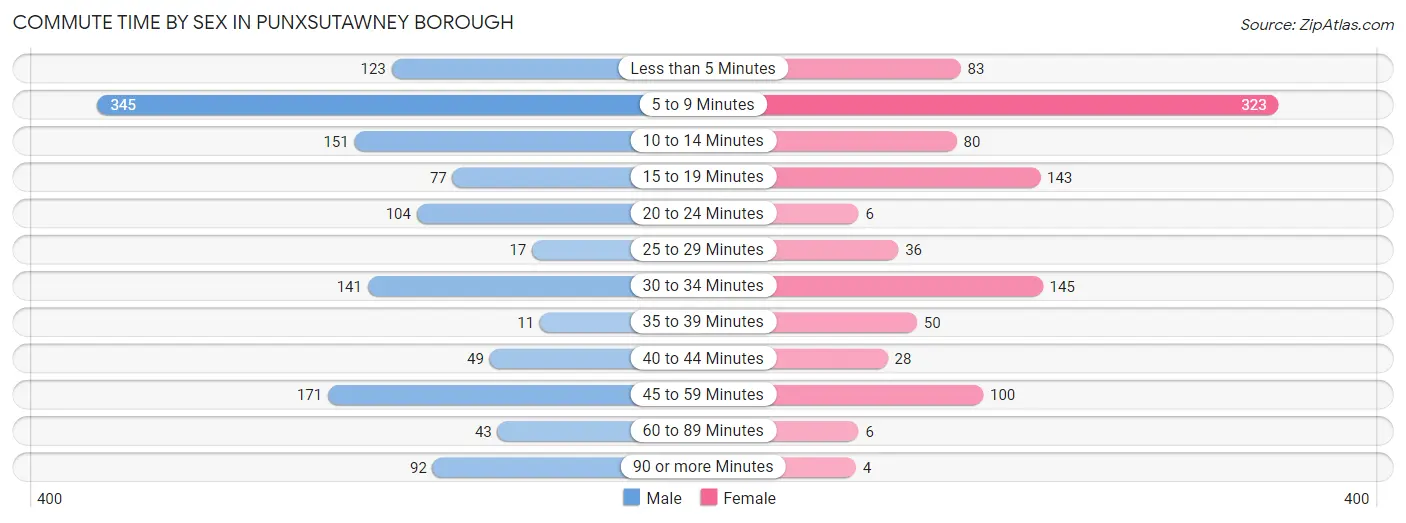
| Commute Time | Male | Female |
| Less than 5 Minutes | 123 (9.3%) | 83 (8.3%) |
| 5 to 9 Minutes | 345 (26.1%) | 323 (32.2%) |
| 10 to 14 Minutes | 151 (11.4%) | 80 (8.0%) |
| 15 to 19 Minutes | 77 (5.8%) | 143 (14.2%) |
| 20 to 24 Minutes | 104 (7.9%) | 6 (0.6%) |
| 25 to 29 Minutes | 17 (1.3%) | 36 (3.6%) |
| 30 to 34 Minutes | 141 (10.6%) | 145 (14.4%) |
| 35 to 39 Minutes | 11 (0.8%) | 50 (5.0%) |
| 40 to 44 Minutes | 49 (3.7%) | 28 (2.8%) |
| 45 to 59 Minutes | 171 (12.9%) | 100 (10.0%) |
| 60 to 89 Minutes | 43 (3.3%) | 6 (0.6%) |
| 90 or more Minutes | 92 (7.0%) | 4 (0.4%) |
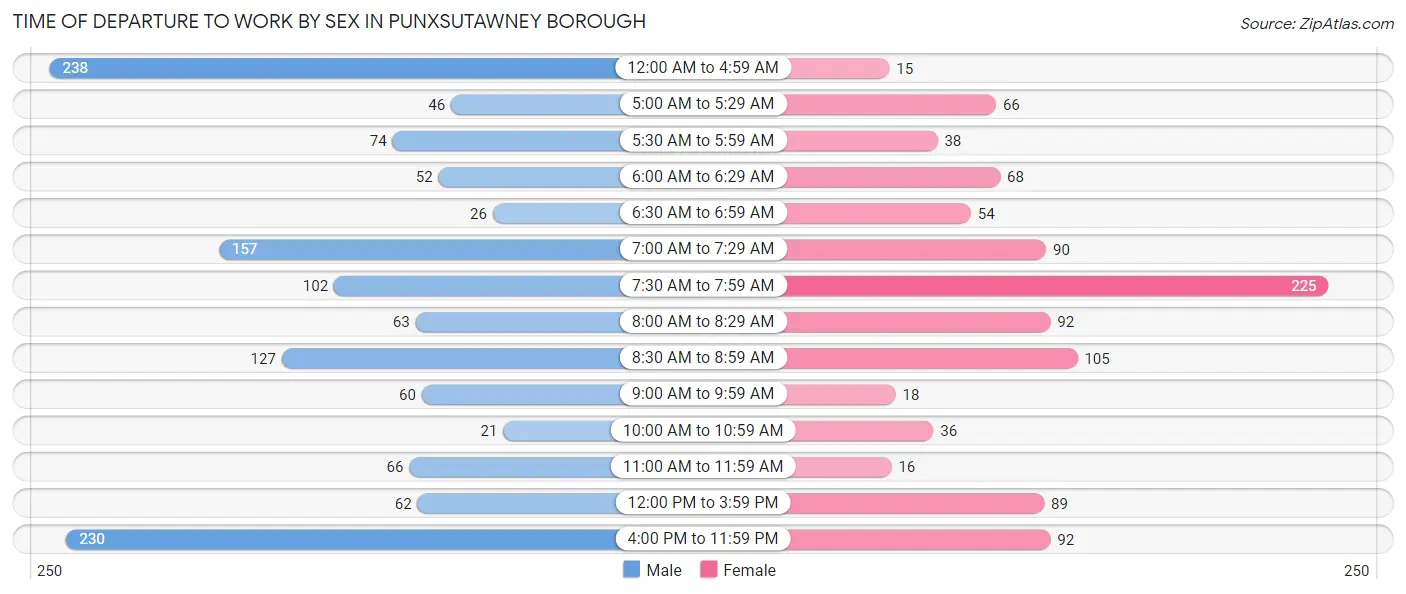
Time of Departure to Work by Sex in Punxsutawney borough
The most frequent times of departure to work in Punxsutawney borough are 12:00 AM to 4:59 AM (238, 18.0%) for males and 7:30 AM to 7:59 AM (225, 22.4%) for females.
| Time of Departure | Male | Female |
| 12:00 AM to 4:59 AM | 238 (18.0%) | 15 (1.5%) |
| 5:00 AM to 5:29 AM | 46 (3.5%) | 66 (6.6%) |
| 5:30 AM to 5:59 AM | 74 (5.6%) | 38 (3.8%) |
| 6:00 AM to 6:29 AM | 52 (3.9%) | 68 (6.8%) |
| 6:30 AM to 6:59 AM | 26 (2.0%) | 54 (5.4%) |
| 7:00 AM to 7:29 AM | 157 (11.9%) | 90 (9.0%) |
| 7:30 AM to 7:59 AM | 102 (7.7%) | 225 (22.4%) |
| 8:00 AM to 8:29 AM | 63 (4.8%) | 92 (9.2%) |
| 8:30 AM to 8:59 AM | 127 (9.6%) | 105 (10.5%) |
| 9:00 AM to 9:59 AM | 60 (4.5%) | 18 (1.8%) |
| 10:00 AM to 10:59 AM | 21 (1.6%) | 36 (3.6%) |
| 11:00 AM to 11:59 AM | 66 (5.0%) | 16 (1.6%) |
| 12:00 PM to 3:59 PM | 62 (4.7%) | 89 (8.9%) |
| 4:00 PM to 11:59 PM | 230 (17.4%) | 92 (9.2%) |
| Total | 1,324 (100.0%) | 1,004 (100.0%) |
Housing Occupancy in Punxsutawney borough
Occupancy by Ownership in Punxsutawney borough
Of the total 2,578 dwellings in Punxsutawney borough, owner-occupied units account for 1,463 (56.8%), while renter-occupied units make up 1,115 (43.2%).
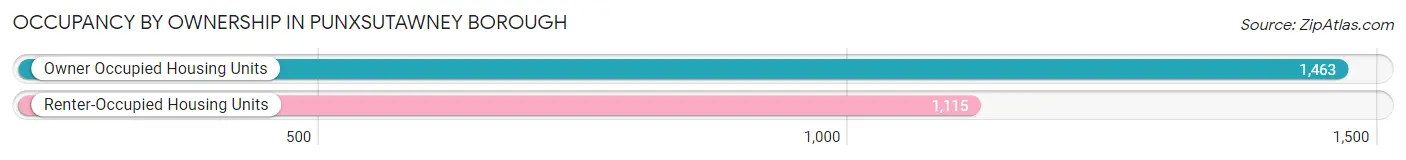
| Occupancy | # Housing Units | % Housing Units |
| Owner Occupied Housing Units | 1,463 | 56.8% |
| Renter-Occupied Housing Units | 1,115 | 43.2% |
| Total Occupied Housing Units | 2,578 | 100.0% |
Occupancy by Household Size in Punxsutawney borough
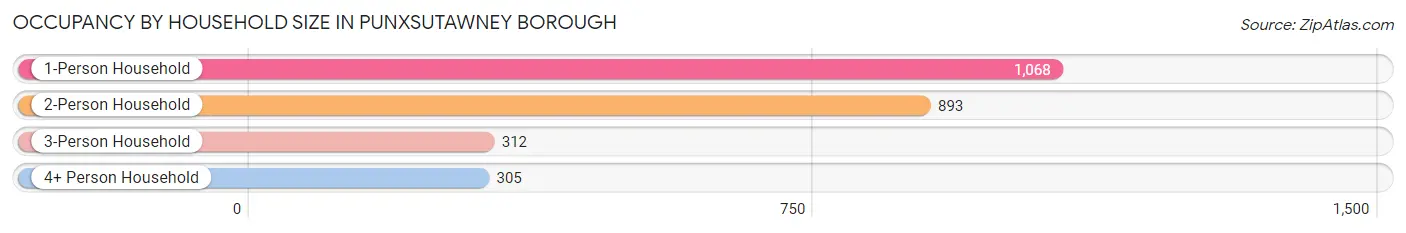
| Household Size | # Housing Units | % Housing Units |
| 1-Person Household | 1,068 | 41.4% |
| 2-Person Household | 893 | 34.6% |
| 3-Person Household | 312 | 12.1% |
| 4+ Person Household | 305 | 11.8% |
| Total Housing Units | 2,578 | 100.0% |
Occupancy by Ownership by Household Size in Punxsutawney borough
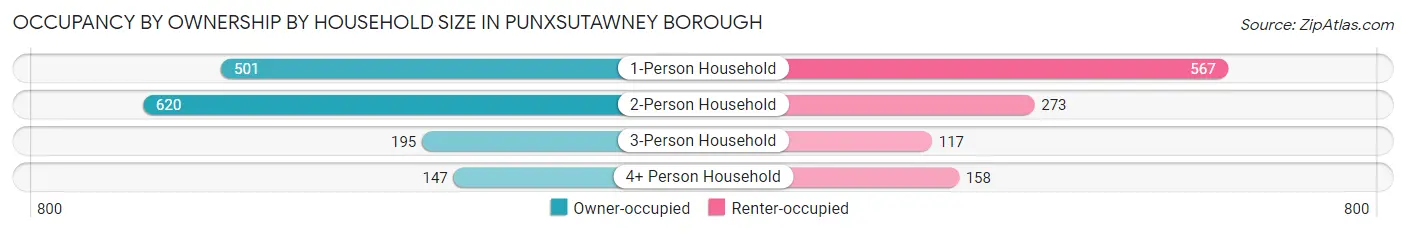
| Household Size | Owner-occupied | Renter-occupied |
| 1-Person Household | 501 (46.9%) | 567 (53.1%) |
| 2-Person Household | 620 (69.4%) | 273 (30.6%) |
| 3-Person Household | 195 (62.5%) | 117 (37.5%) |
| 4+ Person Household | 147 (48.2%) | 158 (51.8%) |
| Total Housing Units | 1,463 (56.8%) | 1,115 (43.2%) |
Occupancy by Educational Attainment in Punxsutawney borough
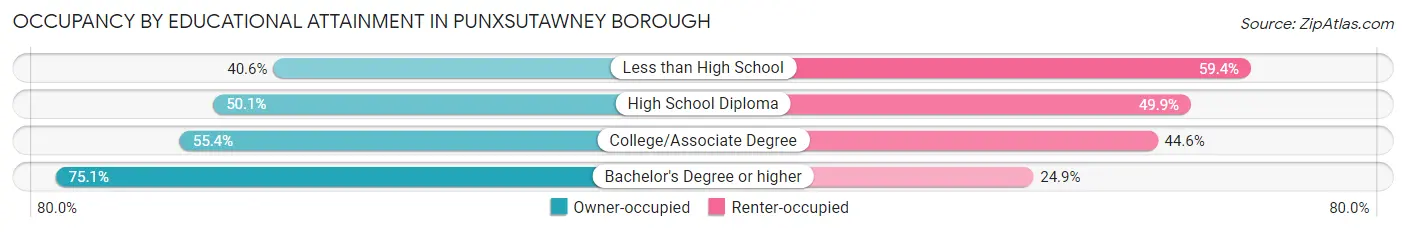
| Household Size | Owner-occupied | Renter-occupied |
| Less than High School | 58 (40.6%) | 85 (59.4%) |
| High School Diploma | 609 (50.1%) | 607 (49.9%) |
| College/Associate Degree | 335 (55.4%) | 270 (44.6%) |
| Bachelor's Degree or higher | 461 (75.1%) | 153 (24.9%) |
Occupancy by Age of Householder in Punxsutawney borough
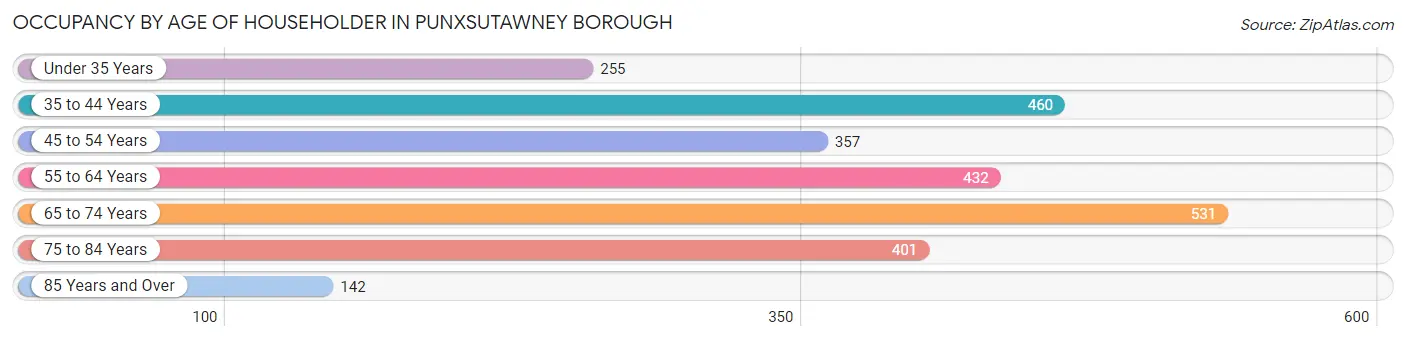
| Age Bracket | # Households | % Households |
| Under 35 Years | 255 | 9.9% |
| 35 to 44 Years | 460 | 17.8% |
| 45 to 54 Years | 357 | 13.9% |
| 55 to 64 Years | 432 | 16.8% |
| 65 to 74 Years | 531 | 20.6% |
| 75 to 84 Years | 401 | 15.5% |
| 85 Years and Over | 142 | 5.5% |
| Total | 2,578 | 100.0% |
Housing Finances in Punxsutawney borough
Median Income by Occupancy in Punxsutawney borough
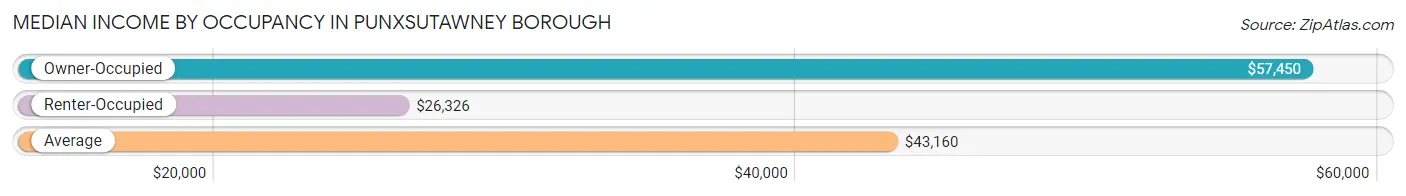
| Occupancy Type | # Households | Median Income |
| Owner-Occupied | 1,463 (56.8%) | $57,450 |
| Renter-Occupied | 1,115 (43.2%) | $26,326 |
| Average | 2,578 (100.0%) | $43,160 |
Occupancy by Householder Income Bracket in Punxsutawney borough
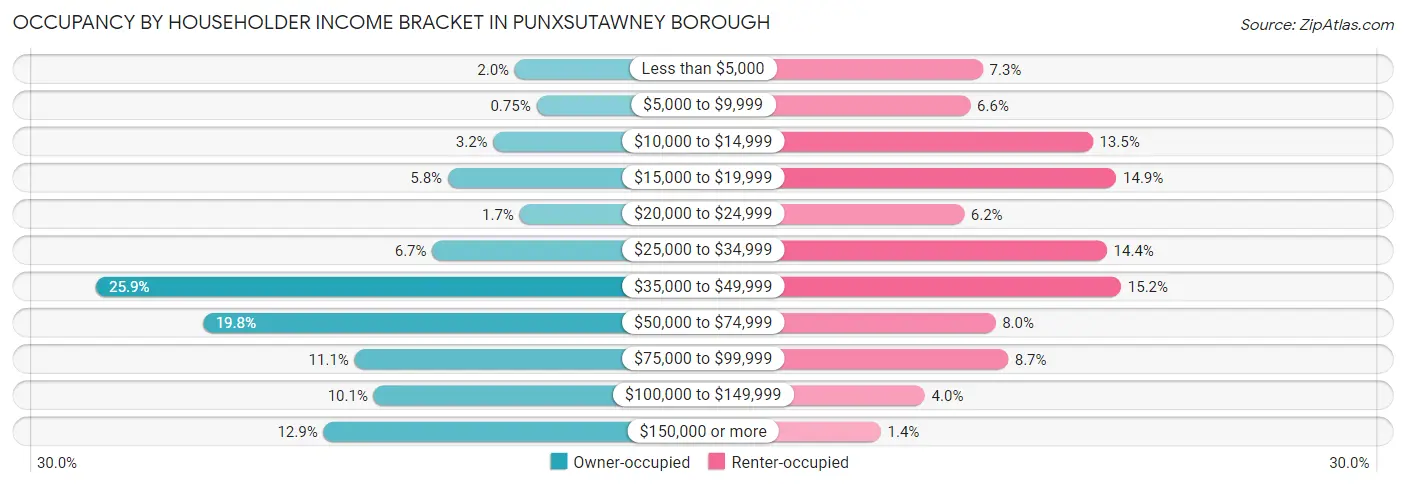
| Income Bracket | Owner-occupied | Renter-occupied |
| Less than $5,000 | 29 (2.0%) | 81 (7.3%) |
| $5,000 to $9,999 | 11 (0.7%) | 73 (6.6%) |
| $10,000 to $14,999 | 47 (3.2%) | 151 (13.5%) |
| $15,000 to $19,999 | 85 (5.8%) | 166 (14.9%) |
| $20,000 to $24,999 | 25 (1.7%) | 69 (6.2%) |
| $25,000 to $34,999 | 98 (6.7%) | 160 (14.3%) |
| $35,000 to $49,999 | 379 (25.9%) | 169 (15.2%) |
| $50,000 to $74,999 | 290 (19.8%) | 89 (8.0%) |
| $75,000 to $99,999 | 163 (11.1%) | 97 (8.7%) |
| $100,000 to $149,999 | 147 (10.1%) | 44 (4.0%) |
| $150,000 or more | 189 (12.9%) | 16 (1.4%) |
| Total | 1,463 (100.0%) | 1,115 (100.0%) |
Monthly Housing Cost Tiers in Punxsutawney borough
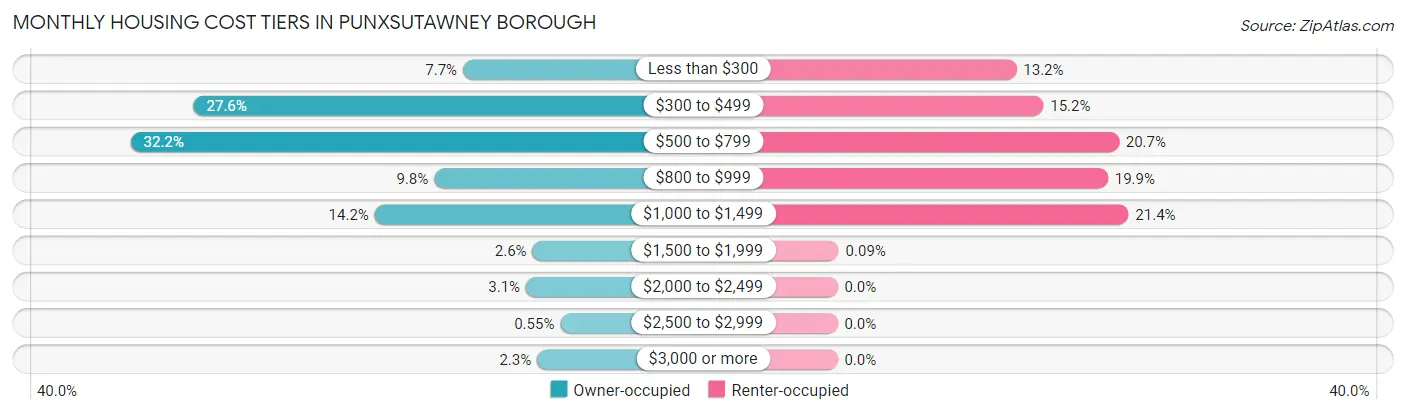
| Monthly Cost | Owner-occupied | Renter-occupied |
| Less than $300 | 113 (7.7%) | 147 (13.2%) |
| $300 to $499 | 403 (27.6%) | 169 (15.2%) |
| $500 to $799 | 471 (32.2%) | 231 (20.7%) |
| $800 to $999 | 144 (9.8%) | 222 (19.9%) |
| $1,000 to $1,499 | 208 (14.2%) | 239 (21.4%) |
| $1,500 to $1,999 | 38 (2.6%) | 1 (0.1%) |
| $2,000 to $2,499 | 45 (3.1%) | 0 (0.0%) |
| $2,500 to $2,999 | 8 (0.5%) | 0 (0.0%) |
| $3,000 or more | 33 (2.3%) | 0 (0.0%) |
| Total | 1,463 (100.0%) | 1,115 (100.0%) |
Physical Housing Characteristics in Punxsutawney borough
Housing Structures in Punxsutawney borough
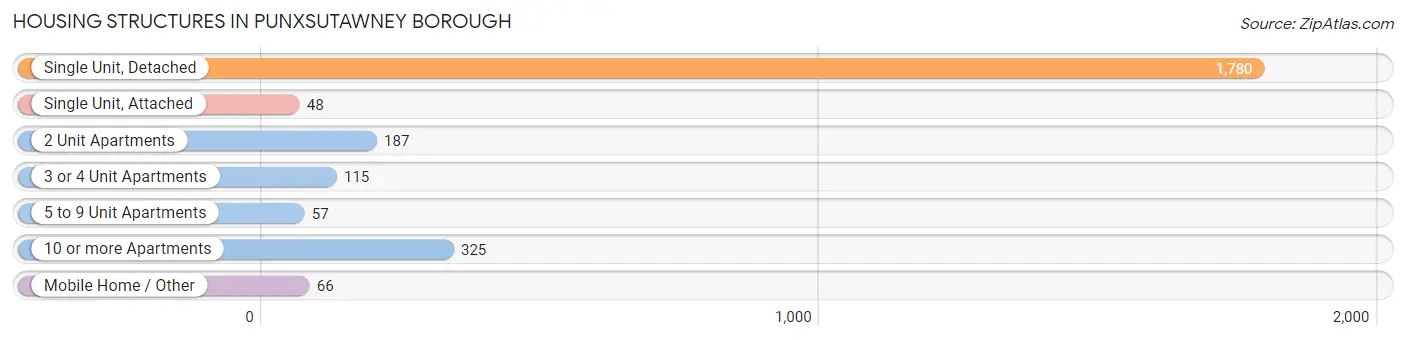
| Structure Type | # Housing Units | % Housing Units |
| Single Unit, Detached | 1,780 | 69.1% |
| Single Unit, Attached | 48 | 1.9% |
| 2 Unit Apartments | 187 | 7.2% |
| 3 or 4 Unit Apartments | 115 | 4.5% |
| 5 to 9 Unit Apartments | 57 | 2.2% |
| 10 or more Apartments | 325 | 12.6% |
| Mobile Home / Other | 66 | 2.6% |
| Total | 2,578 | 100.0% |
Housing Structures by Occupancy in Punxsutawney borough
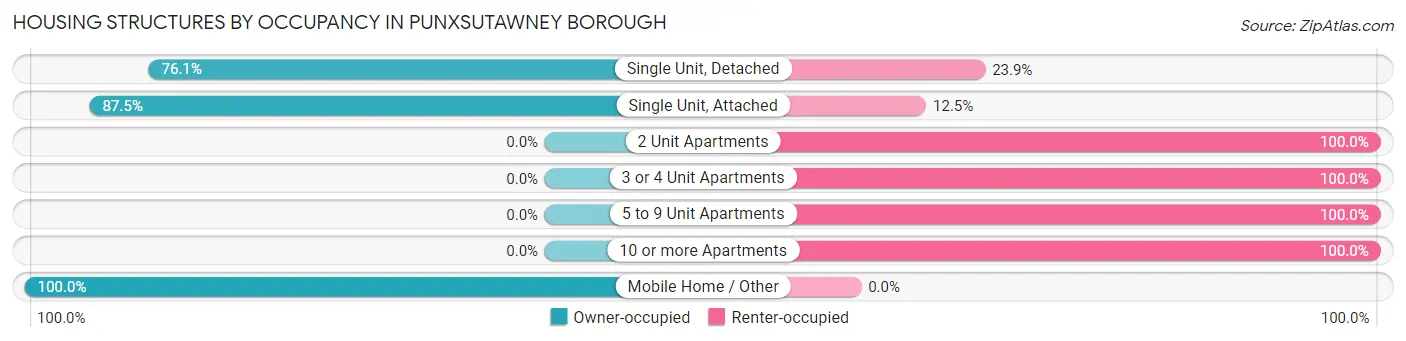
| Structure Type | Owner-occupied | Renter-occupied |
| Single Unit, Detached | 1,355 (76.1%) | 425 (23.9%) |
| Single Unit, Attached | 42 (87.5%) | 6 (12.5%) |
| 2 Unit Apartments | 0 (0.0%) | 187 (100.0%) |
| 3 or 4 Unit Apartments | 0 (0.0%) | 115 (100.0%) |
| 5 to 9 Unit Apartments | 0 (0.0%) | 57 (100.0%) |
| 10 or more Apartments | 0 (0.0%) | 325 (100.0%) |
| Mobile Home / Other | 66 (100.0%) | 0 (0.0%) |
| Total | 1,463 (56.8%) | 1,115 (43.2%) |
Housing Structures by Number of Rooms in Punxsutawney borough
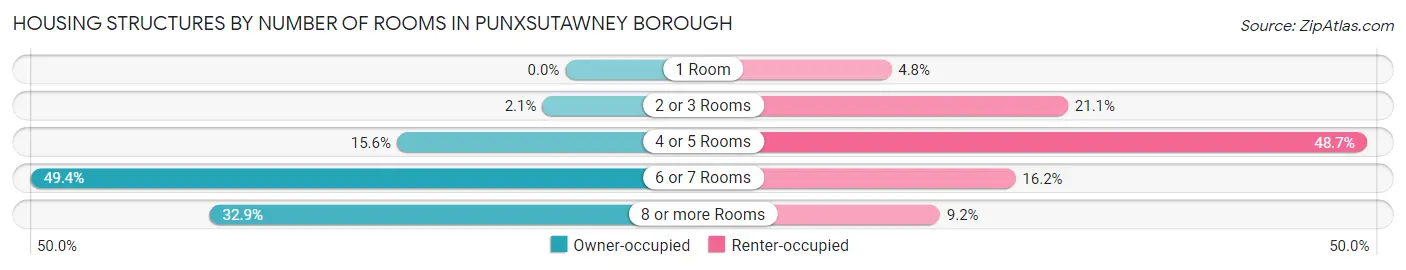
| Number of Rooms | Owner-occupied | Renter-occupied |
| 1 Room | 0 (0.0%) | 53 (4.8%) |
| 2 or 3 Rooms | 31 (2.1%) | 235 (21.1%) |
| 4 or 5 Rooms | 228 (15.6%) | 543 (48.7%) |
| 6 or 7 Rooms | 723 (49.4%) | 181 (16.2%) |
| 8 or more Rooms | 481 (32.9%) | 103 (9.2%) |
| Total | 1,463 (100.0%) | 1,115 (100.0%) |
Housing Structure by Heating Type in Punxsutawney borough
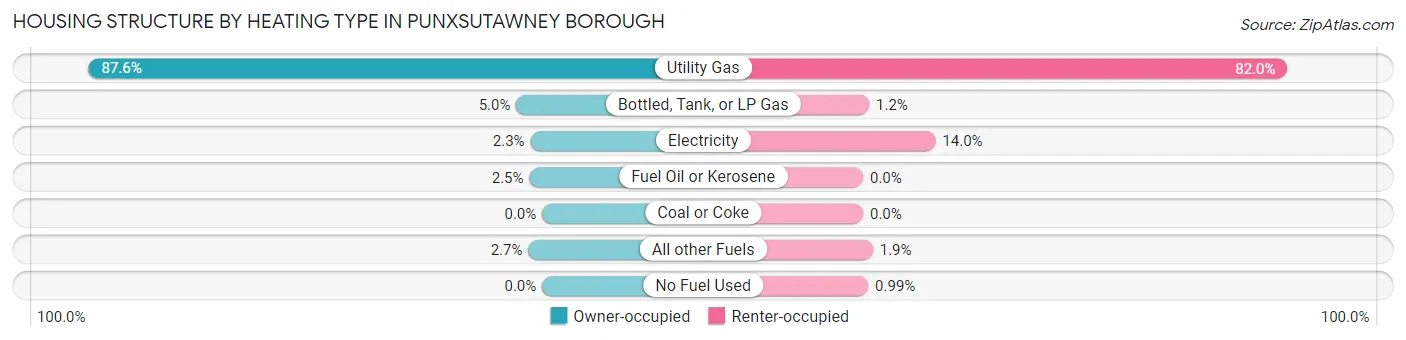
| Heating Type | Owner-occupied | Renter-occupied |
| Utility Gas | 1,282 (87.6%) | 914 (82.0%) |
| Bottled, Tank, or LP Gas | 73 (5.0%) | 13 (1.2%) |
| Electricity | 33 (2.3%) | 156 (14.0%) |
| Fuel Oil or Kerosene | 36 (2.5%) | 0 (0.0%) |
| Coal or Coke | 0 (0.0%) | 0 (0.0%) |
| All other Fuels | 39 (2.7%) | 21 (1.9%) |
| No Fuel Used | 0 (0.0%) | 11 (1.0%) |
| Total | 1,463 (100.0%) | 1,115 (100.0%) |
Household Vehicle Usage in Punxsutawney borough
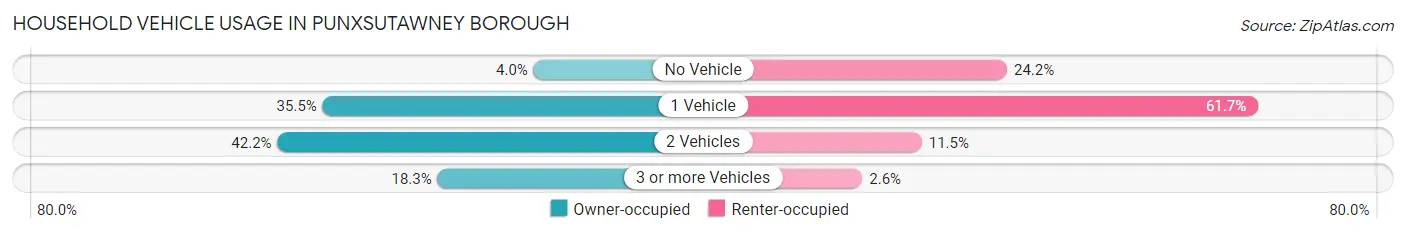
| Vehicles per Household | Owner-occupied | Renter-occupied |
| No Vehicle | 58 (4.0%) | 270 (24.2%) |
| 1 Vehicle | 519 (35.5%) | 688 (61.7%) |
| 2 Vehicles | 618 (42.2%) | 128 (11.5%) |
| 3 or more Vehicles | 268 (18.3%) | 29 (2.6%) |
| Total | 1,463 (100.0%) | 1,115 (100.0%) |
Real Estate & Mortgages in Punxsutawney borough
Real Estate and Mortgage Overview in Punxsutawney borough
| Characteristic | Without Mortgage | With Mortgage |
| Housing Units | 904 | 559 |
| Median Property Value | $86,800 | $121,400 |
| Median Household Income | $47,014 | $96 |
| Monthly Housing Costs | $463 | $33 |
| Real Estate Taxes | $950 | $0 |
Property Value by Mortgage Status in Punxsutawney borough
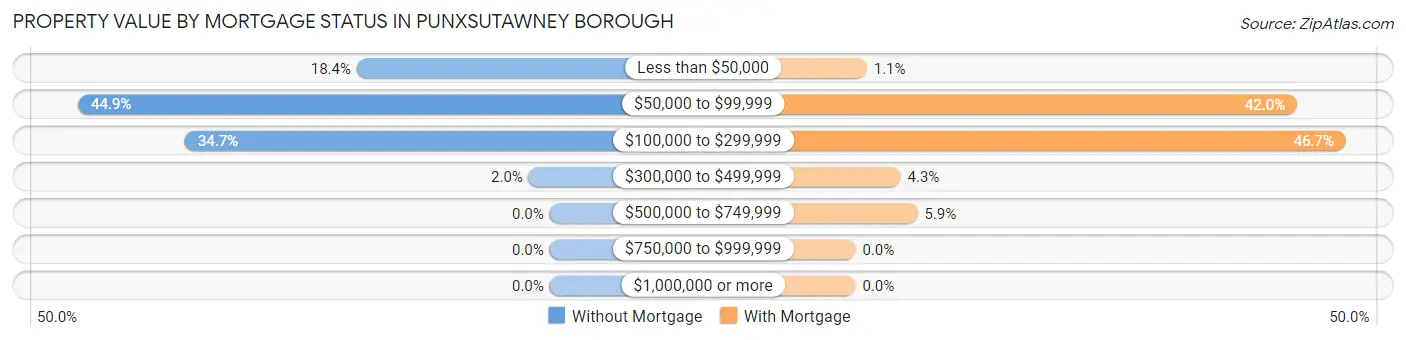
| Property Value | Without Mortgage | With Mortgage |
| Less than $50,000 | 166 (18.4%) | 6 (1.1%) |
| $50,000 to $99,999 | 406 (44.9%) | 235 (42.0%) |
| $100,000 to $299,999 | 314 (34.7%) | 261 (46.7%) |
| $300,000 to $499,999 | 18 (2.0%) | 24 (4.3%) |
| $500,000 to $749,999 | 0 (0.0%) | 33 (5.9%) |
| $750,000 to $999,999 | 0 (0.0%) | 0 (0.0%) |
| $1,000,000 or more | 0 (0.0%) | 0 (0.0%) |
| Total | 904 (100.0%) | 559 (100.0%) |
Household Income by Mortgage Status in Punxsutawney borough
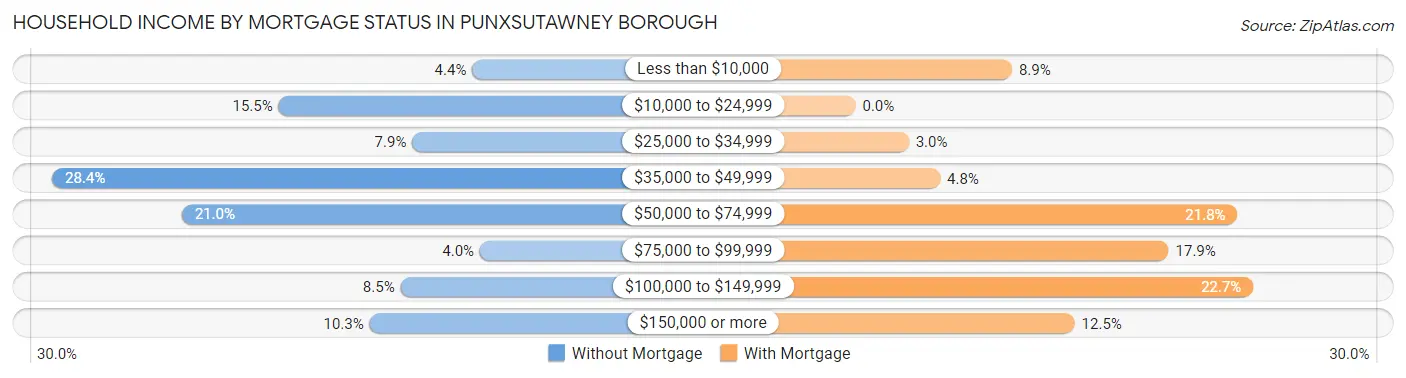
| Household Income | Without Mortgage | With Mortgage |
| Less than $10,000 | 40 (4.4%) | 50 (8.9%) |
| $10,000 to $24,999 | 140 (15.5%) | 0 (0.0%) |
| $25,000 to $34,999 | 71 (7.9%) | 17 (3.0%) |
| $35,000 to $49,999 | 257 (28.4%) | 27 (4.8%) |
| $50,000 to $74,999 | 190 (21.0%) | 122 (21.8%) |
| $75,000 to $99,999 | 36 (4.0%) | 100 (17.9%) |
| $100,000 to $149,999 | 77 (8.5%) | 127 (22.7%) |
| $150,000 or more | 93 (10.3%) | 70 (12.5%) |
| Total | 904 (100.0%) | 559 (100.0%) |
Property Value to Household Income Ratio in Punxsutawney borough
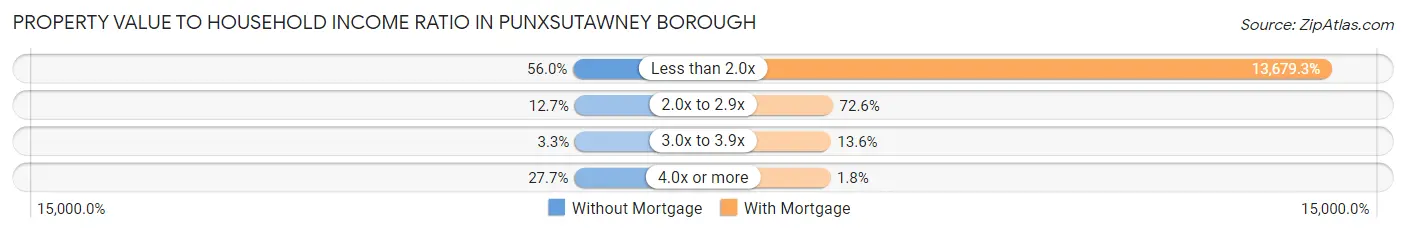
| Value-to-Income Ratio | Without Mortgage | With Mortgage |
| Less than 2.0x | 506 (56.0%) | 76,467 (13,679.2%) |
| 2.0x to 2.9x | 115 (12.7%) | 406 (72.6%) |
| 3.0x to 3.9x | 30 (3.3%) | 76 (13.6%) |
| 4.0x or more | 250 (27.7%) | 10 (1.8%) |
| Total | 904 (100.0%) | 559 (100.0%) |
Real Estate Taxes by Mortgage Status in Punxsutawney borough
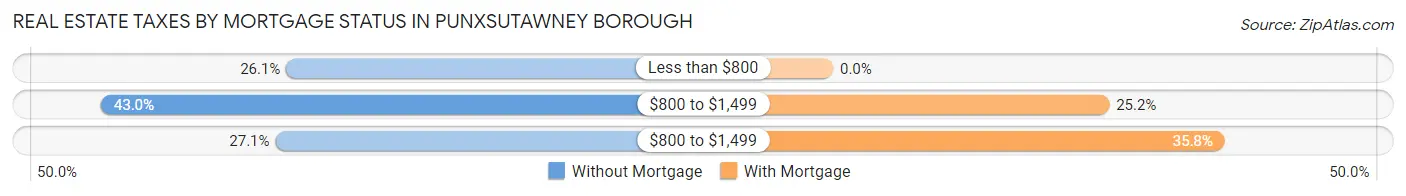
| Property Taxes | Without Mortgage | With Mortgage |
| Less than $800 | 236 (26.1%) | 0 (0.0%) |
| $800 to $1,499 | 389 (43.0%) | 141 (25.2%) |
| $800 to $1,499 | 245 (27.1%) | 200 (35.8%) |
| Total | 904 (100.0%) | 559 (100.0%) |
Health & Disability in Punxsutawney borough
Health Insurance Coverage by Age in Punxsutawney borough
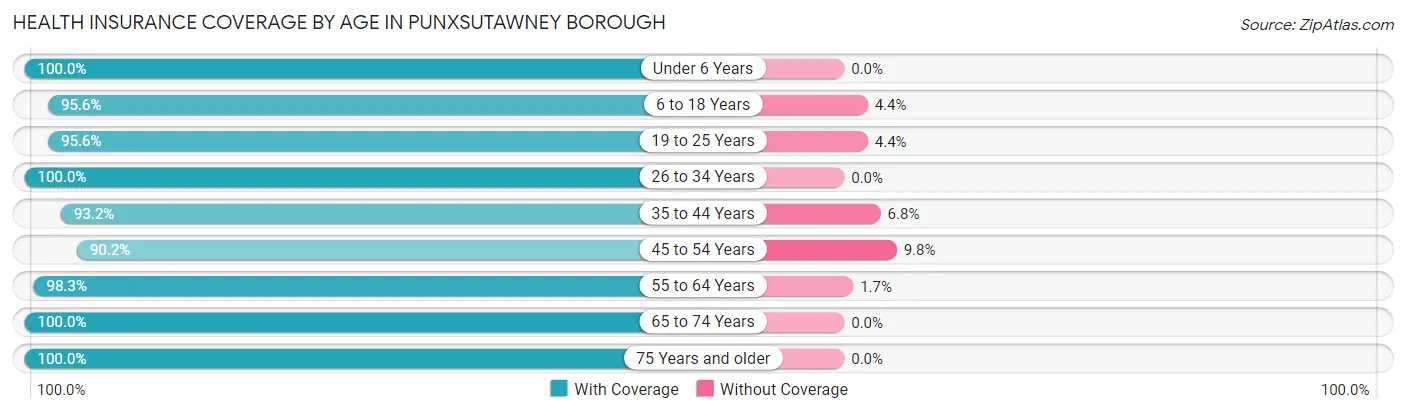
| Age Bracket | With Coverage | Without Coverage |
| Under 6 Years | 326 (100.0%) | 0 (0.0%) |
| 6 to 18 Years | 787 (95.6%) | 36 (4.4%) |
| 19 to 25 Years | 545 (95.6%) | 25 (4.4%) |
| 26 to 34 Years | 388 (100.0%) | 0 (0.0%) |
| 35 to 44 Years | 646 (93.2%) | 47 (6.8%) |
| 45 to 54 Years | 554 (90.2%) | 60 (9.8%) |
| 55 to 64 Years | 764 (98.3%) | 13 (1.7%) |
| 65 to 74 Years | 778 (100.0%) | 0 (0.0%) |
| 75 Years and older | 687 (100.0%) | 0 (0.0%) |
| Total | 5,475 (96.8%) | 181 (3.2%) |
Health Insurance Coverage by Citizenship Status in Punxsutawney borough
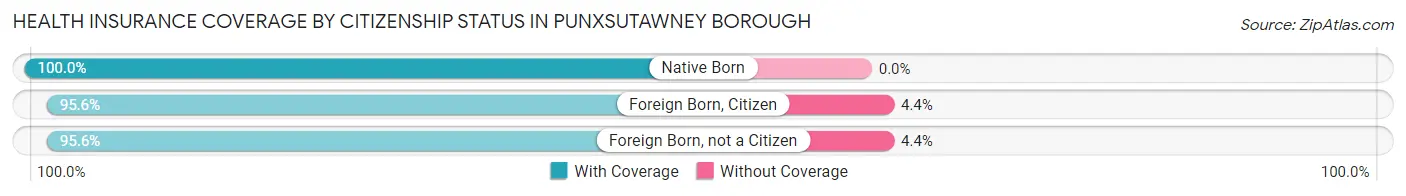
| Citizenship Status | With Coverage | Without Coverage |
| Native Born | 326 (100.0%) | 0 (0.0%) |
| Foreign Born, Citizen | 787 (95.6%) | 36 (4.4%) |
| Foreign Born, not a Citizen | 545 (95.6%) | 25 (4.4%) |
Health Insurance Coverage by Household Income in Punxsutawney borough
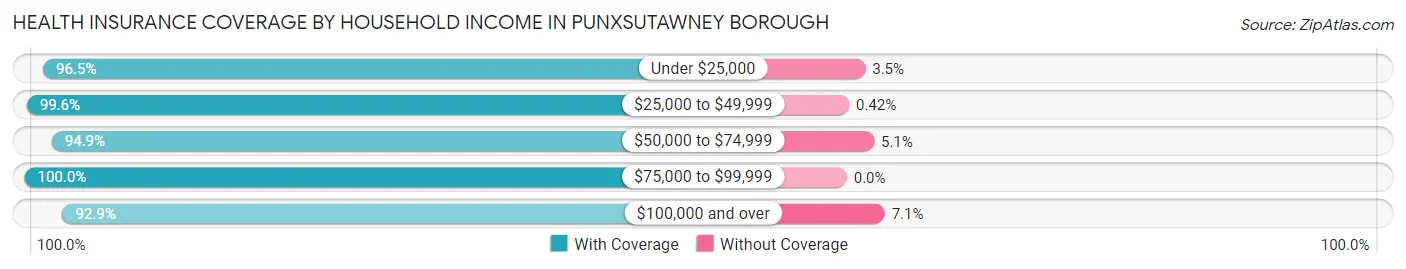
| Household Income | With Coverage | Without Coverage |
| Under $25,000 | 1,283 (96.5%) | 46 (3.5%) |
| $25,000 to $49,999 | 1,439 (99.6%) | 6 (0.4%) |
| $50,000 to $74,999 | 781 (94.9%) | 42 (5.1%) |
| $75,000 to $99,999 | 798 (100.0%) | 0 (0.0%) |
| $100,000 and over | 1,085 (92.9%) | 83 (7.1%) |
Public vs Private Health Insurance Coverage by Age in Punxsutawney borough
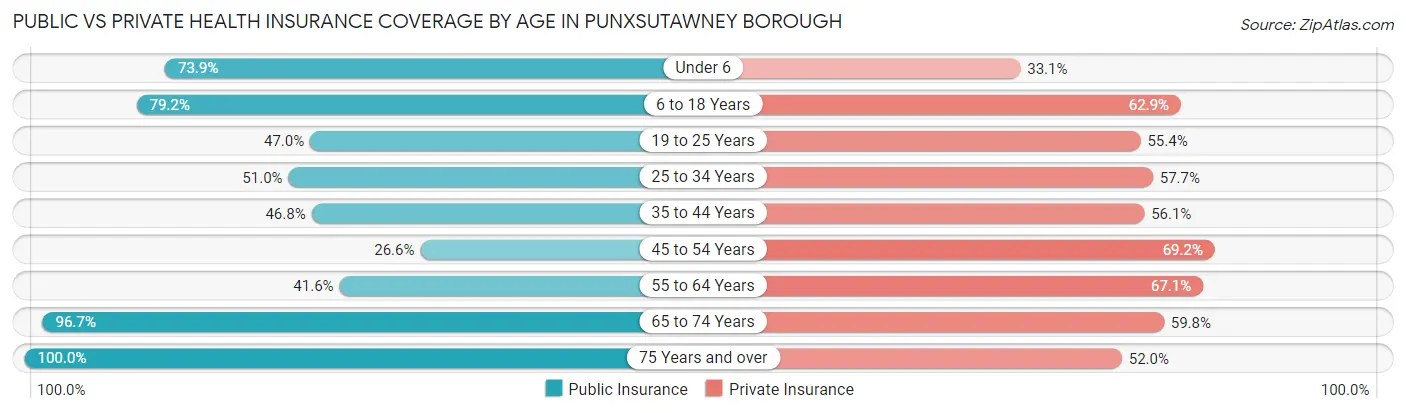
| Age Bracket | Public Insurance | Private Insurance |
| Under 6 | 241 (73.9%) | 108 (33.1%) |
| 6 to 18 Years | 652 (79.2%) | 518 (62.9%) |
| 19 to 25 Years | 268 (47.0%) | 316 (55.4%) |
| 25 to 34 Years | 198 (51.0%) | 224 (57.7%) |
| 35 to 44 Years | 324 (46.8%) | 389 (56.1%) |
| 45 to 54 Years | 163 (26.6%) | 425 (69.2%) |
| 55 to 64 Years | 323 (41.6%) | 521 (67.0%) |
| 65 to 74 Years | 752 (96.7%) | 465 (59.8%) |
| 75 Years and over | 687 (100.0%) | 357 (52.0%) |
| Total | 3,608 (63.8%) | 3,323 (58.8%) |
Disability Status by Sex by Age in Punxsutawney borough
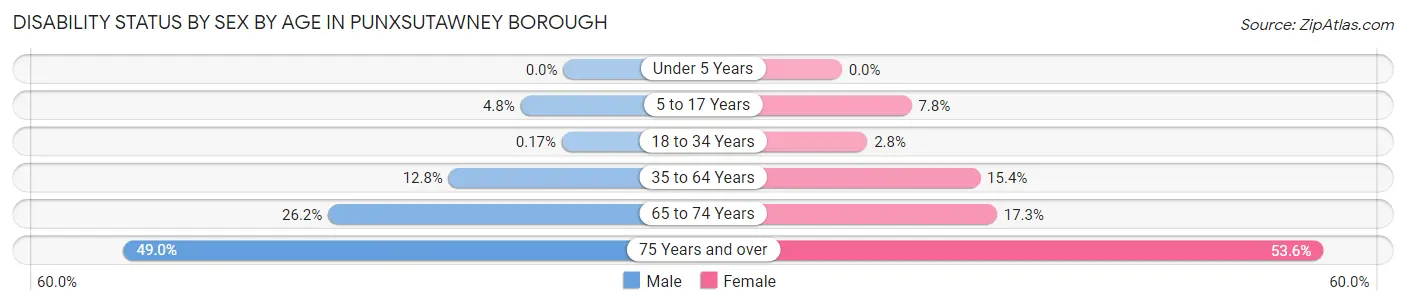
| Age Bracket | Male | Female |
| Under 5 Years | 0 (0.0%) | 0 (0.0%) |
| 5 to 17 Years | 24 (4.8%) | 25 (7.8%) |
| 18 to 34 Years | 1 (0.2%) | 12 (2.8%) |
| 35 to 64 Years | 131 (12.8%) | 163 (15.4%) |
| 65 to 74 Years | 87 (26.2%) | 77 (17.3%) |
| 75 Years and over | 119 (49.0%) | 238 (53.6%) |
Disability Class by Sex by Age in Punxsutawney borough
Disability Class: Hearing Difficulty
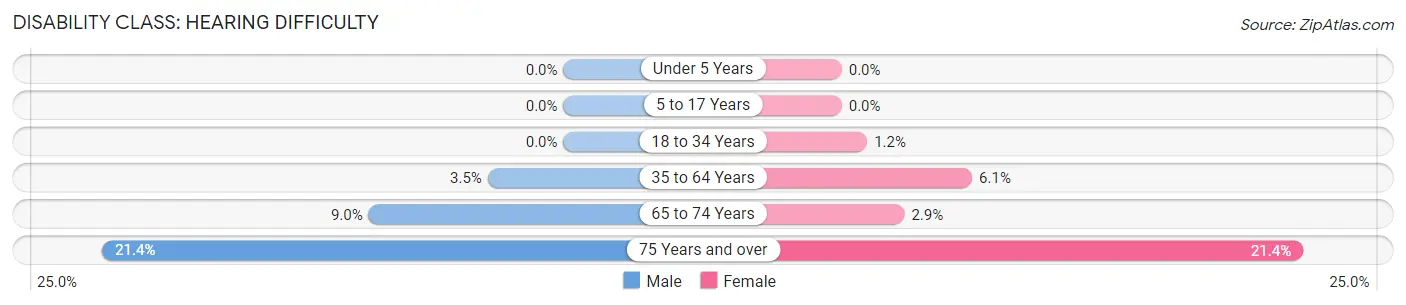
| Age Bracket | Male | Female |
| Under 5 Years | 0 (0.0%) | 0 (0.0%) |
| 5 to 17 Years | 0 (0.0%) | 0 (0.0%) |
| 18 to 34 Years | 0 (0.0%) | 5 (1.2%) |
| 35 to 64 Years | 36 (3.5%) | 64 (6.0%) |
| 65 to 74 Years | 30 (9.0%) | 13 (2.9%) |
| 75 Years and over | 52 (21.4%) | 95 (21.4%) |
Disability Class: Vision Difficulty
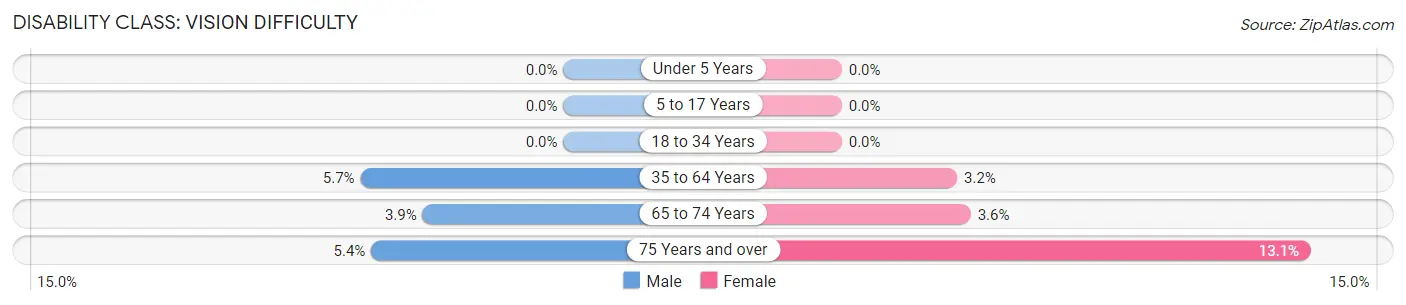
| Age Bracket | Male | Female |
| Under 5 Years | 0 (0.0%) | 0 (0.0%) |
| 5 to 17 Years | 0 (0.0%) | 0 (0.0%) |
| 18 to 34 Years | 0 (0.0%) | 0 (0.0%) |
| 35 to 64 Years | 58 (5.7%) | 34 (3.2%) |
| 65 to 74 Years | 13 (3.9%) | 16 (3.6%) |
| 75 Years and over | 13 (5.3%) | 58 (13.1%) |
Disability Class: Cognitive Difficulty
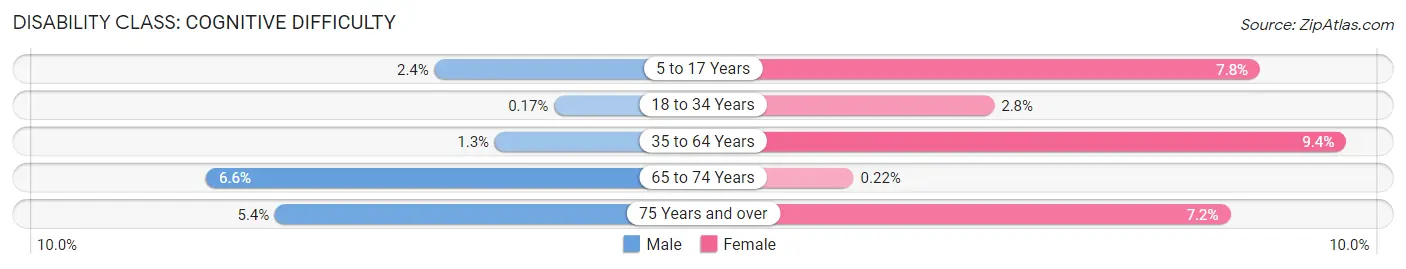
| Age Bracket | Male | Female |
| 5 to 17 Years | 12 (2.4%) | 25 (7.8%) |
| 18 to 34 Years | 1 (0.2%) | 12 (2.8%) |
| 35 to 64 Years | 13 (1.3%) | 99 (9.4%) |
| 65 to 74 Years | 22 (6.6%) | 1 (0.2%) |
| 75 Years and over | 13 (5.3%) | 32 (7.2%) |
Disability Class: Ambulatory Difficulty
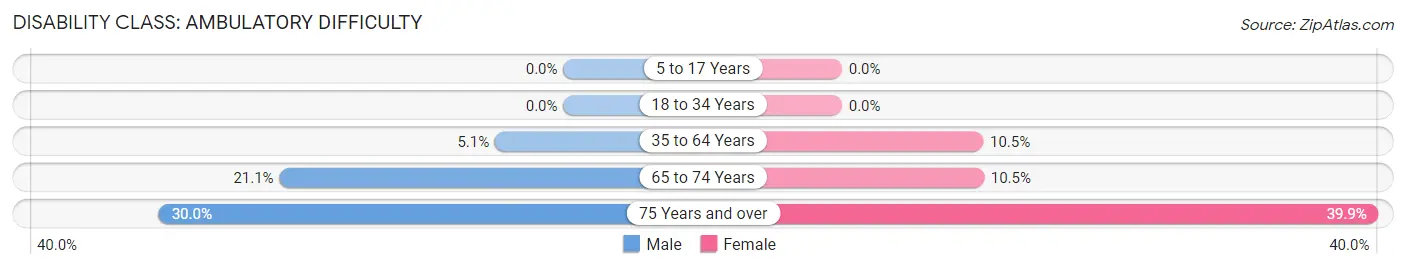
| Age Bracket | Male | Female |
| 5 to 17 Years | 0 (0.0%) | 0 (0.0%) |
| 18 to 34 Years | 0 (0.0%) | 0 (0.0%) |
| 35 to 64 Years | 52 (5.1%) | 111 (10.5%) |
| 65 to 74 Years | 70 (21.1%) | 47 (10.5%) |
| 75 Years and over | 73 (30.0%) | 177 (39.9%) |
Disability Class: Self-Care Difficulty
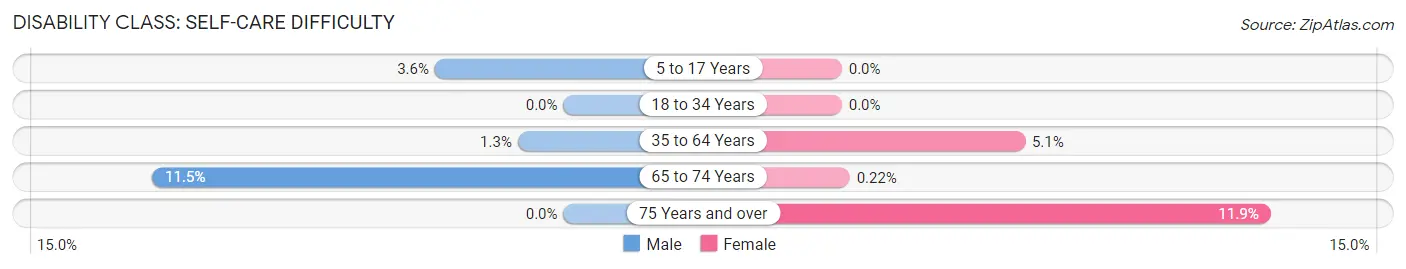
| Age Bracket | Male | Female |
| 5 to 17 Years | 18 (3.6%) | 0 (0.0%) |
| 18 to 34 Years | 0 (0.0%) | 0 (0.0%) |
| 35 to 64 Years | 13 (1.3%) | 54 (5.1%) |
| 65 to 74 Years | 38 (11.5%) | 1 (0.2%) |
| 75 Years and over | 0 (0.0%) | 53 (11.9%) |
Technology Access in Punxsutawney borough
Computing Device Access in Punxsutawney borough
| Device Type | # Households | % Households |
| Desktop or Laptop | 1,754 | 68.0% |
| Smartphone | 1,962 | 76.1% |
| Tablet | 1,430 | 55.5% |
| No Computing Device | 313 | 12.1% |
| Total | 2,578 | 100.0% |
Internet Access in Punxsutawney borough
| Internet Type | # Households | % Households |
| Dial-Up Internet | 18 | 0.7% |
| Broadband Home | 1,794 | 69.6% |
| Cellular Data Only | 176 | 6.8% |
| Satellite Internet | 75 | 2.9% |
| No Internet | 520 | 20.2% |
| Total | 2,578 | 100.0% |
Punxsutawney borough Summary
Punxsutawney Borough is a borough located in Jefferson County, Pennsylvania, United States. The population was 5,918 at the 2010 census. It is the county seat of Jefferson County.
History
Punxsutawney Borough was founded in 1818 by James Wilson, a Scots-Irish immigrant. The town was named after the Native American tribe of the same name, which had inhabited the area prior to the arrival of Europeans. The town was originally a farming community, but it soon developed into a center of commerce and industry. The town was incorporated in 1851.
In the late 19th century, Punxsutawney became known as the “Groundhog Capital of the World” due to its annual Groundhog Day celebration. The celebration began in 1886 and has been held every year since then.
Geography
Punxsutawney Borough is located at 40°56'45" North, 78°58'45" West (40.94583, -78.97917). According to the United States Census Bureau, the borough has a total area of 1.2 square miles (3.1 km2), all of it land.
Economy
Punxsutawney Borough is a small town with a population of just over 5,900 people. The town is home to a variety of businesses, including retail stores, restaurants, and professional services. The town is also home to a number of manufacturing companies, including a steel mill and a paper mill.
The town is also home to a number of tourist attractions, including the Punxsutawney Groundhog Club, the Punxsutawney Phil statue, and the Punxsutawney Weather Discovery Center.
Demographics
As of the census of 2010, there were 5,918 people, 2,521 households, and 1,541 families residing in the borough. The population density was 4,914.7 people per square mile (1,897.2/km2). There were 2,717 housing units at an average density of 2,241.7 per square mile (865.7/km2). The racial makeup of the borough was 97.2% White, 0.7% African American, 0.2% Native American, 0.4% Asian, 0.2% from other races, and 1.3% from two or more races. Hispanic or Latino of any race were 0.9% of the population.
There were 2,521 households, out of which 28.2% had children under the age of 18 living with them, 44.2% were married couples living together, 13.3% had a female householder with no husband present, and 37.2% were non-families. 32.2% of all households were made up of individuals, and 15.2% had someone living alone who was 65 years of age or older. The average household size was 2.33 and the average family size was 2.93.
In the borough, the population was spread out, with 22.7% under the age of 18, 8.2% from 18 to 24, 27.2% from 25 to 44, 22.7% from 45 to 64, and 19.2% who were 65 years of age or older. The median age was 39 years. For every 100 females, there were 87.3 males. For every 100 females age 18 and over, there were 83.2 males.
The median income for a household in the borough was $30,938, and the median income for a family was $37,917. Males had a median income of $30,938 versus $21,964 for females. The per capita income for the borough was $17,845. About 10.2% of families and 13.2% of the population were below the poverty line, including 18.2% of those under age 18 and 8.2% of those age 65 or over.
Common Questions
What is Per Capita Income in Punxsutawney borough?
Per Capita income in Punxsutawney borough is $29,486.
What is the Median Family Income in Punxsutawney borough?
Median Family Income in Punxsutawney borough is $66,125.
What is the Median Household income in Punxsutawney borough?
Median Household Income in Punxsutawney borough is $43,160.
What is Income or Wage Gap in Punxsutawney borough?
Income or Wage Gap in Punxsutawney borough is 5.3%.
Women in Punxsutawney borough earn 94.7 cents for every dollar earned by a man.
What is Family Income Deficit in Punxsutawney borough?
Family Income Deficit in Punxsutawney borough is $12,406.
Families that are below poverty line in Punxsutawney borough earn $12,406 less on average than the poverty threshold level.
What is Inequality or Gini Index in Punxsutawney borough?
Inequality or Gini Index in Punxsutawney borough is 0.48.
What is the Total Population of Punxsutawney borough?
Total Population of Punxsutawney borough is 5,730.
What is the Total Male Population of Punxsutawney borough?
Total Male Population of Punxsutawney borough is 2,821.
What is the Total Female Population of Punxsutawney borough?
Total Female Population of Punxsutawney borough is 2,909.
What is the Ratio of Males per 100 Females in Punxsutawney borough?
There are 96.97 Males per 100 Females in Punxsutawney borough.
What is the Ratio of Females per 100 Males in Punxsutawney borough?
There are 103.12 Females per 100 Males in Punxsutawney borough.
What is the Median Population Age in Punxsutawney borough?
Median Population Age in Punxsutawney borough is 46.2 Years.
What is the Average Family Size in Punxsutawney borough
Average Family Size in Punxsutawney borough is 2.9 People.
What is the Average Household Size in Punxsutawney borough
Average Household Size in Punxsutawney borough is 2.2 People.
How Large is the Labor Force in Punxsutawney borough?
There are 2,563 People in the Labor Forcein in Punxsutawney borough.
What is the Percentage of People in the Labor Force in Punxsutawney borough?
53.9% of People are in the Labor Force in Punxsutawney borough.
What is the Unemployment Rate in Punxsutawney borough?
Unemployment Rate in Punxsutawney borough is 5.3%.